wp 306 - kaushik basu and meenakshi rajeevisec.ac.in/wp 306 - kaushik basu and meenakshi...
TRANSCRIPT

Determinants of CapitalStructure of IndianCorporate Sector:Evidence of RegulatoryImpact
Kaushik BasuMeenakshi Rajeev

ISBN 978-81-7791-162-6
© 2013, Copyright Reserved
The Institute for Social and Economic Change,Bangalore
Institute for Social and Economic Change (ISEC) is engaged in interdisciplinary researchin analytical and applied areas of the social sciences, encompassing diverse aspects ofdevelopment. ISEC works with central, state and local governments as well as internationalagencies by undertaking systematic studies of resource potential, identifying factorsinfluencing growth and examining measures for reducing poverty. The thrust areas ofresearch include state and local economic policies, issues relating to sociological anddemographic transition, environmental issues and fiscal, administrative and politicaldecentralization and governance. It pursues fruitful contacts with other institutions andscholars devoted to social science research through collaborative research programmes,seminars, etc.
The Working Paper Series provides an opportunity for ISEC faculty, visiting fellows andPhD scholars to discuss their ideas and research work before publication and to getfeedback from their peer group. Papers selected for publication in the series presentempirical analyses and generally deal with wider issues of public policy at a sectoral,regional or national level. These working papers undergo review but typically do notpresent final research results, and constitute works in progress.
DETERMINANTS OF CAPITAL STRUCTURE OF INDIAN CORPORATE
SECTOR: EVIDENCE OF REGULATORY IMPACT
Kaushik Basu and Meenakshi Rajeev∗
Abstract
In this study we have made an attempt to answer two crucial questions - first, whether capital market regulations exert any influence on capital structure decisions of Indian corporate firms, and second, how to measure the capabilities of firm-specific factors to explain two theories of capital structure namely, static trade-off theory and pecking order hypothesis. In order to answer these two questions, we have employed static panel data model as proposed by Driscoll and Kraay (1998), considering 1154 firms for a period of 21 years (1989-2009) which resulted in 6946 observations. In this study we have looked at the impact of firm-specific and institutional factors on debt and equity separately in order to understand the explanatory power of the same set of factors in favour of trade-off theory and pecking order hypothesis. We find evidence in favour of the argument that institutional factors matter in financing decisions of corporations. Our results suggest that capital market regulations in India have adverse impact on the use of public debt and favorable impact on the use of equity capital. It is also found that firm-specific factors are more capable of explaining trade-off theory rather than explaining the information asymmetry in the public domain. This explains the fact that private lenders have superior firm specific information which helps firms in mobilizing resources from private sources rather than from the market. This study may be of some use for academicians and policy makers to understand the impact of regulation on the use of public debt and equity capital from the capital market by the firms. Keywords: India. Institution. Regulations. Capital Structure. Static Panel Data Model. Firm-level
data. JEL CODE: G32 . G38
Introduction Modern theories of capital structure have traveled a long way since the publication of the pioneering
article by Modigliani and Miller in 1958. All the theories that have subsequently emerged tried to answer
the moot question ‘what are the factors that affect capital structure decisions’. In the process of their
enquiry, scholars have identified several dimensions of imperfections that can affect capital structure
decisions of firms. Such imperfections may arise due to nature of contract, transaction cost, conflict of
interest, asymmetry of information, institutional structure etc. Among these factors, institution is unique
in the sense that institutions play a dual role - on one hand, the presence of institution itself creates
imperfection, and on the other, presence of institutions is necessary to correct the imperfection if it is
arising out of asymmetry of information. For example, presence of a government institution, such as tax
authority, may create imperfection through the imposition of tax on individual as well as on
corporations, and the presence of capital market regulator may reduce the asymmetry in information
through regulation. Since the institution has the ability to create as well as resolve the imperfections
and as corporations operate in accordance with the stipulations of various institutions, such as tax
authority, banking system, capital market and regulatory authority, it implies that institutional structure
may explain the behavior of corporations, particularly its financial behavior. To be specific, “capital
∗ PhD Scholar and Professor, Centre for Economic Studies and Policy (CESP), Institute for Social and Economic
Change (ISEC), Nagarbhavi, Bangalore-560072, Karnataka, India. E- Mail. [email protected]; [email protected]; and [email protected].

2
structure decision is not only the product of the firm’s own characteristics, but also the result of tenets
of corporate governance, legal framework and institutional environment of the countries in which the
firm operates” (Deesomsak et al. 2004: 404).
Rajan and Zingales (1995) while comparing the capital structure difference of G-7 countries
have pointed out that institution explains large part of variation of capital structure decisions in different
countries. Relative importance of institutions varies across countries, depending on the level of
development of banking system, corporate bond market, and development of stock market. In this
context, it is worth mentioning that countries like Japan, Germany, France and Italy are bank-oriented
countries whereas US, UK and Canada are market-oriented countries. The “difference between bank-
oriented and market-oriented countries is reflected in the choice of private and public financing” (De-
Miguel and Pindado 2001: 83). De-Miguel and Pindado (2001) have further argued that whether a
country is bank oriented or market oriented depends on the ownership structure1 of the corporate firms.
In countries where the corporate ownership is vested in fewer hands and particularly dominated by
family ownership, dependence of firms on banking system is much pronounced as compared to market-
oriented ones, probably because dilution of ownership is a great concern to them. Germany and France
are glaring examples of this, and the nature of business corporations in India resembles the pattern of
Germany and France where three-fourth of the largest companies are family-owned (Chakraborty
2010). Therefore, dilution of ownership is critical to the determination of capital structure. Another
feature of Indian economy is that it has been dominated by banks (nationalized banks) and
development financial institutions2 since the country’s independence. The combined effect of family
ownership and dominance of banks and financial institutions result in dominance of private lending over
public debt.
However, the choice of institutions for equity capital depends on the level of stock market
activity. Demirguc-Kunt and Maksimovic (1996) have argued that with the increase in stock market
activity, firms’ preference for equity over debt increases. In the wake of liberalization process in the last
two decades, Indian economy has adapted itself to several changes in institutional set up and
government policies in an attempt to integrate it with the global economy. Development of a vibrant
capital market has been given enormous importance to make it a viable and stable source of finance for
corporate sector in India. This has necessitated several reform measures. In the process of reforming
capital market, in order to make it easier for firms to raise capital in the equity market, Capital Control
Act (CCA) of 1947 was repealed by Securities and Exchange Board of India (SEBI)3 in 1992. In the same
year, SEBI was given statutory power to regulate the capital market. Abolition of CCA gave firms
freedom in designing instruments, deciding size of the capital issue, and pricing of the instrument (Rao
et al 2002). This encouraged many privately owned firms to go for public offering and raise funds from
capital market; it also encouraged publicly held firms to raise more capital in the equity market. The
trend is reflected in the amount raised through capital issue of equity; it increased from about Rs. 4000
crore in 1991 to about Rs. 87,029 crore in 2007-08. Moreover, in 1994 National Stock Exchange (NSE)
1 There are two distinct ownership patterns -Anglo-American pattern where firms have diffused ownership and
Continental European pattern where firms have highly concentrated ownership (Shapiro et al., 1998). 2 The operations of development financial institutions have shrinked in recent years. 3 SEBI was established in 1988.

3
was established with nation-wide stock trading and electronic display as well as clearing and settlement
facilities (Chakraborty 2010). In 1995 Bombay Stock Exchange (BSE) also introduced electronic trading.
Apart from the changes in capital market conditions, there are other macroeconomic changes
that came about in the last two decades which might have also affected the capital structure decision of
firms in the corporate sector. These include, deregulation of interest rate, reduction of Cash Reserve
Ratio (CRR) from 25 percent to 5 percent and a reduction of Statutory Liquidity Ratio (SLR), from 40
percent to 24 percent (Chakraborty 2010).
In this backdrop, the present study attempts to measure the importance of institutional
factors, particularly, the impact of capital market regulation in controlling firm specific factors and in the
utilization of various sources of financing by the Indian corporate sector. To the best of our knowledge,
there are no such studies which have explicitly considered capital market regulation as one of the
determinants of capital structure. Most of the previous studies in the capital structure literature have
focused on the impact of firm specific factors, ignoring the impact of institutional factors on leverage
decisions of firms assuming that substitutability between debt capital and owners’ capital exists. Given
the impact of firm-specific factors on leverage, it would be imprudent to comment on the effect of firm-
specific factors on the use of equity capital because equity capital is one of the two components of
owners’ capital. For example, reduction in the use of debt may be due to increase in the use of internal
capital and not because of the increased use of equity capital. Hence, the positive impact of any firm-
specific factor on leverage doesn’t signify negative impact on equity. Moreover, internal capital arises
out of accumulation of retained earnings in the past, and that does not reflect the activities in the
market other than providing information about the past performance. So, to dwell on the impact of firm
specific as well as institutional factors, one has to decompose the owners’ capital into equity and
internal capital and look at the impacts of each separately. In this study we have looked at the impact
of firm-specific and institutional factors on debt and equity separately in order to understand the
explanatory power of the same set of factors in favour of trade-off theory and pecking order hypothesis.
Quantification of the impact of capital market regulation may help policy makers to understand the
positive/ negative aspects of this legislation on the use of capital market which is considered a stable
source of finance. This will also help to see what the intention behind setting up capital market
regulation was, and whether the intended purpose is being served.
Institutional Characteristics and Capital Structure Decision The study by Rajan and Zingales (1995) is one of the first attempts to test the differences in capital
structures for G-7 countries. Their finding is that the firm specific factors, such as size, growth,
profitability, and tangibility of assets are important in US as well as in other countries. They also
emphasized that there is a considerable difference across G-7 countries in terms of institutional factors,
such as bankruptcy law, fiscal treatment, ownership concentration, and accounting standards which
may help in explaining the variation of capital structure decisions across G-7 counties. Studies of
Mcclure et al. (1999) and Wald (1999) have provided empirical evidence in favour of the postulate of
Rajan and Zingales (1995).
4
Franks et al. (1993) has endorsed the opinion of Rajan and Zingales (1995) and concluded that
UK and US bankruptcy codes have a major difference. While US bankruptcy code appears to offer
strong incentive to keep a firm as a going concern, the UK code appears to emphasize the rights of
creditors; this is found to have led to premature liquidations in U K. Indian bankruptcy procedure is
similar to that of US; India’s system has drawn heavily from the 1985 Sick Industrial Companies Act
(SICA), which considers a company as “sick” only after its entire net worth has been eroded, and the
company referred to the Board for Industrial and Financial Reconstruction (BIFR). As soon as a
company is registered with the BIFR, it will immediately get protection from creditors’ claims for at least
four years. Deesomsak et al. (2004), considering four countries Thailand, Malaysia, Singapore, and
Australia, have empirically shown that firms in countries with better protected creditors’ right are more
leveraged.
The impact of fiscal treatment such as rules of taxation has also been captured by scholars like
Demirguc-Kunt et al. (1996), Pindado et al. (2001). Demirguc-Kunt and Maksimovic (1996) have shown
that G-7 countries like US, Japan, and Canada have very few Non Debt Tax Shields (NDTS) in
comparison with European countries. Therefore, NDTS is a significant determinant of capital structure in
European countries. De-Miguel and Pindado (2001) have shown that the NDTS, allowed by Spanish tax
code, in Spain is much higher as compared to US. Hence, this is a significant determinant of capital
structure in Spain, whereas in US no significant impact of NDTS was felt. It is useful to mention, at this
point that in India, the rate of depreciation allowed on various types of asset varies substantially, as
evidenced by the fact that the rate of depreciation on general machinery and equipment is pegged at 25
percent.
The role of ownership in determination of leverage has been considered empirically by
Deesomsak et al. (2004). Scholars have shown that leverage is positively related to the concentration of
ownership in Asia-Pacific region unlike the postulates of agency and signaling theories. Positive
relationship between ownership and leverage is explained by the fact that firms in these countries
(except Australia) are characterized by high level of family ownership, which reduces information
asymmetry between owners and lenders. This has therefore led to lower transaction cost and easier
access to borrowing particularly, after the financial crisis. They have also argued that firms owned by a
family or small group of well-known investors may find borrowing easier. Indian corporations are mostly
dominated by family owned firms which are similar to those in other developing countries, and hence
ownership structure may also explain the variation of capital structure decision.
The other factor which may affect the leverage of firms is the level of development of bond
market. The two reasons for the underdevelopment of bond market are severity of information
asymmetry and the higher level of transaction cost (De-Miguel and Pindado 2001). The
underdevelopment of bond market leads to lower level of public debt in the capital structure. In contrast
to the public debt, the problem of information asymmetry and transaction cost for private debt is low as
the private lenders have superior firm specific information (Best and Zhang 1993). Countries like US,
UK, and Canada have well developed bond market, whereas bond market in Germany, France, and
Spain are underdeveloped. Indian corporate bond market is similar to that of Germany, France, and
Spain.

5
Summarizing the facts considered so far, it can be said that scholars have considered the effect
of creditors’ right, fiscal treatment, ownership concentration, and underdevelopment of bond market in
explaining leverage of corporations across countries, but the impact of capital market regulation on the
use of equity market as a source of financing has not received sufficient academic attention as yet.
Capital market regulation is important in the use of public debt and equity as it can induce to or deter
firms from raising debt and equity from the capital market.
Measures of Capital Structure and its Determinants As we intend to measure the effectiveness of capital market regulation on the use of public debt and
equity, we have first considered two measures of capital structure- first, the ratio of long-term debt to
total asset where long term debt includes long-term borrowing from banks and financial institutions and
public borrowing in form of debenture (secured and non-secured) and second, the ratio of equity to
total asset where equity consists of paid-up equity capital plus share-premium reserves. We have not
considered internal capital as equivalent to equity capital as this would not reflect firms’ public activities.
The other reason for the choice of these two variables is as follows: The trade-off theory predicts that
larger the firms tangible assets, lesser the chance of bankruptcy and higher value in liquidation;; so
tangible assets should be positively correlated with debt. On the other hand, information asymmetry
theory says that higher tangible assets lead to reduction in asymmetry of information between ‘insiders’
and ‘outsiders’, and hence use of equity should increase. Considering these two dependent variables,
we can distinguish between theories and the regression co-efficient on equity will particularly tell us the
level of information a particular variable conveys in the market. One may argue that in a sense, debt
and equity are substitutes and hence it is sufficient to consider only one of them as dependent variable.
However, empirical estimation presented in Table 6 clearly shows that increase and decrease in these
variables are not proportionate over time. One reason may be that retained profits are not considered.
Nonetheless, given the observation that they do not increase or decrease in fixed proportion, one may
get additional insights from running two separate regressions. Most importantly it helps us to derive
clear indications regarding validity of the above mentioned theories.
However, the choice of explanatory variables is based on trade-off, pecking order, agency
theory, control considerations as well as institutional factors. The predictions can be summarized as
follows:
1. Age
Trade-off theory predicts that with passage of time, firms establish a historical record of honouring the
financial obligations and this reputation increases the debt capacity of firms. Thus, mature firms can
borrow under better terms, and the probable impact of age on debt is positive. In contrast, it may be
argued that the greater availability of information on older firms tends to reduce information
asymmetries associated with equity. Hence, in line with pecking order hypothesis, one can say that
mature firms tend to use the capital market for equity relatively more compared to younger firms.
Moreover, since mature firms are likely to have accumulated higher levels of past earnings, these firms

6
need less of debt finance. We have calculated age as the difference between year of incorporation and
the year in which firm exists in the sample.
2. Size
Trade-off theory predicts that larger firms tend to be more diversified, and hence less risky and less
prone to bankruptcy. Further, if maintaining control is important, then it is likely that firms achieve
larger size through debt rather than equity financing. Thus, control considerations also support positive
correlation between size and debt. However, it can also be argued that size serves as proxy for
availability of information that outsiders have about the firm. From pecking order point of view, less
information asymmetry makes equity issuance more appealing to the firm. Thus, a negative link
between size and leverage is expected. This study uses natural logarithm of real sales as a proxy for
size while some studies are found to have used natural logarithm of total assets as the proxy for size,
though both yield the same result.
3. Asset Structure
The ratio of fixed assets to total assets represents the degree of asset tangibility. The trade-off theory
postulates tangibility to be positively related to debt levels for two main reasons, namely, security and
the cost of financial distress. First, tangible assets normally provide high collateral value relative to
intangible assets, which implies that these assets can support more debt. Second, tangible assets often
reduce the cost of financial distress because they tend to have high liquidation value. Information
asymmetry theory predicts that larger firms disclose more information to outsiders than smaller firms.
Larger firm with less information asymmetry problem should tend to have more equity than debt, and
hence less leverage. Here we have introduced the ratio of gross fixed assets to total assets as the
tangibility of firm’s assets.
4. Growth Opportunities
The term ‘growth opportunities’ means possible growth alternatives or future investment opportunities.
This can be considered as intangible asset of the firms. The nature of intangibility creates the problem
of information asymmetry between firm’s insiders and outsiders. Due to this information asymmetry, the
firms with higher growth opportunities issue securities which have less problem of information
asymmetry, e.g. short-term debt. However, it can also be argued that a system dominated by private
lenders ought to have superior firm specific information that could reduce the problem of information
asymmetry between private lenders and borrowers, even in the long-term. In a country like India,
where the debt market is mostly dominated by private lenders, namely, banks and financial institutions,
one can expect a positive relationship between growth and leverage. Myers (1977) has suggested using
ratio of market value to the book value of assets as a proxy for growth opportunities. Moreover, Titman
and Wessels (1988) have used the percentage change in total assets as a proxy for growth
opportunities. In the absence of data for market value to book value of assets, this study uses the
percentage growth of total assets as the proxy for growth opportunities.

7
5. Non-debt Tax shields
DeAngelo and Masulis (1980) argue that non-debt tax shields are substitutes for tax benefits of debt
financing. Thus, a firm with high non-debt tax shields is likely to be less leveraged. This leads to
prediction of negative correlation between non debt tax shields and debt. Therefore, this study uses the
depreciation to gross fixed assets ratio as a proxy for non-debt tax shields.
6. Profitability
In the context of pecking order theory, profitable firms are likely to have sufficient internal finance that
obviates the need to rely on external finance. Moreover, as per agency theory framework, if the contest
for corporate control is inefficient, managers of profitable firms will use the higher level of retained
earnings in order to avoid the disciplinary role of external finance. These two rationales point to a
negative correlation between profitability and leverage. In addition, in an agency theory framework, if
the market/contest for corporate control is efficient, managers of profitable firms will seek debt as a
disciplinary device because debt is regarded as a commitment to pay out cash in the future. Agency
theory also supports the positive correlation between profitability and leverage. On the other hand,
trade-off theory postulates that firms with larger profits need to pay more taxes than firms with smaller
profits. Therefore, firms with high profit should use more debt in their capital structure in order to get
much more tax shields from interest payment. Hence, it can be said that trade-off theory postulates a
positive relation between profitability and leverage. This study uses earnings before interest tax and
depreciation to total assets as a measure of profitability.
7. Liquidity
Liquidity ratios may have a mixed impact on the capital structure decision. On one hand, firms with
higher liquidity ratios might support a relatively higher debt ratio due to greater ability to meet short-
term obligations when they fall due. This would imply a positive relationship between a firm’s liquidity
position and debt ratio. On the other hand, firms with greater liquid assets may use these assets to
finance their investments. Therefore, firm’s liquidity position should exert a negative impact on its
leverage ratio. Moreover, as Prowse (1990) argues, liquidity of the company assets can be used to show
the extent to which these assets can be manipulated by shareholders at the expense of bondholders.
For the purpose of this study, the ratio of current assets to current liabilities is used as a proxy for
liquidity.
8. Interest Cover
Harris and Raviv (1990) have suggested that interest coverage ratio has negative correlation with
leverage. They conclude that an increase in debt will increase default probability. Therefore, interest
coverage ratio will act as a proxy of default probability, which means that a lower interest coverage
ratio indicates a higher debt ratio. This study takes earnings before interest and tax to interest payment
ratio as a measure of interest cover.

8
9. Exports
In developing countries, like India, firms which are net exporters are given credit benefits like export
import credit facility4, and forward letter of credit. This implies that firms which are net exporters may
have lesser need of debt in their capital structure. Therefore, we can expect a negative relationship
between exports and leverage. This study uses exports to total sales ratio as a measure of exports.
10. Labour Intensity
According to Modigliani-Miller’s (1958) capital structure irrelevance theorem, capital structure decision is
independent of output, investment and employment decision, as real variables do not affect the
financial variables and vice versa. Funke et al. (1999) have estimated the labour demand function for
Germany and found that leverage is negatively related to the labour demand. The reason is that as debt
increases, the cost of borrowing increases. On the other hand, as employment increases, productivity of
capital decreases. Therefore, when marginal product of capital falls below marginal cost of borrowing,
investment becomes unprofitable. So, the firm reduces its labour demand. Hence, financial decision and
employment decision are interdependent. This study has used compensation to employees to fixed
assets ratio as a measure of labour intensity in the production process.
11. Capital Market Regulation
Capital market regulation is aimed at reducing the information asymmetry between insiders and outside
investors, and thereby reducing the cost of equity capital of the firms. This reduction in cost of equity
capital leads to the development of equity market which will form a viable source of finance for the
corporate sector. In this study, we are using a ‘regulation index’, which serves as an inverse proxy for
information asymmetry, constructed through factor analytic approach as proxy for regulatory changes.
Thus we have explained the important independent variables to be considered in our analysis,
and how they may impact our dependent variable. Also, the dependent variables may impact some of
the independent variables in a later period, as is the case in most regressions. The impacts however are
clearly not simultaneous.
Empirical Results
1. Data
For this study, firm level financial information has been collected from CMIE PROWESS data base for 21
years (1989-2009). Based on NIC-2 digit classification, we have organized the firm level data into seven
broad groups, viz., chemical, food and beverages, machinery, metal and metal products, non-metallic
mineral products, textiles and transport. We have retained those observations obtained from the
Prowess data base for which there are no missing data. The next step was to remove the outliers using
box-whisker plot. Finally, we have arrived at 6946 observations which contain 1154 firms. Hence, the
data set is an unbalanced panel. Construction of growth variable has caused loss of one observation for
4 The different form of export credits that are available to manufacturing sector exporters are pre-shipment credit,
suppliers credit etc.

9
each firm in the sample. Thus the number of useable observation is 5792. Minimum and maximum
number of observations in a year is 22 (1989) and 456 (2001) respectively. The capital stock in is
measured at1993-94 prices in the study and as the gross fixed asset of the firm is reported in our firm
level data in terms of historical cost, we had to convert this value into replacement cost. Therefore, this
needs to be adjusted, which requires capital stock estimation at the firm level. Capital stock at the firm
level has been constructed through perpetual inventory method by taking 2001-02 as the base year.
After it was estimated for the base year, then using the perpetual inventory method estimated the
capital stock existing at various point of time. In order to deflate the sales and expenditure on labour,
the whole sale price index of the respective industry has been used as the deflator.
2. Construction of Index of Capital Market Regulation
In this study, in order to measure the impact of capital market regulation on capital structure decision, a
regulation index is constructed using factor analysis method. Measuring the impact of regulation using a
single dummy variable may not be appropriate because, from time and again, there have been
modifications of a particular regulation. Moreover, the co-existence of many other regulations can affect
the capital structure decisions of firms. This study mainly looks into those regulations which are related
to entry of firms and issue of common stock or right issues in the capital market, promoters’
contribution and lock in time, issue of debt and issue of preference shares. In other words, the study
seeks to measure the impact of those regulations which can directly affect the capital structure
decisions of firms5.
The motivation behind setting up these regulations by the capital market regulator is to gain
the confidence of investors (local as well as global). This will ensure the steady flow of capital,
channelisation of the scarce resources to the best possible utilization, increase the soundness of the
financial system by ensuring that contracts are obeyed by counterparties, and reduction of information
asymmetry between insiders and outside investors by reducing the problem of ‘asset-substitution’. The
study focuses on these four aspects of regulation as the regulation regarding entry and issue of
common stock deters the entry of ingenuine firms into the market thereby restricting new firms from
issuing equity capital and allowing existing firms to move in favour of private or public debt. This
reduces the asymmetry of information among insiders and outside investors. Regulation regarding debt
issue also tries to reduce the information asymmetry, through the introduction of credit rating on debt
instruments, between ‘insiders’ and ‘outsiders’. Regulation regarding promoters’ contribution and lock-in
and issue of preference shares reduces the problem of ‘asset substitution’.
5 There are many other regulations which may affect the capital structure decision of firms indirectly such as
regulation regarding the foreign institutional inflows (FIIs). For example, greater inflow of FIIs to Indian capital market increases the demand for domestic shares and hence market price increases; in this situation firms may be induced to raise equity capital from the market as it requires less number of shares to be allotted in order to raise a specified amount. This leads to a partial dilution of ownership.
10
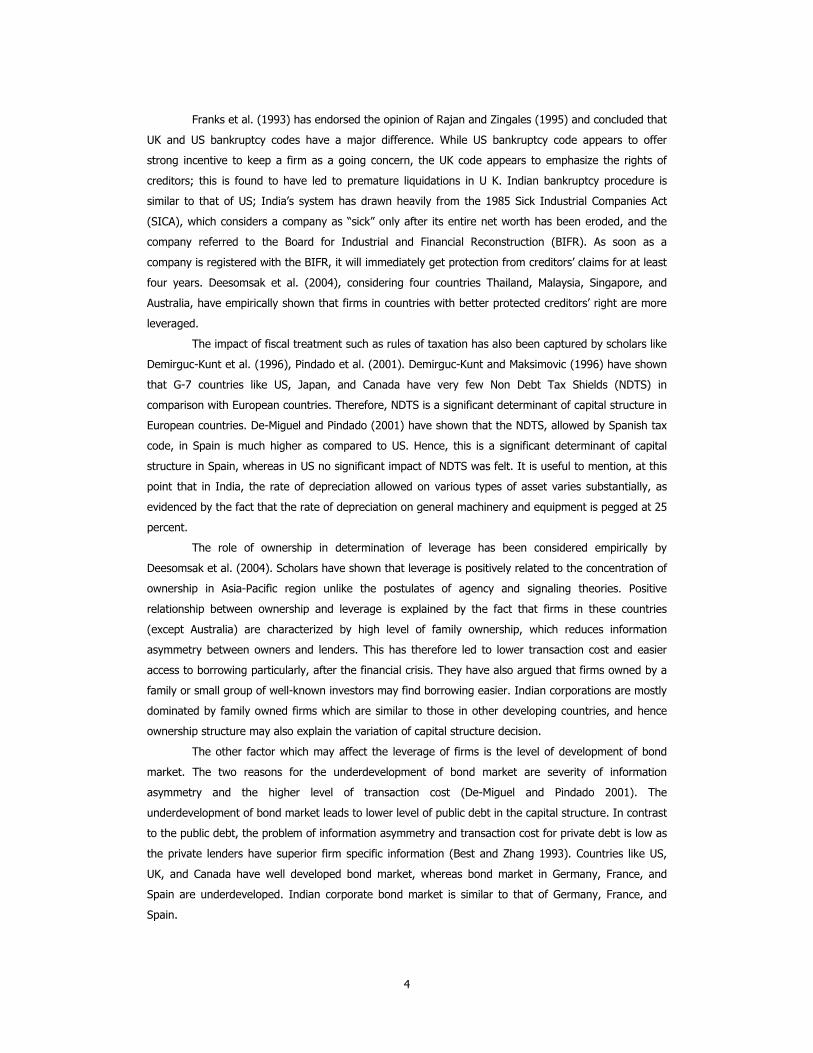
Table 1: Description of Dummy Variables used for Construction of Regulation Index
Year Entry & Public Issue of Equity
Issue of Public Debt
Promoters Contribution
Issue of Preference Shares
1989 0 0 0 0
1990 0 0 0 0
1991 0 0 0 0
1992 0 0 1 0
1993 0 0 1 0
1994 0 0 1 1
1995 0 0 1 1
1996 1 0 2 1
1997 1 0 2 1
1998 0.5 1 2 1
1999 0.5 1 2 1
2000 1 0.5 3 2
2001 1 0.25 3 2
2002 1 0.25 3 2
2003 0.5 1.25 3 3
2004 0.5 1.25 3 3
2005 1.5 1.25 3 3
2006 1.5 1.25 3 3
2007 1.5 1.25 3 2.5
2008 1.5 1.25 3 2.5
2009 1.5 1.25 3 2.5
However, in order to construct the index, the study follows the methodology of Bandiera et al.
(2000) and Abiad and Modi (2003). In this methodology, various regulatory measures are assigned
dummy values, which cannot be otherwise determined quantitatively. Four dummy variables have been
considered, namely, regulation relating to entry and public issue of equity, promoters contribution and
lock-in, issue of debt instruments and issue of preference shares. The assignment of values are
subjective in the sense that if the regulations are made stringent in order to deter firms o entering the
capital market and raise equity as well as debt capital, s those are assigned the value of 1.
If it is felt that the stringency of the regulation is dipping, , then it is assigned a value within
the range of (-0.25) to (-0.5). Table 1 presents the description of the four dummy variables. Description
of regulations and assignment of values corresponding to each regulation and subsequent changes are
described in the Appendix.
Table 2: Component Extraction
Factor Eigen Value Percentage of Variance Cumulative
Factor1 3.39411 84.85 84.85
Factor2 0.37426 21.27 94.21
Factor3 0.16154 9.14 98.25
Factor4 0.07009 0.0175 1.00
11
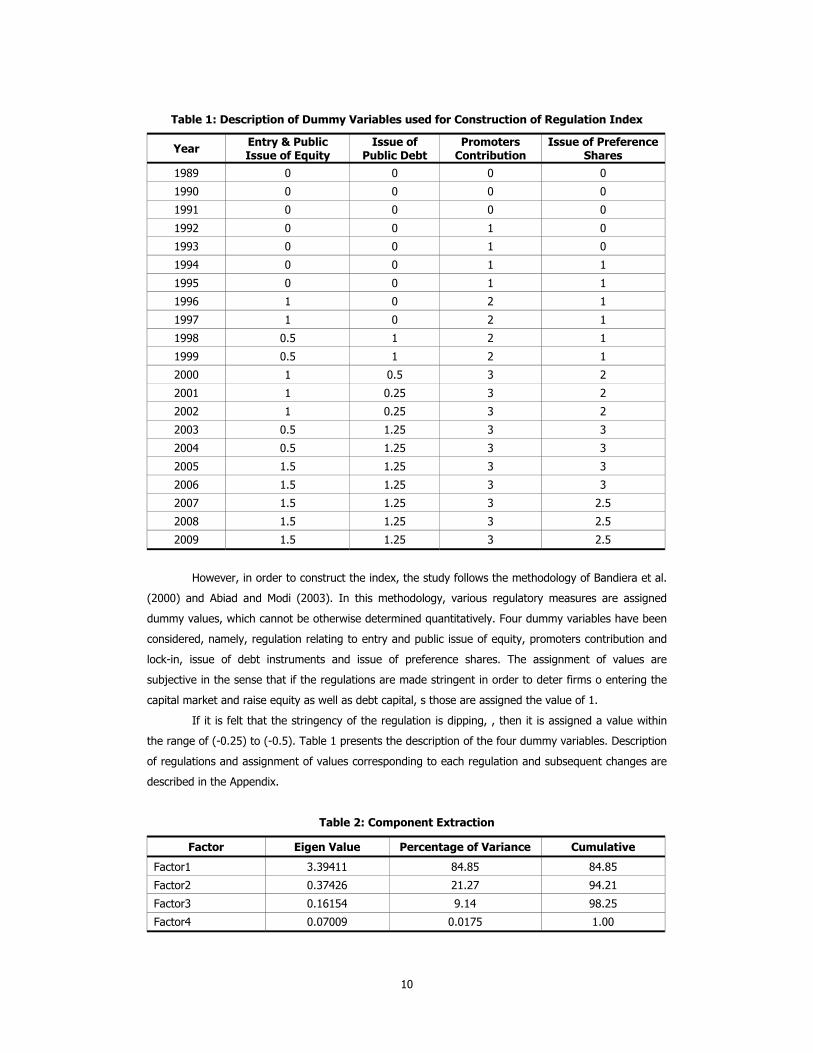
Table 3: Factor Loadings
Variable Factor1 Uniqueness
Entry Regulation 0.8933 0.2019
Debt Issue 0.8726 0.2386
Promoters Contribution 0.9482 0.10009
Preference Issue 0.9672 0.0645
Table 4: Scores of Regulatory Index in Indian Capital Market
Year Index Year Index
1989 100 2000 286.61
1990 100 2001 275.54
1991 100 2002 275.54
1992 124.50 2003 321.57
1993 124.50 2004 321.57
1994 148.10 2005 365.32
1995 148.10 2006 365.32
1996 216.36 2007 365.32
1997 216.36 2008 365.32
1998 238.78 2009 365.32
1999 238.78
Each column represents a single dummy and each row represents a year. In order to reduce
the dimensionality of the matrix, the method of principal component analysis has been used as it helps
to reduce the dimensionality while preserving the variance-covariance structure intact. Table 2 makes it
clear that only factor 1 is important as its eigen value is more than 1. Table 3 represents the factor
loadings of different regulations from which we find that entry regulation regarding debt issue is unique
by nature. To reduce information asymmetry, it was found necessary to raise the standards of
disclosure during 1998-99, and to help investors make informed decisions, every public or right issue of
debt instruments was required to be compulsorily rated by the approved credit rating agency
irrespective of their maturity/ conversion period as against 18 months. If a public or right issue of debt
security is greater than or equal to Rs. 100 crore, two ratings from two different credit rating agencies
should be obtained. During 2000-01, it was specified that in order to provide a variety of debt
instruments and to help the development of the debt market, the SEBI should permit the issue of
unsecured / subordinated debt instruments for providing mezzanine capital provided that these are
subscribed by the QIBs or where the debenture allottees/ holders have given their positive consent. It
was further specified that in case of issue of debenture with maturity of more than 18 months, the
issuer shall appoint a debenture trustee. To overcome the ‘asset substitution’ (misuse of debt holders’
money by equity holders) problem faced by debt holders, the specification of 18 months was removed
and appointment of debenture trustee was made applicable to all debenture issues. Moreover, the
responsibility of obtaining report from the lead bank regarding monitoring progress of the project and
monitoring utilization of funds raised with debenture issues lies with debenture trustees. In order to
12
secure the rights of the debenture holders, a debenture redemption fund was required to be created by
all companies issuing debenture irrespective of the maturity of the debenture, and in case the company
fails to meet the obligation of interest payment on debentures or redemption of debentures, distribution
of dividend shall now require prior approval of debenture trustees and the lead institution which was
earlier applicable only to the new companies (August 14 2003). Since these two regulations aim at
reducing information asymmetry, one can argue that information asymmetry control is the most crucial
factor in the capital market regulation. As the degree of stringency increases, transparency in the capital
market also increases. The regulation index is calculated on the basis of the components that explain
the maximum variance. The component extraction and factor loading are given is the Table 2 and 3. It
is evident from the table that the first factor explains almost 85 percent of variance.
Then we have used factor1 to construct the index of regulation. Table 4 presents the
regulation index scores. The Index ranges from 100 in 1989 to 365.32 in 2009, which gives an
indication of the stringency of regulation in Indian capital market. This is due to the fact that with
establishment of National Stock Exchange (NSE) in 1994, many new companies entered into the market
and raised money through public issue, and just after raising funds, they disappeared from the market.
In order to keep these vanishing companies away from the market, SEBI came up with many stringent
norms, and over time they made several amendments which raised regulatory index value in the
liberalization period.
3. Model Construction
We have constructed an unbalanced panel of 1154 firms for 21 years (1989-2009) which makes to total
number of observations 6946. The use of Ordinary Least Square (OLS) for the panel data is not optimal
because of the following two reasons: First, since we get repeated observations for each unit of analysis
in the panel data, there may be unit-specific and time-specific characteristics in data. Second, there is
high probability that the error process is not spherical because of heterogeneity among the units of
analysis, correlations among the error terms of the same units (serial correlation) of observation, and
correlation among the different units (contemporaneous correlation) of observations. However, the
contemporaneous correlation is not a problem in this case, as there is no single time period which is
common to all units of analysis. So, we have taken into consideration heteroskedasticity and serial auto-
correlation problem. In order to take care of heteroskedasticity and problem of autocorrelation, one can
employ Generalized Least Square (GLS) technique. However, the problem with this technique is that
covariance matrix of the errors is assumed to be known at least up to a scale factor, which is never
realized in practice. Therefore, Feasible Generalized Least Square (FGLS) is found to have more
applicability. Parks (1967) has used FGLS to Time-series Cross-section (TSCS) models with panel errors.
There are three important criticisms against FGLS estimators: First, FGLS performs well in large
samples, but the finite sample properties of FGLS estimator are difficult to assess; second, FGLS
standard errors underestimate true variability at least for normal errors; and third, the application of
FGLS may not be appropriate if the panel’s time dimension is smaller than its cross- sectional
dimension. Beck and Katz (1995) have suggested relying on OLS co-efficient estimates with panel
corrected standard errors (PCSE) which take into consideration heteroskedasticity, serial autocorrelation
13
and contemporaneous correlation. The criticism against the method proposed by Beck and Katz (1995)
is that though the standard errors are based on T-asymptotics (small sample properties of PCSE
estimators) are poor when the panel’s cross sectional dimension is large compared to the time
dimension.
Driscoll and Kraay (1998) have shown, relying on large T-asymptotics, that the standard
nonparametric time series covariance matrix estimator can be modified such that it is robust in very
general form of cross-sectional as well as temporal dependence. In their exercise, they adjusted the
standard errors using a Newey-West type correction to the sequence of cross sectional moment
conditions, which ensures that the covariance matrix estimator is consistent and independent of cross
sectional dimension. Therefore, Driscoll and Kraay (1998) eliminate the deficiencies of time consistent
covariance matrix estimators such as Parks – Kmenta or the PCSE approach which typically becomes
inappropriate when the cross sectional dimension of a micro econometric panel is large.
The Driscoll-Kraay (1998) method is also applicable in case of fixed effect model6. Since the
study is dealing with panel data, it is assumed that there are firm-specific and time specific effects. So
instead of relying on OLS coefficients the study relies on fixed effect estimator of Driscoll and Kraay
(1998) which take into consideration the problem of panel heteroskedasticity and serial autocorrelation.
The reliance on fixed effect estimator comes from the Hausman7 (1978) Specification test. Two
regressions are estimated in the study in which dependent variables are long term debt to total assets
ratio and equity to total assets ratio respectively. The explanatory variables are same for both the
regressions. The choice of these two particular measures of capital structure is intended to capture the
discriminating effect of the same set of variables on debt and equity.
The following model has been estimated.
Yit = + Σk βkXkit + Vit , where Vit=µi+ eit (1)
Where i = 1,2, ……,n
t = 1,2,……., T
where, Yit is the dependent variable, pooling N cross-sectional observations and T time series
observations, and Xkit are the independent variables, pooling N cross-sectional observations and T time-
series observations. α is a constant term, µi is firm specific effect, and eit is random error, with mean 0
and variance σi2. E(eit, ei(t-1)) ≠ 0 are same for all the panels.
The choice of the explanatory variables in the estimated model is based on the theories of
capital structure viz., Trade-off theories, Agency cost Theory, Information Asymmetric Theory etc.
(Long Term Debt/ Asset)it = β1 + β2Sizeit + β3Profitabilityit + β4Non-Debt Tax shieldsit +
β5Tangibilityit + β6Interst Coverit + β7Liquidityit + β8 Ageit + β9 Regulationit+ β10Exportit+
β11(Labour/Capital)it + µi + eit (2)
6 The estimation has been carried out using STATA 10.0 version. 7 Hauman test statistic value: 102.34
14
(Equity/ Asset)it = β1 + β2Sizeit + β3Profitabilityit + β4Non-Debt Tax shieldsit +
β5Tangibilityit + β6Interst Coverit + β7Liquidityit + β8 Ageit + β9 Regulationit+
β10Exportit+ β11(Labour/Capital)it + µi + eit (3)
4. Descriptive Statistics
Summary statistics of the different measures of capital structure and explanatory variables, for different
time periods, are shown in Table 5. It is seen that long term debt to total assets ratio have remained
almost at the level of 20 percent for the sample of firms, although there is a marginal decline of 1
percent during 2005-09. The other measure i.e., the ratio of equity to total assets, which considers only
paid-up capital and security premium reserves, has shown variation in different time periods. There is
on an average 4 percent increase in the average use of equity between the first two time periods
(1989-94, 1995-2000). Moreover, the standard deviation has also become higher. This is indicative of
the fact that the establishment of National Stock Exchange in 1994 and Bombay Stock Exchange in
1995 with nation wide electronic trading system has enabled many firms to raise capital from the capital
market. However, this trend became sluggish during 2001-04 with only a marginal increase of 1
percent. In fact, in subsequent years, the average use of equity declined by 3 percent and the variation
also came down. This declining trend is attributed to the Securities and Exchange Board of India’s
stringent regulation. Capital market regulation has deterred dubious firms from accessing capital market
easily, thereby ensuring a stable source of finance for good quality firms.
Average age and profitability of the firms have declined over the years while size and
tangibility have increased substantially. Average growth of the firm has shown some fluctuation over
time period. Liquidity and Interest cover have shown an increase which indicates that the overall
financial health of the firm has improved. Exports of the firms have increased substantially, whereas the
labour capital ratio has declined substantially. Decreasing labour capital ratio is an indication of the
increasing automation of technological processes after liberalization. The regulation index, which is an
indicator of the stringency of regulation, has increased substantially over the time period.
Table 6 shows the correlation co-efficient of the different variables considered for the study. It
shows that two measures of capital structure are negatively related which is obvious, as they are
substitutes for each other. Age is found to be negatively correlated with long term debt and equity,
which means that as firms age increases, dependence on internal resources becomes higher. Another
noteworthy finding is that equity decreases more than debt as age increases. Age and size are highly
positively correlated which indicates that olds firms acquire a large market share, as size is measured by
the log of real sales. Although size and profitability are positively correlated, the correlation is not very
strong. Size is positively correlated with long term debt but negatively correlated with equity.
Dependence on equity decreases as the size of the firm increases whereas long term debt increases.
This implies that firms in Indian corporate sector are much more dependent on debt as most of the big
business houses in India are family owned, and dilution of ownership is a dreaded prospect. Profitability
is positively related to long-term debt, but negatively correlated with equity, which implies that
profitability acts as a good signal to the lenders and reduces information flow between lenders and
firms. Liquidity has positive correlation with long term debt as well as equity; therefore, liquidity acts as

15
tool for reduction of information asymmetry between ‘insiders’ and ‘outsiders’. It reduces information
asymmetry in the market as well as in the private sphere where private lenders and borrowers interact
with each other. Liquidity and interest cover are highly correlated with profitability (their quotient being
0.14 and 0.46 respectively). Interest cover is negatively correlated to the long term debt which implies
that as interest cover of the firm increases, its probability of default decreases as a result of which debt
decreases. The correlation between non-debt tax shields and tangibility is only 7 percent. Growth of the
firm has positive correlation with long term debt but negative correlation with equity. This is indicative
of the fact that Indian corporates prefer debt over equity as debt is easily available from private lenders
as is the case in almost all developing countries. Labour-capital ratio is also negatively correlated with
debt and equity, but the correlation is more in case of debt than equity. It is interesting to note that
labour capital ratio and age are positively correlated which implies that aged firms use labor intensive
techniques whereas young firms use more of capital intensive techniques. Export is negatively
correlated with long term debt and equity; this could be due to the fact that high exporting firms may
be getting export import credit facilities which reduce the demand for debt. Regulation index is
negatively correlated with debt, but positively correlated with equity. The positive correlation between
equity and regulation is indicative of the fact that capital market regulation has had the desired impact
on the use of equity capital by Indian corporate firms. Since there are few high correlations among the
variables, we have checked for incidence of multicollinearity, and the Variance Inflation Factor has
shown that multicollinearity is not a significant problem.

16
Table 5: Descriptive Statistics of the Variables Chosen for the study
Variables 1989-1994 1995-2000 2001-2004 2005-2009 1989-2009
Mean Std. Dev. Mean Std. Dev. Mean Std. Dev. Mean Std. Dev. Mean Std. Dev. Min. Max.
Debt to Total Asset 0.20 0.10 0.20 0.11 0.19 0.11 0.19 0.11 0.20 0.11 0.000053 0.87
Equity to Total Asset 0.07 0.04 0.11 0.10 0.12 0.10 0.09 0.09 0.10 0.09 0.0015 0.95
Age 35.76 22.83 28.47 21.24 26.36 19.48 27.53 18.86 28.52 20.53 1 154.5
Size 4.31 1.23 4.45 1.35 4.55 1.37 4.97 1.34 4.61 1.36 0.18 8.93
Profitability 0.13 0.03 0.11 0.04 0.09 0.03 0.09 0.03 0.10 0.04 0.0096 0.35
Tangibility 0.52 0.18 0.57 0.20 0.62 0.21 0.60 0.22 0.58 0.21 0.03 0.92
Non-debt Tax Shields 0.05 0.01 0.05 0.01 0.05 0.01 0.04 0.01 0.05 0.01 0.01 0.15
Growth 0.23 0.28 0.17 0.28 0.12 0.65 0.25 0.61 0.19 0.51 -0.72 24.02
Liquidity 1.5 0.29 1.52 0.34 1.47 0.35 1.41 0.35 1.47 0.34 0.45 4.75
Interest-cover 2.6 1.002 2.83 1.08 2.37 1.11 2.93 1.25 2.54 1.16 0.14 9.79
Export 0.07 0.11 0.11 0.18 0.15 0.22 0.19 0.25 0.14 0.21 0 0.78
Labor Capital Ratio 0.23 0.18 0.16 0.18 0.14 0.17 0.13 0.13 0.15 0.17 0.0008 2.69
Regulatory Index 123.94 18.24 229.93 38.32 298.005 23.01 365.32 0 273.35 80.68 100 365.32
Source: Author’s calculation from CMIE Prowess Database

17
Table 6: Pair-wise correlation co-efficient between variables and Variance Inflation Factor
Variable
Debt to
Total Asset
Equity to Total Asset
Age Size Profitability Tangibility
Non-Debt tax
Shields
Growth Liquidity Interest cover Export
Labour Capital Ratio
Regulation Index VIF
Debt to Total Asset 1.00 1.8
Equity to Total Asset -0.132 1.00 1.7
Age -0.053 -0.384 1.00 1.6
Size 0.231 -0.547 0.257 1.00 1.5
Profitability 0.160 -0.167 0.052 0.048 1.00 1.5
Tangibility 0.468 0.055 0.014 0.034 0.087 1.00 1.4 Non-Debt Tax Shields 0.037 -0.042 0.012 0.002 0.197 0.071 1.00 1.3
Growth 0.045 -0.043 -0.07 0.04 0.002 -0.094 -0.11 1.00 1.3
Liquidity 0.189 0.114 -0.007 -0.058 0.145 0.071 0.198 -0.049 1.00 1.1
Interest Cover -0.105 -0.085 -0.011 0.087 0.469 0.028 0.054 0.093 0.143 1.00 1.1
Export -0.069 -0.050 -0.126 0.066 -0.1 -0.052 0.009 0.0007 -0.008 0.0015 1.00 1.0 Labour Capital Ratio -0.29 -0.151 0.325 -0.126 0.075 -0.37 0.098 -0.061 -0.066 0.013 0.112 1.00 1.0
Regulation Index -0.042 0.055 -0.115 0.155 -0.36 0.13 -0.105 0.005 -0.102 0.103 0.194 -0.178 1.00
Source: Author’s calculation from CMIE Prowess Database
18
5. Results
Tables 7 & 8 represent the regression results of pooled OLS and panel data regression model. Pooled
OLS is considered as the base model which operates under the assumption of homoskedasticity and
absence of serial and contemporaneous correlation. In the presence of the problems such as
heteroskedasticity or presence of serial correlation, co-efficient estimates arrived at using pooled
regression method may not be optimal. Therefore along with Pooled OLS, we have separately estimated
the OLS with panel corrected standard errors (PCSE) to get rid-off panel level heteroskedasticity, serial
auto-correlation and contemporaneous correlation problem as proposed by Beck and Katz (1995).
However, in this case there is no problem of contemporaneous correlation as there is no single year
which is common for all the unit of analysis. Therefore, what is considered is only the hetroskedasticity
and serial autocorrelation problem. The PCSE estimator of Beck & Katz (1995) has poor finite sample
properties when the panel’s cross sectional dimension is too large as compared to time dimension.
Therefore,the method proposed by Driscoll and Kraay (1998) is used to estimate the model. However,
since Pooled OLS estimates fail to take into account the unobservable firm specific and time specific
effects, the model is once again estimated assuming firm specific effects are fixed and random.
Hausman specification test suggests that fixed effect model is appropriate. So we are relying on fixed
effect model with correction for heteroskedasticity and auto-correlation corrected standard errors as
proposed by Driscoll and Kraay (1998). Moreover, Parks- Kmenta method estimates of FGLS has also
been reported. It is observable that OLS estimators and random effect estimator provide an
overestimation over the fixed effect models and an underestimation of the standard errors.
It is observed that age has a negative impact on long term debt, though it is insignificant in
case of fixed effect model and Driscoll and Kraay (1998) model with fixed effect. However, for equity,
the effect is significant. Although the impact of age on debt is insignificant, the negative sign is worth
discussing. It means that as age of the firm increases, demand for long term debt as well as demand
for equity decreases. This is indicative of the fact that firms have become reliant more on internal funds.
Chakraborty (2010) has shown that firms in India in recent years have been following pecking order
hypothesis, i.e., they are more reliant on internal funds as the cost of borrowing has increased in the
liberalization period, and equity market has not been a stable source of finance.
Size, which is measured as the logarithm of real sales of the firm, is found to be positively
related to long term debt and negatively related to equity though it is significant. This is in contrast to
the findings of Titman and Wessels (1988) and Chakraborty (2010). Chakraborty (2010), based on the
regression where the dependent variable is borrowing to total asset ratio, has argued that larger firms
should be issuing more equity as compared to smaller firms. But most of the larger firms in the Indian
market are family owned, and therefore reluctance to dilute ownership becomes crucial. This fact was
proved when we considered the equity to total asset ratio as the dependent variable and found that size
is negatively related to the equity. Following this, it can be inferred that control considerations are
crucial to the use of financing instruments.
This is also true in case of growth variable, which is measured as the percentage change of
firm’s assets. The reason is that as a firm grows either in terms of sales or assets, the growth is directly
visible to private lenders such as banks and financial institution due to their long term relationship with

19
the firm; this reduces information asymmetry between the two. This finding is in line with the
arguments of Best and Zhang (1993) that private lenders have superior firm specific information. Firms
in countries with poor corporate governance system may end up manipulating information in favour of
shareholders and therefore raising funds from capital market may be difficult. Therefore, size and
growth figures of firms are found ineffective in reducing information asymmetry in the market, and
hence equity as a share of total assets is decreasing. Looking at the impact of tangible assets on long
term debt and equity, it is found that tangible assets have significant positive impact on both, and the
impact is more in case of debt. This finding is similar to the findings of Rajan and Zingales (1995) and
Chakraborty (2010). However, the impact of tangibility on debt (0.13) is more than that of equity
(0.023). It underscores the fact that tangibility acts more as a tool for reducing default risk (as it serves
the purpose of collateral) rather than as a tool for reduction of information asymmetry.
The impact of non-debt tax shields is negative and significant on debt but insignificant on
equity. This is in contrast to the findings of Chakraborty (2010) and Delcoure (2007), but consistent
with the findings of Ozkan (2001), Deesomsak et al. (2004). Depreciation of machinery and general
equipments is 25 percent in India which is higher than in developed countries. De-Miguel et al. (2001)
have shown that as the NDTS is higher in Spain than in other developed countries, it has acted as a
significant factor in the determination of leverage of the corporate sector in that country. We have
found similar evidence in India, and one can say that fiscal treatment affects the capital structure
decisiona of Indian corporate sector. This is in line with the prediction of Masulis (1980) that non-debt
tax shields acts as a substitute to the interest tax shields.
Liquidity has significant positive impact on long term debt and equity. Therefore, it can be said
that liquidity of firms acts as an indication of its capability to meet its short-term obligations such as
interest payments, which induces the borrower to borrow more as/when liquidity increases. The positive
impact of liquidity also highlights the fact that liquidity can also act as a tool for reduction of asymmetry
of information in the public domain. This finding is in contrast with the findings of Ozkan (2001) and
Prowse (1990), who found a negative link between liquidity and leverage. Hence, in the Indian context,
higher solvency of firms increases its borrowing capacity, unlike the firms in UK, where liquidity figures
are believed to be manipulated by managers in favour of equity holders. The result is consistent

20
Table 7: Results of regressions where the dependent variable is Long – Term Debt to Total Asset
Variables
Ordinary Least
Squares (OLS)
OLS with Panel Corrected Standard Errors
(PCSE) (Beck & Katz, 1995)
Driscoll-Kraay, 1998
One Way Fixed Effect
One Way Fixed Effect with
Heteroskedasticity & Auto-correlation
(Driscoll & Kraay, 1998)
One Way Random
Effect
FGLS With Heteroskedasticity & AR(1) Error Term
Parks & Kmenta (1967, 1986)
Age -0.0006* (0.000064)
-0.0008* (0.000095)
-0.0006* (0.00012)
-0.0004 (0.000347)
-0.0004 (0.000627)
-0.00082* (0.000119)
-0.00087* (0.00007)
Size 0.023* (0.00095)
0.024* (0.0013)
0.023* (0.00103)
0.024* (0.0031)
0.024* (0.0043)
0.025* (0.0015)
0.025* (0.00104)
Profitability 0.58* (0.038)
0.27* (0.0385)
0.58* (0.1119)
0.28* (0.0394)
0.28* (0.0623)
0.35* (0.0360)
0.16* (0.0239)
Tangibility 0.23* (0.0062)
0.21* (0.0083)
0.23* (0.0046)
0.13* (0.011)
0.13* (0.01604)
0.19* (0.0082)
0.21* (0.0057)
Non-Debt Tax Shields
-0.38* (0.076)
-0.67* (0.088)
-0.38* (0.172)
-0.48* (0.097)
-0.48* (0.1744)
-0.54* (0.0827)
-0.62* (0.0505)
Growth 0.02* (0.0023)
0.0069* (0.0022)
0.02* (0.00806)
0.007* (0.0017)
0.007** (0.0032)
0.0102* (0.0017)
0.007* (0.00103)
Liquidity 0.065* (0.0035)
0.081* (0.0039)
0.065* (0.00403)
0.094* (0.0039)
0.094* (0.0075)
0.084* (0.0034)
0.092* (0.0024)
Interest-Cover -0.027* (0.0012)
-0.018* (0.0012)
-0.027* (0.0039)
-0.019* (0.0011)
-0.019* (0.0022)
-0.021* (0.0011)
-0.015* (0.0007)
Net-Export -0.026* (0.0057)
-0.028* (0.0077)
-0.026* (0.0039)
-0.007 (0.0134)
-0.007 (0.0127)
-0.028* (0.0085)
-0.014* (0.0052)
Labour-Capital Ratio -0.043* (0.0083)
-0.044* (0.0107)
-0.043* (0.01008)
-0.135* (0.0224)
-0.135* (0.0217)
-0.066* (0.0131)
-0.035* (0.0071)
Regulation -0.00005* (0.000018)
-0.00011* (0.00002)
-0.00005* (0.000035)
-0.00014* (0.00003)
-0.00014* (0.00004)
-0.00011* (0.00002)
-0.00012* (0.000014)
Constant -0.076* (0.0099)
-0.047* (0.011)
-0.076* (0.01431)
-0.013 (0.01306)
-0.013 (0.01599)
-0.039* (0.01006)
-0.063* (0.0073)
No of Observations 5792 5792 5792 5792 5792 5792 5560
No of Groups - 1154 1154 1154 1154 1154 921
F test F(11,5780)= 352.52 F(11,1153)
=1423.63 F(11,1153)
=124.31 F(11,1153)=95.60
21
R2 0.43 0.40 within (0.22) Within(0.22) Overall
(0.38)
Adjust. R2 0.40 -
Root MSE 0.08 0.089
Wald Chi2 Chi2(11)=2168 - 2204.03 5250.3 Correlation coefficient 0.66 -
Sigma u 0.08 0.06
Sigma e 0.06 0.06
rho 0.67 0.56 AR(1) co-efficient=0.78
*, **, *** indicate the significance at 1 percent, 5 percent, and 10 percent level. The values in the parentheses indicate the standard errors.
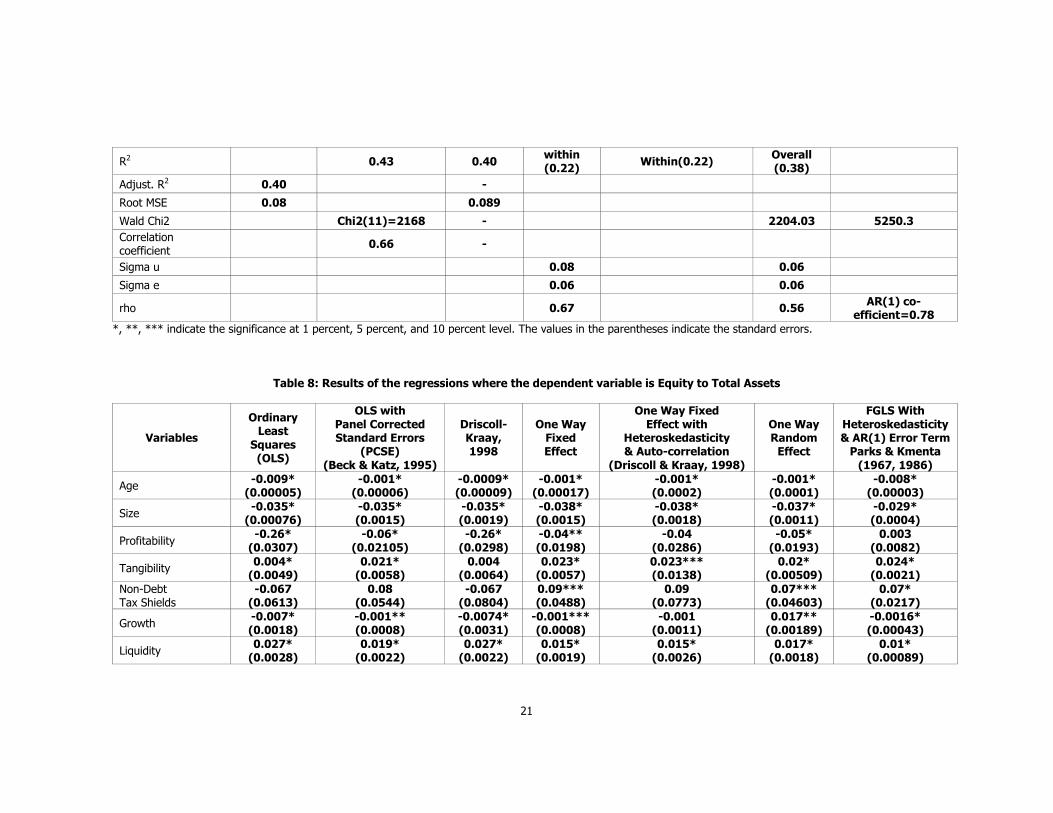
Table 8: Results of the regressions where the dependent variable is Equity to Total Assets
Variables
Ordinary Least
Squares (OLS)
OLS with Panel Corrected Standard Errors
(PCSE) (Beck & Katz, 1995)
Driscoll-Kraay, 1998
One Way Fixed Effect
One Way Fixed Effect with
Heteroskedasticity & Auto-correlation
(Driscoll & Kraay, 1998)
One Way Random
Effect
FGLS With Heteroskedasticity & AR(1) Error Term
Parks & Kmenta (1967, 1986)
Age -0.009* (0.00005)
-0.001* (0.00006)
-0.0009* (0.00009)
-0.001* (0.00017)
-0.001* (0.0002)
-0.001* (0.0001)
-0.008* (0.00003)
Size -0.035* (0.00076)
-0.035* (0.0015)
-0.035* (0.0019)
-0.038* (0.0015)
-0.038* (0.0018)
-0.037* (0.0011)
-0.029* (0.0004)
Profitability -0.26* (0.0307)
-0.06* (0.02105)
-0.26* (0.0298)
-0.04** (0.0198)
-0.04 (0.0286)
-0.05* (0.0193)
0.003 (0.0082)
Tangibility 0.004* (0.0049)
0.021* (0.0058)
0.004 (0.0064)
0.023* (0.0057)
0.023*** (0.0138)
0.02* (0.00509)
0.024* (0.0021)
Non-Debt Tax Shields
-0.067 (0.0613)
0.08 (0.0544)
-0.067 (0.0804)
0.09*** (0.0488)
0.09 (0.0773)
0.07*** (0.04603)
0.07* (0.0217)
Growth -0.007* (0.0018)
-0.001** (0.0008)
-0.0074* (0.0031)
-0.001*** (0.0008)
-0.001 (0.0011)
0.017** (0.00189)
-0.0016* (0.00043)
Liquidity 0.027* (0.0028)
0.019* (0.0022)
0.027* (0.0022)
0.015* (0.0019)
0.015* (0.0026)
0.017* (0.0018)
0.01* (0.00089)

22
Interest-Cover -0.00004 (0.00099)
0.0004 (0.00063)
-0.00004 (0.0008)
0.0011** (0.0005)
0.0011 (0.0009)
0.0012** (0.0005)
0.0004*** (0.0002)
Net-Export -0.036* (0.0045)
-0.02* (0.0055)
-0.036* (0.0035)
-0.02* (0.0067)
-0.02* (0.0079)
-0.02* (0.0057)
-0.004* (0.0019)
Labour-Capital Ratio -0.06* (0.0066)
-0.05* (0.0076)
-0.06* (0.0085)
-0.04* (0.0113)
-0.04* (0.0115)
-0.05* (0.0092)
-0.03* (0.00307)
Regulation 0.00008* (0.00001)
0.00006* (0.00001)
0.00008* (0.000023)
0.00007* (0.00001)
0.00007* (0.00002)
0.00007* (0.00001)
0.00005* (0.0000006)
Constant 0.27* (0.0079)
0.25* (0.0082)
0.27* (0.0185)
0.26* (0.0065)
0.26* (0.01307)
0.26* (0.0061)
0.21* (0.0031)
No of Observations 5792 5792 5792 5792 5792 5792 5560
No of Groups 1154 1154 1154 1154 1154 922
F test F(11,5780) =376.12 F(11,1153)
=2030.36 F(11,4627)
=166.23 F(11,1153)
=76.27
R2 0.4172 0.49 0.41 Within (0.28)
Within (0.28) 0.40
Adjust. R2 0.4162
Root MSE 0.07 0.07
Wald Chi2 1183.26 2536.53 8131.28 Correlation coefficient 0.78
Sigma u 0.08 0.07
Sigma e 0.03 0.03
rho 0.87 0.86 AR(1) coefficient=0.82
*, **, *** indicate the significance at 1 percent, 5 percent, and 10 percent level. The values in the parentheses indicate the standard errors.
23
with the lending setup of India which is mostly dominated by banks and financial institutions. In other
words, private debt dominated system values liquidity as private lenders have superior information in
contrast with the market dominated system like UK. This is true also in case of India where capital
market is developed and this information is less in the public domain as they are susceptible to
manipulation.
Impact of interest cover on long term debt is significantly negative but its impact on equity is
insignificant although negative. This finding is in line with the prediction of Harris & Raviv (1991) that
interest cover acts as an inverse proxy for default risk. Therefore, as the interest cover increases,
probability of default decreases, as a result of which debt decreases.
In case of profitability, we find evidence in favour of trade-off theory as the sign of the co-
efficient is positive. This could be due to the fact that current profitability of the firms may not be
sufficient to cover the investment expenditure, and they may need to use internal resources or need to
borrow to cover investment expenditure. The other reason could be, due to high level of taxation, firms
may want to realize more tax shields from interest payment. This highlights the effect of institutional
factors on capital structure decisions of Indian firms. This is in contrast with the findings of Chakraborty
(2010), De-Miguel and Pindado (2001), which supports the pecking order hypothesis. However, Ozkan
(2001) have shown that lagged value of profitability is positively related to leverage whereas current
profitability is inversely related.
In contrast to the findings of Kakani (1999), we find no evidence in favour of the government
stand that net exporting firms are less leveraged as the impact of export is statistically insignificant.
Kakani’s (1999) result could be biased inference due to heteroskedasticity and autocorrelation and
contemporaneous correlation. It can be seen from (table …) that when all the effects such as firm
specific effect, heteroskedasticity, autocorrelation and contemporaneous correlation are not
simultaneously taken care of, the co-efficient turns out to be significant.8
In contrast to Modigliani and Miller’s (1958) prediction that financial decision and real decisions
are independent of each other, we have obtained evidence that employment decision and capital
structure decision are interdependent. This finding is consistent with the findings of Funke et al. (1999).
The impact of labour capital ratio on demand for long term debt is negative and significant, which
means that as employment increases, demand for debt also decreases, as the marginal cost of debt
becomes higher than the productivity of capital. So, it can be concluded that financial decision and real
decisions are interdependent in India. Moreover, the interplay among various decisions of corporations
provides evidence in favour of market imperfection.
In order to comprehend the role of institutions, the study has made use of the index of capital
market regulation. The impact of capital market regulation on long term debt is negative and significant,
which is due to the fact that Indian firms face higher transaction cost in the public debt market in order
to comply with disclosure-requirements needed to reduce information asymmetry. For example, the
statutory requirement of obtaining credit rating from two credit rating institutions and establishment of
debenture trustees and debt redemption funds etc. might be imposing substantial cost on the firms. The
8 The case of Parks-Kmenta method applies FGLS and it is criticized for producing lowest standard errors.

24
reduction in public debt is probably not compensated by the loan obtained from private lenders, and
this could be behind the reduction in overall long term debt.
On the other hand, the impact of capital market regulation on the equity is positive and
significant, although the magnitude of the impact is very small. This is due to the fact that capital
market regulation acts as an inverse proxy for the information asymmetry and ‘asset-substitution’
problem, i.e., higher the degree of monitoring, lower is the problem of information asymmetry and
‘asset-substitution’ and vice versa. The positive impact is indicative of the fact that capital market
regulation has been successful to some extent in the reduction of information asymmetry, and
consequently reducing cost of equity capital of the firms. This might have encouraged the existing good
quality firms as well as new good quality firms to enter into the market and thereby channelize the
scarce resources to their best possible advantage. Therefore, the establishment of SEBI as capital
market regulator is successful to some extent in the Indian context to play the role in reduction of
information asymmetry. Hence, we find partial empirical evidence in favour of the claim of Demirguc-
Kunt et al. (1996) that increased stock market activity increases the preference for equity by the
corporate firms.
Conclusions The principal objective of this study is to understand the effectiveness of institutional factors like capital
market regulation on the use of debt and equity by firms through assessing the impact of the above
regulation on the capital structure decision of firms.
Apart from the impact of capital market regulation, we have also looked into the impact of
taxation policy on financing decision of firms. Moreover, an attempt has also been made to distinguish
between trade-off theory and information asymmetry theory, based on the implication of these theories
on the firm specific factors.
In this study, it has been found that the impact of capital market regulations on debt is
significantly negative. This implies that regulations have adverse impact on the use of public debt,
probably because of increased cost of transaction in the public sphere in comparison to the private
debt. The negative sign indicates that due to regulation, use of overall long-term debt has declined. At
the same time, it points to the probability that reduction in public debt has not been compensated by
private debt. This indicates that there is borrowing constraints which might be because of lesser supply
of loanable funds.
On the contrary, capital market regulation has had significant positive impact on the use of
equity capital. This is indicative of the fact that the regulation has been successful in reducing
information asymmetry as well as asset substitution problem in the capital market and thereby to
ensure a level playing field for outside investors. However, it is impossible to say to what extent these
regulations are successful in reduction of information asymmetry and ‘asset substitution’ problem, but in
the long run there is a positive feedback of regulations, at least for good quality firms. Age and size are
found to be negatively related to equity use. It emphasizes the fact that for older firms, which are
mostly dominated by family ownership, dilution of ownership is a serious matter of concern. The
concerns of ownership dilution have led to a positive relationship among debt, age and size of firms. In

25
this study, we have however, failed to provide evidence in favour of the pecking order hypothesis as
profitability is negatively related to equity but positively related to debt. This indicates that as the firms
become profitable, they accumulate reserves, which in turn reduce their dependency on equity.
Moreover, higher profitability also reduces the information asymmetry between private lenders and
borrowers, as a result of which debt increases.
It is also found that Indian taxation policy has had significant impact on the use of debt, as
non-debt tax shields and debt have been found negatively related. This is similar to the case of Spain,
where non-debt tax shields are higher in comparison with US. Moreover, it is evident that there is
interaction between real and financial decisions, as evidenced by the noticeably negative impact of
labour capital ratio on debt and equity. This disproves the Modigliani and Miller’s (1958) ‘Capital
Structure Irrelevance Theorem’. Hence, it can be said that there are imperfections in the market which
cause an interaction among the various decisions of corporates.
This study also provides evidence that different nuances of explanations or firm specific
factors, considered hitherto (from available empirical literature), have different conceptual dimensions.
Firm specific factors like tangibility, liquidity are successful in reduction of information asymmetry in the
capital market, which indicates that these factors have content of information. However, it is an
interesting finding that although factors like tangibility and liquidity tend to reduce information
asymmetry, it also supports certain predictions of the trade-off theory. The co-efficient of regression
reveals that relative efficacy of static trade-off theory is more in comparison to the pecking-order
hypothesis.
The contribution of this study is twofold. First, it seeks to enrich the body of empirical literature
on capital structure in the context of a developing economy like India. Second, it provides empirical
evidence in in support of the observation that institutional factors, such as capital market regulation and
fiscal treatment, matter greatly in deciding the financing policy of corporations. The theoretical
arguments, data set and conclusions of this study may be of use to both researchers and policy makers
who are convinced of the importance of institutional factors in the determination of financial policy of
corporations in an economy.

26
References Abiad A, Modi A (2003). Financial Reform: What shakes it? What shapes it?. Working Paper No. 70.
International Monetary Fund, Washington.
Bandiera O et al (2000). Does financial reform raise or reduce savings. Review of Economics and
Statistics, 82: 239-63.
Beck N, Katz J N (1995). What to do (and not to do) with time-series cross-section data. American
Political Science Review, 89: 634-47.
Best R, Zhang H (1993). Alternative information sources and the information content of bank loans.
Journal of Finance, 40: 1385-401.
Chakraborty I (2010). Capital structure in an emerging stock market: The case of India. Research in
International Business and Finance, 24: 295-314.
Deangelo H, Masulis R W (1980). Optimal capital structure under corporate and personal taxation.
Journal of Financial Economics, 8: 3-29.
————— (1980). Optimal capital structure under corporate and personal taxation. Journal of Financial
Economics, 8: 3-29.
Deesomsak R, Paudyal K and Prescetto G (2004). The determinants of capital structure: evidence from
Asia Pacific region. Journal of Multinational Financial Management, 14: 387-405.
Delcoure N (2007). The determinants of capital structure in transitional economies. International Review
of Economics and Finance, 16: 400-415.
De-Miguel A, Pindado J (2001). Determinants of capital structure: new evidence from Spanish panel
data. Journal of Corporate Finance, 7: 77-99.
Demirguc-Kunt A, Maksimovic V (1996). Stock market development and firms’ financing choices. World
Bank Economic Review, 10: 341-69.
Driscoll J C, Kraay A C (1998). Consistent covariance matrix estimation with spatially dependent panel
data. Review of Economics and Statistics, 80: 549-560.
Franks J R, Torous W N (1993). A comparison of the U.K and U.S bankruptcy codes. Journal of Applied
Corporate Finance, 95-103.
Funke M, Maurer W, Strulik H (1999). Capital structure and labour demand: Investagations using
german micro data. Oxford Bulletin of Economics and Statistics, 61: 199-215.
Harris M, Raviv A (1991). The theory of capital structure. Journal of Finance, 46: 297-355.
Hausman J (1978). Specification tests in econometrics. Econometrica, 46: 1251-71.
Kakani R K (1999). The determinants of capital structure- An econometric analysis. Finance India, 1: 51-
59.
Kmenta J (1986). Elements of Econometrics, 2nd ed., New York: Macmillan
Mcclure K G, Clayton R and Hofler R A (1999). International capital structure differences among the G-7
nations: a current empirical view. The European Journal of Finance, 5: 141-64.
Modigliani F, Miller M H (1958). The cost of capital, corporation Finance and the theory of investment.
American Economic Review, 68: 261-97.
Newey W K, West K D (1987). A simple, positive semi-definite, heteroskedasticity and autocorrelation
consistent covariance matrix. Econometrica, 55: 703-708.

27
Ozkan A (2001). Determinants of capital structure and adjustment to long run target: Evidence from UK
company panel data. Journal of Business Finance and Accounting, 28: 175-99.
Parks R (1967). Efficient Estimation of a system of regression equations when disturbances are both
serially and contemporaneously correlated. Journal of the American Statistical Association, 62:
500-509.
Prowse S D (1990). Institutional investment patterns and corporate financial behavior in the US and
Japan. Journal of Financial Economics, 27: 43-66.
Rajan R G, Zingales L (1995). What do we know about capital structure? Some evidence from
international data. Journal of Finance, 1: 1421-461.
Rao S N, Lukose J P J (2002). An empirical study on the determinants of the capital structure of listed
firms. Social Science Research Network (SSRN), Working paper.
Titman S, Wessels R (1988). The determinants of capital structure choice. Journal of Finance, 43: 1-19.
Wald J K (1999). How firm characteristics affect capital structure: an international comparison. The
Journal of Financial Research, 22: 161-187.
White H (1980). A heteroskedasticity- consistent covariance matrix estimator and a direct test of
heteroskedasticity. Econometrica, 48: 817-38.

28
Appendix
Regulation of Entry and Public Issue:
1996-97:
During 1996-97 it was decided that in order to deter the ingenuine firms to enter in to the market to
raise capital, it was decided that an unlisted company with a track record of dividend payment for at
least three years out of preceding five years only allowed accessing the securities markets for raising
capital through equity or instruments converted into equity. Moreover, a listed company making further
issue of equity capital had to satisfy the same as it is applicable for unlisted companies. This has been
assigned value 1.
1998-99:
Eligibility norms for initial public offer were relaxed during 1998-99 in order to allow greater number of
firms accessing the capital market. New companies having distributable profits in terms of section 205
of Companies Act for at least three out of immediately preceding five years and a pre-issue net worth of
not less than Rs. 1 crore in three out of preceding five years were allowed to mobilize capital through
Initial Public Offering (IPOs). However, the minimum net worth requirement of Rs. 1 crore is to be met
during the immediately preceding two years. Therefore, in order to accommodate this relaxation
in stringency we have assigned -0.5.
2000-01:
Further, during 2000-01, it was observed that in practice the requirement of distributable profits and
appraisal of bank did not serve its intended purpose. It has again been modified that if the issuer did
not have a stipulated net worth or track record of distributable profits or if the issuer is a listed company
which proposed to raise more than five times its pre-issue net-worth, the revised guidelines required
issue to be compulsorily made through Book building route wherein 60 percent of the offer has to be
allotted to the Qualified Institutional Buyers (QIBs). In case 60 percent cannot be allotted to QIBs the
issue will have to fail. This norm is also applicable to companies, which propose to make an offer for
sale. Therefore, we have assigned value of 1.
Earlier companies could access the primary market only if they had offered a minimum of 25
percent of their post issue capital to the public as prescribed under rule 19 (2) (b) of securities contract
(regulation) rules, 1957. On December 12, 2000, it was modified that offering of 10 percent of post
issue capital to the public was made available to all sectors subject to the minimum offering of 20 lakh
shares. However, in order to ensure a wide float, it was stipulated that the minimum issue size should
be increased from Rs. 50 crore to Rs. 100 crore. Companies not fulfilling the aforesaid conditions are
required to make minimum public offering of 25 percent. The restriction of minimum public issue size of
Rs. 25 crore in the case of an IPO through book-building was removed and all companies were allowed
to make issue through book-building. However, if the track record criteria are satisfied, allocation to
QIBs can be less than 60 percent. The relaxation was done to encourage the small firms to enter into
the market. It is clear from the fact that number of issues in the category of less than 5 crore increased

29
to 66 in 2000-01 as compared to 19 in the previous year. This has been assigned -0.5. Therefore, the
resultant value of the dummy for entry regulation is 1 (0.5+1-0.5).
2003-04:
On August 14, 2003, the requirement of allotment of 60 percent to QIBs was relaxed to 50 percent
provided that issue is made through the book-building process or the project has at least 15 percent
participation by financial institution or scheduled commercial banks, of which 10 percent comes from
the appraisers. In addition to this, at least 10 percent of the issue size shall be allotted to QIBs, failing
which the full subscription monies shall be refunded. Moreover, the minimum post issue face value
capital of the company shall be Rs. 10 crore. In case of book built issues, the QIBs such as banks,
mutual funds FIIs etc. are entitled to an allocation of 50 percent except mandatory allocation of 60
percent in terms of rule 19(2) (b) of SC (R) Rules 1957. Within the category of QIBs, there was no
specific allocation for any group. This relaxation has been assigned value -0.5.
2005-06:
In order to increase retail participation SEBI (DIP) guidelines 2000 were amended to introduce specific
allocation of 5 percent to mutual funds within the QIB category with effect from September 19, 2005. In
addition mutual funds would also be eligible for allotment from the balance available for the QIBs. This
has been assigned a value of 1.
Promoter’s Contribution and Lock-in Period:
1992:
According to Original DIP Guidelines of June 1992, Promoters Contribution for public issues by unlisted
as well as listed companies specified as 25% for issue size up to Rs.100 crore and 20% for issue size
above Rs.100 crore. For unlisted companies eligible to bring out public issues at premium, the
promoters’ contribution should not be less than 50 percent of post issue capital of the issuer company.
In case of offers for sale of securities of unlisted companies, promoters’ shareholding subject to lock-in
shall not be less than 25%. It has been assigned value 1.
1996-97:
During 1996-97, it was specified that the promoters should bring their entire contribution before the
opening of an issue in case the promoter’s contribution in the company exceeds Rs. 100 crore relaxed
and the promoters allowed henceforth bringing in 50 percent of their contribution before opening of
issue and balancing 50 percent in advance pro-rata before calls made on public. This has been
assigned value 1.
2000:
In case promoters’ contribution has been brought prior to public issue and has already been deployed
by the company, the company shall give the cash flow statement in the offer document disclosing the
use of such funds received as promoters’ contribution (August 4, 2000). It was also been provided that

30
promoters contribution is required to be kept in escrow account with a scheduled commercial bank and
the same can be released only with the public issue proceeds. This has been assigned value 1.
Issue of Debt Instrument:
1998-99:
To reduce the information asymmetry it was necessary to raise the standards of disclosure during 1998-
99, and to help investors make informed decision , every public or right issue of debt instruments is
required to be compulsorily rated by the approved credit rating agency irrespective of their maturity/
conversion period as against 18 months. If a public or right issue of debt security is greater than or
equal to Rs. 100 crore two ratings from two different credit rating agencies should be obtained. This
has been assigned value 1.
2000-01:
During 2000-01, it was specified that in order to provide a variety of debt instruments and to help the
development of the debt market, the SEBI permitted the issue of unsecured / subordinated debt
instruments for providing mezzanine capital provided that these are subscribed by the QIBs or where
the debenture allottees/ holders have given their positive consent. This has been assigned value -
0.5.
2001-02:
During 2001-02, to facilitate the resource mobilization by unlisted companies SEBI has issued some
guidelines. An unlisted company making a public issue of NCDs, may subject to other applicable
provisions of these guidelines, make a public issue and make an application for listing its NCDs in the
stock exchanges without making a prior public issue of equity and listing. This has been assigned
value -0.25.
2003:
In case of issue of debenture with maturity of more than 18 months, the issuer shall appoint a
debenture trustee. To overcome the ‘asset substitution’ (misuse of debt holders money by equity
holders) problem faced by debt holders the specification of 18 months was removed and appointment
of debenture trustee was made applicable to all debenture issues. Moreover, the responsibility of
obtaining report from lead bank regarding monitoring progress of the project and monitoring utilization
of funds raised with debenture issues lies with debenture trustees. In order to secure the rights of the
debenture holders a debenture redemption fund was asked to be created by all companies issuing
debenture irrespective of the maturity of the debenture and in case the company fails to meet the
obligation of interest payment on debentures or redemption of debentures, distribution of dividend shall
require prior approval of debenture trustees and the lead institution which was earlier applicable only to
the new companies (August 14 2003). This has been assigned value 1.
31
Preference Share Issue:
1994:
In order to eliminate the price differential between preference shareholders and ordinary shareholders,
in August 04, 1994 SEBI issued guidelines for the preferential issues. The guideline issued by SEBI is
under the provision of Section 81(1A) of the Companies Act 1956. It states that preferential issue of
shares or warrants or fully convertible debentures (FCDs) or partly convertible debentures (PCDs) can
be made at a price not less than higher of the following : The average of the weekly high and low of the
closing prices of the related shares quoted on the stock exchange during the six months preceding the
relevant date OR the average of the weekly high and low of the closing prices of the related shares
quoted on a stock exchange during the two weeks preceding the relevant date where "relevant date"
for this purpose means the date thirty days prior to the date on which the meeting of General Body of
shareholders is convened, in terms of Section 81(1A) of the Companies Act to consider the proposed
issue. In case of warrant an upfront payment of ten percent of the fixed price would be payable on the
date of their allotment and this amount would be adjusted against the price payable subsequently for
acquiring the shares by exercising an option for the purpose. The amount would be forfeited if the
option to acquire shares is not exercised. In case of warrants/ FCDs/ PCDs maturity period should not
exceed beyond 18 months from the date of issue. Maturity of the instruments should not exceed
beyond 18 months from the date of issue of the relevant instrument. Moreover, warrants/FCDs/PCDs or
any other financial instruments issued on a preferential basis will not be transferable. The shares
allotted on a preferential basis will not be transferable in any manner for a period of 5 years from their
date of allotment. Similarly, the shares acquired, by conversion or otherwise, would also remain locked
in for a period of five years from their date of allotment. Similarly, the shares acquired by conversion or
otherwise, would also remain locked in for a period of five years from the date of their allotment. It was
stipulated that action on resolution passed at a meeting of shareholders of company granting consent
on preferential issue of any financial instrument shall be completed within three months from the date
of passing resolution, if nor completed a fresh resolution has to be passed. Apart from these, an auditor
has to certify that instrument is being made in accordance with the requirements contained in these
guidelines. Allotment to FIIs is subject to approval of govt. of India, SEBI, and RBI. This has been
given value of 1.
2000-01:
In 2000-01 guidelines for preferential issue of securities were further modified to enhance the disclosure
level of issue process with the intention to enable the share holders to have adequate information
regarding the allotment on the basis of which they can accord their approval for allotment. It was
stipulated that notice for general meeting shall contain the objective of the issue through preferential
offer, intention of promoters, directors and key management persons to subscribe to the offer, share
holding pattern before and after the offer, proposed time within which such allotment would be
complete and the identity of the proposed allottees and the percentage of post preferential issue capital
that may be held by them. The lock-in period for preferential instrument has been reduced to one year

32
as compared to the previous period of five years except for such allotments which involve share-swap
for acquisition. This has been given value 1.
2003-04:
During 2003-04 it was stipulated that listed and unlisted companies issuing debt securities on private
placement basis should make full disclosure on its website or stock exchange or SEBI. If such securities
are not proposed to be listed, SEBI regulated intermediaries should discourage from associating with
issuance and trading. Companies must appoint debenture trusties for all securities issued through
private placement and debt securities should carry a credit rating not less than investment grade.
Trading in privately placed securities should take place between qualified institutional investors and high
net worth individuals in standard denomination of Rs. 10 lakh. Earlier it was pre supposed that company
should have a listing history of at least six months for proposing preferential allotment. This has been
given value 1.
2007-08:
During 2007-08 it was amended that companies with listing history of less than six months will be able
to raise fund through preferential allotment. Moreover, it was specified that PAN number of the allottees
should be obtained by the company going for allotment. This has been given value -0.5.

246 Patterns and Determinants of FemaleMigration in India: Insights from CensusSandhya Rani Mahapatro
247 Spillover Effects from MultinationalCorporations: Evidence From West BengalEngineering IndustriesRajdeep Singha and K Gayithri
248 Effectiveness of SEZs Over EPZsStructure: The Performance atAggregate LevelMalini L Tantri
249 Income, Income Inequality and MortalityAn empirical investigation of therelationship in India, 1971-2003K S James and T S Syamala
250 Institutions and their Interactions:An Economic Analysis of IrrigationInstitutions in the Malaprabha DamProject Area, Karnataka, IndiaDurba Biswas and L Venkatachalam
251 Performance of Indian SEZs: ADisaggregated Level AnalysisMalini L Tantri
252 Banking Sector Reforms and NPA:A study of Indian Commercial BanksMeenakshi Rajeev and H P Mahesh
253 Government Policy and Performance: AStudy of Indian Engineering IndustryRajdeep Singha and K Gayithri
254 Reproduction of Institutions throughPeople’s Practices: Evidences from aGram Panchayat in KeralaRajesh K
255 Survival and Resilience of Two VillageCommunities in Coastal Orissa: AComparative Study of Coping withDisastersPriya Gupta
256 Engineering Industry, CorporateOwnership and Development: Are IndianFirms Catching up with the GlobalStandard?Rajdeep Singha and K Gayithri
257 Scheduled Castes, Legitimacy and LocalGovernance: Continuing Social Exclusionin PanchayatsAnand Inbanathan and N Sivanna
258 Plant-Biodiversity Conservation inAcademic Institutions: An EfficientApproach for Conserving BiodiversityAcross Ecological Regions in IndiaSunil Nautiyal
259 WTO and Agricultural Policy in KarnatakaMalini L Tantri and R S Deshpande
260 Tibetans in Bylakuppe: Political and LegalStatus and Settlement ExperiencesTunga Tarodi
261 Trajectories of China’s Integration withthe World Economy through SEZs: AStudy on Shenzhen SEZMalnil L Tantri
Recent Working Papers262 Governance Reforms in Power Sector:
Initiatives and Outcomes in OrissaBikash Chandra Dash and S N Sangita
263 Conflicting Truths and ContrastingRealities: Are Official Statistics onAgrarian Change Reliable?V Anil Kumar
264 Food Security in Maharashtra: RegionalDimensionsNitin Tagade
265 Total Factor Productivity Growth and ItsDeterminants in Karnataka AgricultureElumalai Kannan
266 Revisiting Home: Tibetan Refugees,Perceptions of Home (Land) and Politicsof ReturnTarodi Tunga
267 Nature and Dimension of Farmers’Indebtedness in India and KarnatakaMeenakshi Rajeev and B P Vani
268 Civil Society Organisations andElementary Education Delivery in MadhyaPradeshReetika Syal
269 Burden of Income Loss due to Ailment inIndia: Evidence from NSS DataAmrita Ghatak and S Madheswaran
270 Progressive Lending as a DynamicIncentive Mechanism in MicrofinanceGroup Lending Programmes: EmpiricalEvidence from IndiaNaveen Kumar K and Veerashekharappa
271 Decentralisation and Interventions inHealth Sector: A Critical Inquiry into theExperience of Local Self Governments inKeralM Benson Thomas and K Rajesh
272 Determinants of Migration andRemittance in India: Empirical EvidenceJajati Keshari Parida and S Madheswaran
273 Repayment of Short Term Loans in theFormal Credit Market: The Role ofAccessibility to Credit from InformalSourcesManojit Bhattacharjee and Meenkashi Rajeev
274 Special Economic Zones in India: Arethese Enclaves Efficient?Malini L Tantri
275 An Investigation into the Pattern ofDelayed Marriage in IndiaBaishali Goswami
276 Analysis of Trends in India’s AgriculturalGrowthElumalai Kannan and Sujata Sundaram
277 Climate Change, Agriculture, Povertyand Livelihoods: A Status ReportK N Ninan and Satyasiba Bedamatta
278 District Level NRHM Funds Flow andExpenditure: Sub National Evidence fromthe State of KarnatakaK Gayithri

279 In-stream Water Flows: A Perspectivefrom Downstream EnvironmentalRequirements in Tungabhadra RiverBasinK Lenin Babu and B K Harish Kumara
280 Food Insecurity in Tribal Regions ofMaharashtra: Explaining Differentialsbetween the Tribal and Non-TribalCommunitiesNitin Tagade
281 Higher Wages, Cost of Separation andSeasonal Migration in IndiaJajati Keshari Parida and S Madheswaran
282 Pattern of Mortality Changes in Kerala:Are they Moving to the Advanced Stage?M Benson Thomas and K S James
283 Civil Society and Policy Advocacy inIndiaV Anil Kumar
284 Infertility in India: Levels, Trends,Determinants and ConsequencesT S Syamala
285 Double Burden of Malnutrition in India:An InvestigationAngan Sengupta and T S Syamala
286 Vocational Education and Child Labour inBidar, Karnataka, IndiaV Anil Kumar
287 Politics and Public Policies: Politics ofHuman Development in Uttar Pradesh,IndiaShyam Singh and V Anil Kumar
288 Understanding the Fiscal Implications ofSEZs in India: An Exploration in ResourceCost ApproachMalini L Tantri
289 Does Higher Economic Growth ReducePoverty and Increase Inequality?Evidence from Urban IndiaSabyasachi Tripathi
290 Fiscal DevaluationsEmmanuel Farhi, Gita Gopinath and Oleg Itskhoki
291 Living Arrangement Preferences andHealth of the Institutionalised Elderly inOdishaAkshaya Kumar Panigrahi and T S Syamala
292 Do Large Agglomerations Lead toEconomic Growth? Evidence from UrbanIndiaSabyasachi Tripathi
293 Representation and Executive Functionsof Women Presidents andRepresentatives in the GramaPanchayats of KarnatakaAnand Inbanathan
294 How Effective are Social Audits underMGNREGS? Lessons from KarnatakaD Rajasekhar, Salim Lakha and R Manjula
295 Vulnerability Assessment Of TheAgricultural Sector In Yadgir District,Karnataka: A Socio-Economic SurveyApproachSarishti Attri and Sunil Nautiyal
296 How Much Do We Know about theChinese SEZ Policy?Malini L Tantri
297 Emerging Trends in E-Waste Management- Status and IssuesA Case Study of Bangalore CityManasi S
298 The Child and the City: Autonomous Mi-grants in BangaloreSupriya RoyChowdhury
299 Crop Diversification and Growth of Maizein Karnataka: An AssessmentKomol Singha and Arpita Chakravorty
300 The Economic Impact of Non-communicable Disease in China and India:Estimates, Projections, and ComparisonsDavid E Bloom, Elizabeth T Cafiero, Mark EMcGovern, Klaus Prettner, Anderson Stanciole,Jonathan Weiss, Samuel Bakkia and LarryRosenberg
301 India’s SEZ Policy - Retrospective AnalysisMalini L Tantri
302 Rainwater Harvesting Initiative inBangalore City: Problems and ProspectsK S Umamani and S Manasi
303 Large Agglomerations and EconomicGrowth in Urban India: An Application ofPanel Data ModelSabyasachi Tripathi
304 Identifying Credit Constrained Farmers:An Alternative ApproachManojit Bhattacharjee and Meenakshi Rajeev
305 Conflict and Education in Manipur: AComparative AnalysisKomol Singha
Price: Rs. 30.00 ISBN 978-81-7791-162-6
INSTITUTE FOR SOCIAL AND ECONOMIC CHANGEDr V K R V Rao Road, Nagarabhavi P.O., Bangalore - 560 072, India
Phone: 0091-80-23215468, 23215519, 23215592; Fax: 0091-80-23217008E-mail: [email protected]; Web: www.isec.ac.in