wp1 use cases, business models and services d1.3 t1.4
TRANSCRIPT

THIS PROJECT HAS RECEIVED FUNDING FROM THE EUROPEAN UNION’S HORIZON 2020 RESEARCH AND INNOVATION
PROGRAMME UNDER GRANT AGREEMENT NO 857237
interoperable solutions connecting smart homes,
buildings and grids
D1.3
System use cases for smart buildings and
grids
WP1 – Use Cases, Business Models
and Services
T1.4

System use cases for smart buildings and grids
WP1
2 | 60
DOCUMENT INFORMATION
DOCUMENT D1.3 – System use cases for smart buildings
and grids
TYPE Report
DISTRIBUTION LEVEL Public
DUE DELIVERY DATE 31/03/2021
DATE OF DELIVERY 11/05/2021
VERSION 1.0.1
DELIVERABLE RESPONSIBLE TRIALOG
AUTHOR (S) TRIALOG, EEBUS, all pilots partners
OFFICIAL REVIEWER/s WP1 Leader (EEBUS)
DOCUMENT HISTORY
VERSION AUTHORS DATE CONTENT AND CHANGES
0.1 Frédéric Mesureur
26/01/2021 Initial document creation, main chapters & table of
contents
0.2 Frédéric Mesureur
17/02/2021 The overall structure of the document has been
reorganized to make it clearer without changing the initial
goal and contents.
The introduction § has been added.
0.3 Frédéric Mesureur
23/02/2021 The following sections were added:
• Abbreviations and acronyms
• § 3.1, 3.2, 3.3, 3.4 and 3.5 (partially)
0.4 Frédéric Mesureur 15/03/2021 Document structure modification
0.5 Frédéric Mesureur
Hadrien Lafforgue
17/03/2021 The following sections were added:
• §3.5, §5
• §7 (work still in progress)
0.5.1 Frédéric Mesureur 18/03/2021 Minor corrections of version 0.5
0.5.1
Ino Prümm/
Ulrich Bartsch
19/03/2021 Chapter 2. and 4. created
0.6 Frédéric Mesureur 24/03/2021 • References to the annexes added
Several corrections and comments

System use cases for smart buildings and grids
WP1
3 | 60
0.7 Ulrich Bartsch 26.03.2021 New version created for final adaptations Transferred the input of chapter 7 from Hadrian out of document V0.51
0.8 Ulrich Bartsch 29.03.2021 Creating a new document for all new changes
0.8 Adrien Lafforgue
Frédéric Mesureur
Dune Sebilleau
29.03.2021 Provide changes according to the previous review
0.9 Ulrich Bartsch
Adrien Lafforgue
Frédéric Mesureur
Ino Prümm
Dune Sebilleau
30.03.2021 Common work to provide last modifications before delivery
1.0 Ulrich Bartsch
Frédéric Mesureur
Ino Prümm
31.03.2021 D1.3 validation
D1.3 ready for delivery
1.0.1 Frédéric Mesureur 11/05/2021 Update of the annexes version numbers
System use cases for smart buildings and grids
WP1
4 | 60
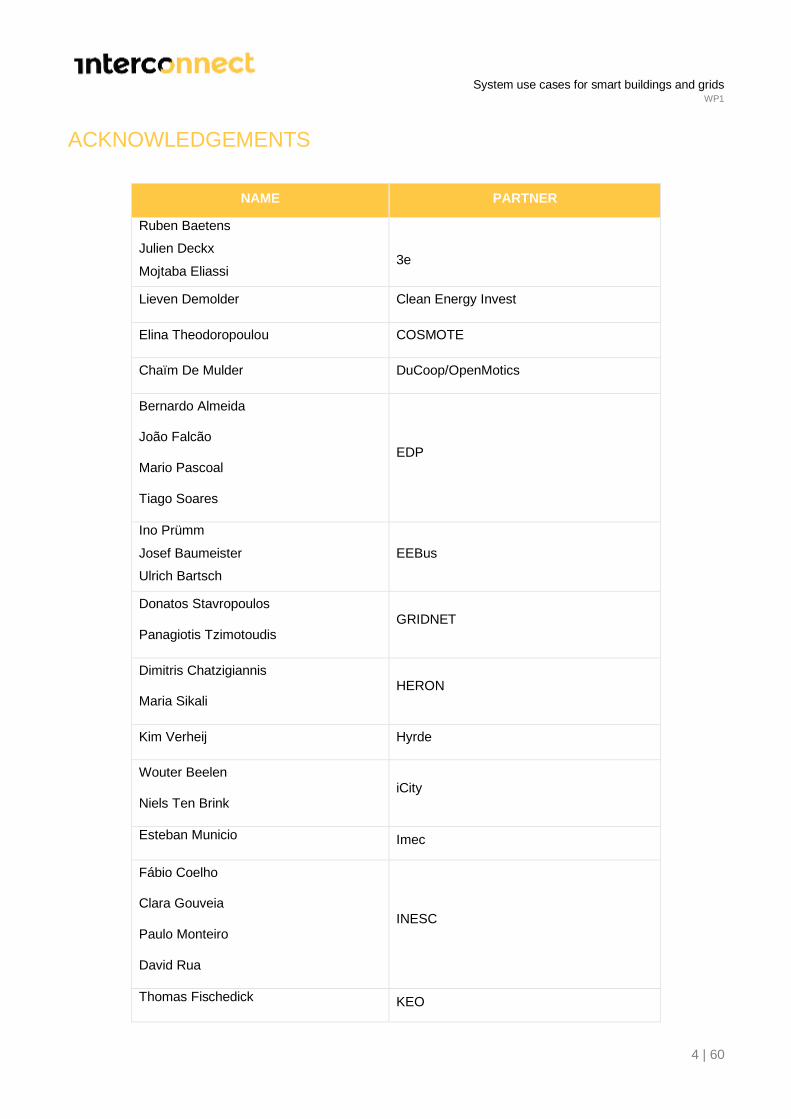
ACKNOWLEDGEMENTS
NAME PARTNER
Ruben Baetens
Julien Deckx
Mojtaba Eliassi
3e
Lieven Demolder Clean Energy Invest
Elina Theodoropoulou COSMOTE
Chaïm De Mulder DuCoop/OpenMotics
Bernardo Almeida
João Falcão
Mario Pascoal
Tiago Soares
EDP
Ino Prümm
Josef Baumeister
Ulrich Bartsch
EEBus
Donatos Stavropoulos
Panagiotis Tzimotoudis GRIDNET
Dimitris Chatzigiannis
Maria Sikali HERON
Kim Verheij Hyrde
Wouter Beelen
Niels Ten Brink iCity
Esteban Municio Imec
Fábio Coelho
Clara Gouveia
Paulo Monteiro
David Rua
INESC
Thomas Fischedick KEO

System use cases for smart buildings and grids
WP1
5 | 60
Stephano Fava
Fabrizio Tortonese
Guilio Troncarelli
Planet Idea
Valerio Angelucci
Renato Urban RSE
Amandio Ferreira SONAE /ELERGONE
Eliana Valles SENSINOV
Klaas Charlier
Pol Olivella
Marc Schicks
Thermovault
Arnor Van Leemputten
Leen Peeters Think-E
Joost Laarakkers
Wilco Wijbrandi TNO
Hadrien Laforgue
Frédéric Mesureur
Dune Sebilleau
TRIALOG
Dominic Ectors
Jung Georg VITO
Thierry Coosemans
Maria Luisa Lode
Maarja Meitern
VUB
Andrea Antonietti Whirlpool
Anaïs Galligani
Stéphane Vera Yncréa
DISCLAIMER:
The sole responsibility for the content lies with the authors. It does not necessarily reflect the
opinion of the CNECT or the European Commission (EC). CNECT or the EC are not
responsible for any use that may be made of the information contained therein.

System use cases for smart buildings and grids
WP1
6 | 60
EXECUTIVE SUMMARY
The goal of this document is to detail the outputs of the Interconnect task 1.4 and which method
has been used to do so.
The task 1.4 aims to produce System Use Cases for smart buildings and grids from
Interconnect Pilot’s High-Level Use Cases. These High-Level Use Cases constitute outputs of
the Task 1.3 and consequently inputs of the Task 1.4 of the Interconnect project.
A commonality study among all the Interconnect’s pilots is also provided to identify clear rules
of engagement/interaction between all parts of the Interconnect ecosystem.
Both System Use Case Specification and Commonalities Analysis results will provide strong
basements to feed the Interconnect WP2 to derive the proper ontologies and pilots’
implementations that will come next.

System use cases for smart buildings and grids
WP1
7 | 60
TABLE OF CONTENTS
EXECUTIVE SUMMARY ________________________________________________________6
LIST OF FIGURES ____________________________________________________________9
LIST OF TABLES ____________________________________________________________11
ABBREVIATIONS AND ACRONYMS_______________________________________________12
1. INTRODUCTION __________________________________________________________14
1.1 OVERALL INTRODUCTION ________________________________________________14
1.2 OBJECTIVES FOR T1.4 ___________________________________________________14
1.2.1 SYSTEM UC FOR BOTH BUILDING DOMAIN & GRID DOMAIN ______________________15
2. CONTEXT DESCRIPTION ____________________________________________________18
2.1 REMIND PREVIOUS PROCESSES USED TO GET HLUCS, PILOTS INVOLVED, D1.1 & D1.2 RESULTS
_____________________________________________________________________18
2.1.1 INNOVATION PROCESS OVERVIEW ________________________________________18
2.1.2 FOSTERING INNOVATION THROUGH DESIGN THINKING METHODOLOGY _____________18
2.1.3 TRANSLATION OF RESULTS THROUGH HIGH LEVEL USE CASES _____________________22
2.1.4 TRANSLATION OF REQUIREMENTS INTO TECHNICAL SYSTEM USE CASE SPECIFICATIONS __23
3. FROM HIGH-LEVEL USE CASE TO SYSTEM USE CASE METHODOLOGY ____________________24
3.1 DIFFERENTIATE HIGH-LEVEL USE CASE AND SYSTEM USE CASE ______________________25
3.2 TOWARD SYSTEM USE CASE AND STANDARDIZATION ____________________________26
3.3 ROLE VERSUS ACTOR ___________________________________________________26
3.3.1 ROLE _____________________________________________________________26
3.3.2 ACTOR ____________________________________________________________27
3.4 REQUIREMENT ________________________________________________________28
3.4.1 FUNCTIONAL REQUIREMENT ____________________________________________28
3.4.2 NON-FUNCTIONAL REQUIREMENT ________________________________________28
3.5 SYSTEM USE CASE MODELING PROCESS ______________________________________28
3.5.1 IDENTIFY PRIMARY USE CASE FROM HIGH LEVEL USE CASE _______________________30
3.5.2 PRIMARY USE CASE ANALYSIS ____________________________________________31
3.5.3 IEC 62559-2 TEMPLATE OVERVIEW ________________________________________32
4. HIGH LEVEL USE CASES PRESENTATION _________________________________________34
4.1 PILOTS HLUC SELECTION AS INPUT OF THE SYSTEM USE CASE PRODUCTION PROCESS _____34

System use cases for smart buildings and grids
WP1
8 | 60
5. SYSTEM USE CASE IEC 62559 FORMALIZATION PROCESS _____________________________38
5.1 PROCESS STEPS _______________________________________________________38
5.2 SYSTEM USE CASE REVIEWS ______________________________________________39
6. INTERCONNECT - ALL PILOTS SYSTEM USE CASE SPECIFICATIONS _______________________40
7. IDENTIFIED COMMONALITIES AMONG HLUC & PUC FROM PILOTS ______________________41
7.1 APPROACH AND METHODOLOGY __________________________________________41
7.1.1 CHOICE OF HLUC COMMONALITIES OVER PUC COMMONALITIES ___________________41
7.1.2 DEFINITION OF NORMALIZED ROLES _______________________________________41
7.1.3 DEFINITION OF NORMALIZED OBJECTIVES ___________________________________42
7.1.4 DEFINITION OF NORMALIZED FUNCTIONS ___________________________________43
7.2 COMMONALITIES ANALYSIS RESULTS ________________________________________44
7.2.1 GLOBAL STUDY ______________________________________________________44
7.2.2 MAIN BENEFICIARIES __________________________________________________45
7.2.3 PER OBJECTIVE STUDY _________________________________________________47
7.3 CONCLUSION ON COMMONALITIES _________________________________________58
REFERENCES ______________________________________________________________60

System use cases for smart buildings and grids
WP1
9 | 60
LIST OF FIGURES
FIGURE 1 – T1.4 START POINT & END POINT ______________________________________ 16
FIGURE 2 - THE T1.4 METHOD & ITS PRODUCTIONS LEADING TO D1.3 ____________________ 17
FIGURE 3 : INNOVATION PROCESS _____________________________________________ 18
FIGURE 4: STEPS IN DESIGN THINKING METHODOLOGY ______________________________ 19
FIGURE 5 : MANIFEST ITALY PILOT _____________________________________________ 19
FIGURE 6 : PERSONA DESCRIPTION _____________________________________________ 20
FIGURE 7: ECO SYSTEM MAP OF NORDERSTEDT PILOT _______________________________ 20
FIGURE 8: SERVICE CONCEPT _________________________________________________ 21
FIGURE 9 : EPIC ___________________________________________________________ 21
FIGURE 10 : CUSTOMER / SOLUTION CENTRIC VIEW _________________________________ 22
FIGURE 11 : HIGH LEVEL USE CASE _____________________________________________ 23
FIGURE 12 : PRIMARY USE CASE _______________________________________________ 23
FIGURE 13 : T1.4 WORKFLOW WITHIN THE INTERCONNECT WORKFLOW __________________ 24
FIGURE 14 - ROLES & ACTORS INTERACTION MODEL ________________________________ 27
FIGURE 15 – IDENTIFY PRIMARY USE CASES FROM HIGH LEVEL USE CASES _________________ 29
FIGURE 16 - STEP BY STEP MODELING PROCESS WITH A NORMALIZED PRODUCTION _________ 30
FIGURE 17 - THE PRIMARY USE CASE ANALYSIS PROCESS _____________________________ 32
FIGURE 18 - OVERVIEW OF THE IEC 62559-2 TEMPLATE ______________________________ 33
FIGURE 19 - SYSTEM USE CASE IEC 62559 FORMALIZATION PROCESS STEPS ________________ 38
FIGURE 20 - POPULARITY OF EACH NORMALIZED OBJECTIVE (BY HLUC) ___________________ 44
FIGURE 21 - POPULARITY OF EACH NORMALIZED OBJECTIVE (BY PILOT) ___________________ 45
FIGURE 22 - MAIN BENEFICIARIES OF INTERCONNECT HLUCS __________________________ 46
FIGURE 23 - MAIN BENEFICIARIES OF INTERCONNECT PILOTS __________________________ 47
FIGURE 24 - ROLE PERCENTAGE OF APPEARANCE (PEAK SHAVING) ______________________ 48
FIGURE 25 - FUNCTION PERCENTAGE OF APPEARANCE (PEAK SHAVING) __________________ 48
FIGURE 26 - ROLE PERCENTAGE OF APPEARANCE (MAXIMIZE RES CONSUMPTION) ___________ 49
FIGURE 27 - FUNCTION PERCENTAGE OF APPEARANCE (MAXIMIZE RES CONSUMPTION) _______ 50
FIGURE 28 - ROLE PERCENTAGE OF APPEARANCE (PROVIDE FLEXIBILITY) __________________ 50
FIGURE 29 - FUNCTION PERCENTAGE OF APPEARANCE (PROVIDE FLEXIBILITY) ______________ 51

System use cases for smart buildings and grids
WP1
10 | 60
FIGURE 30 - ROLE PERCENTAGE OF APPEARANCE (FLEXIBLE TARIFFS) ____________________ 51
FIGURE 31 - FUNCTION PERCENTAGE OF APPEARANCE (FLEXIBLE TARIFFS)_________________ 52
FIGURE 32 - ROLE PERCENTAGE OF APPEARANCE (CONSUMER INVOLVEMENT) _____________ 53
FIGURE 33 - FUNCTION PERCENTAGE OF APPEARANCE (CONSUMER INVOLVEMENT) _________ 53
FIGURE 34 - ROLE PERCENTAGE OF APPEARANCE (MONITORING) _______________________ 54
FIGURE 35 - FUNCTION PERCENTAGE OF APPEARANCE (MONITORING) ___________________ 55
FIGURE 36 - ROLE PERCENTAGE OF APPEARANCE (CONSUMPTION FORECAST) ______________ 55
FIGURE 37 - FUNCTION PERCENTAGE OF APPEARANCE (CONSUMPTION FORECAST) __________ 56
FIGURE 38 - ROLE PERCENTAGE OF APPEARANCE (ENERGY COMMUNITY) _________________ 57
FIGURE 39 - FUNCTION PERCENTAGE OF APPEARANCE (CONSUMPTION FORECAST) __________ 57

System use cases for smart buildings and grids
WP1
11 | 60
LIST OF TABLES
TABLE 1 – HIGH-LEVEL USE CASE VERSUS SYSTEM USE CASE ....................................................... 25
TABLE 2 – LIST OF PILOT HLUC’S FROM D1.2 AND D1.3 DOCUMENT ............................................. 34
TABLE 3 - ANNEXES FOR PILOTS SYSTEM USE CASE SPECIFICATIONS............................................. 40
TABLE 4 – LIST OF OBJECTIVES FOR ROLES AND FUNCTIONS ........................................................ 58

System use cases for smart buildings and grids
WP1
12 | 60
ABBREVIATIONS AND ACRONYMS
Actor entity that communicates and interacts1
Business Use Case A Business Use Case details business processes organized to satisfy a business goal
BUC Business Use Case
Domain (SGAM) group of related subjects of standardization2
Functional
requirement
descriptions of what the system must do3
High Level Use Case Use case which describes a general requirement, idea or concept independently from
a specific technical realization like an architectural solution4
HLUC High Level Use Case
IoT Internet of Things
Non-functional
requirement
descriptions of what qualities the system must contain from an execution and
performance perspective5
Primary Use Case Use case which describes in detail the functionality of (e part of) a business process6
PUC Primary Use Case
Requirement provisions that convey criteria to be fulfilled7
Role type of actor which has responsibilities and represents the external intended
behaviour of a party8
SAREF Smart Applications REFerence (SAREF) ontology
Scenario possible sequence of interactions9
1 Source IEC/IS 62559-2
2 Source IEV 901-01-03
3 Source IEC PAS 62559 Edition 1, §7.2.6.2
4 SG-SC/M490/E, 2012-12, definition 3.4
5 Source IEC PAS 62559 Edition 1, §7.2.6.2
6 Source SG-CG/M490/E, 2012-12, definition 3.5
7 Source IEV 901-05-05
8 Source SG-CG/M490/C, 2012-12
9 Source SG-CG/M490/E, 2012-12, definition 3.10
System use cases for smart buildings and grids
WP1
13 | 60
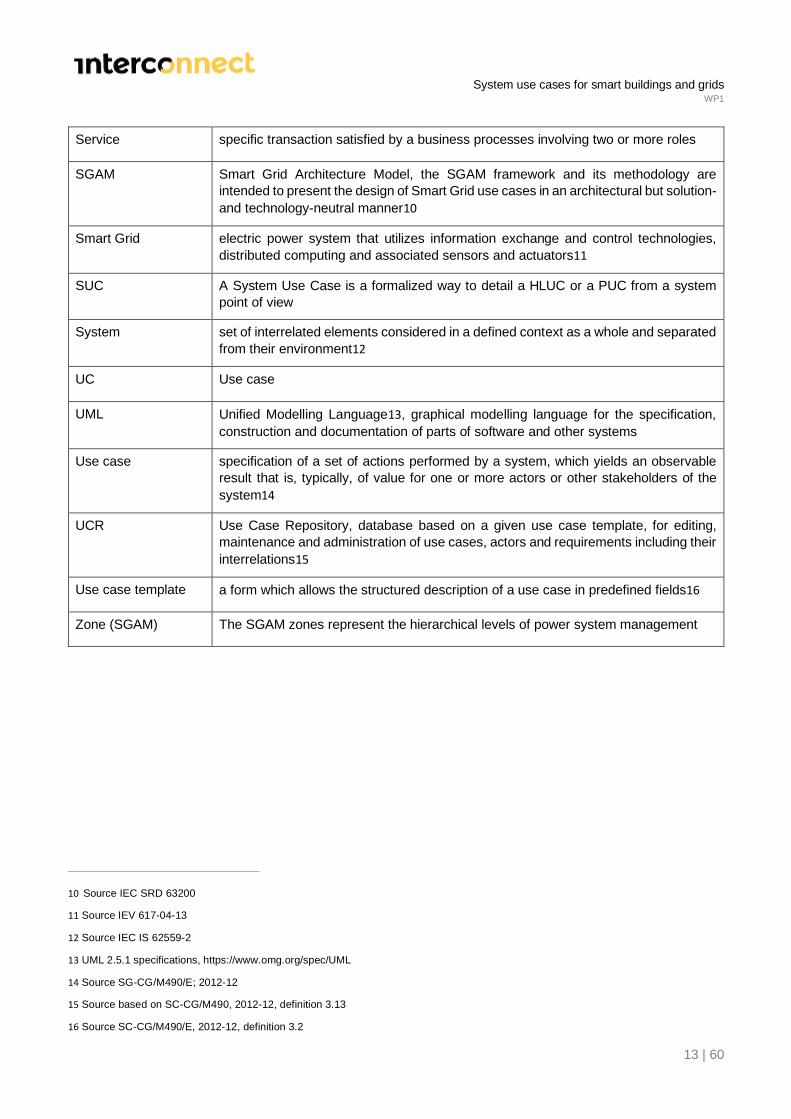
Service specific transaction satisfied by a business processes involving two or more roles
SGAM Smart Grid Architecture Model, the SGAM framework and its methodology are
intended to present the design of Smart Grid use cases in an architectural but solution-
and technology-neutral manner10
Smart Grid electric power system that utilizes information exchange and control technologies,
distributed computing and associated sensors and actuators11
SUC A System Use Case is a formalized way to detail a HLUC or a PUC from a system
point of view
System set of interrelated elements considered in a defined context as a whole and separated
from their environment12
UC Use case
UML Unified Modelling Language13, graphical modelling language for the specification,
construction and documentation of parts of software and other systems
Use case specification of a set of actions performed by a system, which yields an observable
result that is, typically, of value for one or more actors or other stakeholders of the
system14
UCR Use Case Repository, database based on a given use case template, for editing,
maintenance and administration of use cases, actors and requirements including their
interrelations15
Use case template a form which allows the structured description of a use case in predefined fields16
Zone (SGAM) The SGAM zones represent the hierarchical levels of power system management
10 Source IEC SRD 63200
11 Source IEV 617-04-13
12 Source IEC IS 62559-2
13 UML 2.5.1 specifications, https://www.omg.org/spec/UML
14 Source SG-CG/M490/E; 2012-12
15 Source based on SC-CG/M490, 2012-12, definition 3.13
16 Source SC-CG/M490/E, 2012-12, definition 3.2

System use cases for smart buildings and grids
WP1
14 | 60
1. INTRODUCTION
1.1 OVERALL INTRODUCTION
The Interconnect D1.3 deliverable mainly constitutes smart building and grid System Use
Case Specifications for the Interconnect’s pilots.
The D1.3 has a double goal of standardization and harmonization to transform High-Level
Use Cases to System Use Case standardized specifications and to provide standardized
representations of interoperable architectures. This double goal has been managed by the
Work Package 1, Task 1.4.
Non-harmonized High Level Use Cases were created by a previous Interconnect innovating
process dealing with Personas, Needs, Ideas, Epics and Service Concepts to provide a
selection of High-Level Use Cases that constitute the input of the Task 1.4.
A methodology has been built, based on existing standards such as IEC-62559 or IEC-
62913 and fundamental concepts such as roles, actors, functional and non-functional
requirements, to define a System Use Case Modeling Process that was used by the
Interconnect’s pilots to produce their Standardized System Use Case specifications.
The D1.3 also provides a Commonality study among all the Interconnect’s pilots.
Commonalities were identified during the System Use Case Specification review phase that
came next to the Use Case Modeling Process phase. Commonalities such as objectives
popularity, main beneficiaries, predominant roles, predominant functions and combinations
of those criteria’s have been highlighted.
1.2 OBJECTIVES FOR T1.4
The Interconnect grant agreement stated the task 1.4 with the following words:
System use cases writing of selected services
This task will conduct a general categorization, considering customer and grid-centric business cases, to group and classify
them, and therefore facilitate the development of clear rules of engagement/interaction between all parts of the
ecosystem. These rules will then be described in terms of SUC, with the corresponding functions and interactions. In this
way, common functionalities can be provided by the same SUC, contributing to prove the modularity and interoperability
not only at a lower ICT level but also, when possible, at the functional layer among the different pilots. Results will be
summarized to feed WP2, to derive the proper ontologies. Note that SUC identification is needed not only for the
implementations in WP3-7, but also for the addition of services through the cascade funding of WP8, making this rather
analytical task a very important task of the project.
The task 1.4 is subdivided into three sub-tasks:
• Subtask 1.4.1 Categorization: o The broad overview resulting from tasks 1.1 to 1.3 will be analyzed to find commonalities in the way of
interactions, the stakeholders engaged and their roles.
• Subtask 1.4.2 From human-centric business case to human-centric system use cases: o EEBUS will coordinate the work for human-centric use cases, departing from IEC TC62746-2 (“Use Cases and
Requirements”) and EN50631 (“Household Appliances Network and Grid Connectivity”), and various working
System use cases for smart buildings and grids
WP1
15 | 60
groups on white goods, HVAC, e-mobility with all relevant manufactures developing human-centric use cases.
• Subtask 1.4.3 From grid-centric business case to grid-centric system use cases: o TRIALOG will coordinate the detailed description of SUC following IEC 62559, which ensures a complete
compatibility with both normalization and EU work in a comprehensive manner. Specific KPIs will also be proposed for each SUC, re-using methodologies considered in other FP7 and H2020 projects
The objectives for T1.4 was quite clear concerning sub-tasks 1.4.2 and 1.4.3. However, the
sub-task 1.4.1 that should come first before the two other sub-tasks raised a crucial question:
How can we find commonalities among the use cases in terms of interactions without having
them detailed into system use cases.
This is why the sub-task 1.4.1 has been managed as the last sub-task considering that we will
be full of system details at the end of sub-tasks 1.4.2 and 1.4.3 and consequently more able
to treat the objectives of the 1.4.1 sub-task.
1.2.1 SYSTEM UC FOR BOTH BUILDING DOMAIN & GRID DOMAIN
Specifying Interconnect system use cases from high level use cases is a long run and requires
an unneglectable number of efforts from both building and grid stakeholders. Thus, it was
initially required to clarify first, what was the Start point and End point for the task, what was
its inputs and outputs and finally what the responsibilities of the stakeholders were.
The Interconnect D1.2 deliverable provided the task 1.4 with the inputs such as pilot’s selected
HLUCs and all details gathered without sufficient harmonisations. The outputs of the task 1.4
will provide System UC harmonized specifications which is the purpose of the deliverable 1.3,
this present document. Stakeholder’s responsibilities had to be defined as well with a common
agreement.
The Figure 1 depicts 1.4.1, 1.4.2 and 1.4.3 sub-tasks articulation forming as a whole the task
1.4.

System use cases for smart buildings and grids
WP1
16 | 60
FIGURE 1 – T1.4 START POINT & END POINT
As shown in Figure 1, the production of Interconnect System UC definitions is based on several
existing standards that will be further detailed:
• IEC-62559 – Use case methodology
• UML diagrams
• IEC-63200 – Smart Grid Architecture Model
The stakeholder’s responsibilities were stated as follow in a common agreement:
1. T1.4 leaders define and provide a method for the System UC definition process,
basically:
▪ Transform HLUCs to System UCs
▪ Create UML diagrams
▪ Create SGAM blueprints
2. T1.4 leaders approve and validate the method
3. T1.4 leaders provide the pilot leaders with the method
4. Each Pilot team follows the method to produce its own System UCs definition
▪ Each pilot leader is responsible of the content, the consistence and feasibility of
its pilot team production
5. T1.4 leaders provide supports on the methodology to the pilots during the step #4
6. T1.4 leaders manage pilot leaders to get their System UCs definition on time
7. T1.4 leaders prepare the D1.3 document structure and method inputs
System use cases for smart buildings and grids
WP1
17 | 60
8. Pilot leaders are responsible to fill out D1.3 respective § and the integration of all pilot’s
specifications
9. D1.3 is reviewed and validated by T1.4 leaders for delivery
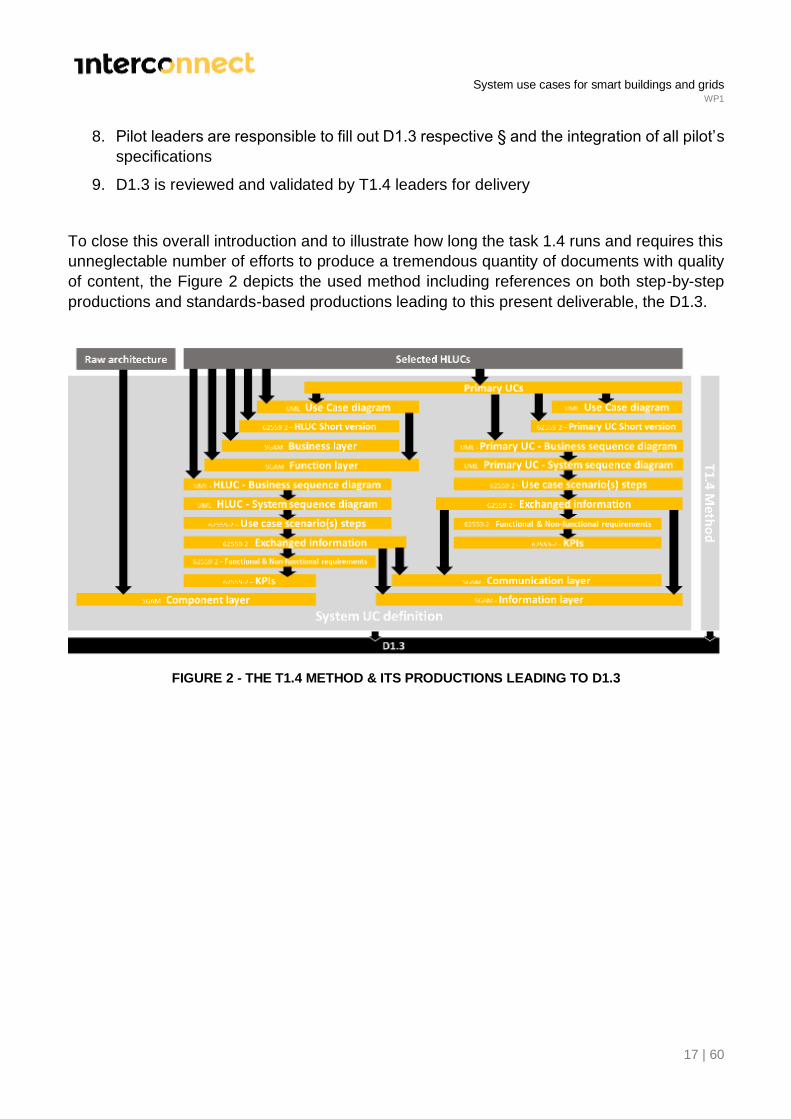
To close this overall introduction and to illustrate how long the task 1.4 runs and requires this
unneglectable number of efforts to produce a tremendous quantity of documents with quality
of content, the Figure 2 depicts the used method including references on both step-by-step
productions and standards-based productions leading to this present deliverable, the D1.3.
FIGURE 2 - THE T1.4 METHOD & ITS PRODUCTIONS LEADING TO D1.3

System use cases for smart buildings and grids
WP1
18 | 60
2. CONTEXT DESCRIPTION
2.1 REMIND PREVIOUS PROCESSES USED TO GET HLUCS,
PILOTS INVOLVED, D1.1 & D1.2 RESULTS
2.1.1 INNOVATION PROCESS OVERVIEW
Interconnects’ process is starting with the first innovative ideas and leads finally to systems
use case specification which define the services implemented in the pilots.
The following figure shows the agile innovation process.
FIGURE 3 : INNOVATION PROCESS
The 3 main elements of the process are the design thinking methodology, the translation of
design thinking results through High Level Use Cases and the translation of requirements into
technical system use case specifications.
A High-Level Use Case is the base for a Business Canvas to detail out the Business Case.
2.1.2 FOSTERING INNOVATION THROUGH DESIGN THINKING
METHODOLOGY
Design Thinking is a formal method for creative problem solving, with the intent of fostering
innovation. It is characterized by
System use cases for smart buildings and grids
WP1
19 | 60
1. the leverage of creativity as a driver of innovation,
2. a human centered perspective, where innovators build empathy with users
3. and an intense use of experimentation as a rapid and effective source of communication
and learning among stakeholders
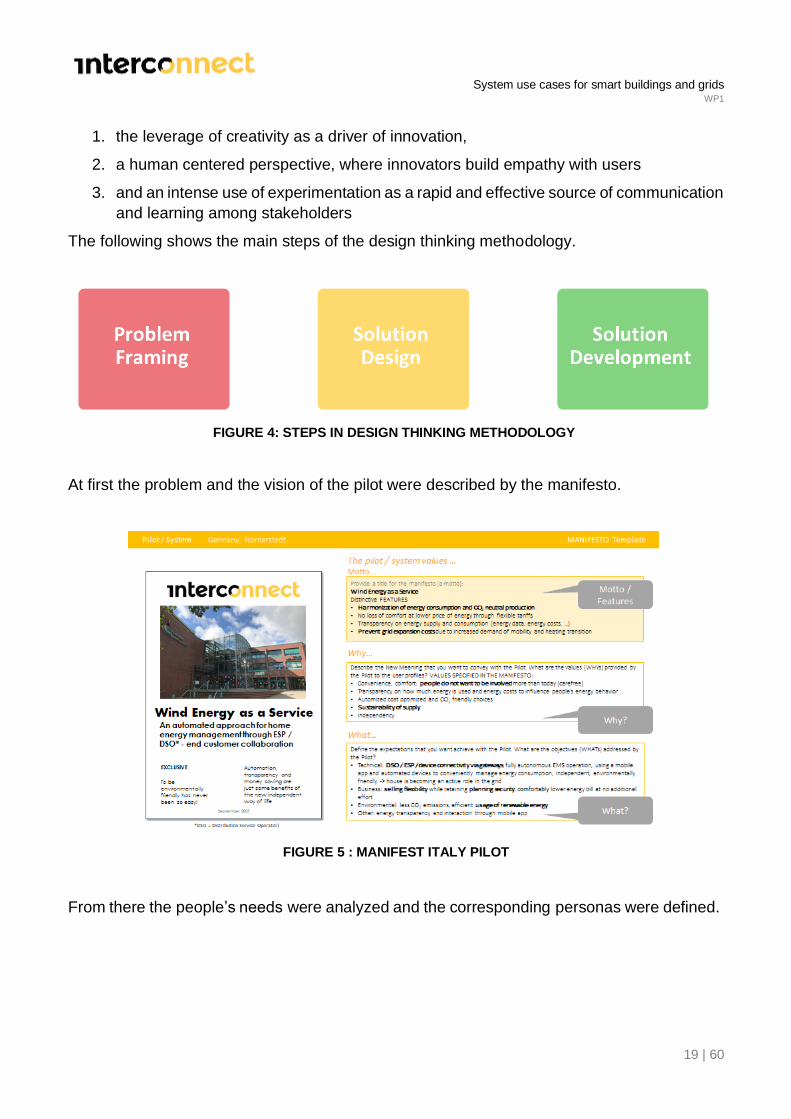
The following shows the main steps of the design thinking methodology.
FIGURE 4: STEPS IN DESIGN THINKING METHODOLOGY
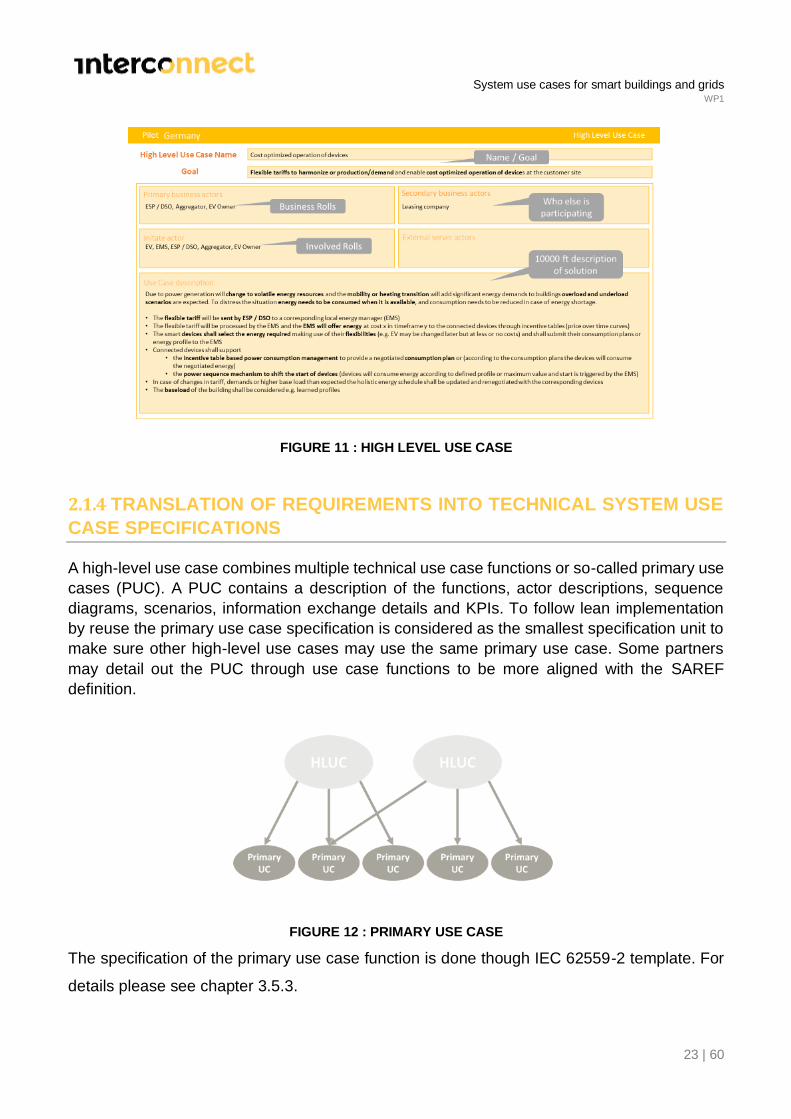
At first the problem and the vision of the pilot were described by the manifesto.
FIGURE 5 : MANIFEST ITALY PILOT
From there the people’s needs were analyzed and the corresponding personas were defined.

System use cases for smart buildings and grids
WP1
20 | 60
FIGURE 6 : PERSONA DESCRIPTION
In the next step the group was doing ideation to identify new values and discover solutions for
the personas defined.
The corresponding eco system map shows the stakeholders, data flows and functionalities.
This is an abstracted view what feature the pilot will implement and test.
FIGURE 7: ECO SYSTEM MAP OF NORDERSTEDT PILOT
In addition, a country analysis was performed to make sure all known legal items were
covered.

System use cases for smart buildings and grids
WP1
21 | 60
After selection of the most interesting solutions specific service ideas
which fulfill the user’ needs have been defined. The initial service ideas were translated into
service concepts describing the detailed customer journey.
FIGURE 8: SERVICE CONCEPT
The service concepts were detailed out through EPICs and user stories. All involved personas
were stating their needs specific values they will get. Though this the service concepts were
refined considering all aspects.
FIGURE 9 : EPIC

System use cases for smart buildings and grids
WP1
22 | 60
Several user stories were combined on the one hand in an EPIC to detail out the complete
service but may be used in different high-level use cases with describe a part of the solution.
The following figure shows the interrelationships.
FIGURE 10 : CUSTOMER / SOLUTION CENTRIC VIEW
On top of that a high-level business canvas has been created to point out the value of the
service, the invest, the market situation and revenue stream.
At this point the customer centric view was fully described and the process was changing to
solution centric.
2.1.3 TRANSLATION OF RESULTS THROUGH HIGH LEVEL USE CASES
The high-level use case was the first process step which described the solution what covers
all customers’ needs. The goal of the use case and all involved actors weather technical or
business were defined. The high-level use case description itself were explaining the features
and interaction of the actors at high level as is considered as the envelope of the technical use
case specifications named primary use cases.
A pilot is fully described by high-level use cases and primary use cases, based on which the
reference architecture design and device implementation can be started.
System use cases for smart buildings and grids
WP1
23 | 60
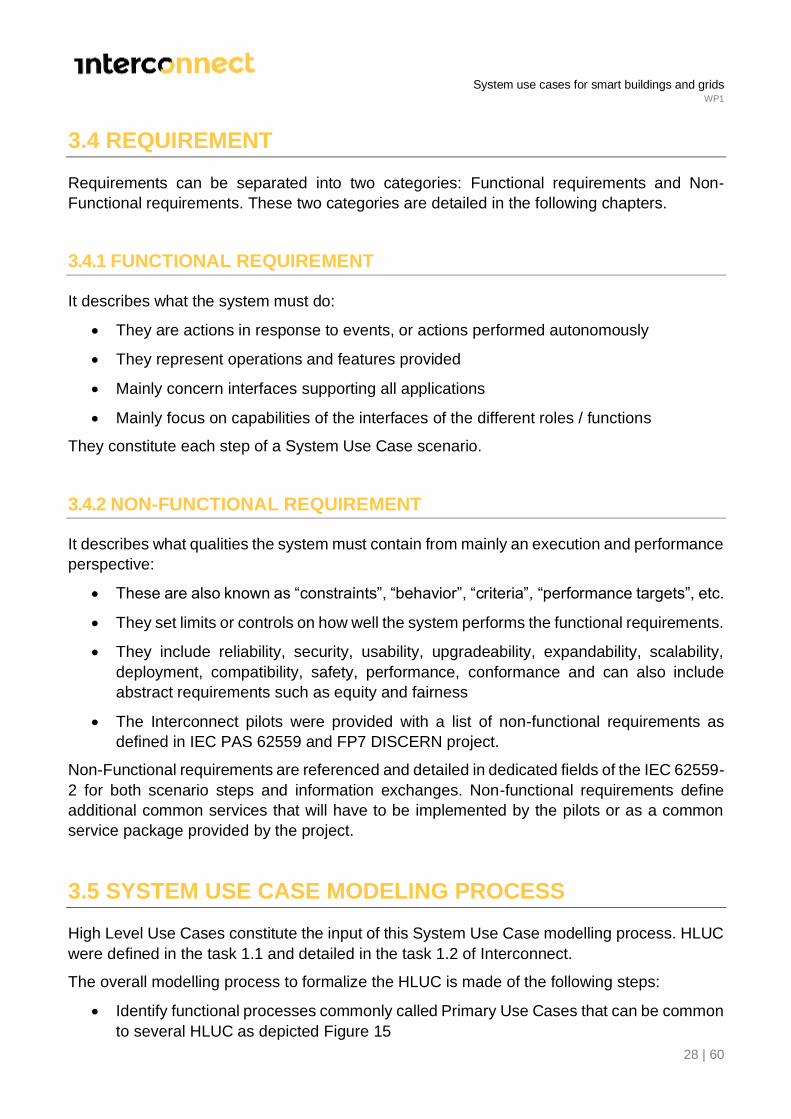
FIGURE 11 : HIGH LEVEL USE CASE
2.1.4 TRANSLATION OF REQUIREMENTS INTO TECHNICAL SYSTEM USE
CASE SPECIFICATIONS
A high-level use case combines multiple technical use case functions or so-called primary use
cases (PUC). A PUC contains a description of the functions, actor descriptions, sequence
diagrams, scenarios, information exchange details and KPIs. To follow lean implementation
by reuse the primary use case specification is considered as the smallest specification unit to
make sure other high-level use cases may use the same primary use case. Some partners
may detail out the PUC through use case functions to be more aligned with the SAREF
definition.
FIGURE 12 : PRIMARY USE CASE
The specification of the primary use case function is done though IEC 62559-2 template. For
details please see chapter 3.5.3.

System use cases for smart buildings and grids
WP1
24 | 60
3. FROM HIGH-LEVEL USE CASE TO SYSTEM USE
CASE METHODOLOGY
The Interconnect High-Level Use Cases to System Use Cases methodology aims to produce
harmonized System Use Cases for further standardisation work. It uses as inputs a common
approach from IEC 62913 and IEC 62559 to extract, from a high-level vision from pilots,
functional and non-functional system requirements. The IEC 62559-2 associated with UML
use case diagrams, UML sequence diagrams and SGAM blueprints provide a harmonization
of System Uses Cases specifications for all pilots within Interconnect.
The following figure shows how the High-Level Use Case to System Use Case Methodology
takes place into the InterConnect workflow.
FIGURE 13 : T1.4 WORKFLOW WITHIN THE INTERCONNECT WORKFLOW
It is first essential to achieve a consistent and homogeneous description of all preliminary
concepts used in this methodology such as:
• Differentiation between High-Level Use Cases and System Use Cases
• Standards used as a basement of this methodology
• Roles and Actors
• Requirements
• System Use Cases modelling process
All those concepts are detailed in the following chapters.

System use cases for smart buildings and grids
WP1
25 | 60
3.1 DIFFERENTIATE HIGH-LEVEL USE CASE AND SYSTEM
USE CASE
Specifying system requirements for both Smart Grid and Smart Cities is a really challenging
process that requires to manage many domains of expertise in a way of sharing ideas and
finally technical requirements. People with various background such as business, energy
systems, home automation or other IT specialists have to brainstorm in technical workshops
to define how the future system will be interconnected and will exchange information leading
to specifying the system functionalities, the system behaviour, its interfaces, its used protocols
and data models in a secure and privacy compliant manner.
In this context High-Level Use Cases and System Use Cases are defined as follow:
• High-Level Use Case (HLUC)
‒ It describes how roles interact to execute a high-level process
▪ These processes are derived from services which have previously been
identified
• System Use Case (SUC)
‒ It describes how System and/or Business Roles of a given system interact to
perform a function required to enable / facilitate the high-level processes
‒ Its purpose is to detail the execution of those processes from an Information
System perspective
As depicted in Table 1, HLUC and SUC are compared including the roles involved in both
types of use case.
TABLE 1 – HIGH-LEVEL USE CASE VERSUS SYSTEM USE CASE
High-Level UC System UC
Description Depicts a high-level process
Expected to be system agnostic
Depicts a function or sub-function
supporting one or several high-
level processes
Roles involved Business Roles
• Organizations
• Organizational entities
• Physical persons
Business Roles and System Roles
• Same as Business roles
• Devices
• Information System
The roles involved are considered
as actors

System use cases for smart buildings and grids
WP1
26 | 60
3.2 TOWARD SYSTEM USE CASE AND STANDARDIZATION
The Interconnect High-Level Use Case to System Use Case methodology is based on several
standards that have been used to specify functional and non-functional requirements into
System Use Cases.
The IEC 62913-1 provides guideline and a Use Case methodology to define generic smart
grid requirements, the IEC 62559-2 provides Use Case definition template recommendations
from the European Smart Grids Task Force which is a group of experts for 'Standards and
Interoperability for Smart Grids Deployment’ (EG1) and towards Interoperability within the EU
for Electricity and Gas Data Access & Exchange.
Special add-ons for Interconnect have been added to provide harmonized graphical views into
the System Use Cases specifications including UML use case diagrams, UML sequence
diagrams and SGAM layers.
Even though the Smart Grid Architecture Model is dedicated to the grid domain, it has been
used to produce harmonized pilot architecture blueprints providing the interoperability
viewpoint that you cannot get with conventional disparate architecture drawings.
Lists of standardized roles and non-functional requirements were also provided to the pilots to
get harmonized items identification along the specification process.
3.3 ROLE VERSUS ACTOR
Roles are mostly used to define High-Level Use cases. Since use cases become more and
more detailed during the High-Level Use Case to System Use Case specification process,
roles are replaced by the actors playing the roles.
An important step in the System Use Cases specification process is to properly identify the
roles involved in the High-Level Use Cases and to map with the corresponding actors that will
play the roles in the future system implementation. Thus, lists of roles and actors are created
by the pilots and if a role doesn’t exist as a standard reference, it is created as a new identified
role.
The difference between roles and actors is detailed just below.
3.3.1 ROLE
Roles may be defined as “an intended behavior of a business party”. In other words, a business
party, when carrying out a business transaction, takes on a certain role. A Role is associated
with responsibilities.
Within a given system, a Role is a type of actor which has responsibilities for a Business Role.
It is also a type of actor which has functionalities for a System Role such as information
systems and devices.
The Figure 14 bellow depicts the interactions between Parties, Roles, Actors and
responsibilities.

System use cases for smart buildings and grids
WP1
27 | 60
FIGURE 14 - ROLES & ACTORS INTERACTION MODEL
Roles relating Grids is a regulated domain and references were provided to the pilots:
• HARMONISED ELECTRICITY MARKET ROLE MODEL
o https://eepublicdownloads.azureedge.net/clean-
documents/EDI/Library/HRM/Harmonised_Role_Model_2020-01.pdf
• Roles from USEF
o https://www.usef.energy/app/uploads/2016/12/USEF_TheFrameworkExplained
-18nov15.pdf
Roles relating Human/Home are not already regulated and IOT work groups start to define
them.
3.3.2 ACTOR
Actors are entities that communicate or interact with a given system.
Roles involved in a High-Level Use Case are business roles such as organizations,
organizational entities which are functional entities of an organization (company department,
project teams, etc.) and physical persons.
Actors involved in a System Use Case include business roles and system roles such as
devices and Information System.
An actor may also play multiple roles.
Interconnect pilots were provided with a list of actors that was extracted from the DISCERN
H2020 project and a mapping between roles and actors were also provided from the SG-
CG/M490/E - Part E: Smart Grid Use Case Management Process.
System use cases for smart buildings and grids
WP1
28 | 60
3.4 REQUIREMENT
Requirements can be separated into two categories: Functional requirements and Non-
Functional requirements. These two categories are detailed in the following chapters.
3.4.1 FUNCTIONAL REQUIREMENT
It describes what the system must do:
• They are actions in response to events, or actions performed autonomously
• They represent operations and features provided
• Mainly concern interfaces supporting all applications
• Mainly focus on capabilities of the interfaces of the different roles / functions
They constitute each step of a System Use Case scenario.
3.4.2 NON-FUNCTIONAL REQUIREMENT
It describes what qualities the system must contain from mainly an execution and performance
perspective:
• These are also known as “constraints”, “behavior”, “criteria”, “performance targets”, etc.
• They set limits or controls on how well the system performs the functional requirements.
• They include reliability, security, usability, upgradeability, expandability, scalability,
deployment, compatibility, safety, performance, conformance and can also include
abstract requirements such as equity and fairness
• The Interconnect pilots were provided with a list of non-functional requirements as
defined in IEC PAS 62559 and FP7 DISCERN project.
Non-Functional requirements are referenced and detailed in dedicated fields of the IEC 62559-
2 for both scenario steps and information exchanges. Non-functional requirements define
additional common services that will have to be implemented by the pilots or as a common
service package provided by the project.
3.5 SYSTEM USE CASE MODELING PROCESS
High Level Use Cases constitute the input of this System Use Case modelling process. HLUC
were defined in the task 1.1 and detailed in the task 1.2 of Interconnect.
The overall modelling process to formalize the HLUC is made of the following steps:
• Identify functional processes commonly called Primary Use Cases that can be common
to several HLUC as depicted Figure 15

System use cases for smart buildings and grids
WP1
29 | 60
• Create UML Use Case Diagram (relations between HLUC, Primary UCs & Roles)
• Use IEC 62559-2 for HLUC formal description
• Draw SGAM Business layer
• Draw SGAM Function layer
FIGURE 15 – IDENTIFY PRIMARY USE CASES FROM HIGH LEVEL USE CASES
The overall modelling process to formalize the Primary Use Cases is made of the following
steps:
• Describe functional processes including “elemental” functions which are functional
requirements
• Use IEC 62559-2 for System Use Case formal description
• Draw SGAM Component layer
• Draw SGAM Communication layer
• Draw SGAM Information layer
The Figure 16 depicts the entire process showing the normalized documents production
following standards on those the Interconnect High-Level Use Case to System Use Case
methodology is based on. All produced specifications will constitute the inputs for WP2, WP3
and WP4.

System use cases for smart buildings and grids
WP1
30 | 60
FIGURE 16 - STEP BY STEP MODELING PROCESS WITH A NORMALIZED PRODUCTION
3.5.1 IDENTIFY PRIMARY USE CASE FROM HIGH LEVEL USE CASE
Identifying Primary Use Cases (PUC) from High Level Use Cases (HLUC) is a fundamental
step of the entire process. It consists of identifying the functional processes that will be used
to answer a high-level objective. In this step all relevant professional backgrounds including
business backgrounds, energy system backgrounds, home automation profile backgrounds,
IT specialist backgrounds, Security and Privacy specialist profile backgrounds have to
brainstorm in technical workshops to identify which functional solutions will be used and
interconnected to answer to the High-Level Use Cases requirements. The workshops are
organized by the pilot leaders for pilot team brainstorming. To do so, making the difference
between High Level Use Case and Primary Use Case ecosystem is also fundamental and can
be detailed as follow:
• A HLUC provides a high-level process answer to a business goal
‒ Involved actors are mainly roles
‒ High-level requirements are identified
‒ It describes a high-level process often related to a service
‒ A HLUC will be depicted in the SGAM business layer

System use cases for smart buildings and grids
WP1
31 | 60
• A PUC provides a functional process answer to satisfy a part of the high-level
process, functions and sub-functions are used
‒ Involved actors are systems, other functions, human operators, etc.
‒ Requirements for a field implementation of the solution are identified, they
describe a function, or a sub-function related to a part of the business or high-
level process
‒ A Primary Use Case will be depicted in the SGAM function layer
Once all PUCs of a HLUC have been identified a Primary Use Case Analysis is required.
3.5.2 PRIMARY USE CASE ANALYSIS
A Primary Use Case Analysis provides for each PUC the ability to translate a high-level
process function into a System Primary Use Case Specification.
The PUC is developed first as a system sequence diagram with involvement of all relevant
pilot partners. According to the objectives of the PUC, the system sequence diagram will detail
the interactions between the actors involved in each action constituting the functions such as
requests / responses. For each function, the information exchanged will be provided but limited
to a high level of detail.
The System Sequence Diagram is then translated into an IEC 62559-2 System Use Case
template by detailing each function into scenario steps. Depending on the way the PUC will
be staged by the HLUC multiple scenarios can be required. Each step of a scenario will provide
one action or exchange between actors, the exchanged information will be detailed, and
potentially additional non-functional requirements will be added at the scenario step level
and/or at the information detail level.
The System Use Case will then be provided with additional activity such as error treatments
or alternative processing and the IEC 62559-2 PUC will be refined till reaching a sufficient level
of detail and satisfaction.
The Figure 17 depicts the Primary Use Case Analysis process.

System use cases for smart buildings and grids
WP1
32 | 60
FIGURE 17 - THE PRIMARY USE CASE ANALYSIS PROCESS
3.5.3 IEC 62559-2 TEMPLATE OVERVIEW
The IEC 62559-2 template is depicted Figure 18.
This document is a Microsoft Word format document that provide a way to dispatch each Use
Case specified information into dedicated chapters and tables in a formatted manner.

System use cases for smart buildings and grids
WP1
33 | 60
FIGURE 18 - OVERVIEW OF THE IEC 62559-2 TEMPLATE
In a double goal of standardisation and harmonisation, for Interconnect, additional information
was added such as:
• a UML Use Case Diagrams providing a standardized viewpoint of the PUCs articulation
for a HLUC,
• a UML Sequence Diagrams providing a standardized graphical viewpoint of the UC’s
scenarios,
• a SGAM Business layer providing a standardized viewpoint of a business detailed in a
HLUC,
• a SGAM Function layer providing a standardized viewpoint of the main functions or
PUCs identified in a HLUC,
• a SGAM Communication layer providing a standardized viewpoint of the
communication protocols used in a PUC,
• a SGAM Information layer providing a standardized viewpoint of the data models used
in a PUC and,
• a SGAM Component layer providing a standardized viewpoint of the components of the
system architecture. This layer was used as a layout for the other layers that are
mapped on it.

System use cases for smart buildings and grids
WP1
34 | 60
4. HIGH LEVEL USE CASES PRESENTATION
4.1 PILOTS HLUC SELECTION AS INPUT OF THE SYSTEM
USE CASE PRODUCTION PROCESS
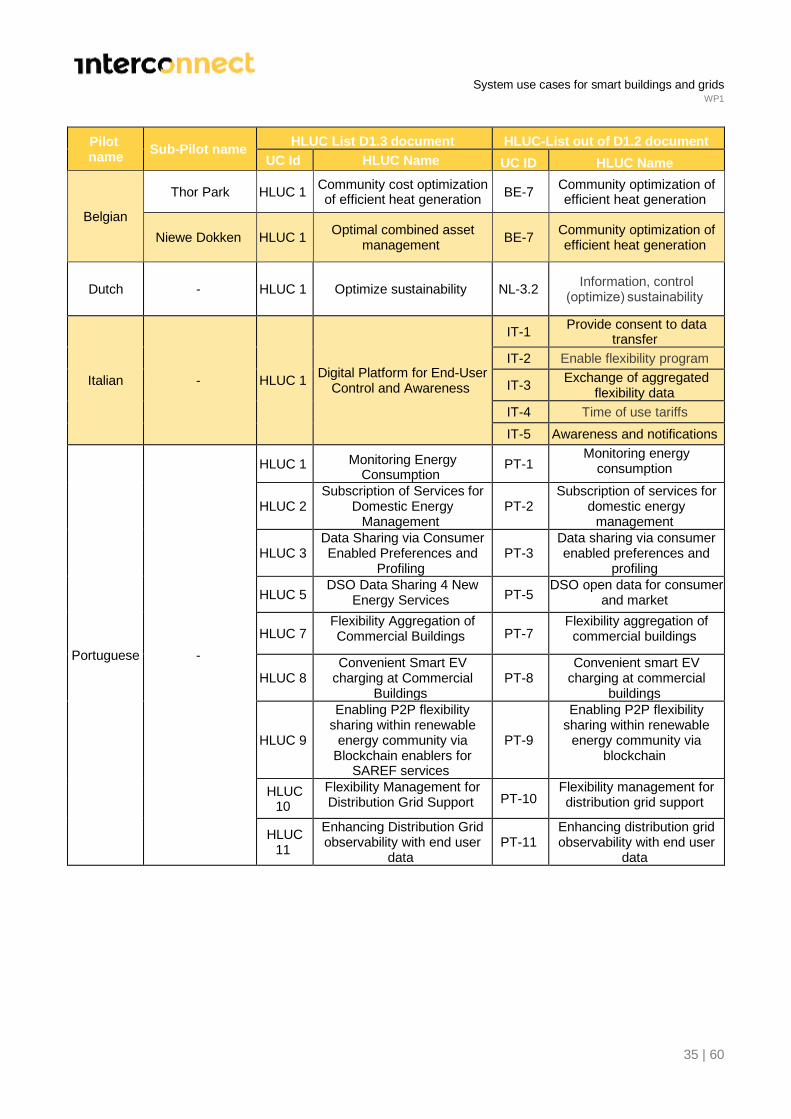
During the T1.4 HLUC and PUC definition process for the pilots of the Interconnect project, all partners of the WP1 team have continued to work on the design of the pilot objectives, realisations and solutions. Therefore, some pilots have updated their HLUCs definitions from D1.2 document which are now described in the D1.3 document. The table below compares the HLUCs of the pilots from the D1.2 and D1.3 document:
TABLE 2 – LIST OF PILOT HLUC’S FROM D1.2 AND D1.3 DOCUMENT
Pilot name
Sub-Pilot name HLUC List D1.3 document HLUC-List out of D1.2 document
UC Id HLUC Name UC ID HLUC Name
Belgian
Cordium HLUC1 Community cost
optimization
BE-7 Community optimization of efficient heat generation
BE-8 Peak shaving via direct control of heat pump
Genk ThermoVault HLUC 1
Peak shaving and self-consumption by optimizing
household boilers at community and household
level
BE-11 Smartifying my local energy
community
Green Energy Park Zellik
HLUC 1 Energy community based on
P2P energy trading BE-12
Energy flexibility service for spot prices electricity tariffs
Imec HLUC 1 Gamification of use of common appliances
BE-3 “Gamification” of the use of
common appliances
Nanogrid
HLUC 1 "Connectionless"
maximization of flexibility in Energy Community
BE-2
Aggregation of energy in local energy community
through local controller with focus on grid interaction
HLUC 2 Voluntary (non-) participation
in Energy Community BE-1
Voluntary (non-) participation in energy
community
HLUC 3 Peer to peer exchange
between (virtual) Energy Community
new
Oud Heverlee HLUC 1 Community Energy
Management BE-11
Smartifying my local energy community
System use cases for smart buildings and grids
WP1
35 | 60
Pilot name
Sub-Pilot name HLUC List D1.3 document HLUC-List out of D1.2 document
UC Id HLUC Name UC ID HLUC Name
Belgian
Thor Park HLUC 1 Community cost optimization of efficient heat generation
BE-7 Community optimization of efficient heat generation
Niewe Dokken HLUC 1 Optimal combined asset
management BE-7
Community optimization of efficient heat generation
Dutch - HLUC 1 Optimize sustainability NL-3.2 Information, control
(optimize) sustainability
Italian - HLUC 1 Digital Platform for End-User
Control and Awareness
IT-1 Provide consent to data
transfer
IT-2 Enable flexibility program
IT-3 Exchange of aggregated
flexibility data
IT-4 Time of use tariffs
IT-5 Awareness and notifications
Portuguese -
HLUC 1 Monitoring Energy Consumption
PT-1 Monitoring energy
consumption
HLUC 2 Subscription of Services for
Domestic Energy Management
PT-2 Subscription of services for
domestic energy management
HLUC 3 Data Sharing via Consumer Enabled Preferences and
Profiling PT-3
Data sharing via consumer enabled preferences and
profiling
HLUC 5 DSO Data Sharing 4 New
Energy Services PT-5 DSO open data for consumer
and market
HLUC 7 Flexibility Aggregation of Commercial Buildings PT-7
Flexibility aggregation of commercial buildings
HLUC 8 Convenient Smart EV
charging at Commercial Buildings
PT-8 Convenient smart EV
charging at commercial buildings
HLUC 9
Enabling P2P flexibility sharing within renewable
energy community via Blockchain enablers for
SAREF services
PT-9
Enabling P2P flexibility sharing within renewable
energy community via blockchain
HLUC 10
Flexibility Management for Distribution Grid Support PT-10
Flexibility management for distribution grid support
HLUC 11
Enhancing Distribution Grid observability with end user
data PT-11
Enhancing distribution grid observability with end user
data

System use cases for smart buildings and grids
WP1
36 | 60
Pilot name
Sub-Pilot name HLUC List D1.3 document HLUC-List out of D1.2 document
UC Id HLUC Name UC ID HLUC Name
Greek -
HLUC 1 Energy Monitoring &
Management GR-1
Energy monitoring and management
HLUC 2 Home Comfort GR-2 Home comfort
HLUC 3 Flexibility Provision GR-3 Flexibility provision
HLUC 4 Data Analytics Services GR-4 Data analytics
HLUC 5 Security Services GR-5 Security
HLUC 6 Increase CO2 savings and
become eco-friendly GR-6 Increase CO2 savings and
become eco-friendly
HLUC 7 User Engagement GR-7 User engagement
HLUC 8 Unified User Interface
Application GR-8
Unified user interface application
HLUC 9 Appliances Energy Efficiency
GR-9 Appliances’ energy
efficiency
French -
HLUC 1 Max RES
FR-2 Maximize use of local RES
HLUC 2 Dynamic tariff
FR-1 Dynamic tariff & usage
management
German -
HULC 1
Maximize utilization of renewable -wind- energy @grid connection point (general generation)
GE-1
Maximize utilization of renewable -wind- energy at
grid connection point
HULC 2
Maximize utilization of DER energy consumption in
premises (local generation by myself)
GE-2
Maximize utilization of DER energy consumption in
premises
HULC 3
Grid stability via power limitation at grid connection GE-3
Grid stability via power limitation at grid connection
HULC 4 Maximize flexible energy consumption in premises GE-4
Maximize flexible energy consumption in premises
HULC 5
Provide dashboard to inform user about status and
stimulate to use opportunities GE-5
Provide dashboard to inform user about status and
stimulate to use opportunities
From the table you can see which HLUCs from Belgium are assigned to the different sub-pilots and which planned HLUC was changed between the collection of pilot information for the D1.2 and D1.3 document. For example, in the Belgian sub-pilot Nanogrid , a new HLUCs was defined and other Belgium pilots have combined similar HLUCs into one HLUC. But Thor Park reduce 6 HLUCs from D1.2 document to only one HLUC now.

System use cases for smart buildings and grids
WP1
37 | 60
In Belgium pilots the HLUCs from D1.2 document BE-04: Manage peak load to avoid increases in the electricity invoice (peak shaving), BE-05: Building level services: RES self-consumption à reduce electricity invoice, BE-06: Building level services: EV smart charging pricing for flexibility use, BE-09: Increase RES for self-consumption, BE-10: Community Car sharing , and in the Netherland pilot the HLUC NL-1.1: Devices that can be controlled to free up time are now not needed anymore and were not described in detail with the IEC 62559-2 template. Through the characterisation of the pilots and the adaptation of the goals towards the possibilities of the architecture the HLUCs and PUCs have been adapted. This leads to an overall goal to realize 37 HLUCs and 130 PUCs and is considered as the input to the other working packages to enable the specified features for the pilots. All future HLUC or PUC definitions will not be considered in the systems architecture. As stated in D1.2 document the harmonization of similar use cases into one common use case was not followed up in order not to slow down innovation. This was mostly driven by the partners and agreed with the project lead.

System use cases for smart buildings and grids
WP1
38 | 60
5. SYSTEM USE CASE IEC 62559 FORMALIZATION
PROCESS
5.1 PROCESS STEPS
The System Use Case IEC 62559 formalisation process took place between month 9 to month
18 of the Interconnect project. It is based on the High-Level Use Case to System Use Case
Methodology presented in chapter 3.
The process got a kind of “industrial project management” with tasks divided into sub-tasks,
milestones, deadlines, follow-ups and reviews.
The methodology was presented to the pilot leaders and their team at the beginning of the
process. It got approvals and enthusiasms from the partners and the provided tasks/sub-tasks
timeline was clear and welcome.
Support sessions were provided to the pilot partners all along the process to illustrate by
multiple examples and trainings the methodology and its process to produce the requested
information on time. The process steps of this organisation are provided in Figure 19Figure 19
to illustrate the duty the Interconnect partners went through to produce their IEC 62559
formalized System Use Cases.
FIGURE 19 - SYSTEM USE CASE IEC 62559 FORMALIZATION PROCESS STEPS

System use cases for smart buildings and grids
WP1
39 | 60
5.2 SYSTEM USE CASE REVIEWS
Before the final System Use Case pilot’s delivery two consecutive reviews were leaded with
more than a month between both.
The aim of the first review was to evaluate the level of production of each pilot versus the
expected production level targeted by the methodology, the support session, the trainings and
the T1.4 management team. This review was mainly a compliance review versus the IEC
62559, UML diagrams and the SGAM layers.
The aim of the second review was to measure the rework done by the pilots next to the first
review to check the production corrections and improvements. Recommendations, additional
targeted supports and close follow-ups were provided by the T1.4 management team between
both reviews to reach 100% harmonized production for all pilots.

System use cases for smart buildings and grids
WP1
40 | 60
6. INTERCONNECT - ALL PILOTS SYSTEM USE
CASE SPECIFICATIONS
Since the production of the System Use Case Specifications from all Interconnect Pilots
represent a very large amount of information, each pilot is provided with a separate dedicated
annex file.
The annexes are organized as shown in Table 3.
TABLE 3 - ANNEXES FOR PILOTS SYSTEM USE CASE SPECIFICATIONS
Pilot System Use Case Specification document
Belgian InterConnect - D1.3 - System use cases for smart buildings and grids -
Annex 1 - Belgian Pilot - V1.0.3
Dutch InterConnect - D1.3 - System use cases for smart buildings and grids -
Annex 2 - Dutch Pilot - V1.0.3
Italian InterConnect - D1.3 - System use cases for smart buildings and grids -
Annex 3 - Italian Pilot - V1.0.3
Portuguese InterConnect - D1.3 - System use cases for smart buildings and grids -
Annex 4 - Portuguese Pilot - V1.0.4
Greek InterConnect - D1.3 - System use cases for smart buildings and grids -
Annex 5 - Greek Pilot - V1.0.5
French InterConnect - D1.3 - System use cases for smart buildings and grids -
Annex 6 - French Pilot - V1.0.4
German InterConnect - D1.3 - System use cases for smart buildings and grids -
Annex 7 - German Pilot - V1.0.4

System use cases for smart buildings and grids
WP1
41 | 60
7. IDENTIFIED COMMONALITIES AMONG HLUC &
PUC FROM PILOTS
This chapter presents the results of the analysis we performed on HLUC System Specification
documents collected. This was done in order to find commonalities between pilots. The
analysis was done purely on quantitative terms. We based our analysis on the intentions
explicitly declared in the use-cases documents by each pilot, without going into the details of
their solutions.
7.1 APPROACH AND METHODOLOGY
7.1.1 CHOICE OF HLUC COMMONALITIES OVER PUC COMMONALITIES
During the assessment process of commonalities, it appeared that commonalities are mostly
relevant for HLUCs. Indeed, the HLUCs focus on generic areas, objectives and roles, without
going into the details of a specific system, as it is done in the PUCs. Therefore, analysing the
HLUCs makes more sense in order to assess the objectives, roles or function that are common
throughout the pilots, and between various systems. Moreover, the roles in particular have
been normalised in the HLUCs, enabling to clearly show the commonalities of roles, while the
PUCs actors use denominations that are specific to a particular component or company.
Additionally, HLUCs are described at the scale of the whole system of the pilot, while PUCs
generally represent a subsystem, or a specific function, making it more difficult to show the
common features of the overall system.
Therefore, only HLUCs will be analysed in the following chapter. Out of all 37 HLUCs defined
by pilots, 36 were included in this study (the Niewe Dokken pilot was not considered because
its HLUC was provided after the calculation of statistics).
7.1.2 DEFINITION OF NORMALIZED ROLES
In order to find commonalities between pilots, normalized roles representing every unique role
from every pilot are needed. Those roles are defined in the 62559 documents provided by the
pilots (chapter 3.1. Actors).
As mentioned earlier, references regarding roles were provided to the pilots:
• Harmonized Electricity Market Role Model
o https://eepublicdownloads.azureedge.net/clean-
documents/EDI/Library/HRM/Harmonised_Role_Model_2020-01.pdf
• Roles from USEF
o https://www.usef.energy/app/uploads/2016/12/USEF_TheFrameworkExplained
-18nov15.pdf

System use cases for smart buildings and grids
WP1
42 | 60
As a result, most pilots were already aligned in their definition of each roles used in the use-
case. And so, the normalization process consisted of regrouping the few roles not aligned with
the references into pre-existing roles. The following list was defined:
• DPO
• Aggregator
• EMS
• User
• Energy service provider
• Energy trader market
• Information aggregator
• Electricity supplier
• Forecaster
• Devices
• System operator
• Monitoring system
• Smart meter
• Interoperability layer
• Graphical user interface
• DER
• IoT network (home)
• Metering Data Management System
• External Service Provider
• External Information Provider
• APP – GUI
• Building owner/operator
7.1.3 DEFINITION OF NORMALIZED OBJECTIVES
In order to find commonalities between pilots, normalized objectives representing every unique
objective from every pilot are needed. Those objectives are described in the 62559 documents
provided by the pilots (chapter 1.3 Scope and objective of use case).
The normalization process consisted of regrouping similar and popular objectives into
uniformed objectives. The following list was defined:
• Peak Shaving
• Minimize Invoice
• Maximize RES consumption
• Provide Flexibility
• Optimization of consumption
• Flexible Tariffs
• Consumer Involvement (Gamification, Recommendations, User Interface,
Visualization, empowerment, …)

System use cases for smart buildings and grids
WP1
43 | 60
• Energy Community
• Monitoring (of consumption, devices, …)
• Manual mode (user control through GUI)
• Automated mode for appliance (Rules-based device management)
• Consumption Prediction
7.1.4 DEFINITION OF NORMALIZED FUNCTIONS
In order to find commonalities between pilots, normalized functions representing every unique
function from every pilot are needed. Those functions were extracted from the scenarios
described in the 62559 documents provided by the pilots (chapter 4. Step by step analysis of
use case).
Functions, which can be defined as solutions implemented in order to achieve the scenario’s
objective, were extracted and then regrouped into uniformed function covering every pilot’s
needs. The following list was defined:
• EV charging
• User preferences
• Enrolment
• Forecast (production, consumption)
• Optimization (consumption, flexibility, Building level, district level)
• Monitoring
• EMS operation
• Flexible Tariffs
• Manual mode (appliances)
• Automated mode (appliances)
• Data Storage in Cloud
• User interface (gamification)
• Alerting (security, notifications)
• Overload protection
Note that some functions can be similar to some objectives. This is because objectives can be
functions aiming to achieve other objectives. For example, establishing a system that provide
reliable consumption forecast is an objective in itself, but it can also be a mean to achieve
peak shaving.

System use cases for smart buildings and grids
WP1
44 | 60
7.2 COMMONALITIES ANALYSIS RESULTS
7.2.1 GLOBAL STUDY
This section concerns statistics that were calculated using data from all considered pilot
without selection.
7.2.1.1 POPULARITY OF EACH NORMALIZED OBJECTIVES
The popularity of each normalized objectives was calculated in order to identify the issues
most often considered by pilots. The calculation was done by simply counting the number of
occurrences of each objective among all 36 HLUC.
FIGURE 20 - POPULARITY OF EACH NORMALIZED OBJECTIVE (BY HLUC)
The diagram above shows that among all pilots, Peak Shaving, Maximization of RES
consumption and Consumer Involvement are primary concerns that all appears in more than
12 HLUCs. Flexible Tariffs and Monitoring of the Smart Home are secondary objectives that
each appear in 9 HLUCs. Other objectives are more specific.
However, these first statistics are biased by the fact that the different pilots have very different
numbers of HLUCs, which results in the over-representation of the objectives of a few pilots.
In order to mitigate this issue, the following graph have been drawn, in which the objective of
each pilot is counted once. It shows the same tendencies as in the previous one, though more
equally distributed.

System use cases for smart buildings and grids
WP1
45 | 60
FIGURE 21 - POPULARITY OF EACH NORMALIZED OBJECTIVE (BY PILOT)
Here we can see this new distribution, apart from the Energy Community objective, the number
of occurrences of all objectives dropped. This is because some pilots have different HLUCs
with objectives that fall into the same category. For example, the Portuguese pilot has 2
HLUCs aiming for Peak shaving, one specific for commercial building and one for grid support.
The most popular objectives among pilots are Peak Shaving, Maximization of RES
Consumption and Flexible Tariffs, which seems more important here with 8 out of 13 pilots
focusing on it. On the other hand, consumer involvement seems less important here with only
5 pilots making it an objective. Other than that, the general trend stays the same, but
differences have been flatten.
7.2.2 MAIN BENEFICIARIES
The study of the main beneficiaries is an important matter, as it shows what is driving the
actions. However, it is a delicate line to be drawn, since all actors are in some way beneficiaries
from the UCs they are involved in. Here, the main beneficiaries have been considered to be
the actors to whom the main objectives of the UC are addressed.
The main beneficiaries have been established by comparing the objectives and the actors
involved, in order to answer the question: “Whom, among the present actors, is this objective
addressed to?”.
Based on this selection, the statistics have been calculated by counting in how many HLUCs
a specific actor is beneficiary. This enables to highlight the drivers of the Interconnect business
model.
The diagram below shows the repartition of the main beneficiaries across the 36 HLUCs of
the Interconnect project.

System use cases for smart buildings and grids
WP1
46 | 60
FIGURE 22 - MAIN BENEFICIARIES OF INTERCONNECT HLUCS
The diagram above shows that the first beneficiary of the Interconnect activities is indeed the
consumer, with 32 out of the 36 HLUCs benefiting them. Indeed, it is a role that is present in
all HLUCs and can benefit from the activities in several ways: through secure energy supply,
reduction of invoices, customer empowerment or additional services (house security for
instance). Additionally, the prosumers and energy communities are also very present as
beneficiaries across the HLUCs (respectively 15 and 8 HLUCs). The prosumers benefit from
maximisation of RES, while the energy communities mostly benefit from peer-to-peer, district
heating optimisation and reduction of Hydrocarbon-base energy schemes.
On the other hand, industrial actors also highly benefit from the activities of Interconnect. The
DSO is the second beneficiary, with 21 out of 36 HLUCs addressed to it. They benefit from
various activities, from load management such as peak shaving, flexible tariffs or power
limitation to power quality and monitoring. Moreover, the Aggregator is also a major
beneficiary, with 12 HLUC having flexibility provision, optimisation or demand response as
objectives.
However, these first statistics are indeed biased by the fact that the different pilots have very
different numbers of HLUCs, which results in the over-representation of the vision of little
number of pilots. In order to mitigate this issue, the following graph have been drawn, in which
the beneficiaries of each pilot is counted once. It shows the same tendencies as in the previous
one, though more equally distributed.

System use cases for smart buildings and grids
WP1
47 | 60
FIGURE 23 - Main beneficiaries of Interconnect pilots
Obviously, both representations show a very simplified vision of the very complex mechanisms
leading to the various benefits of the Interconnect schemes, however it aims to help highlight
the most preeminent roles in this ecosystem.
7.2.3 PER OBJECTIVE STUDY
This section concerns statistics that were calculated by isolating HLUC according to the
objective they were aiming for. For example, every use-case aiming to maximize RES
consumption was isolated in order to calculate specific statistics for this objective.
For each objective, we calculated the percentage of appearance of each normalized role in
order to identify which roles were the biggest contributor to this objective. We also calculated
the percentage of appearance of each normalized function in order to identify which solutions
were most often developed in order to achieve this objective.

System use cases for smart buildings and grids
WP1
48 | 60
7.2.3.1 OBJECTIVE: PEAK SHAVING
FIGURE 24 - ROLE PERCENTAGE OF APPEARANCE (PEAK SHAVING)
In the diagram above, the user and its Devices are the two roles that most often appear in
HLUCs aiming to achieve Peak Shaving. This is explained by the necessity of participation
from these two roles to Peak Shaving programs. Next in line are the EMS which coordinates
devices for Peak shaving, the Aggregator and the Energy Service Providers, which are the
roles benefitting from the Peak Shaving.
FIGURE 25 - FUNCTION PERCENTAGE OF APPEARANCE (PEAK SHAVING)

System use cases for smart buildings and grids
WP1
49 | 60
As expected, Flexible tariffs is the primary solution for Peak Shaving in the diagram above.
Monitoring, Forecast, Consumption Optimization and EMS Operation are also important
aspects of the system. Lastly, User Preferences are taken into account in 30% of cases.
7.2.3.2 OBJECTIVE: MAXIMIZE RES CONSUMPTION
FIGURE 26 - ROLE PERCENTAGE OF APPEARANCE (MAXIMIZE RES CONSUMPTION)
The repartition of roles is similar to the Peak Shaving objective in the diagram above. The User
is however the most solicited role.

System use cases for smart buildings and grids
WP1
50 | 60
FIGURE 27 - FUNCTION PERCENTAGE OF APPEARANCE (MAXIMIZE RES CONSUMPTION)
Flexible Tariffs and Optimization are the two most considered functions for this objective in
the diagram above. User Preferences also play a large part in 40% of HLUCs. Despite the
fact that most roles are common with the Peak Shaving objective, the distributions of
function largely differ.
7.2.3.3 OBJECTIVE: PROVIDE FLEXIBILITY
FIGURE 28 - ROLE PERCENTAGE OF APPEARANCE (PROVIDE FLEXIBILITY)

System use cases for smart buildings and grids
WP1
51 | 60
The distribution of roles in the diagram above is similar to the Peak Shaving and Maximize
RES Consumption objectives with the EMS, the User, the Energy Provider and the Devices
being the primary roles concerned.
FIGURE 29 - FUNCTION PERCENTAGE OF APPEARANCE (PROVIDE FLEXIBILITY)
The diagram above shows that Flexibility Provision is mainly achieved through Flexible Tariffs,
Optimization of consumption and production while the Monitoring of the system and the EMS
operations coordinate operations and prevent problems. Despite the fact that most roles are
common with the Peak Shaving and Maximize RES Consumption objectives, the distributions
of function differ.
7.2.3.4 OBJECTIVE: FLEXIBLE TARIFFS
FIGURE 30 - ROLE PERCENTAGE OF APPEARANCE (FLEXIBLE TARIFFS)

System use cases for smart buildings and grids
WP1
52 | 60
The diagram above shows that the roles most important to a Flexible Tariffs system are the
Energy Service Provider, the User, its EMS and devices and the Electricity Supplier.
FIGURE 31 - FUNCTION PERCENTAGE OF APPEARANCE (FLEXIBLE TARIFFS)
Here the function Flexible Tariffs has been excluded from the study. As explained in chapter
8.1.4, some objectives are similar to functions. This is the case here and considering Flexible
Tariffs as an enabler for Flexible Tariffs is redundant. The graph above shows that a Flexible
Tariffs system is mainly made possible by the forecast and the monitoring of the grid and
devices functions. HLUC aiming for Flexible Tariffs also define how that tariff is used, hence
the large proportion of Optimization appearance.

System use cases for smart buildings and grids
WP1
53 | 60
7.2.3.5 OBJECTIVE: CONSUMER INVOLVEMENT
FIGURE 32 - ROLE PERCENTAGE OF APPEARANCE (CONSUMER INVOLVEMENT)
The consumer involvement programs mainly rely on the Smart Meter, the Energy Service
Provider and the User himself in the diagram above. The EMS and the devices are also taken
into account in 40% of all HLUC.
FIGURE 33 - FUNCTION PERCENTAGE OF APPEARANCE (CONSUMER INVOLVEMENT)

System use cases for smart buildings and grids
WP1
54 | 60
The customer is involved with its EMS operations which take into account its User
Preferences, especially for the use of the Flexible Tariffs in the diagram above. The
involvement of the customer is encouraged by the User Interface.
7.2.3.6 OBJECTIVE: MONITORING
FIGURE 34 - ROLE PERCENTAGE OF APPEARANCE (MONITORING)
The graph above shows that the monitoring of the home relies mostly on the Smart meter, the
User, the EMS, the Energy Service Provider and the Devices, as they are the most present
roles.

System use cases for smart buildings and grids
WP1
55 | 60
FIGURE 35 - FUNCTION PERCENTAGE OF APPEARANCE (MONITORING)
Here, the Monitoring function has been excluded from the study (for similarity purposes, as
explained in chapter 8.2.2.4).
The function that is most often used is Automated Mode for appliances in the diagram above.
This function enables to automatically operate a device, for instance by an EMS or by a rules-
based system. This makes sense since the appliances are controlled according to the
preferences of the customer and the state of the grid.
7.2.3.7 OBJECTIVE: CONSUMPTION FORECAST
FIGURE 36 - ROLE PERCENTAGE OF APPEARANCE (CONSUMPTION FORECAST)

System use cases for smart buildings and grids
WP1
56 | 60
The Forecast is either done by the Energy service provider, an external Forecaster or the EMS
in the diagram above. The data for the forecast comes from the User through its Smart Meter,
depending on the pilot system.
FIGURE 37 - FUNCTION PERCENTAGE OF APPEARANCE (CONSUMPTION FORECAST)
Here, the Forecast function has been excluded from the study (for similarity purposes, as
explained in chapter 8.2.2.4).
The diagram above shows that the Forecast is in most cases used for the generation of
Flexible Tariffs and the Optimization of consumption.

System use cases for smart buildings and grids
WP1
57 | 60
7.2.3.8 OBJECTIVE: ENERGY COMMUNITY
FIGURE 38 - ROLE PERCENTAGE OF APPEARANCE (ENERGY COMMUNITY)
The Energy Communities largely involve the Users, and the Aggregator in the diagram above.
Other main contributors are the DER, the Devices, EMSs, Electricity Suppliers and
Forecasters.
FIGURE 39 - FUNCTION PERCENTAGE OF APPEARANCE (CONSUMPTION FORECAST)

System use cases for smart buildings and grids
WP1
58 | 60
The diagram above shows that the Energy Communities have a large use of user preferences
and EMS operation functions. Peer-to-peer is also present in larger proportion than usual,
along with Forecasting and Optimization.
7.3 CONCLUSION ON COMMONALITIES
The study of commonalities enabled to highlight the most predominant roles, beneficiaries,
objectives and functions, that were found in different pilots across the project. In order to do
so, the previously described HLUCs of each pilot were analysed and these elements were
extracted, in an effort to harmonize the denominations. However, even though the names of
functions were harmonized, the implementation of the different functions can’t be harmonized,
because it heavily depends on the components used and the partners involved, who each
have their own implementation approaches. Through this process, a few interesting points
were highlighted:
• The consumer is at the centre of the attention. It is a role that is present in almost all
UCs, and several objectives are dedicated to him. The grid actors, such as DOS,
aggregator or energy services providers are also very present through the project.
• The main objectives, throughout the project, were peak shaving, and maximizing the
use of renewable energy sources. These are grid-centric issues and show that the
optimized operation of the grid is a central issue. Moreover, the predominance of peak-
shaving over other issues such as consumption goes to show that the consumption of
peak periods is one the biggest challenges faced today by the electricity grid.
• A few functions were found to be important for all objectives, such as monitoring, EMS
operation, user preferences, optimization or forecast. It shows that they are core
building blocks of the Interconnect systems of any pilot, which are important for any
smart grid system at consumer premises.
Here is a list of the main role and function for each normalized objective. It shows the driver
and core functionality for each of these building blocks.
TABLE 4 – LIST OF OBJECTIVES FOR ROLES AND FUNCTIONS
OBJECTIVE Most present role Most present function
PEAK SHAVING EMS Monitoring / Flexible Tariffs
MAXIMIZE RES CONSUMPTION User Flexible Tariffs
PROVIDE FLEXIBILITY EMS / User / Energy Service
Provider
Flexible Tariffs
TIME OF USE TARIFFS Energy Service Provider Optimization / Monitoring
CONSUMER INVOLVEMENT Smart Meter EMS Operations
MONITORING User / Smart Meter Automated mode for appliances

System use cases for smart buildings and grids
WP1
59 | 60
CONSUMPTION FORECAST Energy Service Provider / Smart
Meter
Optimization / Flexible Tariffs
ENERGY COMMUNITY User User Preferences / EMS
Operation
System use cases for smart buildings and grids
WP1
60 | 60
REFERENCES
External documents
[1] CEN-CENELEC-ETSI Smart Grid Coordination Group – Sustainable Processes, November 2012
[2] IEC TS 62913-1 ED1 Generic Smart Grid Requirements – Part 1: Specific application of the Use Case methodology for
defining Generic Smart Grid Requirements according to the IEC System approach, April 2018
[3] European Smart Grids Task Force Expert Group 1 – Standards and Interoperability – Towards Interoperability within the
EU for Electricity and Gas Data Access & Exchange, March 2019
[4] IEC 62559-2 Use case methodology – Part 2: Definition of the templates for use cases, actor list and requirements list,
April 2015
[5] SG-CG/M490/E - Part E: Smart Grid Use Case Management Process,
https://ec.europa.eu/energy/sites/ener/files/documents/xpert_group1_sustainable_processes.pdf
Interconnect documents
[1] InterConnect Grant Agreement number 857237
[2] D1.2 Mapping between use cases and large-scale pilots – V1.1
[3] InterConnect - D1.3 - System use cases for smart buildings and grids - Annex 1 - Belgian Pilot - V1.0.3
[4] InterConnect - D1.3 - System use cases for smart buildings and grids - Annex 2 - Dutch Pilot - V1.0.3
[5] InterConnect - D1.3 - System use cases for smart buildings and grids - Annex 3 - Italian Pilot - V1.0.3
[6] InterConnect - D1.3 - System use cases for smart buildings and grids - Annex 4 - Portuguese Pilot - V1.0.4
[7] InterConnect - D1.3 - System use cases for smart buildings and grids - Annex 5 - Greek Pilot - V1.0.5
[8] InterConnect - D1.3 - System use cases for smart buildings and grids - Annex 6 - French Pilot - V1.0.4
[9] InterConnect - D1.3 - System use cases for smart buildings and grids - Annex 7 - German Pilot - V1.0.4