wr supplement
TRANSCRIPT

8/13/2019 Wr Supplement
http://slidepdf.com/reader/full/wr-supplement 1/9
1
WaveRider Supplement
In this supplement I want to explain to you what you need to know to better understand the weekly
report, and to be able to trade better. The basis of Delta is necessary and prevents a lot of
misunderstanding.
In the mid-'80s technical analyst Wellis Wilder wrote the book The Delta Phenomenon. The so-called
Delta system originated with Jim Slogan. This system unravels a hidden order in every exchange rate,
in which the same order exists continuously. Markets repeat themselves time and again in an
interaction between the sun, the moon, and the earth.
Delta is a technique which is actually based on astrology. The book about Delta entiled The Delta
Phenomenon can be downloaded and read via the following link, and I really advise you to read it:
http://www.ganntrader.org/WWdelta.pdf
The various cycles used by Delta are derived from the lunar cycle and other astrological cycles. The
moon is very important, and influences, for instance, tides and people. A human being consists of
75% water, and the moon's gravity affects this. Planet movement, positions and relationshipsbetween the planets influence the whole, man as well as animal.
Most people who trade are fixated on price, and barely, if at all, take into account the most
important factor: time. In Delta everything revolves around time.
WD Gann said in the beginning of this century that time is much more important than price. A
statement I completely agree with. No analyst can predict each movement well. Gann was not
always correct either, but he was more exact with time (turnaround data) than with price
calculations. Trading and good money management are just as important as a good analysis. Plenty
of good books are available on these subjects
8/13/2019 Wr Supplement
http://slidepdf.com/reader/full/wr-supplement 2/9
2
CyclesIn WaveRider we work with the following Delta cycles, and for ease of comprehension we have color-
coded them:
ITD = Intermediate Term Delta
MTD = Medium Term Delta
MLTD = Medium Long Term Delta. (This isnot described in The Delta Phenomenon; it is situated
exactly between the MTD and LTD, and I have added it.)
LTD = Long Term Delta
SLTD = Super Long Term Delta (It is very occasionally included in WaveRider; in priciple it is not.)
If, for instance, a cycle has 11 high and low turning points, as, for example, in the ITD cycle in gold,
we speak of 11 delta points.
A cycle always has a fixed number of points. Gold has 11 ITD punten, for instance, but the S&P500
has 12. The number of points differs per index/commodity and per cycle.
Inversion
An inversion may occur in some cycles. An inversion occurs more often in the ITD and MTD than in
the higher cycles. In the MLTD an inversion may happen, but then it is usually a double inversion. Inthe LTD inversion is rare, and in the SLTD there is no inversion at all.
An inversion occurs due to a division in time between the planet cycles. In the ITD and MTD cycles
this is because they are based on the moon. One lunar year differs from an earth year by 11 days.
An inversion adds 1 or 2 points. If in the S&P500 an inversion takes place in the ITD, an extra 12
points are added. With a double inversion we add an extra 12 delta points plus one more delta point.
These are enclosed in parentheses in the forecast.
Because of an inversion, the prognosticated highs/lows may flip over, although as far as turnaround
dates are concerned, the calculated delta points (fortunately) should come out right. Trading after
the last delta point and up to the second delta point in a new cycle is always riskier.
An inversion always comes during the transition of the last delta point to the first delta point. You
can read more about this in The Delta Phenomenon.
Delta points provide a guide to the direction of the market.
8/13/2019 Wr Supplement
http://slidepdf.com/reader/full/wr-supplement 3/9
3
Applied rules and counting
- In WaveRider I have optimized the count somewhat with regard to the original count as described
in the book. The following rules are noteworthy:
- There are higher/lower highs and lows within a high cycle, whereby at most 3 higher/lower highs
may exist. Exception is made when an inversion occurs—then there may be 4. (For this reason the
MLTD cycle, among others, has been added to maintain this rule in every cycle.)
-The inversion period always contains one extra end number and possibly also an extra 1. These extranumbers are enclosed by parentheses.
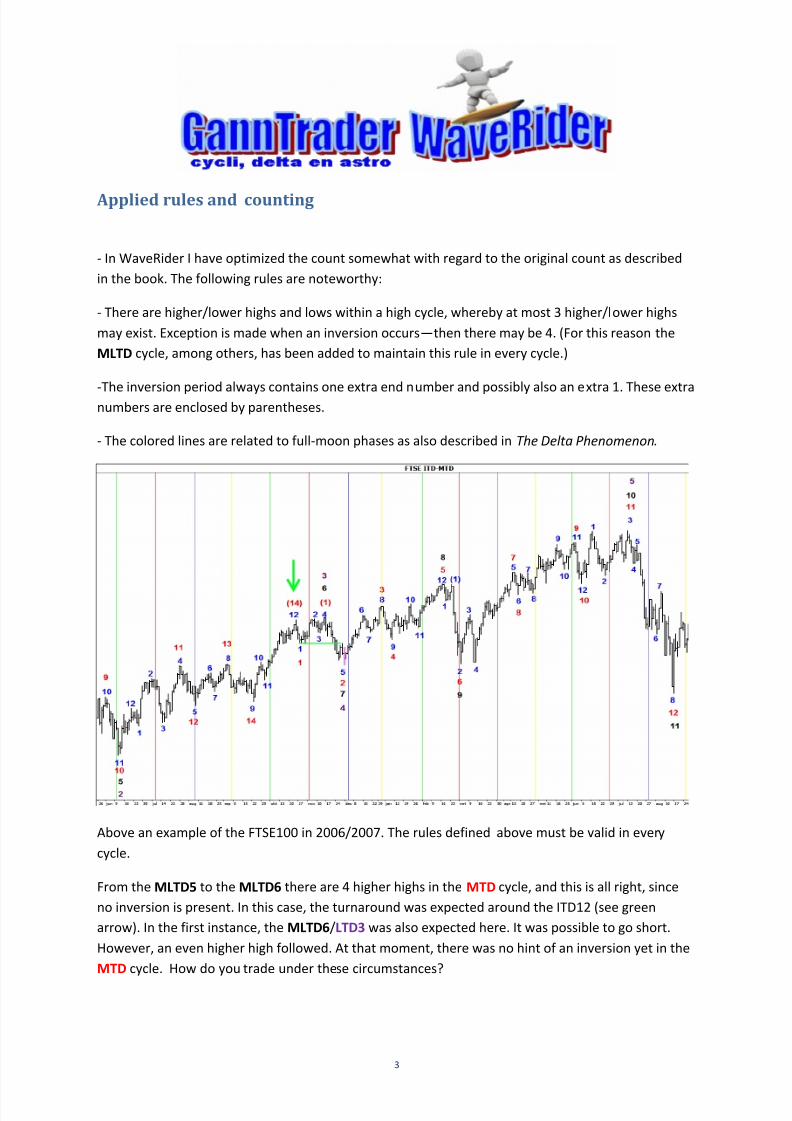
- The colored lines are related to full-moon phases as also described in The Delta Phenomenon.
Above an example of the FTSE100 in 2006/2007. The rules defined above must be valid in every
cycle.
From the MLTD5 to the MLTD6 there are 4 higher highs in the MTD cycle, and this is all right, since
no inversion is present. In this case, the turnaround was expected around the ITD12 (see green
arrow). In the first instance, the MLTD6/LTD3 was also expected here. It was possible to go short.
However, an even higher high followed. At that moment, there was no hint of an inversion yet in the
MTD cycle. How do you trade under these circumstances?
8/13/2019 Wr Supplement
http://slidepdf.com/reader/full/wr-supplement 4/9
4
Around the green arrows it was in any event possible to go short. But keep to a generous stop-loss
(with a somewhat lower lever). And if the unexpected happens anyway and an even higher high
comes up, we will yet have to sit out an MTD high. As soon as the MTD high is set (here the MTD(1)
together with the MLTD6) we can ascertain the double inversion in the MTD cycle. As soon as the
exchange rate comes under the MTD1 (green horizontal line)—not until then is the MTD(1) high
definitely set together with the MLTD high.
The deviation
The average deviation ( in calendar days) in the calculated dates as per Delta is:
ITD MTD MLTD LTDINDEXES 4,5 10,8 23,4 48,6
GOLD 4,2 11,2 26,4 61,8
WHEAT 4,5 11,7 35,9 61,6
SOYBEANS 3,6 10,3 19,9 51,5
The larger the cycle, the greater the deviation.
The delta points are often moved a little afterward by the average deviation, and by the delta rules
that always have to tally. This may have consequences for the forecast in the short or long term,
depending on the rule that is broken, and the cycle it relates to.
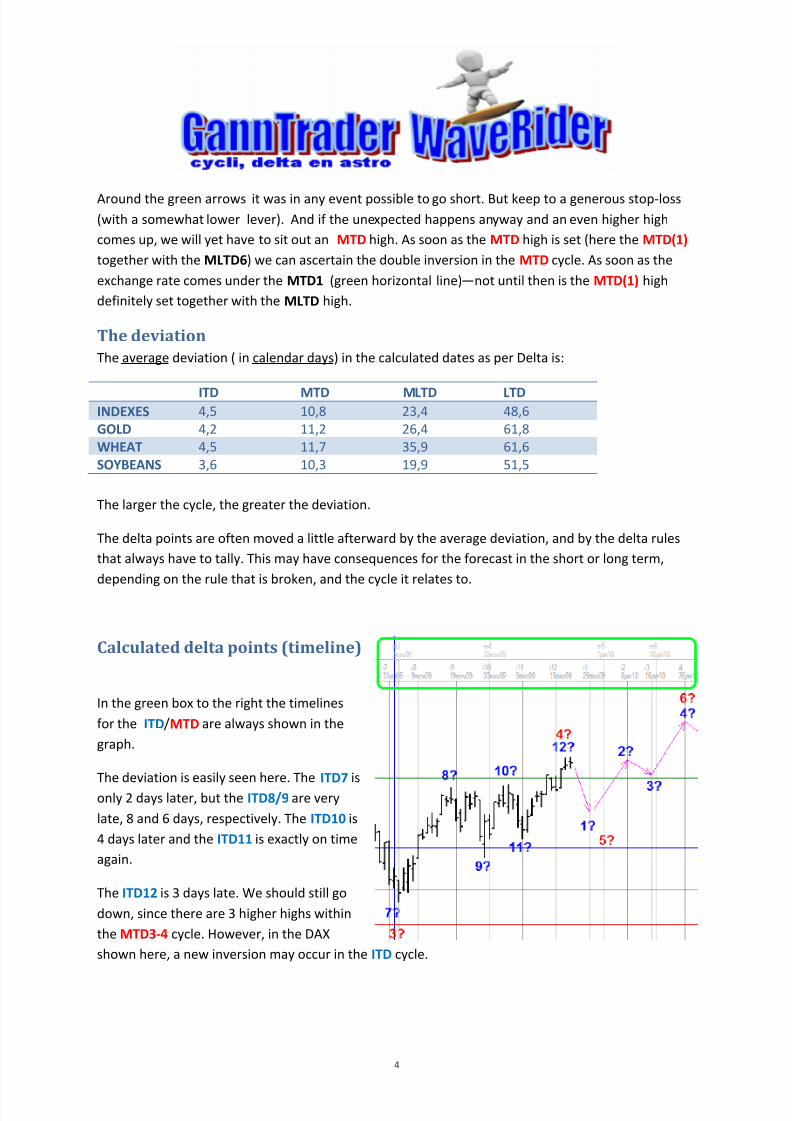
Calculated delta points (timeline)
In the green box to the right the timelines
for the ITD/MTD are always shown in the
graph.
The deviation is easily seen here. The ITD7 is
only 2 days later, but the ITD8/9 are very
late, 8 and 6 days, respectively. The ITD10 is
4 days later and the ITD11 is exactly on time
again.
The ITD12 is 3 days late. We should still go
down, since there are 3 higher highs within
the MTD3-4 cycle. However, in the DAX
shown here, a new inversion may occur in the ITD cycle.
8/13/2019 Wr Supplement
http://slidepdf.com/reader/full/wr-supplement 5/9
5
The direction, in any case,is upward toward a higher MLTD high (not shown). In this case it is better
to wait till a correction has taken place in the direction of the ITD1, and then get in high with a long
toward the red 6. More later about how to trade.
As stated earlier, I discourage trading when a possible inversion is imminent, and recommend trading
not until after number 2 has been placed. Nevertheless, the more speculative investor may make a
profit in this period, as long as good money management is practiced.
An inversion or double inversion can never be ascertained till after the fact, so that the count has to
be adjusted afterward.
In WaveRider we establish the turning points for the short and the long term by the cycles in
combination with astrology. We don't look at prices. The purple arrows indicate the expected
direction. The expected higher and lower highs/lows are important. You may not see at what
exchange level the arrows end—this is just an indication.
Sometimes the fibonacci levels are represented in the forecast, which serve as a goal or as
resistance. They are shown with horizontal colored lines, and on the right in the graph is the price
and the retracement. These are meant to be merely informative, and they are sometimes referred to
in the text.
I value fibonacci because the fibonacci sequence influences nearly everything in life, including the
movement of planets, the structure of plants, animals, and the human body. Now and then we also
look at the time aspects of fibonacci. In WaveRider we sometimes look at the 60/90/120 relationship
of other cycles, such as the 102 cycle.
Delta points are normally in the calculated place, and an arrow indicates where the turning point is
expected in time. At times the turning point is expected earlier and at times later. As soon as the
actual high/low is known, it is moved to the high/low. Occasionally this point may still be moved, if it
turns out later that a higher/lower high/low still follows. We know this as soon as the delta rules in
the lower cycles are broken.
Rules of experience:
o When a higher cycle is aimed upward, the delta highs usually come a bit later and the lows a
little earlier than calculated. When a higher cycle is down, the delta lows usually come a little
later, and the highs a little sooner than calculated.
Example: The following MLTD point is lower. MTD points usually make lows in the direction
of this lower MLTD point that come a little later than calculated, and highs that come sooner
than expected. When the following MTD point is higher, the ITD highs usually come a little
later and the lows a little earlier.

8/13/2019 Wr Supplement
http://slidepdf.com/reader/full/wr-supplement 6/9
6
o Whenever a delta point is higher than a previous delta point (this goes for every cycle), a
delta low point is placed in a higher cycle (the reverse is also true).
o In the MLTD inversion is rare, and if it occurs at all, it is usually a double inversion.
o No inversions occur in the LTD.
o Remember that greater movement often occurs around delta point 1.
In the table of deviations, we see an average of 4 calendar days' deviation in the ITD cycle. For
convenience, assume a deviation of +/- 3 trading days. This must be taken into account in trading.
It is clear that the indicated path will be more reliable in the short term than in the long term,
because there is less deviation in a smaller cycle
Prognoses are therefore adjusted when they no longer satisfy the delta rules. This goes for every
cycle. Adjustments in the larger cycles have greater impact, of course, and effect greater change in
the long term.
A man must remember that the trend of markets change and he must change when the trend
changes. He must learn the rules that have worked in the past and apply them in the market in the
future in order to make a success.
WD Gann
Having to adjust the calculation afterward is therefore necessary to satisfy the delta rules and to be
able to determine future delta points. A look back to old reports gives us the prognosis as it looks for
the future at that moment. Reality is always just a little different. Time (read: turning points) always
has deviations. The sum of the cycles indicates a direction, and on the basis of the various cycles the
greater and lesser highs/lows can be determined, measured in time.
For the analysis at the indexes, the events in the indexes themselves are considered. Astrological
aspects are also taken into account so that delta points can be placed more exactly. In the past thishas led to better turnaround dates and better long-term prognoses.

8/13/2019 Wr Supplement
http://slidepdf.com/reader/full/wr-supplement 7/9
7
How to trade:
In principle, trading can take place in any cycle. I advise trading in the MTD cycle, and using the ITD
as a trigger. But in addition to this, we look at the underlying direction to the MLTD/LTD. Depending
on risk, trading can occur only in the direction of the MLTD and/or LTD.
We must always consider that a recent delta point may not be in the place where it should be, no
matter how certain we are. You must always remember that the trade may be wrong. It is my
opinion that if you don't know what risk you are taking, and the amount you are risking, you
shouldn't speculate.
Suppose that we have had 2 ITD highs and are going toward an MTD high. And suppose that we think
the MTD high is set. Go short on the second ITD high 50% from the position, but take into account
that a higher MTD high will be placed anyway. If the exchange rate goes down and there is no higher
high—great. But if a higher high does come, then go short 100% from the position around the next
ITD high. Determine the high possibly with the help of a technical indicator. I myself always use the
stochastic. But there are other good indicators, such as RSI, ADX etc.
Always use a stop-loss and stick to it. Stop orders are your best friend as a trader. Expect the
unexpected. Trading is successful only when you respect the rules.
"Paper trading" and demo accounts are avilable from various brokers. I advise you to use them. Not
until you have achieved consistent results can you start trading in earnest.
The strategy and rules are different for everyone. What suits you, what strategy and what market,
how much time you have, and when you can do your trading—make a list of your rules and position
it near you monitor, for instance, and stick to them.
8/13/2019 Wr Supplement
http://slidepdf.com/reader/full/wr-supplement 8/9
8
Trading example
How can we profit from a movement we foresee, and trade on it? As an example, I take the S&P500,
one of the most popular indexes.
Most traders want a position for a short period of a few days to a few weeks. We must look, then, at
the ITD cycle. We can trade in the direction of the MTD cycle, with the MLTD/LTD cycle indicating the
main direction.
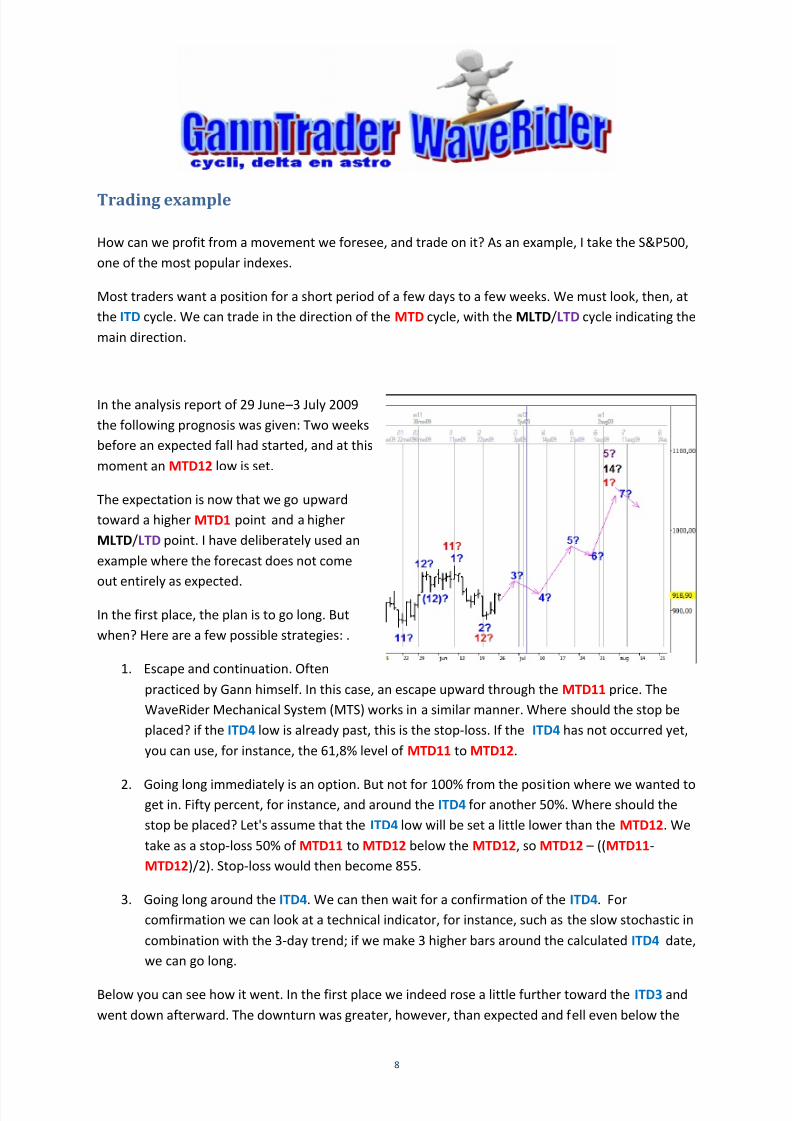
In the analysis report of 29 June –3 July 2009
the following prognosis was given: Two weeks
before an expected fall had started, and at this
moment an MTD12 low is set.
The expectation is now that we go upward
toward a higher MTD1 point and a higher
MLTD/LTD point. I have deliberately used an
example where the forecast does not come
out entirely as expected.
In the first place, the plan is to go long. But
when? Here are a few possible strategies: .
1. Escape and continuation. Often
practiced by Gann himself. In this case, an escape upward through the MTD11 price. The
WaveRider Mechanical System (MTS) works in a similar manner. Where should the stop be
placed? if the ITD4 low is already past, this is the stop-loss. If the ITD4 has not occurred yet,
you can use, for instance, the 61,8% level of MTD11 to MTD12.
2. Going long immediately is an option. But not for 100% from the position where we wanted toget in. Fifty percent, for instance, and around the ITD4 for another 50%. Where should the
stop be placed? Let's assume that the ITD4 low will be set a little lower than the MTD12. We
take as a stop-loss 50% of MTD11 to MTD12 below the MTD12, so MTD12 – ((MTD11-
MTD12)/2). Stop-loss would then become 855.
3. Going long around the ITD4. We can then wait for a confirmation of the ITD4. For
comfirmation we can look at a technical indicator, for instance, such as the slow stochastic in
combination with the 3-day trend; if we make 3 higher bars around the calculated ITD4 date,
we can go long.
Below you can see how it went. In the first place we indeed rose a little further toward the ITD3 and
went down afterward. The downturn was greater, however, than expected and fell even below the

8/13/2019 Wr Supplement
http://slidepdf.com/reader/full/wr-supplement 9/9
9
ITD2. Because of this we have to move the MTD12 (afterward). Much later yet even the MLTD13 will
be placed here.
But time is more important than price, and that a lower low has been placed is no catastrophe. Let's
look at the point of entry in the 3 strategies.
1. See the color light green. See the 1, the level where we get in. Stop-loss is the green line.
Actually, we should take the MTD12 as the stop, but since the ITD5 high is getting close, we
take a higher stop-loss.
2. See the color orange. The first and second entry levels and stop-loss level are indicated.
3. See the color maroon. The entry level (as in the second point of entry in 2) is indicated and
the stop-loss is the MTD12.
Where do we get out? I won't go
into this too much. You can figure
out fibonacci levels for yourselves.
Taking profits in phases, looking at
the 3-day trend, looking at
decreasing momentum with the
help of technical indicators, for
example.
The best thing is when we can
move the stop-loss up and down,
with a little latitude for moving.
The fact is that the ITD5 and ITD7 are highs. When you look at the calculated timeline: The MTD1 is
calculated on 2 August; the ITD5 doesn't count anymore, and the ITD7 is calculated on 11 August.
Around the period from 2 to 11 August you must expect the high, and look for indications of a good
time to get out.
The delta points are your guide, and the various cycles show the way. Be patient, always set a stop-
loss, and follow the rules you operate yourself.
Tjerk Spriensma
(December 2009)
http://www.ganntrader.org/nl/gtabonnementen/waverider/index.html
http://www.ganntrader.org/en/gt-waverider/index.html