wwt technology solutions for water reuse final · technology solutions for water reuse 1. ... air...
TRANSCRIPT
Presented by
Technology Solutions For Water Reuse

Technology Solutions For Water Reuse
1. Industrial water reuse key technology
2. Secondary, Tertiary Applications
3. Zero Liquid Discharge
4. Flue Gas Scrubber - Metals
5. Case Histories

Secondary TertiaryScrubber

WATER USERS
Equalization, Pretreatment
BOILERS, COOLING SYSTEMS, PROCESSES
Secondary/TertiaryPRIMARY
INFLUENT
SLUDGE DEWATERING
RIVER
What key technology enables water reuse?

Separations Technologies
Always in Combination
Preconditioning (MF, MMF, Chemical)
Membrane Systems (RO, NF, UF, MF)
Electro Dialysis Reversal (EDR)
Zero Liquid Discharge (ZLD)
DAF / EAF (Entrapped Air Floatation)
Membrane Bio Reactor (MBR)
Media Filters
Mem-Chem Enhancements

Technology exists to reuse water
Inorganic Waste Organic WasteHeavy Metals /Ionic Sink/Complex
UF + ROUF + EDR
MBR Evap / ZLD

Reverse Osmosis
Membrane Configurations for Reuse
Spiral wound/tubular: best suited to NF/RO
Hollow fiber: best suited for MF/UF
Sand filtrationSand filtration
MicrofiltrationMicrofiltration
UltrafiltrationUltrafiltration
NanofiltrationNanofiltration
Reverse OsmosisReverse Osmosis
0.0001 0.001 0.01 0.1 1 10 100mm
Conventional: Best suited Roughing
Increasing pressure requirements

UF Membrane Configurations
Spiral
Inside OutPressure Fiber Out side In
Vacuum PlateTubular
Quality Required by the Effluent Supplied
Pressure Fiber

Waste Water Leader–The Industrial-Strength Solution
Immersed
Hollow fiber
Outside-in
Ultrafiltration (UF)
PVDF (chlorine and oxidant-resistant) chemistry
Absolute Barrier - <3 SDI
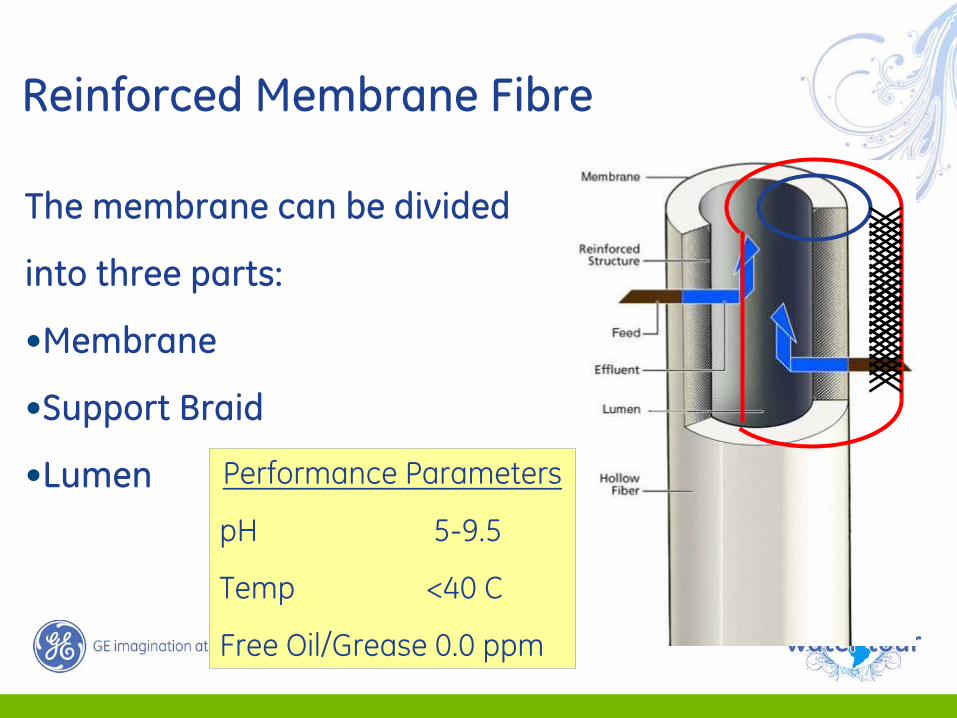
Reinforced Membrane Fibre
The membrane can be divided
into three parts:
•Membrane
•Support Braid
•Lumen Performance Parameters
pH 5-9.5
Temp <40 C
Free Oil/Grease 0.0 ppm

ZeeWeed 500 Hollow Fibre UF How Does It Work
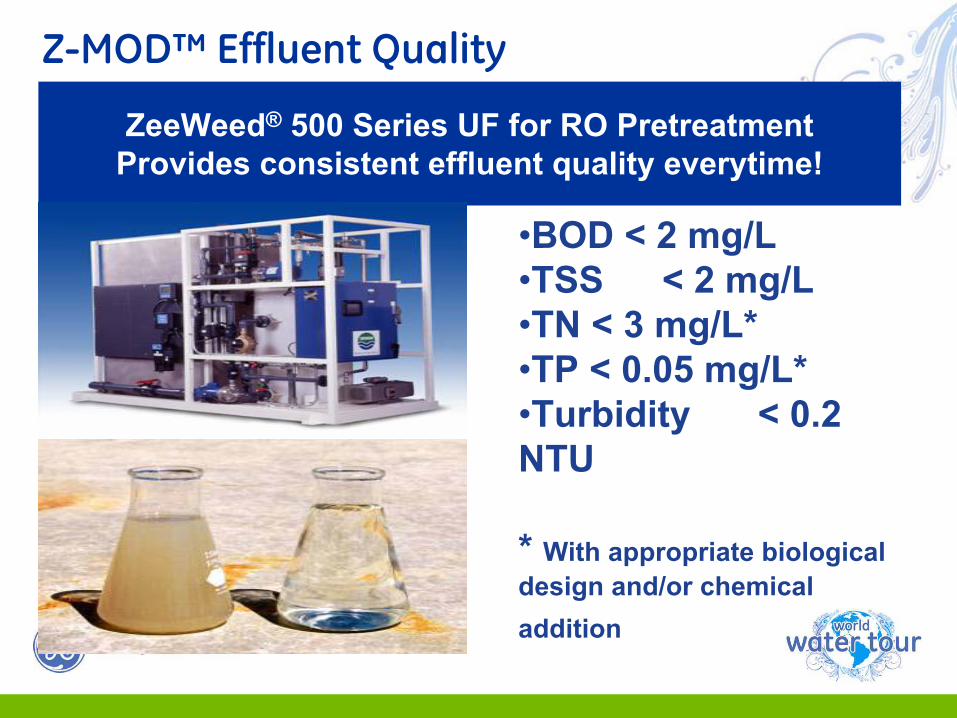
Z-MOD™ Effluent Quality
ZeeWeed® 500 Series UF for RO PretreatmentProvides consistent effluent quality everytime!
•BOD < 2 mg/L•TSS < 2 mg/L•TN < 3 mg/L*•TP < 0.05 mg/L*•Turbidity < 0.2 NTU
* With appropriate biological design and/or chemical addition

Secondary Effluent Recycle

Secondary Effluent Recycle

Primary Effluent
Boiler Feed
CIP HotCooling Tower
HygieneProcess Make Up
Primary Waste Treatment
Permeate
Indirect Contact
Flow: >50 gpm>500 <10,000 mg/l COD< 100 mg/l TSS continuous< 500 mg/l TSS Spikes< 2,000 mg/l TDS< 20 mg/l FOG>100 mg/l BOD
Secondary Effluent
Target Water Costs >$4.00/kgal (3.78m3)OBJECTIVE: remove organic* and ionic impurities; recover water, reduce waste volume
MBR RO
Post API/DAFfree oil or TSS removal

Membrane Bioreactor (MBR)
ActivatedSludgeProcess
MembraneFiltration
MBR
Stable BiologicalTreatment Process
Absolute SolidsSeparation

ZeeWeed® MBR System
ZeeWeed® 500 Membrane Cassettes
Permeate Header
Biological Reactor
Air Header
Permeate Pump Air Blower
Control Panel

Conventional AS Process
ActivatedSludge
SecondaryClarifier
SandFilter
PrimaryClarifier
SludgeDigestion To Sludge
Dewatering
ActivatedSludge
To Sludge Dewatering
ZeeWeed® MBR Process
Conventional Activated Sludge vs. MBR
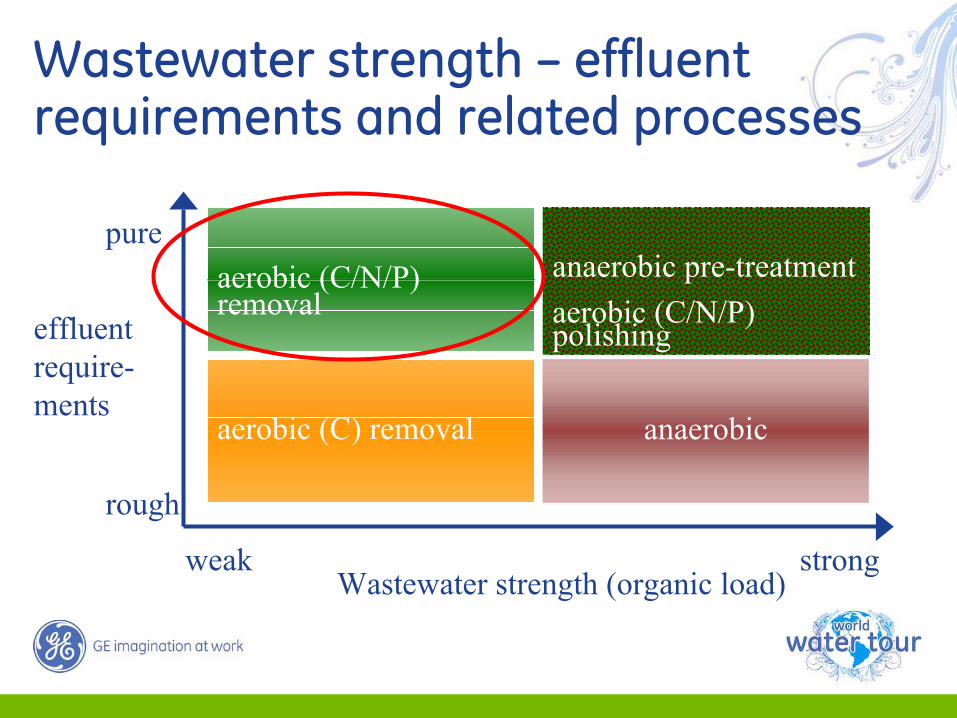
Wastewater strength – effluent requirements and related processes
Wastewater strength (organic load)weak strong
rough
pure
effluentrequire-ments
anaerobic
aerobic (C/N/P) removal
aerobic (C) removal
anaerobic pre-treatmentaerobic (C/N/P) polishing

IndustrialWastewater Treated
Effluent
ProcessBlower
AerobicBioreactor
Air ScourBlower
Recirc Pump
UF ProcessPump
Waste Sludge
Caustic
Phosphoric Acid
ZeeWeed® MBR Typical Process Flow Diagram

Key ZeeWeed® MBR Parameters
HRT of 4-8 hours
SRT of 15-365 days
MLSS of 8-12,000 mg/L (3 to 5 times that of conventional AS plants)
Stable effluent quality
Upset resistant

Reuse DriversRequirements for reuse (now or in future) or direct discharge are primary drivers • Eliminate non-compliance due to
upsets • High purchase or discharge costs• Scarcity or allocation
Reducing BOD surcharges are secondary drivers • Most times meeting sewer use limits
can be done less expensively with MBR• Permit requirements
Space constraints • Most Industrial sites are space
challenged and nothing else will fit!
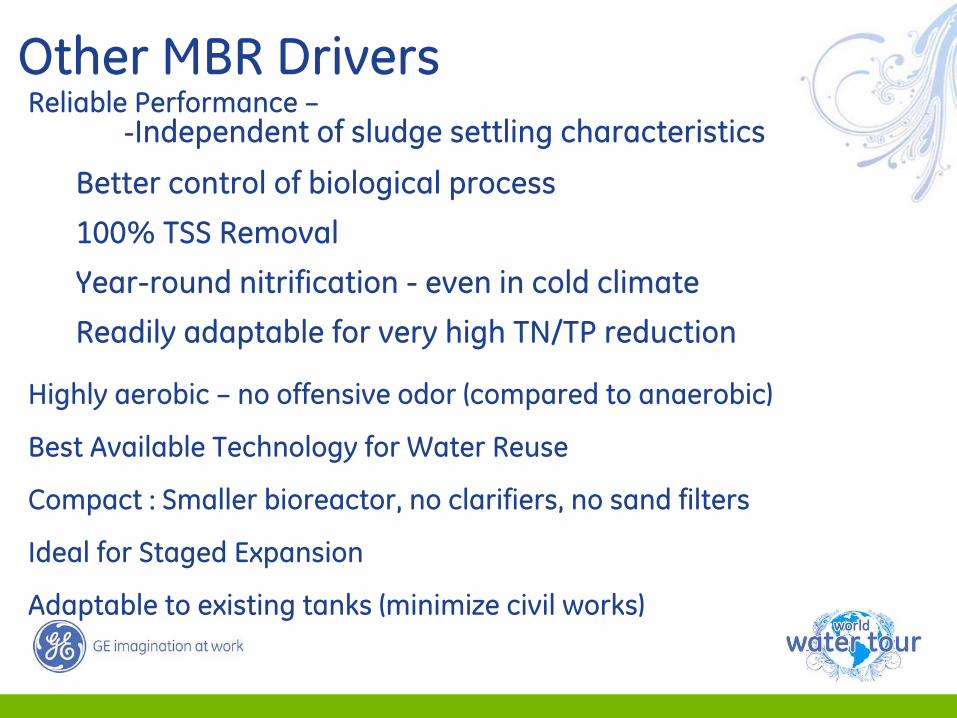
Other MBR DriversReliable Performance –
-Independent of sludge settling characteristics
Better control of biological process
100% TSS Removal
Year-round nitrification - even in cold climate
Readily adaptable for very high TN/TP reduction
Highly aerobic – no offensive odor (compared to anaerobic)
Best Available Technology for Water Reuse
Compact : Smaller bioreactor, no clarifiers, no sand filters
Ideal for Staged Expansion
Adaptable to existing tanks (minimize civil works)

Significant Footprint Reduction
Conventional plantMembrane bio-reactor plant
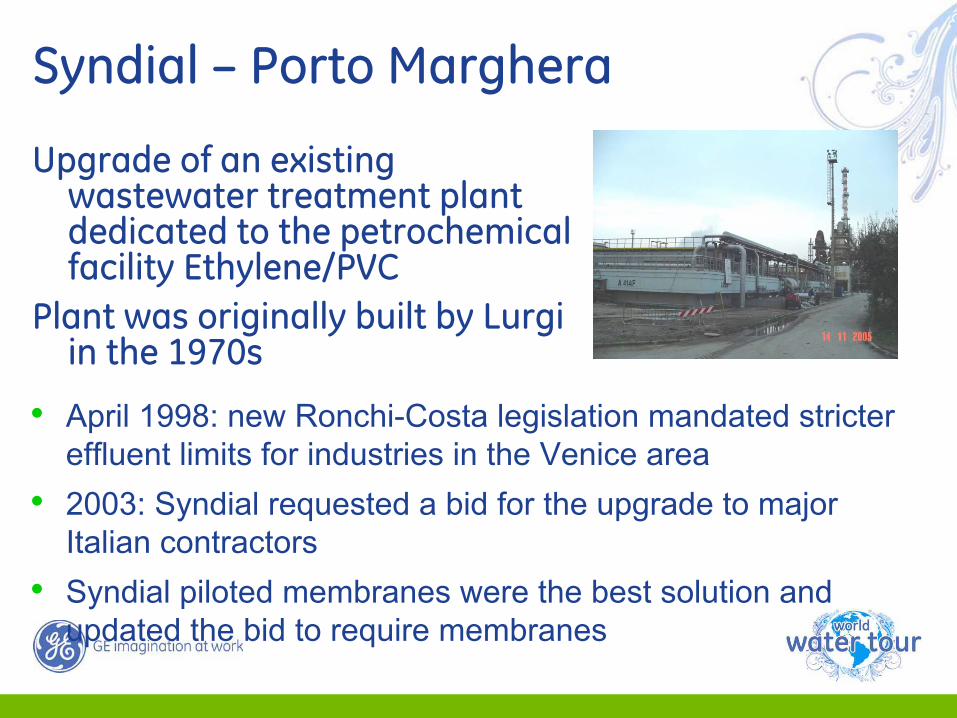
Syndial – Porto Marghera
Upgrade of an existing wastewater treatment plant dedicated to the petrochemical facility Ethylene/PVC
Plant was originally built by Lurgiin the 1970s
• April 1998: new Ronchi-Costa legislation mandated stricter effluent limits for industries in the Venice area
• 2003: Syndial requested a bid for the upgrade to major Italian contractors
• Syndial piloted membranes were the best solution and updated the bid to require membranes

Syndial – Biological Tanks

Syndial – ZW 500d Train
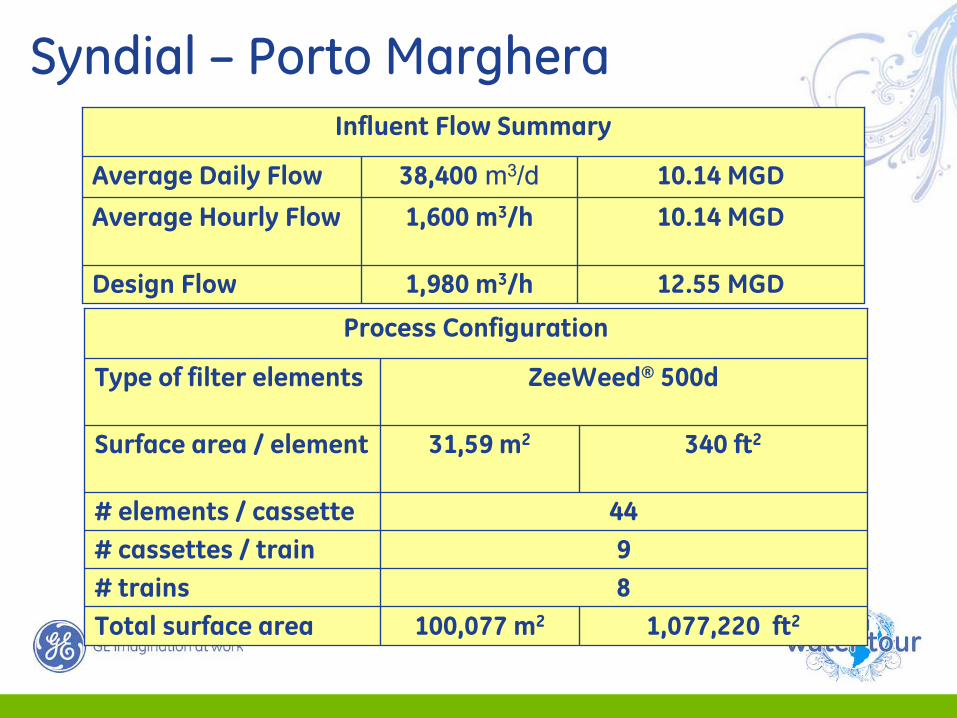
Syndial – Porto Marghera
10.14 MGD1,600 m3/hAverage Hourly Flow
12.55 MGD
10.14 MGD
1,980 m3/hDesign Flow
38,400 m3/dAverage Daily Flow
Influent Flow Summary
1,077,220 ft2100,077 m2Total surface area8# trains
44# elements / cassette
340 ft231,59 m2Surface area / element
9# cassettes / train
ZeeWeed® 500dType of filter elements
Process Configuration

Syndial – Porto Marghera
≤ 120 µg/lCOD≤ 0.3 µg/lNitrogen as Nitrate≤ 0.5 µg/lNitrogen as Ammonia ≤ 10 pg/l Total Nitrogen≤ 1 mg/lSuspended Solids, mg/L
Treated Water Quality
Super RO influent quality

COD Reduction
0
1
10
100
1000
10000
0 5 10 15 20 25 30 35
Time (d)
CO
D in
fluen
t; C
OD
effl
uent
(mg·
L-1);
CO
D lo
ad (k
g·m
-3·d
-1)
0
10
20
30
40
50
60
70
80
90
100
MLS
S (g·L
-1);C
OD
removal (%
)
COD influent COD effluent COD load MLSS COD remova l

Tertiary Effluent Recycle

Secondary Effluent
Boiler Feed
CIP HotCooling Tower
HygieneCIP Cold
Waste TreatmentClarifier
Permeate
Indirect Contact
Flow: >50 gpm<200 mg/l COD< 50 mg/l TSS continuous< 150 mg/l TSS Spikes< 2,000 mg/l TDS0.0 mg/l FOG<50 mg/l BOD
Target Water Costs >$4.00/kgal (3.78m3)OBJECTIVE: remove organic* and ionic impurities; recover water, reduce waste volume
UF RO
Post biox final clarifier
Tertiary Effluent

MBR vs. Tertiary Treatment
MBR Simplified Treatment Process
Tertiary Filtration Process
Wastewater
High Quality Effluent forRO Feed

ZeeWeed® Tertiary Filtration PFD
Inlet Water
Reject NeutralizedWaste to Drain/Sewer
Drain/Recirculation
Pump
Air ScourBlower
NaOH SodiumBisulphite
Optional for Neutralization
Permeate to TreatedWater Storage
Permeate/Bakcpulse
PumpStorage
Tank
BackpulseTank
NaOCl Citric Acid
Influent From
Secondary Clarifier
Conc. To Bioreactor
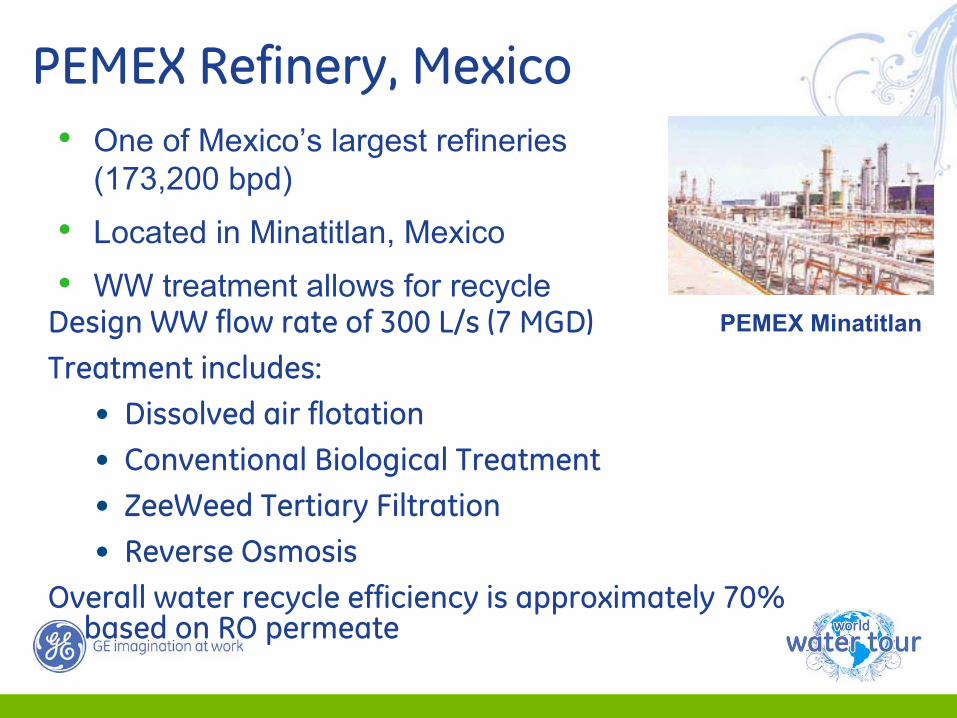
PEMEX Refinery, Mexico
Design WW flow rate of 300 L/s (7 MGD)Treatment includes:
• Dissolved air flotation• Conventional Biological Treatment• ZeeWeed Tertiary Filtration• Reverse Osmosis
Overall water recycle efficiency is approximately 70% based on RO permeate
• One of Mexico’s largest refineries (173,200 bpd)
• Located in Minatitlan, Mexico
• WW treatment allows for recyclePEMEX Minatitlan

PEMEX Refinery, MexicoZeeWeed® system design:
Peak Flow – 300 L/s (~ 6 MGD)Recovery- 90 to 95%7 parallel trains of ZW500b
(6 operating + 1 standby)11 cassettes per train
(expandable to 15)
Effluent Quality Requirements:TSS < 1 mg/lTurbidity < 0.1 NTUSDI < 3

PEMEX – Flow Diagram
RefineryWastewater
333 Lps
300 Lps< 0.2 NTU
< 3 SDI
RO Permeate240 Lps
for Recycle toRefinery
UFPermeate
UFReject33 LpsZeeWeed® UF Operating at 90 % Recovery
8 Trains of 11 cassettes of ZW500b Elements
Refinery
Oil/WaterSeparator
Bioreactor
SecondaryClarifier
Reverse OsmosisSystem Operating at
80 % RecoveryRO
Reject60 Lps

PEMEX Refinery, Mexico
ZeeWeed Process Trains
ZeeWeed Building

Membranes Immersed in Process Tank @ 85,000 mg/L FOG After Upset!
Cassette Fully Restored After Recovery Cleaning!
NO Discharge –RO’s Saved!!

Refinery / Petrochemical Water Reuse
ZW + RO tertiary0.35M3.32006Sasol Secunda, South Africa
ZW + RO tertiary4.0M3.52006ENI R&M, Taranto, Italy (R)
0.76
5.7 ADF
6.9 MDF
0.16
6.8
1.3 Ph.1
5.28 Ph.2
1.9
1.9
Size (MGD)
ZW + RO MBR2.74M2007ENI, Gela, Sicily (R)
ZW + RO MBR2.74M2007ENI Priolo, Sicily (R)
ZW + RO tertiary4.4M2001PEMEX, Minatitlan, Mexico (R)
ZW + RO MBR2004Borsodchem, Hungary (R)
0.2M
2.6M
5.6M
Sales$M
ZW + RO tertiary2004Yanshan Petrochemical, China (P)
ZW + RO MBR2005Formosa Petrochemical Corp., Taiwan (P)
ZW tertiary 2004Syndial Manfredonia, Italy (R)
Startup
ApplicationLocation

Zero Liquid Discharge

Brine Concentrator/Crystallizer PFD

Auburndale Power Plant

Comparison of Traditional and Evaporative Produced Water Treatment Approaches
Traditional Approach
Evaporative Approach

Simplified Vapor Compression Falling Film Evaporator System

Suncor Firebag Stage 2 Evaporators

Typical Heavy Oil Zero Liquid Discharge Crystallizer System

Economic Analysis Summary (WLS / WAC vs. Evaporation)
When compared to WLS / WAC / OTSG, the evaporator / drum boiler approach resulted in:
• 6% lower operating cost over life of plant• 10% lower total installed costs for
ENTIRE facility• 5 year and 10 year NPV savings of 11%
and 12%, respectively, EXCLUDING lost opportunity credit for higher on-stream availability
• 2-3% higher on-stream availability• Significantly lower operational labor and
maintenance requirements for evaporator and boiler
• 6 month shorter scheduleTotal Deer Creek

Modularized General Arrangement

Oil Sands - Mature Fine Tails
BOD / COD- 30/100 mg/l

Direct UF vs MBR - MFT

HFUF to RO

HFUF to RO
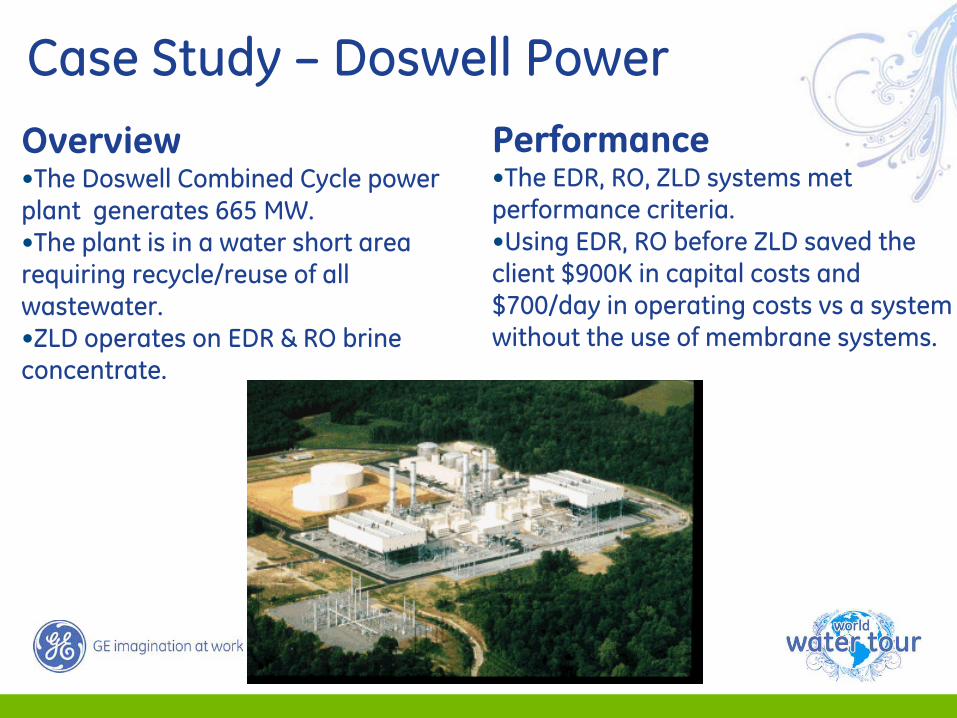
Case Study – Doswell Power Overview•The Doswell Combined Cycle power plant generates 665 MW. •The plant is in a water short area requiring recycle/reuse of all wastewater.•ZLD operates on EDR & RO brine concentrate.
Performance•The EDR, RO, ZLD systems met performance criteria.•Using EDR, RO before ZLD saved the client $900K in capital costs and $700/day in operating costs vs a system without the use of membrane systems.

Doswell Power PFD
250gpm - Thru 6 Steps - 0.2gpm

Advanced Biological

AdvancedBiological Treatment
Inorganics and Metals Removal

Advanced Biological Metals (ABMet®) Removal Process
Removes metals and inorganics to below non-detectable levels
Utilizes a simple and controlled biological reduction and precipitation process
Keeps metal particulates inside the system until recovery
Ideal for use in scrubber water reuse

Best Available Technology99+% Removal of:
• Selenium• Arsenic• Mercury• Chromium• Cadmium• Copper• Zinc• Cobalt• Nickel• Antimony• Nitrate
ABMet® Metals Removal
0
1
2
3
4
5
6
Untreated 2 3 4 5 6
Time [weeks]
Ars
enic
, Sel
eniu
m
[m
g/L]
0
2
4
6
8
10
12
Mer
cury
[ug/
L]
Arsenic Selenium Mercury
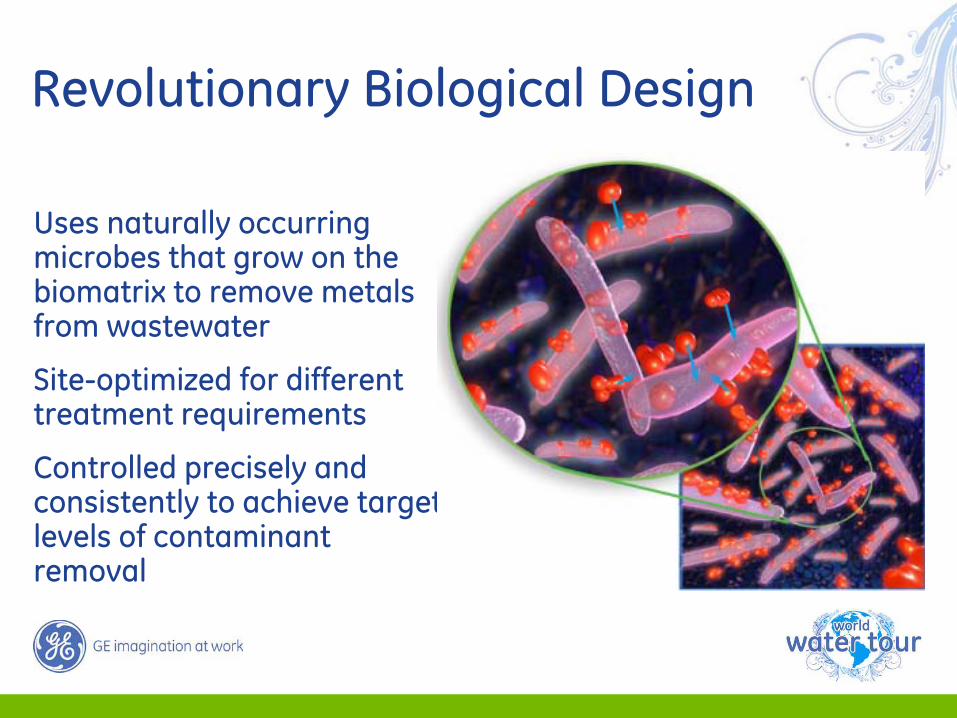
Revolutionary Biological Design
Uses naturally occurring microbes that grow on the biomatrix to remove metals from wastewater
Site-optimized for different treatment requirements
Controlled precisely and consistently to achieve target levels of contaminant removal
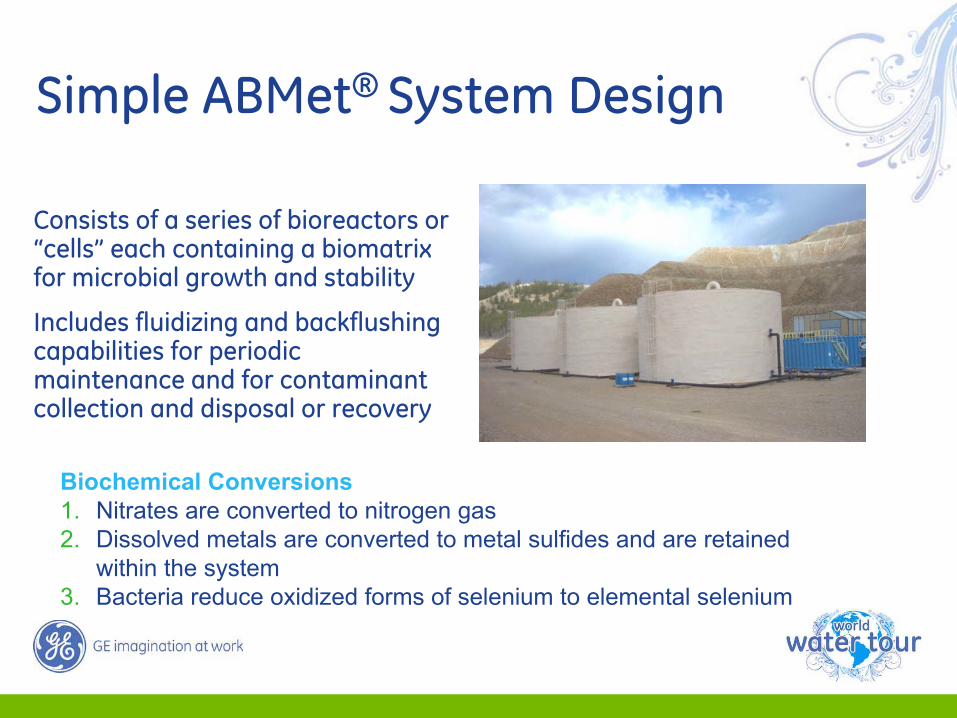
Simple ABMet® System Design
Consists of a series of bioreactors or “cells” each containing a biomatrix for microbial growth and stability
Includes fluidizing and backflushing capabilities for periodic maintenance and for contaminant collection and disposal or recovery
Biochemical Conversions1. Nitrates are converted to nitrogen gas2. Dissolved metals are converted to metal sulfides and are retained
within the system3. Bacteria reduce oxidized forms of selenium to elemental selenium


Lower Costs. Better Results.
Reverse Osmosis($3 - $10/1,000 gal)
Ion Exchange($1 - $3/1,000 gal)
FerrihydritePrecipitation (BDAT)($9 - $15/1,000 gal)
Nanofiltration($3 - $8/1,000 gal)
ABMet®(< $1.00/1,000 gal)
In-Situ
Wetlands(below $2/1,000 gal
Chemical Precipitation($1 - $5/1,000 gal)
TREATMENT COSTHigh Low
High
Low
EF
FEC
TIV
EN
ES
S
Treatment of Petroleum Refinery Wastewater for Metals Removal
Selenium (Se) present in natural crude oil is removed and eventually flows to the stripped sour water waste stream
Refineries are often located in heavily populated areas and are direct dischargers of waste
Regulatory authorities are now pushing limits of < 5 ppb for Se

Power Generation
OverviewOne of the largest power plants in the United States
Flue Gas Desulfurization (FGD) wastewater, contaminated with selenium and other metals, must be treated prior to being discharged to meet environmental requirements
The ABMet® process was selected to biologically remove selenium from wastewaters
North Carolina Utility

Case study:Great White North Refining