wyoming county trends and impacts report · pdf filedo the elderly and disabled have special...
TRANSCRIPT

WYOMING COUNTY
TRENDS AND IMPACTS REPORT
COMMUNITY HEALTH
RELATED NEEDS
AND SERVICES
2008 THROUGH 2016
WILLIAM F. THIEL FUND
COMMUNITY FOUNDATION
FOR GREATER BUFFALO
OCTOBER 2017
HMS ASSOCIATES, GETZVILLE, NY

TRENDS AND IMPACTS
i
Table of Contents
A. Overview 1
B. Executive Summary 2
C. Detailed Findings 11
a. Has the overall need for health care services changed? 12
i. County resident characteristics
ii. Factors affecting births
iii. Major illnesses
b. Do the elderly and disabled have special needs in terms
of types of illnesses, use of hospital services and cost of care? 42
i. Key Concepts
ii. Prevalence of chronic illnesses
iii. Preventable use of hospital inpatient services
iv. Use of hospital emergency department services
v. Cost of care
c. What have been the impacts of Thiel funded projects? 54
i. Guiding principles
ii. Funding levels
iii. Services
iv. People served
v. 2016 Special Projects
D. Technical Notes 61a. Benchmarks
b. Vital Statistics
c. Medicare Claims Data

TRENDS AND IMPACTS
ii
List of Exhibits and Illustrations
A. Wyoming County Medicare Enrollees Chronic Disease Rates 4
B. Original Medicare Costs of Care - Wyoming County Enrollees 6
C. Wyoming County Residents Served by Thiel Funded Projects by Year 8
1. Projected Trend in Wyoming County Population 13
2. Projected Changes in Age Groups Between 2003 and 2014 14
3. Poverty Rates 15
4. Educational Attainment 16
5. Live Births 17
6. Deaths 18
7. Births and Deaths 19
8. Uninsured Rate 20
9. Higher Fertility Ratios 21
10. Lower Fertility Ratios 21
11. Teen Pregnancy Rate and Number of Births 22
12. Out of Wedlock (OOW) Birth Rates by Age of Mother 23
13. Low Income Births 24
14. Early Prenatal Care 25
15. All Causes of Death: Number and Rate 26
16. All Causes of Death Rate Comparisons 27
17. Diseases of the Heart 28
18. Heart Disease Death Rate Comparisons 29
19. Cancer 30
20. Cancer Death Rate Comparisons 30
21. Chronic Lower Respiratory Disease 31
22. Chronic Lower Respiratory Disease Death Rate Comparisons 32
23. Cerebrovascular Disease Deaths 33
24. Cerebrovascular Disease Death Rate Comparison 33
25. All Accidental Deaths 34
26. All Accidental Death Rate Comparisons 34
27. Diabetes Death Rates 36
28. Diabetes Death Rate Comparisons 37
29. Pneumonia Deaths 38
30. Pneumonia Death Rate Comparisons 38
31. All Other Causes of Death 39
32. All Other Causes of Death Rate Comparisons 39
33. ER and Inpatient Use for Opioid Abuse - Wyoming County Residents 40
34. Medicare Coverage Enrollment by Type - Wyoming County 43
35. Conditions by Type of Medicare Beneficiary in Wyoming County 45
36. Chronic Disease Rates - 2012 through 2014 Average 46
37. Preventable Inpatient Hospitalizations 47
38. Hospital Emergency Department Visits - 3+ Conditions 48
39. Hospital Emergency Department Visits - 1 or 2 Conditions 49
TRENDS AND IMPACTS
iii
40. Medicare Annual Costs by Type of Eligible and Chronic Condition 50
41. Percent Change in Medicare Annual Cost by Type of Eligible and
Chronic Condition 51
42. Chronic Conditions Severity by Costs and Type of Coverage - 3 Year Average 52
43. Chronic Condition Medicare Costs - 3-Year Average - Wyoming County 53
44. Local Providers Working Hand-in-hand to Address Complex Community
Health Needs 55
45. Funding Level by Component 55
46. Thiel Funded Projects 57
47. People Served by Project Type 58
_______________________________________________________
Questions or comments appreciated to
Darren Penoyer, Senior Program Officer
Community Foundation for Greater Buffalo
(716) 852-2857, x206
Web: www.cfgb.org
Report prepared by
Gregory Bonk, CEO/Principal
HMS Associates
P O Box 374, Getzville, NY 14068
(716) 868-6448
Web: askhmschna.com

TRENDS AND IMPACTS
1
A. Overview
The Thiel Fund has been and continues to be dedicated to addressing the health related needs
of Wyoming County residents. Since 2007, the Fund administered by the Community Foundation
for Greater Buffalo has awarded approximately $2,960,000 to local organizations serving at
least one out of three Wyoming County residents.
Comprehensive community health needs assessments were commissioned by the Community
Foundation for Greater Buffalo to identify priority needs and guide Thiel Fund grant making
decisions for 2008 through 2017. Technical analyses for these assessments addressed all
residents regardless of income levels or culture, unlike many community health assessments
which focus extensively on the needs of low income populations.
The assessments, as well as this report employed both Western New York and statewide
benchmarks to distinguish between needs related to the county’s rurality versus its presence in
the regional Western New York health care services system. Analyses prepared by HMS
Associates were fortified by extensive community engagement with the community-at-large
through focus groups, interviews and internet based surveys as well as the input of the Wyoming
County Health Roundtable, which was created partly in response to the assessment process
itself.
This trends report or chart book includes data on different multiple year periods determined
by the availability of different years within the audited data set. Trend lines are present in
many exhibits to demonstrate the direction, increasing or decreasing, of the data point and
likewise potential for increasing or decreasing need. This report also expands earlier analyses
by citing data and analyses on county residents covered by original Medicare, i.e., the elderly
and disabled, populations of special interest identified at the Wyoming County Health Forum
of October 2015. Traditional Medicare claims based analyses on the prevalence of chronic
disease and hospital inpatient and emergency room services use identify the unique needs of
this population. Additionally, the costs for services or “premium” for Wyoming County Medicare
patients provide perspectives on local costs for care or health care system “value”, a key
dynamic in today’s evolving health care environment.
The major purpose of this report or chart book is to present data and analyses which identify:
Trends or changes in needs and services use of Wyoming County residents over the last
several years
Insights on future needs based on those trends
Thiel Fund impacts

TRENDS AND IMPACTS
2
B. Executive Summary
Key Trends and Insights
County Residents
The actual make-up of County residents is a major factor in assessing the health care needs of
the community. The number of people or population determines the ideal size of a responsive
health care system. The growth or decline of the population accordingly influences the need
for expansion or contraction in health care services capacity. There are several other factors
indicative of the county’s make-up which influence health care needs. Age and sex, income and
educational level, birth and death rates, and health care coverage are other key factors.
Fundamentally, the non-institutional population of the county is declining and is projected to
decline from 40,791 in 2016 to 39,300 by 2022. Most age groups will experience a decline with
the exception being people between the ages of 55 and 74. In 2015, the number of deaths, 398,
exceeded the number of births, 369, by 8% or 29 people, a trend which is projected to continue.
Hence population growth in the future will likely be driven by people moving into the county.
Poverty or low incomes and the associated need for enabling health care services will especially
affect two groups in the future: the elderly and people without a high school education. The
percentages for those groups have grown. Health care coverage has improved over the period
studied and is expected to have resulted in improved access to health care services. It is
difficult to determine exactly how much of this improved coverage is related to past changes
in national and state health care coverage policy and, in this era of uncertainty, what the
impact of future changes will be.
Maternal and Child Health
The health care needs of the county are also heavily influenced by care available to women of
child-bearing age. Consistent with the finding on lower birth rate, women in most age groups
are having fewer babies, the exception being women between the ages of 25 and 29. On the
positive side, teen pregnancies continue to decline, going from 40 in 2008 to 17 in 2015 and the
county’s teen pregnancy rate is among the lowest in Western New York and similar rural
counties in New York State. Negative or increasing trends were noted for out-of-wedlock
pregnancies for women 25 to 29 years of age and lack of access to prenatal care by women 20
to 24 years of age. Births to women covered by Medicaid increased and there was a
corresponding decline in births to women covered by commercial insurance. Yet this is
considered to be a function of expanded Medicaid coverage rather than a change in poverty or
low income levels in the county.

TRENDS AND IMPACTS
3
Overall Health and Lifestyles
The county’s death rate for all causes has been increasing, going from 702 deaths per 100,000
people (age/sex adjusted) in 2009 to 799 deaths in 2015, an increase of 14%. That rate is
unremarkable for Western New York but high in comparison to similar rural counties in the
state. A rising number of deaths of county residents was found for three distinct major causes
of death: Chronic Lower Respiratory Diseases, related to airflow blockage and breathing-related
problems such as emphysema, chronic bronchitis, and in some cases asthma; All types of
Accidents, including unintentional injuries, falls, poisonings and motor vehicle traffic deaths;
and Cerebrovascular Disease or stroke. Death rates due to cancer were relatively unchanged
with minimal changes in deaths due to Diabetes Mellitus or Pneumonia. Deaths due to Disease
of the Heart declined, however. For most causes, death rates were unremarkable in comparison
to Western New York counties, but high for All Accidents and Diabetes in comparison to similar
rural counties.
Opioid abuse has become a major health care challenge, especially as it pertains to the abuse
of pain medication. Use of hospital-based services by county residents has increased over the
past several years, with the highest increased rates of use occurring to people covered by
Medicare. Death rates for both opioid and opioid pain medication abuse are similar to western
New York and similar rural county rates. The county’s recent high rate for Neonatal Abstinence
Syndrome (NAS), which occurs to infants born to women using legal or illegal opiates, includes
hypersensitivity and hyperirritability, tremors, vomiting, respiratory difficulties, poor sleep,
and low-grade fevers should be examined more closely. On the positive side of the challenge is
the county’s very low use of pain medication, 524.4 prescriptions per 100,000 people (adjusted
rate), in comparison to other counties in the region and similar counties in the state. Pain
medication prescriptions for drugs such as oxycodone, hydrocodone, codeine, morphine, and
fentanyl are declining due to greater recognition of the problem. For Wyoming County, the
number has declined from 26,634 prescriptions in 2014 to 23,926 in 2016, a reduction of
approximately 10%. Even though prescription rates are declining, substitution of heroin for
prescription pain medication is increasing due to heroin’s low cost and availability.
The Elderly and Disabled
Both the elderly and disabled require more health and enabling health care services than the
general population. Both groups are covered by Medicare and a review of service use by those
groups provides a unique perspective on their needs. The perspective is unique in that the data
takes into account several different types of services and service needs of 3,900 original
Medicare enrollees or 48% of all Medicare enrollees. Most importantly, It is based on the use of
services regardless of where the service is provided, whether within or outside of the county,
region or state. It also provides insights on how the needs of people with low incomes, so-called

TRENDS AND IMPACTS
4
“dual eligible” because Medicaid also helps to pay for services, differ from the higher income
Medicare population. The data does not reflect the experience of Medicare enrollees
participating in Medicare Advantage managed care plans.
Low income, dual eligible enrollees are sicker than the Medicare Only enrollees. One out of six
or 16% are relatively healthy with no chronic condition, yet one out of four Medicare Only
enrollees have no chronic condition. At the opposite end of the spectrum, 56% of dual eligible
enrollees have 3 or more chronic conditions, yet 47% of Medicare Only enrollees have at 3 or
more chronic conditions. These percents for multiple chronic conditions also point to the
importance of care coordination services.
Of the twenty chronic conditions reviewed, ten affected at least 10% of the Medicare
population. Two types of heart disease had the highest “average” rates: Hypertension (high
blood pressure) and Hyperlipidemia (high cholesterol), 55% and 41% respectively. Diabetes,
Ischemic Heart Disease (coronary artery blockage) and Arthritis had rates between 20% and 29%.
Depression, Chronic Obstructive Pulmonary Disease (lung disease), Heart Failure, Chronic
Kidney Disease, and Obesity had rates between 10% and 19%.
Rates were noticeably higher for those people with dual eligible status for six of the ten
conditions, with major differences occurring for Chronic Obstructive Pulmonary Disease (100%
higher), Depression (94% higher), Obesity (56% higher), Heart Failure (47% higher), Diabetes
(23% higher) and Chronic Kidney Disease (19% higher).
0
10
20
30
40
50
60
70
Rate per 100 people
ChronicDisease
Exhibit A. Wyoming County Medicare Enrollees Chronic Disease Rates
Average
Dual Eligible
Medicare Only

TRENDS AND IMPACTS
5
Relative to Western New York counties and similar New York State counties, Wyoming County’s
standing is noteworthy for several chronic conditions for the three-year average rate:
It compares favorably for several conditions and for “healthy” dual eligible and MedicareOnly residents in that its rate is among the best or lowest of those counties.
It is low and compares well for dual eligibles with only one chronic condition to otherWestern New York counties.
The county’s Diabetes rate is high and compares poorly with both Western New York andsimilar rural counties for the Medicare Only group of enrollees.
Chronic Kidney Disease and Ischemic Heart Disease rates for the county are high incomparison to similar NYS counties for the Medicare Only group.
The use of hospital inpatient services for the original Medicare and dual eligible populations
has improved, that is, the inpatient discharge rates have declined for most preventable and
chronic conditions. The overall preventable discharges rate declined by 18% between 2012 and
2014 and the chronic preventable conditions discharge rate has declined even more, 28%, during
that period. The acute preventable conditions discharge rate, however, has increased by 9%.
The increase in the acute rate suggests that access to immediate care needs more may be more
of a challenge than access to care for long term treatment for chronic diseases. Rates have
declined for Bacterial Pneumonia and Heart Failure as well, two preventable conditions which
typically have high rates of hospital discharges.
The level of hospital emergency department use is seen as an indicator of the need for improved
access to primary care and preventive health services. The emergency department use rates
for the high need (3+ chronic conditions), dual eligible group are 75% higher than the high need
Medicare Only population. This again is expected because of the problems in access to care
that people with low incomes typically experience.
Total costs for all covered health care services, as one would expect, differ substantially by
level of chronic care need and income level of enrollee or beneficiary. Costs for care used in
this study refer to “risk-adjusted” costs, which are based on the complexity of the beneficiary’s
medical problem and corresponding health care needs. Hence comparisons with other diseases
or counties are more valid than comparisons based on costs or rates which treat all patients
equally regardless of the complexity of their illness. Costs included are: Inpatient, Skilled
Nursing Facility (SNF), Hospice, Home Health Agency, Outpatient (including emergency room
care), Carrier (physician/supplier) and Durable Medical Equipment (DME)
The three-year average risk-adjusted annual cost for care for Wyoming County enrollees ranges
from $4,399 for Medicare Only enrollees with no chronic conditions to $16,801 for dual eligible
individual with 3+ chronic conditions.

TRENDS AND IMPACTS
6
Wyoming costs compare very favorably to Western New York counties for dual eligibles, having
low expected costs for beneficiaries with no chronic condition, 1 or 3+ chronic conditions and
seven of the ten high prevalence conditions. Comparisons for dual eligibles in Wyoming County
to similar counties in New York State had similar findings for several chronic conditions.
Medicare Only comparisons with Western New York counties were markedly different, however,
with high risk-adjusted costs for beneficiaries with 2 or 3+ conditions, and with two chronic
conditions: Chronic Obstructive Pulmonary Disease and Obesity. Comparisons to rural NYS
counties were similar for Pulmonary Disease and Obesity: both high, but low for Medicare
beneficiaries with no condition or 2 conditions.
Costs of care differ by enrollee’s status and number and type of chronic conditions. Exhibit B
depicts risk-adjusted costs for various levels of complexity of medical problems for Wyoming
County for the most prevalent chronic conditions.
Exhibit B. Medicare Costs of Care – Wyoming County Enrollees
Medical Problem Medicare Only Dual Eligible
No Condition $4,399 $5,109
1 Condition $6,431 $6,467
2 Conditions $7,156 $9,375
3+ Conditions $13,627 $16,801
Hyperlipidemia $11,657 $15,069
Hypertension $12,293 $15,481
Arthritis $12,252 $16,403
Diabetes $14,287 $17,246
Depression $15,459 $17,975
Obesity $16,982 $18,411
Ischemic Heart Disease $14,859 $19,179
Chron. Obstruct. Pulmonary Dis. $20,904 $21,191
Chronic Kidney Disease $19,768 $23,448
Heart Failure $23,181 $25,233
Thiel Funded projects
Key Concepts
Several key principles have guided the Thiel Fund grant making process administered by the
Community Foundation for Greater Buffalo. First and foremost is the principle of balance. The
overall effectiveness of health care is often linked to care provided by multiple organizations
and health care providers, rather than an individual organization or practitioner. The Thiel

TRENDS AND IMPACTS
7
grants funding model supported by the Wyoming County community through the extensive
involvement of county residents and the Wyoming County Health Care Roundtable was
predicated on a “systems” or balanced approach to service development rather than
concentrating on a specific disease or component of the health care system. An additional
consideration was the principle that successful solutions in Wyoming County require
participants who are heavily vested in Wyoming County, such as the organizations represented
on the Roundtable. Thiel Fund Advisory Councils convened by the Community Foundation made
recommendations on the types of projects.
Awards and Projects
Eight organizations were awarded a total of 52 grants amounting over $2.96M for the nine
funding cycles (2007 through 2015/2016). Over the five year period studied, 2012 through 2016,
the Infrastructure – Equipment Component was awarded 46% of Thiel funds for 8 different
projects, Enabling Services received 26% of funds for 14 different types of projects, Services
Expansion received 20% of funds for 5 different types of projects and Infrastructure –
recruitment, retention, training received 7% of Thiel funds for 13 different types of projects.
Two county agencies and six not-for-profit organizations have received funding during that
period. These are listed below by component and major project type.
Enabling Services
o Crossroads House, Batavia, NY
o Geneseo Migrant Center, Leicester, NY
o Wyoming County Community Action, Perry, NY
Infrastructure – Equipment
o Oak Orchard Health Community Health Center, Warsaw, NY
o Wyoming Community Hospital Foundation, Warsaw, NY
o Wyoming County Office of Emergency Services, Warsaw, NY
Infrastructure – Recruitment, retention, training
o Western New York Rural Area Health Education Center, Warsaw, NY
Services Expansion
o Spectrum Human Services, Orchard Park, NY
People Served
Services reached up to an estimated one out of every three county residents each year. Over
the five year period studied, the Infrastructure – Equipment Component served an average of
14,600 people, Enabling Services reached 5,800 people, Services Expansion served 500 people
and Infrastructure – recruitment, retention, training reached 600 people. The large number of
people served by equipment projects was due to the high numbers of Wyoming County residents

TRENDS AND IMPACTS
8
served by the Wyoming County Hospital each year and the impact of several equipment
purchases over the multi-year period. The data on people served is a duplicate count. Some
people were counted multiple times because they were served by different programs and by
different organizations. Wyoming County residents served by year are depicted in Exhibit C.
2016 Special Projects
Care Coordination
The core of effective comprehensive systems of health and enabling health care services is care
coordination. In 2015, the Wyoming County Health Roundtable identified care coordination as
a new priority program which should be supported by Thiel funds. The Roundtable supported a
Wyoming County Care Coordination Summit in 2016 with three objectives:
• Engage personnel of providers in Wyoming County
• Familiarize them with care coordination concepts
• Provide an opportunity to informally network with staff of other organizations
0
5000
10000
15000
20000
25000
2011-2012 2012-2013 2013-2014 2014-2015 2015-2016 5 Year Avg.
PeopleServed
(duplicatecount)
Funding Period
Exhibit C. Wyoming County Residents Served by Thiel Funded Projects by Year and Project Type
Service Expansion
Infrastructure - Recuitment, retention, training
Infrastructure - Equipment
Enabling Health Services

TRENDS AND IMPACTS
9
The 2016 Summit was a resounding success with 48 health and enabling health care services
personnel from 24 Wyoming County organizations in attendance. Follow-up responses clearly
demonstrated the impact and potential of the Care Coordination Summit for participants. Eight
weeks after the event, participants were already starting to engage new partners by sharing
information, ideas, and/or resources and establishing collaborations.
Selected impacts were:
• Participants averaged two “new collaborations” following the event and those
participants with limited connections were now more active in the overall coordination network
for Wyoming County
• Participants indicated that they would possibly coordinate care with an additional 16
participants at the summit. The current average level of coordination contacts was 7.
The Care Coordination Summit was repeated in October 2017 and participants were asked to
bring materials and brochures depicting their organization’s services.
Seniors Connect Project
At the 2015 Wyoming County Health Care Summit held in Perry, NY, participants were asked to
select a high priority need from a list of five needs identified earlier through a community
internet survey. That high priority need was to be addressed by program provided by a
Roundtable member through a special project grant of $2,500. The five needs were:
• Affordable Health Care
• Counseling/ mental health/ support groups
• Elder Health Care Options
• Positive Teen Attitudes funded through equipment
• Recreational Facilities
The Elder Health Care Option was selected and a program designed to address many aspects of
the needs for the elderly – Senior Connect – was offered by the Wyoming County Community
Action with assistance from the Wyoming County Office for the Aging and Youth Bureau. Sixteen
seniors received portable touchscreen devices (i.e., tablets) through which they could access
various internet resources and 8 hours of training. The participants viewed the program as very
valuable and the need for follow-up at public access internet access sites such as the county’s
libraries considered to be an important next step

TRENDS AND IMPACTS
10
In conclusion, the health care needs of the county have changed over the past several years as
a result of lower births rates, higher numbers of people between the ages of 54 and 74 with
traditionally high health care services needs, increased impact of poverty, specific chronic
disease and accidental death rates. Emerging health care needs in the future will be linked to
changes in the county’s incoming new residents rather than population increases due to births
which are now overpassed by the number of deaths. Like most communities, high rates of
chronic diseases are present in the elderly and disabled covered by the Medicare program.
Although the number of residents receiving emergency room or inpatient care for Opioid Abuse
is low, the number has increased significantly.
On the positive side, several “healthy” trends were noted. Teen pregnancy rates and heart
disease death rates have declined. The number of people without health care coverage has
declined. Use of hospital inpatient services by Medicare enrollees has declined with low rates
of use for most preventable health problems. Medicare costs of care for people with low
incomes are comparable or low in some cases compared to similar communities.
Over the 2011 through 2016 funding cycles, Thiel funded programs reached on average an
estimated one out of three county residents, funded eight different organizations which
operated 52 different programs and were awarded a total of $2,960,000. Future Thiel funding
priorities should take these trends into account as well as current and emerging policies on
health care coverage through both private and public programs.
Summary

TRENDS AND IMPACTS
11
C. Detailed Findings
Detailed findings on trends are presented on three topics which include the needs of all
Wyoming County residents; the need for, use and cost of health care services of elderly and
disabled residents, and Thiel funded program impacts. Time period studied varies by data
point, consistent with the availability of such data. Noteworthy needs potentially requiring
further study in future assessments are those needs which compare poorly with other counties
in Western New York, similar counties in New York State, or have shown negative trends over
the time period studied.
The need for all residents section examines key demographic characteristics of county
residents which influence the need for health care services, factors affecting births to
Wyoming County mothers, and major illnesses.
Services need and use by the elderly and disabled section is a new unique feature of HMS
Associates’ assessments. In part, it is presented due to the high interest in services to the
elderly identified by participants at the Wyoming County Health Forum in October 2015 and is
made possible by the availability of new techniques to study Medicare claims data. This
analysis provides a vivid picture in many instances of the high health care needs of elderly
and disabled residents and especially those with low incomes. This group of people is often
referred to as “dual eligible” because the costs of their care are covered by both Medicare,
through an employment insurance premium, and Medicaid, a federal and local tax supported
program. This section not only describes the extent of chronic illnesses of original Medicare
enrollees but also provides a picture of the costs of such care. Essentially it underscores the
importance of primary and preventive health care services and enabling services needed by
this group of county residents.
Funding levels, services, and people served through Thiel fund programs are summarized by
component of the health care system addressed which includes service development or
operation, infrastructure support for equipment or staff, or enabling services designed to
increase access to needed services. This is illustrative of the balanced approach to Thiel
grants over the past several years. There are no “magic bullets” in health care. A
comprehensive system of preventive, acute and specialty care services as well as enabling
services are required to meet the varied needs of the community.

TRENDS AND IMPACTS
12
a. Has the overall need for health care services changed?
I. County Resident Characteristics
• Number of People
• Age Group
• Poverty Level
• Educational Level
• Births and Deaths
• Health Care Coverage
II. Factors Affecting Births
• Fertility Ratios
• Teen Pregnancy
• Out of Wedlock
• Low Income Mothers
• Prenatal Care
III. Major Illnesses
• All causes of death
• Major causes of death
• Diseases of the Heart
• Malignant Neoplasms
• Chronic Lower Respiratory Diseases (CLRD)
• Cerebrovascular Disease
• Accidents (Total)
• Diabetes Mellitus
• Pneumonia
• All other causes
• Opioid Abuse

TRENDS AND IMPACTS
13
I. Characteristics of Wyoming County Residents
Number of People
The number of people in the County is projected to have declined from a high of 42,155 in
2010 to a low of 40,791 in 2016 (US Census). The projected linear trend line for the
population is a decline of approximately 235 people per year as depicted in Exhibit 1.
Wyoming County Population.
Should this trend be correct, population loss will continue through 2022 with
approximately 1,400 less people in the County by that time for a projected total
population of 39,300.
The population of Wyoming County is predominantly white. The number of minorities in the
permanent residential population is very small and the accurate measurement of minorities
within the seasonal worker population is challenging. Hence, typical health care disparities
associated with minority populations are not extensively assessed in this report.
Finding: As the population declines, the need for health care services also declines. Yet
this can be offset if high need populations, such as the elderly, actually increase.
3750038000385003900039500400004050041000415004200042500
2010 2011 2012 2013 2014 2015 2016 2017 2018 2019 2020 2021 2022
People Year
Exhibit 1. Projected Trend in Wyoming County Population
People

TRENDS AND IMPACTS
14
Age Groups
A review of estimated changes by major age groups for 2003 through 2014 shows that the
number of people under 54 declined, those 55 to 74 increased and people over 75 showed
little change.
Finding: The large increases in the 55 to 74 years of age population are likely to continue.
This indicates that overall need for services will remain constant as this counterbalances
the overall loss of population.
-40%
-30%
-20%
-10%
0%
10%
20%
30%
40%
50%
Percent
Age Group
Exhibit 2. Projected Changes in Age Groups Between 2003 and 2014
Age Group

TRENDS AND IMPACTS
15
Poverty
Poverty levels among county residents have increased by 434 people from 3,991 in the 2008 to
2012 five-year period to 4,425 in the most recent five year period studied, 2011 to 2015 The
overall percent of people living below poverty has consequently increased from 10.5% to
11.8% for the periods studied or 592 people.
The increase occurred in all age groups, yet those 18 to 64 years of age were least affected.
Poverty rates for the elderly were most affected, going from 6.1% to 8.4%, a 38% increase
over earlier levels.
On the positive side, poverty is far less frequent in Wyoming County than in other Western
New York counties or similar counties in New York State.
Finding: This indicates that there is an increased need for enabling types of services
which have been shown to improve quality of life and population health such as
transportation, nutrition, and social services, especially for the elderly.
0%
2%
4%
6%
8%
10%
12%
14%
16%
18%
Under 18years
Relatedchildrenunder 18
years
18 to 64years
65 yearsand over
Percent of Population
Group
Exhibit 3. Poverty Rates
2011-2015
2008-2012

TRENDS AND IMPACTS
16
Educational Attainment
All levels of educational attainment improved slightly for the five year periods studied. Lower
level educational attainment, i.e., less than 12th grade with no diploma, declined slightly and
high school graduates and bachelor’s degree attainment improved slightly.
Most notably however, people over 25 years of age with low incomes with less than a high
school degree increased by 54%, going from 17.3% to 26.7% in the most recent period studied.
In comparison to other Western New York counties and similar counties in New York State,
Wyoming County’s level of high school graduates compares favorably.
Finding: Economic and educational program needs, such as those provided by enabling
services, have risen for people with low incomes and are expected to continue.
0.0%
10.0%
20.0%
30.0%
40.0%
50.0%
60.0%
70.0%
80.0%
90.0%
100.0%
Less than 9thgrade
9th to 12thgrade, nodiploma
High schoolgraduate or
higher
Bachelor'sdegree or
higher
Less thanhigh schoolgraduate -
BelowPoverty
Percent of People Over
25 Level
Exhibit 4. Educational Attainment
2011-2015
2007-2011

TRENDS AND IMPACTS
17
Births
The actual number of births for the period studied fluctuated from a high of 420 in 2009 to a
low of 369 in 2015. The actual number of live births for 2015 was the low for that period, 369.
Although the actual number of births varied, the trend in live births to Wyoming County
mothers has been declining by approximately 5 live births per year. Should this trend
continue, there will be a projected 340 live births in 2022 to Wyoming County mothers.
Finding: The need for maternity services is declining.
340
350
360
370
380
390
400
410
420
430
2008 2009 2010 2011 2012 2013 2014 2015
Num
ber
Year
Exhibit 5. Live Births
Live Births
Linear (Live Births)

TRENDS AND IMPACTS
18
Deaths
The actual number of deaths for the period studied fluctuated from a high of 398 in 2015 to a
low of 329 in 2009. The actual number of deaths for 2015 was the high for that period, 398.
Although the actual number of deaths varied, the projected trend has been increasing by
approximately 5 deaths per year. Should this trend continue, there will be a projected 410
deaths in 2022 to Wyoming County residents.
Finding: Increased deaths indicate a higher need for grief and bereavement support
services as well as advanced care planning services.
300
320
340
360
380
400
420
2008 2009 2010 2011 2012 2013 2014 2015
Number
Year
Exhibit 6. Deaths
Deaths
Linear (Deaths)

TRENDS AND IMPACTS
19
Births and Deaths
Projected deaths will outpace projected births in the future and contribute to population loss
and reduced need for health care services. Yet, as noted earlier, reduced need for overall
health services will be both gradual and counterbalanced by an increased number of people
between the ages of 55 and 74, who generally require more healthcare, consistent with the
aging process.
300
320
340
360
380
400
420
440
2008 2009 2010 2011 2012 2013 2014 2015
Number
Year
Exhibit 7. Births and Deaths
Births Deaths
Linear (Births) Linear (Deaths)

TRENDS AND IMPACTS
20
Health Care Coverage
More Wyoming County residents have health care coverage than in the past. It is estimated
that the rate of uninsured has declined from 9% of the civilian non-institutionalized
population or 3,439 people in 2012 to 7.7% or 2,760 county residents in 2015. Major increases
were seen in coverage by Medicare and Medicaid while commercial coverage declined over
the period studied.
Finding: Increases in governmental coverage, that is, Medicare and Medicaid, will result in
greater influence of care coordination and other quality of care programs. Those
programs favor evolving value based health care services payment structures which shift
payment for services from how much care is provided to how much good care is provided.
7
7.5
8
8.5
9
9.5
2012 2013 2014 2015
Percent Uninsured
Civilian Population
Year
Exhibit 8. Uninsured Rate
Uninsured Rate

TRENDS AND IMPACTS
21
ii. Factors affecting births
Fertility Ratios
The all ages or overall fertility ratio, i.e., the number of live births per 1,000 female
population 15-44, has been very similar over the years studied. Yet, fertility ratios for specific
age groups are declining with the exception of women 25 to 29. The county’s fertility ratio
for 2014, 153 live births per 1,000 women 25 to 29, was the highest for both the Western New
York region and similar New York State counties.
Finding: Maintaining existing levels of reproductive health services are needed.
20
40
60
80
100
120
140
160
2008 2009 2010 2011 2012 2013 2014 2015
Fertility Ratio Year
Exhibit 9. Higher Fertility Ratios
20-24
25-29
30-34
All Ages
Linear (20-24)
Linear (25-29)
Linear (30-34)
Linear (All Ages)
20
40
60
80
100
120
140
160
2008 2009 2010 2011 2012 2013 2014 2015Fertility Rate Year
Exhibit 10. Lower Fertility Ratios
18-19
35-39
All Ages
Linear (18-19)
Linear (35-39)
Linear (All Ages)

TRENDS AND IMPACTS
22
Teen Pregnancy
The actual number of teen pregnancies and the teen pregnancy rate has been declining for
the period studied with the number of teen pregnancies reduced by more than 50%. The
county’s teen pregnancy rate for 2015 was among the lowest of counties in Western New York
and similar counties in New York State.
Finding: Existing levels of programming in reproductive health, parenting skills and health
literacy should be continued in the county to help maintain these low (good) rates.
10
15
20
25
30
35
40
45
2008 209 2010 2011 2012 2013 2014 2015
Rate per 1000 women
15 to 19 or number of
live births
Year
Exhibit 11. Teen Pregnancy Rate and Number of Births
Rate
Number
Linear (Rate)
Linear (Number)

TRENDS AND IMPACTS
23
Out of Wedlock Births
The number of out-of-wedlock births has fluctuated over the period studied, going from a low
of 122 to a high of 164. For 2015, there were 140 out of wedlock births and the overall trend
for the period studied is increasing moderately but unremarkably.
Recognizing that the number of births is declining and the number of out-of-wedlock births is
relatively stable, out-of-wedlock births percentages of total births by age group are
increasing for all age groups, especially women in the 25 to 29 age group. The rate for that
age group went from 18% of all live births in 2008 to 34% in 2015. For 2015, this rate was
among the highest compared to Western New York counties and similar counties in New York
State.
Finding: The need for support services for single moms in the 25 to 29 age group is
increasing.
0%
10%
20%
30%
40%
50%
60%
70%
80%
90%
100%
2008 2009 2010 2011 2012 2013 2014 2015
Percent of OOW Births of Live Births by Age
Group
Exhibit 12. Out of Wedlock (OOW) Birth Rates by Age of Mother
18-19
20-24
25-29
30-34
35-39
Total
Linear (20-24)
Linear (25-29)
Linear (Total)

TRENDS AND IMPACTS
24
Births to women and families with low incomes who are Medicaid program eligible have risen
during the period studied, going from 118 births in 2008 to 144 births in 2015. Conversely,
births to women and families with commercial insurance coverage have declined, going from
262 in 2008 to 202 in 2015. Rather than changes in income, this pattern is considered to be
related to increased access to Medicaid related programs through changes in eligibility
requirements.
These statistics, that is the percent of coverage related to Medicaid and private insurance,
compare very favorably to other counties in the Western New York region and to similar
counties in New York State and are among the best rates for those counties for 2015.
Finding: Although Medicaid related coverage rates for live births are increasing, they are
comparatively low. Health care and enabling services for low income families with young
children should be maintained at least at current levels.
30%
35%
40%
45%
50%
55%
60%
65%
70%
2008 2009 2010 2011 2012 2013 2014 2015
Percent of all live births
Year
Exhibit 13. Low Income Births
Medicaid Related
Private Insurance
Linear (MedicaidRelated)
Linear (PrivateInsurance)
Low Income Mothers

TRENDS AND IMPACTS
25
Rates for access to prenatal care during the first three months of pregnancy have fluctuated
over the period studied. They have improved slightly for women between 25 and 34 years of
age and declined slightly for women between 20 and 24 years of age. The linear trend has
improved by approximately 5% for women 25 to 34 and declined by approximately 7% for
women 20 to 24 years of age.
These rates compare very favorably with Western New York counties and similar counties in
New York State.
Finding: Programs designed to encourage access to prenatal care for women 20 to 24
should be expanded.
60
65
70
75
80
85
90
95
2008 2009 2010 2011 2012 2013 2014 2015
Percent Mothers
by Age Group
Year
Exhibit 14. Early Prenatal Care
20-24
25-34
35+
Linear (20-24)
Linear (25-34)
Linear (35+)
Prenatal Care

TRENDS AND IMPACTS
26
iii. Major Illnesses
All Causes of Death
The number of deaths of Wyoming County residents has fluctuated over the period studied,
going from a low of 329 in 2009 to a high of 398 for 2015. The most current number noted for
2015 was 398. The age/sex adjusted death rate has fluctuated accordingly, ranging from a
low of 702 deaths per 100,000 population in 2009 to a high of 799 deaths per 100,000 people
in 2015.
The corresponding trend lines depict an increase in both deaths and death rates over the
period studied, implying that in the future, deaths of Wyoming County residents will continue
to increase.
300
400
500
600
700
800
2008 2009 2010 2011 2012 2013 2014 2015
Number of Deaths or Rate per 100,000
Year
Exhibit 15. All Causes of Death: Number and Rate
Deaths
Age/Sex Adj. Rate
Linear (Deaths)
Linear (Age/Sex Adj. Rate)

TRENDS AND IMPACTS
27
Wyoming County’s age/sex adjusted death rates have been similar to WNY county rates for the past twelve years. However, the County’s death rate compares poorly, that is, has been among the highest 25% of similar counties in the state.
Finding: Death rates for Wyoming County residents have increased over the past eight years. Recently, death rates for the County are high in comparison to similar counties in New York State.
20
30
40
50
60
70
80
90
100
04 to 06 07 to 09 10 to 12 13 to 15
PercentileStanding
3 Year Average
Exhibit 16. All Causes of Death Rate Comparisons
WNY Counties
Similar NYSCounties
Linear (WNYCounties )
Linear (SimilarNYS Counties )

TRENDS AND IMPACTS
28
iii. Major Illnesses – Major causes of death
Diseases of the Heart
The number of deaths due to diseases of the heart of Wyoming County residents has
fluctuated over the period studied, ranging from a low of 69 in 2015 to a high of 100 for 2008.
The age/sex adjusted death rate has fluctuated accordingly, from a low of 153 deaths per
100,000 population in 2011 to a high of 210 deaths per 100,000 people in 2008. The most
current rate for 2015 was 178 deaths per 100,000 people.
Over the eight-year period studied, the linear trend for both deaths and the death rate has
been declining with the age/sex adjusted death rate declining by approximately 20%. If this
trend continues in the future, heart disease may continue to decline among county residents.
0
50
100
150
200
250
2008 2009 2010 2011 2012 2013 2014 2015
Number of Deaths or
Rate per 100,000
Year
Exhibit 17. Diseases of the Heart
Deaths
Age/Sex Adj.Rate
Linear(Deaths)
Linear(Age/Sex Adj.Rate)

TRENDS AND IMPACTS
29
The County’s death rate for heart disease has been and continues to be unremarkable in comparison to other Western New York counties and similar counties in New York State.
Finding: If the downward trend in heart disease deaths continues, fewer county residents will die from heart disease in the future.
2025303540455055606570
04 to 06 07 to 09 10 to 12 13 to 15
Percentile Standing
3 Year Average
Exhibit 18. Heart Disease Death Rate Comparisons
WNY Counties
Similar NYSCounties
Linear (WNYCounties )
Linear (SimilarNYS Counties )

TRENDS AND IMPACTS
30
Cancer
The number of deaths of Wyoming County residents due to cancer has fluctuated over the
period studied, from a low of 73 in 2011 to a high of 96 for 2015. The age/sex adjusted death
rate has fluctuated accordingly going from a low of 144 deaths per 100,000 population in 2011
to a high of 197 deaths per 100,000 people in 2009. The most current rate for 2015 was 186
deaths per 100,000 people. Over the eight year period studied, the linear trend for both
deaths and the death rate has been steady and unremarkable.
The County’s death rate for cancer has been and continues to be unremarkable in comparison to other Western New York counties and similar counties in New York State.
Finding: Cancer will continue to be a major cause of death of Wyoming County residents and may displace diseases of the heart as the number one cause of death in the future.
0
50
100
150
200
250
2008 2009 2010 2011 2012 2013 2014 2015
Number of Deaths or
Rate per 100,000
Year
Exhibit 19. Cancer
Deaths
Age/Sex Adj.Rate
Linear(Deaths)
Linear(Age/SexAdj. Rate)
40
50
60
70
80
90
04 to 06 07 to 09 10 to 12 13 to 15
Percentile Standing
3 year Average
Exhibit 20. Cancer Death Rate Comparisons
WNY Counties
Similar NYS Counties
Linear (WNY Counties )
Linear (Similar NYSCounties )

TRENDS AND IMPACTS
31
Chronic Lower Respiratory Disease
The number of deaths of Wyoming County residents due to chronic lower respiratory disease
has fluctuated over the period studied, going from a low of 20 in 2009 to a high of 30 for
2015. The age/sex adjusted death rate has changed accordingly, from a low of 45 deaths per
100,000 population in 2009 to a high of 62 deaths per 100,000 people in 2014. The most
current rate for 2015 was 60 deaths per 100,000 people. Over the eight-year period studied,
the linear trend for both deaths and the death rate has steadily increased and is now the
third highest cause of death of county residents.
The County’s death rate for chronic lower respiratory disease had been unremarkable in
comparison to other Western New York counties and similar counties in New York State. Yet
most recently, it is among the highest counties for both comparison groups.
0
10
20
30
40
50
60
70
2008 2009 2010 2011 2012 2013 2014 2015
Number of Deaths orRate per100,000
Year
Exhibit 21. Chronic Lower Respiratory Disease
Deaths
Age/SexAdj. Rate
Linear(Deaths)
Linear(Age/SexAdj. Rate)

TRENDS AND IMPACTS
32
Finding: Chronic lower respiratory disease has steadily increased as a major cause of
death of Wyoming County residents. The most current rates for the last six years have
been high in comparison to both Western New York counties and similar counties in New
York State.
30
40
50
60
70
80
90
100
04 to 06 07 to 09 10 to 12 13 to 15
Percentile Standing
3 Year Average
Exhibit 22. Chronic Lower Respiratory Disease Death Rate Comparisons
WNYCounties
Similar NYSCounties
Linear (WNYCounties )
Linear(Similar NYSCounties )

TRENDS AND IMPACTS
33
Cerebrovascular Disease
The number of deaths due to cerebrovascular disease of Wyoming County residents has fluctuated over the period studied, going from a low of 12 in 2008 to a high of 25 for 2011. The age/sex adjusted death rate has changed accordingly, from a low of 26 deaths per 100,000 population in 2008 to a high of 54 deaths per 100,000 people in 2008. The most current rate for 2015 was 38 deaths per 100,000 people. Over the eight-year period studied, the linear trend for both deaths and the death rate has been increasing by approximately 40%. If this trend continues in the future, deaths due to cerebrovascular disease will increase. The County’s death rate for cerebrovascular disease peaked in 2011 and fluctuated since that time.
Finding: Cerebrovascular disease deaths have steadily increased as a major cause of death of Wyoming County residents. Recently, the trend line has been high in comparison to similar counties.
0
10
20
30
40
50
60
2008 2009 2010 2011 2012 2013 2014 2015
Number of Deaths or
Rate per
100,000
Year
Exhibit 23. Cerebrovascular Disease Deaths
Deaths
Age/SexAdj. Rate
Linear(Deaths)
Linear(Age/SexAdj. Rate)
30
40
50
60
70
80
90
100
04 to 06 07 to 09 10 to 12 13 to 15
Percentile Standing
3 Year Average
Exhibit 24. Cerebrovascular Disease Death Rate Comparisons
WNYCounties
Similar NYSCounties
Linear (WNYCounties )

TRENDS AND IMPACTS
34
Accidents – All Causes
The number of accidental deaths of Wyoming County residents has fluctuated over the period
studied, going from a low of 5 in 2009 to a high of 25 for 2015. The age/sex adjusted death
rate has varied accordingly, going from a low of 11 deaths per 100,000 population in 2009 to a
high of 52 deaths per 100,000 people in 2015.
Over the eight-year period studied, the linear trend for both deaths and the death rate has
increased by over 100%. If this trend continues in the future, deaths due to all types of
accidents will increase.
For the most recent three-year period studied, death rates are high for both Western New York and similar counties.
0
10
20
30
40
50
60
2008 2009 2010 2011 2012 2013 2014 2015
Number of Deaths or Rate per 100,000
Year
Exhibit 25. All Accidental Deaths
Deaths
Age/SexAdj. Rate
Linear(Deaths)
40
50
60
70
80
90
04 to 06 07 to 09 10 to 12 13 to 15
Percentile Standing
3 Year Average
Exhibit 26. All Accidental Death Rate Comparisions
WNY Counties
Similar NYSCounties

TRENDS AND IMPACTS
35
Finding: The gradual rise in all accidental deaths should be examined by different causes
of accidental death to determine if accident prevention programs should be expanded and
target specific causes.
The remainder of this page intentionally left blank.

TRENDS AND IMPACTS
36
Diabetes
The number of deaths of Wyoming County residents for diabetes has varied over the period
studied, ranging from a low of 11 in 2008 to a high of 15 for 2011. The most current number
for 2015 was 11, consistent with the low of 2008. The age/sex adjusted death rate has
fluctuated, from a low of 23 deaths per 100,000 population in 2008/2015 to a high of 30
deaths per 100,000 people in 2011. The linear trend line for both the number of deaths and
age/sex adjusted death rate are flat, indicating no substantive change over the time period
studied.
However, the County’s death rate compares poorly, i.e., has been among the highest 25% of
Western New York counties and similar counties in the state for most of the three year
periods studied. . For the most recent three-year period, the rate has dropped and is now
unremarkable in comparison to Western New York counties.
0
5
10
15
20
25
30
35
2008 2009 2010 2011 2012 2013 2014 2015
Number of Deaths orRate per100,000
Year
Exhibit 27. Diabetes Death Rates
Deaths
Age/Sex Adj.Rate
Linear (Deaths)
Linear (Age/SexAdj. Rate)

TRENDS AND IMPACTS
37
Finding: The most recent decline in diabetes deaths for 2015 for Wyoming County
residents may be indicative of increased comprehensive care and care coordination
programs for this disease. These services should be continued.
60
65
70
75
80
85
90
95
100
04 to 06 07 to 09 10 to 12 13 to 15
Percentile Standing
3 Year Average
Exhibit 28. Diabetes Death Rate Comparisons
WNY Counties
Similar NYSCounties
Linear (WNYCounties )
Linear (SimilarNYS Counties )

TRENDS AND IMPACTS
38
Pneumonia
The number of deaths of Wyoming County residents due to pneumonia has changed over the
period studied, ranging from a low of 4 in 2009 to a high of 10 for 2010. The most current
number for 2015 was 7. The age/sex adjusted death rate has varied accordingly, from a low
of 10 deaths per 100,000 population in 2009 to a high of 21 deaths per 100,000 people in
2010. The most current rate for 2015 was 15 deaths per 100,000 people.
The trend line shows that the number of deaths has increased but the age/sex adjusted rate
is mostly unchanged for the period studied. Wyoming County age/sex adjusted death rates
have been similar to both county comparison groups for the past twelve years.
Finding: No significant finding.
0
5
10
15
20
25
2008 2009 2010 2011 2012 2013 2014 2015
Number of Deaths orRate per 100,000
Year
Exhibit 29. Pneumonia Deaths
Deaths
Age/SexAdj. Rate
Linear(Deaths)
Linear(Age/SexAdj. Rate)
0
10
20
30
40
50
60
70
80
04 to 06 07 to 09 10 to 12 13 to 15
Percentile Standing
3 Year Average
Exhibit 30. Pneumonia Death Rate Comparisons
WNY Counties
Similar NYSCounties
Linear (WNYCounties )
Linear (SimilarNYS Counties )

TRENDS AND IMPACTS
39
All other causes
The number of deaths of Wyoming County residents for all other causes has fluctuated over the period studied, ranging from a low of 95 in 2009 to a high of 119 for 2010. The most current number for 2015 was 118. The age/sex adjusted death rate has varied accordingly, from a low of 204 deaths per 100,000 population in 2009 to a high of 249 deaths per 100,000 people in 2010. The most current rate for 2015 was 248 per 100,000 people.
The trend line for both the number of deaths and age/sex adjusted death rates has increased by approximately 10% over the period studied. These increases are consistent with the increase in the overall deaths and death rates for all causes. Wyoming County age/sex adjusted death rates have been similar to WNY county rates for the past twelve years in most cases. The rate for the last three-year period is high, however, in comparison to similar counties in New York State.
Finding: High rates of other causes of death can contribute to lower rates for the major
causes of death but further examination is considered to be unwarranted
50
100
150
200
250
300
2008 2009 2010 2011 2012 2013 2014 2015
Number of Deaths orRate per 100,000
Year
31. All Other Causes of Death
Deaths
Age/SexAdj. Rate
Linear(Deaths)
30
40
50
60
70
80
90
04 to 06 07 to 09 10 to 12 13 to 15
PercentileStanding
3 Year Average
Exhibit 32. All Other Causes of Death Rate Comparisons WNY Counties
Similar NYSCounties
Linear (WNYCounties )
Linear(Similar NYSCounties )

TRENDS AND IMPACTS
40
Opioid Abuse
Opioid Abuse has become a major problem in many communities throughout the nation.
Health services use by Wyoming County residents also shows an alarmingly increasing trend in
opioid related problems. Both hospital emergency room and inpatient use by Wyoming County
residents has increased from 14 people in 2010 to 39 people in 2015, an increase of 25 people
or 179%.
This increase varies by type of patient, with Medicare patients experiencing the highest
increase between 2014 and 2015. This increase occurred in the use of hospital inpatient
services, going from 6 in 2014 to 14 in 2015, an increase of 8 discharges or 133%. Medicaid
patient use has also increased between 2014 and 2015 but the increase was for hospital
emergency room visits, going from 8 in 2014 to 11 visits in 2015, an increase of 3 ER visits or
38%. Type of health care coverage analysis also showed that people covered by commercial
insurance was high in 2010 but remained comparatively unchanged to people with other types
of coverage.
0
5
10
15
20
25
30
35
40
45
2010 2011 2012 2013 2014 2015
Visits or Discharges
Year
Exhibit 33. ER and Inpatient Use for Opioid Abuse - Wyoming County Residents
Medicare
Medicaid
Commercial
Other

TRENDS AND IMPACTS
41
Death rates for both opioid and opioid pain medication abuse are similar to western New York
and similar rural county rates. The county’s recent high rate for Neonatal Abstinence Syndrome
(NAS), which occurs to infants born to women using legal or illegal opiates, includes
hypersensitivity and hyperirritability, tremors, vomiting, respiratory difficulties, poor sleep,
and low-grade fevers should be examined more closely.
On the positive side of the challenge is the county’s very low use of pain medication, 524
prescriptions per 100,000 people (adjusted rate), in comparison to other counties in the region
and similar counties in the state. Pain medication prescriptions for drugs such as oxycodone,
hydrocodone, codeine, morphine, and fentanyl are declining due to greater recognition of the
problem. For Wyoming County, the number of opioid prescriptions has declined from 26,634 in
2014 to 23,926 in 2016, a reduction of approximately 10%. Even though prescription rates are
declining, substitution of street drugs such as heroin for prescription pain medication, is
increasing due to heroin’s low cost and availability.
Finding: Opioid Abuse is increasing in the county. The development of additional
intervention program capacity should be considered.

TRENDS AND IMPACTS
42
b. Do the elderly and disabled have special needs in terms of types ofillnesses, use of hospital services and cost of care?
i. Key Concepts
ii. Prevalence of Chronic Illnesses
iii. Preventable Use of Hospital Inpatient Services
iv. Use of Hospital Emergency Department Services
v. Cost of Care
I. Key Concepts
This analysis relies on Medicare services use data for all Wyoming County residents regardless
of where care is provided. It is unique because it covers virtually all major types of services
and service providers, not just those located in the county. Services included are Inpatient,
Skilled Nursing Facility (SNF), Hospice, Home Health Agency, Outpatient (including emergency
room care), Carrier (physician/supplier) and Durable Medical Equipment (DME).i As such, it is
a comprehensive picture of service needs, use and costs of care for that group of people.
The period studied is 2012 through 2014 and most data is presented as a rate of use or share
within a segment of the Medicare covered population. It covers fee-for-service “original”
Medicare patients only and does not include the elderly or disabled enrolled in Medicare
Advantage managed care plans, offered by private insurance companies approved by
Medicare.
For Wyoming County, this means that the data covers 48% of all Medicare eligible consumers.
For the period of the study, this amounts to 3,716 Wyoming County residents or
approximately 48% of the 7,714 people covered by Medicare. This original Medicare rate was
identical to the rate for Western New York counties and lower than the rate for similar
counties. Similar counties had a rate of 59% of Medicare eligible people covered by fee-for-
service original Medicare. This difference indicates that more people in Western New York
and Wyoming County are enrolled in Medicare Advantage managed care plans than similar
rural counties in New York State. More recent data for 2017 shows that the original Medicare
coverage rate for Wyoming County residents has declined to 46% and Medicare Advantage
(MA) enrollment in Wyoming County has increased to 54%. These rates are depicted in Exhibit
34. Medicare Coverage Enrollment by Type – Wyoming County.

TRENDS AND IMPACTS
43
Data and analyses are also presented on the original Medicare population alone and on “dual
eligibles,” who are people covered by both Medicare and Medicaid due to low incomes. As
noted earlier in this report, this is an important distinction because it provides a vivid picture
in many instances of the higher needs of the elderly and disabled with low incomes,
especially those with chronic illnesses. So-called health care enabling services such as
transportation, housing, medical equipment needs, and nutritional programs are usually
highly needed by this “dual eligible” group of people, given their income constraints.
II. Prevalence of Chronic Illnesses
Prevalence is a technical term used to describe the amount of illness in a community. It is
sometimes an imprecise measure because in order for the illness to be counted or reported,
someone has to record it. Additionally, some people with illnesses are not aware of their
specific illness until they see a health care provider and are diagnosed. The measure of
prevalence used in this study is very valid because it covers 20 chronic disease diagnoses
0%
10%
20%
30%
40%
50%
60%
70%
80%
90%
100%
2010 2012 2014 2016 2017
Percent of Enrollees
Year
Exhibit 34. Medicare Coverage Enrollment by Type - Wyoming County
Medicare Advantage
Original Medicare

TRENDS AND IMPACTS
44
made by all types of health care providers. It is not based solely on a particular provider or
health care institution, but covers all providers regardless of where the diagnosis was made.
Hence there are more opportunities for illness identification and diagnosis than one visit to a
practitioner. The prevalence rate of a condition for a specific sub-population is the proportion
of beneficiaries who are found to have the condition.
These chronic conditions are also analyzed in terms of the complexity of the beneficiaries’
health care needs by assessing how many beneficiaries have zero, 1, 2, or 3+ chronic
conditions. The number of chronic conditions indicates overall health and need for and use of
health care services. The prevalence rate of a condition or a number of conditions for a
specific sub-population is the proportion of beneficiaries who are found to have the condition
or number of conditions.
The data shows that dual eligibles are sicker than other Medicare enrollees. Very few – only
16% of dual eligibles – do not have at least 1 chronic condition, compared to 26% of people
with only Medicare coverage. Conversely, 56% of dual eligibles have at least three chronic
conditions compared to 47% of Medicare only enrollees. Rates of chronic illnesses for 1 or 2
conditions are very similar for both groups. This data also shows how pervasive multiple
chronic diseases or poor health is in the Medicare only population. As noted, almost one of
two Medicare only enrollees, 47%, has at least three chronic diseases. This also sheds light on
the complexity of providing health care services when numerous diseases need to be
monitored and treated by specialists and primary care practitioners and the overwhelming
importance of care coordination.
Exhibit 35. Conditions by Type of Medicare Beneficiary in Wyoming County depicts a series of
data which illustrate the major difference between Medicare patients and Medicare patients
with low incomes and their chronic care needs. From the low health care needs perspective,
one out of four Medicare beneficiaries or 26% had no chronic condition for the period studied
and are comparatively healthy but only one out of six or 17% of dual eligibles had no chronic
conditions and are comparatively healthy. From the high health care needs and illnesses
perspective, 47% of Me3dicare beneficiaries and 56% of dual eligible beneficiaries have at
least three chronic conditions. From purely an income perspective, this means that people
with lower incomes are much sicker than people with higher incomes. Their need for
comprehensive care and care coordination underscores their need for enabling services which
improve access to such services. It is interesting to note, however, that the rates for these
two populations do not significantly differ for one or two chronic conditions.

TRENDS AND IMPACTS
45
Of the twenty chronic conditions measured, ten affected at least 10% of the Medicare
population. Two types of heart disease had the highest rates: hypertension (high blood
pressure)
and hyperlipidemia (high cholesterol), 55% and 41% respectively. Diabetes, ischemic heart
disease (coronary artery blockage) and arthritis had rates between 20% and 29%. Depression,
chronic obstructive pulmonary disease (lung disease), heart failure, chronic kidney disease,
and obesity had rates between 10% and 19%. Rates were noticeably higher for those people
with dual eligible status for six of the ten conditions, with major differences occurring for
chronic obstructive pulmonary disease (100% higher), depression (94% higher), obesity (56%
higher), heart failure (47% higher), diabetes (23% higher) and chronic kidney disease (19%
higher). Exhibit 36 displays these findings.
10
15
20
25
30
35
40
45
50
55
60
2012 2013 2014 3YR AVG.
Rate per 100 beneficiaries
Exhibit 35. Conditions by Type of Medicare Beneficiary in Wyoming County
Dual: No Chronic Condition Medicare: No Chronic Condition
Dual: 1 Chronic Condition Medicare: 1 Chronic Condition
Dual: 2 Chronic Conditions Medicare: 2 Chronic Conditions
Dual: 3+ Chronic Conditions Medicare: 3+ Chronic Conditions
TRENDS AND IMPACTS
46
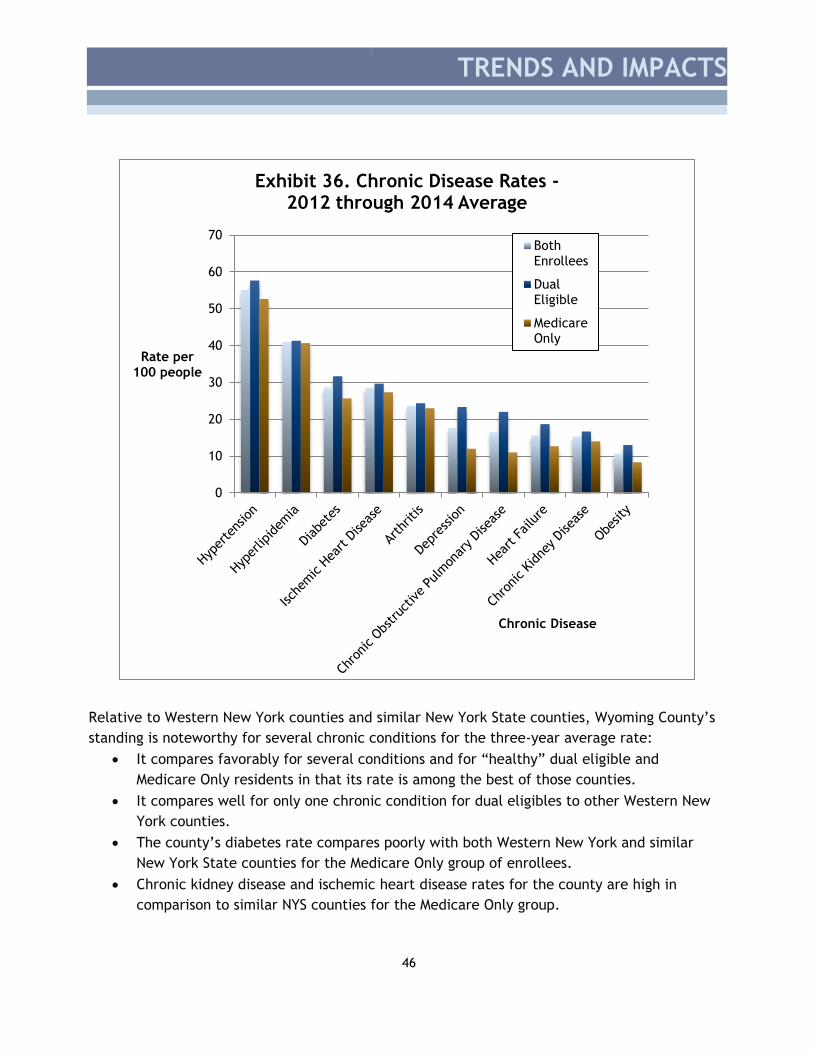
Relative to Western New York counties and similar New York State counties, Wyoming County’s
standing is noteworthy for several chronic conditions for the three-year average rate:
It compares favorably for several conditions and for “healthy” dual eligible and
Medicare Only residents in that its rate is among the best of those counties.
It compares well for only one chronic condition for dual eligibles to other Western New
York counties.
The county’s diabetes rate compares poorly with both Western New York and similar
New York State counties for the Medicare Only group of enrollees.
Chronic kidney disease and ischemic heart disease rates for the county are high in
comparison to similar NYS counties for the Medicare Only group.
0
10
20
30
40
50
60
70
Rate per 100 people
Chronic Disease
Exhibit 36. Chronic Disease Rates -2012 through 2014 Average
BothEnrollees
DualEligible
MedicareOnly

TRENDS AND IMPACTS
47
Finding: Noteworthy high diabetes rates are consistent with many other findings in the past
for the county. Yet the rates were not remarkable for dual eligibles, indicating a pervasive
population based pattern versus one related to low income factors.
III. Preventable use of hospital inpatient services
The use of hospital inpatient services for the original Medicare and dual eligible populations
improved, i.e., declined for most preventable and chronic conditions but recently increased
for acute preventable conditions. The overall preventable composite rate declined from -
5,542 discharges per 1000 beneficiaries in 2012 to 4,724 discharges in 2014 and the chronic
composite rate declined from 3,557 discharges in 2012 to 2,558 in 2014.-The acute composite
rate increased slightly and the decline in the overall and chronic rates are viewed to be
indicative of an improved primary care capacity for the original Medicare population.
0
1000
2000
3000
4000
5000
6000
2012 2013 2014
Age/sex Adjusted Rate
per 1000 beneficiaries
Year
Exhibit 37. Preventable Inpatient Hospitalizations
Overall Composite Chronic Composite Acute Composite

TRENDS AND IMPACTS
48
Relative to Western New York counties and similar New York State counties, Wyoming
County’s standing is noteworthy for several preventable conditions for the 2014 rate, but
none of the three-year rates were remarkable. For 2014, it compares poorly for the acute
composite, urinary tract and chronic obstructive pulmonary disease/adult asthma rates.
Although the overall composite rate is declining, it is high for Western New York.
Finding: Although apparently improving, expanded availability of primary and preventive
health care services for preventable conditions should be explored.
IV. Use of hospital emergency department services
The level of hospital emergency department use is seen as an indicator of the need for
improved access to primary care and preventive health services. The emergency department
use rates for the high need, 3+ Conditions, dual eligible group are much higher than the high
need Medicare Only population. The three-year average rate for the dual eligible is
approximately 75% higher. This again is expected because of the problems with access to care
that people with low incomes experience.
0
200
400
600
800
1000
1200
1400
1600
1800
2012 2013 2014 3 Year Avg.
Rate per 1,000
enrollees
Year
Exhibit 38. Hospital Emergency Department Visits - 3+ Conditions
3+ Claims-Based Condition - Dual Eligible
3+ Claims-Based Condition - Medicare Only

TRENDS AND IMPACTS
49
Moderate and low need populations, i.e., those with 1 or 2 conditions, have much lower use
rates. Again, dual eligibles have higher use rates than the Medicare Only population.
From the Western New York and similar county comparative basis, the only noteworthy
finding is that the Medicare Only low need group (1 condition) three-year average rate for
Wyoming County is high for Western New York counties.
Finding: Emergency room use rates for both these populations are increasing but
unremarkable in most instances.
0
50
100
150
200
250
300
350
400
450
2012 2013 2014 3 Year Avg.
Rate per 1,000 enrolles
Year
Exhibit 39. Hospital Emergency Department Visits -1 or 2 Conditions
2 Claims-Based Condition - Dual Eligible
2 Claims-Based Condition - Medicare Only
1 Claims-Based Condition - Dual Eligible
1 Claims-Based Condition - Medicare Only

TRENDS AND IMPACTS
50
V. Cost of care
Total costs for all covered health care services, as one would expect, differ substantially by
level of chronic care need and income level of enrollee or beneficiary. Costs for care used in
this study refer to “risk-adjusted” costs, which are based on the complexity of the
beneficiary’s medical problem and corresponding health care needs. Hence, comparisons with
other diseases or counties are more valid than comparisons based on costs or rates which
treat all patients equally regardless of the complexity of their illness.
Costs included are: Inpatient, Skilled Nursing Facility (SNF), Hospice, Home Health Agency,
Outpatient (including emergency room care), Carrier (physician/supplier) and Durable Medical
Equipment (DME).
The three-year average risk-adjusted annual cost for care ranges from $4,399 for Medicare
Only enrollees with no chronic conditions to $16,801 for dual eligible individual with 3
conditions. Cost of care increases by income level, that is, low income level, and number of
chronic conditions.
$-
$2,000
$4,000
$6,000
$8,000
$10,000
$12,000
$14,000
$16,000
$18,000
3 Year AverageAnnual Risk
Adjusted Cost
Exhibit 40. Medicare Annual Costs by Type of Eligible and Chronic Condition
No Condition - Medicare Only No Condition - Dual Eligible
1 Condition - Medicare Only 1 Condition - Dual Eligible
2 Conditions - Medicare Only 2 Conditions - Dual Eligible
3+ Conditions - Medicare Only 3+ Conditions - Dual Eligible

TRENDS AND IMPACTS
51
Wyoming County residents’ risk-adjusted costs for care are noteworthy in several instances.
Changes in costs between 2012 and 2014 vary by type and chronic care need. The largest cost
increases were for dual eligibles with 1 or 2 chronic conditions, 16 and 21%, respectively.
Other populations increases were below 7% and the percent change for the highest need
group, dual eligible with 3+ conditions, was actually a reduction, -8%.
Wyoming costs compare very favorably to Western New York counties for dual eligibles,
having low expected costs for beneficiaries with no chronic condition, 1 or 3 chronic
conditions and for seven of the ten high prevalence conditions. Comparisons for dual eligibles
to similar counties in New York State had similar findings for several chronic conditions.
-10%
-5%
0%
5%
10%
15%
20%
25%
Percent Change
Percent Change 2012 versus 2014
Exhibit 41. Percent Change in Medicare Annual Cost by Type of Eligible and
Chronic Condition
No Condition - Medicare Only No Condition - Dual Eligible
1 Condition - Medicare Only 1 Condition - Dual Eligible
2 Conditions - Medicare Only 2 Conditions - Dual Eligible
3+ Conditions - Medicare Only 3+ Conditions - Dual Eligible

TRENDS AND IMPACTS
52
Medicare Only comparisons with Western New York counties were markedly different
however, with high risk-adjusted costs for beneficiaries with 2 or 3+ conditions, and for two
chronic conditions: chronic obstructive pulmonary disease and obesity. Comparisons to rural
NYS counties were similar for pulmonary disease and obesity: both high, but low for Medicare
beneficiaries with no condition or 2 conditions.
Expected annual costs vary by type of chronic condition and type of beneficiary.
Hyperlipidemia (high cholesterol) and other medical problems, had the lowest cost of care,
approximately $11,657 for Medicare Only and $15,069 for dual eligible. The highest costs for
care were for beneficiaries with heart failure and other medical problems, approximately
$23,181 for Medicare Only and $25,233 for dual eligible.
$-
$2,000
$4,000
$6,000
$8,000
$10,000
$12,000
$14,000
$16,000
$18,000
$20,000
Risk Adjusted
Total Annual
Cost
Exhibit 42. Chronic Conditions Severity by Costs and Type of Coverage - 3-Year Average Wyoming
County
Wyoming County Western NY Similar NYS Co.

TRENDS AND IMPACTS
53
Findings:
Data on the costs of care for different levels of needs and chronic diseases clearly
reflects the impact of chronic disease on Medicare premiums and the importance
of preventive health care services as a mechanism to reduce costs and improve
quality of life.
The need for, use and cost of health care services by Medicare enrollees indicates
selected improvements in primary and preventive health care services capacity in
the area.
Decreasing costs of care for the high need difficult to treat population are
encouraging.
$-
$5,000
$10,000
$15,000
$20,000
$25,000
$30,000
Risk Adjusted
Total Annual
Cost
Chronic Condition
Exhibit 43. Chronic Condition Medicare Costs - 3-Year Average - Wyoming County
Medicare Only
Dual Eligible

TRENDS AND IMPACTS
54
c. What have been the impacts of Thiel Funded projects?
i. Guiding principles
Several key principles have guided the Thiel Fund grant making process administered by the
Community Foundation for Greater Buffalo. First and foremost is the principle of balance.
Over the past twenty years, health experts have more widely recognized that comprehensive
systems of health care services are needed to foster community health. This includes a
system of coordinated promotive, preventive, diagnostic, curative, rehabilitative, and
palliative health care services. The overall effectiveness of health care is often linked to care
provided by multiple organizations and health care providers, rather than an individual
organization or practitioner. This is especially true for chronic medical problems which
require a wide variety of services over the life of the individual. As noted in the Medicare
analysis, approximately 50% of people covered by Medicare in Wyoming County have at least 3
chronic illnesses.
The Thiel grants funding model, supported by the Wyoming County community through the
extensive involvement of county residents on the Wyoming County Roundtable, is predicated
on a “systems” or balanced approach to service development rather than concentrating on a
specific disease or component of the health care system.
Three categories of projects were funded:
Health Care Services
Enabling Health Care Services necessary to assure access to needed services
Infrastructure, such as public health, equipment, facilities, and health care personnel
An additional consideration was the principle that successful solutions in Wyoming County
require participants who are heavily vested in Wyoming County, such as the organizations
represented on the Wyoming County Health Care Roundtable. Thiel Fund Advisory Councils
convened by the Community Foundation made recommendations on the types of projects.
These principles are represented in Exhibit 44.

TRENDS AND IMPACTS
55
Exhibit 44. Local Providers Working Hand-in-hand to
Address Complex Community Health Needs.
ii. Funding levels
Eight organizations were awarded a total of 52 grants amounting to over $2.96M for the nine
funding cycles (2007 through 2015/2016). Projects were also supported by other sources of
funding. Over the five-year period studied, the Infrastructure – Equipment Component was
awarded 46% of Thiel funds, Enabling Services received 26% of funds, Services Expansion
received 20% of funds and Infrastructure – Recruitment, Retention, and Training received 7%
of Thiel funds. Proportions by year are depicted in Exhibit 45.
0%
10%
20%
30%
40%
50%
60%
70%
80%
90%
100%
2011-2012 2012-2013 2013-2014 2014-2015 2015-2016 5 Year Avg.
Percent of
Funding
Funding Period
Exhibit 45. Funding Level by Component
Enabling Health Services
Infrastructure - Equipment
Infrastructure - Recuitment, retention, training
Service Expansion

TRENDS AND IMPACTS
56
Two county agencies and six not-for-profit organizations received funding during that period.
These are listed below by component.
Enabling Services
o Crossroads House, Batavia, NY
o Geneseo Migrant Center, Leicester, NY
o Wyoming County Community Action, Perry, NY
Infrastructure – Equipment
o Oak Orchard Health Community Health Center, Warsaw, NY
o Wyoming Community Hospital Foundation, Warsaw, NY
o Wyoming County Office of Emergency Services, Warsaw, NY
Infrastructure – Recruitment, retention, training
o Western New York Rural Area Health Education Center, Warsaw, NY
Services Expansion
o Spectrum Human Services, Orchard Park, NY
iii. Services
As noted earlier, the Thiel approach to funding favored the development of a comprehensive
array of services rather than concentrating on a particular illness or type of service. Forty
programs were funded over the past five-year period, illustrative of this approach. This
robust array of programs is depicted in Exhibit 46 on the following page.

TRENDS AND IMPACTS
57
Exhibit 46. Thiel Funded Projects
Infrastructure - Equipment (8)
o Computed Radiography (CR)
Processor
o Computed Tomography (CT)
Scanner
o Digital Radiography
o High Definition Laparoscopic
Tower System
o Olympus High Definition Narrow
Band Imaging System
o Omnicell Medication Dispensing
System
o SonoSite Ultrasound
o X-ray Picture Archiving and
Communication System (PACS)
Infrastructure - Recruitment,
retention, training (13)
o Care Coordination Summit
o Community Training Day
o Interns Housing
o Interns/Americorps
o Life Sciences Learning
o Mash Clinic
o Medtech Camp
o MyHealth Career
o Pediatrician + Family Medicine
o Puppet Shows
o Small Group Training sessions
o Summer Interdisciplinary
Program
o Teddy Bear Doll Service
Service Expansion (5)
o Case Conferences
o Case Management
o Consultation
o Curbside Consultations
o Treatment sessions
Enabling Health Services (14)
o Brochures
o Emergency Assistance - Housing
o Emergency Assistance - Support
o Eye Exams/Prevention
Education
o Hearing Tests
o Interpretation
o Medical Equipment
o Medical Transportation
o Oral/Optical Assistance
o Pharmacy Assistance
o Seniors “Get Connected”
Internet Training
o Special Food Items
o Thiel House - Families
o Transportation
iv. People Served
Services reached up to an estimated one out of every three county residents each year.
Over the five-year period studied, the Infrastructure – Equipment Component served an
average of 14,600 people, Enabling Services reached 5,800 people, Services Expansion served
500 people and Infrastructure – recruitment, retention, training reached 600 people. The
large number of people served by equipment projects was due to the high numbers of
Wyoming County residents served by the Wyoming County Hospital each year and the impact
of several equipment purchases over the multi-year period.

TRENDS AND IMPACTS
58
The data on people served is also a duplicate count. This means that some people were
counted multiple times because they were served by different programs and by different
organizations. Wyoming County residents served by year are depicted in Exhibit 47.
v. 2016 Special Projects
Care Coordination
The core of effective comprehensive systems of health and enabling health care services is
care coordination. Countless studies point toward the importance of case or disease
management services provided by primary care practitioners as a major mechanism for
improving health care outcomes and quality of care.
In 2015, the Wyoming County Health Roundtable identified care coordination as a new priority
program which should be supported by Thiel funds. Most innovative care coordination
0
5000
10000
15000
20000
25000
2011-2012 2012-2013 2013-2014 2014-2015 2015-2016 5 Year Avg.
PeopleServed
(duplicatecount)
Funding Period
Exhibit 47. People Served by Project Type
Service Expansion
Infrastructure - Recuitment, retention, training
Infrastructure - Equipment
Enabling Health Services

TRENDS AND IMPACTS
59
programs in health care emphasize some form of case or disease management, yet there is no
uniformly accepted process. Hence the Roundtable decided to support a Wyoming County
Care Coordination Summit in 2016 with three objectives:
Engage personnel from Wyoming County organizations involved in care coordination
processes,
Familiarize them with care coordination concepts rather than a specific care
coordination process or technique, and most importantly
Provide an opportunity to informally network with staff of other organizations involved
in care coordination processes.
The 2016 Summit was a resounding success with 48 health and enabling health care services
personnel from 24 Wyoming County organizations in attendance. The Wyoming County Care
Coordination Summit was attended by both seasoned and new professionals working
as care coordinators in non-profit and community-based organizations and health care
settings, serving predominately adults (including older adults) with various cognitive,
developmental, physical, and mental concerns.
Most Summit participants were well-connected prior to the event, having called
on other participants to share resources and/or engage in collaborations (current or past).
Nevertheless, participants also indicated that they were interested in developing future
collaborations. Follow-up responses clearly demonstrated the impact and potential of the
Care Coordination Summit for participants both professionally and personally. Just eight
weeks after the event, participants were already starting to engage new partners by sharing
information, ideas, and/or resources and establishing collaborations.
Impact:
Participants’ use of creative problem solving activities increased (81% agree), they
became more aware of existing organizations that can be helpful to them
professionally (89% agree), or personally (81% agree).
Participants reached out to professionals that they had not interacted with previously
(88.5% agree).
Participants felt more capable as care coordinators (88.5% agree).
Participants averaged two “new collaborations” following the event and those
participants with limited connections were now more active in the overall
coordination network for Wyoming County.
One of the most interesting findings was that participants indicated that they would
possibly coordinate care with an additional 16 participants at the summit. The prior
average level of coordination contacts was 7.

TRENDS AND IMPACTS
60
The Care Coordination Summit was repeated in October 2017 and participants were asked to
bring materials and brochures depicting their organization’s services.
Seniors Connect Project
At the 2015 Wyoming County Health Care Summit held in Perry, NY, participants were asked
to select a high priority need from a list of five needs identified earlier through a community
internet survey listing a total of 20 needs. That high priority need would then be addressed by
a program provided by a Roundtable member through a special project grant of $2,500. The
five needs were:
Affordable Health Care
Counseling/ mental health/ support groups
Elder Health Care Options
Positive Teen Attitudes funded through equipment
Recreational Facilities
The Elder Health Care Option was selected and a program designed to address many aspects
of need for the elderly – Senior Connect – was provided by Wyoming County Community Action
with assistance from the Wyoming County Office for the Aging and Youth Bureau. Sixteen
seniors received portable touchscreen devices (i.e., tablets) through which they could access
the internet and various internet resources. They also received 8 hours of training on those
devices and internet use skills. The participants viewed the program as very valuable and the
need for follow-up at free internet access sites such as the county’s libraries is considered to
be an important next step.

TRENDS AND IMPACTS
61
D. Technical Notes
a. Benchmarks
Two types of benchmarks were used to identify potentially problematic health care
needs or services use. The first pertained to Wyoming County’s standing in regards
to the eight rural or urban counties in Western New York. Those counties are listed
below:
Allegany
Cattaraugus
Chautauqua
Erie
Genesee
Niagara
Orleans
Wyoming
The second pertained to the County’s standing relative to 12 similar rural counties
in New York State based on the Eberts rural typology. Those counties are listed
below:
Columbia
Greene
Herkimer
Livingston
Orleans
Schoharie
Schuyler
Seneca
Washington
Wayne
Wyoming
Yates
The Western New York comparison reflects the effects of the regional health
system on needs and services. As a consequence, both rural and urban counties,
which often differ significantly on socioeconomic conditions which influence needs
and services use, are included in the comparisons. The Eberts comparison screens
out the effect of socioeconomic conditions of urban counties, which may distort
comparisons with rural counties. In both instances, values which were among the

TRENDS AND IMPACTS
62
poorest 25% of counties studied were considered to be reflective of potential
priority needs.
b. Vital Statistics
The source for all vital statistics data is the New York State Department of Health.
Various data sets were employed with the most recent set addressing Opioid
Abuse. Analyses prepared by HMS Associates.
c. Medicare Claims Data
The primary source of the Medicare claims data is the United States Center for
Medicare and Medicaid Services (CMS). Analyses include adjustments or
methodologies by HMS Associates or other third parties.