x-ray raman optical activity of chiral molecules · x-ray raman optical activity of chiral...
TRANSCRIPT

ChemicalScience
EDGE ARTICLE
Ope
n A
cces
s A
rtic
le. P
ublis
hed
on 0
2 N
ovem
ber
2018
. Dow
nloa
ded
on 1
1/9/
2018
10:
58:4
8 A
M.
Thi
s ar
ticle
is li
cens
ed u
nder
a C
reat
ive
Com
mon
s A
ttrib
utio
n-N
onC
omm
erci
al 3
.0 U
npor
ted
Lic
ence
.
View Article OnlineView Journal
X-ray Raman opt
aEcole Polytechnique Federale de Lausanne,
Faculte des Sciences de Base, ISIC-BSP, C
[email protected] Institute, SLAC National Accelerator
E-mail: [email protected] of Chemistry, University of Ca
[email protected] of Physics and Astronomy, Univ
† Electronic supplementary informa10.1039/c8sc04120b
‡ J. R. Rouxel and Y. Zhang have equal co
Cite this: DOI: 10.1039/c8sc04120b
All publication charges for this articlehave been paid for by the Royal Societyof Chemistry
Received 16th September 2018Accepted 30th October 2018
DOI: 10.1039/c8sc04120b
rsc.li/chemical-science
This journal is © The Royal Society of
ical activity of chiral molecules†
Jeremy R. Rouxel, ‡*a Yu Zhang ‡*b and Shaul Mukamel*cd
Resonant and off-resonant Raman Optical Activity signals in the X-ray regime (XROA) are predicted.
XROA is a chiral-sensitive variant of the spontaneous Resonant Inelastic Scattering (RIXS) signal.
Thanks to the highly localized nature of core excitations, these signals provide a direct probe of
local chirality with high sensitivity to the molecular structure. We derive sum-over-states
expressions for frequency domain XROA signals and apply them to tyrosine at the nitrogen and
oxygen K-edges. Time-resolved extensions of ROA made possible by using additional pulses are
briefly outlined.
1 Introduction
The recent development of intense X-ray light fromsynchrotron or X-ray free electron lasers (XFELs)1,2 makes itpossible to extend well established infrared and opticalnonlinear spectroscopic techniques3–6 to the X-ray regime.One notable advantage is that the light–matter interaction ofX-ray light resonant with core excitations in molecules ishighly spatially localized and element specic. Signalsspecically targeting molecular chirality thus offer importantstructural information.7 Chirality is crucial for the biologicalactivity of biomolecules and has been extensively studiedusing visible and IR techniques such as circular dichroism(CD), optical rotation8 and Raman Optical Activity (ROA).9,10
Chiral signals are intrinsically weak and considerable efforthas been made to increase their magnitude11,12 which is vital,e.g. for sensor applications.13,14
ROA employs circularly polarized light to measure thevibrational or electronic optical activity and is routinely used inthe infrared15 and the visible16 regimes to obtain information onthe absolute conguration of small chiral molecules and on thesecondary and tertiary structure of proteins. This is particularlyimportant for drug design since many important drugs arechiral. The X-ray extension of ROA should also provide favorablescaling since it increases as u5 compared to the conventionalRaman background that scales as u4.17 Expressions for XROA
Laboratoire de Spectroscopie Ultrarapide,
H-1015 Lausanne, Switzerland. E-mail:
Laboratory, Menlo Park, CA 94025, USA.
lifornia, Irvine, CA 92697, USA. E-mail:
ersity of California, Irvine, CA 92697, USA
tion (ESI) available. See DOI:
ntributions.
Chemistry 2018
signals are derived in Section 2 and simulation results of theamino acid tyrosine are presented and analyzed in Section 3.Our ndings are summarized in Section 4.
2 The X-ray Raman optical activitysignal
ROA has its origin in the pioneering work of Barron16,18,19 whodemonstrated that the spontaneous Raman scattering intensityinduced by circularly polarized light from chiral enantiomers isdifferent. The ROA signal is usually measured by taking thedifference between spontaneous Raman spectra induced by leand right polarized light at different scattering angles. Thedetector then measures all polarizations of the scattered light.This conguration is shown in Fig. 1. ROA signals can also beacquired in other ways by detecting, for example, the differencebetween the le and right polarized components of the scatteredlight when the incident light is linearly polarized or unpolar-ized.16 Mixed schemes in which both the polarization of theincoming light and the scattered light are varied have been usedas well. By varying the polarization and detecting the signal at
Fig. 1 The ROA measurement scheme. Left and right circularlypolarized X-ray pulses propagating along the z direction generate twoRaman signals which are recorded as a function of the scatteringangle. Their small difference constitutes the ROA signal, eqn (9). Thedetector polarization basis by X and Y provides an extra degree offreedom for the measurement.
Chem. Sci.

Chemical Science Edge Article
Ope
n A
cces
s A
rtic
le. P
ublis
hed
on 0
2 N
ovem
ber
2018
. Dow
nloa
ded
on 1
1/9/
2018
10:
58:4
8 A
M.
Thi
s ar
ticle
is li
cens
ed u
nder
a C
reat
ive
Com
mon
s A
ttrib
utio
n-N
onC
omm
erci
al 3
.0 U
npor
ted
Lic
ence
.View Article Online
different scattering angles, it is possible to isolate different tensorcomponents of the rotationally averaged chiral signal.16
ROA with visible light is by now a well established experi-mental technique for probing the optical activity of thevibrational manifold.9 The electronic chirality is mostcommonly observed by visible or UV CD.20,21 XROA measuresthe optical activity of the valence electronic excited manifoldaccessible through intermediate core electronic excitations.For the setup shown in Fig. 1, the relevant matter correlationfunction is a pseudo-tensor involving a magnetic dipole oran electric quadrupole interaction. The sum of these scat-tering intensities depends only on true tensor quantities(electric dipole–electric dipole interactions). The ROA signalscan be directly deduced from the loop diagrams shown inFig. 2 and are usually normalized by the sum of the spectra(eqn (9)).
In this paper, we study the difference in the Raman signalinduced by the incoming le and right polarizations. Theradiation/matter coupling is given by the multipolar Hamilto-nian22 truncated at the electric quadrupole
Hint(t) ¼ �m$Es � m$Bs � q$VEs (1)
Fig. 2(a), (b) and (c) represent the non-chiral electric dipolecontribution, the magnetic dipole and the electric quadru-pole, respectively. We shall denote the detected spontaneousRaman intensity by SRAM(uX,us,q,eL/R,es), where uX is theincident pulse frequency, us is the detected frequency, q isthe angle between the incident pulse and the detected light,and eL/R and es are the incident and diffracted pulsepolarizations.
The XROA signal is given by the difference between le andright incoming polarizations:
SXROA(uX,us,q,es) ¼ SRAM(uX,us,q,eL,es)
� SRAM(uX,us,q,eR,es) (2)
Without loss of generality, in an isotropic sample, we assumethat the incident pulse propagates along the z axis (this impliesthat kX¼ ez) and that the scattered Raman signal is measured inthe xz plane (see Fig. 1).
Fig. 2 Loop diagrams for the electric dipole (a), magnetic dipole (b) and eof the four diagrams involving the magnetic dipole contribution to the sigdipole interaction with the electric dipole ones. Similarly, there are four
Chem. Sci.
The spontaneous Raman signal is dened as the change ofphoton number emitted in the detected direction
SRAMðusÞ ¼ðdt
d
dt
�E†
s ðr; tÞ$Esðr; tÞ�þ �
E†s ðr; tÞ$Bsðr; tÞ
�þ �
B†s ðr; tÞ$Esðr; tÞ
� (3)
We shall neglect the magnetic eld contribution because it isorders of magnitude smaller.23 The time derivative can becalculated by using the expectation value of the Heisenbergequation of motion of the number operator.
d
dt
�E†
s$Es
� ¼ i
ħ���m$
�E†
s þ Es
��m$�B†
s þ Bs
�� q$
�VE†
s þ VEs
�;E†
s$Es
�� (4)
The commutator can be calculated in a straightforwardmanner using the denition of the Es and Bs operators
Es ¼ i
ffiffiffiffiffiffiffiffiffiffiħus
230U
sasese
iðks$r�ustÞ (5)
Bs ¼ i
c
ffiffiffiffiffiffiffiffiffiffiħus
230U
sas�ks � es
�eiðks$r�ustÞ (6)
where ks is the wavevector of the emitted photon, U is thequantization volume and we have the boson commutation
[ar,a†s ] ¼ drs. (7)
Upon evaluating the commutator, the Raman signal (eqn (3))becomes
SRAMðusÞ ¼ 2
ħħus
230J
ðdtDE†
s ðtÞ$mðtÞ þ B†s ðtÞ$mðtÞ
þ VE†s ðtÞ$qðtÞe�i
ħÐdsHintðsÞ
E(8)
where R and J denote the real and imaginary parts respectively.To obtain the ROA signal, we expand the exponent to secondorder in the incident eld. Three terms then contribute to thesignals. The leading term is given by the interaction with theelectric dipoles only (diagram (a)) and does not contribute to the
lectric quadrupole (c) contributions to the ROA signal. We only plot onenal. The other three can be obtained for (b) by permuting the magneticdiagrams for the electric quadrupole interaction (c).
This journal is © The Royal Society of Chemistry 2018

Edge Article Chemical Science
Ope
n A
cces
s A
rtic
le. P
ublis
hed
on 0
2 N
ovem
ber
2018
. Dow
nloa
ded
on 1
1/9/
2018
10:
58:4
8 A
M.
Thi
s ar
ticle
is li
cens
ed u
nder
a C
reat
ive
Com
mon
s A
ttrib
utio
n-N
onC
omm
erci
al 3
.0 U
npor
ted
Lic
ence
.View Article Online
ROA signal since it vanishes upon rotational averaging.Diagram (b) contains one magnetic dipole and diagram (c) hasone electric quadrupole interaction.
SRAM
�uX;us; q; eL=R; es
� ¼ ħus
2e0U
�2
R
ðdtdt3dt2dt1dr4dr3dr2dr1 � eikX$ðr1�r3Þe�iks$ðr2�r4ÞeiuXðt�t3Þe�iuXðt�t3�t2�t1Þe�iusteiusðt�t3�t2Þ
� �E*
Xðr3; t� t3Þ5e*s5es5EXðr1; t� t3 � t2 � t1Þhmðt3Þmðt2Þmðt1Þmð0ÞiþE*
X ðr3; t� t3Þ5e*s5es5BXðr1; t� t3 � t2 � t1Þhmðt3Þmðt2Þmðt1Þmð0Þi þ E*Xðr3; t� t3Þ5e*s5esVEXðr1; t� t3 � t2 � t1Þ
� hmðt3Þmðt2Þmðt1Þqð0Þi þ permutations of magnetic and quadrupole interactions�: (9)
where the eL/R dependence of the signal is contained in thevector components of EX and BX.The three terms in bracketscorrespond to diagrams (a), (b) and (c), respectively in Fig. 2and all operators evolve with the free molecular Hamiltonianin the interaction picture. Eqn (9) allows us to calculate time-resolved signals induced by broadband pulses. In that case,the spatial and temporal integrals can be then expressed asa Fourier transform. In this paper, we focus on ROA signals inthe frequency domain measured with monochromatic lightexcitation. The total XROA signal is given by the sum of themagnetic and the quadrupole contributions:
SXROA(uX,us;q,es) ¼ SmagXROA(uX,us;q,es) + Squad
XROA(uX,us;q,es)
(10)
Sum-over-states expressions for eqn (9) are given inAppendix B.
3 XROA signals of tyrosine
We have calculated the XROA signal, eqn (9), for a randomlyoriented ensemble of L-tyrosine (Fig. 3(a)) with an X-ray incident
Fig. 3 Calculated spectra of L-tyrosine in its zwitterionic form. (a) UV-visabsorption spectrum. The 3D molecular model is also shown and the x,atom in the phenol group is labelled O1 and the other two in the carbonyof O atoms to the total signal (in light blue) are plotted in red and black, r
This journal is © The Royal Society of Chemistry 2018
pulse tuned at the N (uX � 389–397 eV) and O (uX� 519–526 eV)K-edges. The incoming X-rays are thus resonant with the excitedtransitions. The signals on D-tyrosine are identical but with an
opposite sign and thus are not displayed. We focus on thezwitterionic structure (see Fig. 3(a)) of the molecule in watersince this is its dominant form at physiological pH. Thegeometry was optimized at the B3LYP24,25/aug-cc-pVTZ26,27 levelof theory using the Gaussian program package.28 The watersolvent effect was considered with the PCM model.29–31
All quantities needed for XROA signal calculations werecalculated using the CD spectrum32–34 and the restricted exci-tation window time-dependent density functional (REW-TDDFT)35–40 implementations in the quantum chemistrypackage NWChem41 under the Tamm–Dancoff approximation(TDA).42–44 The computational protocol for the relevant tran-sition moments (electric and magnetic dipoles, electricquadrupoles) has been presented in ref. 40. The B3LYP hybridfunctional and the cc-pVTZ basis set26 were used for allNWChem calculations. The water solvent effect was includedusing the COSMO model.45 It is a common practice to applyconstant shis to the calculated core excitation energies fromTDDFT to match the experimental results. Since in this studyonly the relative positions of spectroscopic features matter, weretain all original core excitation energies from the TDDFTcalculations. We adopted a tight SCF convergence criterion
spectrum. (b) N K-edge X-ray absorption spectrum. (c) O K-edge X-rayy, z axes are marked in red, green and blue, respectively. The oxygenl group are labelled O2,3. The separate contributions of these two typesespectively. The signal contributions are normalized to different scales.
Chem. Sci.

Chemical Science Edge Article
Ope
n A
cces
s A
rtic
le. P
ublis
hed
on 0
2 N
ovem
ber
2018
. Dow
nloa
ded
on 1
1/9/
2018
10:
58:4
8 A
M.
Thi
s ar
ticle
is li
cens
ed u
nder
a C
reat
ive
Com
mon
s A
ttrib
utio
n-N
onC
omm
erci
al 3
.0 U
npor
ted
Lic
ence
.View Article Online
(energy change of SCF cycles <10�8 a.u.) and an ultrane gridin all NWChem calculations.
It is well known that TDDFT–TDA in general produces exci-tation energies of identical or even better quality of full TDDFT,but possibly worse oscillator strengths because of violation ofthe sum rule.46,47 However, previous TDDFT–TDA studies oncore spectroscopy, which is the major topic of this manuscript,showed that TDDFT–TDA and full TDDFT gave almost indis-tinguishable results.39,48 TDDFT–TDA is computationally muchcheaper than full TDDFT, which facilitates its use in largesystems. Moreover, it handles triplet instabilities much betterthan full TDDFT.49 In addition, it also gives better nonadiabaticcouplings by reducing the local-density-approximation (LDA)
Fig. 4 2D XROA signals (eqn (9)) displayed vs. the incoming frequencyvarious scattering angles. The left and right columns represent X and Y p
Chem. Sci.
error.50 With all the considerations above, we use TDDFT–TDAin this study.
Under the multipolar expansion, only the rst non-vanishingmultipole is origin invariant. Thus, in the present work, theelectric quadrupoles and the magnetic dipoles are origindependent.51 Indeed, the spectroscopic observables calculatedfrom exact wave functions must be independent of the origin.52
However, numerical truncation of the basis set can induceorigin-dependence of the spectroscopic observables. A possiblesolution is to use Gauge Invariant Atomic Orbitals (GIAOs) orLondon orbitals.34,53–55 Alternatively, as shown by Reiher et al.,52
by evaluating multipoles in the velocity gauge, the corre-sponding spectroscopic tensors are origin-independent evenwith a truncated basis. The behavior of the spectroscopic
uX and the Raman frequency shift Du ¼ uX � us at the N K-edge forolarizations of the detected photons in the detector frame.
This journal is © The Royal Society of Chemistry 2018
Edge Article Chemical Science
Ope
n A
cces
s A
rtic
le. P
ublis
hed
on 0
2 N
ovem
ber
2018
. Dow
nloa
ded
on 1
1/9/
2018
10:
58:4
8 A
M.
Thi
s ar
ticle
is li
cens
ed u
nder
a C
reat
ive
Com
mon
s A
ttrib
utio
n-N
onC
omm
erci
al 3
.0 U
npor
ted
Lic
ence
.View Article Online
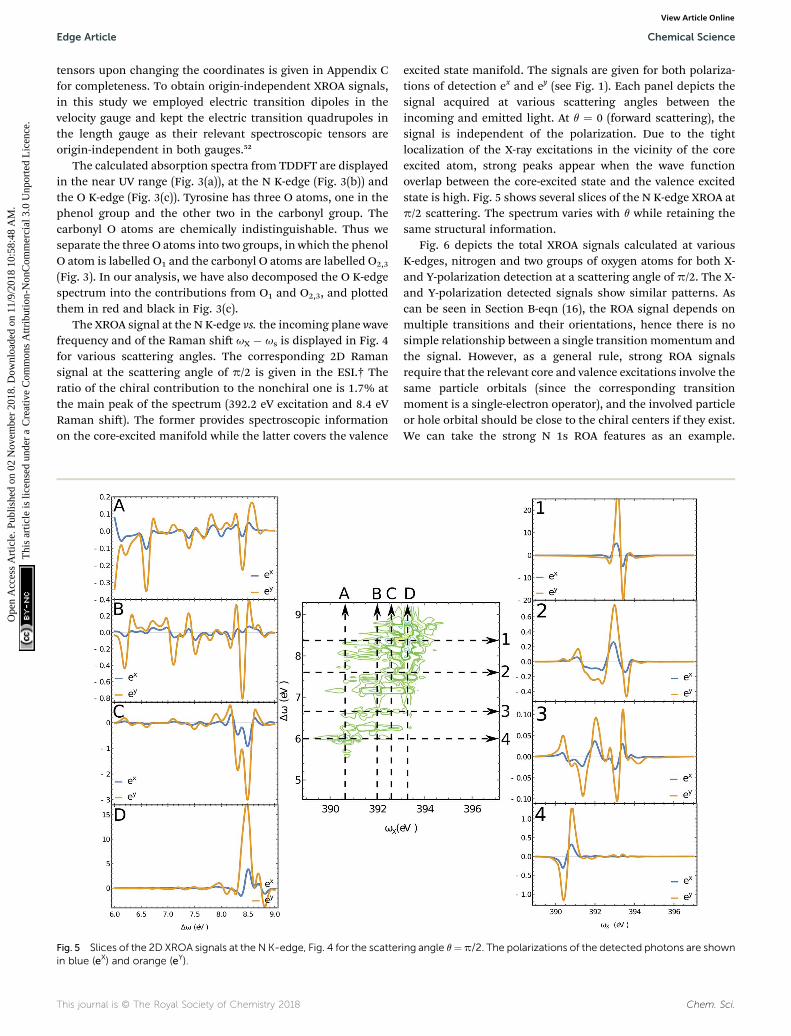
tensors upon changing the coordinates is given in Appendix Cfor completeness. To obtain origin-independent XROA signals,in this study we employed electric transition dipoles in thevelocity gauge and kept the electric transition quadrupoles inthe length gauge as their relevant spectroscopic tensors areorigin-independent in both gauges.52
The calculated absorption spectra from TDDFT are displayedin the near UV range (Fig. 3(a)), at the N K-edge (Fig. 3(b)) andthe O K-edge (Fig. 3(c)). Tyrosine has three O atoms, one in thephenol group and the other two in the carbonyl group. Thecarbonyl O atoms are chemically indistinguishable. Thus weseparate the three O atoms into two groups, in which the phenolO atom is labelled O1 and the carbonyl O atoms are labelled O2,3
(Fig. 3). In our analysis, we have also decomposed the O K-edgespectrum into the contributions from O1 and O2,3, and plottedthem in red and black in Fig. 3(c).
The XROA signal at the N K-edge vs. the incoming plane wavefrequency and of the Raman shi uX � us is displayed in Fig. 4for various scattering angles. The corresponding 2D Ramansignal at the scattering angle of p/2 is given in the ESI.† Theratio of the chiral contribution to the nonchiral one is 1.7% atthe main peak of the spectrum (392.2 eV excitation and 8.4 eVRaman shi). The former provides spectroscopic informationon the core-excited manifold while the latter covers the valence
Fig. 5 Slices of the 2D XROA signals at the N K-edge, Fig. 4 for the scatterin blue (eX) and orange (eY).
This journal is © The Royal Society of Chemistry 2018
excited state manifold. The signals are given for both polariza-tions of detection ex and ey (see Fig. 1). Each panel depicts thesignal acquired at various scattering angles between theincoming and emitted light. At q ¼ 0 (forward scattering), thesignal is independent of the polarization. Due to the tightlocalization of the X-ray excitations in the vicinity of the coreexcited atom, strong peaks appear when the wave functionoverlap between the core-excited state and the valence excitedstate is high. Fig. 5 shows several slices of the N K-edge XROA atp/2 scattering. The spectrum varies with q while retaining thesame structural information.
Fig. 6 depicts the total XROA signals calculated at variousK-edges, nitrogen and two groups of oxygen atoms for both X-and Y-polarization detection at a scattering angle of p/2. The X-and Y-polarization detected signals show similar patterns. Ascan be seen in Section B-eqn (16), the ROA signal depends onmultiple transitions and their orientations, hence there is nosimple relationship between a single transitionmomentum andthe signal. However, as a general rule, strong ROA signalsrequire that the relevant core and valence excitations involve thesame particle orbitals (since the corresponding transitionmoment is a single-electron operator), and the involved particleor hole orbital should be close to the chiral centers if they exist.We can take the strong N 1s ROA features as an example.
ing angle q¼p/2. The polarizations of the detected photons are shown
Chem. Sci.
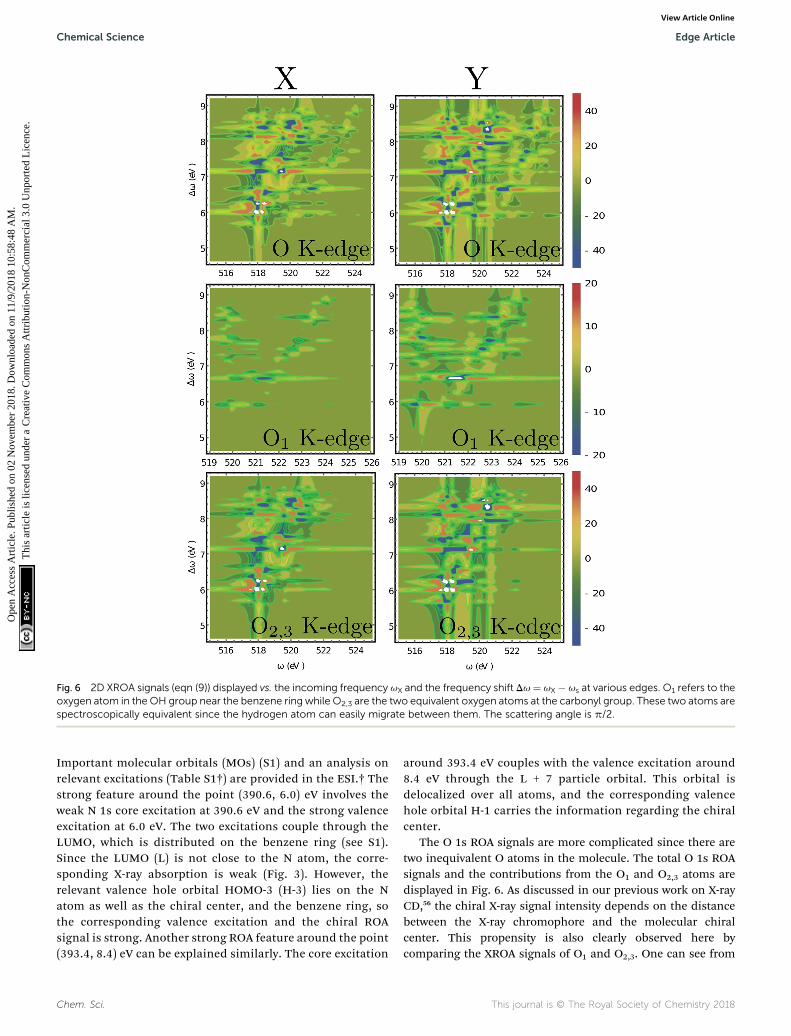
Fig. 6 2D XROA signals (eqn (9)) displayed vs. the incoming frequency uX and the frequency shift Du ¼ uX � us at various edges. O1 refers to theoxygen atom in the OH group near the benzene ring while O2,3 are the two equivalent oxygen atoms at the carbonyl group. These two atoms arespectroscopically equivalent since the hydrogen atom can easily migrate between them. The scattering angle is p/2.
Chemical Science Edge Article
Ope
n A
cces
s A
rtic
le. P
ublis
hed
on 0
2 N
ovem
ber
2018
. Dow
nloa
ded
on 1
1/9/
2018
10:
58:4
8 A
M.
Thi
s ar
ticle
is li
cens
ed u
nder
a C
reat
ive
Com
mon
s A
ttrib
utio
n-N
onC
omm
erci
al 3
.0 U
npor
ted
Lic
ence
.View Article Online
Important molecular orbitals (MOs) (S1) and an analysis onrelevant excitations (Table S1†) are provided in the ESI.† Thestrong feature around the point (390.6, 6.0) eV involves theweak N 1s core excitation at 390.6 eV and the strong valenceexcitation at 6.0 eV. The two excitations couple through theLUMO, which is distributed on the benzene ring (see S1).Since the LUMO (L) is not close to the N atom, the corre-sponding X-ray absorption is weak (Fig. 3). However, therelevant valence hole orbital HOMO-3 (H-3) lies on the Natom as well as the chiral center, and the benzene ring, sothe corresponding valence excitation and the chiral ROAsignal is strong. Another strong ROA feature around the point(393.4, 8.4) eV can be explained similarly. The core excitation
Chem. Sci.
around 393.4 eV couples with the valence excitation around8.4 eV through the L + 7 particle orbital. This orbital isdelocalized over all atoms, and the corresponding valencehole orbital H-1 carries the information regarding the chiralcenter.
The O 1s ROA signals are more complicated since there aretwo inequivalent O atoms in the molecule. The total O 1s ROAsignals and the contributions from the O1 and O2,3 atoms aredisplayed in Fig. 6. As discussed in our previous work on X-rayCD,56 the chiral X-ray signal intensity depends on the distancebetween the X-ray chromophore and the molecular chiralcenter. This propensity is also clearly observed here bycomparing the XROA signals of O1 and O2,3. One can see from
This journal is © The Royal Society of Chemistry 2018

Edge Article Chemical Science
Ope
n A
cces
s A
rtic
le. P
ublis
hed
on 0
2 N
ovem
ber
2018
. Dow
nloa
ded
on 1
1/9/
2018
10:
58:4
8 A
M.
Thi
s ar
ticle
is li
cens
ed u
nder
a C
reat
ive
Com
mon
s A
ttrib
utio
n-N
onC
omm
erci
al 3
.0 U
npor
ted
Lic
ence
.View Article Online
Fig. 6 that the signals of O2,3 are much stronger than O1 signalssince the carbonyl oxygens are closer to the chiral center. Takingthe x-polarized detection as an example, O1 only shows a strongfeature around the (521.5, 6.6) eV point. The involved coreexcitation couples with the valence excitation through theorbital L + 2. We see that L + 2 almost covers the entire chiralcenter (S1) and is involved in many important core and valencetransitions (Table S1†), thus it is the key orbital responsible forstrong ROA signals. The strong O2,3 features around the points(518.2, 6.2) eV and (519.4, 7.2) eV all involve L + 2. Alternatively,the O2,3 core excitations near 518 eV also couple with the 6.0 eVvalence excitation through the L orbital. The other signicantfeatures can be analyzed in a similar manner.
Moreover, even though one can see the chemical shis of O1
and O2,3 in the calculated linear X-ray absorption signals(Fig. 3(c), O1 has strong features near 520 and 521 eV, and O2,3
have strong features around 518 eV), the two spectra overlaparound 520 eV (note that the two spectra are plotted in differentscales and the O2,3 signals are actually stronger than theyappear in Fig. 3(c) compared to the O1 signals). The large corehole lifetime broadening could produce a broad peak around520 eV which will complicate the assignment of the O peaks.However, the situation is different for the XROA signals. Asshown in Fig. 6, the cross-peaks of O1 and O2,3 now havechemical shis in both the core excitation and Raman shienergy dimensions. The various features of O1 and O2,3 can bebetter resolved in the valence excitation manifold, thanks to themuch smaller lifetime broadening of the nal valence excited
Fig. 7 Slices of the XROA signal at the N K-edge (uX ¼ 393.25 eV, q ¼p/2 for x-polarized detection (top) and y-polarized detection (bottom).The total XROA signal measured (T, blue) is the sum of magnetic dipole(M, orange) and electric quadrupole (Q, green) contributions.
This journal is © The Royal Society of Chemistry 2018
states. Therefore, XROA signals have advantages over XCDsignals by better separating the contributions from differentatoms to the chiral signal and resolving the local chiralityinformation at a new level.
Fig. 7 depicts the magnetic and quadrupole contributions tothe XROA signal at the N K-edge (uX ¼ 393.25 eV, q ¼ p/2), eqn(16), for x and y polarization of the signal. The total signalmeasured at the N K-edge is given by the sum of the magneticand the electric contributions. For x-polarized detection, thetotal signal (blue curve) is a mixture of magnetic dipole andelectric quadrupole contributions of similar weight. The y-polarized signal under the same conditions is dominated by themagnetic interaction. The polarization direction of detectionalong which the quadrupole contribution is important isdetermined by the geometric and electronic structure of thesystem, but the fact that this contribution varies signicantlyfor different polarizations of detection is general. The sensitivityof XROA signals to the electric quadrupole interaction opensa new window to molecular chirality compared to XCD signalswhich do not depend on the electric quadrupole because ofcancellation caused by rotational averaging.
4 Conclusions
The most common technique to study chirality with circularlypolarized X-ray light is CD.56–58 We have recently shown how X-ray CD may be used to locally probe chiral structures. In thepresent study we have simulated the XROA signals of L-tyrosineat the N and O K-edges. ROA is routinely used in the IR andvisible regimes, but has not been reported yet for X-rays. Thetechnique has been made feasible by the use of advanced X-raysources.
One advantage of ROA spectroscopy is that the signals can bedetected in a non-collinear geometry thus avoiding the strongbackground of an intense incoming X-ray beam. Moreover, likeoptical Raman signals, ROA signals may detect dark states inthe corresponding absorption spectra because of differentselection rules, and usually have better spectral resolution thantheir absorption counterparts. Unlike XCD, ROA also dependson the electric quadrupole interactions for randomly orientedmolecules and can thus probe molecular chirality even whenmagnetic dipoles are weak, as has been demonstrated for tri-s(ethylenediamine) cobalt(III) ion (Co(en)3
3+).59
The signal in eqn (9) was calculated for a monochromaticexcitation. It will be interesting to extend this technique to thetime-domain by using ultrashort X-ray pulses. Time-resolvedextension can be achieved by adding an actinic pulse witha controlled delay in an optical pump/X-ray probe scheme. Thiscan be done by starting with eqn (9) and expanding the expo-nent to higher orders in the incoming pulses in order to triggersome chiral dynamics. XROA can then be used as a noveldetection mode on top of a nonlinear process that would besensitive to local change of the chiral structure in the vicinity ofan X-ray chromophore. Time-domain XROA should be a power-ful spectroscopy tool to track chiral molecules in chemicalreactions.
Chem. Sci.
Chemical Science Edge Article
Ope
n A
cces
s A
rtic
le. P
ublis
hed
on 0
2 N
ovem
ber
2018
. Dow
nloa
ded
on 1
1/9/
2018
10:
58:4
8 A
M.
Thi
s ar
ticle
is li
cens
ed u
nder
a C
reat
ive
Com
mon
s A
ttrib
utio
n-N
onC
omm
erci
al 3
.0 U
npor
ted
Lic
ence
.View Article Online
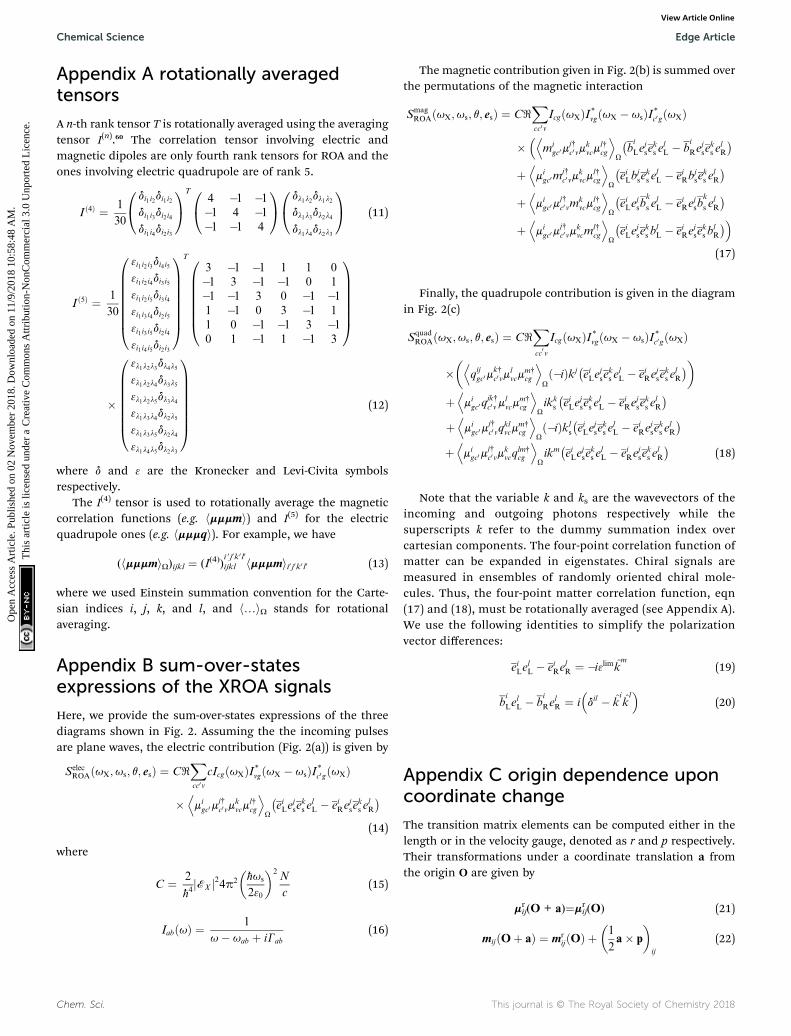
Appendix A rotationally averagedtensors
A n-th rank tensor T is rotationally averaged using the averagingtensor I(n).60 The correlation tensor involving electric andmagnetic dipoles are only fourth rank tensors for ROA and theones involving electric quadrupole are of rank 5.
I ð4Þ ¼ 1
30
0@ di1 i2di1 i2
di1 i3di2 i4di1 i4di2 i3
1A
T0@ 4 �1 �1
�1 4 �1�1 �1 4
1A0@ dl1l2dl1l2
dl1l3dl2l4dl1l4dl2l3
1A (11)
I ð5Þ ¼ 1
30
3i1 i2 i3di4 i5
3i1 i2 i4di3 i5
3i1 i2 i5di3 i43i1 i3 i4di2 i5
3i1 i3 i5di2 i43i1 i4 i5di2 i3
0BBBBBBB@
1CCCCCCCA
T0BBBBBB@
3 �1 �1 1 1 0�1 3 �1 �1 0 1
�1 �1 3 0 �1 �11 �1 0 3 �1 1
1 0 �1 �1 3 �10 1 �1 1 �1 3
1CCCCCCA
�
3l1l2l3dl4l5
3l1l2l4dl3l5
3l1l2l5dl3l43l1l3l4dl2l5
3l1l3l5dl2l43l1l4l5dl2l3
0BBBBBBB@
1CCCCCCCA
(12)
where d and 3 are the Kronecker and Levi-Civita symbolsrespectively.
The I(4) tensor is used to rotationally average the magneticcorrelation functions (e.g. hmmmmi) and I(5) for the electricquadrupole ones (e.g. hmmmqi). For example, we have
(hmmmmiU)ijkl ¼ (I(4))i 0j0k0l0
ijkl hmmmmii0j0k0l0 (13)
where we used Einstein summation convention for the Carte-sian indices i, j, k, and l, and h.iU stands for rotationalaveraging.
Appendix B sum-over-statesexpressions of the XROA signals
Here, we provide the sum-over-states expressions of the threediagrams shown in Fig. 2. Assuming the the incoming pulsesare plane waves, the electric contribution (Fig. 2(a)) is given by
SelecROAðuX;us; q; esÞ ¼ CR
Xcc0v
cIcgðuXÞI*vgðuX � usÞI*c0gðuXÞ
�Dmigc0m
j†c0vm
kvcm
l†cg
EU
�eiLe
jse
ks e
lL � eiRe
jse
ks e
lR
�(14)
where
C ¼ 2
ħ4jEX j24p2
ħus
230
�2N
c(15)
IabðuÞ ¼ 1
u� uab þ iGab
(16)
Chem. Sci.
The magnetic contribution given in Fig. 2(b) is summed overthe permutations of the magnetic interaction
SmagROAðuX;us; q; esÞ ¼ CR
Xcc0v
IcgðuXÞI*vgðuX � usÞI*c0gðuXÞ
��D
migc0m
j†c0vm
kvcm
l†cg
EU
�bi
Lejse
ks e
lL � b
i
Rejse
ks e
lR
�þDmigc0m
j†c0vm
kvcm
l†cg
EU
�eiLb
jse
ks e
lL � eiRb
jse
ks e
lR
�þDmigc0m
j†c0vm
kvcm
l†cg
EU
�eiLe
jsb
k
s elL � eiRe
jsb
k
s elR
�þDmigc0m
j†c0vm
kvcm
l†cg
EU
�eiLe
jse
ks b
lL � eiRe
jse
ks b
lR
� (17)
Finally, the quadrupole contribution is given in the diagramin Fig. 2(c)
SquadROAðuX;us; q; esÞ ¼ CR
Xcc
0v
IcgðuXÞI*vgðuX � usÞI*c0gðuXÞ
�D
qijgc0m
k†c0vm
lvcm
m†cg
EUð�iÞkj
�eiLe
jse
ks e
lL � eiRe
jse
ks e
lR
��
þDmigc0q
jk†c0vm
lvcm
m†cg
EUikk
s
�eiLe
jse
ks e
lL � eiRe
jse
ks e
lR
�þDmigc0m
j†c0vq
klvcm
m†cg
EUð�iÞkl
s
�eiLe
jse
ks e
lL � eiRe
jse
ks e
lR
�þDmigc0m
j†c0vm
kvcq
lm†cg
EUikm
�eiLe
jse
ks e
lL � eiRe
jse
ks e
lR
�(18)
Note that the variable k and ks are the wavevectors of theincoming and outgoing photons respectively while thesuperscripts k refer to the dummy summation index overcartesian components. The four-point correlation function ofmatter can be expanded in eigenstates. Chiral signals aremeasured in ensembles of randomly oriented chiral mole-cules. Thus, the four-point matter correlation function, eqn(17) and (18), must be rotationally averaged (see Appendix A).We use the following identities to simplify the polarizationvector differences:
eiLelL � eiRe
lR ¼ �i3limkm
(19)
bi
LelL � b
i
RelR ¼ i
�dil � k
ikl
(20)
Appendix C origin dependence uponcoordinate change
The transition matrix elements can be computed either in thelength or in the velocity gauge, denoted as r and p respectively.Their transformations under a coordinate translation a fromthe origin O are given by
mrij(O + a)¼mr
ij(O) (21)
mijðOþ aÞ ¼ mrijðOÞ þ
1
2a� p
�ij
(22)
This journal is © The Royal Society of Chemistry 2018

Edge Article Chemical Science
Ope
n A
cces
s A
rtic
le. P
ublis
hed
on 0
2 N
ovem
ber
2018
. Dow
nloa
ded
on 1
1/9/
2018
10:
58:4
8 A
M.
Thi
s ar
ticle
is li
cens
ed u
nder
a C
reat
ive
Com
mon
s A
ttrib
utio
n-N
onC
omm
erci
al 3
.0 U
npor
ted
Lic
ence
.View Article Online
(23)
mpij(O + a) ¼ mp
ij(O) (24)
qpij(O + a) ¼ qpij(O) � (a 5 mij + mij 5 a) (25)
The magnetic dipole remains unchanged in the length andvelocity gauge.51 The ROA spectroscopic signal is origin inde-pendent with truncated basis sets only in the velocity gauge.Thus the velocity gauge has been used to compute the signals.52
Conflicts of interest
There are no conicts to declare.
Acknowledgements
The support of the Chemical Sciences, Geosciences, andBiosciences division, Office of Basic Energy Sciences, Office ofScience, U.S. Deparment of Energy through Award No. DE-FG02-04ER15571 and of the National Science Foundation (Grant NoCHE-1663822) is gratefully acknowledged. J. R was supported bythe DOE grant. Y. Z. would like to thank Prof. Jochen Autsch-bach for helpful discussions.
References
1 Y. Ding, Z. Huang, D. Ratner, P. Bucksbaum and H. Merdji,Generation of attosecond X-ray pulses with a multicycle two-color enhanced self-amplied spontaneous emissionscheme, Phys. Rev. Spec. Top.–Accel. Beams, 2009, 12, 060703.
2 M. Chini, K. Zhao and Z. Chang, The generation,characterization and applications of broadband isolatedattosecond pulses, Nat. Photonics, 2014, 8, 178.
3 J. D. Biggs, Y. Zhang, D. Healion and S. Mukamel, Two-dimensional stimulated resonance Raman spectroscopy ofmolecules with broadband X-ray pulses, J. Chem. Phys.,2012, 136(17), 174117.
4 Y. Zhang, J. D. Biggs and S. Mukamel, Understandingexcitation energy transfer in metalloporphyrinheterodimers with different linkers, bonding structures,and geometries through stimulated X-ray Ramanspectroscopy, J. Mod. Opt., 2014, 61, 558–567.
5 S.-K. Son, H. N. Chapman and R. Santra, Determination ofmultiwavelength anomalous diffraction coefficients at highx-ray intensity, J. Phys. B: At., Mol. Opt. Phys., 2013, 46,164015.
6 K. Tamasaku, E. Shigemasa, Y. Inubushi, T. Katayama,K. Sawada, H. Yumoto, H. Ohashi, H. Mimura, M. Yabashi,K. Yamauchi, et al., X-ray two-photon absorptioncompeting against single and sequential multiphotonprocesses, Nat. Photonics, 2014, 8, 313.
This journal is © The Royal Society of Chemistry 2018
7 N. Berova, K. Nakanashi and R. W. Woody, in CircularDichroism, Principles and Applications, Wiley, 2000.
8 A. Lazar, J. G. Angyan, M. Hollosi, P. Huszthy andP. R. Surjan, Theoretical CD spectrum calculations of thecrown-ether aralkyl-ammonium salt complex, Chirality,2002, 14, 377–385.
9 L. Ashton, P. Pudney, E. Blanch and G. Yakubov,Understanding glycoprotein behaviours using Raman andRaman optical activity spectroscopies: Characterising theentanglement induced conformational changes inoligosaccharide chains of mucin, Adv. Colloid Interface Sci.,2013, 199, 66–77.
10 L. D. Barron, The development of biomolecular Ramanoptical activity spectroscopy, Biomed. Spectrosc. Imaging,2015, 4, 223–253.
11 Y. Tang and A. E. Cohen, Optical chirality and its interactionwith matter, Phys. Rev. Lett., 2010, 104, 163901.
12 J. R. Rouxel, V. Y. Chernyak and S. Mukamel, Non-local real-space analysis of chiral optical signals, Chem. Sci., 2016, 7,6824–6831.
13 H. Zhang and A. Govorov, Giant circular dichroism ofa molecule in a region of strong plasmon resonancesbetween two neighboring gold nanocrystals, Phys. Rev. B:Condens. Matter Mater. Phys., 2013, 87, 075410.
14 M. Schaferling, D. Dregely, M. Hentschel and H. Giessen,Tailoring enhanced optical chirality: design principles forchiral plasmonic nanostructures, Phys. Rev. X, 2012, 2,031010.
15 L. A. Nae, Infrared and Raman vibrational optical activity:theoretical and experimental aspects, Annu. Rev. Phys.Chem., 1997, 48, 357–386.
16 L. Barron, in Molecular light scattering and optical activity,Cambridge, 2004.
17 J. Kapitan, L. D. Barron and L. Hecht, A novel Raman opticalactivity instrument operating in the deep ultraviolet spectralregion, J. Raman Spectrosc., 2015, 46, 392–399.
18 L. Barron and A. Buckingham, Rayleigh and Ramanscattering from optically active molecules, Mol. Phys., 1971,20, 1111–1119.
19 L. Barron, M. Bogaard and A. Buckingham, Ramanscattering of circularly polarized light by optically activemolecules, J. Am. Chem. Soc., 1973, 95, 603–605.
20 T. Dartigalongue and F. Hache, Time-resolved circulardichroism in carbonmonoxy-myoglobin: The central role ofthe proximal histidine, Chirality, 2006, 18, 273–278.
21 F. Hache, M.-C. Schanne-Klein, H. Mesnil, M. Alexandre,G. Lemercier and C. Andraud, Nonlinear optical activityin chiral molecules: surface second harmonic generationand nonlinear circular dichroism, C. R. Phys., 2002, 3,429–437.
22 A. Salam, Molecular quantum electrodynamics: long-rangeintermolecular interactions, John Wiley & Sons, 2010.
23 D. Abramavicius, B. Palmieri, D. V. Voronine, F. Sanda andS. Mukamel, Coherent multidimensional opticalspectroscopy of excitons in molecular aggregates;quasiparticle versus supermolecule perspectives, Chem.Rev., 2009, 109, 2350–2408.
Chem. Sci.

Chemical Science Edge Article
Ope
n A
cces
s A
rtic
le. P
ublis
hed
on 0
2 N
ovem
ber
2018
. Dow
nloa
ded
on 1
1/9/
2018
10:
58:4
8 A
M.
Thi
s ar
ticle
is li
cens
ed u
nder
a C
reat
ive
Com
mon
s A
ttrib
utio
n-N
onC
omm
erci
al 3
.0 U
npor
ted
Lic
ence
.View Article Online
24 A. D. Becke, Density-functional thermochemistry. III. Therole of exact exchange, J. Chem. Phys., 1993, 98, 5648–5652.
25 P. J. Stephens, F. J. Devlin, C. F. Chabalowski andM. J. Frisch, Ab Initio Calculation of Vibrational Absorptionand Circular Dichroism Spectra Using Density FunctionalForce Fields, J. Phys. Chem., 1994, 98, 11623–11627.
26 T. H. Dunning, Gaussian Basis Sets for Use in CorrelatedMolecular Calculations. I. The Atoms Boron through Neonand Hydrogen, J. Chem. Phys., 1989, 90, 1007–1023.
27 R. A. Kendall, T. H. Dunning Jr and R. J. Harrison, Electronaffinities of the rstaARrow atoms revisited. Systematic basissets and wave functions, J. Chem. Phys., 1992, 96(9), 6796–6806.
28 M. J. Frisch, G. W. Trucks, H. B. Schlegel, G. E. Scuseria,M. A. Robb, J. R. Cheeseman, G. Scalmani, V. Barone,G. A. Petersson, H. Nakatsuji, X. Li, M. Caricato,A. Marenich, J. Bloino, B. G. Janesko, R. Gomperts,B. Mennucci, H. P. Hratchian, J. V. Ortiz, A. F. Izmaylov,J. L. Sonnenberg, D. Williams-Young, F. Ding, F. Lipparini,F. Egidi, J. Goings, B. Peng, A. Petrone, T. Henderson,D. Ranasinghe, V. G. Zakrzewski, J. Gao, N. Rega,G. Zheng, W. Liang, M. Hada, M. Ehara, K. Toyota,R. Fukuda, J. Hasegawa, M. Ishida, T. Nakajima, Y. Honda,O. Kitao, H. Nakai, T. Vreven, K. Throssell,J. A. Montgomery Jr, J. E. Peralta, F. Ogliaro, M. Bearpark,J. J. Heyd, E. Brothers, K. N. Kudin, V. N. Staroverov,T. Keith, R. Kobayashi, J. Normand, K. Raghavachari,A. Rendell, J. C. Burant, S. S. Iyengar, J. Tomasi, M. Cossi,J. M. Millam, M. Klene, C. Adamo, R. Cammi,J. W. Ochterski, R. L. Martin, K. Morokuma, O. Farkas,J. B. Foresman, and D. J. Fox, Gaussian 09, Revision C.01,Gaussian, Inc., Wallingford CT, 2009.
29 S. Miertus, E. Scrocco and J. Tomasi, ElectrostaticInteraction of a Solute with a Continuum. A DirectUtilization of ab initio Molecular Potentials for thePrevision of Solvent Effects, Chem. Phys., 1981, 55(1), 117–129.
30 S. Miertus and J. Tomasi, Approximate Evaluations of theElectrostatic Free Energy and Internal Energy Changes inSolution Processes, Chem. Phys., 1982, 65, 239.
31 J. L. Pascual-Ahuir, E. Silla and I. Tunon, GEPOL: Animproved description of molecular-surfaces. 3. A newalgorithm for the computation of a solvent-excludingsurface, J. Comput. Chem., 1994, 15(10), 1127–1138.
32 J. Autschbach, T. Ziegler, S. J. A. van Gisbergen andE. J. Baerends, Chiroptical Properties from Time-dependent Density Functional Theory. I. CircularDichroism Spectra of Organic Molecules, J. Chem. Phys.,2002, 116, 6930–6940.
33 J. Autschbach and T. Ziegler, Calculating Molecular Electricand Magnetic Properties from Time-dependent DensityFunctional Response Theory, J. Chem. Phys., 2002, 116,891–896.
34 J. Autschbach, Time-Dependent Density Functional Theory forCalculating Origin-Independent Optical Rotation and RotatoryStrength Tensors, ChemPhysChem, 2011, 12, 3224–3235.
Chem. Sci.
35 M. Stener, G. Fronzoni and M. de Simone, Time DependentDensity Functional Theory of Core Electrons Excitations,Chem. Phys. Lett., 2003, 373, 115–123.
36 N. A. Besley and A. Noble, Time-Dependent DensityFunctional Theory Study of the X-ray AbsorptionSpectroscopy of Acetylene, Ethylene, and Benzene onSi(100), J. Phys. Chem. C, 2007, 111, 3333–3340.
37 S. DeBeer-George, T. Petrenko and F. Neese, Time-dependent Density Functional Calculations of LigandK-edge X-ray Absorption Spectra, Inorg. Chim. Acta, 2008,361, 965–972.
38 W. Liang, S. A. Fischer, M. J. Frisch and X. Li, Energy-Specic Linear Response TDHF/TDDFT for CalculatingHigh-Energy Excited States, J. Chem. Theory Comput.,2011, 7, 3540–3547.
39 K. Lopata, B. E. V. Kuiken, M. Khalil and N. Govind, Linear-Response and Real-Time Time-Dependent DensityFunctional Theory Studies of Core-Level Near-Edge X-Ray Absorption, J. Chem. Theory Comput., 2012, 8, 3284–3292.
40 Y. Zhang, J. D. Biggs, D. Healion, N. Govind and S. Mukamel,Core and Valence Excitations in Resonant X-ray SpectroscopyUsing Restricted Excitation Window Time-dependent DensityFunctional Theory, J. Chem. Phys., 2012, 137, 194306.
41 M. Valiev, E. Bylaska, N. Govind, K. Kowalski, T. Straatsma,H. V. Dam, D. Wang, J. Nieplocha, E. Apra, T. Windus,et al., NWChem: A Comprehensive and Scalable Open-source Solution for Large Scale Molecular Simulations,Comput. Phys. Commun., 2010, 181, 1477–1489.
42 I. Tamm, Relativistic interaction of elementary particles,J. Phys., 1945, 9, 449.
43 S. M. Dancoff, Non-Adiabatic Meson Theory of NuclearForces, Phys. Rev., 1950, 78, 382–385.
44 S. Hirata and M. Head-Gordon, Time-dependent DensityFunctional Theory within the Tamm–DancoffApproximation, Chem. Phys. Lett., 1999, 314, 291–299.
45 A. Klamt and G. Schuurmann, COSMO: a new approach todielectric screening in solvents with explicit expressionsfor the screening energy and its gradient, J. Chem. Soc.,Perkin Trans. 2, 1993, 799.
46 M. E. Casida and M. Huix-Rotllant, Progress in time-dependent density-functional theory, Annu. Rev. Phys.Chem., 2012, 63, 287–323.
47 A. Chantzis, A. D. Laurent, C. Adamo and D. Jacquemin, Isthe Tamm-Dancoff approximation reliable for thecalculation of absorption and uorescence band shapes?,J. Chem. Theory Comput., 2013, 9, 4517–4525.
48 S. DeBeer George and F. Neese, Calibration of scalarrelativistic density functional theory for the calculation ofsulfur K-edge X-ray absorption spectra, Inorg. Chem., 2010,49, 1849–1853.
49 M. J. Peach, M. J. Williamson and D. J. Tozer, Inuence oftriplet instabilities in TDDFT, J. Chem. Theory Comput.,2011, 7, 3578–3585.
50 C. Hu, O. Sugino and K. Watanabe, Performance of Tamm-Dancoff approximation on nonadiabatic couplings by time-dependent density functional theory, J. Chem. Phys., 2014,140, 054106.
This journal is © The Royal Society of Chemistry 2018

Edge Article Chemical Science
Ope
n A
cces
s A
rtic
le. P
ublis
hed
on 0
2 N
ovem
ber
2018
. Dow
nloa
ded
on 1
1/9/
2018
10:
58:4
8 A
M.
Thi
s ar
ticle
is li
cens
ed u
nder
a C
reat
ive
Com
mon
s A
ttrib
utio
n-N
onC
omm
erci
al 3
.0 U
npor
ted
Lic
ence
.View Article Online
51 L. K. Sørensen, R. Lindh and M. Lundberg, What do weapproximate and what are the consequences inperturbation theory?, arXiv preprint arXiv:1608.02399 2016.
52 S. Luber and M. Reiher, Raman optical activity spectra ofchiral transition metal complexes, Chem. Phys., 2008, 346,212–223.
53 F. London, Theorie quantique des courants interatomiquesdans les combinaisons aromatiques, J. Phys. Radium, 1937,8, 397.
54 T. Helgaker, K. Ruud, K. L. Bak, P. Jørgensen and J. Olsen,Vibrational Raman optical activity calculations usingLondon atomic orbitals, Faraday Discuss., 1994, 99, 165–180.
55 M. Krykunov and J. Autschbach, Calculation of origin-independent optical rotation tensor components inapproximate time-dependent density functional theory,J. Chem. Phys., 2006, 125(3), 034102.
56 Y. Zhang, J. R. Rouxel, J. Autschbach, N. Govind andS. Mukamel, X-ray circular dichroism signals: a unique
This journal is © The Royal Society of Chemistry 2018
probe of local molecular chirality, Chem. Sci., 2017, 8,5969–5978.
57 J. Goulon, A. Rogalev, F. Wilhelm, N. Jaouen, C. Goulon-Ginet and C. Brouder, Optical activity probed with x-rays, J.Phys.: Condens. Matter, 2003, 15, S633.
58 L. Alagna, T. Prosperi, S. Turchini, J. Goulon, A. Rogalev,C. Goulon-Ginet, C. R. Natoli, R. D. Peacock andB. Stewart, X-ray natural circular dichroism, Phys. Rev.Lett., 1998, 80, 4799.
59 B. Stewart, R. D. Peacock, L. Alagna, T. Prosperi,S. Turchini, J. Goulon, A. Rogalev and C. Goulon-Ginet,Circular Dichroism at the Edge: Large X-ray Natural CDin the 1s -> 3d Pre-Edge Feature of 2 [Co (en)3Cl3].NaCl$6H2O, J. Am. Chem. Soc., 1999, 121, 10233–10234.
60 D. P. Craig and T. Thirunamachandran, Molecular quantumelectrodynamics: an introduction to radiation-moleculeinteractions, Courier Corporation, 1984.
Chem. Sci.