x-ray stress measurement for titanium aluminide intermetallic
TRANSCRIPT
X-RAY STRESS MEASUREMENT FOR TITANIUM ALUMINIDE INTERMETALLIC COMPOUND
‘)Takashi Kondoh, 2)Tokimasa Goto, 3)Toshihiko Sasaki and 3)Yukio Hirose
‘)Department of Industrial Engineering, Aichi Institute of Technology Yakusa-cho, Toyota, 470-0392, Japan
2)Graduate Student of Kanazawa University Kakuma-machi, Kanazawa, 920-1192, Japan
3)Department of Materials Science and Engineering Kanazawa University Kakuma-machi, Kanazawa, 920-1192, Japan
ABSTRACT
The purpose of this study is to obtain residual stresses on various worked surfaces of TiAl intermetallic compound by X-ray stress measurement methodology. We accurately obtained residual stress from spotted diffraction patterns by X-ray stress measurement using an imaging plate (IP). On the other hand, a conventional X-ray stress measurement method using a scintillation counter was more effective in accurately obtaining residual stress from diffraction patterns with low P/B ratio than X-ray measurement using IP. Residual stresses on various worked surfaces of TiAl intermetallic compound were obtained by appropriately using these methods.
INTRODUCTION
TiAl intermetallic compound is of great interest because it is expected to be a next generation light heatproof material. Two-phase alloys which consists of Ti3Al (o 2) phase and TiAl( y ) phase have been studied by many researchers[ 11. The two-phase alloy can be obtained when Ti is in slight excess than Al in the mixture. The structure of the two-phase alloy can be controlled to a dual phase equiaxed structure, a full lamellar structure or a duplex structure with an appropriate heat treatment. The duplex structure consists of the dual phase equiaxed structure and the full lamellar structure. Basic studies of these materials have already been done, and used in some applications. There is a need to use an X&ay stress measurement to evaluate the residual stress and strength of these materials.
Grains in TiAl intermetallic compound coarsen during a manufacture process. X-ray stress measurement of TiAl intermetallic compound is difficult because of spotted diffraction patterns caused by coarse grains. On the other hand, diffraction patterns obtained from worked surfaces such as a ground surface or a milled surface become the low P/B ratio because of the ununiform distortion. Even TiAl (3 11) reflection, which provides the best condition to obtain the residual stress by X-ray stress measurement, becomes the low P/B ratio. An addition complication, TiAl
Copyright(c)JCPDS-International Centre for Diffraction Data 2000,Advances in X-ray Analysis,Vol.43 107ISSN 1097-0002

This document was presented at the Denver X-ray Conference (DXC) on Applications of X-ray Analysis. Sponsored by the International Centre for Diffraction Data (ICDD). This document is provided by ICDD in cooperation with the authors and presenters of the DXC for the express purpose of educating the scientific community. All copyrights for the document are retained by ICDD. Usage is restricted for the purposes of education and scientific research. DXC Website – www.dxcicdd.com
ICDD Website - www.icdd.com
ISSN 1097-0002
(3 11) diffraction line is too close to TiAl(l13) line, resulting in a double peak profile. In recent times, an imaging plate (IP ; Two-dimensional and integration type X-ray
detector) is frequently used in X-ray stress measurement. We have succeeded in obtaining the residual stress of a coarse-grained material by applying the software oscillation and the X-Y plane oscillation methods to X-ray stress measurement using IP [2-61. These two methods were proposed in order to obtain the appropriate residual stress from the coarse-grained material.
The purpose of the present study is to obtain appropriate residual stresses on various worked surfaces of TiAl intermetallic compound by X-ray stress measurement. We could obtain appropriate residual stresses from spotted diffraction patterns by X-ray stress measurement using IP, to which the software oscillation and the X-Y plane oscillation methods were applied. On the other hand, a conventional X-ray stress measurement method using a scintillation counter was found to be more effective in obtaining appropriate residual stresses from diffraction patterns of the low P/B ratio than from X-ray measurement using IP. Residual stresses on various worked surfaces of TiAl intermetallic compound were obtained by appropriately using these methods.
EXPERIMENTAL PROCEDURE X-Ray Stress Measurement using IP Theorv of Stress Analvsis[7,8]
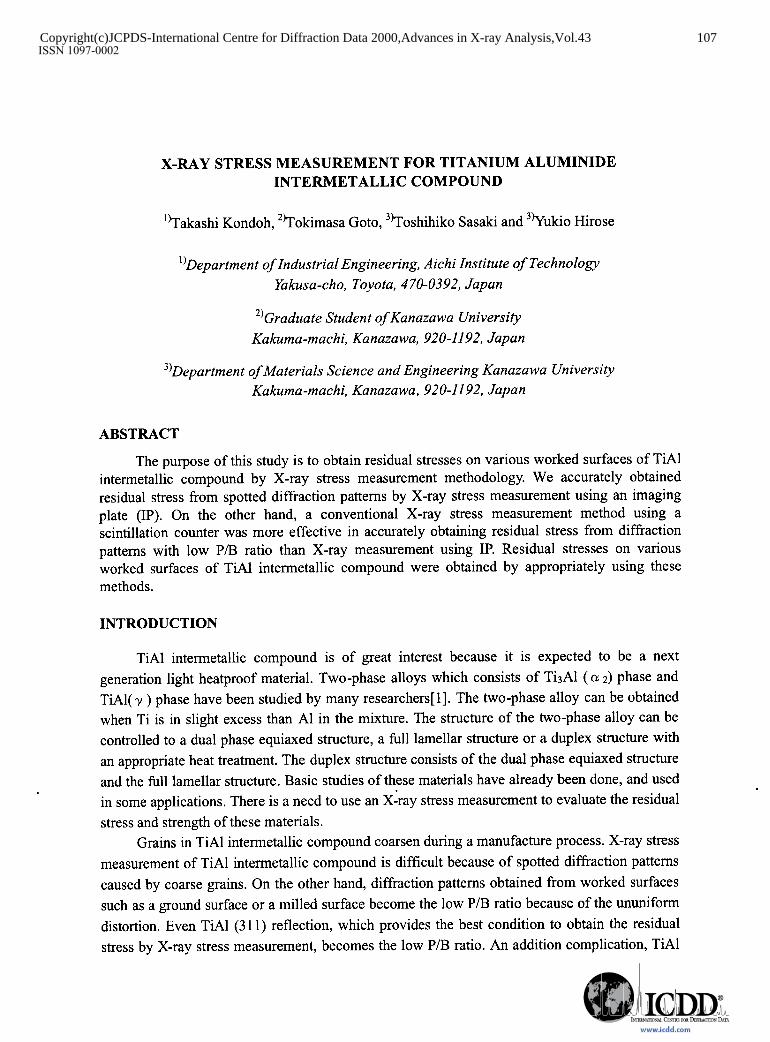
IP can record a whole Debye-Scherrer ring by its two-dimensional measurement ability. The stress can be determined from a Debye-Scherrer ring using the cos (y. method [7,8] promptly. Based on the cos a method, the stress CT x in X-direction in Fig. 1 is
. Ox ={;)i&(&] (1)
where angle, cz , 4 0, r] are shown in Fig.1. Sz is X-ray elastic constant. T is obtained from equation (2), and is calculated from E a, E -a, E x+.x3 and E li-LI as shown in Fig.2.
,+(Em - Ez-.)+(L - E.+.)l (2)
, X-ray
Fig. 1 Coordinate system for X-ray stress measurement and schematic illustration of X-Y plane oscillation.
c 9
Idging Plate
Fig. 2 X-ray strains used for stress calculation.
Copyright(c)JCPDS-International Centre for Diffraction Data 2000,Advances in X-ray Analysis,Vol.43 108ISSN 1097-0002
The stress o x can be obtained from the I relationship between y and cos (y. shown in equation (1).
Coarse Grain Measures in X-Rav Stress Measurement Usiw IP
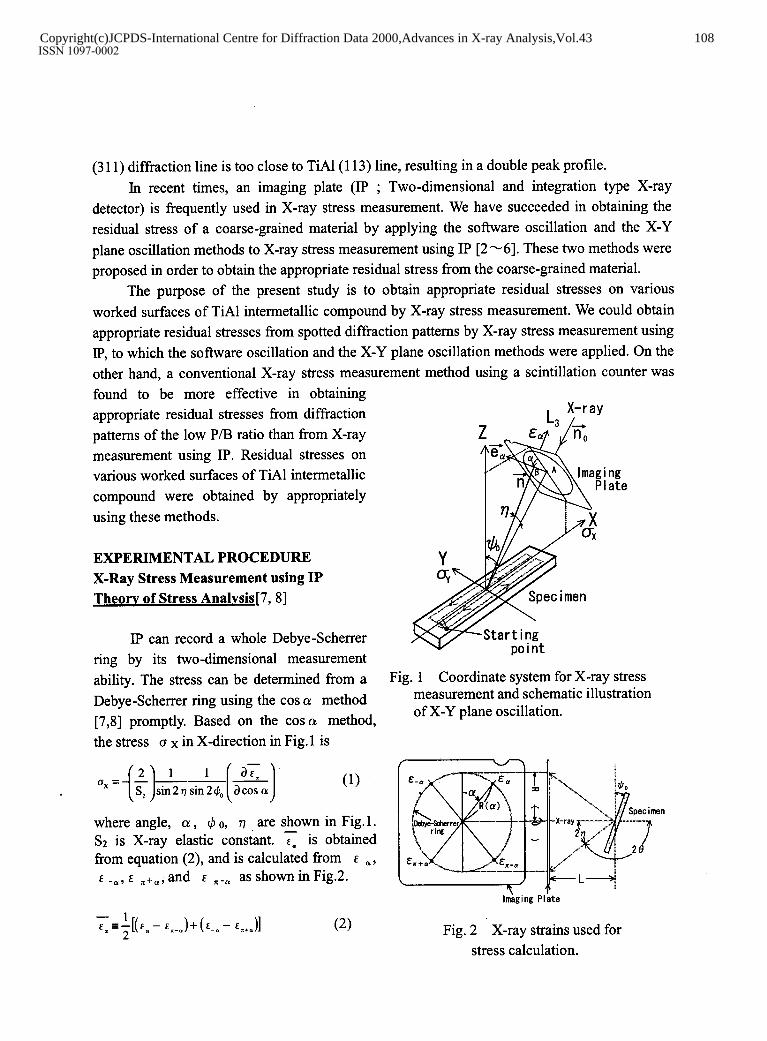
In X-ray stress measurement on a Fig. 3 Principle of software oscillation method. coarse-grained material using IP, a Debye-Scherrer ring becomes a spotted circle. To determine the stress from such Debye-Scherrer rings, a continuous ring is needed. The X-Y plane oscillation and the software oscillation methods applying to X-ray stress measurement using IP make possible to generate a continuous Debye-Scherrer ring from the coarse-grained material. The X-Y plane oscillation is a mechanical sample oscillation that greatly increases the number of grains contributing to diffraction by oscillating a sample parallel to an X-Y plane shown in Fig.1. Arrows on the specimen show, as an example, the movement of a X-ray irradiation point.
On the other hand, the software oscillation improves a discontinuous Debye-Scherrer ring to a continuous one by image processing. The principle is shown in Fig.3. A profile in an (Y -direction is averaged with profiles at n angle ahead and before. This method is effective in the case of a lightly spotted Debye-Scherrer ring (lightly coarse grained materials).
Sample and Specimens
Ingots of TiAl intermetallic compound (T+lSmoll%Al) were made by the induction scull melting method. Chemical compositions
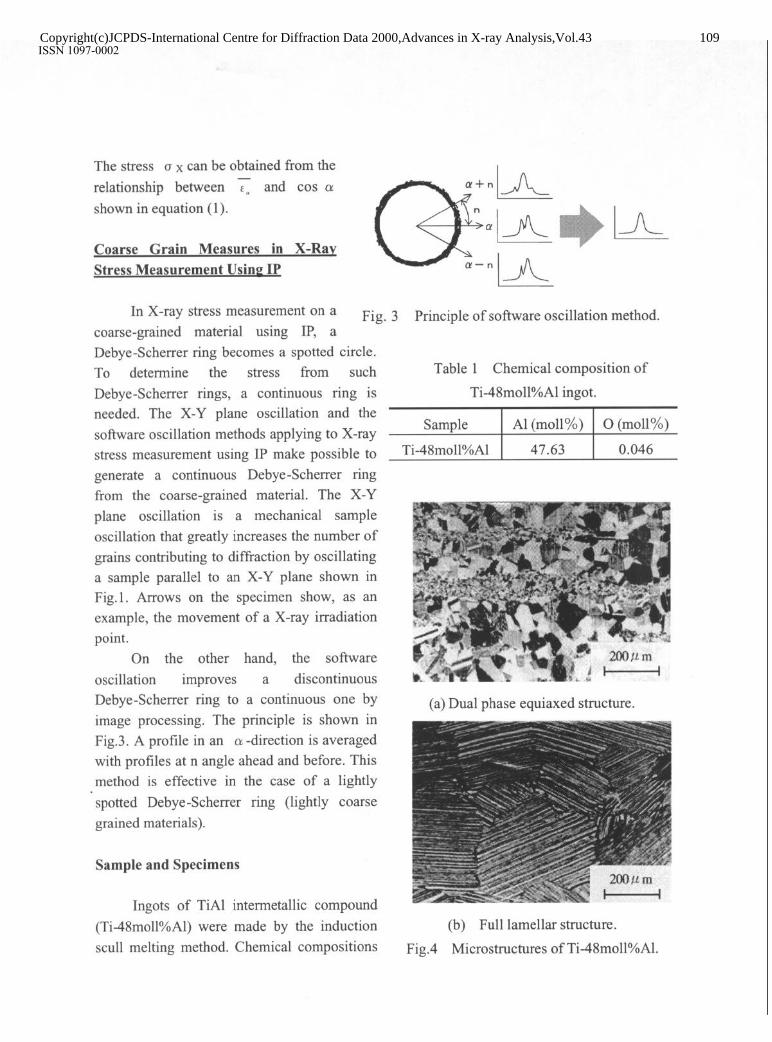
Table 1 Chemical composition of
Ti-48moll%Al ingot.
Sample Al (mall%) 0 (mall%)
Ti-48moll%Al 47.63 0.046
(a) Dual phase equiaxed structure.
200/l m t I
(b) Full lamellar structure.
Fig.4 Microstructures of Ti-48moll%Al.
Copyright(c)JCPDS-International Centre for Diffraction Data 2000,Advances in X-ray Analysis,Vol.43 109ISSN 1097-0002
of the ingot are shown in Table 1. The ingot was extruded after being heated at 1473°C for 3 hours. Specimens were cut from the ingot by a wire electrodischarge machine. The dimensions of these specimens were 3.0t X 7.0~ X 451 mm3. For these specimens, two kinds of heat treatments were performed. The dual phase equiaxed structure can be obtained by a heat treatment of 1473K-3hpfurnace cooling, and the full lamellar structure by 1673K-0.75hr, furnace cooling. For each structure, three specimens were prepared. The dual phase equiaxed structure had a grain size of 20-100 ,U m, and consisted of lightly course grains. The full lamellar structure had a grain size of 100 m 500 ,u m, and consisted of remarkably course grains. These microstructures are shown in Fig.4.
Surfaces of these specimens were worked in a variety of ways. An electrolytic-polished surface, a ground surface and a milled surface were prepared for X-ray stress measurement. The electrolytic-polished surface was made with a solution of 6vol.%perchloricacid + 34vol.%butanol + 60vol.%mrthanol after buffing. A surface layer of 50- 60 ,U m was removed during the preparation. The ground surface was made with a grinding stone rotating at 2000rpm, with the table moving at 30mm/min. The milled surface was made with a mill at 122.5mmin speed, O.lmm cut depth, with the milling table moving at 0.33mm/min. The worked direction corresponds to a transverse direction of the specimen.
X-Ray Diffraction Conditions
The crystal structure of TiAl( y ) is tetragonal with a=4.OOOa
(a) Dual phase equiaxed structure.
(b) Full lamellar structure.
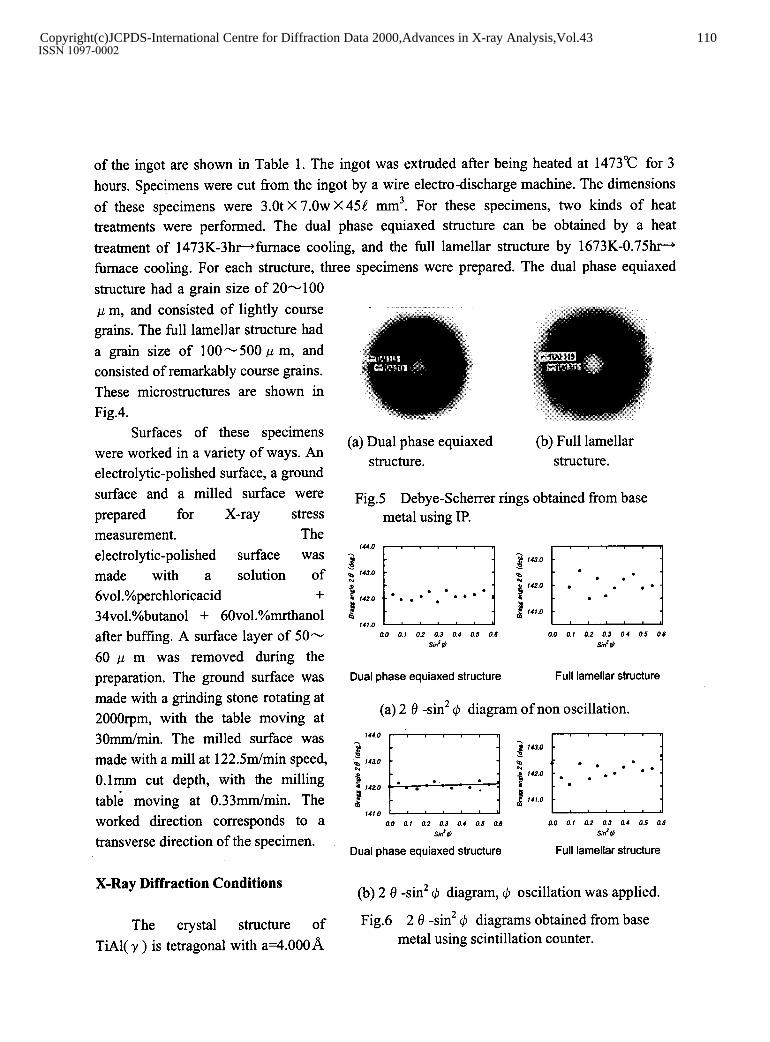
Fig.5 Debye-Scherrer rings obtained from base metal using IP.
144.0 , . . . ,
; 113.0 “(
I ,,2,0 l l l . . l l
! l *** 111.0 /
0.0 0.1 0.2 0.3 0.4 0.6 0.6 Sin’ (I
2
3% 143.0 .
2 . : 3 142.0
/
. . . l
i 141.0 l l
0.0 0.1 0.2 0.3 0.4 0.6 0.6
sin’ r6
Dual phase equiaxed structure Full lamellar structure
(a) 2 13 -sin2 (1, diagram of non oscillation.
-ff--+-J I::I/:::::
0.0 0.1 0.2 0.3 0.4 0.5 0.6 0.0 0.1 0.2 0.3 0.4 0.5 0.6 sin’ &4 sin’tb
Dual phase equiaxed structure Full lamellar structure
(b) 2 8 -sin2 d, diagram, (I oscillation was applied.
Fig.6 2 6’ -sin2 (I, diagrams obtained from base metal using scintillation counter.
Copyright(c)JCPDS-International Centre for Diffraction Data 2000,Advances in X-ray Analysis,Vol.43 110ISSN 1097-0002
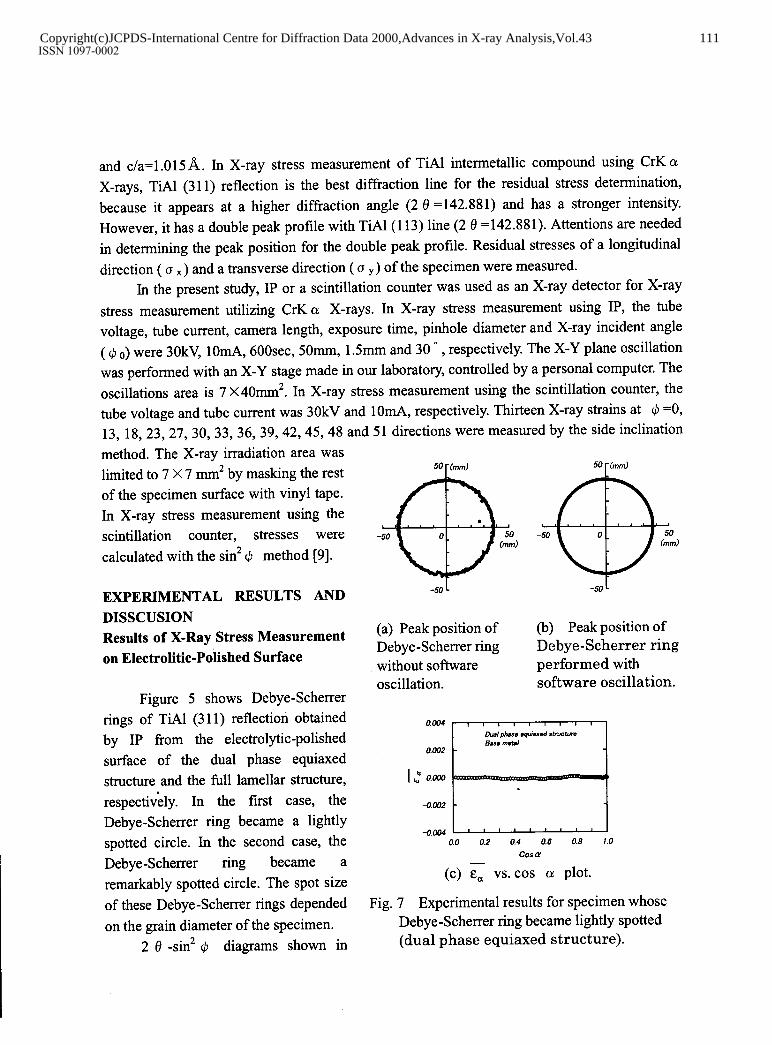
and c/a=1 .OlS a. In X-ray stress measurement of TiAl intermetallic compound using CrK a X-rays, TiAl (311) reflection is the best diffraction line for the residual stress determination, because it appears at a higher diffraction angle (2 8 =142.881) and has a stronger intensity. However, it has a double peak profile with TiAl(l13) line (2 8 =142.881). Attentions are needed in determining the peak position for the double peak profile. Residual stresses of a longitudinal direction ( u x) and a transverse direction (o y) of the specimen were measured.
In the present study, IP or a scintillation counter was used as an X-ray detector for X-ray stress measurement utilizing CrK a X-rays. In X-ray stress measurement using IP, the tube voltage, tube current, camera length, exposure time, pinhole diameter and X-ray incident angle (4 0) were 3OkV, lOmA, 600sec, 5Omm, 1.5mm and 30 ’ , respectively. The X-Y plane oscillation was performed with an X-Y stage made in our laboratory, controlled by a personal computer. The oscillations area is 7 X40mm2. In X-ray stress measurement using the scintillation counter, the tube voltage and tube current was 30kV and lOmA, respectively. Thirteen X-ray strains at (I =O, 13, 18,23,27, 30, 33, 36, 39,42,45,48 and 51 directions were measured by the side inclination method. The X-ray irradiation area was limited to 7 X 7 mm2 by masking the rest of the specimen surface with vinyl tape. In X-ray stress measurement using the scintillation counter, stresses were calculated with the sin2 d, method [9].
EXPERIMENTAL RESULTS AND DISSCUSION Results of X-Ray Stress Measurement on Electrolitic-Polished Surface
(a) Peak position of Debye-Scherrer ring without software
Figure 5 shows Debye-Scherrer rings of TiAl (311) reflection obtained by IP from the electrolytic-polished surface of the dual phase equiaxed structure and the full lamellar structure, respectively. In the first case, the Debye-Scherrer ring became a lightly spotted circle. In the second case, the Debye-Scherrer ring became a remarkably spotted circle. The spot size of these Debye-Scherrer rings depended on the grain diameter of the specimen.
oscillation.
1,” O.OCW
-0.lw2
-0.004 0.0 0.2 0.4 0.6 0.6 1.0
COSCY -
(cl Ecz vs. cos (I! plot.
Fig. 7 Experimental results for specimen whose Debye-Scherrer ring became lightly spotted (dual phase equiaxed structure).
50 r (mm)
+3 -50 0 50 (mm)
-50 L
(b) Peak position of Debye-Scherrer ring performed with software oscillation.
2 8 -sin2 (I, diagrams shown in
Copyright(c)JCPDS-International Centre for Diffraction Data 2000,Advances in X-ray Analysis,Vol.43 111ISSN 1097-0002
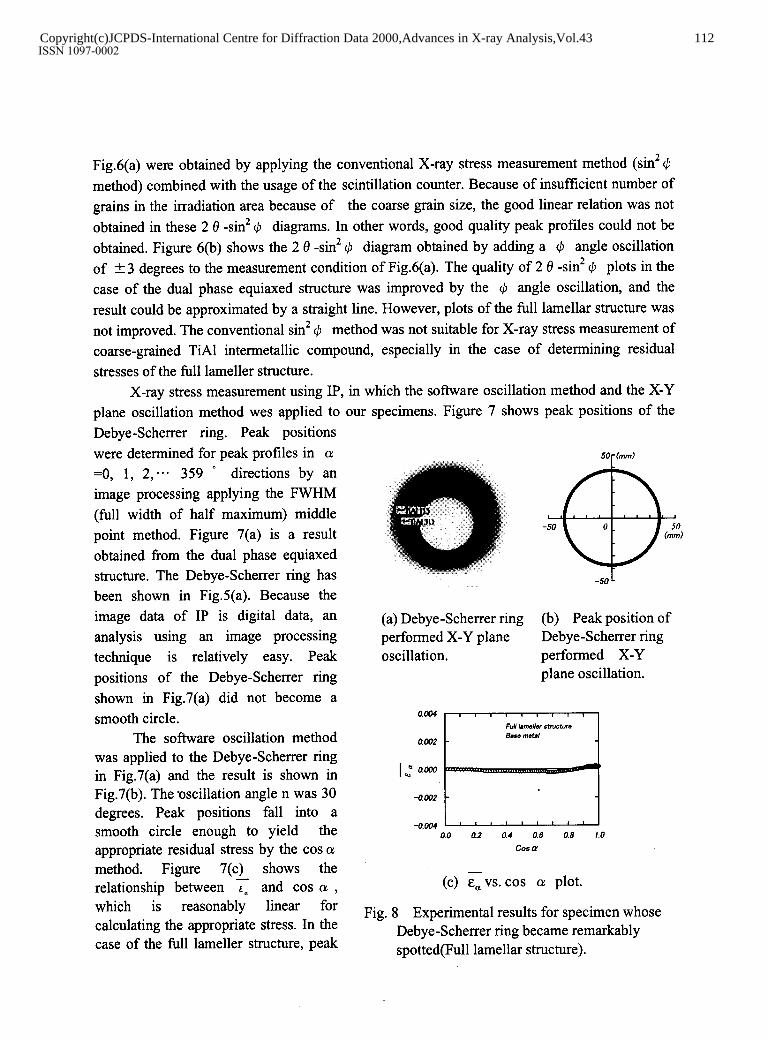
X-ray stress measurement using IP, in which the software oscillation method and the X-Y plane oscillation method wes applied to our specimens. Figure 7 shows peak positions of the Debye-Scherrer ring. Peak positions were determined for peak profiles in (Y 50 (mm)
=O, 1, 2, *em 359 ’ directions by an image processing applying the FWHM (full width of half maximum) middle point method. Figure 7(a) is a result obtained from the dual phase equiaxed structure. The Debye-Scherrer ring has been shown in Fig.S(a). Because the image data of IP is digital data, an analysis using an image processing technique is relatively easy. Peak positions of the Debye-Scherrer ring shown in Fig.7(a) did not become a smooth circle.
8
-50 0 SO (mm)
-50
(a) Debye-Scherrer ring (b) Peak position of performed X-Y plane Debye-Scherrer ring oscillation. performed X-Y
plane oscillation.
The software oscillation method was applied to the Debye-Scherrer ring in Fig.7(a) and the result is shown in Fig.7(b). The oscillation angle n was 30 degrees. Peak positions fall into a smooth circle enough to yield the appropriate residual stress by the cos (y. method. Figure 7(c) shows the relationship between y and cos (y. , which is reasonably linear for calculating the appropriate stress. In the case of the full lameller structure, peak
1,” 0.m
-am?
t
-ooo+ 1 ’ ’ ’ ’ ’ ’ ’ ’ ’ ’ 0.0 0.2 0.4 0.6 0.8 1.0
cos (Y
(c) <vs. cos Q plot.
Fig. 8 Experimental results for specimen whose Debye-Scherrer ring became remarkably spotted(Ful1 lamellar structure).
Fig.6(a) were obtained by applying the conventional X-ray stress measurement method (sin’@ method) combined with the usage of the scintillation counter. Because of insufficient number of grains in the irradiation area because of the coarse grain size, the good linear relation was not obtained in these 2 8 -sin* (1, diagrams. In other words, good quality peak profiles could not be obtained. Figure 6(b) shows the 2 8 -sin* 4 diagram obtained by adding a (I angle oscillation of +3 degrees to the measurement condition of Fig.6(a). The quality of 2 8 -sin* 9 plots in the case of the dual phase equiaxed structure was improved by the 9 angle oscillation, and the result could be approximated by a straight line. However, plots of the full lamellar structure was not improved. The conventional sin* 4 method was not suitable for X-ray stress measurement of coarse-grained TiAl inter-metallic compound, especially in the case of determining residual stresses of the full lameller structure.
Copyright(c)JCPDS-International Centre for Diffraction Data 2000,Advances in X-ray Analysis,Vol.43 112ISSN 1097-0002
positions did not fall into a smooth circle by an application of the software oscillation. The space between the spots was too large. In this case, it is necessary to apply the X-Y plane oscillation to the specimen. Figure 8(a) shows the Debye-Scherrer ring obtained by applying the X-Y plane oscillation method. The discontinuous Debye-Scherrer ring shown in Fig.S(a) becomes a continuous one. Figure 8(b) shows peak positions of the Debye-Scherrer ring. Here peak positions have become a circle as smooth as that of the dual phase equiaxed structure. Figure7(c) shows the relationship between T and cos cz , which is linear enough for calculating the appropriate stress.
Results of X-Ray Stress Measurement on Worked Surfaces
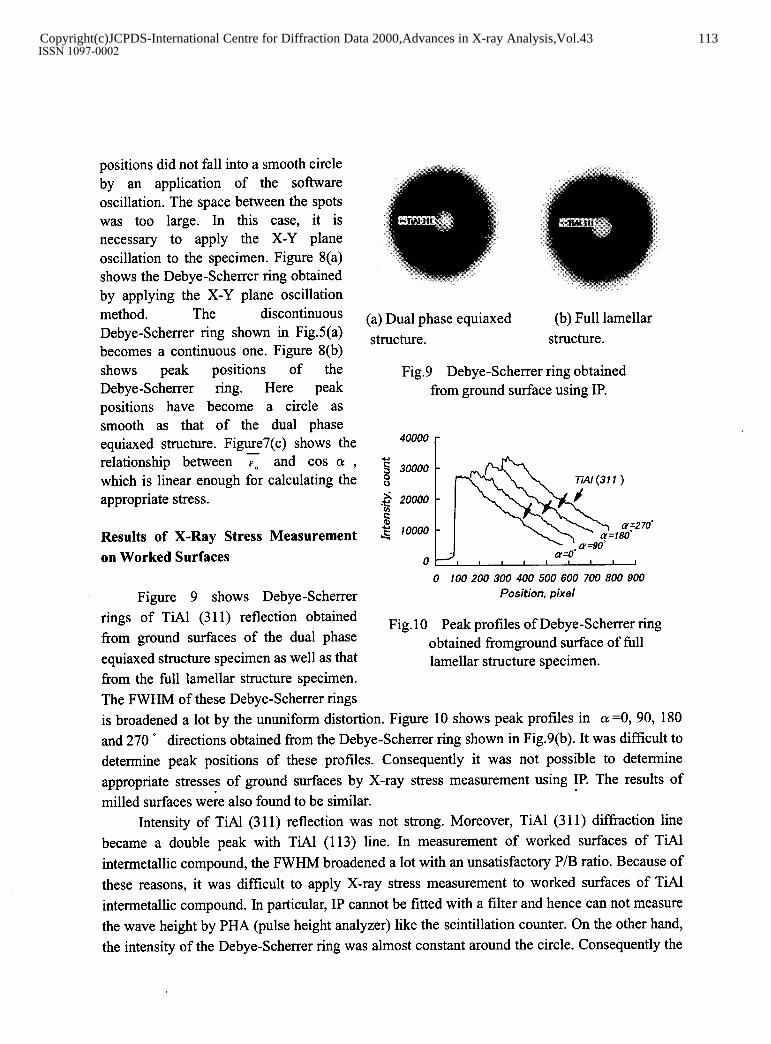
Figure 9 shows Debye-Scherrer rings of TiAl (311) reflection obtained from ground surfaces of the dual phase equiaxed structure specimen as well as that from the full lamellar structure specimen. The FWHM of these Debye-Scherrer rings
(a) Dual phase equiaxed @I) Full lamellar structure. structure.
Fig.9 Debye-Scherrer ring obtained from ground surface using IP.
40000 I-
ts 3 30000 8
.* 20000
:
g 70000
0
0 100 200 300 400 500 600 700 800 900 Position, pixel
Fig. 10 Peak profiles of Debye-Scherrer ring obtained fromground surface of full lamellar structure specimen.
is broadened a lot by the ununiform distortion. Figure 10 shows peak profiles in a =0, 90, 180 and 270 ’ directions obtained from the Debye-Scherrer ring shown in Fig.g(b). It was difficult to determine peak positions of these profiles. Consequently it was not possible to determine appropriate stresses of ground surfaces by X-ray stress measurement using IP. The results of milled surfaces were also found to be similar.
.
Intensity of TiAl (3 11) reflection was not strong. Moreover, TiAl (311) diffraction line became a double peak with TiAl (113) line. In measurement of worked surfaces of TiAl intermetallic compound, the FWHM broadened a lot with an unsatisfactory P/B ratio. Because of these reasons, it was difficult to apply X-ray stress measurement to worked surfaces of TiAl intermetallic compound. In particular, IP cannot be fitted with a filter and hence can not measure the wave height by PHA (pulse height analyzer) like the scintillation counter. On the other hand, the intensity of the Debye-Scherrer ring was almost constant around the circle. Consequently the
Copyright(c)JCPDS-International Centre for Diffraction Data 2000,Advances in X-ray Analysis,Vol.43 113ISSN 1097-0002
I.30 135 140 145 150 0.0 0.1 0.2 0.3 0.4 0.5 0.6 130 1.75 140 145 150 0.0 0.l 0.2 0.3 0.4 0.5 0.6 Br,#‘ l n& 2 6 (de#.) SiJti Bragz l plc 2 e (dad Sir?@
Dual phase equiaxed structure Full iamellar structure
(a) Ground surface
0.D 0.1 0.2 0.3 0.4 0.5 0.6 130 1.75 140 145 150 0.0 0.1 0.2 0.3 0.4 0.5 0.6
Bnn .& 2 8 (dn6.J sit?rl B- de 2 e cd& ShJ 09
Dual phase equiaxed stmchxe Full lamellar structure ” \ . ,... . * (0) Mulea surrace
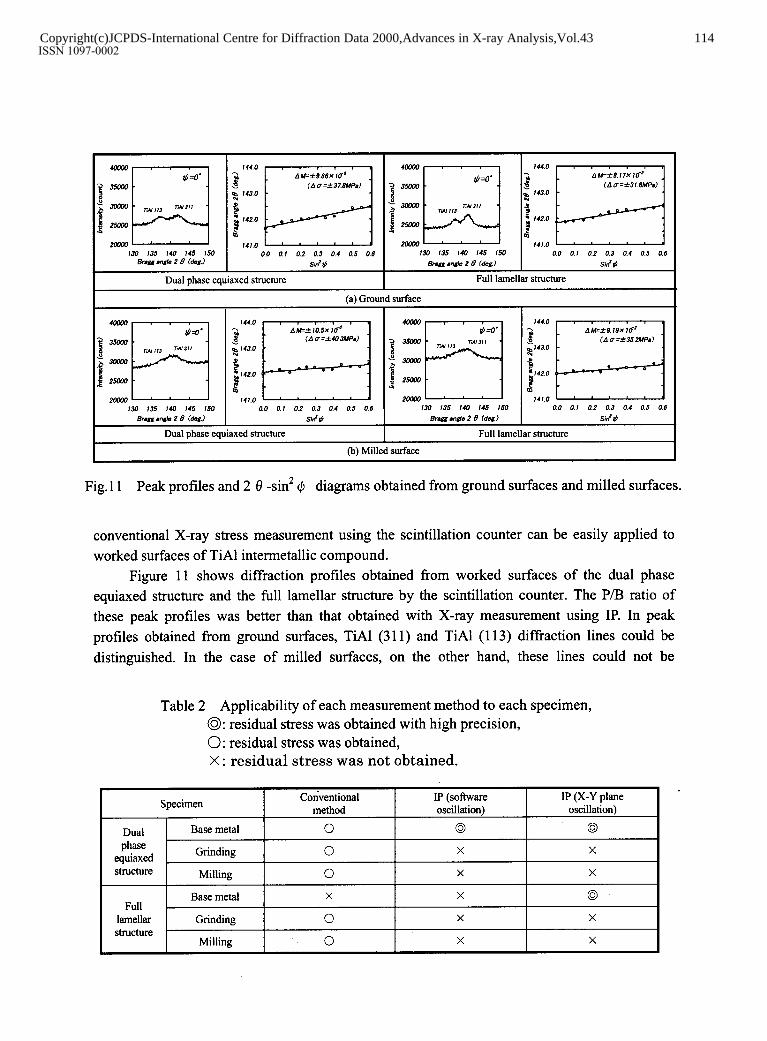
Fig. 11 Peak profiles and 2 8 -sin2 (I, diagrams obtained from ground surfaces and milled surfaces.
conventional X-ray stress measurement using the scintillation counter can be easily applied to worked surfaces of TiAl intermetallic compound.
Figure 11 shows diffraction profiles obtained from worked surfaces of the dual phase equiaxed structure and the full lamellar structure by the scintillation counter. The P/B ratio of these peak profiles was better than that obtained with X-ray measurement using IP. In peak profiles obtained from ground surfaces, TM (311) and TiAl (113) diffraction lines could be distinguished. In the case of milled surfaces, on the other hand, these lines could not be
Table 2 Applicability of each measurement method to each specimen, @: residual stress was obtained with high precision, 0 : residual stress was obtained, X : residual stress was not obtained.
Specimen
Dual Base metal phase
equiaxed Grinding
structure Milling
Base metal Full
lamellar Grinding structure
Milling
ConLentional IP (software method oscillation)
0 0
0 X
0 X
X X
0 X
0 X
IP (X-Y plane oscillation)
63
X
X
63
X
X
Copyright(c)JCPDS-International Centre for Diffraction Data 2000,Advances in X-ray Analysis,Vol.43 114ISSN 1097-0002
100
State of worked surface
(a) Dual phase equiaxed structure.
100
2 0
E *-loo
b
0 8 -200
is -3w 3 %-@o
ry
-500 + s -500 so e$ co= E ai B
8” Stats of worked &face State of worked~sutface
(b) Full lamellar structure.
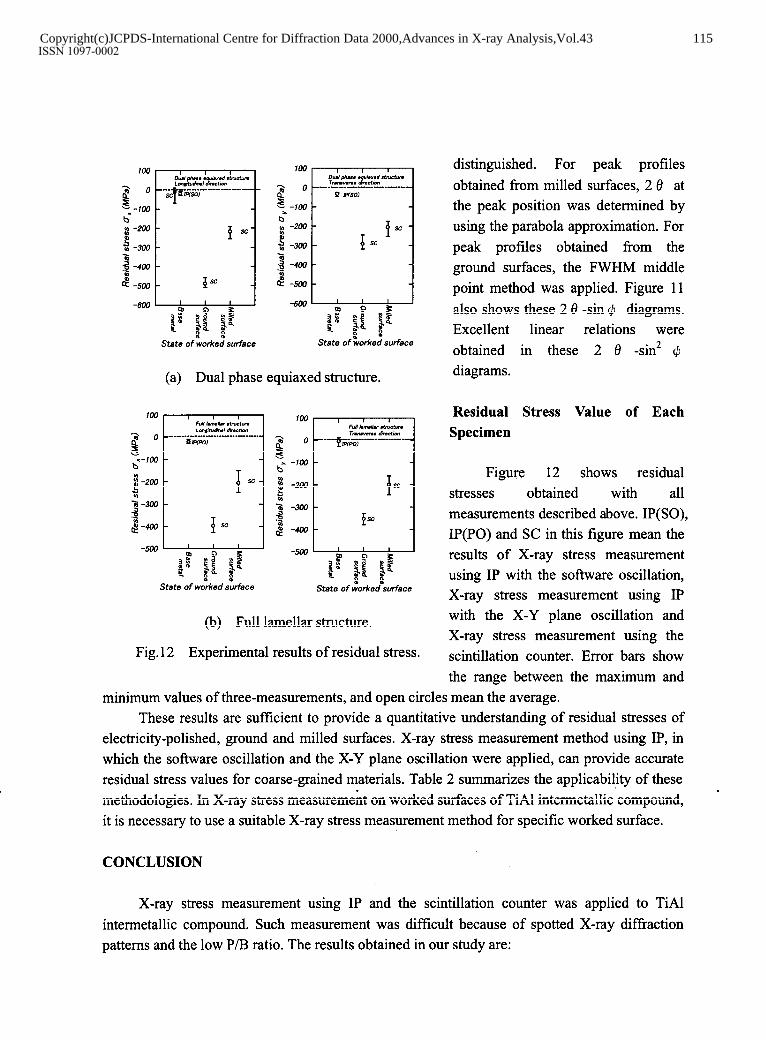
Fig. 12 Experimental results of residual stress.
distinguished. For peak profiles obtained from milled surfaces, 2 8 at the peak position was determined by using the parabola approximation. For peak profiles obtained from the ground surfaces, the FWHM middle point method was applied. Figure 11 also shows these 2 8 -sin 9 diagrams. Excellent linear relations were obtained in these 2 0 -sin2 9 diagrams.
Residual Stress Value of Each Specimen
Figure 12 shows residual stresses obtained with all measurements described above. IP(SO), IP(P0) and SC in this figure mean the results of X-ray stress measurement using IP with the software oscillation, X-ray stress measurement using IP with the X-Y plane oscillation and X-ray stress measurement using the scintillation counter. Error bars show the range between the maximum and
minimum values of three-measurements, and open circles mean the average. These results are sufficient to provide a quantitative understanding of residual stresses of
electricity-polished, ground and milled surfaces. X-ray stress measurement method using IP, in which the software oscillation and the X-Y plane oscillation were applied, can provide accurate residual stress values for coarse-grained materials. Table 2 summarizes the applicability of these methodologies. In X-ray stress measurement on worked surfaces of TiAl inter-metallic compound, it is necessary to use a suitable X-ray stress measurement method for specific worked surface.
CONCLUSION
X-ray stress measurement using IP and the scintillation counter was applied to TiAl intermetallic compound. Such measurement was difficult because of spotted X-ray diffraction patterns and the low P/B ratio. The results obtained in our study are:
Copyright(c)JCPDS-International Centre for Diffraction Data 2000,Advances in X-ray Analysis,Vol.43 115ISSN 1097-0002
(1) X-ray stress measurement using IP, in which the software oscillation and the X-Y plane oscillation were applied, was effective in determining residual stresses from coarse-grained TiAl intermetallic compound. (2) The conventional X-ray stress measurement using the scintillation counter was more effective in obtaining residual stresses from X-ray diffraction patterns of the low P/B ratio than X-ray stress measurement using IP. (3) Appropriate residual stress values on various worked surfaces of TiAl inter-metallic compound could be obtained with a proper application of X-ray stress measurement method using IP or the conventional X-ray stress measurement method using the scintillation counter.
REFERENCES
[l] H. Tabata, T. Sasaki, Z. Yajima and Y. Hirose, Journal of the Society of Materials Science, 1995,43,812-818.
[2] T. Sasaki, Y. Hirose and S. Yasukawa, Transaction of the Japan Society of Mechanical Engineering, 1997, A-63,533-541.
[3] T. Sasaki and Y. Hirose, Transaction of the Japan Society of Mechanical Ignoring, 1997, A-63, 2 196-2204.
[4] T. Sasaki, Z. Rin and Y. Hirose, Transaction of the Japan Society of Mechanical Engineering, 1997, A-62,2741-2749.
[5] T. Sasaki, Z. Rin and Y. Hirose, Transaction of the Japan Society of Mechanical Engineering, 1997, A-63,370-377.
[6] T. Sasaki, T. Goto, H. Tabata, and Y. Hirose, Journal of the Society of Materials Science, 1997,46,756-762.
[7] S. Taira, K. Tanaka and T. Yamazaki, Journal of the Society of Materials Science, 1978, 27, 251-263.
[8] T. Sasaki, and Y. Hirose, Journal of the Society of MateriaZs Science, 1995,44, 1138-l 143. [9] Society of Materials Science, X-Ray Stress Measurement revised, Yo-kendo, 1998,54-88.
Copyright(c)JCPDS-International Centre for Diffraction Data 2000,Advances in X-ray Analysis,Vol.43 116ISSN 1097-0002