xx - canadian nuclear safety commission et al. (1998). in this section the mechanical properties of...
TRANSCRIPT
Constitutive modelling of Tournemire shale
FINAL REPORT
Prepared for Canadian Nuclear Safety Commission
(Contract 87055-13-0331)
E. Haghighat & S. Pietruszczak
March 2015
RSP-0307

- 1 -
Summary This report describes the results of a project (contract # 870055-13-0331) related to constitutive modeling of the mechanical behavior of Tournemire shale. In the first part, an overview of the basic trends in the mechanical response of the shale is provided. This includes a discussion on the results of experimental tests performed under different loading conditions, including axial tension, cyclic compression and creep. The focus is on the sensitivity of material characteristics to the orientation of the bedding planes. Subsequently, the constitutive relation incorporating the notion of a scalar anisotropy parameter, which is a function of a mixed invariants of the stress and microstructure tensors, is derived. Here, an implicit integration scheme is outlined and the problem of identification of material functions/parameters is addressed in depth. The performance of the framework is verified by simulating a set of experimental results described earlier. The last part of this report is focus on the description of localized deformation that is associated with formation of macrocracks. A mathematical formulation of the problem is outlined and the proposed approach is incorporated in a finite element code. An illustrative example is provided which deals with assessment of damage formation/propagation due to excavation of a deep tunnel in Tournemire shale.
RSP-0307

- 2 -
Table of contents:
1. Task #1: A review of the experimental data on the basic trends in the mechanical response of Tournemire shale ............................................................................................................................. 3
1.1. Introduction .................................................................................................................... 3
1.2. Basic properties of Tournemire shale/argillite ............................................................... 4
1.3. Laboratory experiments by Canadian Nuclear Safety Commission-University of Ottawa-Canmet Laboratory ............................................................................................................ 5
(i) Brazilian indirect tensile tests ........................................................................................... 5
(ii) Uniaxial and triaxial compression tests ........................................................................ 6
(iii) Unconfined and confined cyclic compression tests ..................................................... 8
(iv) Creep behavior of Tournemire argillite ...................................................................... 11
1.4. Laboratory experiments by others ....................................................................................... 13
(i) Hydrostatic compression tests ......................................................................................... 13
(ii) Triaxial tests ..................................................................................................................... 13
(ii) Creep behavior of Tournemire shale ........................................................................... 20
2. Task #2: Constitutive relation for Tournemire shale - formulation, identification of material functions and numerical verification ................................................................................. 22
2.1. Formulation of the constitutive relation .............................................................................. 22
2.2. Procedure for identification of material functions/parameters ......................................... 25
2.3. Numerical integration scheme and simulation of triaxial tests ........................................ 31
3. Task #3: Description of localized deformation associated with the formation of macrocracks ................................................................................................................................... 36
3.1. Formulation of the problem .................................................................................................. 36
3.2. Numerical example ................................................................................................................ 37
4. References ........................................................................................................................................ 43
RSP-0307
- 3 -
General This project was related to the development and numerical implementation of a constitutive framework which describes the mechanical response of Tournemire shale. The project started in November 2013 and the three main tasks involved:
1. Conducting a review of the laboratory data on the basic trends in the mechanical response of Tournemire shale.
2. Development of a constitutive relation for Tournemire shale/argillite: formulation of the model, identification of material functions and numerical verification.
3. Description of localized deformation involving formation of macrocracks. Section 1 contains the work described in the first progress report, which deals with Task #1, i.e. a comprehensive review of the available experimental data. Section 2 gives first an outline of the formulation of the constitutive relation. Subsequently, the problem of identification of material parameters/functions embedded in the model is addressed. Later, an algorithm for numerical integration, based on an implicit scheme, is derived and the numerical simulations of experimental tests reviewed in Section 1 are provided. The material contained here is a major part of the second progress report. The last section, i.e. Section 3, addresses the Task #3, i.e. presents a framework for modelling of localized deformation. The approach is illustrated by presenting the results of a finite element analysis which deals with the problem of crack initiation in a deep underground tunnel which is excavated in Tournemire shale.
1. Task #1: A review of the experimental data on the basic trends in the mechanical response of Tournemire shale
1.1. Introduction
Argillaceous sedimentary rocks are typically formed by deposition and progressive consolidation (including diagenetic processes) of marine sediments. They exhibit a strong degree of inherent anisotropy (transverse isotropy), so that their stiffness and strength properties are directionally dependent. The anisotropy is due to the oriented microstructure, particularly the presence of bedding planes that can be easily seen by a visual inspection. Over the last few decades, an extensive research effort has been devoted to study the mechanical behaviour of anisotropic rocks. Comprehensive references on this topic can be found in a number of review papers (see e.g., Amadei (1983), Kwasniewski (1993) and Ramamurthy (1993)). The notion of transverse isotropy in geomaterials has been examined mainly through triaxial tests, and has been found of a significant importance in the analysis and design of a variety of geotechnical structures, such as foundations, retaining walls and slopes (Casagrande and Carillo, 1944; Arthur and Menzies, 1972; Oda et al., 1978). Other experimentally observed features, like the onset of
RSP-0307
- 4 -
shear banding and the influence of the intermediate principal stress, which cannot be properly described by isotropic criteria, have also been extensively examined (e.g., Zhiwei Gao et al. 2010). For sedimentary rocks, the strength has been found to be strongly affected by the loading direction. A large number of triaxial compression tests have been conducted on oriented samples (cf. Donath (1961), McLamore and Gray (1967), Hoek (1968), Atwell and Sandford (1974), Lerau et al. (1981) and Hoek (1983)) and the results generally indicate that the maximum strength is associated with specimens in which the direction of major principal stress is either parallel or perpendicular to the bedding planes, while the minimum strength has been observed for orientations between 30 and 60 degrees. In parallel with experimental studies, an extensive research has been carried out on formulation of appropriate general failure criteria. A comprehensive review on this topic, examining different approaches, is provided in the article by Duveau et al. (1998). In this section the mechanical properties of Tournemire shale/argillite are reviewed. In particular, the basic trends in the experimental results are discussed, which are important in the context of the development of a constitutive model that describes the strength and deformation characteristics (Section 2).
1.2. Basic properties of Tournemire shale/argillite
The Tournemire shale/argillite is located in a Mesozoic marine basin on the south limit of the French Massif Central. Sedimentary formations of this basin are characterized by three main Jurassic layers: a 250 m thick nearly horizontal layer of argillite and marls of Toarcian and Domerian age, located between two aquifer limestone and dolomite layers of Carixian and Alenian Age (Abdi and Evgin, 2013). The basic properties of the Tournemire shale/argillite are shown in the tables below.
The mineralogical composition of the Tournemire shale (Niandou et al., 1997)
Mineralogical composition Weight Proportion (%)(a)
Kaolinite 27.5% Illite 16.5% Quartz 19% Calcite 15% Chlorite 2.7% Interstratifier 8.3% Other minerals (pyrite, siderite, feldspars, ...) 11% Water 4.5 to 8%
RSP-0307
- 5 -
Physico-chemical properties of the Tournemire argillite (Bonin, 1998)
Density ρ= 2.5-2.8e3 kg/m3Pore size a= centered around 2.5 mm Porosity ω= 6-9 % Specific surface area S= 20-40 m2/g Cation exchange capacity (on total rock) CEC=10 meq/100g Capillary pressure (typical value at w=3%) Pc= 5-40 MPa Hydraulic permeability K= 10e-14−10e-15 m/s (samples)
K=10e-13−10e-14 m/s (in situ) Effective diffusivity (for tritiated water) De= 2−4e-12 m2/s
Main mechanical-thermal properties of the Tournemire argillite (Bonin, 1998)
Young moduli E= 8000 to 30,000 MPa Poisson coefficients υ= 0.15 to 0.25 Uniaxial compressive stress fc = 18 to 33 MPa Thermal conductivity λ= 1.6 to 1.8 W m-1 K-1 Heat capacity C= 1.8 to 1.9e6 J m-3 K-1
1.3. Laboratory experiments by Canadian Nuclear Safety Commission-University of Ottawa-Canmet Laboratory
Below is a brief review of the experimental data on the behaviour of Tournemire shale/argillite taken from the CNSC report by Abdi & Evgin (2013). The objective here is to review the basic trends and identify the specific tests that can be used for identification of the material parameters/functions and verification of the constitutive described in Section 2.
(i) Brazilian indirect tensile tests
The variation of tensile strength with loading orientation (relative to bedding planes) is shown in Fig.1 below. The strength varies between 4.8-6 MPa with the average value in the range of 5-5.5MPa. It should be noted that the distribution of the tensile strength exhibits a different trend than the distribution of compressive strength which should, in general, be accounted for in the formulation of the problem.
RSP-0307

- 6 -
Fig.1. Variation of the tensile strength with loading orientation, θ
(ii) Uniaxial and triaxial compression tests
A series of triaxial compression tests were performed on specimens with different loading orientations and different confining pressures. The typical deviatoric stress-strain and volume change characteristics are shown in Figs.2-3 below.
Fig. 2. Deviatoric stress-axial strain characteristics for different loading orientations, θ, and the confining pressures
RSP-0307

- 7 -
Fig.3. Deviatoric stress-volumetric strain curves for different loading orientations, θ, and the confining
pressures
In general, the inelastic deformations develop virtually from the onset of the loading process, which is due to closure of the existing fissures. Within the considered range of confining pressures, the failure mode is predominantly brittle and is associated with strain softening. The ultimate strength and the maximum volume change are strongly influenced by the orientation of the sample. The material displays a contractive behavior up to the peak strength followed by a transition to dilatancy, which is mainly due to rapid propagation and coalescence of microcracks. Also, there is an evidence that the compressibility and the shear behaviour of bedding planes play a significant role in the deformation of argillite at the macroscale (Abdi & Evgin, 2013).
RSP-0307
- 8 -
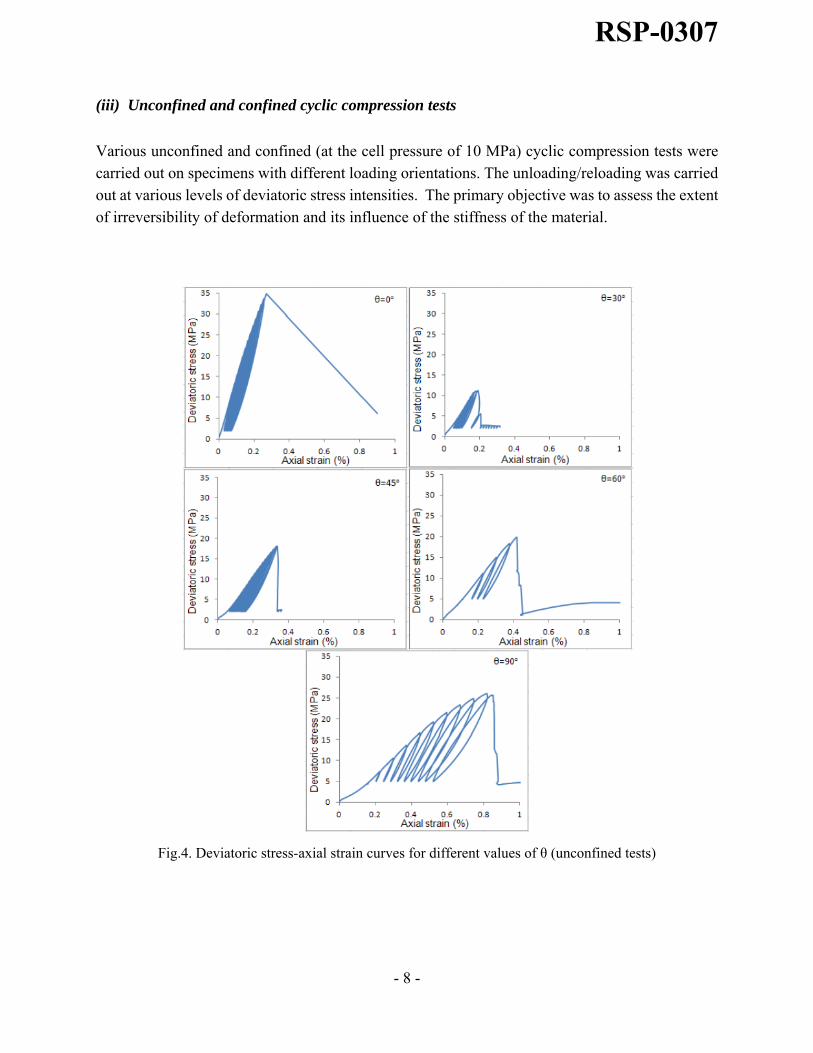
(iii) Unconfined and confined cyclic compression tests
Various unconfined and confined (at the cell pressure of 10 MPa) cyclic compression tests were carried out on specimens with different loading orientations. The unloading/reloading was carried out at various levels of deviatoric stress intensities. The primary objective was to assess the extent of irreversibility of deformation and its influence of the stiffness of the material.
Fig.4. Deviatoric stress-axial strain curves for different values of θ (unconfined tests)
RSP-0307
- 9 -
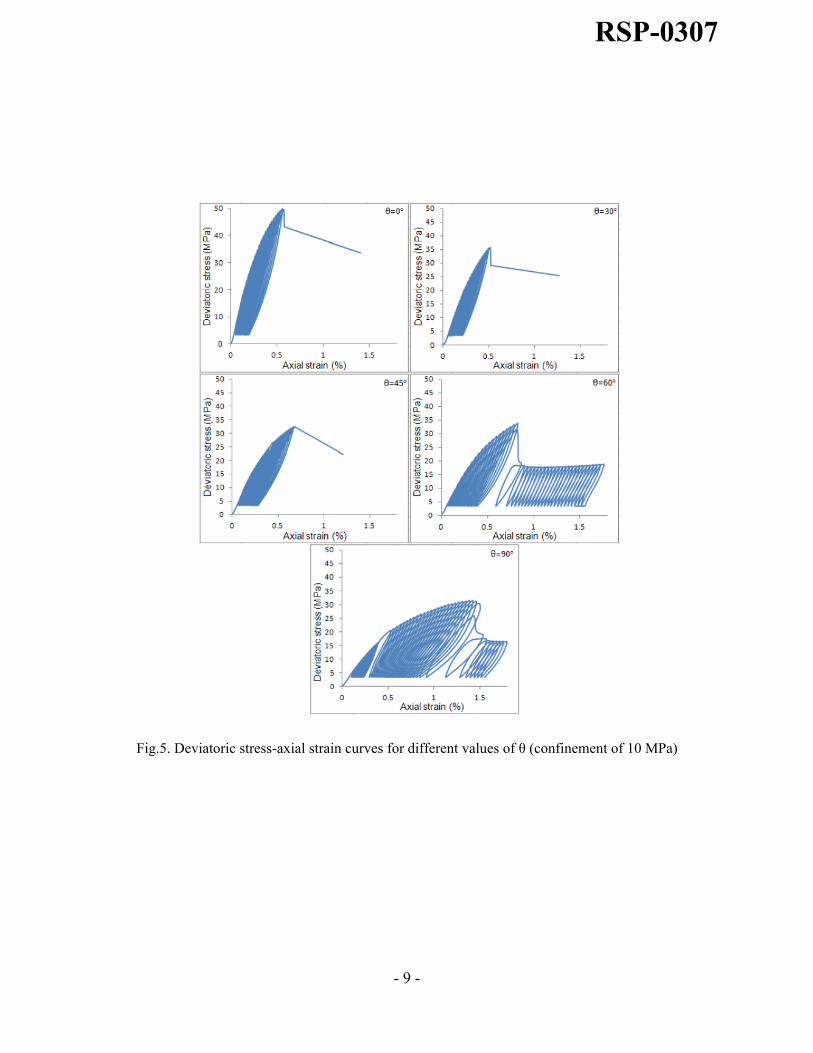
Fig.5. Deviatoric stress-axial strain curves for different values of θ (confinement of 10 MPa)
RSP-0307
- 10 -
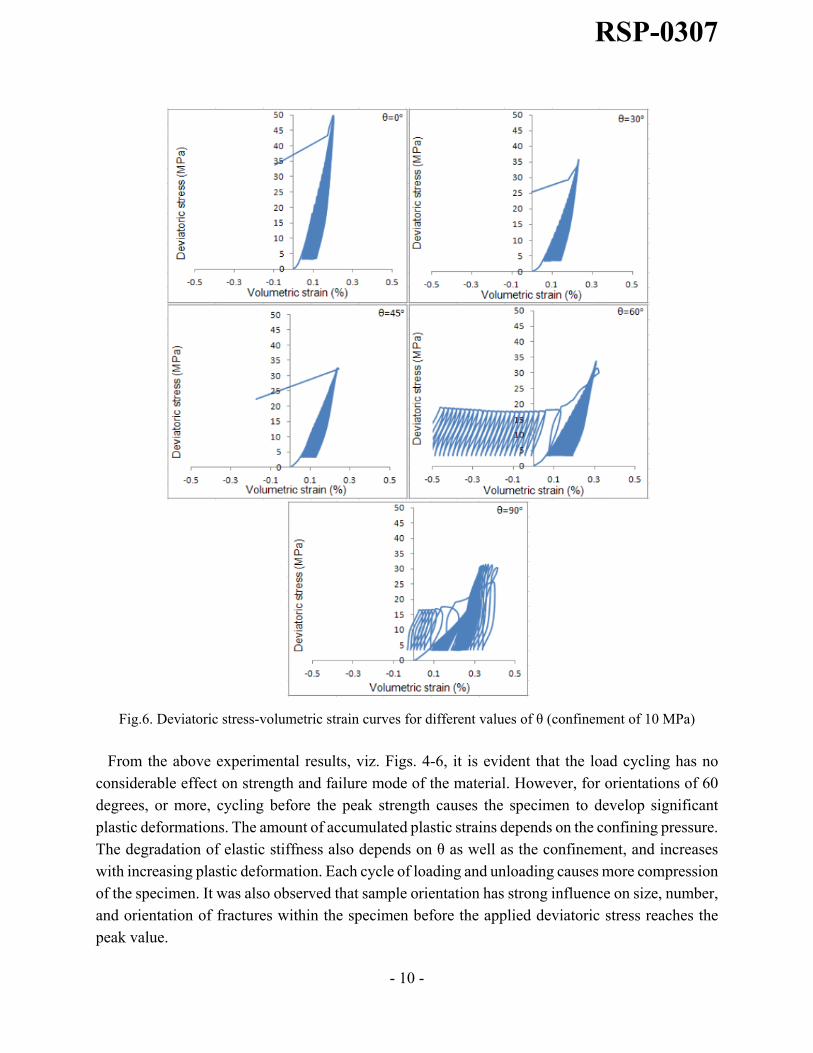
Fig.6. Deviatoric stress-volumetric strain curves for different values of θ (confinement of 10 MPa)
From the above experimental results, viz. Figs. 4-6, it is evident that the load cycling has no considerable effect on strength and failure mode of the material. However, for orientations of 60 degrees, or more, cycling before the peak strength causes the specimen to develop significant plastic deformations. The amount of accumulated plastic strains depends on the confining pressure. The degradation of elastic stiffness also depends on θ as well as the confinement, and increases with increasing plastic deformation. Each cycle of loading and unloading causes more compression of the specimen. It was also observed that sample orientation has strong influence on size, number, and orientation of fractures within the specimen before the applied deviatoric stress reaches the peak value.
RSP-0307
- 11 -
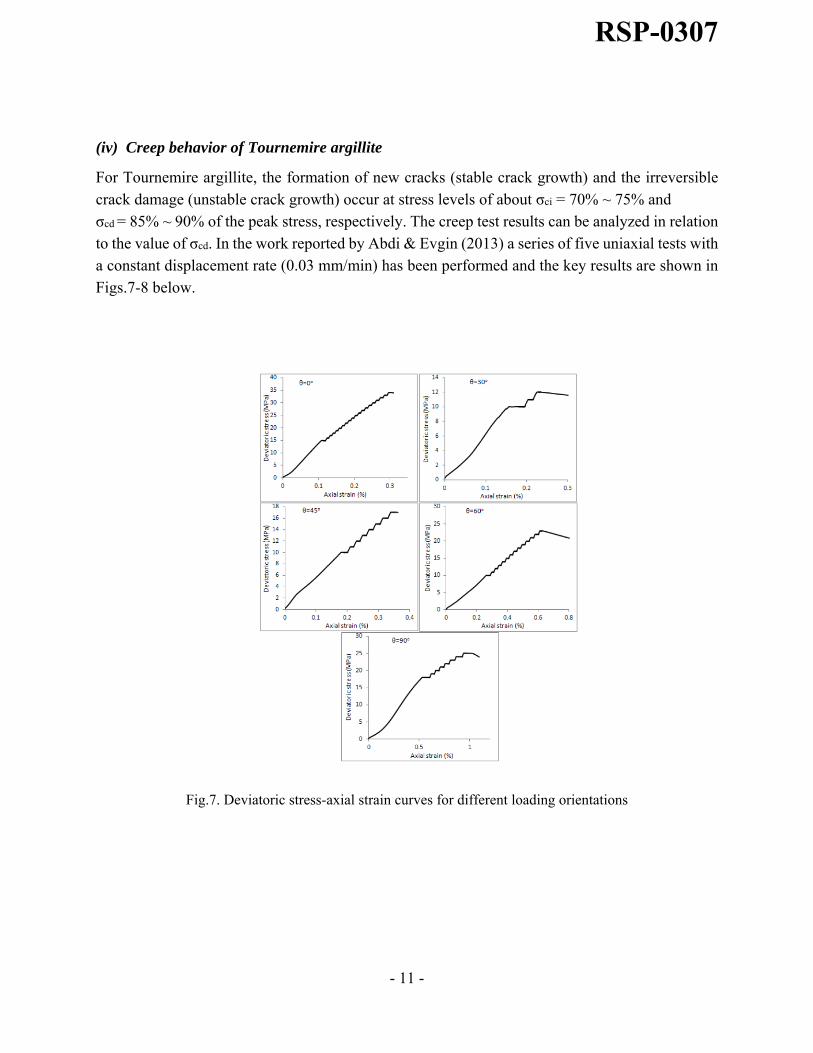
(iv) Creep behavior of Tournemire argillite
For Tournemire argillite, the formation of new cracks (stable crack growth) and the irreversible crack damage (unstable crack growth) occur at stress levels of about σci = 70% ~ 75% and σcd = 85% ~ 90% of the peak stress, respectively. The creep test results can be analyzed in relation to the value of σcd. In the work reported by Abdi & Evgin (2013) a series of five uniaxial tests with a constant displacement rate (0.03 mm/min) has been performed and the key results are shown in Figs.7-8 below.
Fig.7. Deviatoric stress-axial strain curves for different loading orientations
RSP-0307

- 12 -
Fig.8. Axial strain-time curves for different loading orientations
In each test the axial strain was increased to a prescribed level after which the load was maintained constant for a period of 1 hr. This was repeated for a number of increments until the failure occurred. From the experimental data, it was concluded that if the deviatoric stress intensity is lower than σcd, the creep in Tournemire argillite is not very significant. However, when the deviatoric stress exceeds σcd, the increase in axial strain during creep period, and therefore the damage due to unstable crack propagation, become more substantial. At this stress level, a longer period of creep might cause the failure of the material. Compared to the results of uniaxial tests, larger axial strain is measured at peak load in creep tests.
RSP-0307
- 13 -
1.4. Laboratory experiments by others
(i) Hydrostatic compression tests
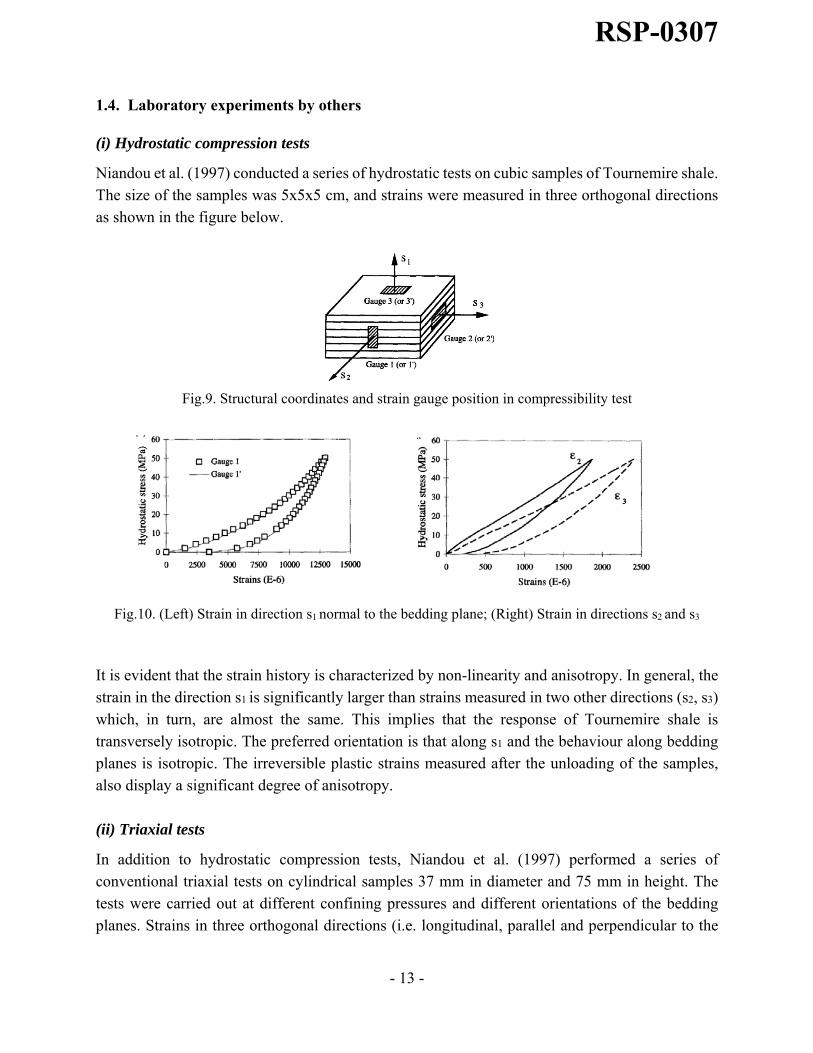
Niandou et al. (1997) conducted a series of hydrostatic tests on cubic samples of Tournemire shale. The size of the samples was 5x5x5 cm, and strains were measured in three orthogonal directions as shown in the figure below.
Fig.9. Structural coordinates and strain gauge position in compressibility test
Fig.10. (Left) Strain in direction s1 normal to the bedding plane; (Right) Strain in directions s2 and s3
It is evident that the strain history is characterized by non-linearity and anisotropy. In general, the strain in the direction s1 is significantly larger than strains measured in two other directions (s2, s3) which, in turn, are almost the same. This implies that the response of Tournemire shale is transversely isotropic. The preferred orientation is that along s1 and the behaviour along bedding planes is isotropic. The irreversible plastic strains measured after the unloading of the samples, also display a significant degree of anisotropy.
(ii) Triaxial tests
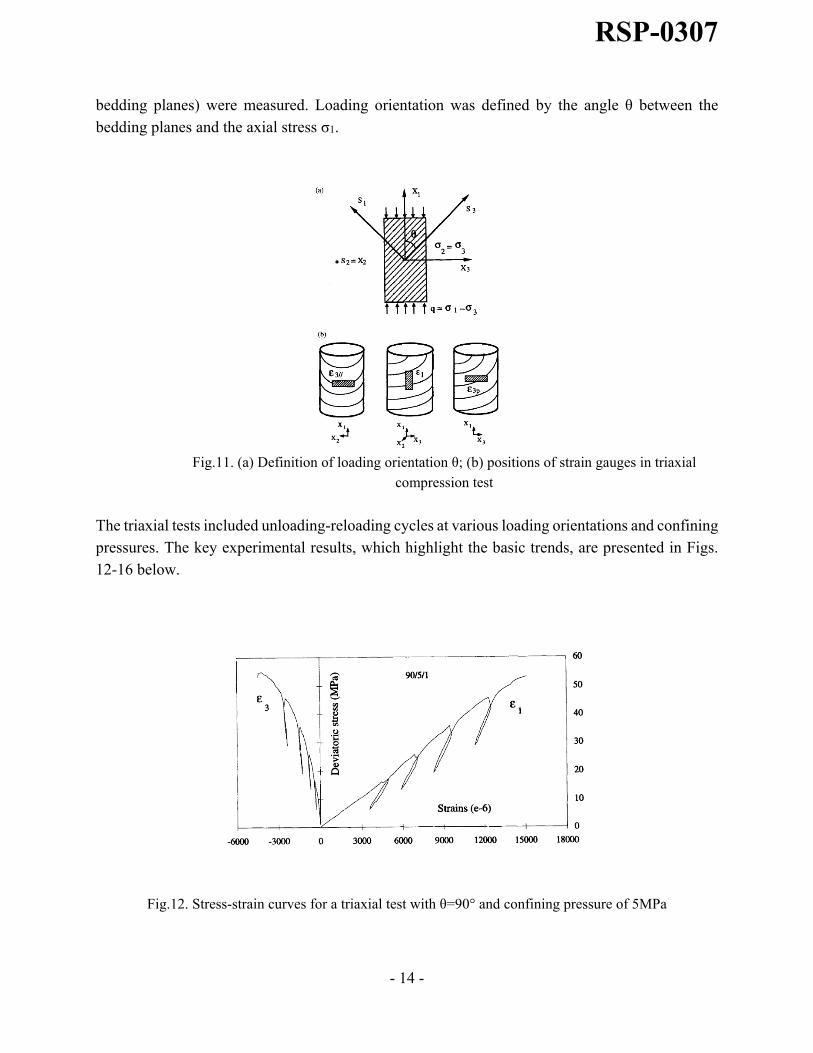
In addition to hydrostatic compression tests, Niandou et al. (1997) performed a series of conventional triaxial tests on cylindrical samples 37 mm in diameter and 75 mm in height. The tests were carried out at different confining pressures and different orientations of the bedding planes. Strains in three orthogonal directions (i.e. longitudinal, parallel and perpendicular to the
RSP-0307
- 14 -
bedding planes) were measured. Loading orientation was defined by the angle θ between the bedding planes and the axial stress σ1.
Fig.11. (a) Definition of loading orientation θ; (b) positions of strain gauges in triaxial
compression test
The triaxial tests included unloading-reloading cycles at various loading orientations and confining pressures. The key experimental results, which highlight the basic trends, are presented in Figs. 12-16 below.
Fig.12. Stress-strain curves for a triaxial test with θ=90° and confining pressure of 5MPa
RSP-0307
- 15 -
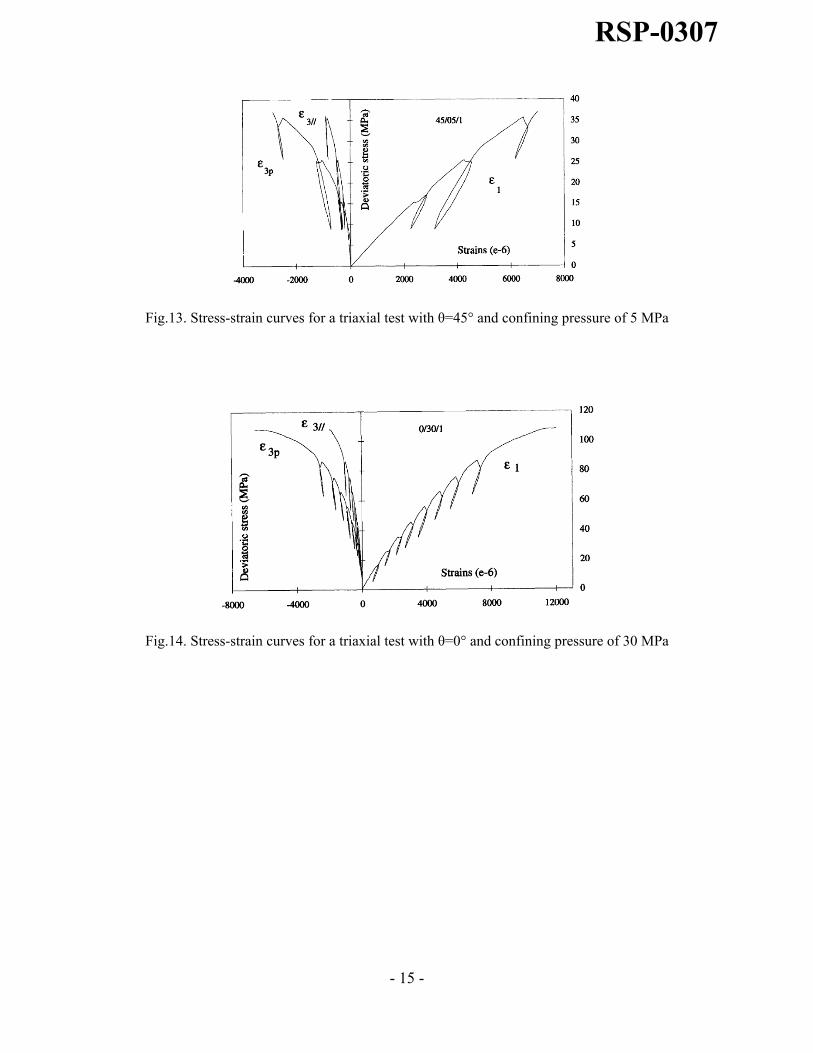
Fig.13. Stress-strain curves for a triaxial test with θ=45° and confining pressure of 5 MPa
Fig.14. Stress-strain curves for a triaxial test with θ=0° and confining pressure of 30 MPa
RSP-0307
- 16 -
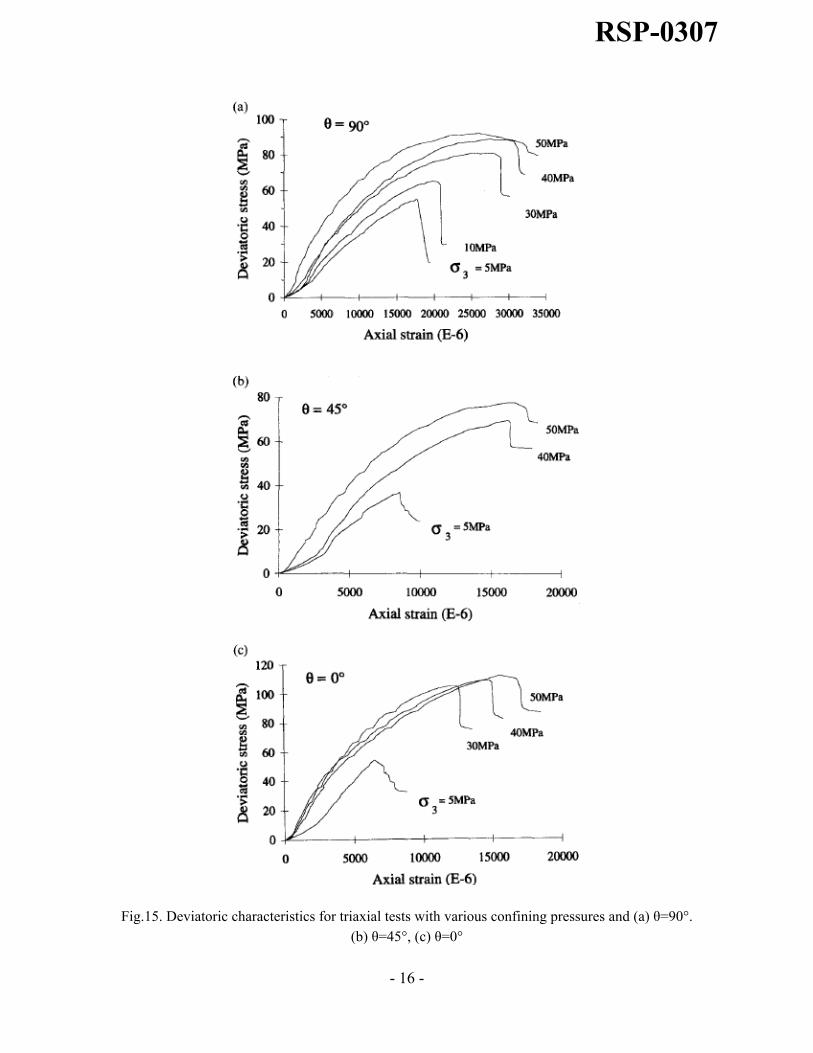
Fig.15. Deviatoric characteristics for triaxial tests with various confining pressures and (a) θ=90°. (b) θ=45°, (c) θ=0°
RSP-0307
- 17 -
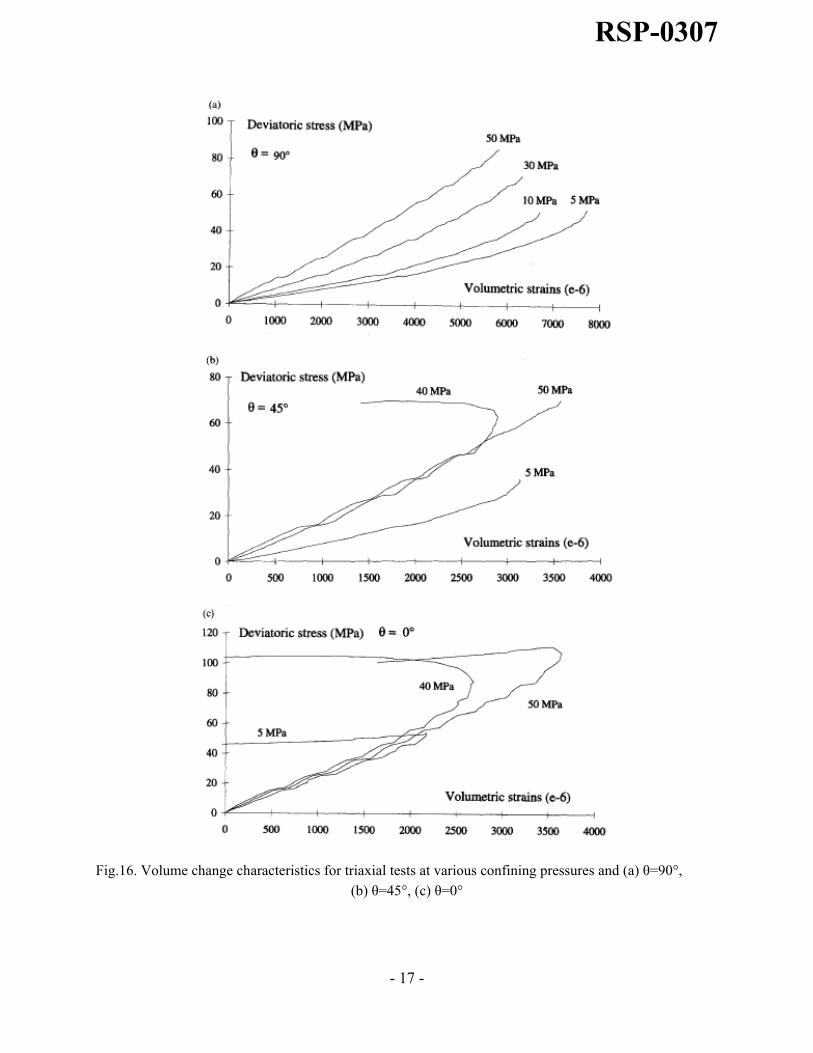
Fig.16. Volume change characteristics for triaxial tests at various confining pressures and (a) θ=90°, (b) θ=45°, (c) θ=0°
RSP-0307
- 18 -
According to Niandou et al. (1997), the main conclusions emerging from these tests are as follows:
(1) For samples tested at θ=90°, both transversal strains are equal. For orientations other than 90°, the normal strains perpendicular to the bedding planes are larger than those in the direction along those planes.
(2) Stress-strain relations show significant non-linearity and irreversibility of deformation. After unloading, approx. 50% of the total deformation is in the plastic range for both longitudinal and transversal directions.
(3) The failure mode evolves with the confining pressure. At high pressures, the response is ductile. At low confinement, the strain softening behaviour, associated with brittle failure, takes place.
(4) The volumetric deformation of Tournemire shale is orientation-dependent and is mostly compactive with a transition to dilatant behaviour occurring near the peak stress. At θ=90°, a continuous compaction occurs as the volumetric strain is primarily due to the closure of the bedding planes. However at θ=0° the bedding planes are parallel to the axial stress, so that a significant dilatancy takes place when deviatoric stress reaches the maximum intensity.
(5) The degree of strength anisotropy is larger at lower confining pressures than at higher ones.
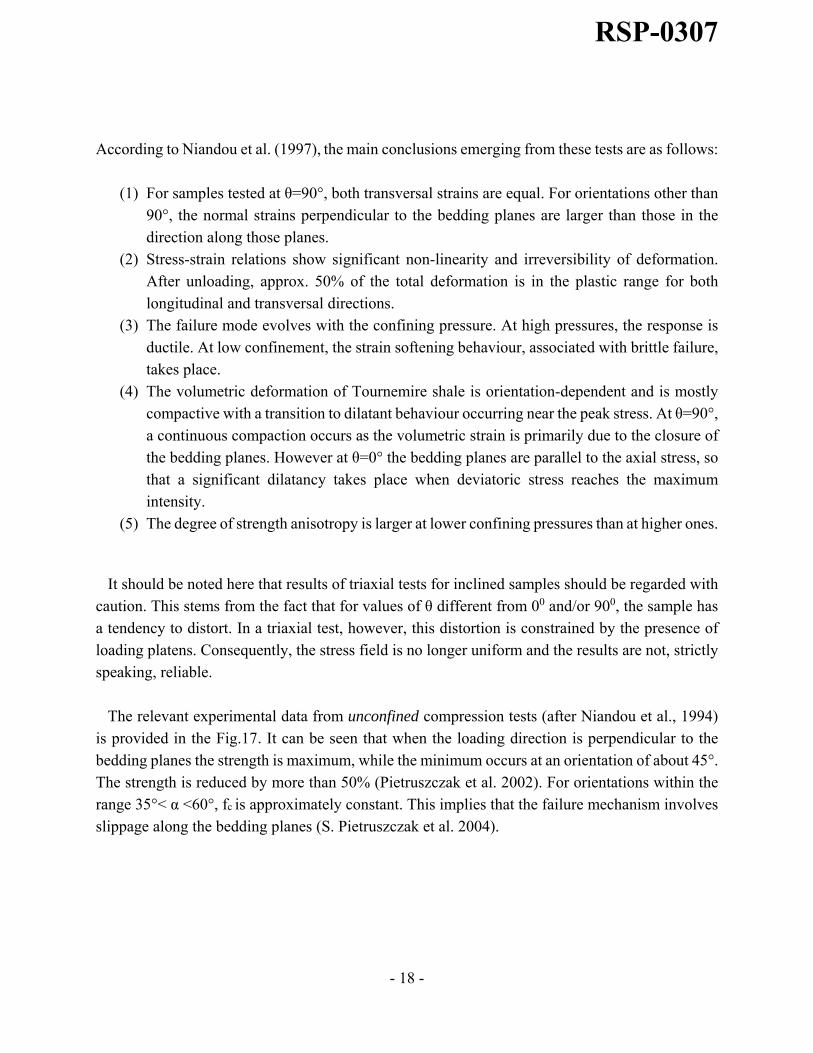
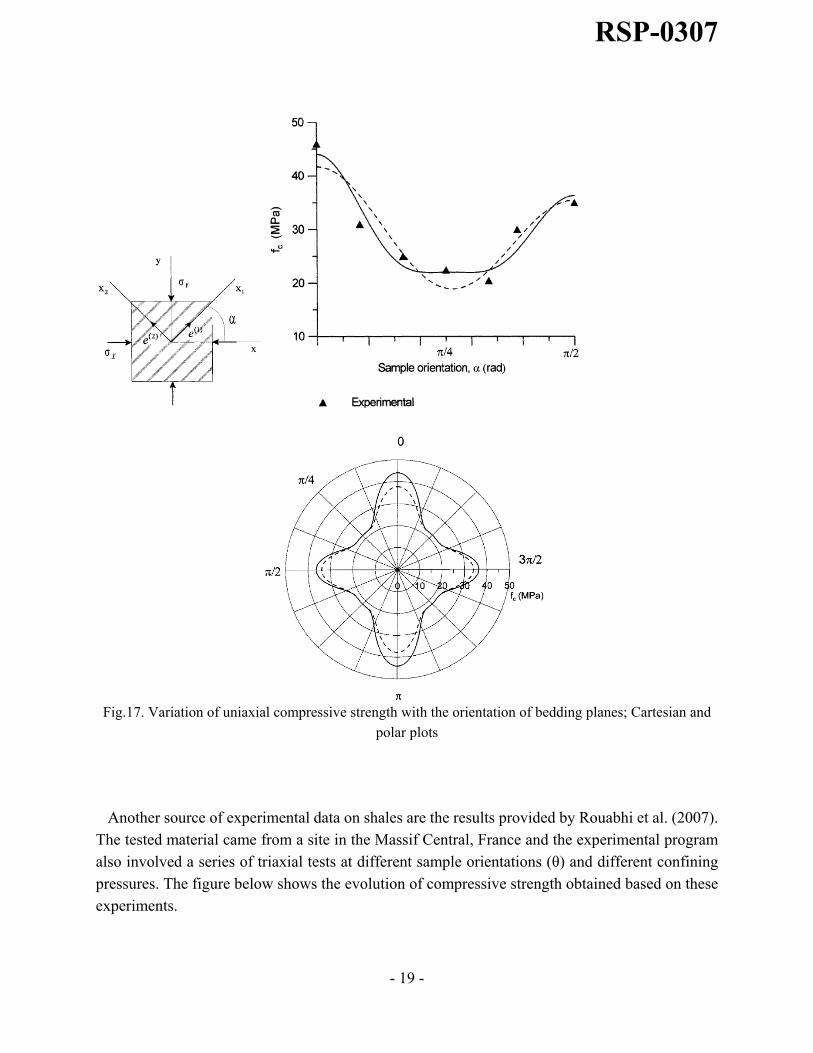
It should be noted here that results of triaxial tests for inclined samples should be regarded with caution. This stems from the fact that for values of θ different from 00 and/or 900, the sample has a tendency to distort. In a triaxial test, however, this distortion is constrained by the presence of loading platens. Consequently, the stress field is no longer uniform and the results are not, strictly speaking, reliable. The relevant experimental data from unconfined compression tests (after Niandou et al., 1994)
is provided in the Fig.17. It can be seen that when the loading direction is perpendicular to the bedding planes the strength is maximum, while the minimum occurs at an orientation of about 45°. The strength is reduced by more than 50% (Pietruszczak et al. 2002). For orientations within the range 35°< α <60°, fc is approximately constant. This implies that the failure mechanism involves slippage along the bedding planes (S. Pietruszczak et al. 2004).
RSP-0307
- 19 -
Fig.17. Variation of uniaxial compressive strength with the orientation of bedding planes; Cartesian and
polar plots
Another source of experimental data on shales are the results provided by Rouabhi et al. (2007). The tested material came from a site in the Massif Central, France and the experimental program also involved a series of triaxial tests at different sample orientations (θ) and different confining pressures. The figure below shows the evolution of compressive strength obtained based on these experiments.
RSP-0307
- 20 -
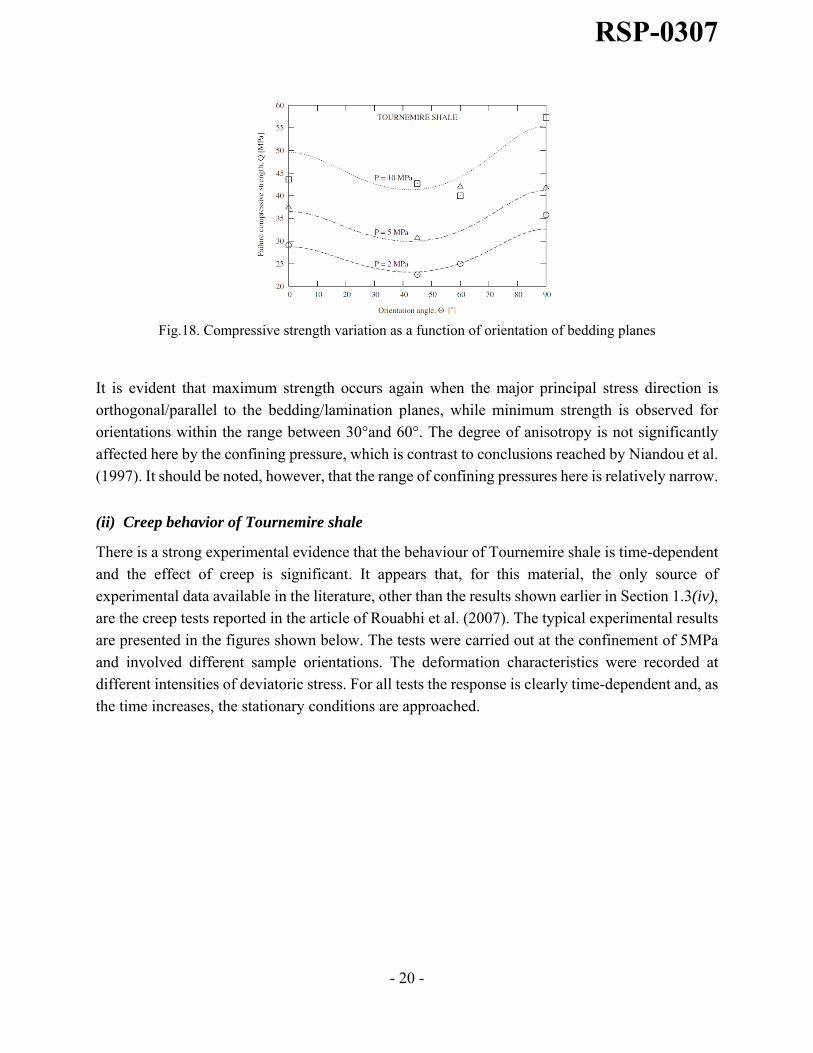
Fig.18. Compressive strength variation as a function of orientation of bedding planes
It is evident that maximum strength occurs again when the major principal stress direction is orthogonal/parallel to the bedding/lamination planes, while minimum strength is observed for orientations within the range between 30°and 60°. The degree of anisotropy is not significantly affected here by the confining pressure, which is contrast to conclusions reached by Niandou et al. (1997). It should be noted, however, that the range of confining pressures here is relatively narrow.
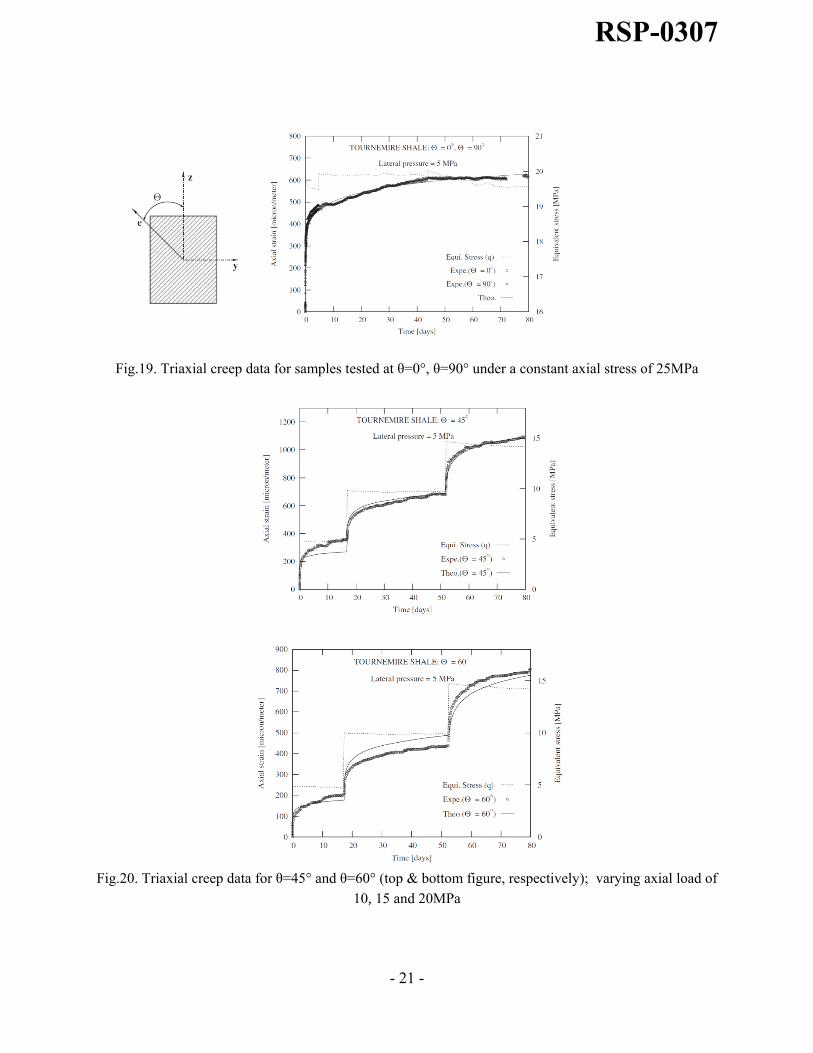
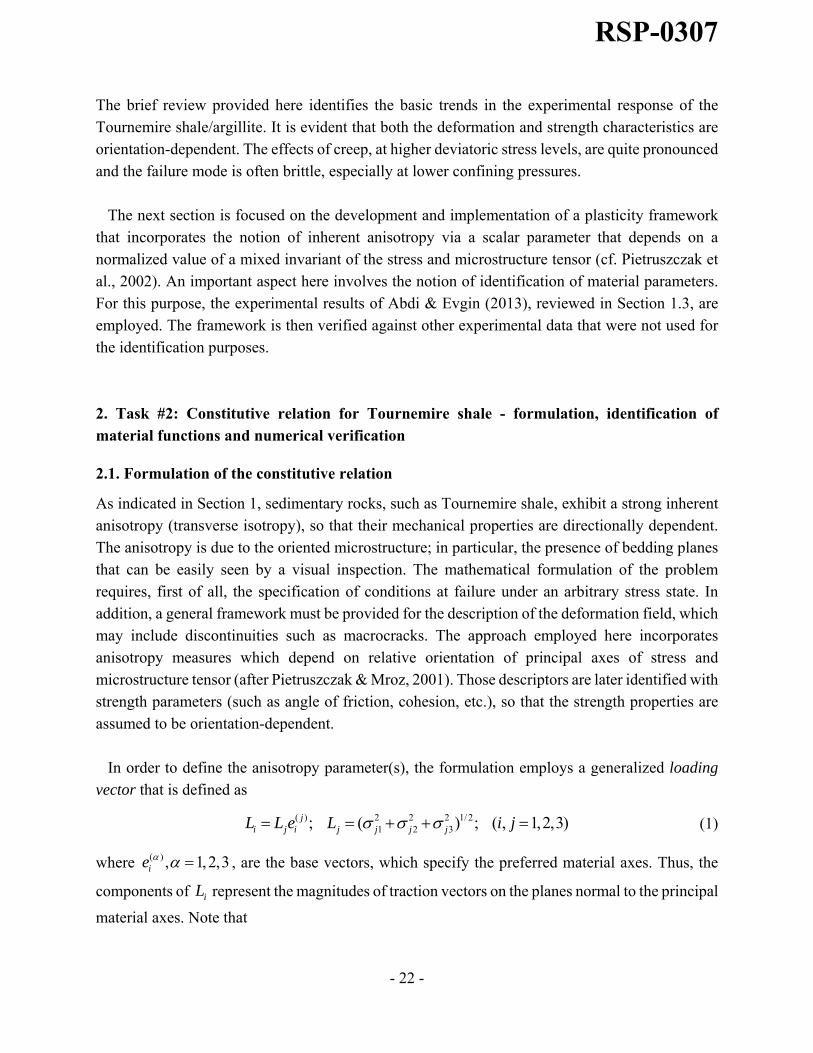
(ii) Creep behavior of Tournemire shale
There is a strong experimental evidence that the behaviour of Tournemire shale is time-dependent and the effect of creep is significant. It appears that, for this material, the only source of experimental data available in the literature, other than the results shown earlier in Section 1.3(iv), are the creep tests reported in the article of Rouabhi et al. (2007). The typical experimental results are presented in the figures shown below. The tests were carried out at the confinement of 5MPa and involved different sample orientations. The deformation characteristics were recorded at different intensities of deviatoric stress. For all tests the response is clearly time-dependent and, as the time increases, the stationary conditions are approached.
RSP-0307
- 21 -
Fig.19. Triaxial creep data for samples tested at θ=0°, θ=90° under a constant axial stress of 25MPa
Fig.20. Triaxial creep data for θ=45° and θ=60° (top & bottom figure, respectively); varying axial load of
10, 15 and 20MPa
RSP-0307
- 22 -
The brief review provided here identifies the basic trends in the experimental response of the Tournemire shale/argillite. It is evident that both the deformation and strength characteristics are orientation-dependent. The effects of creep, at higher deviatoric stress levels, are quite pronounced and the failure mode is often brittle, especially at lower confining pressures. The next section is focused on the development and implementation of a plasticity framework that incorporates the notion of inherent anisotropy via a scalar parameter that depends on a normalized value of a mixed invariant of the stress and microstructure tensor (cf. Pietruszczak et al., 2002). An important aspect here involves the notion of identification of material parameters. For this purpose, the experimental results of Abdi & Evgin (2013), reviewed in Section 1.3, are employed. The framework is then verified against other experimental data that were not used for the identification purposes.
2. Task #2: Constitutive relation for Tournemire shale - formulation, identification of material functions and numerical verification
2.1. Formulation of the constitutive relation
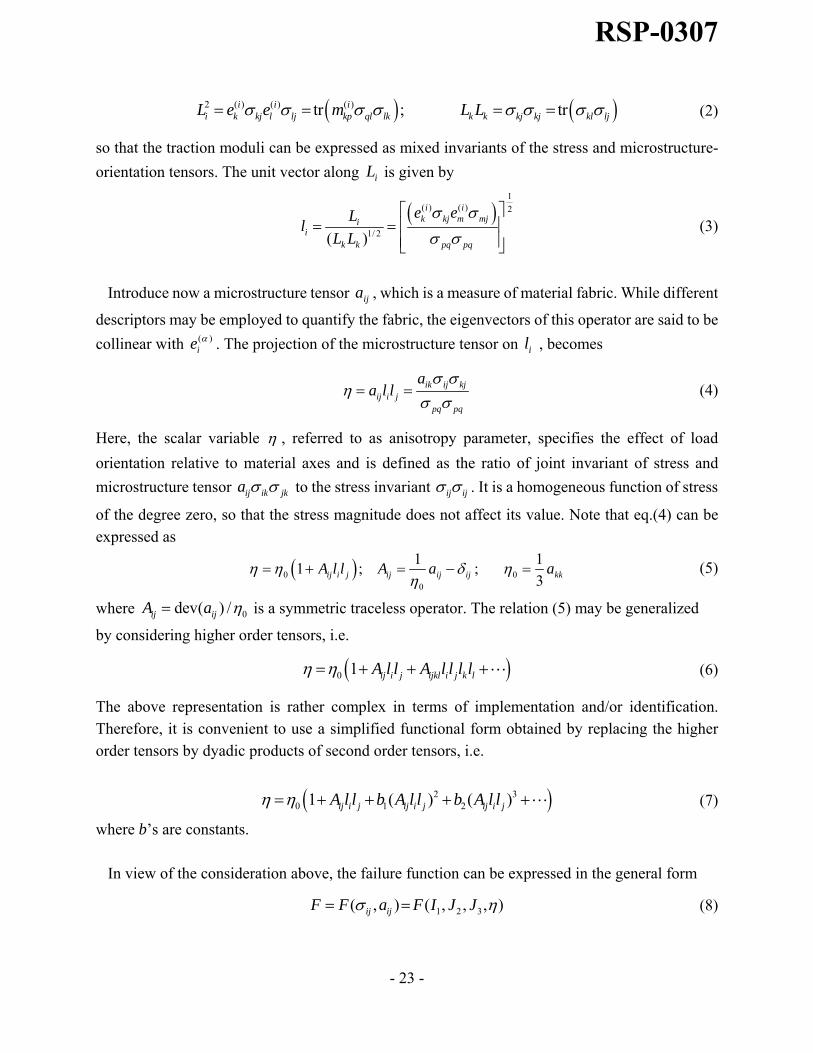
As indicated in Section 1, sedimentary rocks, such as Tournemire shale, exhibit a strong inherent anisotropy (transverse isotropy), so that their mechanical properties are directionally dependent. The anisotropy is due to the oriented microstructure; in particular, the presence of bedding planes that can be easily seen by a visual inspection. The mathematical formulation of the problem requires, first of all, the specification of conditions at failure under an arbitrary stress state. In addition, a general framework must be provided for the description of the deformation field, which may include discontinuities such as macrocracks. The approach employed here incorporates anisotropy measures which depend on relative orientation of principal axes of stress and microstructure tensor (after Pietruszczak & Mroz, 2001). Those descriptors are later identified with strength parameters (such as angle of friction, cohesion, etc.), so that the strength properties are assumed to be orientation-dependent. In order to define the anisotropy parameter(s), the formulation employs a generalized loading vector that is defined as
( ) 2 2 2 1/ 21 2 3; ( ) ; ( , 1,2,3)j
i j i j j j jL L e L i j (1)
where ( ) , 1,2,3ie , are the base vectors, which specify the preferred material axes. Thus, the
components of iL represent the magnitudes of traction vectors on the planes normal to the principal
material axes. Note that
RSP-0307
- 23 -
2 ( ) ( ) ( )tr ; tri i ii k kj l lj kp ql lk k k kj kj kl ljL e e m L L (2)
so that the traction moduli can be expressed as mixed invariants of the stress and microstructure-
orientation tensors. The unit vector along iL is given by
1( ) ( ) 2
1/ 2( )
i ik kj m mji
ik k pq pq
e eLl
L L
(3)
Introduce now a microstructure tensor ija , which is a measure of material fabric. While different
descriptors may be employed to quantify the fabric, the eigenvectors of this operator are said to be
collinear with ( )ie . The projection of the microstructure tensor on il , becomes
ik ij kjij i j
pq pq
aa l l
(4)
Here, the scalar variable , referred to as anisotropy parameter, specifies the effect of load
orientation relative to material axes and is defined as the ratio of joint invariant of stress and
microstructure tensor ij ik jka to the stress invariant ij ij . It is a homogeneous function of stress
of the degree zero, so that the stress magnitude does not affect its value. Note that eq.(4) can be expressed as
0 00
1 11 ; ;
3ij i j ij ij ij kkA l l A a a
(5)
where 0dev( ) /ij ijA a is a symmetric traceless operator. The relation (5) may be generalized
by considering higher order tensors, i.e.
0 1 ij i j ijkl i j k lA l l A l l l l (6)
The above representation is rather complex in terms of implementation and/or identification. Therefore, it is convenient to use a simplified functional form obtained by replacing the higher order tensors by dyadic products of second order tensors, i.e.
2 30 1 21 ( ) ( )ij i j ij i j ij i jA l l b A l l b A l l (7)
where b’s are constants. In view of the consideration above, the failure function can be expressed in the general form
1 2 3( , ) ( , , , )ij ijF F a F I J J (8)
RSP-0307
- 24 -
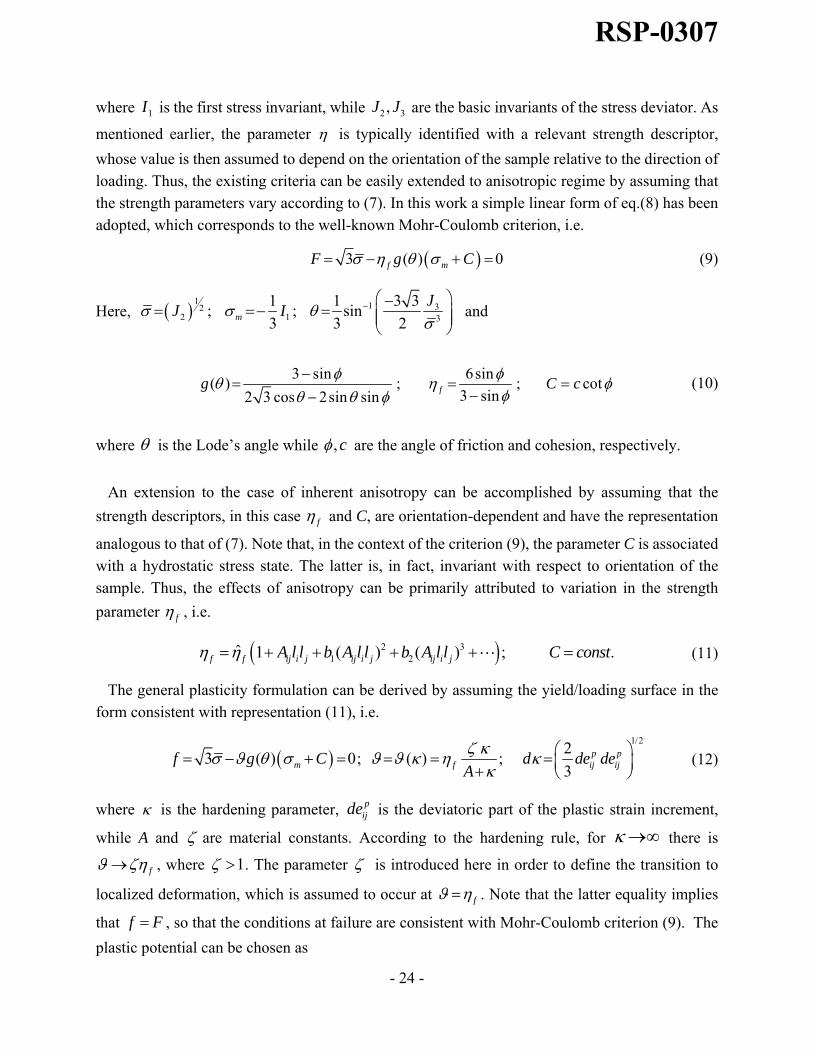
where 1I is the first stress invariant, while 2 3,J J are the basic invariants of the stress deviator. As
mentioned earlier, the parameter is typically identified with a relevant strength descriptor,
whose value is then assumed to depend on the orientation of the sample relative to the direction of loading. Thus, the existing criteria can be easily extended to anisotropic regime by assuming that the strength parameters vary according to (7). In this work a simple linear form of eq.(8) has been adopted, which corresponds to the well-known Mohr-Coulomb criterion, i.e.
3 ( ) 0f mF g C (9)
Here, 1 1 32
2 1 3
1 1 3 3; ; sin
3 3 2m
JJ I
and
3 sin 6sin
( ) ; ; cot3 sin2 3 cos 2sin sin
fg C c
(10)
where is the Lode’s angle while ,c are the angle of friction and cohesion, respectively.
An extension to the case of inherent anisotropy can be accomplished by assuming that the
strength descriptors, in this case f and C, are orientation-dependent and have the representation
analogous to that of (7). Note that, in the context of the criterion (9), the parameter C is associated with a hydrostatic stress state. The latter is, in fact, invariant with respect to orientation of the sample. Thus, the effects of anisotropy can be primarily attributed to variation in the strength
parameter f , i.e.
2 31 2
ˆ 1 ( ) ( ) ; .f f ij i j ij i j ij i jA l l b A l l b A l l C const (11)
The general plasticity formulation can be derived by assuming the yield/loading surface in the form consistent with representation (11), i.e.
1/2
23 ( ) 0; ( ) ;
3p p
m f ij ijf g C d de deA
(12)
where is the hardening parameter, pijde is the deviatoric part of the plastic strain increment,
while A and are material constants. According to the hardening rule, for there is
f , where 1 . The parameter is introduced here in order to define the transition to
localized deformation, which is assumed to occur at f . Note that the latter equality implies
that f F , so that the conditions at failure are consistent with Mohr-Coulomb criterion (9). The
plastic potential can be chosen as
RSP-0307
- 25 -
0
3 ( ) ln 0mc m
m
Cg C
(13)
where c f , so that ( )c c il . Following now the standard plasticity procedure, i.e. invoking
the consistency condition 0df , yields
12
1 2; ;
3p
p ij pijij ij ij ij
f fd d d H d H dev dev
(14)
where pH is the plastic hardening modulus.
For the functional form (12), the gradient operator can be expressed as
fm
ij m ij ij ij f ij
f f f f f
(15)
so that the effect of anisotropy is embedded in the last term of eq.(15). Given the representations (11) and (12) one obtains, after some algebraic manipulations,
21 2 2
ˆ2 (1 2 3 ...) ;
( ) ( ) ( ) /
f ki kj pq pq pk pq kq ijf
ij mn mn
m ff
A Ab b
fg C
(16)
Note that a similar expression can be obtained for the gradient of the plastic potential function. Given the functional form of both gradient operators, the constitutive relation can now be obtained by invoking the additivity postulate, i.e.
1pe eij ijkl kl ijkl p kl ijkl klij
ij kl
fd C d d C H d C d
(17)
where eijklC is the elastic compliance whose representation, once again, depends on the type of
material anisotropy. 2. 2 Procedure for identification of material functions/parameters The identification process employed here is based on the experimental data for Tournemire argillite presented in Section 1 (Abdi & Evgin, 2013). The data includes the results of a series of
RSP-0307

- 26 -
triaxial compression tests performed at different confining pressures on samples tested at different orientation of bedding planes. The first step involves the specification of the conditions at failure which, in turn, requires the
identification of material function f and the parameter C, as defined in eq.(11). The specification
of coefficients appearing in f f i( l ) entails the information on conditions at failure in samples
tested at arbitrary orientation with respect to direction of loading. Consider, for this purpose,
the response of the sample under axial compression at a confining pressure 0p . Refer the geometry
of the sample to the coordinate system in which 1 2 3{ , , }ix x x x are the material axes, Fig.21
Fig.21. Geometry of the problem
In this case,
2 2 2 2
2 2 0 11 2 2 2 2
0 1
sin cos(1 3 );
2ij i j
pA l l A l l
p
(18)
where defines the orientation of the bedding planes. Given the representation above, the
function ( )f f il , eq.(11), reduces to
2 2 2 2 3 2 3 4 2 41 2 1 1 2 2 1 2 3 1 2ˆ 1 (1 3 ) (1 3 ) (1 3 ) (1 3 ) .....f f A l b A l b A l b A l (19)
Note that in the absence of confinement, 0 0p , there is 2 cosl , so that the anisotropy
parameter is an explicit function of the deposition angle , i.e.
2 2 2 2 2 22 1 1 1
ˆcos 1 (1 3cos ) (1 3cos ) .....f fl A b A (20)
Given now the stress parameters {p,q} at failure, for each specific orientation of the sample, the
anisotropy parameter can be determined, i.e. /( )f q p C , together with the corresponding
value of 2l , eq.(18). The results can then be plotted in the affined space 2{ , }f l to generate a set
x1
x2
in
Failure plane
1y
2 3 .const
x
y
x1
x2
in
Failure plane
1y
2 3 .const
x
y
RSP-0307
- 27 -
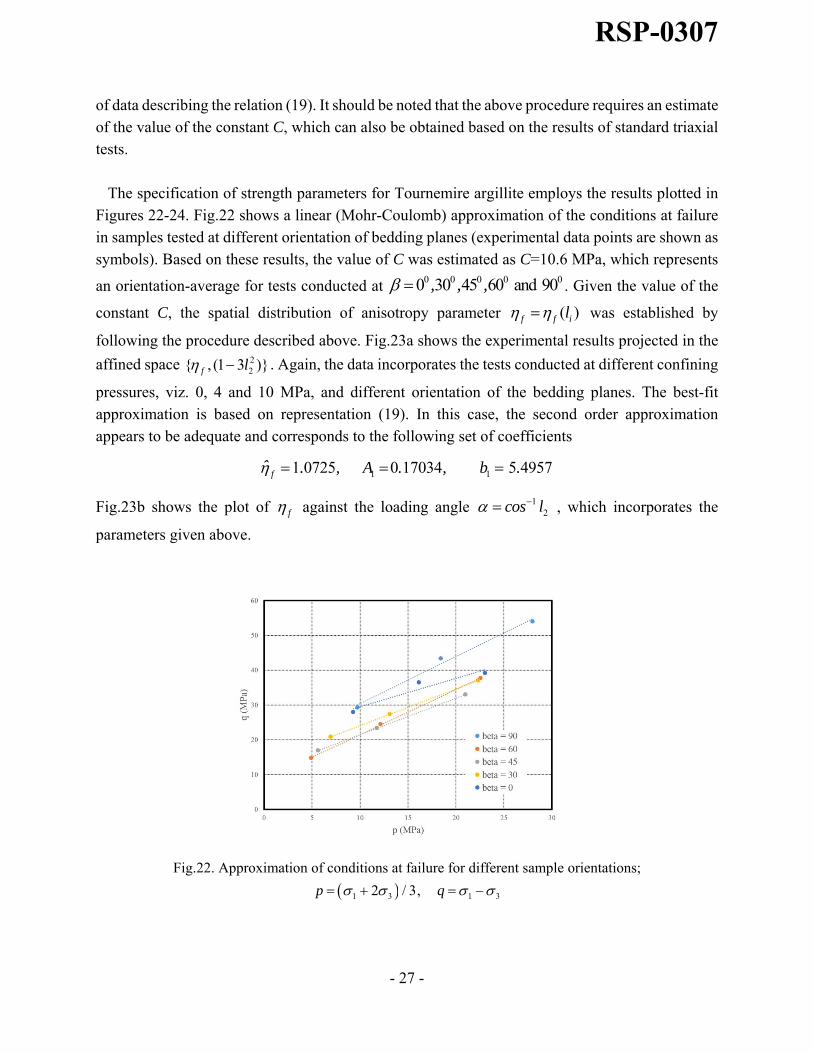
of data describing the relation (19). It should be noted that the above procedure requires an estimate of the value of the constant C, which can also be obtained based on the results of standard triaxial tests. The specification of strength parameters for Tournemire argillite employs the results plotted in Figures 22-24. Fig.22 shows a linear (Mohr-Coulomb) approximation of the conditions at failure in samples tested at different orientation of bedding planes (experimental data points are shown as symbols). Based on these results, the value of C was estimated as C=10.6 MPa, which represents
an orientation-average for tests conducted at 0 0 0 0 00 30 45 60 and 90, , , . Given the value of the
constant C, the spatial distribution of anisotropy parameter ( )f f il was established by
following the procedure described above. Fig.23a shows the experimental results projected in the
affined space 22{ , (1 3 )}f l . Again, the data incorporates the tests conducted at different confining
pressures, viz. 0, 4 and 10 MPa, and different orientation of the bedding planes. The best-fit approximation is based on representation (19). In this case, the second order approximation appears to be adequate and corresponds to the following set of coefficients
1 11 0725 0 17034 5 4957fˆ . , A . , b .
Fig.23b shows the plot of f against the loading angle 12cos l , which incorporates the
parameters given above.
Fig.22. Approximation of conditions at failure for different sample orientations;
1 3 1 32 / 3,p q
RSP-0307

- 28 -
(a)
(b)
Fig.23. Variation of strength parameter f with (a) ij i jA l l and (b) loading angle
The next step of the identifications process pertains to specification of material parameters/ functions that govern the deformation characteristics. The elastic properties have been evaluated in Abdi & Evgin (2013). The assessment was based on the results of unconfined cyclic tests and the following constants were identified
1 2 21 13 2112 5 21 0 0 16 0 08 4 57E . GPa , E . GPa, . , . , G . GPa
RSP-0307
- 29 -
Again, these values are referred to the coordinate system associated with principal material axes, as shown in Fig.21. The evaluation of plastic properties requires the identification of potential function, eq.(13),
which incorporates the parameter c . The latter defines the transition from plastic compaction to
dilatancy and its value can be assessed by examining the respective volume change characteristics. For the Tournemire argillite the results of experimental tests, as reported by Abdi & Evgin (2013), indicate that the transition to dilatancy occurs at deviatoric stress intensities that approach those associated with unstable strain-softening response. Therefore, it may be adequate to approximate
this material function as ( ) 0.99 ( )c i f il l .
The specification of hardening function involves the identification of material parameter A, viz. eq.(12). In order to accomplish this, the mechanical characteristics should be re-plotted in
{ , / ( )}q p C space. Note that constructing such characteristics requires the value of the
elastic shear modulus, so that the plastic deviatoric strain can be determined via the additivity postulate. The deformation properties in the plastic range are likely to be direction-dependent. Thus, the above best-fit procedure should be repeated for different orientations of the sample in order to obtain a set of corresponding values of the parameter A. In order to maintain the simplicity of the formulation it may then be sufficiently accurate to assume that A represents a material constant, whose value is identified with the orientation average. It needs to be pointed out now that the experimental results provided are not adequate to follow the procedure outlined above. This stems from the fact that the deformation measurements comprise only the vertical and volumetric strain, which for samples tested at orientations other
than =0 (i.e., horizontal bedding planes) is not sufficient to uniquely define the value of the
plastic distortion . Note that at 090 , the lateral strain will not be the same in the radial
directions; however, no information in this respect was provided in the CNSC report. At the same time, for inclined samples the shear strain will develop under a stress-controlled regime as the material is anisotropic. Given the restrictions mentioned above, the parameter A was determined by a trial-and-error
procedure that involved fitting the deviatoric characteristics q versus axial strain for samples with
horizontal bedding planes. Fig.24 shows the plots corresponding to confinements of 0, 4 and 10MPa. It is important to point out that the unstable strain softening characteristics reported in experimental tests are associated with localized deformation, i.e. formation of macrocracks. Therefore, they do not represent a material response and should be analysed within the context of a boundary-value problem. Thus, the characteristics reported in Fig.24 are restricted to a stable
RSP-0307

- 30 -
range associated with strain-hardening. The experimental response is characterized by an abrupt transition to localized mode. Within the current mathematical framework the onset of localized
deformation is associated with f and is defined by means of parameter , which appears in
the hardening function eq.(12). In general, the constraint of 1 ensures that the transition occurs
along the ascending branch of the deviatoric characteristic. The simulations reported in Fig.24
were conducted assuming 1 25. and resulted in the value of A = 0.0012. Thus, the material
parameters governing the plastic response of Tournemire argillite were taken as
( ) 0.99 ( ), 1.2, 0.0012c i f il l A
Fig.24. Trial-and-error assessment of the value of parameter A; the results corresponding to A=0.0012
Finally, it should be pointed out that the results of triaxial tests for inclined samples need to be taken with caution. This stems from the fact that the samples will have tendency to distort under the applied load, while in a triaxial set up such distortion is kinematically constrained by the presence of the loading platens. The latter will lead to a non-uniform stress distribution within the specimen, so that the results are representative of a boundary-value problem rather than a material test. This is in fact the main argument why, at the present stage, a simplified procedure for identification of material parameters in the plastic range has been adopted.
RSP-0307
- 31 -
2.3. Numerical integration scheme and simulation of triaxial tests For the purpose of implementation in FEM package, it is convenient to employ the matrix notation.
The stress and plastic strain variables at time t t can be evaluated as
{ } { } [ ]{ } [ ] }{ { {; } } }{t p p p t pD D (21)
where, for an active loading process
( ) .
}
, ) 0 (
{ { } 0
ij ij
p
f f const
(22)
The consistency condition requires that
{ } } 0{Tf f ff
(23)
so that the tangential stiffness operator can be expressed as
[ ]{ { } [ ]
[ ] [ ]{ } [ { }]
} T
TT
fD D
D Df f f
D
(24)
Here, the gradient operators have the form analogous to that defined in eq.(15), i.e.
{ } { } { } { } { }
{ } { } { } { } { }
fm
m f
fm
m f
f f f f f
(25)
In order to accurately integrate the constitutive relation (21) along with conditions (22), the return mapping scheme is employed here. It is clear that the governing equations are coupled and must be solved using a nonlinear solution technique. For the return mapping algorithm, the residuals can be expressed as
} { } [ ]{{ } { } [D]{ }
( , )
ti i i i
i i i
D
f f
r
(26)
Employing now the Newton-Raphson scheme, we can write
RSP-0307
- 32 -
] { } { } 0}
}
[
{ }
{
{ 0
i i i i i
i Ti i
r r
f ff
r
(27)
where
2
2] [ ] [ ][ ]; { } [ ]{ }[
r rI D D
(28)
If the increments are small enough, 0 . In this case
1
1
1 1
} ]
} ] [
{ [ { }
{ [
[ { }
]{ }
{ } ] { } ] { }[
i Ti i i
iTi i i
i i i i i i
f rf
f r fD
r r r
r
r
(29)
and the updated state variables are
1 1{ } { } { } { } { } { }p p pi i i i i i (30)
It should be noted that the above scheme can be implemented either in the global coordinate system or in the material coordinate system; in both cases, proper transformations must be applied for the stress/strain and stiffness operators. The above integration scheme has been used to simulate the results of triaxial compression tests reported in Section 1.3 (Abdi & Evgin, 2013). The material parameters were identical to those identified in the previous section. The experimental data examined here comprised the tests performed on samples at different orientation of the bedding planes (viz.
0 0 0 0 00 30 45 60 and 90, , , ) at confinements of 0, 4 and 10 MPa.
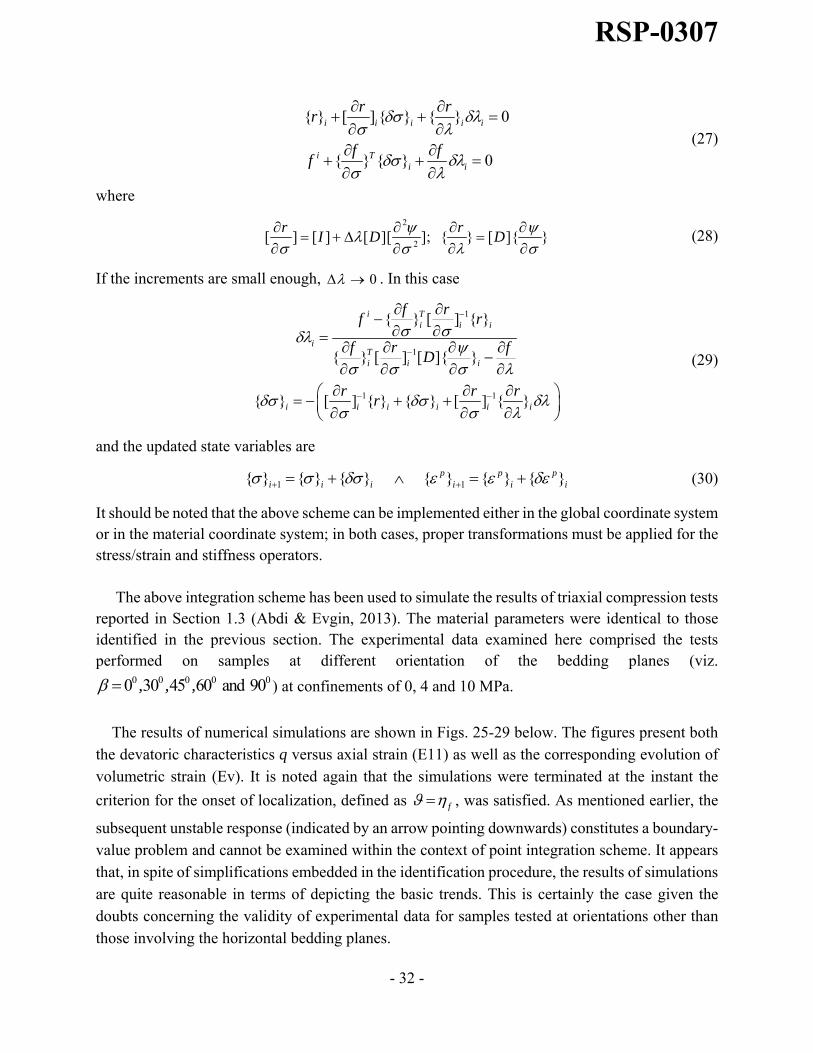
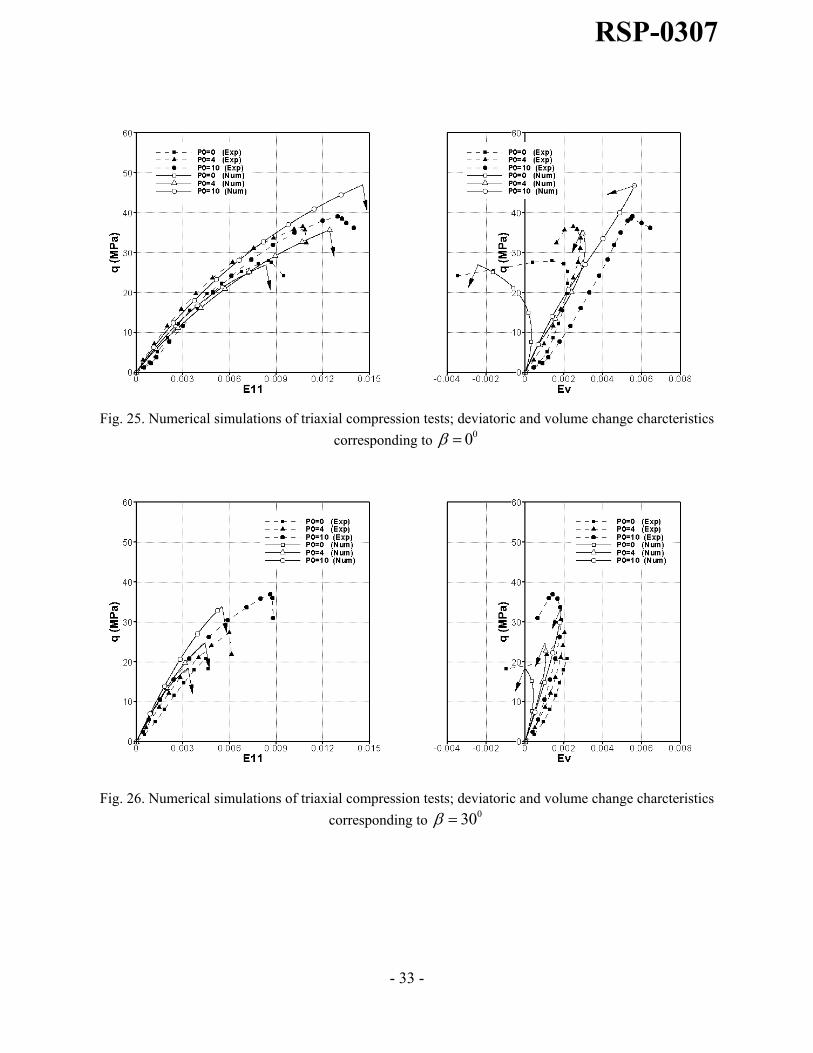
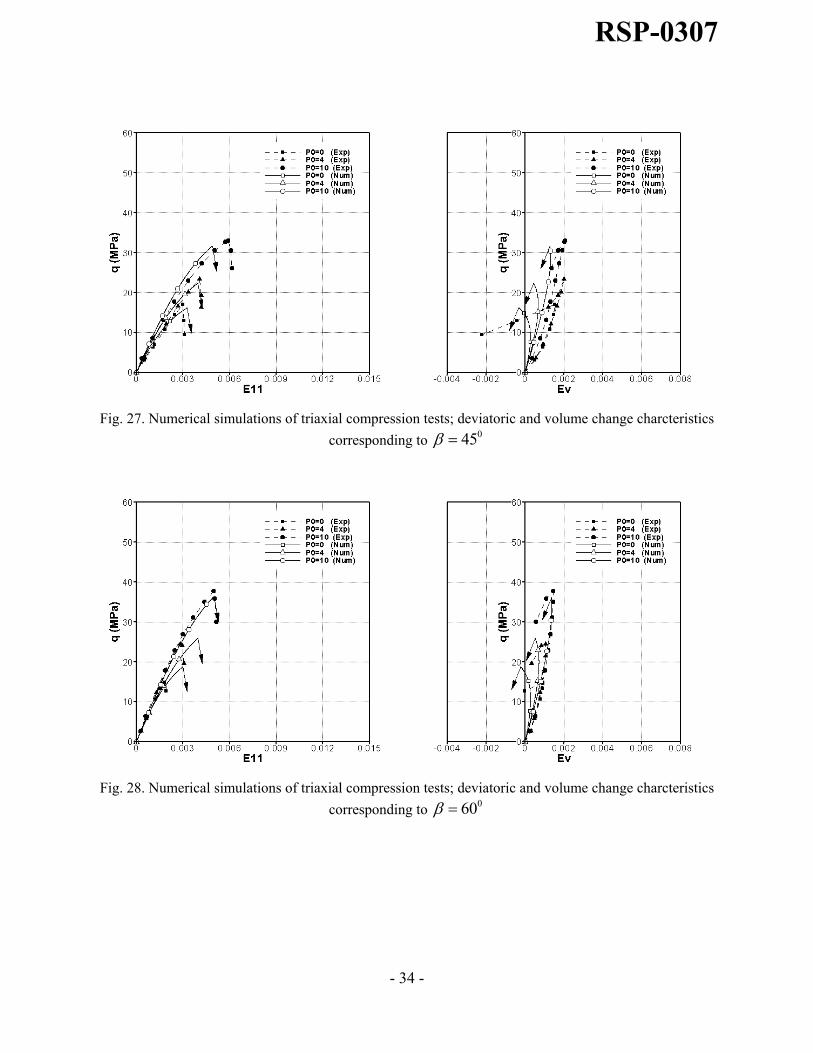
The results of numerical simulations are shown in Figs. 25-29 below. The figures present both the devatoric characteristics q versus axial strain (E11) as well as the corresponding evolution of volumetric strain (Ev). It is noted again that the simulations were terminated at the instant the
criterion for the onset of localization, defined as f , was satisfied. As mentioned earlier, the
subsequent unstable response (indicated by an arrow pointing downwards) constitutes a boundary-value problem and cannot be examined within the context of point integration scheme. It appears that, in spite of simplifications embedded in the identification procedure, the results of simulations are quite reasonable in terms of depicting the basic trends. This is certainly the case given the doubts concerning the validity of experimental data for samples tested at orientations other than those involving the horizontal bedding planes.
RSP-0307
- 33 -
Fig. 25. Numerical simulations of triaxial compression tests; deviatoric and volume change charcteristics
corresponding to 00
Fig. 26. Numerical simulations of triaxial compression tests; deviatoric and volume change charcteristics
corresponding to 030
RSP-0307
- 34 -
Fig. 27. Numerical simulations of triaxial compression tests; deviatoric and volume change charcteristics
corresponding to 045
Fig. 28. Numerical simulations of triaxial compression tests; deviatoric and volume change charcteristics
corresponding to 060
RSP-0307
- 35 -
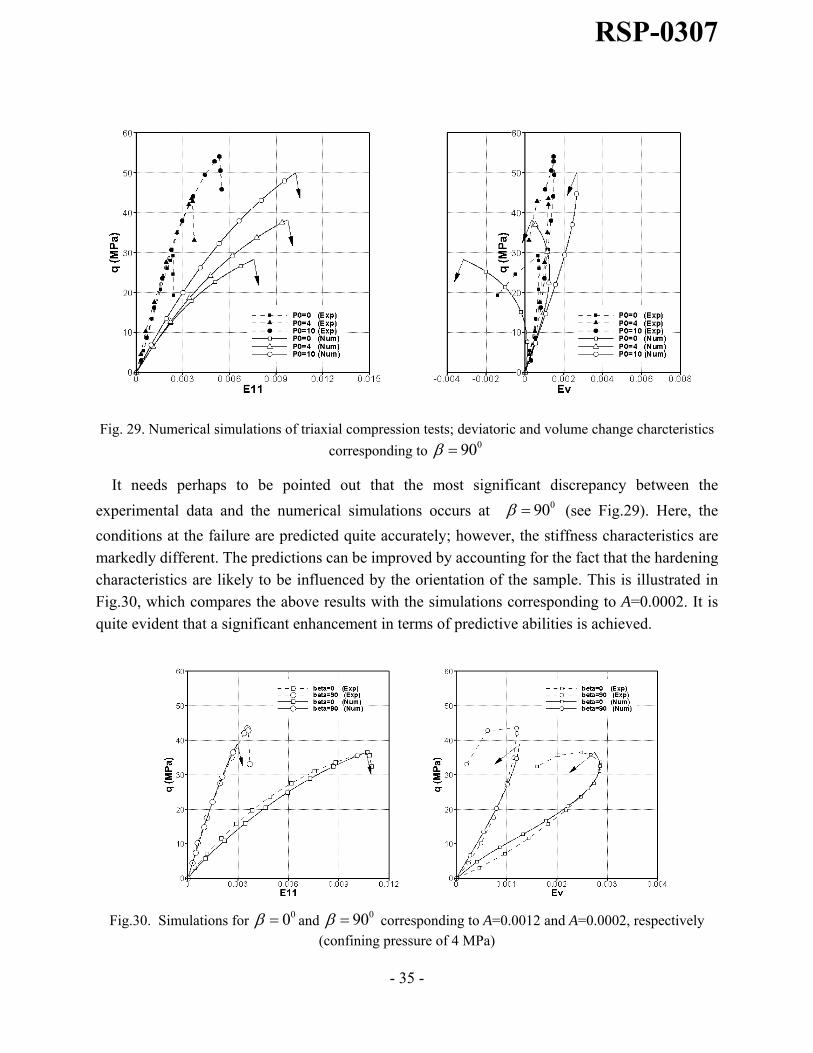
Fig. 29. Numerical simulations of triaxial compression tests; deviatoric and volume change charcteristics
corresponding to 090
It needs perhaps to be pointed out that the most significant discrepancy between the
experimental data and the numerical simulations occurs at 090 (see Fig.29). Here, the
conditions at the failure are predicted quite accurately; however, the stiffness characteristics are markedly different. The predictions can be improved by accounting for the fact that the hardening characteristics are likely to be influenced by the orientation of the sample. This is illustrated in Fig.30, which compares the above results with the simulations corresponding to A=0.0002. It is quite evident that a significant enhancement in terms of predictive abilities is achieved.
Fig.30. Simulations for 00 and 090 corresponding to A=0.0012 and A=0.0002, respectively (confining pressure of 4 MPa)
RSP-0307
- 36 -
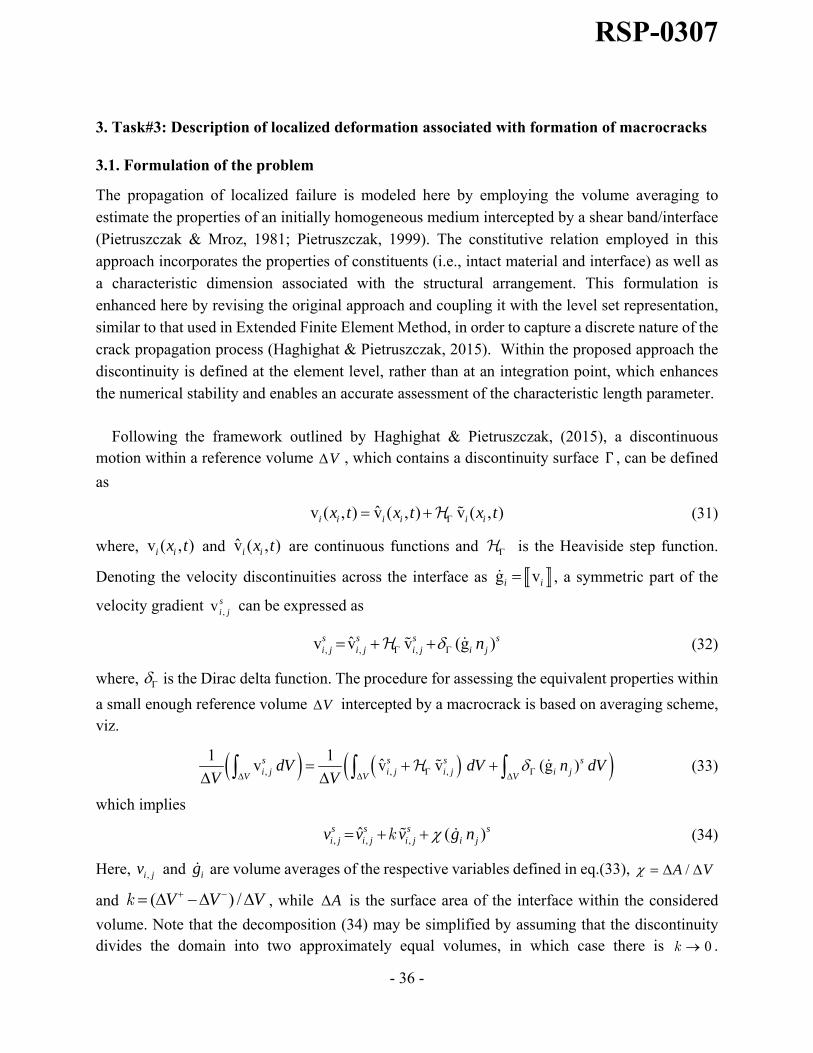
3. Task#3: Description of localized deformation associated with formation of macrocracks
3.1. Formulation of the problem
The propagation of localized failure is modeled here by employing the volume averaging to estimate the properties of an initially homogeneous medium intercepted by a shear band/interface (Pietruszczak & Mroz, 1981; Pietruszczak, 1999). The constitutive relation employed in this approach incorporates the properties of constituents (i.e., intact material and interface) as well as a characteristic dimension associated with the structural arrangement. This formulation is enhanced here by revising the original approach and coupling it with the level set representation, similar to that used in Extended Finite Element Method, in order to capture a discrete nature of the crack propagation process (Haghighat & Pietruszczak, 2015). Within the proposed approach the discontinuity is defined at the element level, rather than at an integration point, which enhances the numerical stability and enables an accurate assessment of the characteristic length parameter.
Following the framework outlined by Haghighat & Pietruszczak, (2015), a discontinuous motion within a reference volume V , which contains a discontinuity surface Γ , can be defined
as
ˆv ( , ) v ( , ) v ( , )i i i i i ix t x t x t (31)
where, v ( , )i ix t and v̂ ( , )i ix t are continuous functions and is the Heaviside step function.
Denoting the velocity discontinuities across the interface as g vi i , a symmetric part of the
velocity gradient ,v si j can be expressed as
, , ,ˆv v v (g )s s si j i j i j
si jn (32)
where, is the Dirac delta function. The procedure for assessing the equivalent properties within
a small enough reference volume V intercepted by a macrocrack is based on averaging scheme, viz.
, , ,ˆv v1 1
(g )vs s si j i j i j
si jV V Vn
VdV dV dV
V
(33)
which implies
, , ,ˆ ( )s s si j i j i ji j
sv v v g n k (34)
Here, ,i jv and ig are volume averages of the respective variables defined in eq.(33), /A V
and ) /( V V V k , while A is the surface area of the interface within the considered
volume. Note that the decomposition (34) may be simplified by assuming that the discontinuity divides the domain into two approximately equal volumes, in which case there is 0k .
RSP-0307
- 37 -
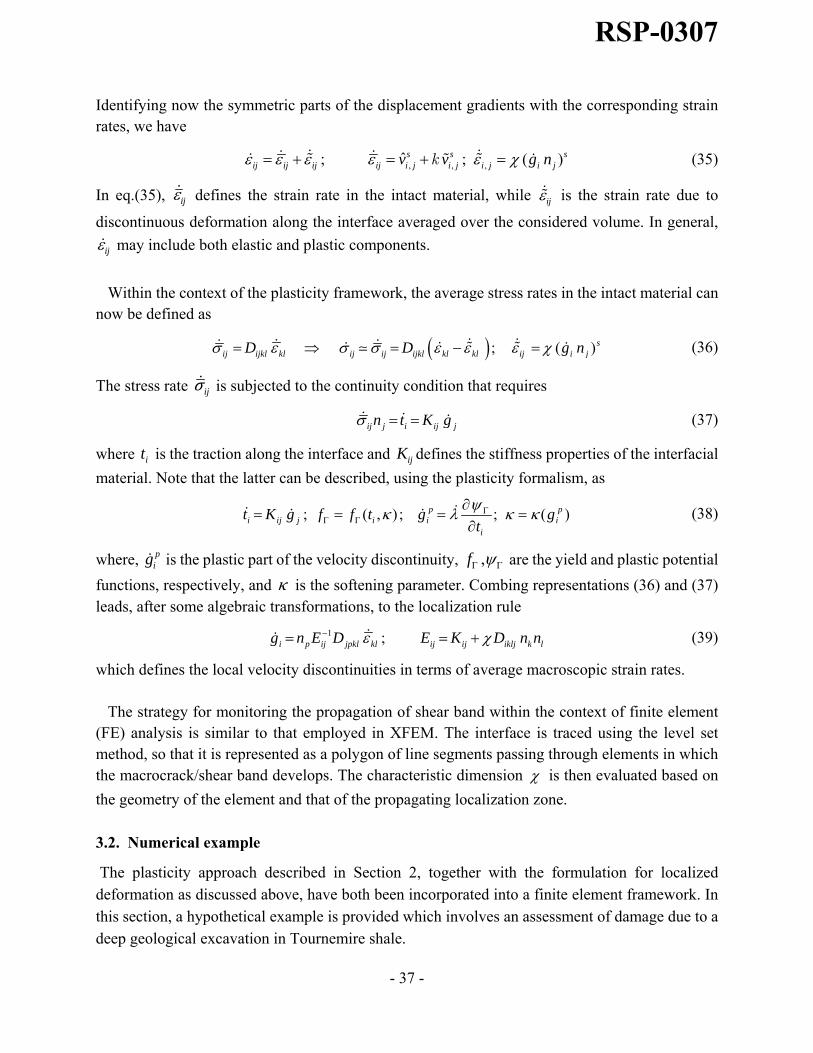
Identifying now the symmetric parts of the displacement gradients with the corresponding strain rates, we have
,, ,; ( )ˆ ;s sij ij ij ij i j i j
si j i jv v g n k (35)
In eq.(35), ij defines the strain rate in the intact material, while ij is the strain rate due to
discontinuous deformation along the interface averaged over the considered volume. In general,
ij may include both elastic and plastic components.
Within the context of the plasticity framework, the average stress rates in the intact material can now be defined as
; ( )ij ijkl kl ij ij ijkl kl l jj ik isgD nD (36)
The stress rate ijσ is subjected to the continuity condition that requires
ij j i ij jn t K g (37)
where it is the traction along the interface and ijK defines the stiffness properties of the interfacial
material. Note that the latter can be described, using the plasticity formalism, as
; ( , ) ; ; ( )p pi ij j i i i
i
t K g f f t g gt
(38)
where, pig is the plastic part of the velocity discontinuity, ,f are the yield and plastic potential
functions, respectively, and κ is the softening parameter. Combing representations (36) and (37) leads, after some algebraic transformations, to the localization rule
1 ;i p ij jpkl kl ij ij iklj k lg n E D E K D n n (39)
which defines the local velocity discontinuities in terms of average macroscopic strain rates. The strategy for monitoring the propagation of shear band within the context of finite element (FE) analysis is similar to that employed in XFEM. The interface is traced using the level set method, so that it is represented as a polygon of line segments passing through elements in which the macrocrack/shear band develops. The characteristic dimension is then evaluated based on
the geometry of the element and that of the propagating localization zone.
3.2. Numerical example
The plasticity approach described in Section 2, together with the formulation for localized deformation as discussed above, have both been incorporated into a finite element framework. In this section, a hypothetical example is provided which involves an assessment of damage due to a deep geological excavation in Tournemire shale.
RSP-0307

- 38 -
The geometry of the problem is shown in Fig. 31, and it’s similar to that employed in the article by Le and Nguyen (2015). The tunnel is 1.04m is diameter and the initial stress state, prior to excavation, was assumed to comprise the vertical stress of 6.5 MPa and the lateral stress of 4.4MPa. The focus in the analysis is on modelling of long-term damage induced by excavation. An accurate assessment in this respect requires a description of the creep phenomenon that is associated with time-dependent evolution of microstructure. Since the example given here is purely illustrative, with the emphasis on qualitative aspects, the latter effects have not been explicitly incorporated. Instead, the simulation of the onset of damage near the excavation zone was carried out by degrading the strength parameters to their residual values.
Fig.31. Geometry of the problem
The first stage of the analysis involved the excavation in the intact material. The mechanical properties were assumed to be the same as those identified in Section 2.2., i.e.
1 2 21 13 21
1 1
12 5 21 0 0 16 0 08 4 57
1 0725 0 17034 5 4957 10 6
0 99 1 2 0 0012
f
c i f i
E . GPa , E . GPa, . , . , G . GPa,
ˆ . , A . , b . , C . MPa
( l ) . ( l ), . , A .
In the second stage, the analysis was conducted by imposing a linear degradation of strength
parameters ˆf and C to their residual values, viz.
0.ˆ 2.09,r rf C MPa
The latter are assumed to be representative of the time associated with the end of creep.
RSP-0307
- 39 -
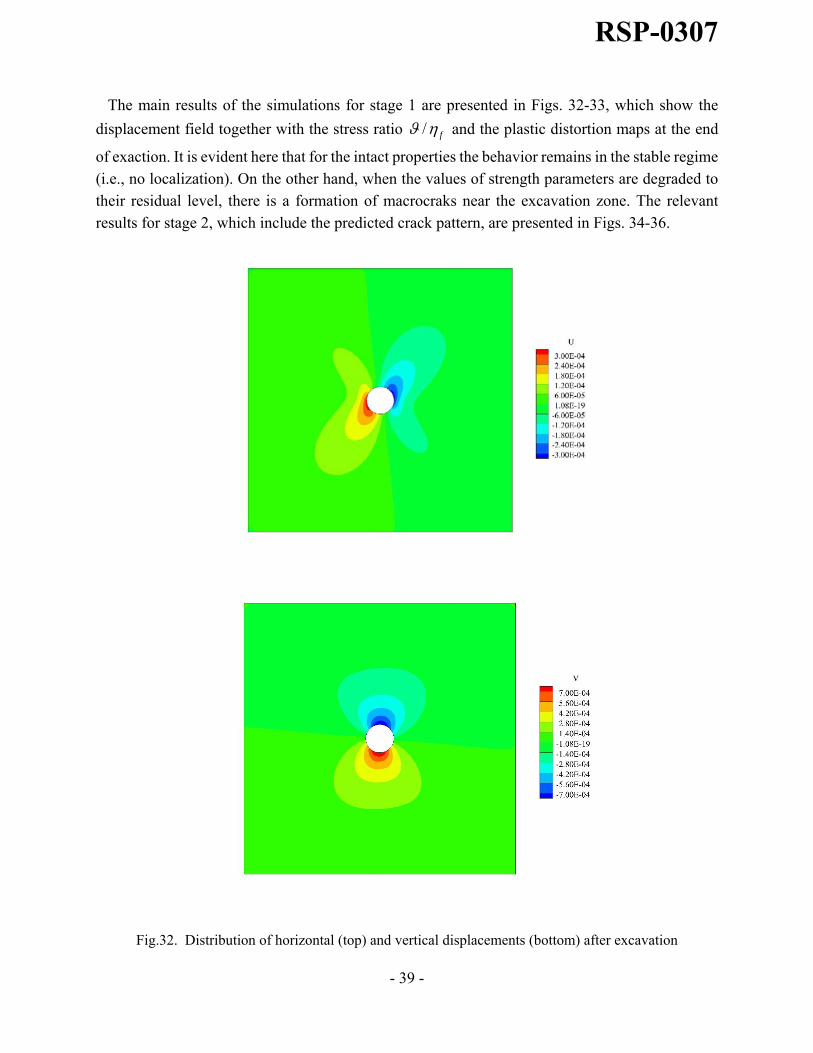
The main results of the simulations for stage 1 are presented in Figs. 32-33, which show the
displacement field together with the stress ratio / f and the plastic distortion maps at the end
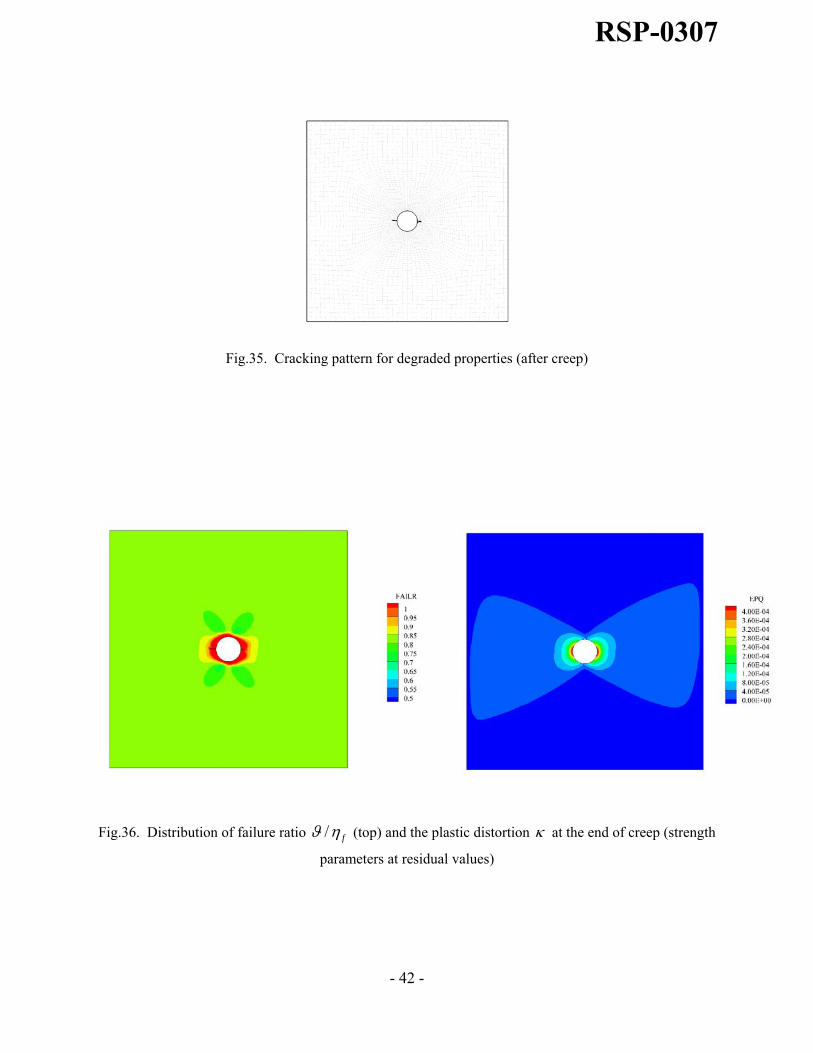
of exaction. It is evident here that for the intact properties the behavior remains in the stable regime (i.e., no localization). On the other hand, when the values of strength parameters are degraded to their residual level, there is a formation of macrocraks near the excavation zone. The relevant results for stage 2, which include the predicted crack pattern, are presented in Figs. 34-36.
Fig.32. Distribution of horizontal (top) and vertical displacements (bottom) after excavation
RSP-0307

- 40 -
Fig.33. Distribution of failure ratio / f (top) and the plastic distortion at the end of excavation
RSP-0307
- 41 -
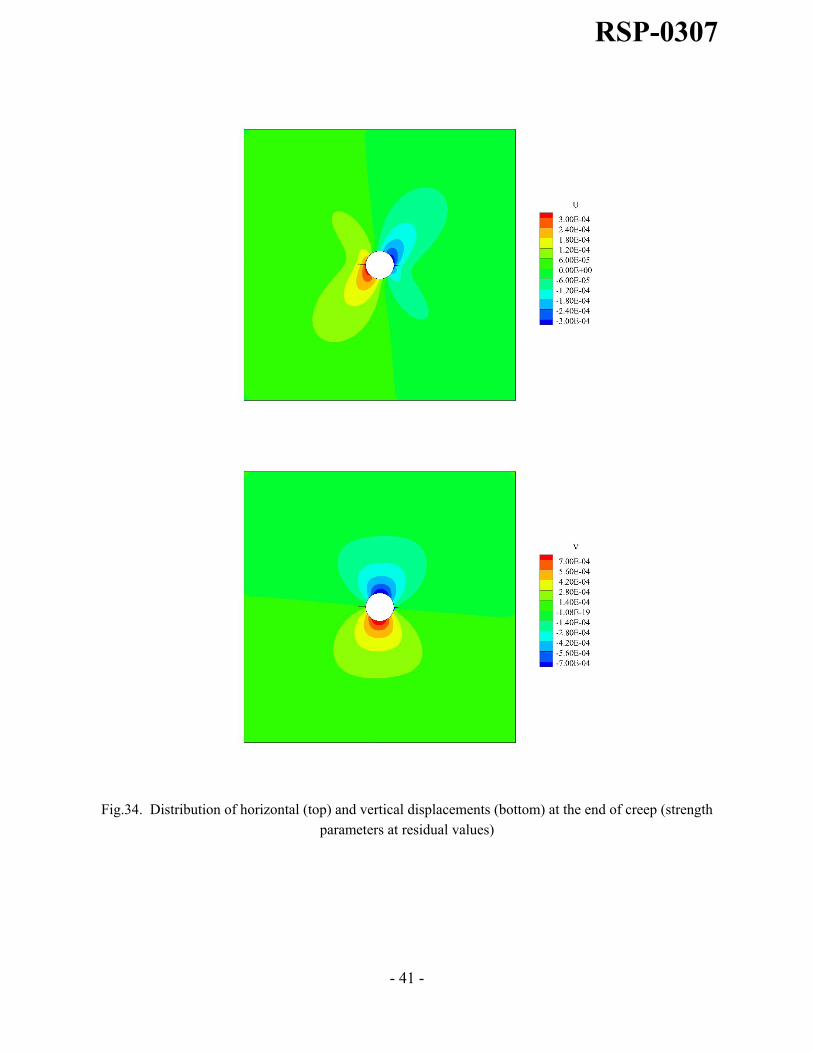
Fig.34. Distribution of horizontal (top) and vertical displacements (bottom) at the end of creep (strength parameters at residual values)
RSP-0307
- 42 -
Fig.35. Cracking pattern for degraded properties (after creep)
Fig.36. Distribution of failure ratio / f (top) and the plastic distortion at the end of creep (strength
parameters at residual values)
RSP-0307

- 43 -
4. References
Abdi F., Evgin E. (2013). Laboratory characterization, modeling, and numerical simulation of an excavation damaged zone around deep geologic repositories in sedimentary rocks. CNSC, Technical Report RSP-0287
Amadei, B. (1983). Rock anisotropy and the theory of stress measurements. Springer, Berlin.
Arthur, J.R.F., Menzies, B.K. (1972). Inherent anisotropy in sand. Geothecnique, vol. 22, No. 1, pp. 115-128.
Atwell, P.B., Sandford, M.A. (1974). Intrinsic shear strength of a brittle anisotropic rock – I: experimental and mechanical interpretation. Int. J. Rock Mech. Min. Sci. Geomech. Abstr, vol. 11, pp. 423–430.
Bonin, B. (1998). Deep geological disposal in argillaceous formations: studies at the Tournemire test site. Journal of Contaminant Hydrology, vol. 35, pp. 315-330.
Casagrande, A., Carillo, N. (1944). Shear failure of anisotropic materials. Journ. Boston Soc. Civ. Eng., vol 31 (4), pp. 74–87.
Donath, F.A. (1961). Experimental study of shear failure in anisotropic rocks. Geol. Soc. Am. Bull, vol. 72, pp. 985–990.
Duveau, G., Shao, J.F., Henry, J.P. (1998). Assessment of some failure criteria for strongly anisotropic materials. Mech. Cohesive Frictional Materials, vol. 3, pp. 1–26.
Gao, Z., Jidong Zhao, J., Yao, Y. (2010). A generalized anisotropic failure criterion for geomaterials. International Journal of Solids and Structures, vol. 47, pp. 3166–3185.
Haghighat E., Pietruszczak S. (2015). On modeling of discrete propagation of localized damage in cohesive-frictional materials. Intern. Journ. Num. Anal. Meth. Geomech., in press; DOI: 10.1002/nag.2368.
Hoek, E. (1968). Brittle failure of rock. In: Stagg, G., Zienkiewicz, O.C. (Eds.), Rock Mechanics in Engineering Practice. Wiley, London, pp. 99–124.
Hoek, E. (1983). Strength of jointed rock masses. Geotechnique, vol. 33, pp. 187–205.
Kwasniewski, M.A. (1993). Mechanical behaviour of anisotropic rocks. In: Hudson, J.A. (Ed.), Comprehensive Rock Engineering, vol. 1, pp. 285–312.
RSP-0307
- 44 -
Le, A.D., Nguyen, T.S. (2015). Hydromechanical response of bedded argillaceous rock formation to excavation and water injection. Can. Geotech. Journ., vol. 52, pp. 1-17.
Lerau, J., Saint Leu, C., Sirieys, P. (1981). Anisotrophie de la dilatance des roches schisteuses. Rock Mech. Rock Engng, vol. 13, pp. 185–196.
McLamore, R., Gray, K.E. (1967). The mechanical behaviour of anisotropic sedimentary rocks. Journ. Engng. Industry, Trans. ASME, vol. 89, pp. 62–73.
Niandou, H. (1994). Etude du comportement rhéologique et modélisation de l'argilite de Tournemire. Applications à la stabilité d'ouvrages souterrains (Doctoral dissertation).
Niandou, H., Shao, J., Henry, J., and Fourmaintraux, D. (1997). Laboratory investigation of the mechanical behaviour of Tournemire argillite. Int. J. Rock Mech. Min. Sci. & Geomech. Abstr. vol. 34, pp. 3-16.
Oda, M., Koishikawa, I., Higuchi, T. (1978). Experimental study of anisotropic shear strength of sand by plane strain test. Soils & Foundations, vol. 18, pp. 25–38.
Pietruszczak S. (1999). On homogeneous and localized deformation in water-infiltrated soils. Journ. Damage Mech., vol.8, pp. 233-253.
Pietruszczak, S., Lydzba, D. Shao JF. (2002). Modelling of inherent anisotropy in sedimentary rocks. Intern. Journ. Solids & Structures, vol. 39, pp. 637–648.
Pietruszczak, S., Lydzba, D., Shao, JF. (2004). Description of creep in inherently anisotropic frictional materials. Journ. Eng. Mechanics ASCE, vol.130, pp. 681-690.
Pietruszczak S., Mroz Z. (1981). Finite element analysis of deformation of strain softening materials. Int. Journ. Num. Meth. Engng., vol. 17, pp. 327-334. Pietruszczak S., Mroz Z. (2001). On failure criteria for anisotropic cohesive-frictional materials. Intern. Journ. Num. Anal. Meth. Geomech., vol.25, pp. 509-524.
Ramamurthy, T. (1993). Strength and modulus responses of anisotropic rocks. In: Hudson, J.A. (Ed.), Comprehensive Rock Eng., vol. 1, pp. 319–329.
Rouabhi, A., Tijani, M., Rejeb, A. (2007). Triaxial behaviour of transversely isotropic materials: application to sedimentary rock. Intern. Journ. Num. Anal. Meth. Geomech., vol.31, pp. 1517-1535.
RSP-0307