y batil refugee camp m -sector needs a - reach … · yusuf batil refugee camp needs assessment ......
TRANSCRIPT

SOUTH SUDAN
ASSESSMENT REPORT
NOVEMBER 2015
YUSUF BATIL REFUGEE CAMP
MULTI-SECTOR NEEDS ASSESSMENT
1
Yusuf Batil Refugee Camp Needs Assessment – November 2015
Cover photo: Maban, South Sudan ©Anna Banyard, October 2015.
About REACH REACH is a joint initiative of two international non-governmental organizations - ACTED and IMPACT Initiatives - and the UN Operational Satellite Applications Programme (UNOSAT). REACH’s mission is to strengthen evidence-based decision making by aid actors through efficient data collection, management and analysis before, during and after an emergency. By doing so, REACH contributes to ensuring that communities affected by emergencies receive the support they need. All REACH activities are conducted in support to and within the framework of inter-agency aid coordination mechanisms. For more information please visit our website: www.reach-initiative.org. You can contact us directly at: [email protected] and follow us on Twitter @REACH_info.
2
Yusuf Batil Refugee Camp Needs Assessment – November 2015
SUMMARY
Yusuf Batil Camp is one of four refugee camps in Maban County in South Sudan’s Upper Nile State. The state houses over 133,236 refugees1 who have fled primarily from the Bau area of Blue Nile State in neighbouring Sudan.2 The first refugees arrived in Maban shortly after the outbreak of conflict between the Sudan People’s Liberation Movement-North (SPLM-N) and the army of Sudan in September 2011. Yusuf Batil refugee camp was opened in May 2012 and is the second largest refugee camp in the county after Doro3. According to the latest figures from the United Nations High Commissioner for Refugees (UNHCR), 40,648 individuals currently reside in the camp.
As the situation stabilizes from the emergency phase into the care and maintenance phase, information needs in Yusuf Batil are changing: with targeted distributions starting to replace blanket distributions4, more granular data is required to understand household level needs. In order to address these information gaps, UNHCR requested a detailed multi-sector needs assessment of households within the camp, which was designed and implemented by REACH. Throughout the process, input from the Danish Refugee Council (DRC), who manage the camp, and other agencies such as Medair and ACTED has been instrumental to the development of the study.
The assessment consisted of a large-scale household survey and four focus groups with refugees. Both components were undertaken in close cooperation with UNHCR, Yusuf Batil’s camp management and community leaders (Sheiks5 and Umdas6). Primary data collection at household level took place between March and July 2015. Focus group discussions with refugees were held in September, in order to complement the household level findings and provide more detail where needed. The findings of this assessment contain critical information for all aid agencies operating in the camp, and seek to facilitate the timely provision of assistance to meet identified needs.
Primary community concerns
Security7 (44%) and access to food8 (38%) were the two most commonly reported priority needs of refugees in Yusuf Batil camp.
Overall, the assessment highlighted the fact that while still in the protracted emergency phase of response, the provision of basic services in Yusuf Batil refugee camp could be generally improved. A high proportion of shelters were observed to be in poor condition, and access to water and WASH facilities (specifically latrines) is sometimes challenging. In addition, uneven access to basic services has been observed across several sectors. Findings presented in this report and the accompanying spatial analysis show the presence of several underserved areas, particularly in the southern parts of the camp. As blanket distributions are phased out, it is essential that targeted assistance is provided to those who need it most, particularly those living in these most underserved areas of the camp.
According to refugees, a lack of security remains a primary concern. There is a general feeling of insecurity among the camp population, while a significant proportion of households have experienced a security incident, such as a robbery or damage inflicted on shelters. In the case of minor security incidents, Sheiks are generally the community’s first point of contact, while the police is involved in more serious cases.
While such measures could ensure the better resolution of conflict with host community, preventative measures should also be considered to ease existing tensions and avoid future incidents. In this respect, livelihood programming represents an important entry point, since competition over resources and livelihood opportunities is at the core of tensions between the host community and refugees. Specifically, the provision of additional vocational training schemes and village saving schemes could together build skills within the refugee community, and provide them with opportunities to create their own businesses.
1 UNHCR South Sudan Information Sharing Portal, updated on 31 July 2015. 2 Yusuf Batil Camp Snapshot, October 2014, UNHCR. 3 Doro refugee camp currently houses 51,659 individuals according to UNHCR data, updated on 31 July 2015. 4 Specific areas of concern: Shelter, FSL, Protection, Environment 5 Refugees within Yusuf Batil continue to use their existing tribal authority structures, principally through sheiks who are community leaders. 6 Each sheikh represents a village, and each umda represents a community 7 Security was defined as individual security and security of household and possessions (protection from physical harm and theft/destruction of property). 8 Access to food was defined as having enough to eat.

3
Yusuf Batil Refugee Camp Needs Assessment – November 2015
Key findings from specific sections in the assessment are summarised below and include the following:
Household demographics
The majority of Yusuf Batil’s population (57%) is below the age of 18. Within this group, 17% are aged under four and 27% are aged 5 - 11. Adults between the ages of 18 - 59 year olds comprise a further 38% of the camp population.
65% of refugee households in Yusuf Batil are male-headed, and 35% female-headed.
On average there are 4.7 individuals per household.
Shelter
Grass and wood (28%), and mud and wood structures (23%) are the two main types of shelter in Yusuf Batil. Sixteen percent of structures in the camp are still tents. Tarpaulin and wood structures account for 13% of shelters. Traditional shelters such as the Tukul made of mud, wood and grass, make up 13% of total shelters. Finally, Corrugated Galvanized Iron (CGI) structures account for only 8% of total structures.
The majority of shelters in Yusuf Batil (51%) were reported to be in poor condition by enumerators. Only 13% were reported to be in good condition and 14% in great condition.
WASH
Tap stands are the most common source of drinking water for refugees in Yusuf Batil camp and were reported as the primary source by 99.2% of households. Only 0.8% of households reported using hand pumps as their main source of drinking water.
31% of surveyed households reported collecting water five times a day. One in five households reported waiting more than 45 minutes at water points, below the minimum SPHERE standard of a queuing time of less than 30 minutes.9
While 40% of households reported using latrines built by NGOs for defecation, another 33% use latrines built by their community, and seven percent of households reported defecating in the open. Households practising open defecation were mainly located on the southern edge of the camp, and in the east, south of the market.
All heads of household reported washing their hands at least once during the day; however, some variation was observed between the reported frequencies. The vast majority of interviewees (88%) reported washing their hands after defecating, however, a smaller proportion (78%) reported washing their hands before eating.
Health
Nearly half (48%) of surveyed households said that at least one member of their household had suffered from a disease or illness since coming to Yusuf Batil.
The Medair Central Clinic was the most commonly reported health facility used when refugees were sick (55%), followed by the Medair West Clinic, reported by 28%.
The planned departure of Médecins Sans Frontières (MSF) Holland and the closure of its Gentil hospital at the end of 2015 is of high concern to refugees according to FGDs.
Livelihoods
A majority of households (60%) planted crops in the last year. The two most reported cultivated crops are maize (79%) and okra (77%).
Crops are generally used for household consumption rather than selling according to FGD findings. FGD participants complained that while they had received seeds from NGOs, little was growing due to infertile land and unfavorable weather conditions.
Ownership of livestock is less common than planting/cultivating in Yusuf Batil, with only 18% of heads of household reporting livestock ownership. Of those who own livestock, 83% herd goats and 23% herd sheep.
Education
Fourteen percent of interviewees said that school-age children in their household were not attending school. When asked why their children were not going to school, the most common response (66%) was that they did not want them to attend school with children from other communities. However, when asked in focus
9 http://www.spherehandbook.org/en/water-supply-standard-1-access-and-water-quantity/

4
Yusuf Batil Refugee Camp Needs Assessment – November 2015
group discussions, refugees said that they had no issue with this. Instead, participants pointed to the lack of clothes as well as sandals as the main barrier to non-attendance. This discrepancy in findings may be explained by an unwillingness to discuss community tensions in a group discussion.
Protection
Security incidents in the camp were reportedly experienced by 14 percent of households. Of those who experienced a security incident, 66% reported that their tent or shelter had been damaged or destroyed by someone else. The second most commonly reported security incident was robbery, reported by 52% of households.
According to FGDs, fear of clashes with the host community was the main reported reason for feeling unsafe in Yusuf Batil.
The majority of heads of household surveyed explained that they would report a security incident to their Sheik (98%) highlighting the importance of these community leaders in the functioning of the camp. Focus group discussions showed that if there is a serious security incident, the Sheik would then report to the Umda, and then to the police.

5
Yusuf Batil Refugee Camp Needs Assessment – November 2015
CONTENTS
SUMMARY ................................................................................................................................................. 2
List of Acronyms ..................................................................................................................................................... 6
Geographical Classifications .................................................................................................................................. 6
List of Figures, Tables and Maps............................................................................................................................ 6
INTRODUCTION .......................................................................................................................................... 8
METHODOLOGY ........................................................................................................................................10
FINDINGS .................................................................................................................................................13
Camp and Household Demographics ................................................................................................................... 13
Shelter .................................................................................................................................................................. 15
Water, Sanitation and Hygiene (WASH) ............................................................................................................... 21
Access to Health Facilities .................................................................................................................................... 24
Livelihoods............................................................................................................................................................ 26
Education.............................................................................................................................................................. 28
Protection and Information ................................................................................................................................... 29
Main Community Concerns .................................................................................................................................. 33
CONCLUSION ...........................................................................................................................................34
ANNEXES .................................................................................................................................................35
Annex 1: Maps...................................................................................................................................................... 35
Annex 2: Household Questionnaire ...................................................................................................................... 35
Annex 3: Focus Group Discussion Guide ............................................................................................................. 52
6
Yusuf Batil Refugee Camp Needs Assessment – November 2015
List of Acronyms
CGI Corrugated Galvanized Iron DRC Danish Refugee Council FGD Focus Group Discussion HHH Head of Household JICA Japan International Cooperation Agency MSF Médecins Sans Frontières/Doctors without Borders NCP National Congress Party NFI Non Food Items NGO Non-Governmental Organization ODK Open Data Kit SPLM/A Sudan People’s Liberation Movement/Army UNHCR United Nations High Commissioner for Refugees USAID United States Agency for International Development WASH Water supply, sanitation and hygiene promotion WFP World Food Programme
Geographical Classifications
State Administration of local government including several Counties County Primary administrative level below the State including several Payams Payam Intermediate administrative level including several Bomas Boma Lowest level of local government administration

7
Yusuf Batil Refugee Camp Needs Assessment – November 2015
List of Figures, Tables and Maps
Figure 1: Yusuf Batil camp population pyramid, disaggregated by age and sex ................................................... 13 Figure 2: Reported reasons for impairment of head of household......................................................................... 14 Figure 3: Type of shelter present in Yusuf Batil Camp .......................................................................................... 16 Figure 4: Shelter quality, by shelter type (based on enumerator observation) ...................................................... 17 Figure 5: Origin of tents in Yusuf Batil camp ......................................................................................................... 19 Figure 6: Reported duration of seasonal flooding in the camp .............................................................................. 19 Figure 7: Average number of trips to fetch water per day, reported by households .............................................. 21 Figure 8: Quantity of water collected, by number of trips ...................................................................................... 21 Figure 9: Reported length of time spent waiting at water source ........................................................................... 22 Figure 10: Reported usual location of defecation .................................................................................................. 24 Figure 11: Reported hand-washing practices ........................................................................................................ 24 Figure 12: Reported use of health facilities ........................................................................................................... 26 Figure 13: Types of crop cultivated by household (multiple selection was allowed) .............................................. 27 Figure 14: Type of hivestock herd ......................................................................................................................... 27 Figure 15: Reported reasons for children not attending school ............................................................................. 28 Figure 16: Type of Security Incident ...................................................................................................................... 30 Figure 17: Reported reasons for ineffective response by community watch teams and police ............................. 32 Figure 18: Most commonly listened to radio stations ............................................................................................. 33 Figure 19: Primary concerns reported by refugee households .............................................................................. 33 Table 1: Dependency Ratios ................................................................................................................................. 13 Map 1: Yusuf Batil Camp General Infrastructure ..................................................................................................... 9 Map 2: Yusuf Batil Camp's Village Communities ................................................................................................... 11 Map 3: Shelter locations and population density in Yusuf Batil Camp ................................................................... 15 Map 4: Reported primary source of shelter materials ............................................................................................ 18 Map 5: Reported length of flood duration .............................................................................................................. 20 Map 6: Reported defecation locations in Yusuf Batil Camp ................................................................................... 23 Map 7: Distance from health centres in Yusuf Batil camp ..................................................................................... 25 Map 8: Households reporting “distance from school” as a reason for child non-attendance ................................. 29 Map 9: Location of reported security incidents in Yusuf Batil, by type ................................................................... 31 Map 10: Reported priority needs in Yusuf Batil Camp ........................................................................................... 35 Map 11: Household shelter type ............................................................................................................................ 36 Map 12: Observed shelter quality .......................................................................................................................... 37 Map 13: Reported preferred water point ................................................................................................................ 38 Map 14: Reported waiting times for water ............................................................................................................. 39 Map 15: Reported source of health assistance used ............................................................................................. 40 Map 16: Reported reasons for not attending school .............................................................................................. 41 Map 17: Reported Satisfaction with community policing ....................................................................................... 42

8
Yusuf Batil Refugee Camp Needs Assessment – November 2015
INTRODUCTION
Following the independence of South Sudan in July 2011, conflict broke out between rebels belonging to the Sudan People's Liberation Army-North (SPLA-N) and the army of Sudan. Rising tensions began following a refusal to grant autonomy and repeated interferences into local government politics in Blue Nile State by the national Khartoum government. The Sudan People’s Liberation Movement-North (SPLM-N), who was leading the local government, refused to disarm after independence, and the government of Khartoum in turn refused to negotiate with the former rebels, instead cracking down on the ensuing dissent. The resulting conflict caused the wide-spread displacement of people from Blue Nile state over the border into South Sudan.10 As of January 2015, about 180,33311 refugees were estimated to have fled from Blue Nile State in Sudan to Upper Nile State in South Sudan. The majority of these refugees live in four refugee camps in Maban County: Doro, Kaya, Gendrassa and Yusuf Batil.
Yusuf Batil camp was opened in May 2012, to accommodate the new influx of refugees that could no longer be sheltered in Doro and Jamman12 camps, since both camps were at almost full capacity. Yusuf Batil is now the second biggest camp in Maban County with a total 40,648 individuals, according to the latest figures from UNHCR.
More than three years since its establishment, UNHCR and NGOs present in Maban County report that the living conditions of refugees within camps continue to be difficult. With no end to the conflict in sight, refugees remain unable to go back to their homes resulting in an increasingly protracted displacement situation. In this context, a better knowledge and understanding of conditions within the camp is critical in order to improve the current situation as well as to facilitate a smooth transition from the emergency phase to the care and maintenance phase. Indeed, as Maban moves into a protracted emergency phase, funding has dwindled, increasing the importance of camp sweeps to inform the targeted distribution of humanitarian assistance and services. Further, a clear lack of information and data (both quantitative and qualitative) on specific camps, including Yusuf Batil, has left the humanitarian community largely unaware of the situation and needs of refugees.13 This lack of both general and sector specific information impedes the continuation of an informed and appropriate response.
In response to this information gap, REACH facilitated a large-scale household survey in order to provide quantitative data on conditions across the sectors of humanitarian response. The survey was conducted in close cooperation with UNHCR, Yusuf Batil’s camp management (Danish Refugee Council) and community leaders, with primary data collected between March and August 2015. Focus group discussions were conducted in September 2015 to provide further qualitative data. The findings of this assessment contain critical information for all aid agencies operating in the camp, and seek to facilitate the timely provision of assistance to meet identified needs.
This report provides a detailed description of the methodology and why it was chosen, followed by an overview of the key assessment findings, organised as follows:
Household Demographics
Shelter
Water, Sanitation and Hygiene (WASH)
Health
Livelihoods
Education
Protection and Information
Main Community Concerns
10 For more information on the Blue Nile State conflict, see “HSBA Working Paper 31: At an Impasse: The Conflict in Blue Nile” Small Arms Survey 2013. 11 According to the latest biometric records. 12 Jamman camp closed in 2013 due to wide-scale flooding. Its inhabitants were relocated to Kaya camp. 13 More studies have been conducted in Gendrassa and Kaya refugee camps, for example: REACH (2014) Gendrassa Camp Profile Report

9
Yusuf Batil Refugee Camp Needs Assessment – November 2015
Map 1: Yusuf Batil Camp General Infrastructure

10
Yusuf Batil Refugee Camp Needs Assessment – November 2015
METHODOLOGY
The objective of this assessment was to gain a greater understanding of the living conditions of refugees within Yusuf Batil camp. The methodology for the assessment was decided by UNHCR prior to REACH’s involvement in order to allow the results to synchronise with ProGres14 data. The assessment used a mixed methods approach to data collection, using a combination of quantitative and qualitative primary data. First, a household survey was undertaken in the refugee camp. This was followed by four focus group discussions which were held within the camp with the aim of gaining a deeper understanding of issues highlighted in the survey data. DRC led the creation of the household survey questionnaire with input from other humanitarian partners in Maban. The focus group discussion guide was developed by REACH with input from several implementing partners.
Timeline February: Recruitment and training of enumerators and community buy-in March 2nd –July 7th: Household survey data collection August-September: Analysis of data; Draft report October: Focus Group Discussions (FGDs); Analysis of FGDs November: Final draft report
Household Survey Definition of Household: For the purposes of the survey, a household was defined as the number of people under one ration card. Therefore, if one shelter structure contained several ration cardholders, then each one was asked to respond to the survey and was considered a household by itself.
The household survey consisted of 76 questions covering multiple sectors including demographics, shelter, WASH, heath, education, protection and livelihoods. The data was collected by 22 enumerators using the Open Data Kit (ODK) software on smartphones. GPS data was collected for every household interviewed. Questions were designed for numerical, yes/no or multiple choice answers, resulting in a quantitative database of responses and allowing for quantitative and spatial analysis of results. Analysis and descriptive statistics were generated using Excel, while the spatial analysis was completed using the Arc GIS software.
Data collection started on the 2nd of March 2015 and lasted 4 months. Prior to data collection, the 22 enumerators were trained for two days on the questionnaire and the use of ODK on smartphones. The training included one day of field training, where the questionnaire was piloted. REACH hired temporary staff among the Yusuf Batil refugee population and nearby host community to act as enumerators.
The assessment aimed to cover every household in Yusuf Batil camp. However, due to internal movement within the camp, between camps, and temporary returns to Sudan it was not possible to interview every single household. In addition, the organic and transient nature of the camp, with no formal address system, meant that some households may have been inadvertently missed. In order to minimize this, supervisors did return visits to the villages assessed, asking sheiks if all HHs had been interviewed as well as by asking random households if they had been interviewed.
Households interviewed 7,508
Focus groups discussions held 4
Yusif Batil Camp is organised into community villages, each of which is headed by a particular sheikh (community leader). Each enumerator was assigned to an individual sheikh, and they would interview each household in that sheikh’s village. All villages are shown in Map 2.
14 UNHCR’s global registration system.

11
Yusuf Batil Refugee Camp Needs Assessment – November 2015
Map 2: Yusuf Batil Camp's Village Communities

12
Yusuf Batil Refugee Camp Needs Assessment – November 2015
Representativeness The initial raw sample consisted of 7,508 households. The normal data cleaning process eliminated 319 of these records. The analysed dataset therefore consisted of 7,189 records. The survey is therefore representative at a 99% confidence level with a 0.72 margin of error.
Focus Group Discussions Four focus group discussions (FGDs) were held in October 2015. REACH randomly selected four sheiks from different villages within the camp who were tasked to mobilize 8 to 9 people each (both men and women) to participate in the discussions. The FGDs were held in DRC’s field office in Yusuf Batil camp. A focus group discussion tool was created which received input from DRC and other NGOs working in Yusuf Batil (see annex).
Limitations Communication with enumerators while in the field collecting data was limited as cellphone reception was non-
existent and budget limitations meant that it was not possible to give radios to each of them. Therefore, communication was mostly done by direct contact, which two field coordinators were tasked to do. This means that each field coordinator had to manage between 5 to 10 enumerators spread out over a camp of over 40,000 people, where they could easily disappear and as a result, it was not always possible to effectively monitor enumerator performance. In order to mitigate potential data collection issues, data quality was monitored on a daily basis and enumerators were briefed every morning.
The pool of candidates from which to select enumerators generally had low levels of education and low levels of literacy in English. Therefore, training the enumerators, many of whom had never used a smart phone before, took longer than expected, and some of them experienced difficulties in performing their assigned tasks effectively. Daily briefings with the team allowed enumerators to ask questions about particular problems they may have encountered in the field, or clarify some of the assessment questions they found complicated.
The REACH team did not have a permanent office on site, therefore had to relocate every day to DRC‘s satellite office in the camp during business hours. The REACH team had to transport all materials from their base in Gendrassa to the camp each morning, and retrieve them before the end of business day. Coordinating activities proved difficult, due to both a lack of reliable transportation in and out of the camp and the inability to communicate with enumerators other than by word of mouth. If an enumerator could not make it back to the site by the prescribed time at the end of a day, they would have no contact with the REACH team until the next morning at the earliest. This meant that time to work on the assessment per day was limited. Daily targets (7 to 9 household assessment per day) were set to make sure that no time was wasted while the enumerators were in the field.
Security problems such as incidents between host communities and refugees as well as local militia conflicts restricted the team’s access to the camp for both quantitative data collection as well as to conduct the FGDs. This created delays in data collection. However, in order to continue data collection in periods of tension between host communities and refugees, refugees kept collecting data in the camp, while host community staff were in the office helping with administrative or human resources issues. As a result, the assessment did not come to a halt.
Limited financial resources meant it was difficult to collect data in a shorter timeframe. For future assessments, selecting a representative sample of households within the camp will prove more cost and time effective.

13
Yusuf Batil Refugee Camp Needs Assessment – November 2015
FINDINGS
This section presents the main findings from the assessment of Yusuf Batil refugee camp. It begins with a section detailing general demographic information; then describes sector-specific findings, including shelter, water supply, sanitation and hygiene promotion (WASH), health, livelihoods, education and protection findings. The final section describes the main concerns, as reported by assessed households in Yusuf Batil.
Camp and Household Demographics
This section of the report provides an overview of the main demographic characteristics of refugee households surveyed in Yusuf Batil camp including a population breakdown by sex and age; information on the sex of heads of household; household size and composition.
General Camp Demographics
Age and Sex Distribution
The population pyramid below shows the age and sex distribution of Yusuf Batil’s refugee population. It is clear from this that the majority of the population in the camp (57%) are under the age of 17. Among these children, 17% is aged under four, and 27% is aged 5 to 11. Figure 1: Yusuf Batil camp population pyramid, disaggregated by age and sex
The table below shows the dependency ratios of children under 18, elderly over 60, and the total age dependency ratio for Yusuf Batil, calculated using the population data collected. The age dependency ratio compares the number of people of non-working age (children and elderly) to the number of people of working age (18-59) who support them. As an example, the age dependency ratio of 123.2 mean that every 100 individuals of working age support 123.2 individuals of non-working age. These figures are significantly higher than national dependency ratios for South Sudan: for 2014, World Bank data shows a total age dependency ratio of 85 for South Sudan. Table 1: Dependency Ratios
Child dependency ratio 117.5
Old age dependency ratio 5.7
Total age dependency ratio15 123.2
15 The dependency ratio is an age-population ratio of those typically not in the labor force (dependents) and those typically in the labor force (productive individuals). It is used to measure the pressure on productive population. The (total) dependency ratio can be decomposed into the child dependency ratio and the old age dependency ratio.
10%
14%
7%
18%
3%
7%
13%
7%
20%
2%
0-4
5-11
12-17
18-59
60+
Male Female

14
Yusuf Batil Refugee Camp Needs Assessment – November 2015
Household Composition
Head of Households and Number of Household Members
The survey found that 65% of refugee households in Yusuf Batil had a male head of the household, and 35% a female head of the household. Within the camp large households are common. On average there are 4.7 members per household. Male-headed households have on average 4.6 members while female-headed households have on average 4.2 members.
Impairment of Head of Household
Only a minority (4%) of the heads of household (HHHs) reported having an impairment or disability. Among female heads of household, three percent reported an impairment, and among male heads of household, five percent reported an impairment. The most common types of impairments were physical (47%), visual (25%), mental/intellectual (15%) and related to chronic disease (14%). Findings reveal that 19% percent of household heads with an impairment reported several impairments, suggesting that these individuals are likely to be particularly vulnerable. Although, heads of household reporting impairment represent a minority, nearly half of this group have nobody else in their household over the age of 16 available to care for them.
One major cause of reported impairment is disease, reported as the reason for impairment by 31% of those with a disability. A quarter of respondents said the cause of impairment was unknown, while a further 19% said that the head of household was born with the impairment.
Figure 2: Reported reasons for impairment of head of household
Population Density
As an unplanned camp that was naturally settled, Yusuf Batil’s population is distributed unevenly across the camp and remains the most congested of all of the camps in Maban County. The population of Yusuf Batil is primarily concentrated in the northern half of the camp, particularly along the camp’s main arterial road between the Darfur market along the main road, and the NGO offices closer to the centre of the camp. The population in the camp’s southern regions is more dispersed, although there are some more densely populated areas near the secondary distribution site and the WFP rub hall.
31%
25%
19%
12%
7%
4%2% 1%
Disease Unknown They were bornwith it
War relatedinjury
Accidental injury Attacked by acivilian
Attacked by ananimal
Other

15
Yusuf Batil Refugee Camp Needs Assessment – November 2015
Map 3: Reported shelter ownership per household

16
Yusuf Batil Refugee Camp Needs Assessment – November 2015
Shelter
This section of the report provides an overview of the main shelter types within Yusuf Batil camp, their condition, the source of the materials used to build them as well as the origin of tents.
In 2014, UNHCR and implementing partners DRC and ACTED, started providing substitute transitional shelters to improve the living conditions of Sudanese refugees in Maban. At the time, 79% of refugees were still living tents, but many of these emergency shelters were worn out, since they had been received upon refugees’ arrival in the camp in 2011 and 2012. Shelter kits provided to beneficiaries in Yusuf Batil camp consisted of local wooden poles, sticks (wall fillers), nails, hoop iron and corrugated iron sheets for roofing.16
Shelter Types
Around half of households in Yusuf Batil (51%) live in one of two main shelter typologies: grass and wood (28%), and mud and wood structures (23%). Sixteen percent of structures in the camp are still tents (either from UNHCR, Japan International Cooperation Agency (JICA) or NGOs), while Corrugated Galvanized Iron (CGI) structures account for eight percent of total structures. Traditional shelters such as the round tukul made of mud, wood and grass, account for 13% of total shelters. Figure 3: Type of shelter present in Yusuf Batil Camp
Map 11 (see Annex 1) shows clearly that mud-built structures are more common in the northern areas of the camp than elsewhere. There are very few mudded structures around the primary refugee market and there is a greater reliance on UNHCR tents in the northern areas of the camp.
Shelter Condition
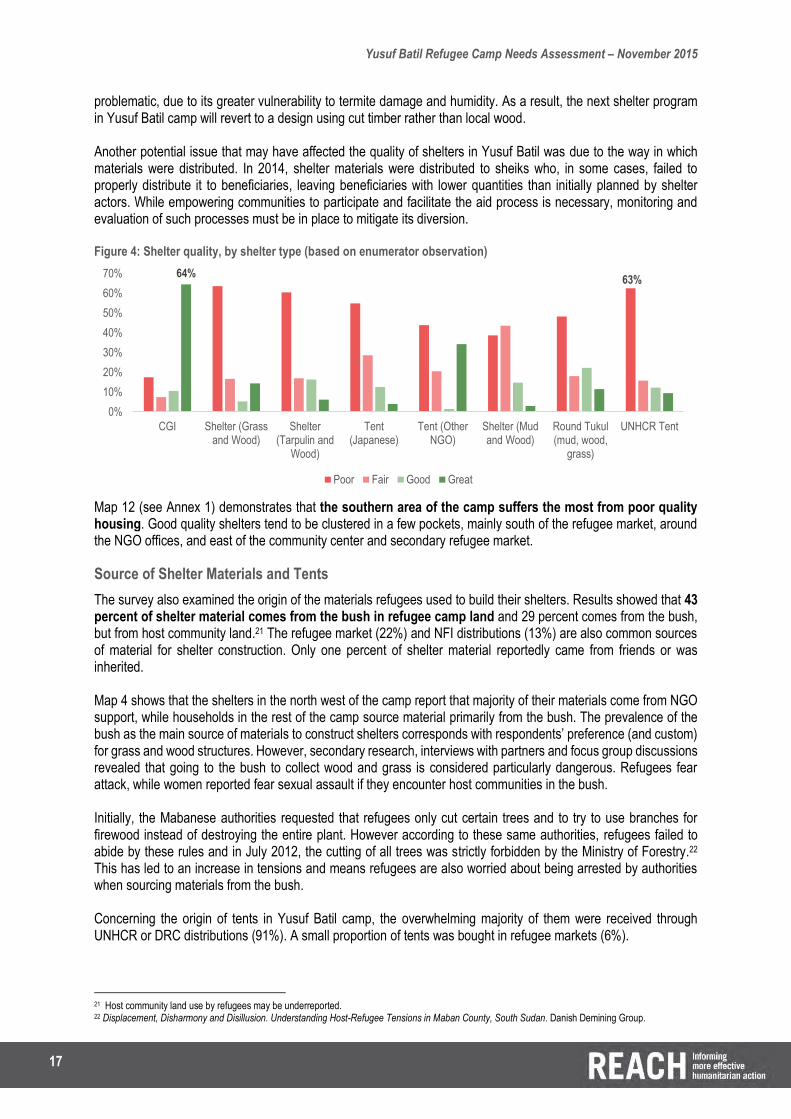
Based on direct observation of enumerators, the majority of shelters in Yusuf Batil were judged to be in poor condition (51%).17 Only 13 percent are in good condition18 and 14 percent in great condition19. When disaggregated by type of shelter, the data shows that CGI shelters are in the best condition, with 64% of these shelters estimated to be in great condition. Grass and wood-built shelters and UNHCR tents represent those shelters in the poorest condition, with 64% and 63% respectively judged to be in poor condition. Discussions with shelter partners revealed that in 2014, while mudding of shelters was done for vulnerable families, resulting in a full completed shelter; for others only the skeleton and the roof of the shelter was built. Households were given wall fillers as part of their shelter kits, but partners soon realised that beneficiaries were not mudding structures their own structures properly, and would therefore deteriorate fast. In addition, the shelter design was changed early 2014 from a timber structure (made of cut wood from the market) to local wooden poles due to declining timber supplies in the market.20 The use of local wood instead of better quality timber proved to be
16 South Sudan, Factsheet, September 2014, UNHCR 17 Poor condition: Structure is in terrible shape. Large holes or destroyed mudding in walls and roof, missing door. Large, un-patchable holes. Structure is in danger of collapse/severe deterioration. No permanent fixes can salvage structure/ need to build a new one. 18 Good condition: Structure may have a hole in the roof or wall, or need more mudding in a few places, but is still a serviceable structure that does not need urgent repairs. Some wear, if a tent, but no unpatched holes. 19 Great condition: Solid structure, no holes in walls or roof, no repairs needed. Like new, if a tent. 20 South Sudan, Factsheet, September 2014, UNHCR
28%
23%
13% 13% 13%
8%
2% 1%
Shelter (Grass andWood)
Shelter (Mud andWood)
Shelter (Tarpulinand Wood)
Round Tukul (mud,wood, grass)
UNHCR Tent UNHCR CGIShelter
Tent (Japanese) Tent (Other NGO)
17
Yusuf Batil Refugee Camp Needs Assessment – November 2015
problematic, due to its greater vulnerability to termite damage and humidity. As a result, the next shelter program in Yusuf Batil camp will revert to a design using cut timber rather than local wood. Another potential issue that may have affected the quality of shelters in Yusuf Batil was due to the way in which materials were distributed. In 2014, shelter materials were distributed to sheiks who, in some cases, failed to properly distribute it to beneficiaries, leaving beneficiaries with lower quantities than initially planned by shelter actors. While empowering communities to participate and facilitate the aid process is necessary, monitoring and evaluation of such processes must be in place to mitigate its diversion. Figure 4: Shelter quality, by shelter type (based on enumerator observation)
Map 12 (see Annex 1) demonstrates that the southern area of the camp suffers the most from poor quality housing. Good quality shelters tend to be clustered in a few pockets, mainly south of the refugee market, around the NGO offices, and east of the community center and secondary refugee market.
Source of Shelter Materials and Tents
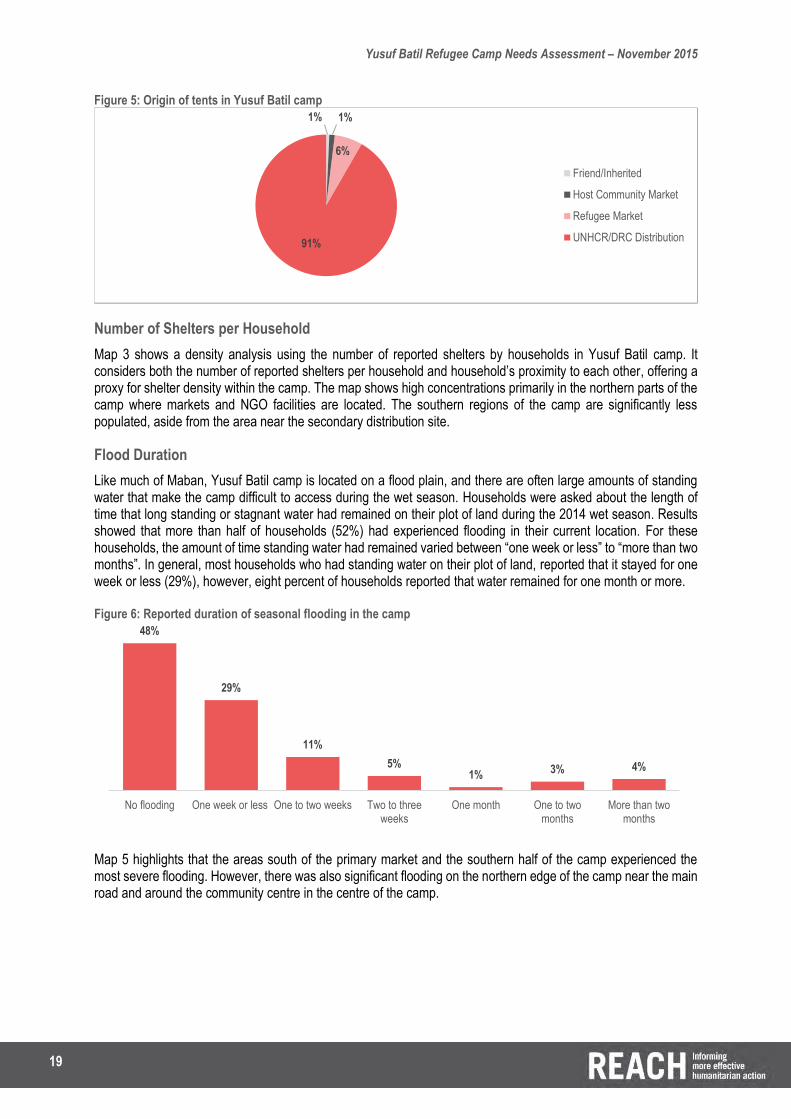
The survey also examined the origin of the materials refugees used to build their shelters. Results showed that 43 percent of shelter material comes from the bush in refugee camp land and 29 percent comes from the bush, but from host community land.21 The refugee market (22%) and NFI distributions (13%) are also common sources of material for shelter construction. Only one percent of shelter material reportedly came from friends or was inherited. Map 4 shows that the shelters in the north west of the camp report that majority of their materials come from NGO support, while households in the rest of the camp source material primarily from the bush. The prevalence of the bush as the main source of materials to construct shelters corresponds with respondents’ preference (and custom) for grass and wood structures. However, secondary research, interviews with partners and focus group discussions revealed that going to the bush to collect wood and grass is considered particularly dangerous. Refugees fear attack, while women reported fear sexual assault if they encounter host communities in the bush. Initially, the Mabanese authorities requested that refugees only cut certain trees and to try to use branches for firewood instead of destroying the entire plant. However according to these same authorities, refugees failed to abide by these rules and in July 2012, the cutting of all trees was strictly forbidden by the Ministry of Forestry.22 This has led to an increase in tensions and means refugees are also worried about being arrested by authorities when sourcing materials from the bush. Concerning the origin of tents in Yusuf Batil camp, the overwhelming majority of them were received through UNHCR or DRC distributions (91%). A small proportion of tents was bought in refugee markets (6%).
21 Host community land use by refugees may be underreported. 22 Displacement, Disharmony and Disillusion. Understanding Host-Refugee Tensions in Maban County, South Sudan. Danish Demining Group.
63%64%
0%
10%
20%
30%
40%
50%
60%
70%
CGI Shelter (Grassand Wood)
Shelter(Tarpulin and
Wood)
Tent(Japanese)
Tent (OtherNGO)
Shelter (Mudand Wood)
Round Tukul(mud, wood,
grass)
UNHCR Tent
Poor Fair Good Great

18
Yusuf Batil Refugee Camp Needs Assessment – November 2015
Map 4: Reported primary source of shelter materials
19
Yusuf Batil Refugee Camp Needs Assessment – November 2015
Figure 5: Origin of tents in Yusuf Batil camp
Number of Shelters per Household
Map 3 shows a density analysis using the number of reported shelters by households in Yusuf Batil camp. It considers both the number of reported shelters per household and household’s proximity to each other, offering a proxy for shelter density within the camp. The map shows high concentrations primarily in the northern parts of the camp where markets and NGO facilities are located. The southern regions of the camp are significantly less populated, aside from the area near the secondary distribution site.
Flood Duration
Like much of Maban, Yusuf Batil camp is located on a flood plain, and there are often large amounts of standing water that make the camp difficult to access during the wet season. Households were asked about the length of time that long standing or stagnant water had remained on their plot of land during the 2014 wet season. Results showed that more than half of households (52%) had experienced flooding in their current location. For these households, the amount of time standing water had remained varied between “one week or less” to “more than two months”. In general, most households who had standing water on their plot of land, reported that it stayed for one week or less (29%), however, eight percent of households reported that water remained for one month or more. Figure 6: Reported duration of seasonal flooding in the camp
Map 5 highlights that the areas south of the primary market and the southern half of the camp experienced the most severe flooding. However, there was also significant flooding on the northern edge of the camp near the main road and around the community centre in the centre of the camp.
1% 1%
6%
91%
Friend/Inherited
Host Community Market
Refugee Market
UNHCR/DRC Distribution
48%
29%
11%
5%1% 3% 4%
No flooding One week or less One to two weeks Two to threeweeks
One month One to twomonths
More than twomonths

20
Yusuf Batil Refugee Camp Needs Assessment – November 2015
Map 5: Reported length of flood duration

21
Yusuf Batil Refugee Camp Needs Assessment – November 2015
Water, Sanitation and Hygiene (WASH)
This sub-section looks at access to water, sanitation and hygiene within Yusuf Batil refugee camp. It first examines the population’s access to water and then their sanitation and hygiene practices. WASH programs in Yusuf Batil are implemented by Medair.
Access to Water
Water Sources
An overwhelming majority (99.2%) of households use tapstands as their main source of drinking water. Only 0.8 percent of households said that they used handpumps as their main source of drinking water. In terms of proximity, tapstands were also the nearest source of water for 99% of households.
Nine percent of households using tapstands as their main source of water are using Tapstand 2. Map 13 (see Annex 1) shows that this tapstand is located between the primary market and DRC’s field office, which is one of the busiest areas/intersections of the camp. On average, each tapstand was used by 2 percent of surveyed households. For the few households using handpumps, more than half (51%) were using Handpump 2 and 19 percent were using Handpump 4.
Number of Collection Trips, Waiting Times and Quantity of Water Collected
While an overwhelming majority of households are either using tapstands or handpumps to access water (only one head of household replied that they got water from rain-water puddles), the amount of trips per day to collect water and waiting times at water points are both significant. Indeed, 31 percent of surveyed households make on average five trips a day to get water.
Figure 7: Average number of trips to fetch water per day, reported by households
Figure 8: Quantity of water collected, by number of trips
As for waiting times, half of households interviewed say that they generally wait between 15 to 30 minutes at the water source to get water. More than 30 percent wait less than 15 minutes. However, 17 percent wait between 45
7%
18%
22% 22%
31%
1 2 3 4 5
% h
ouse
hold
s
30%
12%
4%1% 0%
7%
59%
41%
10%
1%5%
17%
34%
40% 38%
58%
13%
21%
50%
61%
1 2 3 4 5
% h
ouse
hold
s
0 - 20 Litres 21 - 40 Litres 41-60 Litres 61 or more Litres

22
Yusuf Batil Refugee Camp Needs Assessment – November 2015
minutes to an hour, and one percent of households wait for more than an hour. According to SPHERE standards, queuing time at a water source should be no more than 30 minutes23. As explained in the SPHERE handbook, potential negative results of excessive queuing times include reduced per capita water consumption, increased consumption from unprotected surface sources, and reduced time for other essential survival tasks for those who collect water. Map 14 (see Annex 1) reveals that longest waiting times for water occur in the south western region of the camp. Areas east of the community centre appear to be stressed as well, possibly due to the limited number of sources.
In the FGDs, refugees explained that having operators switch off water at certain hours of the day is inconvenient and means that they either have to wait for the water to be switched on again or have to walk to the next village where water is available. This was confirmed through discussions with WASH partners who said that the fact that operators close valves at certain times of the day could lead to an increase in waiting times at water points. Therefore, if it is not possible to guarantee the community access to water all the time, it is necessary to improve the water storage capacity of each household and ensure good storage practices (keeping containers clean, etc.).
Figure 9: Reported length of time spent waiting at water source
Sanitation and Hygiene
Excreta Disposal
Findings reveal that 40% of households defecate in latrines built by NGOs. Another 33% are using latrines built by their community. It is to be noted however, that seven percent of households reported defecating in the bush. This relatively large proportion of people defecating in the open air increases the risk of spreading infectious diarrhoeal diseases such as cholera. In order to reduce the number of people defecating in the open air, additional latrines should be built and additional hygiene education programmes should be put in place to discuss the dangers of such a practice and how it can be reduced. FGD participants mentioned that many latrines were full, and even when the community dug their own holes, NGOs do not always come to finish the latrine construction.
Despite the presence of open air defecation, this practice appears to be localised (see map 6, overleaf); mainly taking place in the south of the camp, to the south of the secondary distribution site, and west of the primary refugee market. Conversations with WASH partners revealed that at the time of data collection, Medair was about to begin work on latrines in this area, suggesting that prior awareness of this issue already existed. In addition, in January and February 2015, Medair started trying to shift the construction of latrines from tarpaulin to locally sourced materials to make them cheaper and more sustainable. However, the NGO faced some resistance from Sheiks who were reluctant to change, particularly in the South of the camp. Therefore, fewer latrines were built during that period. Since then, the shift to locally available materials has been accepted by the refugee community in Yusuf Batil.
19 percent of heads of household reported defecating in family-owned and constructed latrines, the preferred option where possible according to SPHERE standards. Map 6 shows the three different latrine types to have distinct clustering patterns. Communal and family latrine use is most popular in the north and south-western areas of the camp, while NGO latrines are more commonly used in the central and western areas of the camp.
23 http://www.spherehandbook.org/en/water-supply-standard-1-access-and-water-quantity/
32% 51% 6% 11% 1%
0% 10% 20% 30% 40% 50% 60% 70% 80% 90% 100%
Less than 15 minutes 15 to 30 minutes 31 to 45 minutes 45 minutes to an hour More than an hour

23
Yusuf Batil Refugee Camp Needs Assessment – November 2015
Map 6: Reported defecation locations in Yusuf Batil Camp
24
Yusuf Batil Refugee Camp Needs Assessment – November 2015
Figure 10: Reported usual location of defecation
Hand-washing
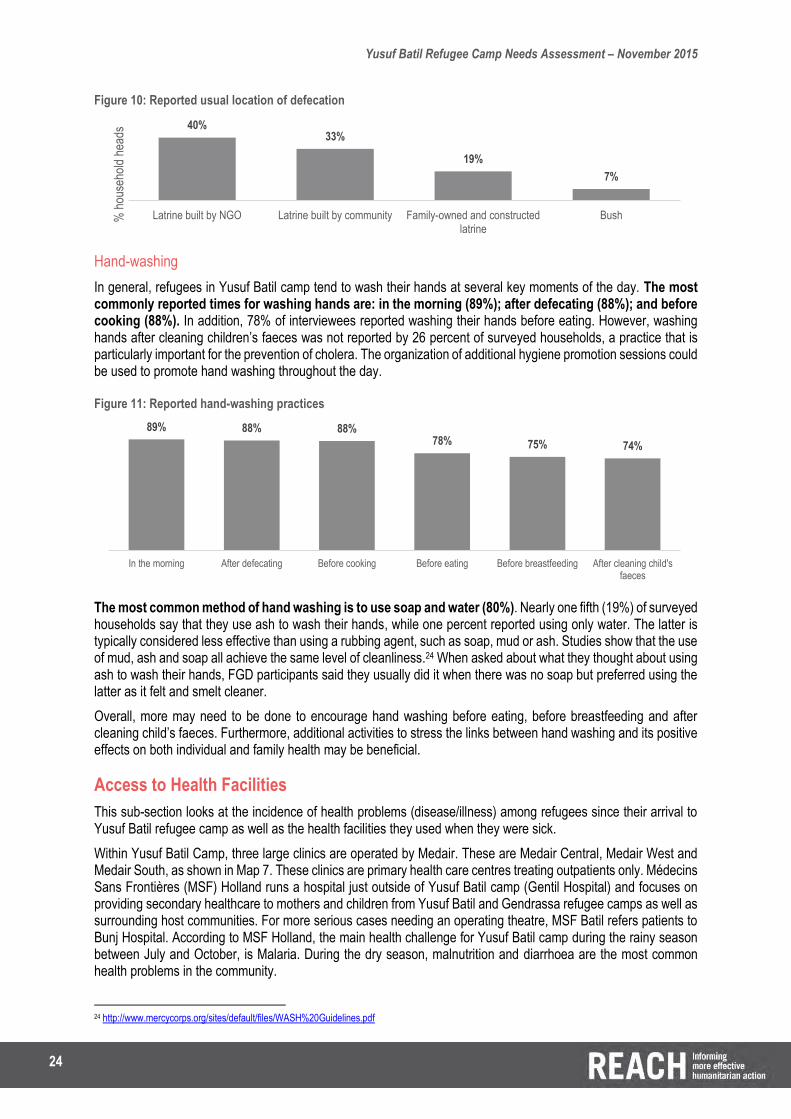
In general, refugees in Yusuf Batil camp tend to wash their hands at several key moments of the day. The most commonly reported times for washing hands are: in the morning (89%); after defecating (88%); and before cooking (88%). In addition, 78% of interviewees reported washing their hands before eating. However, washing hands after cleaning children’s faeces was not reported by 26 percent of surveyed households, a practice that is particularly important for the prevention of cholera. The organization of additional hygiene promotion sessions could be used to promote hand washing throughout the day. Figure 11: Reported hand-washing practices
The most common method of hand washing is to use soap and water (80%). Nearly one fifth (19%) of surveyed households say that they use ash to wash their hands, while one percent reported using only water. The latter is typically considered less effective than using a rubbing agent, such as soap, mud or ash. Studies show that the use of mud, ash and soap all achieve the same level of cleanliness.24 When asked about what they thought about using ash to wash their hands, FGD participants said they usually did it when there was no soap but preferred using the latter as it felt and smelt cleaner.
Overall, more may need to be done to encourage hand washing before eating, before breastfeeding and after cleaning child’s faeces. Furthermore, additional activities to stress the links between hand washing and its positive effects on both individual and family health may be beneficial.
Access to Health Facilities
This sub-section looks at the incidence of health problems (disease/illness) among refugees since their arrival to Yusuf Batil refugee camp as well as the health facilities they used when they were sick.
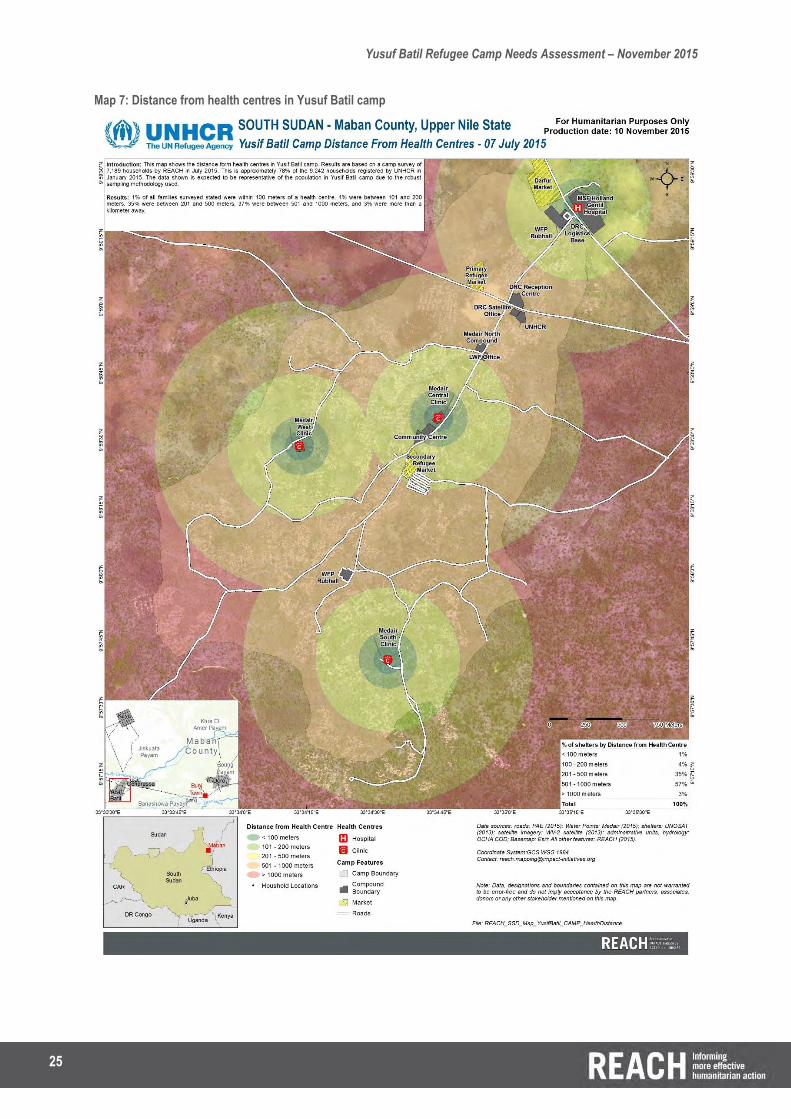
Within Yusuf Batil Camp, three large clinics are operated by Medair. These are Medair Central, Medair West and Medair South, as shown in Map 7. These clinics are primary health care centres treating outpatients only. Médecins Sans Frontières (MSF) Holland runs a hospital just outside of Yusuf Batil camp (Gentil Hospital) and focuses on providing secondary healthcare to mothers and children from Yusuf Batil and Gendrassa refugee camps as well as surrounding host communities. For more serious cases needing an operating theatre, MSF Batil refers patients to Bunj Hospital. According to MSF Holland, the main health challenge for Yusuf Batil camp during the rainy season between July and October, is Malaria. During the dry season, malnutrition and diarrhoea are the most common health problems in the community.
24 http://www.mercycorps.org/sites/default/files/WASH%20Guidelines.pdf
40%33%
19%
7%
Latrine built by NGO Latrine built by community Family-owned and constructedlatrine
Bush% h
ouse
hold
hea
ds
89% 88% 88%78% 75% 74%
In the morning After defecating Before cooking Before eating Before breastfeeding After cleaning child'sfaeces
25
Yusuf Batil Refugee Camp Needs Assessment – November 2015
Map 7: Distance from health centres in Yusuf Batil camp

26
Yusuf Batil Refugee Camp Needs Assessment – November 2015
Occurrence of Disease/Illness and Health Facilities Used Nearly half (48%) of surveyed households said that at least one member of their household had suffered from a disease or illness since coming to Yusuf Batil. The survey asked households whether any member of their household had been ill since coming to the camp and which health facility they had used. The majority of refugees reported having visited the Medair Central Clinic when they were sick (55%) followed by Medair West Clinic (28%). Another nine per cent said that they went to MSF Holland Hospital for treatment. The local hospital (Bunj/SP Hospital) was only used by four per cent of sick refugees.
Figure 12: Reported use of health facilities
Map 15 (see Annex 1) shows that the Medair West clinic is used by refugees living in the western half of the camp, whilst Medair Central is used by refugees from the northeast and south of the camp. Medair South Clinic was closed for the majority of the survey which is why there is a lower number of reported referrals. Conversations with Medair project managers confirmed that the majority of patients for Medair South during this period were referred to Medair Central Clinic.
Livelihoods
This sub-section serves as a preliminary examination of livelihoods, focusing on cultivating and herding within Yusuf Batil refugee camp.
Employment
According to a Food Security and Livelihoods Assessment conducted in Maban County in January 2015,25 50.7% of male refugees and 50.3% percent of female refugees in Maban have no source of income. This varies across the county: 67% of refugees from Gendrassa, 52% of refugees from Doro, 50% of refugees from Kaya and 42% percent of refugees from Batil reportedly have no source of income. Although Yusuf Batil camp has the lowest proportion of people with no source of income, amongst all four camps, livelihood opportunities are scarce. The assessment found that the main reasons for unemployment are the lack of available jobs, lack of education and lack of skills. According to refugees from Yusuf Batil, the main livelihood activities within the camp include selling coffee/tea, or owning small shops26. However, refugees claim that these activities are limited as very few people have enough resources to start such businesses. FGDs also revealed that most cultivating/planting of crops and herding is done for personal consumption rather than to be sold. The following sections look at these two activities in more detail.
Cultivation
Crop cultivation in the Maban refugee camps has become critical over the last year due to cuts of up to 30% of refugees’ World Food Programme (WFP) rations.27 As an alternative, humanitarian partners are looking at long-term, more sustainable solutions, particularly the acquisition of land for refugees to farm. In 2015, the refugee
25 Food Security and Livelihoods Assessment in Maban, Upper Nile, South Sudan, Danish Refugee Council, January 2015 26 Focus group discussions with refugees from Yusuf Batil camp, conducted in October 2015. 27 “’Increasing malnutrition in Maban’; rations to be cut”. Radio Tamazuj. 16 Jun 2015.
55%
28%
9%4%
1% 1% 1%
Medair CentralClinic
Medair WestClinic
MSF HollandHospital
Bunj/SP Hospital Traditional healer IMC Clinic Other

27
Yusuf Batil Refugee Camp Needs Assessment – November 2015
community acquired about 45 square kilometres of land for Batil, Gendrassa and Kaya camps for agriculture. Vegetable and staple crop seeds were distributed to both the host and refugee communities for the 2015 planting season.
A majority of households (60%) reported they had planted something in the last year. Of these, 79 percent said they cultivated maize crops and 77 percent cultivated okra crops. Other major types of cultivated crops include sorghum and beans. According to the survey results, in general refugee camp land is used for cultivation (92%). Only 10 percent of crops were cultivated on host community land and three percent were cultivated on communal land.
Figure 13: Types of crop cultivated by household (multiple selection was allowed)
Although a majority of households reported having planted something in the last year, focus group discussions showed that this was generally done for the household’s own consumption. In addition, FGD participants complained that, while they had received seeds from aid agencies, the soil was infertile and weather conditions had been unfavourable, affecting their harvest. Discussion with Food Security and Livelihood experts demonstrated that while weather conditions in 2015 were unfavourable for cultivation, the land in the area is not infertile. Soil and water conservation techniques coupled with basic agronomy practices should be sufficient to alter the effects of such weather conditions.
Herding
Ownership of livestock was less common than planting/cultivating in Yusuf Batil with only 18% of heads of household reporting they owned livestock. Of these, 83% herd goats and 23% herd sheep. In tems of land used for herding, livestock owners often use a combination of refugee camp land (66%) and communal land (56%). Only 10% reported using host community land. Figure 14: Type of hivestock herd
79% 77%
54%
35%
21% 18% 15%9% 9% 8% 7% 6% 3% 3%
% h
ouse
hold
s gr
owin
g cr
ops
83%
27%18% 14%
7%
Goats Sheep Donkey Cows Camels
% h
ouse
hold
s w
ith
lives
tock

28
Yusuf Batil Refugee Camp Needs Assessment – November 2015
Education
This sub-section looks at the level of school attendance by school-aged children within Yusuf Batil as well as reasons for non-attendance.
Level of Attendance and Reasons for Non-Attendance
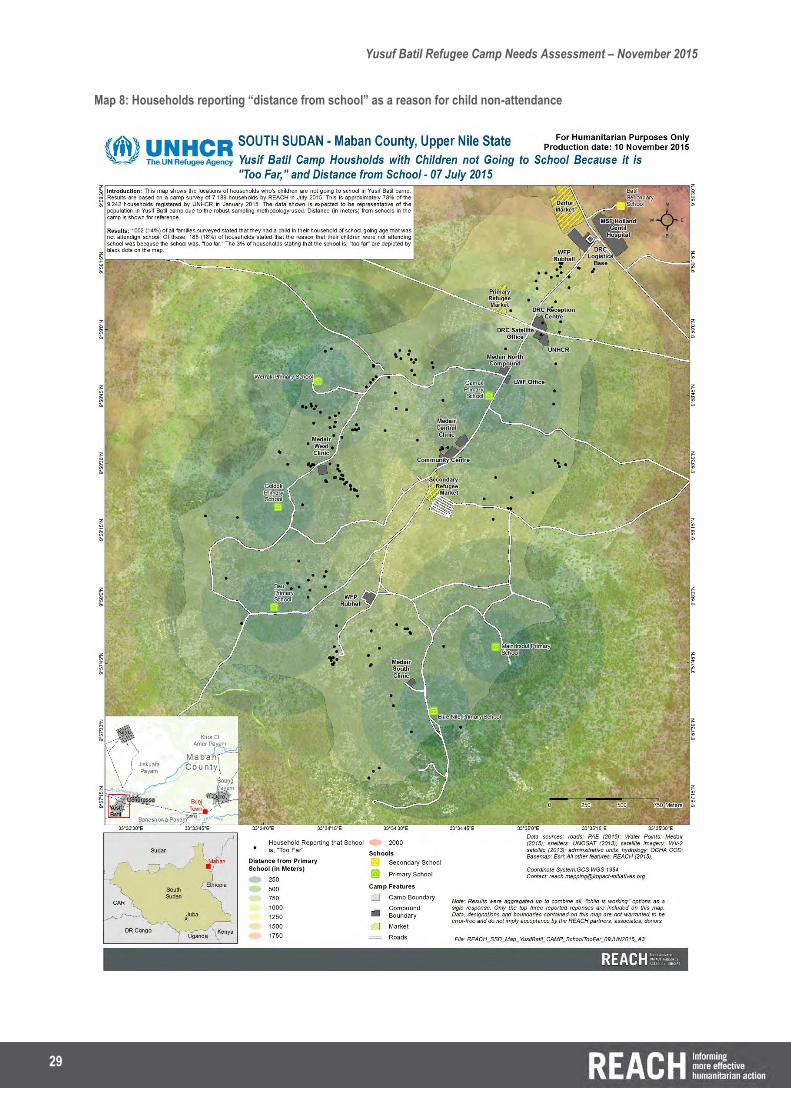
Fourteen percent of interviewees said they had children of school age in their household who were not attending school. When asked why their children were not going to school, the most common response (66%) was that they did not want them to mix with children of other communities. When this data was mapped (see map 16 in Annex 1), it showed that this specific reason was prominent around the edges of the camp. This indicates that there may be issues between specific communities in these areas and that this could be mitigated through social cohesion programming. On the other hand, FGD participants reported that there were no problems between children of different communities at school, indicating either that this issue may have been too sensitive to discuss in a group setting, or that families reporting this were not included in the focus group discussions. Further, 29% of interviewees reported that children were working (either from home, at the market, or tending livestock) as a reason for not attending school. Map 16 shows that households reporting children working instead of going to school are primarily located in the southwest of the camp. Another commonly reported reason for non-attendance was the fact that the school was too far (18%). As we can see in the map 8, overleaf, many of these households (especially in the west of the camp) are in fact quite close to schools. Figure 15: Reported reasons for children not attending school
In FGDs, however, it was common to hear from participants that an important reason why some children were not being sent to school was due to lack of clothes or sandals. Children being hungry at school was also mentioned as a problem and participants suggested having schools serve breakfast to students to remedy this.
66%
18% 17%13%
8%5%
3% 2% 1%
I don't want themto attend schoolwith children of
other communities
The school is toofar
They must workform home/gatherwater, firewood,
sand
The quality of theschool is not very
good
They must tendlivestock
They are too oldto go to school in
the camp
They must work atthe market
Only boys canattend school
Other
% h
ouse
hold
s w
ith o
ut o
f shc
ool c
hild
ren
29
Yusuf Batil Refugee Camp Needs Assessment – November 2015
Map 8: Households reporting “distance from school” as a reason for child non-attendance

30
Yusuf Batil Refugee Camp Needs Assessment – November 2015
Protection and Information
This sub-section outlines assessment findings related to protection. It explores who or which institution refugees can reach out to in order to report security incidents. It also explores refugees’ opinion of protection mechanisms within and outside the camp. In addition, it looks at refugees’ main sources of information.
Security Incidents, Protection and Reporting Mechanisms
Occurrence and Type of Security Incidents
The data revealed that 14% of households have experienced a security related incident in the camp. When asked what happened, a majority of the heads of household replied that their shelter had been damaged or destroyed (66% of this group). The second most common security incident was robbery (52%) followed by physical attacks (12%). Finally, only two percent of security incidents were said to be harassment cases. However, there is a high possibility that many harassment cases are left unreported. Figure 16: Type of Security Incident
Map 9, overleaf, shows that the majority of security incidents occurred in the south west of the camp, around Medair West Clinic and near the Darfur market on the main road. This suggests that these incidents may be the result of conflict with host communities. Proximity to host communities was confirmed to be a problem by participants of FGDs. One participant said “We have a lot of problems with host community because we are on the outskirts of the camp.”
Tensions and security incidents between refugees and host communities are commonplace in Maban. While at first the local population was willing to embrace refugees coming to Maban, as time passed and the influx of refugees continued, perceived inequalities and competition for resources started causing tensions.28 In March 2014, the United States Agency for International Development (USAID) reported that hostilities between host communities and refugees in Maban were escalating and resulting in the burning of houses, tents, and warehouses belonging to both refugees and the local community. Specifically, last year tensions were high in Yusuf Batil as residents demanded that refugees evacuate the area, causing nearly 8,000 refugees to flee.29 The FGDs revealed that fear of clashes with the host community was still prominent within the camp. One participant said on that topic: “We fled war to find peace, but what we have here is worse. We want security here”.
28 Displacement, Disharmony and Disillusion. Understanding Host-Refugee Tensions in Maban County, South Sudan. Danish Demining Group. 29 South Sudan Crisis Fact Sheet #35, USAID, March 28, 2014
66%
52%
12%
2% 1%
Tent damaged/destroyed Robbery Physical attack Harassment Other
% h
ouse
hold
s re
port
ing
secu
rity
inci
dent
s

31
Yusuf Batil Refugee Camp Needs Assessment – November 2015
Map 9: Location of reported security incidents in Yusuf Batil, by type

32
Yusuf Batil Refugee Camp Needs Assessment – November 2015
Protection and Reporting Mechanisms
The majority of heads of household surveyed said that they would report an incidence of harassment to their sheik (98%). Only two percent said they would report it to their umda. This highlights the importance of the sheik’s role in each community in the camp. Indeed, the survey also found that heads of households generally confide deep, personal matters to their sheik more than to a member of their family (97% and 37% respectively). In the FGDs, participants explained that they would automatically report a security incident to their sheik and if it was serious, the sheik would report it to the umda. If both the sheik and the umda were unable to solve the incident then it would be reported to the police.
Heads of household were also asked to rate the effectiveness of community watch teams and police in limiting security issues within the camp. More than half (58%) said it was “ok, but could be better”, 39% reported it was “good”, two percent said it was “poor” and finally one percent claimed that their community was not doing anything to provide security. The main reasons why community actors are seen as ineffective are because they are deemed not committed or consistent (36%) or not professional/competent (26%). The problem of corruption was cited by 19 percent of head of households as a reason for the ineffectiveness of the response of community actors. Overall, map 17 (see Annexe 1) shows that refugees perceive that there is still room for improvement in the quality of community watch teams and police. The northern section of the camp is most concerned with non-representation and having conflicting interests, while others regard them as being unprofessional or incompetent, or corrupt.
With regards the police, FGD participants said that in their opinion, the police generally took the side of the host community when there was a security incident between refugees and host community.
Figure 17: Reported reasons for ineffective response by community watch teams and police
Information Sources
The importance of the sheik’s role in each community in the camp is also confirmed by the fact that a majority (91%) of households primarily get their information from them. Only 8.5% said they get their information from the radio. However, more than 63% of interviewed heads of households said they have access to a radio30. Radio stations most listened to by refugees in Yusuf Batil camp are Radio Salaam31 (83%) followed by Radio Tabanga (49%).
30 Access does not necessarily mean that the radio belong to the HH, it could be a neighbors radio, a radio in a café etc… 31 Radio Salaam is a radio station independently operated by a group of youth from refugee and host community trained by ACTED. It broadcasts general and community news, as well as information on education, health issues, women's concerns, and youth related matters.
36%
26%
19%
13%
3% 3%
They are notcommitted or
consistent
They are notprofessional or
competent
They are too corrupt They do not representthe community
I do not trust them They have conflictinginterests
% h
ouse
hold
s re
port
ing
inef
fect
ive
resp
onse
by
wat
ch te
ams
or p
olic
e
33
Yusuf Batil Refugee Camp Needs Assessment – November 2015
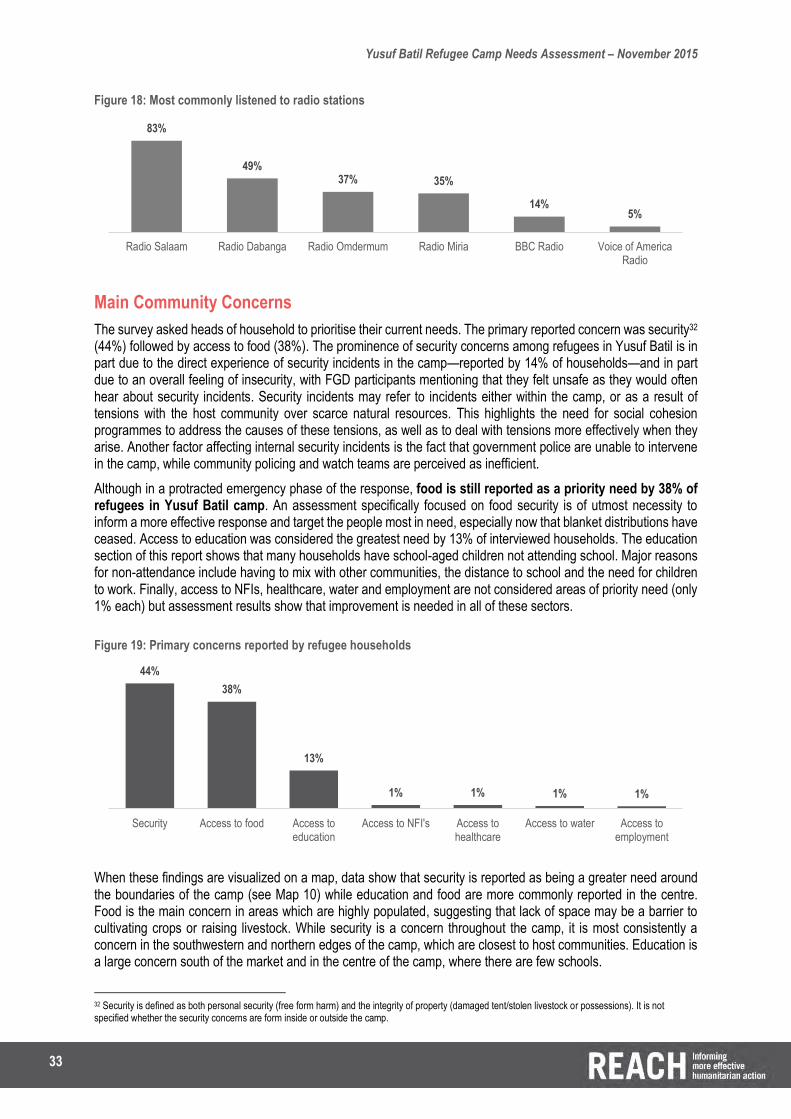
Figure 18: Most commonly listened to radio stations
Main Community Concerns
The survey asked heads of household to prioritise their current needs. The primary reported concern was security32 (44%) followed by access to food (38%). The prominence of security concerns among refugees in Yusuf Batil is in part due to the direct experience of security incidents in the camp—reported by 14% of households—and in part due to an overall feeling of insecurity, with FGD participants mentioning that they felt unsafe as they would often hear about security incidents. Security incidents may refer to incidents either within the camp, or as a result of tensions with the host community over scarce natural resources. This highlights the need for social cohesion programmes to address the causes of these tensions, as well as to deal with tensions more effectively when they arise. Another factor affecting internal security incidents is the fact that government police are unable to intervene in the camp, while community policing and watch teams are perceived as inefficient.
Although in a protracted emergency phase of the response, food is still reported as a priority need by 38% of refugees in Yusuf Batil camp. An assessment specifically focused on food security is of utmost necessity to inform a more effective response and target the people most in need, especially now that blanket distributions have ceased. Access to education was considered the greatest need by 13% of interviewed households. The education section of this report shows that many households have school-aged children not attending school. Major reasons for non-attendance include having to mix with other communities, the distance to school and the need for children to work. Finally, access to NFIs, healthcare, water and employment are not considered areas of priority need (only 1% each) but assessment results show that improvement is needed in all of these sectors.
Figure 19: Primary concerns reported by refugee households
When these findings are visualized on a map, data show that security is reported as being a greater need around the boundaries of the camp (see Map 10) while education and food are more commonly reported in the centre. Food is the main concern in areas which are highly populated, suggesting that lack of space may be a barrier to cultivating crops or raising livestock. While security is a concern throughout the camp, it is most consistently a concern in the southwestern and northern edges of the camp, which are closest to host communities. Education is a large concern south of the market and in the centre of the camp, where there are few schools.
32 Security is defined as both personal security (free form harm) and the integrity of property (damaged tent/stolen livestock or possessions). It is not specified whether the security concerns are form inside or outside the camp.
83%
49%37% 35%
14%5%
Radio Salaam Radio Dabanga Radio Omdermum Radio Miria BBC Radio Voice of AmericaRadio
44%
38%
13%
1% 1% 1% 1%
Security Access to food Access toeducation
Access to NFI's Access tohealthcare
Access to water Access toemployment

34
Yusuf Batil Refugee Camp Needs Assessment – November 2015
CONCLUSION
The conflict in Blue Nile state has left millions of Sudanese displaced or forced to flee the country. Many of them fled across the border, into Upper Nile State in South Sudan. As a result, four refugee camps were set up in Maban county; Doro, Gendrassa, Kaya and Yusuf Batil. Yusuf Batil being the second largest refugee camp after Doro, hosting 40,648 individuals. This assessment was undertaken to address a lack of information about refugees’ needs across multiple sectors of humanitarian response. This is especially important in the context of a care and maintenance phase where targeted assistance replaces blanket distributions.
Overall, findings show that the provision of certain basic services in Yusuf Batil camp could be improved, with refugees reporting issues across several sectors. Significant geographical disparity was also observed in access to services throughout the camp. The maps included within this report should be used by actors within the camp to address these priority areas for intervention. In terms of WASH, water is sometimes difficult to access due to significant waiting times at water points and the closure of valves during the day. The need for new latrines was also mentioned in FGDs, while open defecation was found to be common practice in parts of the camp. A high proportion of refugee shelters were judged to be in poor condition, while protection concerns and a lack of access to quality materials were reportedly hindering repair and improvement.
Despite the problems identified above, refugees’ primary reported concern is a lack of security within the camp. Refugees in Yusuf Batil do not feel safe and security related incidents are common place, among them is the deliberate damage or destruction of shelters, and robbery. Discussions with refugees showed that tensions with host communities are widespread, and a commonly reported cause of concern. While refugees trust their sheiks to resolve security incidents within the camp, more serious incidents that involve the host community are referred to the local police, who refugees perceive to favour the host community.
These findings point towards the need for humanitarian aid agencies to work on social cohesion programs as well as with the traditional judicial system. Peace building and conflict mitigation programmes to promote peaceful coexistence between host and refugees must be continued and increased, especially in the context of recent security incidents between the two communities.33 Concerning the traditional judicial system, aid actors should word to increase the capacity of the police, courts and the prosecutor’s office in Maban and improve knowledge and application of the rule of law and human rights. Work on this has already been started by DRC protection teams, with the hope of positive results in the near future.
While both of these programs are important to mitigate dissent between the two communities, the livelihoods crisis is at the core of host-refugee tensions.34 Although many refugees cultivate some crops, these are mainly for household consumption. Livestock herding is less common, and the products also primarily used for household consumption. At this point in time, agricultural activities are undertaken by refugees to achieve self-sufficiency rather than to create income. Therefore, the creation of income-generating activities, additional vocational training opportunities and village saving schemes could be used to build skills within the refugee community and stimulate the creation of new businesses, in turn, helping to mitigate the lack of available food, the second most commonly reported concern according to households in the camp. Addressing the lack of livelihood opportunities and competition over resources is vital to prevent tensions from rising, and to ensure that the livelihoods needs of both host communities and refugees are addressed. 35 This is particularly important as the refugee situation in Maban becomes increasingly protracted, with no end to the conflict in sight.
33 In October 2015, several refugees and host communities were killed due to rising tensions. 34 Displacement, Disharmony and Disillusion. Understanding Host-Refugee Tensions in Maban County, South Sudan. Danish Demining Group. 35 Displacement, Disharmony and Disillusion. Understanding Host-Refugee Tensions in Maban County, South Sudan. Danish Demining Group.

35
Yusuf Batil Refugee Camp Needs Assessment – November 2015
ANNEXES
Annex 1: Maps
Map 10: Reported priority needs in Yusuf Batil Camp

36
Yusuf Batil Refugee Camp Needs Assessment – November 2015
Map 11: Household shelter type
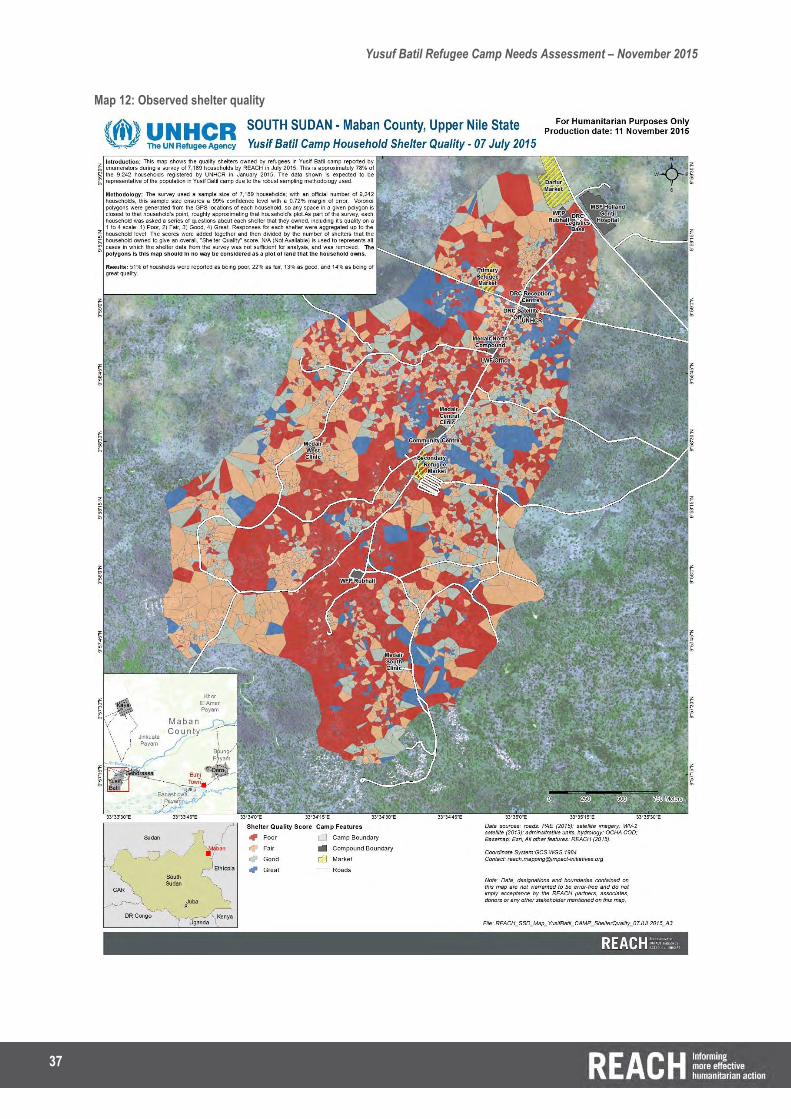
37
Yusuf Batil Refugee Camp Needs Assessment – November 2015
Map 12: Observed shelter quality

38
Yusuf Batil Refugee Camp Needs Assessment – November 2015
Map 13: Reported preferred water point

39
Yusuf Batil Refugee Camp Needs Assessment – November 2015
Map 14: Reported waiting times for water
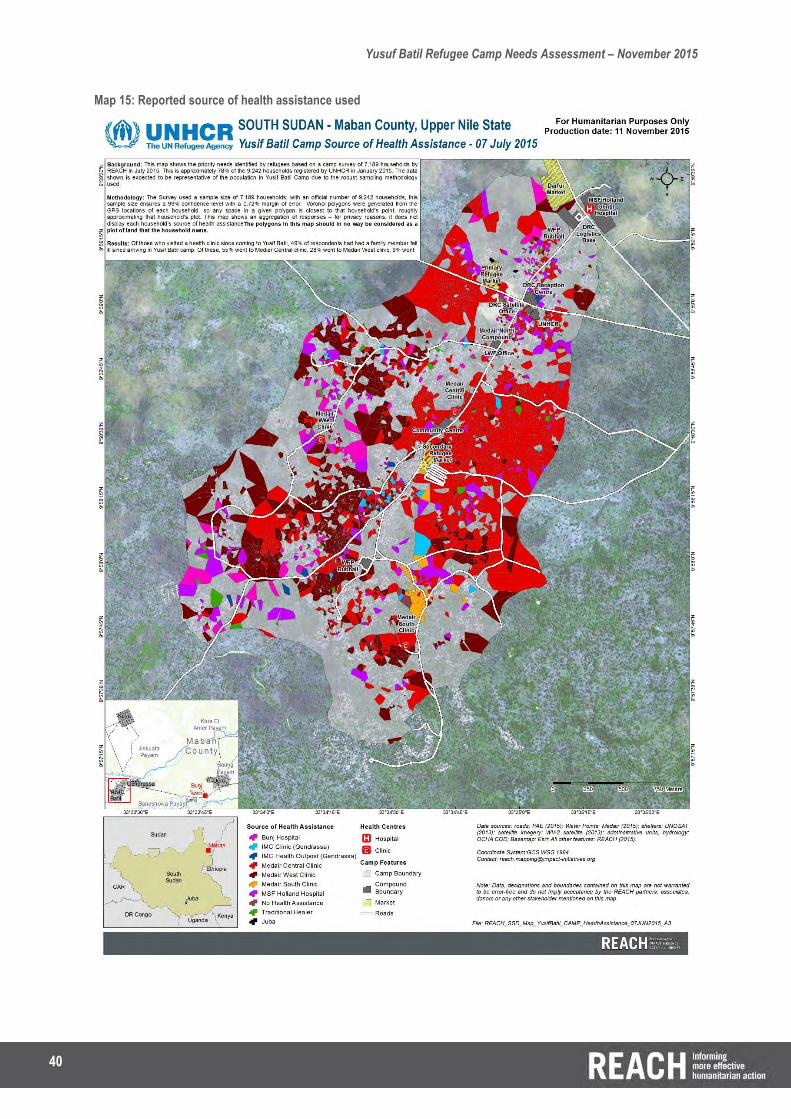
40
Yusuf Batil Refugee Camp Needs Assessment – November 2015
Map 15: Reported source of health assistance used

41
Yusuf Batil Refugee Camp Needs Assessment – November 2015
Map 16: Reported reasons for not attending school

42
Yusuf Batil Refugee Camp Needs Assessment – November 2015
Map 17: Reported satisfaction with community policing

43
Yusuf Batil Refugee Camp Needs Assessment – November 2015
Annex 2: Household Questionnaire
1. Household Information
H 1. Are you the Head of the Household (HHH)?
Yes No
H 2. If no, can you answer on behalf of the HHH?
Yes No
H 3. What is the HHH’s Sex?
Male Female
H 4. What is the HHH’s Age?
Enter Integer
H5. What is the HHH’s marital status?
Single Married Divorced Separated Widowed
H6. What impairments does the person have?
None
Physical
Visual
Hearing
Speech
Mental/Intellectual
Unsure
Other, please specify:__________
H7. How severely do these impairments affect their ability to function?
Very Little
A Little
Somewhat
Quite a lot
Very Much
Extremely difficult
H8. What caused their impairment?
They were born with it
War related injury
Accidental injury
Attacked by a civilian
Attacked by an animal
Disease
Unknown
Other, please specify:______
H9. Is there anyone over 16 years of age who can care for them?
Yes No
H10. What year did you arrive in Maban?
2011 2012 2013 2014 2015

44
Yusuf Batil Refugee Camp Needs Assessment – November 2015
H11. On what month did you arrive in Maban?
January February March April May June
July August September October November December
H12. What is your UNHCR Household ID number?
Enter UNHCR ID Number
H13. What is the household’s ration card number?
Enter Household Ration Card Number
H14. How many people are on the ration card?
Enter Integer (Number of People)
H15. What is your Umda’s Name?
Select Umda’s name from List
H16. What is your Sheik’s name?
Select Sheik’s name from list
H17. Assign House Number (Enter Below and write on House)
Write number on house
2. Demographic Information:
Age and gender of the other household members (repeats for each family member on ration card)….† D1. What is the gender of the household member?
Male Female
D2. What is their marital status?
Single Married Divorced Separated Widowed
D3. What impairments does the person have?
None
Physical
Visual
Hearing
Speech
Mental/Intellectual
Unsure
Other, please specify:__________
D4. How severely do these impairments affect their ability to function?
Very Little
A Little
Somewhat

45
Yusuf Batil Refugee Camp Needs Assessment – November 2015
Quite a lot
Very much
Extremely difficult
D5. What caused their impairment?
They were born with it
War related injury
Accidental injury
Attacked by a civilian
Attacked by an animal
Disease
Unknown
Other, please specify:______
D6. Is there anyone over 16 years of age who can care for them?
Yes No
3, Structure/Environment
S1. Have you suffered from flooding in your current location? If yes. How long was there standing water?
No flooding Less than 1 week 1 to 2 weeks
2 weeks to 1 month 1 to 2 months More than 2 months
S2. How many individual shelters does your household have?†
Enter Integer
S3. What type of structure is it?
UNHCR Tent
Tukul (mud, wood, and grass)
Tent (Japanese)
Shelter (Grass and Wood)
Shelter (Tarpaulin and Wood)
Tent (Other NGO)
UNHCR CGI Shelter
Other, please specify:____________
S4. What condition is it in?
Great
Good
Fair
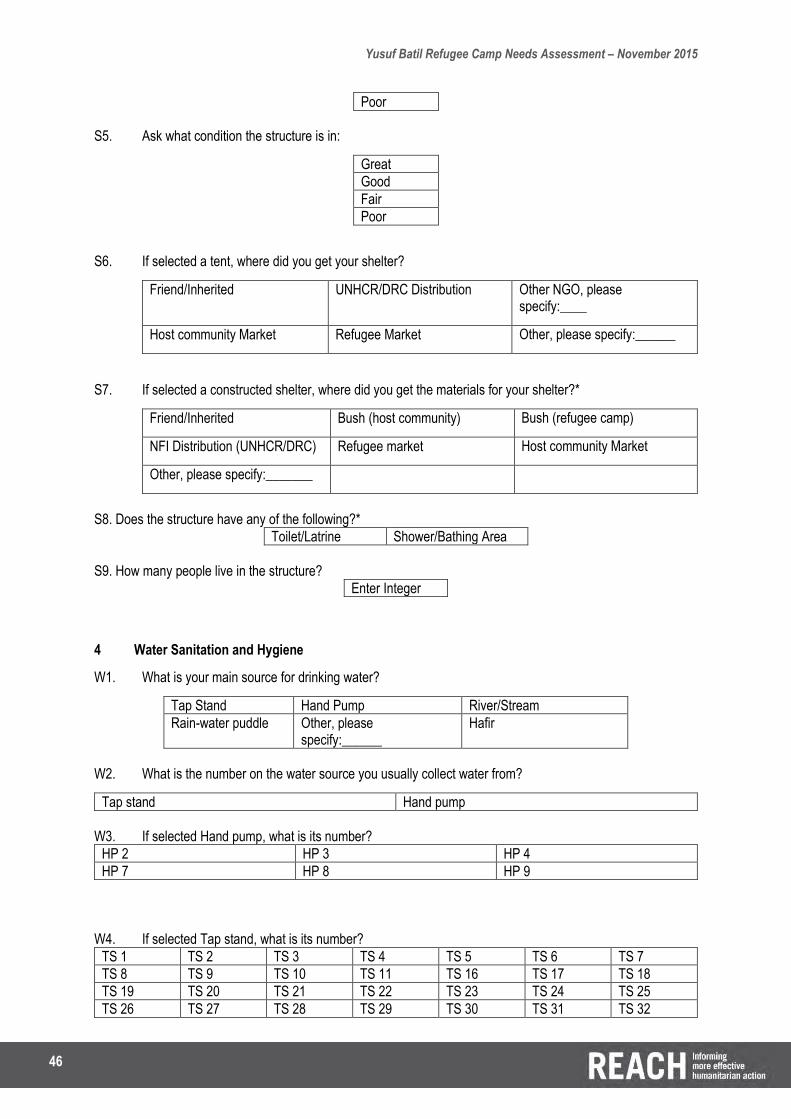
46
Yusuf Batil Refugee Camp Needs Assessment – November 2015
Poor
S5. Ask what condition the structure is in:
Great
Good
Fair
Poor
S6. If selected a tent, where did you get your shelter?
Friend/Inherited UNHCR/DRC Distribution Other NGO, please specify:____
Host community Market Refugee Market Other, please specify:______
S7. If selected a constructed shelter, where did you get the materials for your shelter?*
Friend/Inherited Bush (host community) Bush (refugee camp)
NFI Distribution (UNHCR/DRC) Refugee market Host community Market
Other, please specify:_______
S8. Does the structure have any of the following?*
Toilet/Latrine Shower/Bathing Area
S9. How many people live in the structure?
Enter Integer
4 Water Sanitation and Hygiene
W1. What is your main source for drinking water?
Tap Stand Hand Pump River/Stream
Rain-water puddle Other, please specify:______
Hafir
W2. What is the number on the water source you usually collect water from?
Tap stand Hand pump
W3. If selected Hand pump, what is its number?
HP 2 HP 3 HP 4
HP 7 HP 8 HP 9
W4. If selected Tap stand, what is its number?
TS 1 TS 2 TS 3 TS 4 TS 5 TS 6 TS 7
TS 8 TS 9 TS 10 TS 11 TS 16 TS 17 TS 18
TS 19 TS 20 TS 21 TS 22 TS 23 TS 24 TS 25
TS 26 TS 27 TS 28 TS 29 TS 30 TS 31 TS 32

47
Yusuf Batil Refugee Camp Needs Assessment – November 2015
TS 33 TS 34 TS 35 TS 36 TS 37 TS 38 TS 39
TS 40 TS 42 TS 43
W5. What is the average quantity of water collected by the family each time you go to a water source?
Enter Integer (in Litres)
W6. On average, how many trips does your family make to get water each day?
Enter Integer
W7. How many minutes do you wait at the water source to get water each time?
Enter Integer (In minutes)
W8. Where do you and your family usually defecate?
Latrine built by NGO Bush Latrine Built by community
Family-owned and constructed Latrine
River/Stream Other, please specify:______
W9. At what times of the day do you wash your hands?
In the Morning Before Cooking After Defecating
Before Breastfeeding After cleaning child’s faeces Before eating
W10. What do you usually wash your hands with?
Soap Ash Water Nothing
W11. Has anyone in the HH suffered from a disease or illness since coming to Yusuf Batil?
Yes No
W12. If so, where did you go for help?
No assistance Bunj/SP Hospital IMC Outpost
IMC Clinic MSF Holland Hospital Traditional Healer
Medair Central Clinic Medair West Clinic Other, please specify:______
5 Education
E.1 Are there children of school-going age living here that are not attending school?
Yes No
E.2 If yes, what are the reasons they are not attending school?*

48
Yusuf Batil Refugee Camp Needs Assessment – November 2015
The school is too far
They must work from home/gather water, firewood, and sand
They must tend livestock
The quality of the school is not very good
I don’t want them to attend school with children of other communities
They must work at the market
They are too old to go to school in the camp
Only boys can attend school
Other, please specify:____________
E3. What recreational activities do your children participate in?
Football
Volleyball
Movies
Nothing/Loitering
Playing Games
Working
Making Toys
Other, please specify:______________
E4. What recreational activities would you like to see your children participate in?
Football
Volleyball
Movies
Nothing/Loitering
Playing Games
Working
Making Toys
Other, please specify:______________
E5. At what location do you worship (see map)?
Mosque 1 Mosque 7 Mosque 13
Mosque 2 Mosque 8 Mosque 14
Mosque 3 Mosque 9 Mosque 15
Mosque 4 Mosque 10 Mosque 16
Mosque 5 Mosque 11 Mosque 17
Mosque 6 Mosque 12 Mosque 18
6 Protection/Camp Management
P1. Have you experienced any security incident in the camp within the last 6 months?‡
Yes No
P2. If yes, what happened?
Robbery
Tent damaged/Destroyed
Physical Attack
Harassment/Intimidation
Other, please specify:________
P3. Where would you go to first to report any security incident?
Sheik

49
Yusuf Batil Refugee Camp Needs Assessment – November 2015
Umda
Camp Committee
Camp Manager
UNHCR
Dedicated NGO
Other, please specify:_______
P4. How effective has the response of sheiks, community watch teams, and the police been at limiting security issues within the camps?
Good
Ok, but could be better
Poor
My community does not do anything to provide security for me.
P5. If OK, Poor, or non-existent, why has the response not been good?
They are not professional or competent.
They are not committed or consistent.
They are too corrupt.
I don’t trust them.
They have conflicting interests.
They do not represent the community.
Other, please specify:___________
P6. Where do you get your information?*
Sheik/Umda
Radio
Church/Mosque/Religious Service
Dedicated NGO
Other, please specify:__________
P7. Do you have access to a Radio?
Yes No
P8. If yes, what stations do you listen to?
Radio Miria
50
Yusuf Batil Refugee Camp Needs Assessment – November 2015
Radio Salaam
Radio Tabanga
Radio Omdurmun
Livelihoods Information
L1. Have you planted anything in the last year?
Yes No
L2. If yes, what did you plant?
Okra
Beans
Ground Nuts
Sesame/Simsim
Red Pepper
Onion
Sukuma Wiki
Eggplant
Dodo
Pumpkin
Sorghum
Maize
Tomato
Other, please specify:__________
L3. What land did you use?
Host Community Land Refugee owned Land Communal Land
L4. Do you own any livestock?
Yes No
L5. If yes, what do you heard?
Cows
Goats

51
Yusuf Batil Refugee Camp Needs Assessment – November 2015
Sheep
Donkeys
Camels
Other, please specify:_______________
L6. Where do you heard them?
Host Community Land Refugee owned Land Communal Land
Greatest Need
G1. Specify the greatest NEED affecting your everyday life.
Security
Access to Food
Access to water
Access to NFIs
Access to Education
Access to Employment
Access to Healthcare
None
Other, please specify:_________
G2. On a scale of 1 (very unhappy) to 10 (very happy), how happy are you with life?
Enter Integer between 1 and 10
G3. On a scale of 1 (very unhappy) to 10 (very happy), how happy were you with your life in Blue Nile State (Before the conflict)?
Enter Integer between 1 and 10
G4. On a scale of 1 (very unhappy) to 10 (very happy), please rate how optimistic you are about the future:
Enter Integer between 1 and 10
*Respondent may Select Multiple Answers †Question and accompanying sub-questions will loop the number of times specified by integer ‡ Question is optional and can be skipped

52
Yusuf Batil Refugee Camp Needs Assessment – November 2015
Annex 3: Focus Group Discussion Guide
Moderator Name Assistant Moderator Name
Focus Group Name/(Sheikh)
Number of Participants
Date Gender of Participants
Introductory Notes (2 minutes)
Hello, my name is (name of moderator). First, I would like to welcome and thank you for volunteering to take part in this focus group discussion about your living conditions in Yusuf Batil Camp. Several months ago, the REACH team interviewed all head of households in the camp to ask them about different topics such as Livelihoods, Education, WASH and protection. Today, you have been asked to participate in this discussion as we would like to get more information and your point of view about your situation and current needs. This information will be used to inform response strategy and planning. Please note that this meeting does not have any impact on whether you or your family receives assistance. These discussions are only meant to better understand how you, your household, and the community perceive the situation in the camp. Anonymity: I would like to assure you that the discussion will be anonymous. I and the other focus group participants would appreciate it if you refrain from discussing the comments of other group members outside the focus group. If there are any questions or discussions that you do not wish to answer or participate in, you do not have to do so; however please try to answer and be as involved as possible. The discussion will take no more than one hour and a half.
Ground Rules (2 minutes)
1. The most important rule is that only ONE person speaks at a time. There may be a temptation to jump in when someone is talking but please wait until they have finished.
2. There are no right or wrong answers. 3. You do not have to speak in any particular order 4. When you do have something to say, please do so. There are many of you in the group and it is
important that I obtain the views of each of you. 5. You do not have to agree with the views of other people in the groups 6. Any questions? 7. Ok, let’s start.
Instructions to Moderators
1. Questions to participants: these are the questions that should be read and communicated to the participants. If there are some specific vocabulary which may be unclear, do not hesitate to provide a definition for the purpose of the exercise.
2. Probing questions: Probes and clarifying questions are an important part of interviewing and have two main purposes: 1) to help clarify what an interview respondent has said and 2) To help get more detailed information on topics of interest. Probes allow the interview respondent to provide more than just a one-sentence answer to the questions to the questions you ask. Do not read probing questions to participants. Use or adapt them if necessary.
Introduction (5 minutes)
Questions to Participants:
1. Can everyone introduce themselves, telling me their names, ages and occupations (main source of livelihoods)? Please also tell us which village you come from within the camp. (Moderator to have map

53
Yusuf Batil Refugee Camp Needs Assessment – November 2015
of camp with him/her) – we may skip the village question as we normally will know which villages the participants will come from
Education (15 minutes)
Barriers to Education - In your opinion, are a majority of children enrolled in and regularly attending school in the camp? If not,
why not? - Probing: In your opinion, what is the main barrier to children going to school in Yusuf Batil? - Probing: Is distance to school a major problem? - What is the current condition of the learning environment (space, materials, classrooms, staff, etc.)? - Are children affected by hunger while they are at school (e.g. no breakfast, long distance to school,
general malnutrition)? - Is the education situation the same for everyone within the camp? - Probing: Are there differences between boys and girls, or children of different communities/villages
(geographic/ethnic/etc. backgrounds)? - Probing: Are you aware of any incidents within schools between children of different communities?
What do you think about mixing with other communities at school? (Any specific communities?)
Protection (20 minutes)
Security Incidents - Have you experienced any security incident in the camps? - In your opinion, what type of security incidents are most prominent within the camp? - Is there a difference in security issues between men and women? What about children? - Probing: Are you aware of friendship ties or hostilities between communities/families/tribes within the
camp. Response to Security Incidents
- Who do people generally report security incidents too? How are these incidents solved? - What would make you feel safer within the camp? - What kind of solutions currently exist? Are these satisfying/effective? - What do you think of the response of community actors? If you think it is not effective, why not? - Probing: What do you think of the child friendly spaces in the camp? Are there enough?
WASH (20 minutes)
Access to Water - What is the main challenge you face in accessing water? Do you have any problems accessing water on
a daily basis? - What type of water access do you currently have? - How long do people usually wait for water? (Ask about back in February/March/April). If some people
mention long water wait times (more than 30 minutes) ask why the wait was long. - Probing: Have you had any extended periods of time where you could not access water? What was the
reason this happened? Use of Latrines
- What are the general trends when it comes to latrine use in your opinion? - Are people defecating in the open? - Why are people defecating in the bush? Is open air defecation due to lack of latrines/latrines being full or
because people simply do not want to use latrines/lack of hygiene awareness? Hand Washing
- Ask participants how they perceive using ash to wash their hands.
Livelihoods (15 minutes)
Types of Livelihoods - What are the main types of livelihoods in the camp? What do people do for a living?

54
Yusuf Batil Refugee Camp Needs Assessment – November 2015
Livelihood Challenges - Are there problems when it comes to herding? When it comes to cultivating/planting? - Probing: Is access to water a problem for livestock raising/cultivating/planting? - Probing: Is land property/access to land an issue? If so, why? - Probing: Have conflicts/tensions arisen between host communities/refugees due to land property? - What would people need to increase livelihoods in the camp?
Shelter (10 minutes)
Shelter Type - What is your preferred type of shelter and why? - Do you think some shelters are of better quality/stronger? Materials
- Where do people generally get the materials used to build their shelters? - What are the issues in getting materials to build your shelters? - Probing: What are the problems you face when getting materials from refugee land or from host
community land?
Final overall questions (5 minutes)
- Overall, what is your main concern or biggest need at the moment? Why? - What would help to address this concern/need? What is the potential solution to this problem?