yale icf working paper no....
TRANSCRIPT

Yale ICF Working Paper No. 04-21 May 1, 2004
DEFAULT RISK, FIRM’S CHARACTERISTICS,
AND RISK SHIFTING
Ming Fang Yale School of Management
Rui Zhong
Fordham University
This paper can be downloaded without charge from the Social Science Research Network Electronic Paper Collection:
http://ssrn.com/abstract=550069

Default Risk, Firm’s Characteristics, and Risk Shifting*
Ming Fang† and Rui Zhong‡
May 1, 2004
* We benefited greatly from the discussion with Connie X. Mao. We are also grateful to William Goetzmann, John Griffin, Xiangyang Li, Abraham Ravid, Matthew Spiegel and participants in the Ph.D. workshop at Yale School of Management for their comments. All errors are ours. † Ming Fang is from International Center of Finance, Yale School of Management, P.O. Box 208200, New Haven, CT 06520-8200, USA. Tel: (203) 432-5661; E-mail: [email protected]. ‡ Rui Zhong is from Department of Finance, Graduate School of Business and Management, Fordham University, New York, NY 10023, USA. Tel: (212) 636-6118; Email: [email protected].

Default Risk, Firm’s Characteristics, and Risk Shifting
Abstract
This paper examines the relationship between a firm’s risk-shifting behavior and
its default risk. Using contingent-claims approaches, we estimate the market value
of a firm’s assets, the volatility of asset return, and the associated default risk
based on the stock prices and book value of debt. Our study shows that, consistent
with conventional wisdom and many theoretical models, firms with high default
risk tend to increase asset volatility more in the subsequent year, relative to their
industry peers. We find that, a firm’s risk-shifting is also pronounced when it has
very low default risk. In addition, risk shifting is negatively related to firm size,
leverage ratio, and current asset volatility. Alternative specifications of default
risk confirm that our findings are robust to the choice of default risk measure. A
direct estimation of the market values of firms based on market values of stocks
and bonds confirms our results based on contingent-claims approaches.
Keywords: default risk, contingent-claims model, risk shifting, agency cost.
JEL classification: G13, G33

1
1. Introduction
The agency problem of risk-shifting (also known as “asset substitution”) arises from the
conflict of interest between equityholders and debtholders in a levered firm (Jensen and
Meckling, 1976). Equityholders have incentive to increase investment risk after debt is in place
in order to extract value from debtholders. A substantial body of theoretical work has extended
this study to the various agents (equityholders, firm’s managers) with various compensation
contracts and risk preferences.1 Most of these models suggest that a manager (levered firm)
under normal circumstances does no shift risk due to many concerns and restrictions, such as
bankruptcy and reorganization costs, loss of tax subsidies, loss of future investment opportunity,
and the reputation of the company and its managers. A manager (levered firm) will take on a
large risk exposure only when the probability of the loss of his compensation (default) is high.
Although these models are appealing, some studies suggest that the agency cost associated
with the risk-shifting incentive may not be significant in practice. For example, Fama (1978)
argues that a perfect capital market will discipline firms to maximize the combined value of the
debt and equity, and avoid agency costs. Haugen and Senbet (1981, 1988) demonstrate that
agency costs and liquidation costs can be mitigated or may even be eliminated via the use of
complex financial securities and informal reorganizations. Leland (1994) shows that
equityholders may not have incentive to shift risk under positive net-worth covenants. Mao
(2003) illustrates that, when the volatility of project cash flow increases with investment scale,
the combined problem of the risk-shifting and the under-investment (Myers, 1977) will lead to
1 For example, Leland (1994, 1998) studies the agency cost generated by equityholder-debtholders conflicts; Carpenter (2000) studies a dynamic investment problem of a risk averse manager compensated with a call option on the assets he controls; Goetzmann, Ingersoll and Ross (2003) examine the effect of a compensation contract with “high-water mark” provision on the optimal investment strategies of a hedge fund. Basak, Pavlova and Shapiro (2003) examine the use of benchmarking to control the risk-shifting behavior of a money manager.

2
an investment policy that maximizes firm-value. Thus, without empirical verification, whether
the risk-shifting phenomenon is significant or not is still an open question.
Empirical evidence has been documented to support this risk-shifting hypothesis in the
financial industry. Esty (1997a, b) finds that risk-shifting was significant in the savings and loan
industry during the 1980s. He observes that a firm increases investment in risky assets after a
conversion from mutual to stock ownership. Brown, Harlow and Starks (1996) show that mutual
fund managers tend to take more risk in the latter half-year when the fund performs relatively
badly in the first half-year. Chevalier and Ellison (1997) show that fund investment inflows
depend on its recent performance. The shape of the inflow-performance relationship creates an
incentive for fund managers to increase (decrease) the riskiness of their portfolios based on the
good (bad) performance of the fund in the first eight months. Brown, Goetzmann and Park
(2001) documented a similar risk-shifting investment strategy taken by hedge fund managers. In
contrast, there is little direct empirical evidence of this risk-shifting behavior in industrial firms.
This may be due partially to the fact that the market value of an industrial firm is unobservable,
which makes it impossible to directly measure asset volatility.
To address this lack, this paper examines the risk-shifting problem empirically for firms in
all industries. We assume that the stock market is efficient in the sense that the stock prices fully
reflect a firm’s asset values.2 To infer the market values of the firm’s assets and associated
volatilities of the asset return from the observable stock prices, we apply two contingent-claims
approaches originated by Merton (1974; hereafter M74) and Leland (1994; hereafter L94). In
addition, the likelihood of default can also be calculated via these approaches. Following Brown,
Harlow and Starks (1996), and Brown, Goetzmann and Park (2001), we use the volatility of the
2 At the very least, we can assume that the market is well aware of problems or opportunities that a firm is facing, and fairly reflects the firm’s riskiness.

3
firm’s asset value as the measure of the firm’s business-operation risk. If the risk-shifting
argument is valid, we expect to see firms in the high default risk group to have a higher “risk
adjustment ratio” (RAR), which is the ratio of asset volatility next year to the asset volatility of
this year.
For each year from 1980 to 1999, we compute the default risk and the volatility of the
firm’s asset return. To control for the industry effect on the risk-shifting incentive, we use an
“industry adjusted RAR” (IRAR), which is computed by subtracting the median RAR of all firms
with the same two-digit SIC in the same year from the raw RAR. We show that the curve of
IRAR, as a function of default risk, exhibits a “U-shape.” Firms with low or high level of default
risk display stronger risk-shifting behavior than firms in the medium level of default risk.
Further examination in firm’s characteristics shows that firm’s risk-shifting behavior also
depends on its current asset volatility. Risk-shifting is not significant for firms in all default risk
groups with high current asset volatility. For firms with modest asset volatility, risk-shifting is
pronounced only in high default risk group. Only for firms with low asset volatility, we are able
to observe risk-shifting in both low and high default risk groups.
Applying Fama-MacBeth (1973) multivariate regressions, we find that firms shift to a
higher risk level when they are higher in default probability, smaller in size, lower in leverage
ratio and current asset volatility. In addition, we find that firms take more risk after a recent poor
stock performance. This result is consistent with those documented for the mutual fund and
hedge fund industries (Brown, Harlow and Starks, 1996; Brown, Goetzmann and Park, 2001).
Furthermore, our results are robust to the choice of default risk measure. Using Altman’s (1967)
Z-score or Ohlson’s (1980) O-score, we find that the positive relationship between high default
risk (low Z-score or high O-score) and risk-shifting still holds. To validate our estimations based

4
on contingent-claims models, we also estimate the market values of firm’s asset and associated
volatility in a subset of our sample based on market value of both stock and bond obtained from
CRSP and Lehman Brother Bond database (LBBD). The resulted risk adjustment ratios are
highly correlated.
The remainder of paper is organized as follows. Section 2 outlines the research
methodology used to compute a firm’s asset value, volatility of asset returns, and the proxy of
default risk. Section 3 describes the data sources and sample selection. Section 4 reports and
interprets empirical test results, and Section 5 concludes the paper.
2. Research Methodology
2.1. Firm’s asset value and riskiness
The market value of a firm’s assets is a measure of the present value of the future cash
flow produced by the firm’s assets and discounted back at the appropriate discount rates. The
uncertainty associated with the firm’s asset value is a measure of riskiness in the firm’s business
operation. Then it follows that risk-shifting should be characterized by an increased volatility of
the firm’s asset value. We assume the market is efficient and the asset value of a firm and its
riskiness can be inferred from its stock price history and liability structure. In M74, for example,
a firm’s equity value is modeled as a call option contingent on the market value of its assets. The
default is determined by the firm’s asset value and its debt level at the maturity of the debt.
When the firm’s value is greater than the liability due on the maturity date, the firm pays the
debtholders, whereas if the firm’s value falls below the liability, the default occurs and
equityholders hand the firm over to the debtholders by declaring bankruptcy.

5
In this paper, for comparison and sensitivity analysis, we use two different methods to
estimate a firm’s asset value and associated volatility from the firm’s equity value. One method
is based on M74 and extended by KMV Company (outlined in Crosbie and Bohn, 2002).
Vassalou and Xing (2004) also employ similar approach in their computations of a firm’s default
risk. In this method the firm’s equity value is a treated as a call option on the value of the firm’s
total assets. The exercise price of the call option is specified as a default level, X, which is
determined by the firm’s liability structure.3 The expiration date of the call option is set as an
evaluating time horizon. When the asset value falls below the default point on a specified
evaluation time horizon, T, the firm is assumed to default.4 The other method is based on L94.
This model links corporate debt with asset value, firm risk, taxes and bankruptcy cost in a time-
independent environment. It is assumed that a firm pays a perpetual coupon payment for its debt
and default occurs if the firm fails to meet the required coupon payment by issuing additional
equity. In these two models, the market value of a firm’s assets is assumed to follow a Geometric
Brownian Motion with constant volatility:
)( tVV dWdtVdV σµ += (1)
where V is the firm’s asset value, with an instantaneous drift Vµ and a volatility Vσ ; W is a
standard Wiener process.
There exist closed-form solutions for these two models. For the model of M74, the
solution is given by the well known Blake-Scholes (1973) formula:
)()( dNXeTdVNS rTV
−−+= σ (2)
where
3 For example, it is the face value of a pure discount bond in M74 and it is the sum of debt due in one year and half of the long term debt in Vassalou and Xing (2004). 4 For example, it is specified as the maturity date in M74 and one year in Vassalou and Xing (2004).

6
TTrXV
dV
V
σσ )2/1()/ln( 2−+
= (3)
and S is the current market value of the equity, V the current asset value of the firm, X the
default point, r the risk-free borrowing rate, Vσ the instantaneous volatility of the firm’s asset
value, T the length of the time horizon, and (.)N a univariate cumulative density function of the
standard normal distribution. For the model of L94, the solution is:
XBB VVVrCrCVS −−−+−−= )/](/)1[(/)1( ττ (4)
where )5.0/()1( 2VB rCV στ +−= and 2/2 VrX σ= . S, V is the market value of firm’s equity and
asset respectively, C the continuous coupon payment rate, r the risk-free interest rate, and τ the
firm’s tax rate.
It is noted that equation (2) or (4) both the asset’s value and its associated volatility need
to be solved in one equation. KMV developed an iterative algorithm to resolve this problem in
M74. The procedure sets an initial guess of the asset volatility and computes the asset values
every trading day in a specified time window by solving equation (2) given data on the firm’s
stock price, the number of shares outstanding, the default point, the evaluation time horizon, and
the risk-free interest rate. The volatility of the resulting asset value returns (in this time window)
is used as the input to determine a new set of the asset values in the next iteration. The
procedure continues in this manner until Vσ converges.5 For the model of L94, we adopt a
similar approach.
Following Crosbie and Bohn (2002) and Vassalou and Xing (2004), we use one year as
the time horizon for the evaluation of default risk, and the sum of the “debt due in one year” and
half of the “long term debt” as the proxy of default level in solving the model of M74. The
5 The tolerance level of convergence that we used is 1.0 E-6.

7
choice of this default level is based on the observation that firms do not default even when their
asset value falls below the book value of its total liability because of the long-term nature of their
liability. On the other hand, sometimes firms do default even when they have the ability to
service their liability in due. The default level generally lies somewhere between short-term
liability and total liability. KMV argues that the use of 50 percent of long term debt is sensible
since it adequately captures the financing constraints of firms. Vassalou and Xing (2004) show
that the choice about the portion of long-term debt included is not so sensitive to alter their
results qualitatively.6 We use a calendar year as the time window and the stock volatility as the
initial guess of asset volatility in our computation. The risk-free interest rate is proxied by the
one-year T-bill rates at the end of each month. The advantage of using the model of L94 is that
we do not need to specify a time horizon and default level exogenously. As long as we know the
firm’s equity value, the annual coupon payment and the tax rate, we can solve for the firm’s asset
value and associated volatility iteratively.
2.2. Default risk proxies
There are three main classes of models used to measure the default risk of a firm.
One class is based on a firm’s accounting information and is derived from statistical
analysis, and includes Altman’s (1968) Z-score model and Ohlson’s (1980) O-score model.7 A
low value of Z-score or a high value of O-score represents a high default probability. Models in
the second class, following Jarrow and Turnbull (1995), are the so-called “reduced-form” models.
6 We performed a similar sensitivity test and found that our results are robust. 7 Altman’s (1968) Z-score is: Z = 1.2(working capital / total assets) + 1.4(retained earnings / total assets) + 3.3(earnings before interest and tax / total assets) + 0.6(market value of equity / book value of total debt) + (sales / total assets). Ohlson’s (1980) O-score is: O = -1.32– 0.407 log(total assets / GNP price-level index) + 6.03(total liability / total assets) – 1.43(working capital / total assets) +0.0766(current liability / current assets) – 1.72(1 if total liability > total assets, else 0) - 2.37(net income / total assets) – 1.86(fund from operation / total liability) + 0.285(1 if net loss for last two years, else 0) – 0.521(net income t – net income 1−t )/(|net income t | - |net income 1−t |).

8
These models define the time of default as an exogenous intensity process calibrated by the
market prices of the firm’s debt.8 The third class of models contains the set of structural models,
which are rooted in the contingent-claims approach introduced by Black and Scholes (1973) and
M74. These models derive the likelihood of a firm’s default from its capital structure and its
stock prices.9
Although, relative to structural models, reduced-form models are more likely to produce
a better fit for any given credit spread data, they break the link between the economics of firm
behavior and its default. Also, as shown by Elton, Gruber, Agrawal and Mann (2001), much of
the information in the corporate bond spread is unrelated to default risk. In addition, the data
required to calibrate and implement reduced-form models are not widely available. All the
aforementioned aspects make reduced-form models inappropriate for this study. On the other
hand, the structural models have been proven to be superior in measuring default risk.
Delianedis and Geske (1998) compute risk neutral default probabilities in M74 framework and
show that these risk neutral default probabilities have predictive power on credit migration and
default. Vassalou and Xing (2004) estimate a default likelihood indicator using a contingent-
claims method which is similar to the one developed by KMV (Crosbie and Bohn, 2002). They
show that their approach outperforms accounting models such as Altman’s (1968) Z-score and
Ohlsom’s (1980) O-score in predicting default events. In this study, therefore, we employ the
same method to compute a proxy of default risk.
After the market values of a firm’s assets and its associated volatility have been
computed from equation (2) or (4), the probability of default is the probability that this value
falls below the default level at the specified time horizon. That is
8 See Jarrow, Lando and Turnbull (1997), Lando (1997, 1998), and Duffie and Singleton (1997, 1999) among others. 9 See Black and Cox (1976), Geske (1977), Leland (1994), Longstaff and Schwartz (1995), and Leland and Toft (1996) among others.

9
]|lnPr[ln]|Pr[ 00 VVXVVVXVp AttAAt
tAt =≤==≤= (5)
where tp is the probability of default at time t, tAV the market value of the firm’s asset at time t,
and tX the firm’s default level at time t.
From equation (1), we know that the market value of the firm’s asset is:
εσσµ ttVV VVVAt
A +−+= )2/(lnln 20 (6)
where )1,0(~ Nε is a standard Brownian motion. Combining equations (5) and (6), we have
−+−=−=
ttXV
NDDNpV
VVtAt σ
σµ )2/()/ln()(
20
(7)
where t
tXVDD
V
VVtA
σσµ )2/()/ln( 20 −+
= is the distance-to-default.
As pointed out by Vassalou and Xing (2004), tp in the above equation is only a “default
likelihood indicator” rather than the actual probability of default in practice. We choose tp as a
proxy of default risk for this study.
3. Data Selection and Sample Statistics
We use the annual COMPUSTAT data files to obtain firm-specific accounting
information. The sample period is chosen from 1980 to 1999 since the CRSP-COMPUSTAT
matched sample contains substantially more firms after 1980, which increases statistical power.
For each year the sample consists of firms that have all the valid accounting data required for the
computation described in section 2. For example, in computing asset volatility and the M74
default likelihood indicator, we require firms to have valid “debt due in one year” and “long term

10
debt” in the files. We exclude all-equity firms in the sample since our empirical analysis is not
relevant to them.
The daily stock price data and returns are from CRSP. To obtain a reliable estimate of a
firm’s asset volatility, we select only firms with valid stock prices for more than 100 days each
year. We exclude closed-end funds, ADRs and foreign incorporated companies since CRSP
does not accurately report the total number of outstanding shares for these firms. To reflect a
change of the firm’s asset value due only to its business operation, we also exclude firms having
buy-back or issuing new shares in any sample year.10 For the stocks that are delisted in the
sample period, the delisted returns from CRSP are used. In examining the change in asset
volatility, we restrict the sample to firms having a valid asset volatility estimate in two
consecutive years. The risk-free rate in the computation for each month is proxied by the one-
year Treasury-Bill rate recorded at the end of this month in the CRSP database. The stock
performance for each year is measured by the cumulative return over twelve calendar months,
which includes dividends and price adjustments due to the stock splits. In applying the model of
L94, the tax rates are firm’s statutory federal tax rates applicable to the top income bracket.11
We use the Lehman Brothers Bond database to estimate the monthly market values of
firm’s debt for a subset of our sample during 1980 to 1997 in which corporate bond data are
available. To be included in our study, we require that the firm has valid data for at least 10
consecutive months in the sample year. Similar to Sweeney et al. (1997), we restrict our sample
to firms having information available on at least 50% of the outstanding issues of total debt.
Applying these criteria yields 5,921 firm-year observations.
10 This accounts for less than 1% of records in each sample year. 11 The rate is 46% from 1979 to 1986, 39.5% in 1987, 34% from 1988 to 1992, and 35% after 1993.

11
[Insert Table 1 Here]
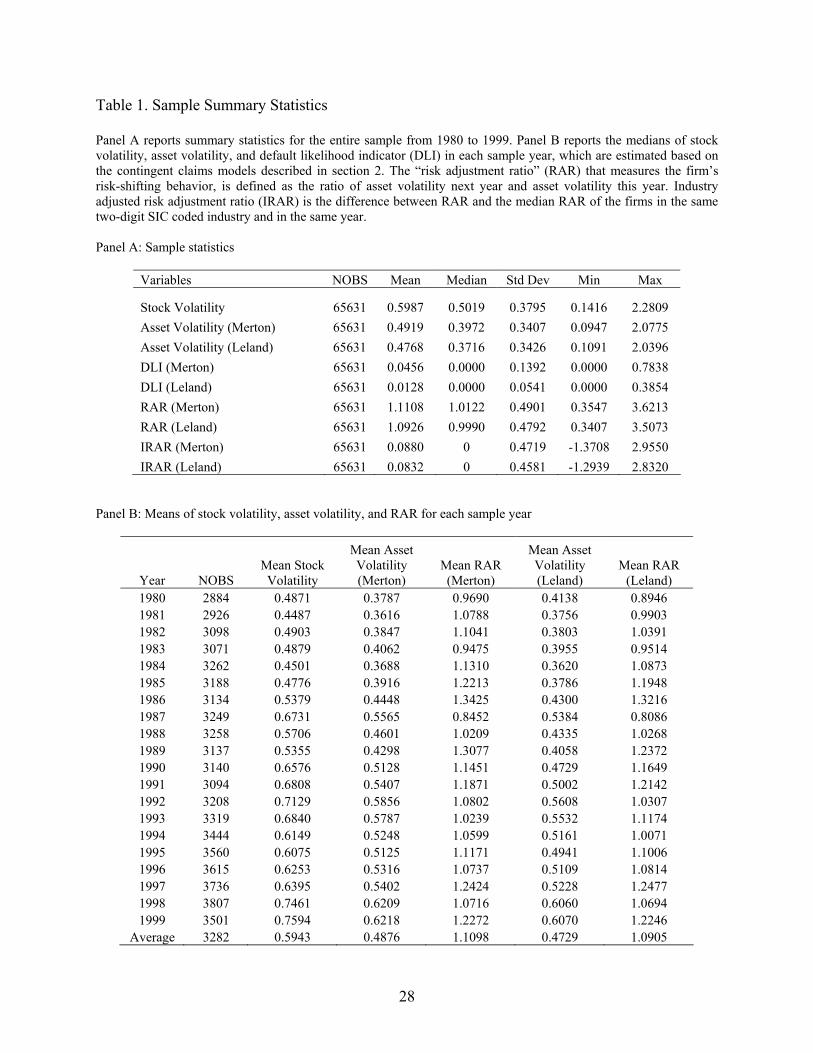
Panel A of Table 1 presents summary statistics for our entire sample. We fix outliers by
winsorizing the default likelihood indicators and RAR at the 1% level. Since the distributions of
volatility and default risk are right skewed, median values are also informative. We report both
the mean and median of our sample here. The mean and median stock return volatility is 0.60
and 0.50 respectively. The mean and the median asset return volatility is 0.49 and 0.40
respectively based on M74, and is 0.47 and 0.37 respectively based on L94. The annualized
stock return volatility and asset return volatility are computed as the standard deviations of daily
returns multiplied by the square root of 250. The median and mean of the “default likelihood
indicators” is less than 0.0001 and 0.046 respectively based on M74, and less than 0.0001 and
0.013 respectively based on L94. Following Brown, Harlow and Starks (1996), we use the “risk
adjustment ratio,” tV
tVRAR σσ /1+= , to measure the firm’s risk-shifting behavior, where t
Vσ , 1+tVσ
denotes the volatility of the firm’s asset value this year and next year, respectively. A value of
RAR larger than one indicates that a firm shifted asset risk to a higher level. The median RAR is
1.012 for the model of M74 and 0.999 for the model of L94, suggesting that during the sample
period of 1980 to 1999, firms on average do not alter their asset risk. Since the asset return
volatility also depends on many market-specific and industry-specific factors, such as business
cycles, interest rates, technological advancements, and product market competition, we also
examine the industry adjusted RAR (IRAR). The sample mean of the IRAR is about 0.08 based on
both M74 and L94, suggesting that there is no risk-shifting in general.
In Panel B, we report both the means and the medians of stock volatility, asset volatility,
and RAR for each sample year. The number of firms for each year increases over the sample

12
period, with an average of 3282. Both stock return volatility and asset return volatility display
upward trends from 1980s to 1990s. This could be explained by the upward trend of stock
volatility in recent years, while the risk adjustment ratio (RAR) shows little time trend.
4. Empirical Results
4.1 Default risk and risk shifting
According to the arguments of standard agency paradigm, the risk-shifting game becomes
particularly attractive to firms when they are facing high default risk. If a firm’s riskiness can be
measured by its asset volatility, a firm with a high level of default risk during this time period
will attempt to increase the volatility of its asset value next period (i.e. 1>RAR ). The realized
volatility of the asset values may also be determined by market conditions, business cycles, or
other economic factors. Compared to its peer firms, however, this firm should have a higher
RAR. We would expect that firms in the highest default risk group will shift more risk (higher
RAR) than firms in the lower default risk group.
[Insert Table 2 Here]
To test this hypothesis, each year we rank firms in the sample according to the value of
their “default likelihood indicator” and sort them into default risk deciles. We then examine the
IRAR in each decile.12 Table 2 presents means and medians of IRAR in each default risk decile.
There appears to be no clear causal relationship between default risk and IRAR. In most years
the median IRAR in the highest default risk decile appears lower than the median IRAR in the
12 Tests using raw RAR yield very similar results.

13
low risk deciles. As shown in Figure 1, the distribution of mean IRAR exhibits a U-shape with
respect to the default risk deciles. The mean IRAR is higher than the median IRAR almost in each
decile every year. This shows that a firm prefers to adjust its asset volatility higher when it is far
from the default zone. In this case default risk is not a factor in firm’s investment decision and
since high risk projects usually brings high return, this benefits both the debt and equity holders.
This adjustment becomes less preferable when the default risk becomes high since both
debtholders and equityholders want to maintain the firm as an integrated entity to keep all of the
organizational benefits such as tax shields and future investment opportunities. The firm will
moderate its risk exposure as the default risk increases. A firm will increase its asset risk
dramatically only when the default risk is extremely high and maintaining current projects means
the loss of equity value as an “out-of-money” option. The averaged medians and means among
all sample years are depicted in Figure 1. The solid line is the averaged medians based on M74
and dashed line is based on L94; the dash-dotted line is the averaged means based on M74 and
dotted line is based on L94. The pooled sample mean and median in each risk decile are similar
as the averaged ones depicted in Figure 1.
[Insert Figure 1 Here]
4.2 Firm’s Characteristics and risk shifting
The above results, especially the relationship between the medians of IRAR and the
default risk, do not seem to support the hypothesis that firms facing high default risk engage in
more risk shifting. However, we must keep in mind that the univariate analysis may be
misleading because the default risk variable could be correlated with other firm characteristics,

14
such as firm size, debt ratio, and current asset volatility, which also affect the firm’s incentive
and capability to shift risk. The risk shifting hypothesis should be understood in the sense of
“other things being the same” and must be examined after we control for these factors.
[Insert Table 3 Here]
To address this concern, we examine the differences in various firm characteristics
between firms in the highest default risk decile and the other nine-tenths of the sample with
lower default risks.13 Firm size is the sum of the book value of debt and the market value of
common equity. The Long-term debt ratio is total long-term debt divided by firm size. Table 3
reports the difference in mean and median between the two groups in Panel A, B, C and D
respectively for both models of M74 and L94. The two groups are significantly different in many
aspects. By construction, both the medians and the means of the default likelihood indicators in
the highest default risk decile are significantly higher than their counterparties in the lower
default risk group. Compared to the firms with lower default risk, the firms in the highest default
risk decile are significantly smaller in firm size (about 3-5 times smaller except the difference of
the means in Leland’s model is relatively smaller) and have a long-term debt ratio more than
twice as high in their capital structure. While the means of RAR and IRAR based on the two
models are significantly different between two risk groups, the difference of medians in RAR and
IRAR between two default risk groups is either insignificant for the model of M74 or in the
13 In the analysis, we do not compare firms between different default risk deciles because there may not exists a definite relationship between default risk and risk shifting when default risk is not very high. Instead we would like to identify the firms facing extremely high default risk only. As emphasized by Brealey and Myers (1991), aggressive risk shifting is more likely to occur in firms under extreme financial distress. We have also examined the differences between firms in the highest default risk quintiles and the rest of the sample, and the results are qualitatively similar to those reported in the paper.

15
opposite direction for the model of L94. In addition, the highest default risk group has
significantly higher asset volatility in existing projects (about 1.5 times higher) based on these
two models. Parrino and Weisbach (1999) point out that for a firm with high cash flow volatility
in the existing asset, there are not many higher risk projects in its investment opportunity set that
can increase its overall asset volatility any further. Therefore, the high level of current asset
volatility in firms with the highest default risk may prevent us from observing any significant
risk-shifting behavior.
[Insert Table 4 Here]
To clarify the above issue, we must control for the current asset volatility when
examining the relationship between default risk and risk-shifting behavior. We first sort the
sample into default risk deciles for every year, and then reclassify the sample into quintiles
according to current asset volatility in the same year. In each asset volatility quintile, we examine
the difference in the mean and median IRAR between the firms in the highest default risk decile
and those in the lower default risk deciles, and the results are reported in Table 4. We observe a
monotonically increasing relationship between the number of high default risk firm and asset
volatility based on M74, however, both lowest and highest asset volatility quintiles have more
high default risk firms based on L94. Based on both models, the mean of risk-shifting variables
(IRAR) is monotonically decreasing with asset volatility in both low and high default risk groups,
which is consistent with the evidence documented in Parrino and Weisbach (1999).14 In each
14 The inclusion of default risk in our sorting rules out the possibility that the dependence between IRAR and the current asset volatility is purely caused by a reversion of estimation error in the asset volatility since the mean IRAR in a group with high default risk and high asset volatility could be much higher than that in a group with low default risk and low asset volatility.

16
asset volatility quintile, firms in the highest default risk decile have higher mean IRAR compared
to firms in the rest of the sample, and the difference is statistically significant (except in the
lowest asset volatility quintile for the model of). For the model of M74, the difference of
medians between firms in the highest default risk and firms in the rest of sample are significantly
positive except in the highest asset volatility quintile. This indicates that, after controlling for
current asset volatility, firms tend to increase asset risk more when they face a high probability
of default. However, in the highest asset volatility quintile, the difference of the medians is in the
opposite direction. One possible explanation is that asset volatility is so high in this group that it
may overwhelm any impact of default risk on risk shifting behavior. High asset volatility from
the existing projects restricts a firm from shifting risk to any higher level. Furthermore, in the
model of L94, the difference of median IRAR between two risk groups does not support the risk-
shifting hypothesis even after we control for the current asset volatility. Further detailed study
shows that this contradiction to the risk-shifting hypothesis is due to the nonlinearity between
default risk and IRAR. Figure 2 plots the mean of IRAR in each cell of default risk and asset
volatility decile. It shows that firms in the highest default risk decile posses relatively higher
IRAR. However the comparison between firms in the highest default risk decile and other firms
in the sample can be confused due to the high asset volatility and the “U-shape” in the
relationship of default risk and IRAR. For example, in the model of M74, firms in both lowest
and highest default deciles exhibit significant risk-shifting when their current asset volatilities are
in the lowest decile. For firms in the highest asset volatility decile, their IRAR are almost same
cross all default risk deciles. For firms with modest current asset volatility, risk-shifting is
pronounced in highest default risk decile only. For the results obtained from the model of L94,
the nonlinearity between default risk and IRAR is more severe.

17
As shown in Table 3, the probability of default is significantly correlated with several
firm characteristics, including current asset volatility, firm size, and long-term debt ratio. A
better specification in regressions should accounts for the effect of all these firm characteristics.
Results in Table 4 indicate that controlling for asset volatility is important and the relationship
between current asset volatility and risk-shifting is negative. Large firms regularly enter debt
markets for financing, and have incentive to mitigate the risk-shifting problem so as to reduce the
cost of debt financing because the adverse consequence of the risk-shifting problem is
anticipated by debtholders, and ultimately borne by the equityholders through an increased cost
of debt financing. As a result, we would expect a negative relationship between firm size and
risk-shifting behavior. The long-term debt ratio is expected to be positively related to IRAR,
since a large amount of debt would lead to a more severe risk-shifting problem. To further
segment these effects on the risk-shifting behavior, we conduct multivariate regressions to
explain the industry adjusted risk adjustment ratio. The independent variables include logarithm
of firm size, long-term debt ratio, current asset volatility, and a default risk dummy variable that
equals to one for firms in the highest default risk decile and zero for the rest of the sample.
[Insert Table 5 Here]
Our sample includes time-series and cross-sectional data, pooled cross-sectional
regressions are not appropriate since serial correlation of regression errors could bias the
estimates and overstate their associated t-statistics. Thus we employ Fama-MacBeth (1973)
regressions in which we first conduct cross-sectional regressions for each year. The coefficients
are then averaged over the time series, and their associated t-statistics are computed following

18
Newey and West (1987) to adjust for heteroscedasticity and serial correlation. We present the
results of cross-sectional regressions for each year in table 5 and the aggregated results from the
Fama-MacBeth (1973) method are report at the bottom of the table. Results in Panel A and B are
based on M74 and L94 respectively.
Since we use the industry adjusted RAR as the dependent variable, any industry effect on
the risk-shifting incentive has been controlled in the analysis. The adjusted R2 of the cross-
sectional regressions varies over time, ranging from 5.2% to 25.3% in Merton’s model and 4.6%
to 29.1% in Leland’s model. On average the model explains about 9% of the variation in the
risk-shifting variable, IRAR.
The default risk dummy captures the difference between firms in the highest default risk
decile and the rest of the sample. The coefficients on this dummy are all positive except in 1999
for the model of L94. The values of these coefficients vary significantly over the sample period,
ranging from 0.02 to 0.38 based on M74 and from 007.0− to 0.49 based on L94. The average
value of the coefficients on the default risk dummy is 0.22 in Merton’s model and 0.15 in
Leland’s model. The corresponding Newey and West (1987) adjusted t-statistic is 9.25 in the
model of M74 and L94 respectively. This result strongly supports our proposition that firms tend
to shift more risk when they face a high probability of default. Furthermore, the effect of default
risk is economically significant. The value of the coefficient on the default risk dummy equals to
the difference of IRAR between the high and low default risk groups, holding everything else
equal. It suggests that firms in the highest default risk decile increase asset volatility about 15%
or 22% more in the subsequent year, compared to their industry peers.
The coefficients on current asset volatility are negative for all the twenty regressions over
the sample period of 1980 to 1999 in both models of M74 and L94, and the average value is –
19
0.535 with a t-statistic of –11.13 in the model of M74 and -0.501 with -12.16 in the model of
L94. This result is consistent with our findings in Table 4. The coefficients on firm size are
negative for all regressions, and the average value is statistically significant, suggesting that
larger firms are less likely to shift risk. This is because they often rely on the public debt market
and have an incentive to reduce the cost of debt financing. To our surprise, the coefficient on
long-term debt ratio is also statistically significantly negative.15 This may be explained by the
fact that larger firms use more long-term debt in their capital structure (Harris and Raviv, 1991)
and firms with large amounts of debt are usually those relying on the debt market for financing,
thereby having strong incentives to avoid any debt agency problem, like risk-shifting. For this
reason, the long-term debt ratio could be negatively related to IRAR. It is also suggested by
Leland (1998) that “agency cost may not be positively associated with optimally chosen levels of
leverage.”
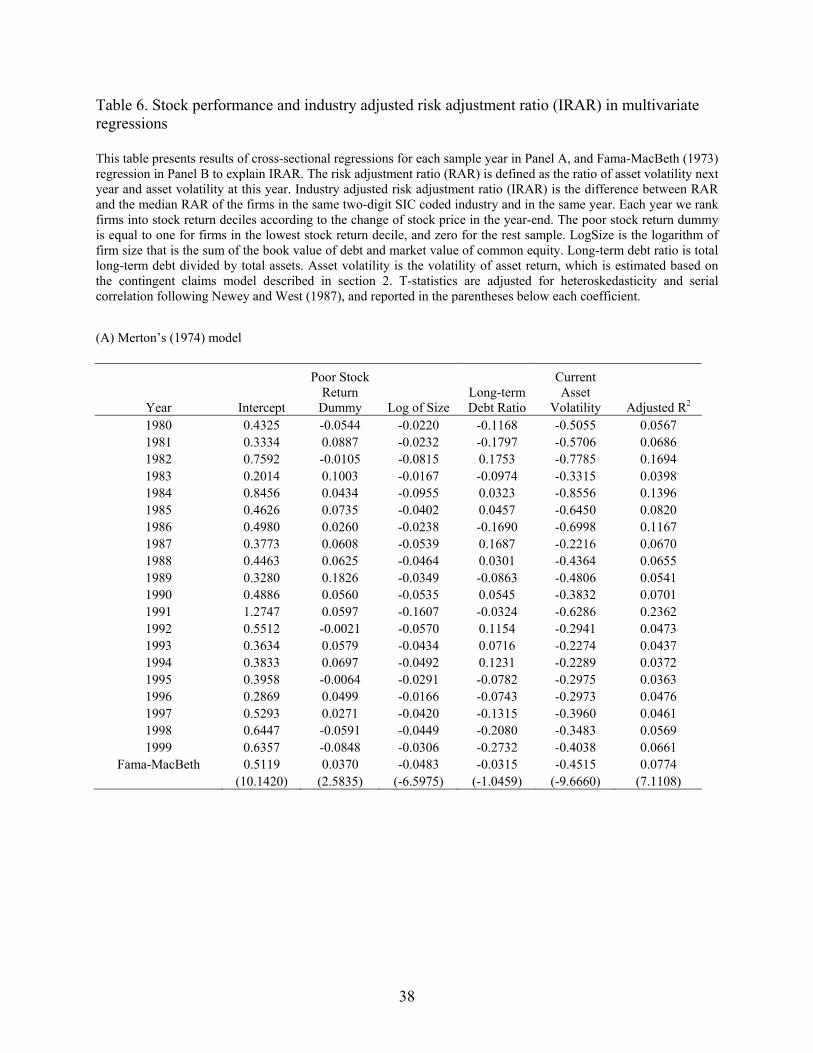
4.3 Stock performance and risk shifting
Empirical studies have documented that mutual fund and hedge fund managers tend to
take more risk subsequent to a relatively poor fund performance (Brown, Harlow and Starks,
1996; Brown, Goetzmann and Park, 2001). Motivation for this behavior is that fund managers’
compensations depend on the recent performance of the fund. In industrial companies, poor
stock performance may also motivate managers to take more risk since managers are often
compensated with stock options. As a result, we expect that a poorly performing stock would be
associated with a high risk adjustment ratio.
[Insert Table 6 Here] 15 However a univariate regression shows that the coefficient on long-term debt ratio is significantly positive.

20
To test this hypothesis, for each year-end we sort the sample into stock return deciles
according to the total return of the firm’s stock that year. We define a performance dummy
variable that is equal to one for firms in the lowest stock return decile and zero for the rest of the
sample. Multivariate regressions are conducted to examine the impact of poor stock performance
on risk-shifting behavior, and the results are reported in Table 6. The coefficients on the poor
stock return dummy are positive in most years. The average value of these coefficients is 0.037
and 0.022 based on M74 and L94 respectively. They are much smaller than their counterparts on
the default risk dummy, and are only marginally significant. Firms shift much less risk as they
experience a poor stock performance than the case when they face high default probability. The
magnitude and statistic significance of the coefficients on firm size and current asset volatility
are similar to those reported in Table 5 when we include the high default risk dummy. The
coefficient on long-term debt ratio is negative but only marginally significant.
4.4 Robustness tests
In this study so far, we have adopted Merton’s (1974) and Leland’s (1994) contingent-
claims models to infer the market values of a firm’s assets, the associated volatilities, and default
probability from its stock price history and book value of the debt. While our above results
generally support the conventional wisdom that a levered firm would take more risk when it
faces financial distress, such as high probability of default or poor stock performance, one
concern remains. The concern is whether there exist some model misspecifications that
systematically bias the results and cause a spurious relationship to arise. To address this concern,
we conduct two robustness tests.
21
In the first test, we examine the relationship between risk shifting and default probability
based on two alternatively measures of default risk. These are Altman’s (1968) Z-score and
Ohlson’s (1980) O-score, which are based on accounting information only and are well accepted
in the empirical literature.16
[Insert Table 7 Here]
As shown in Panel A of Table 7, the Z-score is significantly negatively correlated with
our default likelihood indicator derived from the contingent-claims models. The Spearman rank
correlation coefficient between Z-score and the default risk indicator is 55.0− and 59.0− based
on the model of M74 and L94 respectively. The O-score is significantly positively correlated
with our default probability measures with a correlation coefficient of 0.58 to the default risk
indicator derived from the model of M74 and 0.60 to the one derived from the model of L94. The
rank correlation between default risk indicators derived from two contingent-claims models is
0.94.
In the second test, we use the monthly bond data from Lehman Brothers Bond database
(LBBD) to estimate the monthly market values of firm’s total debt in a subset of our sample and
calculate the annual volatility of firm’s asset value. Since LBBD includes investment grade
bonds only (also include “fallen angels”) it is not appropriate to test the risk shifting behavior
directly in this sub sample. We, instead, compare this volatility with those calculated based on
M74 and L94. Panel B, C of table 7 reports the Spearman rank correlation among these three
estimated asset volatilities and RAR respectively. Asset volatility estimated based on LBBD is
16 These measures are recently used in Dichev (1998), and Griffin and Lemmon (2002) in studying the relationship between a firm’s default risk and stock returns.

22
positively correlated with the computed volatility measures with a correlation coefficient of 0.70
and 0.71 respectively. RAR estimated based on LBBD is also positively correlated with the
computed RAR based on M74 and L94 with a correlation coefficient of 0.55 and 0.50
respectively. All correlation coefficients are statistically significant.
5. Conclusion
Based on the agency literature, when management interests are completely aligned with
the interest of equityholders, they have incentive to increase the firm’s riskiness. However, there
exist many mechanisms preventing them from exploiting the debtholders. The significance of the
risk-shifting remains questionable. The positive evidence on risk-shifting behavior has been
empirically documented in the financial industry (Esty, 1997a, b; Brown, Harlow and Starks,
1996; Chevalier and Ellison, 1997; Brown, Goetzmann and Park, 2001), but there is little direct
empirical evidence of risk-shifting in industrial firms. This is because the market value of assets
for industrial firms is unobservable. In this study, we fill this lack by employing contingent-
claims methodology (Merton, 1974; Leland, 1994) to infer the market value of assets, asset
volatility, and default probability from stock price history and the book value of debt. We find
that firms, in the high default risk group or the poor recent stock performance group, tend to
increase asset risk more subsequently, relative to their industry peers. This evidence is consistent
with the conventional wisdom and many theoretical models.
Our empirical result extends the risk-shifting theory further. It shows that the relation
between a firm’s risk shifting behavior and its default risk is highly nonlinear. The curve of
firm’s “risk adjustment ratio” and its default risk exhibits a “U-shape.” Firms in both lowest and
highest default risk groups tend to take more risk and raise the volatility of their assets. When a

23
firm is far enough from default, it has incentive to increase firm’s risk to pursue a higher return
since high returns are often associated with high risks. As a firm’s default risk increases, it will
reduce its risk exposure in order to avoid entering the default zone since default incurs a cost to
both debtholders and equityholders. When a firm is very close to default, the firm’s
equityholders will increase firm’s risk dramatically and the firm enters a “gambler’s region”
since the equityholders have limited liability. If the gamble successes, the equityholders win; if
the gamble fails, the debtholders bear the loss.
In addition, we find that firm’s risk-shifting behavior is also strongly related to its
characteristics, such as firm size, leverage ratio, and current asset volatility in particular. The
correlations between firm’s risk adjustment and firm size, leverage ratio and asset volatility are
all negative. The nonlinearity between the firm’s default risk and its risk-shifting is more
significant when a firm has relatively low current asset volatility. Alternative specifications of
default risk and firm’s bond price data confirm that our findings are robust to the choice of
default risk measure.
The contribution of this study is two fold. First, we adopt the contingent-claims models to
jointly estimate the market value of assets and default risk. This methodology allows us for the
first time to directly examine the change of asset risk for industrial firms so that their risk-
shifting behavior could be evaluated. Most of the previous empirical studies could only assess
the risk-shifting problem using proxy variables rather than taking a direct approach. Second, we
extend studies of the debt agency problem by documenting direct evidence of risk-shifting
behavior in industrial firms, and the relationship between risk-shifting and various firm
characteristics. Our results support the implications of many theoretical models. The negative
relationship between risk shifting and current asset volatility may result from the difference in

24
investment flexibility between industrial firms and financial firms. Industrial firms may not have
as much flexibility as financial firms in adjusting their asset volatility, especially the volatility in
existing projects.

25
REFERENCES
Altman, Edward I., 1968, Financial ratios, discriminant analysis, and the prediction of corporate bankruptcy, Journal of Finance 23, 589-609.
Basak, Suleyman, Anna Pavlova and Alex Shapiro, 2003, Offsetting the incentives: risk shifting
and benefits of benchmarking in money management, MIT Working Paper. Black, Fischer, and Myron, Scholes, 1973, The pricing of options and corporate liabilities,
Journal of Political Economics 81, 637-659. Black, Fischer, and John C. Cox, 1976, Valuing corporate securities: some effects of bond
indenture provisions, Journal of Finance 31, 351-367. Brown, Keith C., W. Van Harlow, and Laura Starkes, 1996, Of tournaments and temptations: An
analysis of managerial incentives in the mutual fund industry, Journal of Finance, 51, 85-110. Brown, Stephen, William Goetzmann, and James Park, 2001, Careers and survival: competition
and risk in the hedge fund and CTA industry, Journal of Finance, 56, 1869-1886. Carpenter, Jennifer, 2000, Does option compensation increase managerial risk appetite? ,
Journal of Finance 55, 2311-2331. Chevalier, Judith and Glenn Ellison, 1997, Risk taking by mutual funds as a response to
incentives, Journal of Political Economy 114, 389-432. Crosbie, Peter J., and Jeffrey R. Bohn, 2001, Modeling Default Risk, KMV LLC. Delianedis, Gordon, and Robert Geske, 1998, Credit risk and risk neutral default probabilities:
information about rating migrations and defaults, UCLA Working Paper. Dichev, Ilia D., 1998, Is the risk of bankruptcy a systematic risk? Journal of Finance 53, 1131-
1147. Duffie, Darrell, and Kenneth J. Singleton, 1997, An econometric model of the term structure of
interest-rate swap yield, Journal of Finance 52, 1287-1321. Duffie, Darrell, and Kenneth J. Singleton, 1999, Modeling term structures of defaultable bonds,
Review of Financial Studies 12, 687-720. Elton, Edwin J., Martin J. Gruber, Deepak Agrawal, and Christopher Mann, 2001, Explaining the
rate of spread on corporate bonds, Journal of Finance 56, 247-277. Esty, Benjamin C., 1997a, Organizational form and risk taking in the savings and loan industry,
Journal of Financial Economics 44, 25-55.

26
Esty, Benjamin C., 1997b, A case study of organizational form and risk taking in the savings and loan industry, Journal of Financial Economics 44, 57-76.
Fama, Eugene F., 1978, The effects of a firm’s investment and financial decisions on the welfare
of its security holders, American Economic Review 68, 272-284. Fama, Eugene F., and James D. MacBeth, 1973, Risk, return, and equilibrium: empirical tests,
Journal of Political Economy 81, 607-636. Geske, Robert, 1977, The valuation of corporate liabilities as compound options, Journal of
Finance 12, 541-552. Griffin, John M., and Michael L. Lemmon, 2002, Book–to–market equity, distress risk, and
stock returns, Journal of Finance 57, 2317-2336. Goetzmann, William, Jonathan Ingersoll Jr., and Stephen Ross, 2003, High water marks and
hedge fund management contracts, Journal of Finance 58, 1685-1718. Harris, Milton, and Arthur Raviv, 1991, The theory of capital structure, Journal of Finance 46,
297-355. Haugen, Robert A., and Lemma W. Senbet, 1981, Resolving the agency problems of external
capital through options, Journal of Finance, 36, 629-647. Haugen, Robert A., and Lemma W. Senbet, 1988, Bankruptcy and agency costs: Their
significance to the theory of capital structure, Journal of Financial and Quantitative Analysis, 23, 27-38.
Jarrow, Robert A., David Lando, and Stuart M. Turnbull, 1997, A markov model for the term
structure of credit risk spreads, Review of Financial Studies 10, 481-523. Jarrow, Robert A., and Stuart M. Turnbull, 1995, Pricing derivatives on financial securities
subject to credit risk, Journal of Finance 50, 53-86. Jensen, Michael C., and William Meckling, 1976, Theory of the firm: managerial behavior,
agency costs and ownership structure, Journal of Financial Economics 3, 305-360. Lando, David, 1998, On Cox processes and credit risky securities, Review of Derivatives
Research 2, 99-120. Longstaff, Francis A., and Eduardo S. Schwartz, 1995, A simple approach to valuing risky fixed
and floating rate debt, Journal of Finance 50, 789-820. Leland, Hayne E., 1994, Corporate debt value, bond covenants, and optimal capital structure,
Journal of Finance 49, 1213-1252.

27
Leland, Hayne E., 1998, Agency costs, risk management, and capital structure, Journal of Finance 53, 1213-1244.
Leland, Hayne E., and Klaus Bjerre Toft, 1996, Optimal capital structure, endogenous
bankruptcy, and the term structure of credit spreads, Journal of Finance 51, 987-1019. Mao, Connie X., 2003, Interaction of debt agency problems and optimal capital structure: theory
and evidence, Journal of Financial and Quantitative Analysis 38, 399-423. Merton, Robert C., 1974, On the pricing of corporate debt: the risk structure of interest rates,
Journal of Finance 29, 449-470. Myers, Stewart C., 1977, Determinants of corporate borrowing, Journal of Financial Economics
5, 147-175. Newey, Whitney K., and Kenneth D. West, 1987. A simple, positive semi-definite,
herteroskedasticity and autocorrelation consistent covariance matrix, Econometrica 55, 703-708.
Ohlson, James, 1980, Financial ratios and the probabilistic prediction of bankruptcy, Journal of
Accounting Research 18, 109-131. Parrino, Robert, and Michael S. Weisbach, 1999, Measuring investment distortions arising from
stockholder-bondholder conflicts, Journal of Financial Economics 53, 3-42. Ross, Stephen A., 2004, Capital structure and the cost of capital, Journal of Applied Finance,
forthcoming. Sweeney, Richard J., Warga, Arthur D., Winters, Drew, 1997, The market value of debt, market
versus book value of debt, and returns to assets, Financial Management, 26 (Spring), 5-21 Vassalou, Maria, and Yuhang Xing, 2004, Default Risk in Equity Returns, Journal of Finance 59,
831-868.
28
Table 1. Sample Summary Statistics Panel A reports summary statistics for the entire sample from 1980 to 1999. Panel B reports the medians of stock volatility, asset volatility, and default likelihood indicator (DLI) in each sample year, which are estimated based on the contingent claims models described in section 2. The “risk adjustment ratio” (RAR) that measures the firm’s risk-shifting behavior, is defined as the ratio of asset volatility next year and asset volatility this year. Industry adjusted risk adjustment ratio (IRAR) is the difference between RAR and the median RAR of the firms in the same two-digit SIC coded industry and in the same year. Panel A: Sample statistics
Variables NOBS Mean Median Std Dev Min Max
Stock Volatility 65631 0.5987 0.5019 0.3795 0.1416 2.2809 Asset Volatility (Merton) 65631 0.4919 0.3972 0.3407 0.0947 2.0775 Asset Volatility (Leland) 65631 0.4768 0.3716 0.3426 0.1091 2.0396 DLI (Merton) 65631 0.0456 0.0000 0.1392 0.0000 0.7838 DLI (Leland) 65631 0.0128 0.0000 0.0541 0.0000 0.3854 RAR (Merton) 65631 1.1108 1.0122 0.4901 0.3547 3.6213 RAR (Leland) 65631 1.0926 0.9990 0.4792 0.3407 3.5073 IRAR (Merton) 65631 0.0880 0 0.4719 -1.3708 2.9550 IRAR (Leland) 65631 0.0832 0 0.4581 -1.2939 2.8320
Panel B: Means of stock volatility, asset volatility, and RAR for each sample year
Year NOBS Mean Stock Volatility
Mean Asset Volatility (Merton)
Mean RAR (Merton)
Mean Asset Volatility (Leland)
Mean RAR (Leland)
1980 2884 0.4871 0.3787 0.9690 0.4138 0.8946 1981 2926 0.4487 0.3616 1.0788 0.3756 0.9903 1982 3098 0.4903 0.3847 1.1041 0.3803 1.0391 1983 3071 0.4879 0.4062 0.9475 0.3955 0.9514 1984 3262 0.4501 0.3688 1.1310 0.3620 1.0873 1985 3188 0.4776 0.3916 1.2213 0.3786 1.1948 1986 3134 0.5379 0.4448 1.3425 0.4300 1.3216 1987 3249 0.6731 0.5565 0.8452 0.5384 0.8086 1988 3258 0.5706 0.4601 1.0209 0.4335 1.0268 1989 3137 0.5355 0.4298 1.3077 0.4058 1.2372 1990 3140 0.6576 0.5128 1.1451 0.4729 1.1649 1991 3094 0.6808 0.5407 1.1871 0.5002 1.2142 1992 3208 0.7129 0.5856 1.0802 0.5608 1.0307 1993 3319 0.6840 0.5787 1.0239 0.5532 1.1174 1994 3444 0.6149 0.5248 1.0599 0.5161 1.0071 1995 3560 0.6075 0.5125 1.1171 0.4941 1.1006 1996 3615 0.6253 0.5316 1.0737 0.5109 1.0814 1997 3736 0.6395 0.5402 1.2424 0.5228 1.2477 1998 3807 0.7461 0.6209 1.0716 0.6060 1.0694 1999 3501 0.7594 0.6218 1.2272 0.6070 1.2246
Average 3282 0.5943 0.4876 1.1098 0.4729 1.0905

29
Panel C: Medians of stock volatility, asset volatility, and RAR for each sample year
Year NOBS Median Stock
Volatility
Median Asset Volatility (Merton)
Median RAR (Merton)
Median Asset Volatility (Leland)
Median RAR (Leland)
1980 2884 0.4370 0.3304 0.9031 0.3620 0.8357 1981 2926 0.4021 0.3112 1.0096 0.3154 0.9324 1982 3098 0.4366 0.3335 0.9875 0.3178 0.9445 1983 3071 0.4288 0.3507 0.8883 0.3333 0.9003 1984 3262 0.3858 0.3119 0.9925 0.3000 0.9646 1985 3188 0.4063 0.3242 1.1121 0.3023 1.0953 1986 3134 0.4531 0.3661 1.2737 0.3415 1.2504 1987 3249 0.6101 0.4851 0.7498 0.4595 0.7209 1988 3258 0.4769 0.3741 0.9255 0.3326 0.9480 1989 3137 0.4448 0.3533 1.2020 0.3190 1.1334 1990 3140 0.5534 0.4207 1.0433 0.3677 1.0661 1991 3094 0.5677 0.4378 0.9985 0.3823 1.0323 1992 3208 0.5890 0.4783 0.9763 0.4278 0.9164 1993 3319 0.5645 0.4690 0.9573 0.4348 1.0456 1994 3444 0.5137 0.4251 0.9747 0.4021 0.9315 1995 3560 0.5075 0.4104 1.0490 0.3805 1.0314 1996 3615 0.5507 0.4471 1.0046 0.4223 1.0023 1997 3736 0.5544 0.4558 1.1637 0.4371 1.1681 1998 3807 0.6577 0.5184 0.9892 0.5048 0.9860 1999 3501 0.6660 0.5085 1.1452 0.4895 1.1434
Average 3282 0.5103 0.4056 1.0173 0.3816 1.0024

30
Table 2. Industry adjusted risk adjustment ratio (IRAR) and default risk deciles. This table reports the medians and means of the industry adjusted risk adjustment ratio (IRAR) in each default risk decile for every sample year. Asset volatility and default likelihood indicator are estimated based on the contingent claims models described in section 2. Each year firms are assigned into default risk deciles according to the value of their default likelihood indicators. (A) Means of IRAR based on Merton’s (1974) model
Default Risk Deciles Year L 2 3 4 5 6 7 8 9 H 1980 0.1517 0.0769 0.1157 0.0603 0.0624 0.0496 0.0256 0.0122 0.0405 0.0565 1981 0.2173 0.1232 0.0801 0.0366 0.0166 -0.0179 0.0234 0.0140 0.0170 0.1180 1982 0.1917 0.1193 0.0973 0.0689 0.0960 0.0906 0.0772 0.0951 0.0554 0.1721 1983 0.1768 0.1012 0.0945 0.0287 0.0299 0.0297 0.0060 -0.0047 0.0512 0.1059 1984 0.3828 0.1966 0.1311 0.0967 0.0379 0.0931 0.0698 0.0490 0.0805 0.2424 1985 0.2053 0.1846 0.1156 0.0869 0.0357 0.0537 0.0133 0.0117 0.0622 0.1865 1986 0.2636 0.1629 0.1006 0.0804 0.0733 0.0220 -0.0020 0.0117 -0.0642 0.0388 1987 0.0910 0.0169 0.0467 0.0622 0.0377 0.0359 0.0855 0.0909 0.1678 0.2756 1988 0.1917 0.1028 0.0501 0.0758 0.0264 0.0716 0.0715 0.0612 0.0877 0.1524 1989 0.2329 0.0948 0.0607 0.0973 0.0904 0.0369 0.0853 0.0568 0.0573 0.2230 1990 0.1160 0.0804 0.0717 0.1022 0.0442 0.0513 0.0560 0.0830 0.0805 0.3104 1991 0.2277 0.0904 0.0998 0.1368 0.1321 0.1225 0.1701 0.2049 0.2720 0.3200 1992 0.1339 0.0652 0.0488 0.0978 0.0542 0.0481 0.0818 0.0999 0.1160 0.2492 1993 0.0905 0.1090 0.0549 0.0192 0.0344 0.0400 0.0507 0.0345 0.0361 0.1597 1994 0.0646 0.0434 0.0587 0.0613 0.0924 0.0516 0.0667 0.0659 0.0847 0.2211 1995 0.1471 0.1444 0.0545 0.0570 0.0395 0.0093 0.0488 0.0189 0.0113 0.1139 1996 0.1934 0.1189 0.0852 0.0570 0.0583 0.0415 0.0220 0.0020 0.0368 0.0758 1997 0.1777 0.1225 0.1053 0.1344 0.0417 -0.0016 0.0043 0.0314 0.0242 0.1510 1998 0.1505 0.0937 0.1073 0.0805 0.0624 0.0212 0.0265 0.0524 0.0673 0.1296 1999 0.2083 0.1596 0.0756 0.0623 0.0477 0.0158 -0.0016 0.0174 0.0331 0.1216
Average 0.1807 0.1103 0.0827 0.0751 0.0557 0.0432 0.0491 0.0504 0.0659 0.1712

31
(B) Medians of IRAR based on Merton’s (1974) model
Default Risk Decile Year L 2 3 4 5 6 7 8 9 H 1980 0.0633 0.0051 0.0206 -0.0063 0.0293 -0.0059 -0.0154 -0.0449 -0.0273 -0.0441 1981 0.1114 0.0646 0.0405 0.0069 -0.0013 -0.0306 -0.0458 -0.0422 -0.0477 -0.0384 1982 0.0270 0.0206 0.0125 -0.0254 0.0153 0.0067 -0.0058 -0.0005 -0.0194 -0.0186 1983 0.1042 0.0484 0.0290 0.0000 -0.0124 -0.0178 -0.0492 -0.0501 -0.0214 -0.0402 1984 0.1539 0.0521 0.0065 -0.0332 -0.0377 -0.0035 -0.0446 -0.0321 -0.0153 0.0413 1985 0.0943 0.0533 0.0323 0.0146 -0.0255 -0.0284 -0.0553 -0.0512 -0.0273 -0.0104 1986 0.1811 0.1030 0.0352 0.0189 0.0092 -0.0182 -0.0623 -0.0888 -0.1076 -0.0988 1987 -0.0189 -0.0537 -0.0364 -0.0147 -0.0239 -0.0141 0.0100 0.0196 0.0672 0.0924 1988 0.0367 0.0125 -0.0121 0.0023 -0.0142 0.0000 0.0077 -0.0296 0.0010 -0.0228 1989 0.0957 0.0398 -0.0095 0.0041 -0.0268 -0.0223 -0.0171 -0.0300 -0.0518 -0.0172 1990 0.0046 -0.0116 0.0021 0.0079 -0.0241 -0.0076 -0.0110 0.0000 0 0.0727 1991 0.0140 -0.0122 -0.0013 0 -0.0258 -0.0242 0.0083 0.0174 0.0182 0.0091 1992 0.0554 0.0105 -0.0097 -0.0045 -0.0179 -0.0324 -0.0090 0.0125 0.0000 0.0055 1993 0.0526 0.0424 0.0040 -0.0135 -0.0123 -0.0261 -0.0018 -0.0275 -0.0190 0.0165 1994 0.0077 -0.0072 0 -0.0130 0.0001 -0.0213 0.0058 0.0000 -0.0010 0.0487 1995 0.1046 0.0533 0.0028 0.0153 -0.0170 -0.0466 -0.0242 -0.0568 -0.0494 -0.0294 1996 0.1330 0.0448 0.0045 0.0000 0 -0.0262 -0.0541 -0.0808 -0.0435 -0.0021 1997 0.1094 0.0623 0.0278 0.0249 0 -0.0494 -0.0568 -0.0400 -0.0845 -0.0173 1998 0.0944 0.0376 0.0063 -0.0002 -0.0120 -0.0611 -0.0366 -0.0625 0 -0.0014 1999 0.1302 0.0869 0.0201 0 -0.0015 -0.0481 -0.0730 -0.0576 -0.0622 -0.1107
Average 0.0777 0.0326 0.0088 -0.0008 -0.0099 -0.0239 -0.0265 -0.0323 -0.0245 -0.0083

32
(C) Means of IRAR based on Leland’s (1994) model
Default Risk Deciles Year L 2 3 4 5 6 7 8 9 H 1980 0.1776 0.1010 0.0855 0.0827 0.0316 0.0340 0.0268 0.0057 0.0080 -0.0186 1981 0.2115 0.1249 0.0660 0.0354 0.0497 -0.0225 0.0074 -0.0336 0.0058 0.0671 1982 0.1643 0.0792 0.0699 0.0599 0.0902 0.0948 0.0769 0.0489 0.0394 0.1224 1983 0.1677 0.0792 0.0533 0.0181 0.0137 0.0183 -0.0058 0.0233 0.0297 0.1247 1984 0.3464 0.1349 0.1024 0.1176 0.0746 0.0476 0.0637 0.1016 0.0444 0.1571 1985 0.1979 0.1726 0.1090 0.0886 0.0624 0.0351 0.0187 0.0432 0.0723 0.1886 1986 0.2266 0.1356 0.1105 0.1148 0.0594 0.0131 0.0512 -0.0034 -0.0483 -0.0516 1987 0.0776 0.0186 0.0528 0.0553 0.0706 0.0670 0.0667 0.0983 0.1228 0.2218 1988 0.1441 0.1072 0.0622 0.0399 0.0323 0.0307 0.0626 0.0753 0.0871 0.1614 1989 0.2300 0.1374 0.0697 0.0895 0.0694 0.1110 0.0620 0.0443 0.0843 0.0657 1990 0.0882 0.0571 0.0730 0.0474 0.0546 0.1006 0.0497 0.1088 0.1618 0.2545 1991 0.1105 0.0822 0.1121 0.0998 0.1240 0.1687 0.2494 0.1798 0.3244 0.2787 1992 0.1526 0.0695 0.0826 0.0926 0.0571 0.0754 0.0769 0.1387 0.0904 0.2583 1993 0.0215 0.0664 0.0505 0.0341 0.0323 0.0278 0.0095 0.0483 0.0577 0.2011 1994 0.0861 0.0619 0.0491 0.0566 0.0724 0.0716 0.0896 0.0603 0.1622 0.0739 1995 0.1622 0.1483 0.0686 0.0487 0.0562 0.0363 0.0391 0.0182 0.0060 0.0369 1996 0.1896 0.1054 0.0900 0.0951 0.0536 0.0391 0.0265 0.0101 0.0522 0.0900 1997 0.1559 0.1099 0.1037 0.0995 0.0599 0.0407 0.0190 0.0148 0.0564 0.1223 1998 0.1495 0.1242 0.0788 0.0710 0.1011 0.0363 0.0127 0.0697 0.0900 0.0898 1999 0.2384 0.1567 0.0747 0.0380 0.0548 0.0321 0.0527 0.0112 0.0270 0.0571
Average 0.1649 0.1036 0.0782 0.0692 0.0610 0.0529 0.0528 0.0532 0.0737 0.1250

33
(D). Medians of IRAR based on Leland’s (1994) model
Default Risk Deciles Year L 2 3 4 5 6 7 8 9 H 1980 0.0967 0.0539 0.0493 0.0453 -0.0021 0.0000 -0.0256 -0.0367 -0.0212 -0.0413 1981 0.1432 0.0786 0.0605 0.0039 0.0145 -0.0243 -0.0277 -0.0524 -0.0567 -0.0752 1982 0.0426 0.0166 -0.0013 -0.0085 0.0007 0.0176 0.0000 -0.0263 -0.0477 -0.0266 1983 0.1027 0.0448 0.0073 -0.0094 -0.0211 -0.0514 -0.0545 -0.0142 -0.0173 0.0419 1984 0.1225 0.0502 0.0004 0.0008 -0.0236 -0.0543 -0.0368 -0.0043 -0.0368 0.0061 1985 0.0859 0.0740 0.0035 -0.0029 -0.0072 -0.0405 -0.0354 -0.0363 -0.0232 0.0000 1986 0.1600 0.0718 0.0356 0.0113 0.0190 -0.0636 -0.0105 -0.0868 -0.0977 -0.1396 1987 -0.0159 -0.0327 -0.0185 -0.0355 -0.0029 -0.0002 0.0000 0.0386 0.0437 0.0589 1988 0.0141 -0.0002 -0.0011 -0.0187 -0.0171 -0.0251 0.0013 -0.0031 0.0070 0.0952 1989 0.1328 0.0499 0.0143 0.0000 -0.0161 -0.0092 -0.1039 -0.0310 -0.0748 -0.2031 1990 -0.0033 -0.0187 0.0000 -0.0403 -0.0325 0.0000 -0.0010 0.0335 0.0840 0.0790 1991 -0.0046 0.0000 -0.0209 -0.0051 -0.0413 -0.0122 0.0437 0.0003 0.0499 0.0077 1992 0.0680 0.0365 0.0000 -0.0106 -0.0186 -0.0148 -0.0381 0.0000 -0.0332 -0.0338 1993 -0.0110 0.0001 0.0080 0.0028 -0.0181 -0.0331 -0.0362 -0.0001 0.0000 0.1203 1994 0.0325 0.0102 0.0040 -0.0073 0.0000 -0.0086 0.0120 -0.0139 0.0049 -0.0762 1995 0.1206 0.0761 0.0156 0.0000 0.0099 -0.0435 -0.0510 -0.0513 -0.0499 -0.0632 1996 0.1348 0.0315 0.0131 0.0077 -0.0136 -0.0076 -0.0667 -0.0714 -0.0301 -0.0352 1997 0.0900 0.0503 0.0357 0.0011 -0.0128 -0.0177 -0.1041 -0.0520 -0.0684 -0.0024 1998 0.0918 0.0558 -0.0004 -0.0273 0.0082 -0.0486 -0.0447 -0.0412 0.0000 -0.0340 1999 0.1727 0.0761 0.0071 0.0000 -0.0094 -0.0350 -0.0386 -0.0393 -0.0600 -0.0859
Average 0.0788 0.0362 0.0106 -0.0046 -0.0092 -0.0236 -0.0309 -0.0244 -0.0214 -0.0204

34
Table 3. Characteristic differences between firms with high and low default risk. This table presents characteristic differences between firms in high default risk group and low default risk group. Each year we sort the sample into default risk deciles according to the values of their default likelihood indicator. The high default risk group consists of firms in the highest default risk decile, and the rest firms are classified into the low default risk group. Asset volatility and default likelihood indicator (DLI) are estimated based on the contingent claims model described in section 2. The risk adjustment ratio (RAR) is defined as the ratio of asset volatility next year and asset volatility this year. Industry adjusted risk adjustment ratio (IRAR) is the difference between RAR and the median RAR of the firms in the same two-digit SIC coded industry and in the same year. Firm size is the sum of the book value of debt and the market value of common equity. Long-term debt ratio is total long-term debt divided by firm’s size. T-test and Wilcoxon rank-sum test are used to examine the difference of means and medians between the two groups respectively. (A) Sample means of firm’s characteristic variables based on Merton’s (1974) model
NOBS DLI RAR IRAR Asset
Volatility Size Debt Ratio High Default Risk 6559 0.402 1.197 0.177 0.770 485.444 0.327 Low Default Risk 59038 0.006 1.101 0.078 0.461 2068.280 0.155 Difference 0.396 0.096 0.098 0.309 -1582.837 0.173 P-value 0.000 0.000 0.000 0.000 0.000 0.000
(B) Sample medians of firm’s characteristic variables based on Merton’s (1974) model
NOBS DLI RAR IRAR Asset
Volatility Size Debt Ratio High Default Risk 6559 0.346 1.012 0.002 0.613 47.083 0.326 Low Default Risk 59038 0.000 1.012 0.000 0.383 153.066 0.121 Difference 0.346 0.000 0.002 0.231 -105.983 0.204 P-value 0.000 0.142 0.883 0.000 0.000 0.000
(C) Sample means of firm’s characteristic variables based on Leland’s (1994) model
NOBS DLI RAR IRAR Asset
Volatility Size Debt Ratio High Default Risk 6563 0.124 1.125 0.128 0.682 1611.007 0.319 Low Default Risk 59068 0.000 1.089 0.078 0.454 1943.243 0.156 Difference 0.123 0.036 0.050 0.228 -332.236 0.163 P-value 0.000 0.000 0.000 0.000 0.030 0.000
(D) Sample medians of firm’s characteristic variables based on Leland’s (1994) model
NOBS DLI RAR IRAR Asset
Volatility Size Debt Ratio High Default Risk 6563 0.067 0.969 -0.002 0.466 54.200 0.323 Low Default Risk 59068 0.000 1.000 0.000 0.365 149.000 0.123 Difference 0.067 -0.033 -0.002 0.101 -95.200 0.200 P-value 0.000 0.000 0.004 0.000 0.000 0.000

35
Table 4. Differences in the risk-shifting behavior between firms with high and low default risk conditional on current asset volatility This table reports differences in RAR and IRAR between firms in high default risk group and low default risk group in each current asset volatility quintile. Each year we sort the sample into default risk deciles according to the values of their default likelihood indicator. The high default risk group consists of firms in the highest default risk decile, and the rest firms are classified into the low default risk group. The firms are then assigned into current asset volatility quintiles according to their asset volatilities in current year. Asset volatility and default risk indicator are estimated based on the contingent claims models described in section 2. The risk adjustment ratio is defined as the ratio of asset volatility next year and asset volatility this year. Industry adjusted risk adjustment ratio (IRAR) is the difference between RAR and the median RAR of the firms in the same two-digit SIC coded industry and in the same year. T-test and Wilcoxon rank-sum test are used to examine the difference of means and medians between the two groups respectively. (A) Means and medians of IRAR based on Merton’s (1974) model
NOBS Mean of IRAR Median of IRAR Quintiles of Asset
Volatility High Default
Risk Low Default
Risk High Default
Risk Low Default
Risk p-value High Default
Risk Low Default
Risk p-value
L 795 12342 0.4600 0.2104 0.0000 0.1219 0.0758 0.0059
2 709 12421 0.3300 0.0932 0.0000 0.0526 0.0072 0.0002
3 982 12149 0.2331 0.0596 0.0000 0.0429 -0.0034 0.0007
4 1260 11870 0.1929 0.0380 0.0000 0.0393 -0.0173 0.0000
H 2809 10294 0.0162 -0.0264 0.0000 -0.0977 -0.0851 0.0165
(B) Means and medians of IRAR based on Leland’s (1994) model
NOBS Mean of IRAR Median of IRAR Quintiles of Asset
Volatility High Default
Risk Low Default
Risk High Default
Risk Low Default
Risk p-value High Default
Risk Low Default
Risk p-value
L 1214 11820 0.2081 0.1886 0.1872 0.0452 0.0664 0.0006
2 921 12104 0.2017 0.0997 0.0000 -0.0185 0.0074 0.0068
3 951 12074 0.1955 0.0711 0.0000 -0.0104 -0.0014 0.4755
4 1010 12015 0.1866 0.0535 0.0000 0.0236 -0.0097 0.0002
H 2408 10589 -0.0091 -0.0312 0.0308 -0.1117 -0.0842 0.0008

36
Table 5. Default risk and industry adjusted risk adjustment ratio (IRAR) in multivariate regressions This table presents results of cross-sectional regressions for each sample year in Panel A, and Fama-MacBeth (1973) regressions in Panel B to explain IRAR. The risk adjustment ratio (RAR) is defined as the ratio of asset volatility next year and asset volatility this year. Industry adjusted risk adjustment ratio (IRAR) is the difference between RAR and the median RAR of the firms in the same two-digit SIC coded industry and in the same year. Each year we rank firms into default risk deciles, and default risk dummy is equal to one for firms in the highest default risk decile, and zero for the rest sample. Log of Size is the logarithm of firm size that is the sum of the book value of debt and market value of common equity. Long-term debt ratio is total long-term debt divided by total assets. Asset volatility is the volatility of asset return, which is estimated based on the contingent claims model described in section 2. T-statistics are adjusted for heteroskedasticity and serial correlation following Newey and West (1987), and reported in the parentheses below each coefficient.
(A) Merton’s (1974) model
Year Intercept
Default Risk
Dummy Log of Size Long-term Debt Ratio
Current Asset
Volatility Adjusted R2 1980 0.3787 0.0200 -0.0212 -0.1475 -0.4921 0.0554 1981 0.4295 0.1482 -0.0203 -0.3027 -0.6260 0.0736 1982 0.7794 0.1196 -0.0808 0.0534 -0.8340 0.1737 1983 0.3362 0.1756 -0.0146 -0.2744 -0.4354 0.0471 1984 0.9215 0.2110 -0.0936 -0.1605 -0.9426 0.1495 1985 0.5782 0.2635 -0.0378 -0.1765 -0.7722 0.0980 1986 0.5601 0.2016 -0.0224 -0.3365 -0.7826 0.1270 1987 0.4734 0.2046 -0.0533 0.0068 -0.2836 0.0828 1988 0.5511 0.2171 -0.0455 -0.1393 -0.5319 0.0777 1989 0.5724 0.3255 -0.0359 -0.3188 -0.6346 0.0666 1990 0.6188 0.3803 -0.0551 -0.2026 -0.4997 0.1104 1991 1.4109 0.3363 -0.1619 -0.2699 -0.7571 0.2532 1992 0.6452 0.3221 -0.0593 -0.1602 -0.4187 0.0757 1993 0.4897 0.2391 -0.0449 -0.1343 -0.3315 0.0636 1994 0.5067 0.2280 -0.0498 -0.0749 -0.3253 0.0529 1995 0.4452 0.2019 -0.0298 -0.2718 -0.3786 0.0520 1996 0.3789 0.1604 -0.0171 -0.2214 -0.3686 0.0562 1997 0.6101 0.2610 -0.0408 -0.3603 -0.4972 0.0633 1998 0.6033 0.1628 -0.0421 -0.3595 -0.3761 0.0644 1999 0.5498 0.1570 -0.0269 -0.4165 -0.4088 0.0711
Fama-MacBeth 0.5920 0.2168 -0.0477 -0.2134 -0.5348 0.0907 (11.2897) (9.2505) (-6.3382) (-7.9236) (-11.1301) (7.8925)

37
(B) Leland’s model
Year Intercept
Default Risk
Dummy Log of Size Long-term Debt Ratio
Current Asset
Volatility Adjusted R2 1980 0.3748 0.0358 -0.0173 -0.3681 -0.4125 0.0623 1981 0.3511 0.0862 -0.0104 -0.4561 -0.4480 0.0644 1982 0.6776 0.1351 -0.0665 -0.2426 -0.6540 0.1324 1983 0.3055 0.1246 -0.0105 -0.3083 -0.4407 0.0559 1984 0.8362 0.0868 -0.0852 -0.3118 -0.7817 0.1367 1985 0.5923 0.1901 -0.0382 -0.3530 -0.7664 0.0957 1986 0.5026 0.0996 -0.0191 -0.4073 -0.6796 0.1167 1987 0.4661 0.1474 -0.0505 -0.1100 -0.2560 0.0697 1988 0.5490 0.1373 -0.0464 -0.1510 -0.5455 0.0928 1989 0.5701 0.1272 -0.0372 -0.5843 -0.5248 0.0547 1990 0.6293 0.4935 -0.0622 -0.0565 -0.5028 0.1179 1991 1.4818 0.2739 -0.1729 -0.3598 -0.8203 0.2906 1992 0.7878 0.3419 -0.0751 -0.4591 -0.4504 0.0976 1993 0.3594 0.0282 -0.0336 0.2856 -0.3166 0.0825 1994 0.5407 0.1374 -0.0546 -0.2798 -0.2565 0.0462 1995 0.4778 0.1132 -0.0331 -0.4233 -0.3626 0.0507 1996 0.4787 0.1333 -0.0249 -0.3907 -0.4297 0.0669 1997 0.6444 0.1234 -0.0440 -0.4482 -0.5311 0.0670 1998 0.6664 0.0987 -0.0475 -0.4219 -0.4045 0.0743 1999 0.6038 -0.0073 -0.0324 -0.4266 -0.4263 0.0833
Fama-MacBeth 0.5948 0.1453 -0.0481 -0.3137 -0.5005 0.0929 (9.9878) (5.2085) (-5.6564) (-8.1559) (-12.1643) (7.3425)
38
Table 6. Stock performance and industry adjusted risk adjustment ratio (IRAR) in multivariate regressions This table presents results of cross-sectional regressions for each sample year in Panel A, and Fama-MacBeth (1973) regression in Panel B to explain IRAR. The risk adjustment ratio (RAR) is defined as the ratio of asset volatility next year and asset volatility at this year. Industry adjusted risk adjustment ratio (IRAR) is the difference between RAR and the median RAR of the firms in the same two-digit SIC coded industry and in the same year. Each year we rank firms into stock return deciles according to the change of stock price in the year-end. The poor stock return dummy is equal to one for firms in the lowest stock return decile, and zero for the rest sample. LogSize is the logarithm of firm size that is the sum of the book value of debt and market value of common equity. Long-term debt ratio is total long-term debt divided by total assets. Asset volatility is the volatility of asset return, which is estimated based on the contingent claims model described in section 2. T-statistics are adjusted for heteroskedasticity and serial correlation following Newey and West (1987), and reported in the parentheses below each coefficient.
(A) Merton’s (1974) model
Year Intercept
Poor Stock Return
Dummy Log of Size Long-term Debt Ratio
Current Asset
Volatility Adjusted R2 1980 0.4325 -0.0544 -0.0220 -0.1168 -0.5055 0.0567 1981 0.3334 0.0887 -0.0232 -0.1797 -0.5706 0.0686 1982 0.7592 -0.0105 -0.0815 0.1753 -0.7785 0.1694 1983 0.2014 0.1003 -0.0167 -0.0974 -0.3315 0.0398 1984 0.8456 0.0434 -0.0955 0.0323 -0.8556 0.1396 1985 0.4626 0.0735 -0.0402 0.0457 -0.6450 0.0820 1986 0.4980 0.0260 -0.0238 -0.1690 -0.6998 0.1167 1987 0.3773 0.0608 -0.0539 0.1687 -0.2216 0.0670 1988 0.4463 0.0625 -0.0464 0.0301 -0.4364 0.0655 1989 0.3280 0.1826 -0.0349 -0.0863 -0.4806 0.0541 1990 0.4886 0.0560 -0.0535 0.0545 -0.3832 0.0701 1991 1.2747 0.0597 -0.1607 -0.0324 -0.6286 0.2362 1992 0.5512 -0.0021 -0.0570 0.1154 -0.2941 0.0473 1993 0.3634 0.0579 -0.0434 0.0716 -0.2274 0.0437 1994 0.3833 0.0697 -0.0492 0.1231 -0.2289 0.0372 1995 0.3958 -0.0064 -0.0291 -0.0782 -0.2975 0.0363 1996 0.2869 0.0499 -0.0166 -0.0743 -0.2973 0.0476 1997 0.5293 0.0271 -0.0420 -0.1315 -0.3960 0.0461 1998 0.6447 -0.0591 -0.0449 -0.2080 -0.3483 0.0569 1999 0.6357 -0.0848 -0.0306 -0.2732 -0.4038 0.0661
Fama-MacBeth 0.5119 0.0370 -0.0483 -0.0315 -0.4515 0.0774 (10.1420) (2.5835) (-6.5975) (-1.0459) (-9.6660) (7.1108)

39
(B) Leland’s (1994) model
Year Intercept
Poor Stock Return
Dummy Log of Size Long-term Debt Ratio
Current Asset
Volatility Adjusted R2 1980 0.4128 -0.0403 -0.0183 -0.3233 -0.4175 0.0627 1981 0.2927 0.0558 -0.0122 -0.3933 -0.4159 0.0623 1982 0.6685 -0.0181 -0.0674 -0.1334 -0.6039 0.1263 1983 0.1984 0.0937 -0.0145 -0.1398 -0.3511 0.0508 1984 0.7995 0.0251 -0.0864 -0.2189 -0.7417 0.1343 1985 0.5064 0.0682 -0.0435 -0.1296 -0.6435 0.0828 1986 0.4653 0.0224 -0.0198 -0.3293 -0.6395 0.1140 1987 0.3956 0.0539 -0.0506 -0.0247 -0.2244 0.0630 1988 0.4930 0.0346 -0.0470 -0.0545 -0.4936 0.0877 1989 0.4000 0.1523 -0.0379 -0.4611 -0.4357 0.0563 1990 0.5750 0.0380 -0.0620 0.0267 -0.4688 0.0943 1991 1.3983 0.0415 -0.1740 -0.1544 -0.7285 0.2780 1992 0.7304 -0.0269 -0.0742 -0.1658 -0.3311 0.0652 1993 0.3103 0.0507 -0.0346 0.3280 -0.2965 0.0832 1994 0.4553 0.0707 -0.0536 -0.2350 -0.2285 0.0458 1995 0.4591 -0.0110 -0.0329 -0.3113 -0.3181 0.0456 1996 0.4308 0.0187 -0.0253 -0.2601 -0.3737 0.0606 1997 0.6353 0.0013 -0.0483 -0.2659 -0.4606 0.0609 1998 0.7318 -0.0698 -0.0503 -0.3278 -0.3943 0.0731 1999 0.7606 -0.1259 -0.0364 -0.4170 -0.4615 0.0884
Fama-MacBeth 0.5559 0.0217 -0.0495 -0.1995 -0.4514 0.0868 (9.2231) (1.4816) (-5.8886) (-5.0539) (-12.5536) (7.7886)

40
Table 7. Robustness Tests Panel A reports Spearman rank correlation among our measures of default probability, Altman’s Z-score, and Ohlson’s O-score. Our measures of default likelihood indicator (DLI) are estimated based on the contingent claims models described in section 2. Low Z-score and high O-score represent high default probability. The p-value is reported in parentheses below the correlation coefficients. Panel B present Spearman rank correlation among the asset volatilities calculated based on Lehman Brother Bond Database (LBBD) and those calculated based on Merton’s (1974) model and Leland’s (1994) model. Panel C present Spearman rank correlation among the risk adjustment ratio (RAR) calculated based on LBBD and those calculated based on Merton’s (1974) model and Leland’s (1994) model. The p-value is reported in the parentheses below each correlation coefficient.
Panel A: Correlation among different measures of default probability
Default Probability
(Merton) Default Probability
(Leland) Altman's Z-score Ohlson's O-score
DLI (Merton) 1.0000 0.9377 -0.5461 0.5745
(<0.0001) (<0.0001) (<0.0001)
DLI (Leland) 1.0000 -0.5873 0.6004
(<.0001) (<0.0001)
Altman's Z-score 1.0000 -0.6207
(<0.0001)
Ohlson's O-score 1.0000 Panel B: Correlation among different calculated asset volatilities
Asset Volatility
(LBBD) Asset Volatility
(Merton) Asset Volatility
(Leland)
Asset Volatility 1.0000 0.6976 0.7058
(LBBD) (<0.0001) (<0.0001)
Asset Volatility 1.0000 0.8632
(Merton) (<0.0001)
Asset Volatility 1.0000
(Leland) Panel C: Correlation among different calculated RAR
RAR (LBBD) RAR (Merton) RAR (Leland)
RAR (LBBD) 1.0000 0.5534 0.5005
(<0.0001) (<0.0001)
RAR (Merton) 1.0000 0.8294
(<0.0001)
RAR (Leland) 1.0000

41
Figure 1. The averaged medians and means of industry adjusted risk adjustment ratio (IRAR) in each risk decile. The solid line is the averaged medians based on Merton’s (1974) model and dashed line is based on Leland’s (1994) model; the dash-dotted line is the averaged means based on Merton’s (1974) model and dotted line is based on Leland’s (1994) model.

42
Figure 2. The averaged industry adjusted “risk adjustment ratio” in each default risk and current asset volatility decile. (A) The relationship of IRAR with asset volatility and default risk based on Merton’s (1974) model

43
(B) The relationship of IRAR with asset volatility and default risk based on Leland’s (1994) model