year 10 a mathematics exam revision booklet semester 1 …
TRANSCRIPT

Year 10 A Mathematics
EXAM REVISION BOOKLET SEMESTER 1 2021
Name: _________________
*Solutions and extra material are available on STL Link*
*Practice examinations will be provided in a separate handout*


10A MATHEMATICS SEMESTER 1 2021 REVISION PROGRAM
Examination dates
o Technology Free (Paper 1) Thursday June 3 11:45 a.m. (MEC) o Technology Active (Paper 2) Friday June 4 1:45 p.m. (MEC)
Topics to be examined
o Chapter 9 (Ex 9A-9D, F-I) Statistics o Chapter 8 (Ex 8A – G) Probability o Chapter 1 (Ex 1C – K) Linear Relations o Chapter 6 (Ex 6B – H) Measurement o Chapter 5 (Ex 5A – I) Quadratic Equations o Chapter 3 (Ex 3A – D) Surds
Format
• Technology Free Examination – Paper 1 o 60 minutes duration (plus 15 minutes reading time) o No calculators or summary books are allowed o A formula sheet will be provided o All questions are short answer questions but some may contain multiple parts o Detailed workings to questions should be written in the spaces provided
• Technology Active Examination – Paper 2 o 90 minutes duration (plus 15 minutes reading time) o Includes Multiple Choice and Extended Response type questions o Detailed workings should be written in the spaces provided o A CAS calculator (and optionally a scientific calculator) and one bound summary book
(not the textbook) are allowed Summary Books
o Technology Free No summary book (and no calculator) o Technology Active Examination One bound summary book (and a CAS and
scientific calculator) The summary book must be a single bound book with no loose sheets and it must be your own summary of notes and key examples. It cannot be your textbook and cannot have post-it notes/tabs.

Revision material
• Text: Semester Reviews (note: Semester Review questions were not set in the work schedules so you have probably not done these problems before).
� Statistics pg 792-794
� Probability pg 790-791
� Linear Relations pg 408-409
� Measurement pg 787-788
� Quadratic Equations pg 416-417
� Surds pg 412 (Q1-4) & 413 (Q1-3)
• 2021 Tests, Assignments and Quizzes – go back through these and write out corrected versions of any mistakes made. Copies of the tests will be uploaded to the learning site.
� 1. Statistics Test
� 2. Probability Test
� 3. Linear Relations Test
� 4. Measurement Test
� 5. Quadratic Equations Practice test
• Text chapter reviews
The chapter reviews at the end of each chapter provide a comprehensive review of the chapter. Each question is labelled with the relevant exercise that you can return to for more practice.
• Past Examinations (will be uploaded to the learning site)
� Semester 1 Technology Free examination
� Semester 1 Technology Active examination General notes
• You should attempt and follow up on questions early. Regular practice over the coming weeks will be more effective that “cramming” in the days leading up to the exams.
• It is most important that you have a well prepared summary book with material that may assist you with the technology active examination.
• Make sure that you have a charged calculator for the technology active examination and that you know how to use it. You should ensure you practice with your CAS calculator while revising.
• You must include some timed practice as a part of your revision. • Ensure you have made full corrections to all work handed back during the Semester and
seek support from your teacher with any areas where you’re still unsure.

AR
EAS
I NEE
D T
O D
O M
OR
E W
OR
K O
N
As y
ou c
ompl
ete
the
prac
tice
test
s and
revi
ew q
uest
ions
, tic
k th
e bo
xes b
elow
of a
reas
that
requ
ire m
ore
wor
k. N
ext t
o th
ose
area
s are
rela
ted
ques
tions
from
the
text
book
that
you
can
use
for f
urth
er p
ract
ice,
the
exer
cise
is li
sted
, e.g
. 8B,
follo
wed
by
the
ques
tion,
e.g
. Q5.
Prob
abili
ty
sim
ple
prob
abili
ties (
8A: Q
2, 7
)
set
not
atio
n, V
enn
diag
ram
s, tw
o w
ay ta
bles
(8B
: Q3,
5, 7
)
the
add
ition
rule
(8C
: Q2,
3)
co
nditi
onal
pro
babi
lity
(8D
: Q2,
5,)
tw
o w
ay ta
bles
(8E:
Q4)
tre
e di
agra
ms (
8F: Q
6)
ind
epen
dent
eve
nts (
8G: Q
2)
Stat
istic
s
col
lect
ing
and
usin
g da
ta (9
A: Q
2)
rev
iew
of s
tatis
tical
gra
phs (
9B: Q
3, 4
)
sum
mar
y St
atist
ics (
9C: Q
2,3)
bo
x pl
ots (
9D: Q
2, 3
)
Tim
e-se
ries d
ata
(9F:
Q5,
7)
Biv
aria
te d
ata
and
scat
ter p
lots
(9G
: Q2,
4)
Lin
e of
bes
t fit
by e
ye (9
H: Q
3)
Lin
ear r
egre
ssio
n us
ing
tech
nolo
gy (9
I: Q
4)
Surd
s
sim
plify
ing
(3A
: Q4)
ad
ding
/subt
ract
ing
(3B
: Q3,
4)
mu
ltipl
ying
/div
idin
g (3
C: Q
3, 7
, 8)
rat
iona
lisin
g th
e de
nom
inat
or (3
E: Q
4)
Line
ar R
elat
ions
alg
ebra
ic fr
actio
ns (1
B: Q
5, 1
C: Q
6)
sol
ving
line
ar e
quat
ions
(1D
: Q3,
4, 6
)
ine
qual
ities
(1E:
Q2,
3)
gra
phin
g st
raig
ht li
nes (
1F: Q
5, 6
)
fin
ding
the
equa
tion
of a
line
(1G
: Q2,
4)
len
gth
of a
line
segm
ent (
1H: Q
2, 6
)
mi
dpoi
nt o
f a li
ne se
gmen
t (1H
: Q5)
pa
ralle
l and
per
pend
icul
ar li
nes (
1I: Q
3, 1
1)
sim
ulta
neou
s equ
atio
ns: s
ubst
itutio
n (1
J: Q
2)
sim
ulta
neou
s equ
atio
ns: e
limin
atio
n (1
K: Q
3)

Mea
sure
men
t
Py
thag
oras
’ the
orem
incl
udin
g 3D
(6B
: Q3,
4)
A
rea,
surf
ace
area
:
co
nver
ting
units
(6C
: Q2)
are
a of
bas
ic sh
apes
(6C
: Q3,
5)
are
a of
com
posit
e sh
apes
(6C
: Q7)
pri
sms a
nd c
ylin
ders
(6D
: Q2,
6, 8
)
py
ram
ids a
nd c
ones
(6E:
Q2,
3, 1
0)
py
ram
ids (
6E: Q
5, 1
0)
co
nes (
6E: Q
4, 6
, 7)
sur
face
are
a co
mpo
site
solid
s (6D
: Q9
& 6
E: Q
12)
sph
eres
(6H
: Q2,
11)
Vol
ume:
co
nver
ting
units
(6F:
Q2)
pri
sms a
nd c
ylin
ders
(6F:
Q4,
9)
py
ram
ids a
nd c
ones
(6G
: Q2,
3, 5
)
sph
eres
(6H
: Q2,
12)
Qua
drat
ic E
quat
ions
Expa
ndin
g:
bin
omia
ls, p
erfe
ct sq
uare
s and
DO
PS (5
A: Q
4, 5
, 6)
Fa
ctor
ising
:
co
mm
on fa
ctor
(5B
: Q2,
3)
DO
PS a
2 – b
2 (5B:
Q4-
6)
gro
upin
g (5
B: Q
7, 9
)
trin
omia
ls x2 +
bx
+ c
(5C
: Q4,
5)
trin
omia
ls ax
2 + b
x +
c (5
D: Q
2, 3
)
sim
plify
ing
alge
brai
c fra
ctio
ns (5
C: Q
6, 8
)
by
com
plet
ing
the
squa
re (5
E: Q
3, 4
)
Solv
ing
quad
ratic
equ
atio
ns:
usi
ng th
e N
ull F
acto
r Law
(5F:
Q3,
4, 6
)
by
com
plet
ing
the
squa
re (5
H: 2
, 4)
usi
ng th
e qu
adra
tic fo
rmul
a (5
I: Q
3, 4
, 6)
the
disc
rimin
ant (
5I: Q
2)
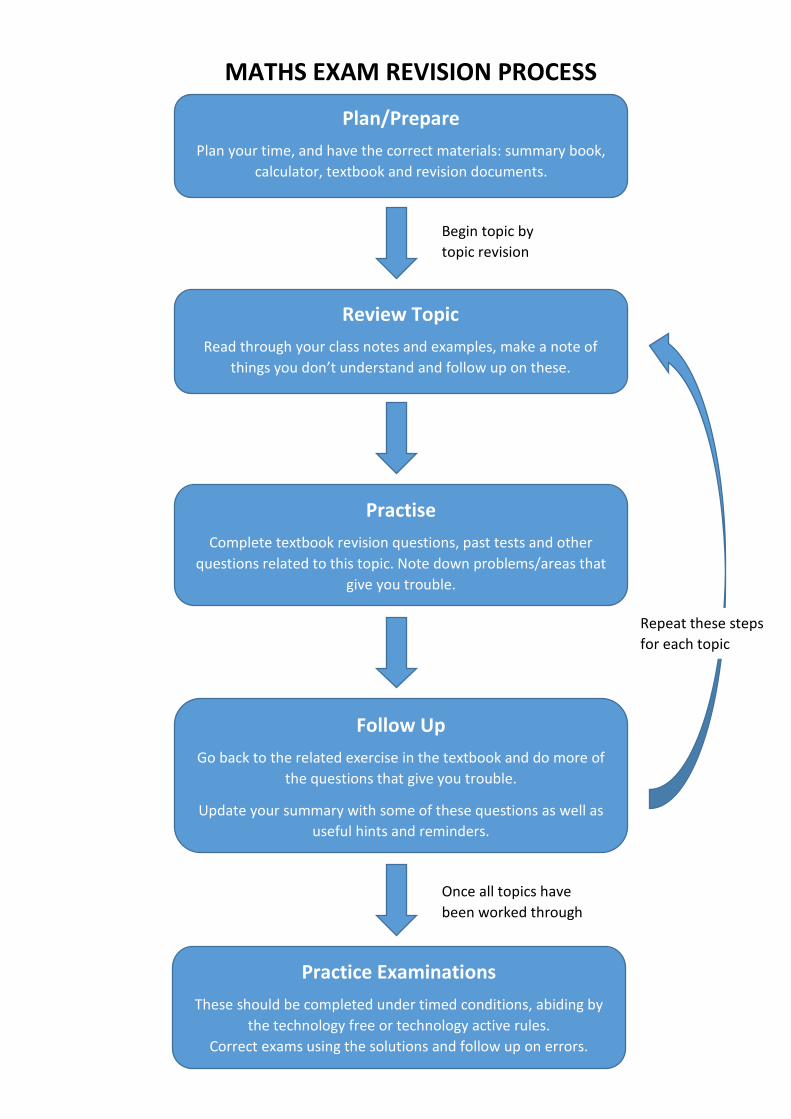
MATHS EXAM REVISION PROCESS Plan/Prepare
Plan your time, and have the correct materials: summary book, calculator, textbook and revision documents.
Review Topic Read through your class notes and examples, make a note of
things you don’t understand and follow up on these.
Practise Complete textbook revision questions, past tests and other
questions related to this topic. Note down problems/areas that give you trouble.
Follow Up Go back to the related exercise in the textbook and do more of
the questions that give you trouble.
Update your summary with some of these questions as well as useful hints and reminders.
Practice Examinations These should be completed under timed conditions, abiding by
the technology free or technology active rules. Correct exams using the solutions and follow up on errors.
Once all topics have been worked through
Begin topic by topic revision
Repeat these steps for each topic

Examination Formula Sheet
Linear Relations
distance between two points (x1, y1) and (x2, y2)
212
212 )()( yyxx −+−
Quadratic Equations
quadratic formula a
acbb2
42 −±−
Probability
)Pr()Pr()Pr()Pr( BABABA ∩−+=∪
( ) ( )Pr 1 PrA A′= −
( ) ( )( )
PrPr |
PrA B
A BB∩
=
Measurement
area of a parallelogram bh
area of a sector 2 360
rπθ×
area of a trapezium hba )(21
+ area of a
rhombus/kite xy21
area of a circle 2 rπ
curved surface area of a cylinder rh 2π
volume of a prism area of base × height
curved surface area of a cone rs π
volume of a cylinder hr 2 π
total surface area of a sphere 4 2 rπ
volume of a cone
hr 2 31π
volume of a
pyramid heightbase of area31
××
volume of a
sphere 3
43
rπ

1
10A Mathematics Statistics Test
Name: _____________________
Time permitted: 60 mins
Instructions
A CAS calculator and one bound reference are permitted. Answer all questions in the spaces provided. Exact answers are required unless otherwise specified. In questions where more than one mark is available, appropriate working must be shown. Multiple choice questions are each worth one mark.
Section A Multiple Choice Questions 10 marks Circle the letter corresponding to the correct response. 1. Samantha records the age of each of her family members in years. This type of data is: A. categorical and ordinal B. categorical and nominal C. positively skewed D. numerical and discrete E. numerical and continuous
2. Victor records the number of emails he receives each day for a month. He puts these into a stem and leaf diagram, shown opposite. What is the median number of emails Victor received that month?
Number of emails received
A. 25 B. 6 C. 26 D. 27 E. 33
Mark: _____ /50

2
3. 20 households were asked how many times they visited the supermarket in a given week and the results are recorded in the dot plot below. What percentage of households visited the supermarket less than 3 times that week?
A. 90%
B. 80%
C. 10
D. 20%
E. 15%
4. A distribution has a range of 30, an interquartile range of 15 and a median of 25. Which of the following boxplots could represent this distribution?
5. A data set is positively skewed, with one outlier. The best statistic to most accurately measure its spread would be the: A. range B. median C. mode D. IQR E. mean

3
Questions 6 to 8 relate to the following information. The Maths department want to look at the relationship between the scores achieved by Year 10 students on two tests. The results for one Year 10 class are plotted on the scatterplot below. A line of best fit has also been added.
6. The correlation between this data is best described as: A. negative B. univariate C. positive D. categorical E. skewed
7. The equation of the line of best fit is closest to: A. 𝑦𝑦 = 1.2𝑥𝑥 + 11 B. 𝑦𝑦 = 2𝑥𝑥 − 10 C. 𝑦𝑦 = 11𝑥𝑥 + 1.2 D. 𝑦𝑦 = 0.8𝑥𝑥 E. 𝑦𝑦 = 11− 1.2𝑥𝑥
8. Which one of the following statements can we conclude to be true? A. Each test was out of 40 marks. B. Students are more likely to receive a higher mark on test 2 compared to test 1. C. All students performed better on test 2 than test 1. D. The lowest mark on test 2 was 10. E. There are 22 students in the class.
4
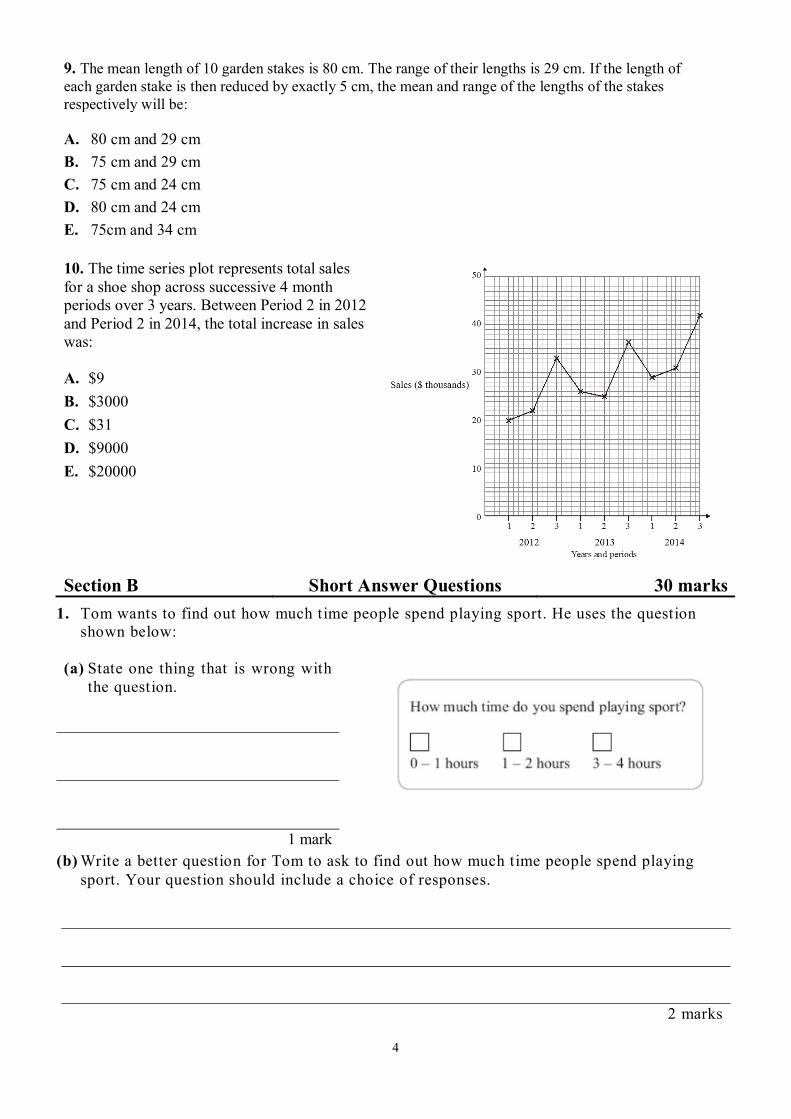
9. The mean length of 10 garden stakes is 80 cm. The range of their lengths is 29 cm. If the length of each garden stake is then reduced by exactly 5 cm, the mean and range of the lengths of the stakes respectively will be: A. 80 cm and 29 cm B. 75 cm and 29 cm C. 75 cm and 24 cm D. 80 cm and 24 cm E. 75cm and 34 cm
10. The time series plot represents total sales for a shoe shop across successive 4 month periods over 3 years. Between Period 2 in 2012 and Period 2 in 2014, the total increase in sales was:
A. $9
B. $3000 C. $31 D. $9000 E. $20000
Section B Short Answer Questions 30 marks
1. Tom wants to find out how much time people spend playing sport. He uses the question shown below:
(a) State one thing that is wrong with the question.
1 mark (b) Write a better question for Tom to ask to find out how much time people spend playing
sport. Your question should include a choice of responses.
2 marks

5
2. The back to back stem and leaf plot below compares the number of points scored in each
game of a season by two American Junior College football teams:
Laney College Feather River College 0 0 7 9 5 3 1 4 9 6 4 2 0 1 4 3 3 0 1 4 7 5 2 4
Key: 2|0 means 20 points (a) Calculate, to 2 decimal places, the mean number of points scored by:
(i) Laney College
(ii) Feather River College
2 marks 2 marks (b) Calculate the range of points scored by:
(i) Laney College
(ii) Feather River College
1 mark 1 mark (c) Alex is trying to decide which college to join next year based on which has the best football
team. Which college should Alex join? Support your answer with at least one suitable statistical comparison.
1 mark

6
3. Some local families were asked how many meals they ate at a café or restaurant over a 3 month period. The data collected is displayed in the histogram opposite.
(a) How many families were asked?
1 mark
(b) What was the modal interval of meals eaten at a café or restaurant over the three month period?
(c) Describe the distribution of this data.
1 mark 1 mark 4. Determine suitable samples to satisfy the following conditions: (a) A set of 8 positive integers (whole numbers), with no numbers repeated that have 𝑄𝑄1 = 3,
median= 5.5 and 𝑄𝑄3 = 7.5.
1 mark
(b) A set of 6 numbers between 0 and 10 with 𝑄𝑄1 = 𝑄𝑄2 = 𝑄𝑄3
1 mark
(c) A set of 6 numbers between 0 and 10 with an IQR of 5 and where the mean is greater than the
median.
1 mark

7
5. You are interested in finding out how students in Victoria travel to school each day. You design a survey and stand in front of your locker and ask the first 20 people who go past you one morning to complete the survey. Give one reason why this sample may not be representative of students in Victoria?
1 mark 6. The number of visits to a small website is recorded over a 12 day period. The information is shown in the table below.
Day 1 2 3 4 5 6 7 8 9 10 11 12
Number of visits 52 63 53 59 74 82 93 77 89 104 95 113
(a) Plot this information as a time series graph on the axes below.
3 marks
(b) Describe the trend in the data over the 12 days.
2 marks

8
7. 15 teachers were asked how many detentions they gave out on average each week over a 6 week period. Their answers are below:
31 12 38 13 59 21 29 28
41 33 34 42 31 32 49
(a) Calculate the five number summary for this data.
(b) Show that there are no outliers for this data set.
2 marks 3 marks (c) Construct a box plot for this data using the grid provided below. Ensure you use a suitable scale.
2 marks (d) Mr. Thomas decides he gives too many detentions. He wants to give less detentions on average than
75% of the staff surveyed. What is the maximum number of detentions Mr Thomas should issue on average each week in order to meet his goal?
1 mark

9
Section C Extended Response Question 10 marks Amanda is moving to a new town, and she is researching the cost of renting a room in a shared house. The table opposite shows the number of kilometres (kms) each house is from the town centre, d, and the cost of the room per week in dollars, r. This information is also shown in the scatterplot below.
(a) After compiling this list, Amanda sees two more properties. The first is 0.5 km from the town centre
and costs $480 a week. The second costs $300 and is 2km from the town centre. Add these two the scatterplot above.
1 mark
(b) Use your CAS calculator to find the least squares regression line for the 12 properties Amanda
collected data for. State the equation of this line below, using the variable names provided and rounding all values to 2 decimal places.
2 marks
(c) Sketch this line on the scatterplot provided. 1 mark
d r 0.4 510 0.8 470 0.9 430 1.4 340 1.8 400 2.3 320 2.3 290 3.2 140 3.4 100 4 120
d
r

10
(d) Use your answer to part (b) to estimate:
(i) The cost of renting a room 2.7 km from the town centre.
2 marks
(ii) The distance from the town centre of a room costing $250 a week, to 2 decimal places.
2 marks (e) Is your answer to (d) (ii) an example of interpolation or extrapolation. Explain why.
1 mark (f) Amanda sees a property which is 7 km from the town centre. Suggest a reason why the model used above may not be suitable to estimate the rent for this property.
1 mark
END OF TEST

1
10A Mathematics Probability Test
Name: _____________________
Time permitted: 60 mins
Instructions
Answer all questions in the spaces provided. No CAS allowed. A single bound reference is permitted. Exact answers are required, unless otherwise stated. In questions where more than one mark is available, appropriate working must be shown. Multiple choice questions are each worth one mark.
Formulae:
( ) ( )Pr 1 PrA A′= −
( ) ( )( )
PrPr |
PrA B
A BB∩
=
( ) ( ) ( ) ( )Pr Pr Pr PrA B A B A B∪ = + − ∩
Mark: _____ /45

2
Section A Multiple Choice Questions 10 marks Circle the letter corresponding to the correct response. 1. Given a standard deck of 52 playing cards, what is the probability that a single card drawn is an Ace or a Queen?
A. 2
52
B. 1
13
C. 2
13
D. 20%
E. 4
52
2. Max tosses a fair coin 23 time’s and records their results as follows: Heads: 11 Tails: 12 Using their results, what is the probability that on the next toss they get an outcome of Tails?
A. 12
B. 1123
C. 50%
D. 1223
E. 51%
3. A 24 sided dice is rolled. The set of outcomes being an odd number is A. {1,2,3,4,5,6,7,8,9,10,11,12,13,14,15,16,17,18,19,20,21,22,23,24} B. {2,4,6,8,10,12,14,16,18,20,22,24} C. {3,7,9,11,13,15,17,19,21,23} D. {1,5,7,9,11,13,17,19,21,23} E. {1,3,5,7,9,11,13,15,17,19,21,23}
3
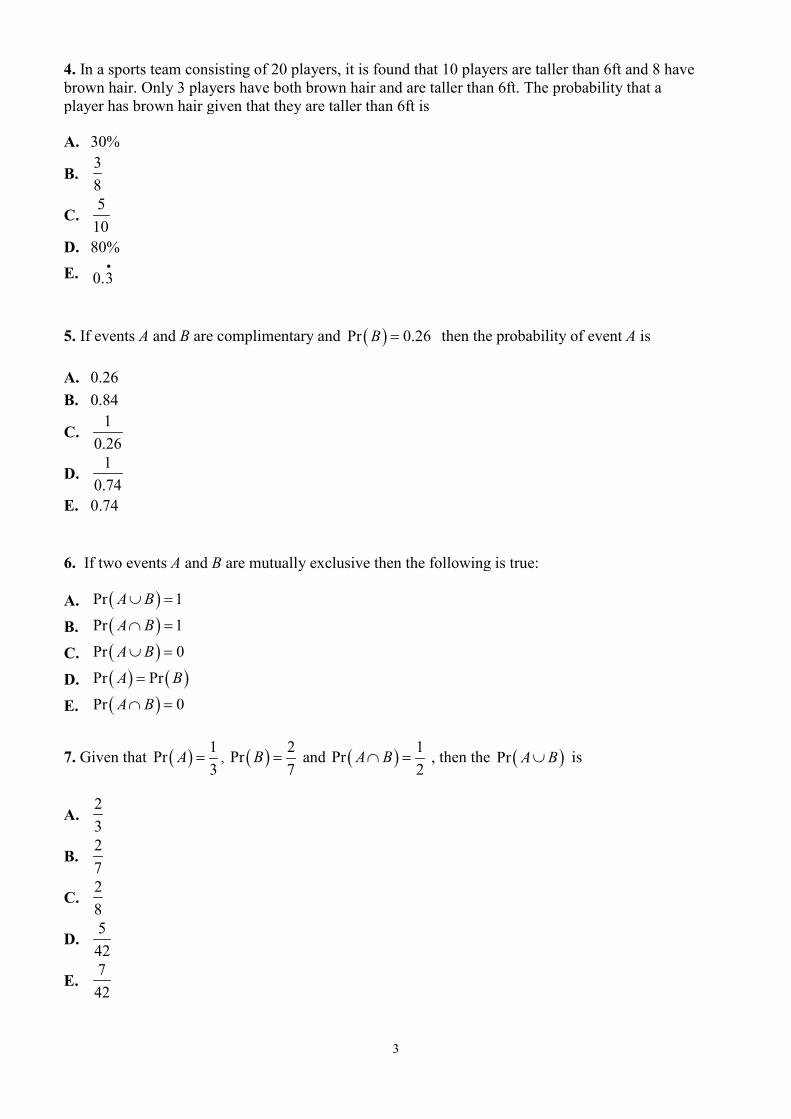
4. In a sports team consisting of 20 players, it is found that 10 players are taller than 6ft and 8 have brown hair. Only 3 players have both brown hair and are taller than 6ft. The probability that a player has brown hair given that they are taller than 6ft is A. 30%
B. 38
C. 5
10
D. 80% E. 0.3
•
5. If events A and B are complimentary and ( )Pr 0.26B = then the probability of event A is A. 0.26 B. 0.84
C. 1
0.26
D. 1
0.74
E. 0.74
6. If two events A and B are mutually exclusive then the following is true: A. ( )Pr 1A B∪ =
B. ( )Pr 1A B∩ =
C. ( )Pr 0A B∪ =
D. ( ) ( )Pr PrA B=
E. ( )Pr 0A B∩ =
7. Given that ( ) 1Pr3
A = , ( ) 2Pr7
B = and ( ) 1Pr2
A B∩ = , then the ( )Pr A B∪ is
A. 23
B. 27
C. 28
D. 542
E. 742

4
8. Events A and B are independent events if A. ( ) ( )Pr PrA B=
B. ( ) ( )Pr PrA B≠
C. ( ) ( ) ( )Pr Pr Pr |A B A B+ =
D. ( ) ( )Pr | PrA B B=
E. ( ) ( )Pr | PrA B A=
The Venn diagram given below is used for Question 9 and Question 10 of multiple choice.
9. The ( )Pr A B′ ′∪ is
A. 3740
B. 3040
C. 2840
D. 2140
E. 340
10. The probability that it is neither A only, nor B only as a percentage is A. 60% B. 40% C. 0% D. 80% E. 52%
5
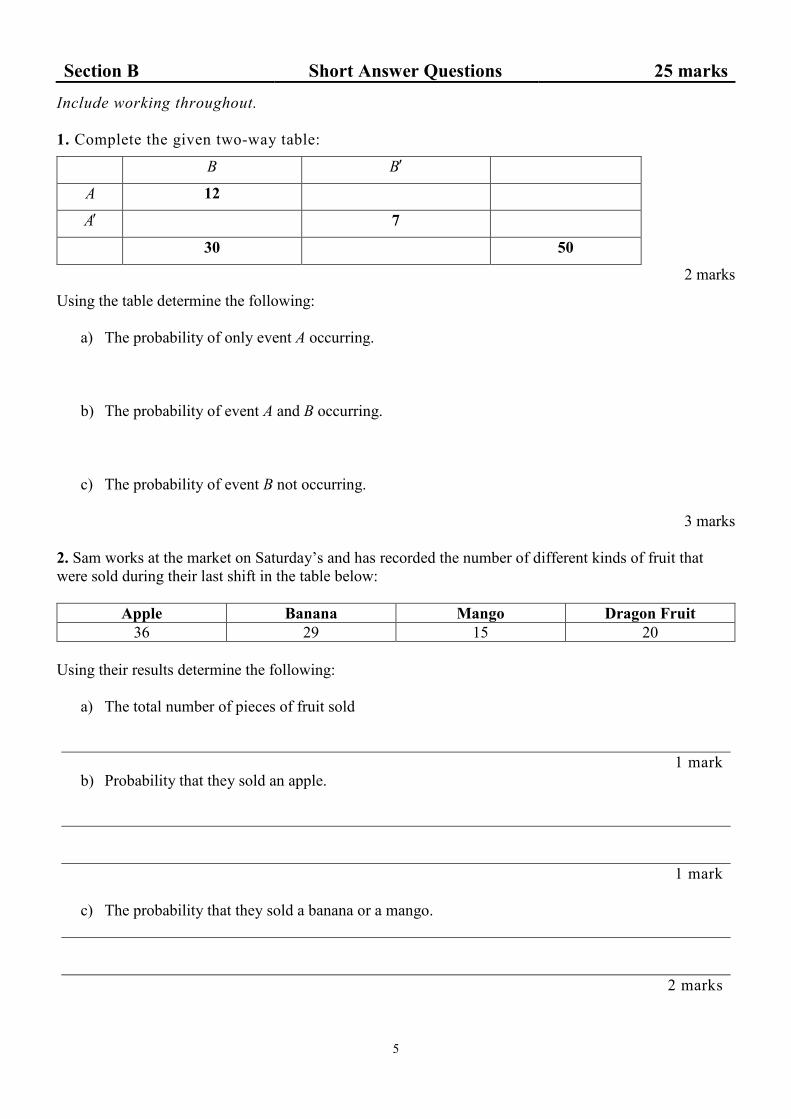
Section B Short Answer Questions 25 marks
Include working throughout. 1. Complete the given two-way table:
B B′
A 12
A′ 7
30 50
2 marks Using the table determine the following:
a) The probability of only event A occurring.
b) The probability of event A and B occurring.
c) The probability of event B not occurring.
3 marks
2. Sam works at the market on Saturday’s and has recorded the number of different kinds of fruit that were sold during their last shift in the table below:
Apple Banana Mango Dragon Fruit 36 29 15 20
Using their results determine the following:
a) The total number of pieces of fruit sold
1 mark b) Probability that they sold an apple.
1 mark
c) The probability that they sold a banana or a mango.
2 marks

6
If 500 people walk through the stall on the next Saturday to buy fruit, and using Sam’s data from the previous Saturday, how many of them can be expected to buy:
a) A Dragon Fruit?
1 mark
b) An apple or a banana?
1 mark 3. The letter’s for the word ACORN are written on a set of cards. A card is drawn from the set and not replaced. Another card is then drawn from the set.
a) List the set of possible outcomes in the table below: First card drawn
Second card
drawn
A C O R N A
C
O
R
N
2 marks
Determine the probability that:
a) R is drawn.
1 mark b) C or O are drawn.
1 mark c) R and N are drawn.
1 mark d) O then R is drawn.
1 mark

7
4. If A and B are events such that Pr(A) = 0.56, Pr(B′) = 0.83 and Pr(A ∩ B) = 0.15, find:
(a) Pr(A′ ∩ B′)
space for a possible diagram
2 marks (b) Pr(A′ ∩ B)
1 mark 5. You are given the following set of numbers {1,2,3,4,5,6,7,8,9,10,11}S =
a) List the set P for the prime numbers from the set of S.
1 mark b) List the set O for the odd numbers from the set of S.
1 mark c) Draw a Venn diagram for the events P and O for the set of S.
3 marks

8
Section C Extended Response Question 10 marks In year 10 there are 150 lockers and 30 of them are missing their locks. Mr Wever is annoyed that there are lockers without locks on them and walks past 3 of these lockers on his way to his office when arriving at school one morning.
a) Determine the probability that a locker does have a lock on it.
1 mark b) Out of a class of 20 students, how many can be expected to have a lock on their locker?
2 marks
Mr Wever tries to guess who in the year level the three lockers without their locks on belong to.
c) Determine the probability that his first guess is correct.
1 mark d) Determine the probability that his second guess is also correct.
2 marks

9
Mr Wever makes 3 guesses. Draw a Tree diagram below to summarise the probabilities of his 3 guesses being correct or not.
2 marks
e) Provide a suitable equation that would determine the probability that at least 1 of Mr Wever’s guesses were correct. (you do not need to give an exact answer).
2 marks BONUS QUESTION Determine the exact value of the answer to e) above.
1 mark
END OF TEST

1
10A Mathematics
Linear Relations Test Part A
Name: _____________________
Time permitted: 30 mins
Instructions
No notes or calculator are allowed.
Answer all questions in the spaces provided.
Exact answers are required.
In questions where more than one mark is available, appropriate working must be shown.
1. Solve the following equations.
(a) 6−𝑥 = 3𝑥 + 2
(b) 4(3𝑥 − 1) = 4 − 6(5 − 𝑥)
1 mark 2 marks
(c) 6−2𝑥
3= 0
(d) 3𝑥
2+
𝑥
4= 6
2 marks 2 marks
Mark: _____ /30

2
2. Solve the following inequalities.
(a) −3𝑥 + 1 ≥ 16
(b) 3−2𝑥
5≤
5𝑥−1
2
2 marks 3 marks
3. Sketch the following graphs on the axes provided, clearly labelling intercepts.
(a) 𝑦 = 4𝑥 + 1
2 marks
(b) 2𝑥 + 3𝑦 = 3
2 marks
x
y
x
y

3
4. A rectangular block of land is such that its length is 20 m less than double its width.
(a) Define a single variable for this problem and label the width and length of the block of land in terms
of that variable.
1 mark
The perimeter of the block of land is 140 m.
(b) Write an equation involving the perimeter and the dimensions of the block of land. You do not need to
simplify it here.
1 mark
(c) Simplify and solve your equation from part (b) to determine the dimensions of the block of land.
Answer in words.
2 marks
5. (a) Solve the pair of simultaneous equations 𝑥 = 3𝑦 − 2 and 7𝑦 − 2𝑥 = 8 using substitution.
3 marks
4
(b) Solve the pair of simultaneous equations 4𝑥 − 3𝑦 = 0 and 3𝑥 + 4𝑦 = 25 using the elimination
method.
3 marks
6. The sum of two numbers is 1128 and their difference is 72. Letting a be the value of one number and b
the value of the second number, write down a pair of simultaneous equations and solve them to find both
numbers.
4 marks
END OF PART A

1
10A Mathematics Linear Relations Test Part B
Name: _____________________
Time permitted: 30 mins
Instructions
CAS calculator and summary book permitted. Answer all questions in the spaces provided. Exact answers are required unless otherwise specified. In questions where more than one mark is available, appropriate working must be shown. Multiple choice questions are each worth one mark.
Section A Multiple Choice Questions 10 marks
Circle the letter corresponding to the correct response. 1. The equation of a linear graph with a gradient of −3 and y-intercept of 5 is: A. 3 15y x= − + B. 3 5y x= − + C. 3 5y x= − D. 5 3y x= − − E. 5 15y x= − −
2. The fully simplified form of 2 2
x yy x−−
is:
A. It cannot be simplified
B. x yy x−−
C. 12
D. 2
E. 12
−
Mark: _____ /20

2
3. The equation of the linear graph with x-intercept = −4 and y-intercept = 4 is: A. 2 4y x= − + B. 4 4y x= − +
C. 1 42
y x= − +
D. 4y x= + E. 2 4y x= +
4. The distance between the two points (1, −5) and (3, −8) is: A. 173 B. 29 C. 13 D. 53 E. 13
5. If the midpoint of the line segment joining the points P(4, 4) and Q(x, y) has the coordinates (2, 5), then the coordinates of Q are: A. (1, 7) B. (−2.5, −4) C. (−0.5, −1) D. (−1, −7) E. (0, 6)
6. The gradient of the line parallel to the line with equation 2 3 8 0x y− + − = is:
A. 23
B. 32
C. 32
−
D. 2 E. −3
7. The line that passes through (1, 3) and (−2, −3) also passes through: A. (1, 0)
B. 1 1,12 2
−
C. (2, 5) D. (−5, 2) E. (13, 8)

3
8. Which point is not on the line with rule 2 5 2x y+ = ?
A. 20,5
B. (−4, 2) C. (1, 0) D. (6, −2) E. (8, −4)
9. The solution to the simultaneous equations 4 6 2x y− = − and 4 6y x= + is: A. (−1.7, −0.8) B. (−2, 6) C. (−3, −2) D. (3, −2) E. (2, 7)
10. The rule for a horizontal line passing through the point (3, 5) is: A. 5 3y x= − + B. 3y = C. 5y = D. 5x = E. 3x =
Section B Extended Response Question 10 marks
Include working throughout.
Ships A and B are in the open ocean. As a reference point in the ocean a buoy (floating device) is given the coordinates (0, 0). With respect to the buoy the coordinates of ships A and B are respectively (8, 4) and (−4, −5). Each whole number represents 1 km, so the point (0, 5) is 5 km away from the buoy.
(a) Sketch the positions of ships A and B on the Cartesian plane and find the equation of the line that joins A and B.
3 marks

4
Recall, ship that A has coordinates (8, 4) and ship B has coordinates (−4, −5). (b) Find the distance between the two ships, A and B, giving your answer in exact form in kilometres.
2 marks (c) Show that the coordinates of the midpoint between ships A and B are (2,− 1
2).
2 marks (d) Using the midpoint from part (c), determine the equation of the line perpendicular to the line AB and passing through the midpoint of AB.
3 marks
END OF PART B

10A Mathematics Measurement Test Technology Free
Name: _____________________
Time permitted: 35 mins
Instructions
No notes or calculators are permitted. A formula sheet is provided. Answer all questions in the spaces provided. Exact answers are required unless otherwise specified. In questions where more than one mark is available, appropriate working must be shown.
1. Find the area of the shaded region in the shape below, giving your answer in terms of 𝜋𝜋.
2 marks
Mark: _____ /30

2. Simplify each of the following:
(a) √2(3 + �5)
(b) 4√7 + 2√5 − √7 + 3√5
1 mark 2 marks
(c) √45 + √20
(d) √18 × √3
2 marks 2 marks
3. Calculate the value of the pronumeral for each of the following, simplifying any surds where necessary:
(a)
(b)
3 marks 2 marks
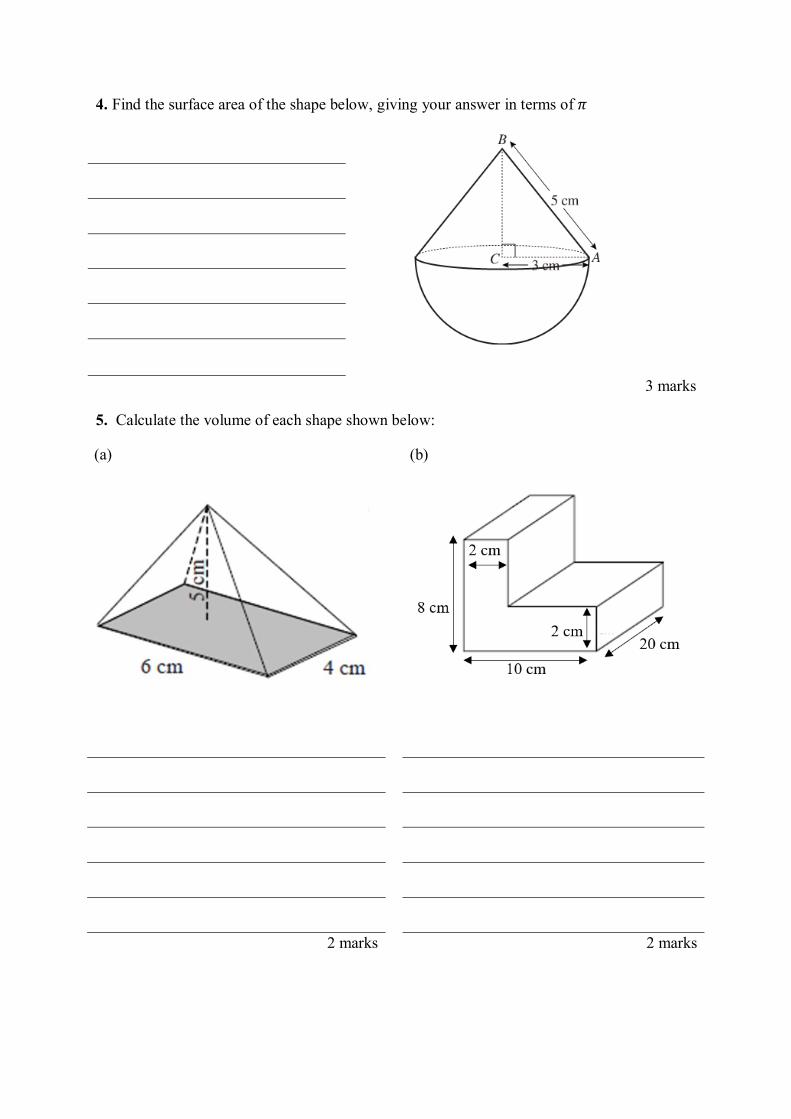
4. Find the surface area of the shape below, giving your answer in terms of 𝜋𝜋
3 marks
5. Calculate the volume of each shape shown below:
(a)
(b)
2 marks 2 marks

6. A cylinder has a volume of 810𝜋𝜋 cm3. If it has a height of 10 cm, calculate its radius.
3 marks
7. Rewrite √103√2
as a fraction with a rational denominator.
2 marks
8. Pencils are stored in a rectangular box as shown below. Find the length of the longest pencil that will fit in this box.
4 marks
END OF TEST

1
10A Mathematics Measurement Test Technology Active
Name: _____________________
Time permitted: 30 mins
Instructions
CAS calculator and summary book permitted. Answer all questions in the spaces provided. Exact answers are required unless otherwise specified. In questions where more than one mark is available, appropriate working must be shown. Multiple choice questions are each worth one mark.
Section A Multiple Choice Questions 10 marks
Circle the letter corresponding to the correct response. 1. The surface area of a cube with side length 5 m is: A. 100 m2
B. 125 m2 C. 150 m2 D. 225 m2 E. 215 m2
2. The volume of a prism if the area of the cross-section is 87 m2 and the perpendicular height is 11 m is: A. 191.4 m3 B. 696 m3 C. 957 m3 D. 4785 m3 E. 898 m3
Mark: _____ /20

2
3. A rectangular bath with dimensions of length 50 cm, width 330 mm and height 15 cm has a capacity of: A. 2475 mL B. 0.025 L C. 25000 mL D. 2.475 L E. 24700 mL
4. Which one of the following is equivalent to 2√7: A. 28
B. √28√4
C. √84√3
D. √7√14
E. √14√2
5. The shaded area of the diagram is closest to: A. 38 cm2 B. 93 cm2 C. 154 cm2 D. 374 cm2 E. 136 cm2
6. The area of an equilateral triangle with side lengths of 6 mm is: A. 18 mm2 B. 36 mm2 C. 6√27 mm2 D. 15 mm2 E. 9√3 mm2

3
7. An area of 10 m2 is equivalent to: A. 1000 cm2 B. 10 000 mm2 C. 0.01 km2 D. 10 000 000 mm2 E. 0.1 km2
8. A sphere with a volume of 53243π has a radius of:
A. 9 B. 13 C. 11 D. 12 E. 10
9. Which of the following is closest to the curved surface area of a cylinder with radius 14 cm and height of 20 cm? A. 1239 cm2 B. 1759 cm2 C. 2991 cm2 D. 3520 cm2 E. 1861 cm2
10. A cone has a perpendicular height of 15 cm and a radius of 7 cm. The curved surface area of this cone is closest to: A. 2548.13 cm2 B. 2042.22 cm2 C. 364.02 cm2 D. 291.75 cm2 E. 329.87 cm2

4
Section B Extended Response Question 10 marks Include working throughout.
Obelisks were originally erected at the entrance to ancient Egyptian temples. Cleopatra’s Needle (depicted in the diagram below) can be found in Paris. Obelisks are designed with a square based pyramid for the cap (the top of the obelisk). This is then placed onto a section of another square based pyramid with a much steeper slant angle to make the lower part of the obelisk (the pillar).
Mr Davis wants to erect an obelisk at St Leonard’s College. This obelisk will have a pyramid shaped cap with a square base of side length 50 cm and a perpendicular height of 40 cm. The obelisk is to be made using concrete.
Question 1
a) Determine the volume of concrete required to create the cap.
Round your answer to the nearest cm3.
1 mark
b) The cap will be painted in gold paint. Determine the total surface area that will need to be painted.
3 marks

5
The total height of the obelisk needs to be 8m with a square base of side length 1m.
c) Determine the height of the of the section of pyramid beneath the cap (the pillar).
1 mark
The pillar (lower part of the obelisk) is made from a section of a larger pyramid as shown:
d) The perpendicular height of the original pyramid used to make the pillar of the St Leonard’s College obelisk was 1520 cm. Calculate the volume of the concrete required for the pillar, rounding your answer to the nearest cm3.
3 marks

6
e) Concrete costs $88 per m3. Determine the cost of the concrete for the entire obelisk to the nearest dollar.
2 marks
END OF TEST