yellowstone grizzly bear investigations · 2019-04-09 · table 1. grizzly bears captured in the...
TRANSCRIPT
Yellowstone Grizzly Bear Investigations
2000
Annual Report of the Interagency Grizzly Bear Study

Data contained in this report are preliminary and subject to change. Please obtain permission prior to citation. To give credit to authors, please cite the section within this report as a chapter in a book. Below is an example: Haroldson, M. A., and K. Frey. 2001. Grizzly bear mortalities. Pages 24-29 in C. C.
Schwartz and M. A. Haroldson, editors. Yellowstone grizzly bear investigations: annual report of the Interagency Grizzly Bear Study Team, 2000. U.S. Geological Survey, Bozeman, MT.

YELLOWSTONE GRIZZLY BEAR INVESTIGATIONS
Report of the Interagency Study Team
2000
U.S. Geological Survey Wyoming Game and Fish Department
U.S. Fish and Wildlife Service Montana Fish, Wildlife and Parks Department
U.S. Forest Service Idaho Fish and Game Department
Charles C. Schwartz and Mark A. Haroldson, Editors
You may cite the information printed in this document. Please understand that some materials are preliminary and may change. Please give authors credit.
U.S. Department of the Interior U.S. Geological Survey
November 2001

i
TABLE OF CONTENTS INTRODUCTION ........................................................................................................... 1 BEAR MONITORING AND POPULATION TREND.................................................. 3 Marked Animals................................................................................................... 3 Unduplicated Females.......................................................................................... 11 Occupancy of Bear Management Units by Females with Young........................ 15 Observation Flights.............................................................................................. 16 Telemetry Flights ................................................................................................. 20 Grizzly Bear Mortalities ...................................................................................... 24 Annual Home Range Sizes and Movements........................................................ 30 KEY FOODS MONITORING ........................................................................................ 33 Spring Ungulate Availability and Use by Grizzly Bears ..................................... 33 Spawning Cutthroat Trout Numbers.................................................................... 37 Grizzly Bear Use of Insect Aggregation Sites ..................................................... 44 Ecological Relationship Between Grizzly Bears and Army Cutworm Moths..... 48 Whitebark Pine Cone Production......................................................................... 52 HABITAT MONITORING ............................................................................................. 56 Yellowstone National Park Recreational Use...................................................... 56 Grand Teton National Park Recreation Use......................................................... 57 Effects of Environmental Variability on Grizzly Bear Habitat Use .................... 58 Trends in Elk Hunter Numbers ............................................................................ 62 GRIZZLY BEAR-HUMAN CONFLICTS, CONFRONTATIONS, AND MANAGEMENT ACTIONS, 2000 ................................................................................ 64 Table of Contents................................................................................................. 65 List of Tables ....................................................................................................... 66 List of Figures ...................................................................................................... 68 Introduction.......................................................................................................... 69 Acknowledgments................................................................................................ 69 Methods................................................................................................................ 71 Results.................................................................................................................. 71 2000 Agency Summaries ..................................................................................... 97 Discussion............................................................................................................106 LITERATURE CITED ....................................................................................................110 APPENDICIES Appendix A. Memorandum on Inclusion of �Probable� Grizzly Bear Mortalities in Calculation of Mortality Thresholds ........................................119 Appendix B. Feasibility of Using Portable Electric Fencing to Prevent Damage to Livestock and Apiaries by Bears and Other Predators ...............................................................................................122

1
INTRODUCTION (Charles C. Schwartz, Interagency Grizzly Bear Study Team; and David S. Moody, Wyoming Game and Fish Department) History and Purpose of the Study Team It was recognized as early as 1973, that in order to understand the dynamics of grizzly bears (Ursus arctos horribilis) throughout the Greater Yellowstone Ecosystem (GYE), there was a need for a centralized research group responsible for collecting, managing, analyzing, and distributing information. To meet this need, agencies formed the Interagency Grizzly Bear Study Team (IGBST), a cooperative effort among the U.S. Geological Survey, National Park Service, U.S. Forest Service, U.S. Fish and Wildlife Service (USFWS), and the States of Idaho, Montana, and Wyoming. The responsibilities of the IGBST are to: (1) conduct both short and long-term research projects addressing information needs for bear management, (2) monitor the bear population, including status and trend, numbers, reproduction, and mortality, (3) monitor grizzly bear habitats, foods, and impacts of humans, and (4) provide technical support to agencies and other groups responsible for the immediate and long-term management of grizzly bears in the GYE. Quantitative data on grizzly bear abundance, distribution, survival, mortality, nuisance activity, and bear foods are critical to formulating management strategies and decisions. Moreover, this information is necessary to evaluating the recovery process. The IGBST coordinates data collection and analysis on an ecosystem scale, prevents overlap of effort, and pools limited economic and personnel resources. Visit our web site (http://www.nrmsc.usgs.gov/research/igbst-home.htm) for additional details. Previous Research Some of the earliest research on grizzlies within Yellowstone National Park was conducted by the Craigheads. The book �The grizzly bears of Yellowstone� provides a detailed summary of this early research (Craighead et al. 1995). With the closing of open-pit garbage dumps and cessation of the ungulate reduction program in Yellowstone National Park in 1967, bear demographics (Knight and Eberhardt 1985), food habits (Mattson et al. 1991a), and growth patterns (Blanchard 1987) for grizzly bears changed. Since 1975, the IGBST has produced an annual report and numerous scientific publications summarizing monitoring and research efforts within the GYE (see web site for a complete list). As a result, we know much about the distribution of grizzly bears within the GYE (Basile 1982, Blanchard et al. 1992), movement patterns (Blanchard and Knight 1991), food habits (Mattson et al. 1991a), habitat use (Knight et al. 1984), and population dynamics (Knight and Eberhardt 1985, Eberhardt et al. 1994, Eberhardt 1995). Nevertheless, monitoring and updating continue so that status can be reevaluated annually.

2
This Report The contents of this Annual Report summarize results of monitoring and research conducted during the 2000 field season. Additionally, the report contains a summary of nuisance grizzly bear management actions and habitat monitoring requirements detailed in the Draft Conservation Strategy (USFWS 2000). This report truly represents a �study team� approach. Many individuals contributed either directly or indirectly to its preparation. To that end, we have identified author(s). We also wish to thank Chad Dickinson, Craig Whitman, Mark Biel, Dan Reinhart, Travis Wyman, Jason Hicks, Jeremiah Smith, Maureen Hartmann, Rick Swanker, Hillary Robison, Kurt Alt, Keith Aune, Kevin Frey, Neil Anderson, Mark Bruscino, Brian DeBolt, Craig Sax, Gary Brown, John Emmerich, Larry Roop, Tim Fagan, Jerry Longobardi, Duke Early, Dennis Almquist, Doug McWhirter, Cole Thompson, Bill Long, Doug Crawford, Steve Cain, Wendy Clark, Sue Consolo Murphy, Bonnie Gafney, Kerry Gunther, Kerry Murphy, Tom Olliff, Dave Price, Doug Smith, Peter Gogan, Jeff Copeland, Kim Barber, Mark Hinschberger, Brian Aber, Adrian Villaruz, Connie King, Bill Chapman, Doug Chapman, Rich Hyatt, Gary Lust, Stan Monger, Jerry Spencer, Dave Stradley, Roger Stradley, Randy Arment, Sheldon Rasmussen, Claude Tyrrel, Kim Keating, Casey Hunter, Merril Nelson, Jed Edwards, and Steve Cherry for their contributions to data collection, analysis, and other phases of the study. Without the collection efforts of many, the information contained within this report would not be available. The annual reports of the IGBST summarize annual data collection. Because additional information can be obtained after publication, data summaries are subject to change. For that reason, data analyses and summaries presented in this report supersede all previously published data. The study area and sampling techniques are reported by Blanchard (1985), Mattson et al. (1991a), and Haroldson et al. (1998).

3
RESULTS AND DISCUSSION Bear Monitoring and Population Trend Marked Animals (Mark Haroldson, Interagency Grizzly Bear Study Team; and Ron Grogan, Wyoming Game and Fish Department) During the 2000 field season, 54 individual grizzly bears were captured and handled on 65 occasions (Table 1), including 26 females (17 adult) and 28 males (11 adult). Thirty-two individuals were new bears not previously marked. We conducted research trapping efforts for 828 trap days (1 trap day = 1 trap set for 1 day) in 14 Bear Management Units (BMUs) within the Grizzly Bear Recovery Zone (USFWS 1993) or their respective 10-mile outer perimeter area (Figure 1). We captured 30 individual grizzly bears 38 times for a trapping success rate of 1 capture every 21.7 trap days. There were 27 management captures of 24 individual bears in the GYE during 2000 (Tables 1 and 2). Seven were captured in management trapping efforts and release on site because they were non-target individuals. Adult female #365 was captured in response to cattle depredation but was released on-site because her 2 cubs-of-the-year (COY) were not captured within 24 hours. In a separate management incident, 2 cubs were released on-site when their mother could not be captured within 24 hours. These cubs (G68 and G69) were captured again 12 days later and their mother, #249, was successfully trapped within 24 hours. As female #249 had several previous management actions for nuisance activity in developed areas, all 3 bears were removed from the population (live removal). Two additional male bears were captured and removed from the population. Bear #353, a subadult male, was captured and relocated during May for numerous nuisance activities in and around West Yellowstone. Bear #353 returned to the vicinity of West Yellowstone during July, and because of continued nuisance activity, was subsequently recaptured and removed from the population. Bear #212 was an adult male that had been involved in numerous livestock depredations. He was captured in response to cattle depredation and removed during October. An additional 11 bears, including 2 females with 3 cubs, were captured during management trapping efforts and relocated within the GYE during 2000. Specific information pertaining to these management actions can be found in the �Conflicts� section of this report. We radio-monitored 84 grizzly bears during the 2000 field season, including 28 adult females (Tables 2 and 3). Sixty grizzly bears entered their winter dens wearing active transmitters in the GYE. Since 1975, 374 individual grizzly bears have been radio-marked.

4
Table 1. Grizzly bears captured in the Greater Yellowstone Ecosystem during 2000. Bear Sex Age Date General locationa Capture type Release site Trapper/Handlerb
166 F Adult 4/28 Spread Cr, GTNP Research On site GTNP/WYGF 292 M Adult 5/3 Pacific Cr, GTNP Research On site IGBST/GTNP 7/23 Spread Cr, BTNF Research On site WYGF 350 F Yearling 5/10 Spread Cr, GTNP Research On site IGBST/GTNP 343 M Subadult 5/10 Pacific Cr, GTNP Research On site IGBST/GTNP 351 F Adult 5/11 Francs Fork, SNF Research On site WYGF 291 M Adult 5/11 Francs Fork, SNF Research On site WYGF 80 M Adult 5/11 Pilgrim Cr, GTNP Research On site IGBST/GTNP 352 M Subadult 5/13 Timber Cr, SNF Research On site WYGF 5/16 Dick Cr, SNF Research On site WYGF 353 M Subadult 5/31 Madison River, Pr-MT Management Tepee Cr, GNF MTFWP/IGBST 7/14 Madison River, GNF Management Removed MTFWP 354 M Adult 6/14 Eldridge Cr, GNF Research On site IGBST 355 M Subadult 6/16 Eldridge Cr, GNF Research On site IGBST 201 M Adult 6/16 Flat Mountain Cr, YNP Research On site IGBST 356 M Adult 6/16 Cartridge Cr, SNF Research On site WYGF 357 F Subadult 6/16 Brent Cr, SNF Research On site WYGF 358 F Subadult 6/21 Cartridge Cr, SNF Research On site WYGF 6/29 Horse Cr, SNF Research On site WYGF 303 F Adult 6/21 Long Cr, SNF Research On site WYGF 359 M Adult 6/26 Long Cr, SNF Research On site WYGF 305 F Subadult 6/27 Cartridge Cr, SNF Research On site WYGF 360 F Subadult 7/2 Deadhorse Cr, , GNF Research On site IGBST 349 F Adult 7/2 Gibbon River, YNP Research On site IGBST 7/17 Gibbon River, YNP Research On site IGBST 211 M Adult 7/3 Cascade Crk, YNP Research On site IGBST 9/11 Antelope Cr, YNP Research On site IGBST 361 M Yearling 7/6 Grinnell Cr, SNF Management Robinson Cr, SNF WYGF 362 M Yearling 7/6 Grinnell Cr, SNF Management Robinson Cr, SNF WYGF 267 F Adult 7/9 Six Mile Cr, SNF Management On site WYGF G67 F Yearling 7/14 S Fork Spread Cr, BTNF Research On site WYGF 179 F Adult 7/15 Grizzly Cr, BTNF Research On site WYGF 281 M Adult 7/15 Cascade Cr, YNP Research On site IGBST 10/10 Gibbon River, YNP Research On site IGBST 10/11 Gibbon River, YNP Research On site IGBST 363 M Subadult 7/16 Blackrock Cr, BTNF Research On site WYGF 364 F Subadult 7/16 Blackrock Cr, BTNF Research On site WYGF

5
Table 1. Continued. Bear Sex Age Date General locationa Capture type Release site Trapper/Handlerb
196 F Adult 7/17 Cascade Cr, YNP Research On site IGBST 365 F Adult 7/30 Gilbert Cr, SNF Management On site WYGF 366 F Adult 7/31 Blackrock Cr, BTNF Research On site WYGF 327 F Adult 8/15 E Fork Belknap Cr, SNF Management On site WYGF 367 F Adult 8/21 Meeteetse Cr, SNF Management On site WYGF 348 M Adult 8/23 Meeteetse Cr, SNF Management On site WYGF 125 F Adult 8/27 Antelope Cr, YNP Research On site IGBST 368 M Subadult 9/1 Brent Cr, SNF Management On site WYGF 369 M Adult 9/2 Sage Cr, Pr-WY Management On site WYGF G68 M Cub 9/2 Carter Cr, Pr-WY Management On site WYGF 9/14 Carter Cr, Pr-WY Management Removal WYGF G69 F Cub 9/2 Carter Cr, Pr-WY Management On site WYGF 9/14 Carter Cr, Pr-WY Management Removal WYGF 308 F Adult 9/6 Brent Cr, SNF Management On site WYGF 370 F Adult 9/10 Jasper Cr, YNP Research On site IGBST 135 F Adult 9/10 N Fork Shoshone, Pr-WY Management Buffalo Plateau, SNF WYGF 371 F Cub 9/10 N Fork Shoshone, Pr-WY Management Buffalo Plateau, SNF WYGF 249 F Adult 9/15 Carter Cr, Pr-WY Management Removal WYGF 372 M Subadult 9/19 N Fork Shoshone, Pr-WY Management Wind River, SNF WYGF 373 M Subadult 9/22 Outlet Cr, TNF Research On site IGBST 10/7 Outlet Cr, TNF Research On site IGBST 374 M Subadult 9/26 S Fork Shoshone, Pr-WY Management Sunlight Cr, SNF WYGF 234 F Adult 9/29 S Fork Shoshone, Pr-WY Management Parque Cr, SNF WYGF G70 M Cub 9/29 S Fork Shoshone, Pr-WY Management Parque Cr, SNF WYGF G71 M Cub 9/29 S Fork Shoshone, Pr-WY Management Parque Cr, SNF WYGF 375 M Adult 10/3 Whit Cr, Pr-WY Management Wood River, SNF WYGF 212 M Adult 10/3 S Fork Sage Cr, SNF Management Removal WYGF 376 M Subadult 10/21 June Cr, Pr-WY Management Togwotee Cr, BNTF WYGF a BTNF = Bridger-Teton National Forest, GNF = Gallatin National Forest, GTNP = Grand Teton National Park, SNF = Shoshone National Forest, TNF = Targhee National Forest, YNP = Yellowstone National Park, Pr = private. b IGBST = Interagency Grizzly Bear Study Team, USGS; MTFWP = Montana Fish, Wildlife and Parks; WS = Wildlife Services/APHIS; WYGF = Wyoming Game and Fish.

6
Figure 1. Bear Management Units in the Greater Yellowstone Ecosysteresearch trapping efforts were conducted during 2000 (a) and within the
0 years 1 year 2 years 3 years
Years trapped 1998-2000
(a)
(b)
0 years 1 year 2 years 3 years
Years trapped 1998-2000
Research trapping 2000
Not trapped Trapped
m in which last 3 years (b).

7
Table 2. Annual record of grizzly bears monitored, captured, and transported in the Greater Yellowstone Ecosystem since 1980. Total captures Year
Number monitored
Individuals trapped Research Management Transports
1980 34 28 32 0 0
1981 43 36 30 35 31
1982 46 30 27 25 17
1983 26 14 0 18 13
1984 35 33 20 22 16
1985 21 4 0 5 2
1986 29 36 19 31 19
1987 30 21 15 10 8
1988 46 36 23 21 15
1989 40 15 14 3 3
1990 35 15 4 13 9
1991 42 27 28 3 4
1992 41 16 15 1 0
1993 43 21 13 8 6
1994 60 43 23 31 28
1995 71 39 26 28 22
1996 76 36 25 15 10
1997 70 24 20 8 6
1998 58 35 32 8 5
1999 65 42 31 16 13
2000 84 54 38 27 12

8
Table 3. Grizzly bears radio monitored in the Greater Yellowstone Ecosystem during 2000. Monitored Bear Sex Age Offspringa
Out ofden
Into den
Current status Transported
80 M Adult No No Cast No 125 F Adult No young No Yes Active No 128 F Adult No young Yes Yes Active No 135 F Adult 1 COY (371) No Yes Active Yes 166 F Adult No young No Yes Active No 179 F Adult Unknown (not observed) No Yes Active No 185 M Adult Yes No Missing No 196 F Adult No young No Yes Active No 201 M Adult No Yes Active No 211 M Adult No Yes Active No 212 M Adult Yes No Removed No 213 F Adult 3 COY, lost 1 No Yes Active No 224 M Adult Yes No Cast No 234 F Adult 2 COY No Yes Active Yes 267 F Adult No young No Yes Active No 270 F Adult 2 2-year-olds Yes Yes Active No 281 M Adult No Yes Active No 287 M Adult Yes Yes Active No 289 F Adult 2 COY Yes No Battery failure No 290 M Adult No Yes Active No 291 M Adult Yes Yes Active No 292 M Adult Yes Yes Active No 295 F Adult 2 COY Yes Yes Active No 296 F Adult Unknown (not observed) Yes No Cast No 298 F Adult 2 yearlings Yes No Battery failure No 303 F Adult No young No Yes Active No 305 F Subadult No young No Yes Active No 308 F Adult 1 yearling, lost Yes Yes Active No 309 M Adult Yes No Battery failure No 312 M Subadult Yes No Dead No 313 M Adult Yes Yes Active No 315 F Subadult No young Yes No Battery failure No 316 F Adult 2 yearlings/separated bred Yes No Dead No 317 M Adult No No Dead No 320 M Adult No Yes Active No 321 F Adult 2 COY No Yes Active No

9
Table 3. Continued. Monitored Bear Sex Age Offspringa
Out of den
Into den
Current status Transported
322 F Subadult Unknown (not observed) Yes No Cast No 325 F Adult 2 COY Yes Yes Active No 327 F Adult 2 COY, lost 1 Yes Yes Active No 328 M Adult Yes No Missing No 329 M Adult No Yes Active No 330 M Adult No No Cast No 333 M Subadult Yes No Cast No 334 F Subadult No young Yes Yes Active No 336 M Adult Yes No Unresolvedb No 338 M Adult No Yes Active No 339 M Adult Yes Yes Active No 340 M Subadult Yes Yes Active No 341 M Adult No No Cast No 342 F Adult 2 COY No Yes Active No 343 M Subadult No No Missing No 344 M Subadult Yes No Cast No 345 M Adult Yes No Cast No 346 F Adult 2 COY, lost both Yes Yes Active No 347 M Adult Yes No Cast No 348 M Adult Yes Yes Active No 349 F Adult No young Yes Yes Active No 350 F Subadult No young No Yes Active No 351 F Adult No young No Yes Active No 352 M Subadult No Yes Active No 353 M Subadult No No Removed Yes 354 M Adult No Yes Active No 355 M Subadult No Yes Active No 356 M Adult No Yes Active No 357 F Subadult No young No Yes Active No 358 F Subadult No young No Yes Active No 359 M Adult No Yes Active No 360 F Subadult No young No Yes Active No 361 M Subadult No Yes Active Yes 362 M Subadult No Yes Active Yes 363 M Subadult No Yes Active No 364 F Subadult No young No Yes Active No

10
Table 3. Continued. Monitored Bear Sex Age Offspringa
Out of den
Into den
Current status Transported
365 F Adult 2 COY No Yes Active No 366 F Adult No young No Yes Active No 367 F Adult No young No Yes Active No 368 M Subadult No Yes Active No 369 M Adult No No Missing No 370 F Adult No young No Yes Active No 371 F Subadult No young No Yes Active Yes 372 M Subadult No Yes Active Yes 373 M Subadult No Yes Active No 374 M Subadult No Yes Active Yes 375 M Subadult No Yes Active Yes 376 M Subadult No Yes Active Yes a COY = cub-of-the-year. bThis collar was not retrieved in 2000, the site will be visited as soon as possible in 2001 to determine status.
11
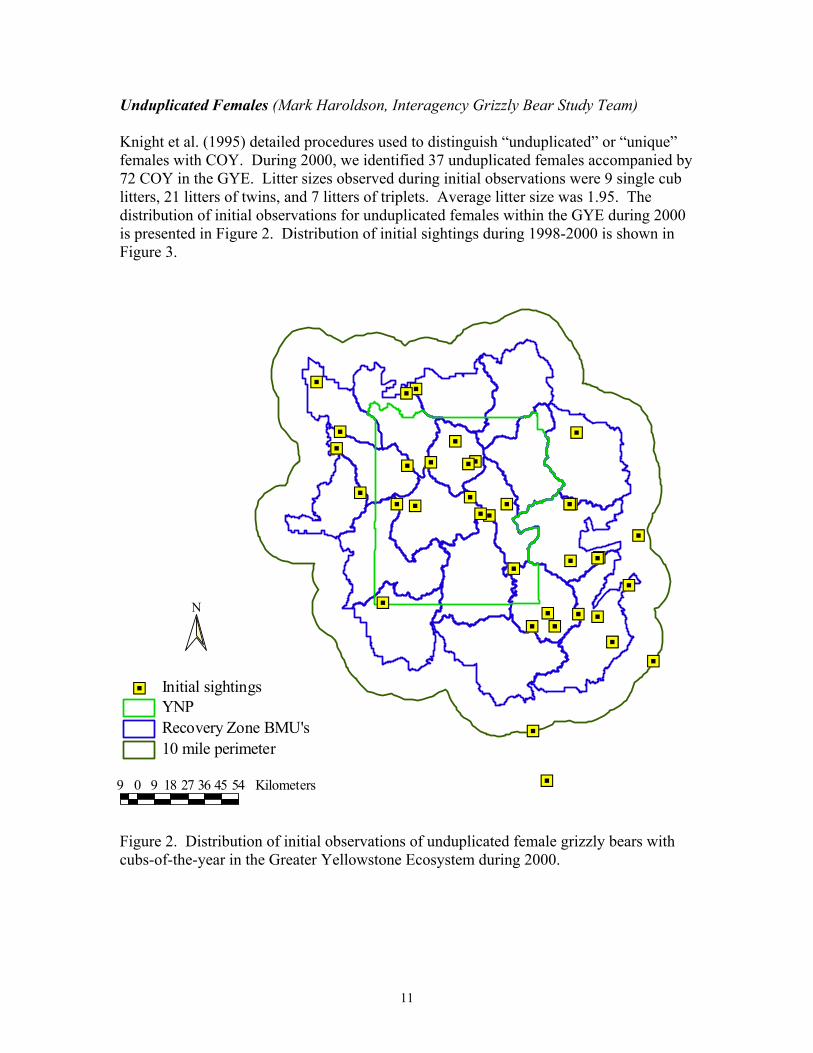
Unduplicated Females (Mark Haroldson, Interagency Grizzly Bear Study Team) Knight et al. (1995) detailed procedures used to distinguish �unduplicated� or �unique� females with COY. During 2000, we identified 37 unduplicated females accompanied by 72 COY in the GYE. Litter sizes observed during initial observations were 9 single cub litters, 21 litters of twins, and 7 litters of triplets. Average litter size was 1.95. The distribution of initial observations for unduplicated females within the GYE during 2000 is presented in Figure 2. Distribution of initial sightings during 1998-2000 is shown in Figure 3.
Figure 2. Distribution of initial observations of unduplicated female grizzly bears with cubs-of-the-year in the Greater Yellowstone Ecosystem during 2000.
%[
%[
%[
%[
%[
%[
%[
%[
%[
%[
%[
%[
%[
%[
%[
%[
%[
%[%[
%[%[%[
%[
%[%[
%[%[%[%[
%[
%[
%[
%[%[
%[
%[%[
N
10 mile perimeterRecovery Zone BMU'sYNP
%[ Initial sightings
9 0 9 18 27 36 45 54 Kilometers

12
Figure 3. Initial sightings of unduplicated females with cubs-of-the-year in the Greater Yellowstone Ecosystem, 1998-2000. Of the 37 female with COY classified as unduplicated, 46% (17) were initially sighted by ground observers while 19% (7) were sighted during IGBST observation flights (Table 4). The low percentage of females sighted during observation flights in 2000 was probably influenced somewhat by excellent whitebark pine (Pinus albicaulis) cone crop in 1999. Grizzly bears throughout the GYE used over-wintered cones during the spring and summer. Bears foraging for whitebark pine cones spend more time under forest canopies and are less observable as a result. Appendix F of the Grizzly Bear Recovery Plan (USFWS 1993) provides �Revised reporting rules for Recovery Plan Targets, July 12, 1992.� Rule 1 states that �unduplicated females with cubs will be counted inside or within 10 miles of the Recovery Zone line.� Five females were initially observed outside the Recovery Zone; 2 of these females were observed >10 miles from the recovery zone boundary. Considering only the 35 females sighted within the recovery zone and the 10-mile perimeter, 69 total COY were observed and average litter size was 1.97. The current 6-year average (1995-2000) for unduplicated females with COY within the recovery zone and the 10-mile perimeter is 31 (Table 5). The 6-year average for total number of COY and average litter size observed at initial sighting were 62 and 2.0, respectively (Table 5).
(̂
(̂(̂
(̂
(̂
(̂
(̂
(̂
(̂
(̂
(̂(̂
(̂
(̂
(̂
(̂
(̂
(̂
(̂
(̂(̂
(̂
(̂(̂(̂ (̂ (̂(̂(̂
(̂
(̂
(̂
(̂
(̂(̂
x{
x{
x{
x{
x{
x{
x{
x{
x{
x{
x{
x{x{
x{x{
x{x{x{
x{
x{x{
x{
x{
x{x{
x{
x{
x{
x{
x{
x{
x{x{
%[
%[
%[
%[
%[
%[
%[
%[
%[
%[
%[
%[
%[
%[
%[
%[
%[
%[%[
%[%[%[
%[
%[%[
%[%[%[%[
%[
%[
%[
%[%[
%[
%[%[
N
10 mile perimeterRecovery Zone BMU'sYNP
Initial sightings 1998-2000(̂ 1998x{ 1999%[ 2000
9 0 9 18 27 36 45 54 Kilometers

13
Table 4. Numbers of sightings of unduplicated female grizzly bears with cubs-of-the-year by method of observation in the Greater Yellowstone Ecosystem, 1986-2000. Observation flights Year IGBSTa Otherb
Ground sightings
Radio flights/trap Total
1986 9 2 10 4 25
1987 5 1 4 3 13
1988 7 1 7 4 19
1989 7 2 5 2 16
1990 8 0 12 4 24
1991 17 2 2 3 24
1992 10 4 6 3 23
1993 3 4 10 3 20
1994 12 4 2 2 20
1995 2 2 12 1 17
1996 13 1 10 9 33
1997 9 0 9 13 31
1998 15 1 12 7 35
1999 7 5 16 5 33
2000 7 5 17 8 37 a IGBST = Interagency Grizzly Bear Study Team. b Female with cubs-of-the-year seen during non-IGBST research flights by qualified observers.

14
Table 5. Number of unduplicated females with cubs-of-the-year (COY), number of COY, and average litter size at initial observation for the years 1973-2000 in the Greater Yellowstone Ecosystem (GYE). Six-year running averages were calculated using only unduplicated females with COY observed in the recovery zone and 10-mile perimeter. Averages differ slightly from previous reports where running averages were calculated using all unduplicated females in the GYE. 6-Year running averages Year
Female with COY
Total number of cubs
Mean litter size F w/COY Cubs Litter size
1973 14 26 1.9 1974 15 26 1.7 1975 4 6 1.5 1976 17 32 1.9 1977 13 25 1.9 1978 9 19 2.1 12 22 1.8 1979 13 29 2.2 12 23 1.9 1980 12 23 1.9 11 22 1.9 1981 13 24 1.8 13 25 2.0 1982 11 20 1.8 12 23 2.0 1983 13 22 1.7 12 23 1.9 1984 17 31 1.8 13 25 1.9 1985 9 16 1.8 13 23 1.8 1986 25 48 1.9 15 27 1.8 1987 13 29 2.2 15 28 1.9 1988 19 41 2.2 16 31 1.9 1989a 16 29 1.8 16 32 1.9 1990 25 58 2.3 18 36 2.0 1991b 24 43 1.9 20 41 2.0 1992 25 60 2.4 20 43 2.1 1993a 20 41 2.1 21 45 2.1 1994 20 47 2.4 21 46 2.1 1995 17 37 2.2 22 47 2.2 1996 33 72 2.2 23 50 2.2 1997 31 62 2.0 24 53 2.2 1998 35 70 2.0 26 55 2.1 1999a 33 63 1.9 28 58 2.1 2000c 37 72 2.0 31 62 2.0 a One female with COY was observed outside the 10-mile perimeter. b One female with unknown number of cubs. Average litter size was calculated using 23 females. c Two female with COY were initially observed outside the 10-mile perimeter.

15
Occupancy of BMUs by Females with Young (Shannon Podruzny, Interagency Grizzly Bear Study Team) Dispersion of reproductive females throughout the ecosystem is represented by verified reports of female grizzly bears with young (COY, yearlings, 2-year-olds, and/or young of unknown age) by BMU. The population recovery requirements (USFWS 1993) include occupancy of 16 of the 18 BMUs by females with young on a running 6-year sum with no 2 adjacent BMUs unoccupied. Eighteen of 18 BMUs had verified observations of female grizzly bears with young during 2000 (Table 6). Eighteen of 18 BMUs contained verified observations of females with young in at least 2 years of the last 6-year period. Table 6. Bear Management Units in the Greater Yellowstone Ecosystem occupied by females with young (cubs-of-the-year, yearlings, 2-year-olds, or young of unknown age), as determined by verified reports, 1995-2000. Bear Management Unit
1995
1996
1997
1998
1999
2000
Years
occupied 1) Hilgard X X X X 4 2) Gallatin X X X X X X 6 3) Hellroaring/Bear X X X 3 4) Boulder/Slough X X X X X 5 5) Lamar X X X X X X 6 6) Crandall/Sunlight X X X X X 5 7) Shoshone X X X X X X 6 8) Pelican/Clear X X X X X X 6 9) Washburn X X X X X 5 10) Firehole/Hayden X X X X X X 6 11) Madison X X X X 4 12) Henry's Lake X X X X 4 13) Plateau X X 2 14) Two Ocean/Lake X X X X X X 6 15) Thorofare X X X X X X 6 16) South Absaroka X X X X X X 6 17) Buffalo/Spread Creek X X X X X X 6 18) Bechler/Teton X X X X X 5
Totals 13 12 17 14 17 18
16
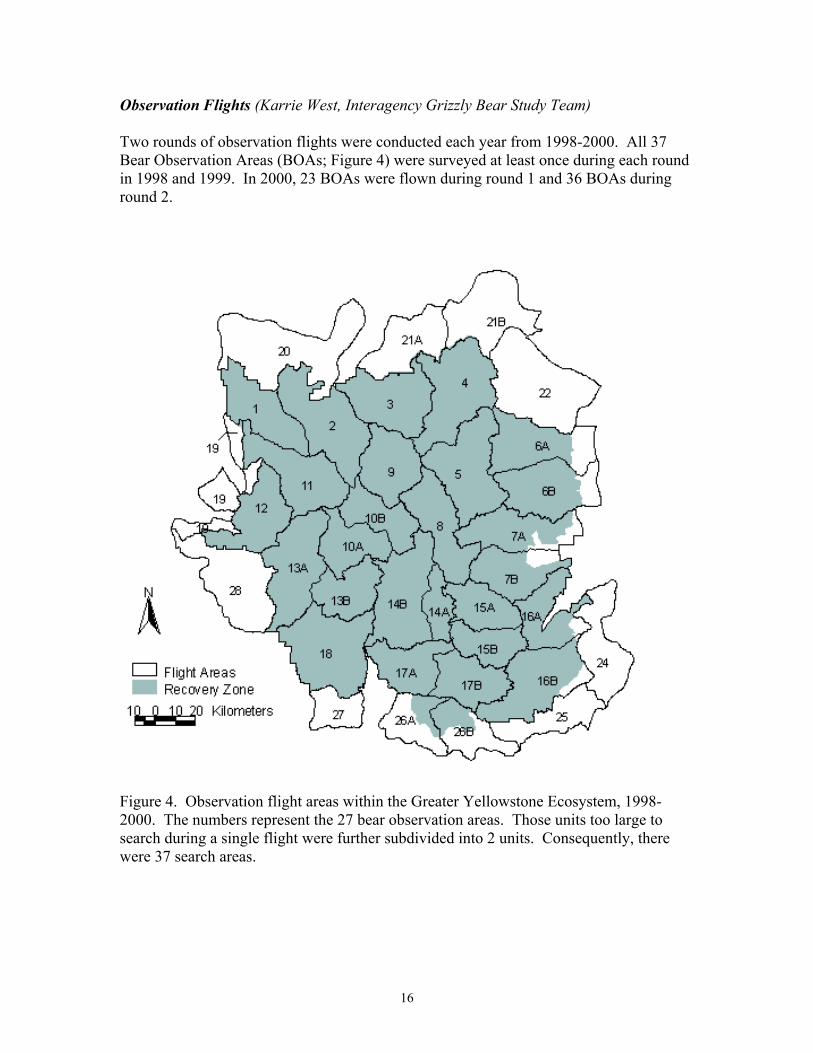
Observation Flights (Karrie West, Interagency Grizzly Bear Study Team) Two rounds of observation flights were conducted each year from 1998-2000. All 37 Bear Observation Areas (BOAs; Figure 4) were surveyed at least once during each round in 1998 and 1999. In 2000, 23 BOAs were flown during round 1 and 36 BOAs during round 2.
Figure 4. Observation flight areas within the Greater Yellowstone Ecosystem, 1998-2000. The numbers represent the 27 bear observation areas. Those units too large to search during a single flight were further subdivided into 2 units. Consequently, there were 37 search areas.
17
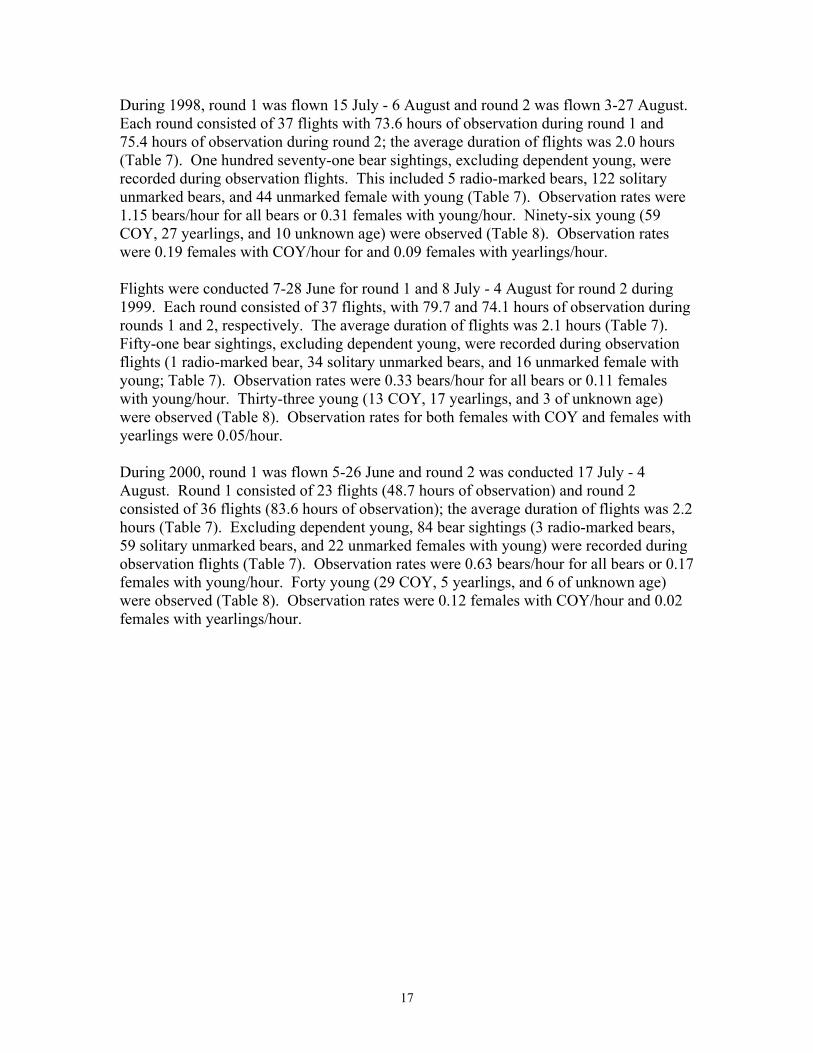
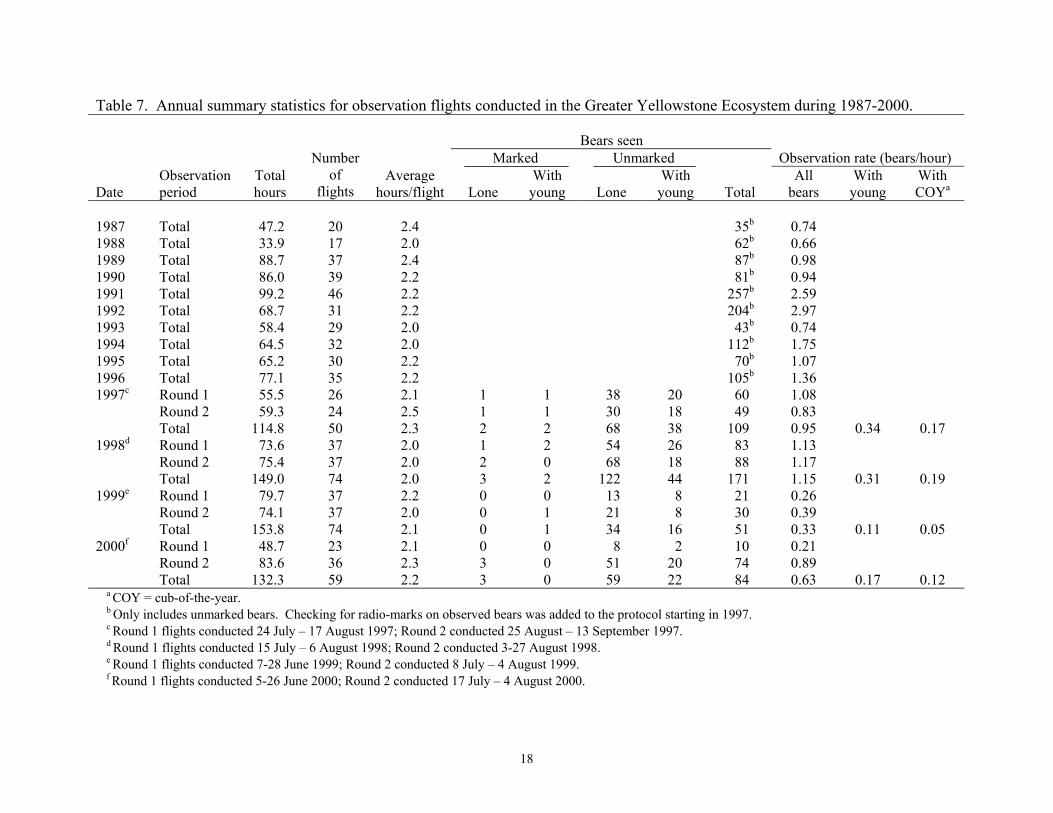
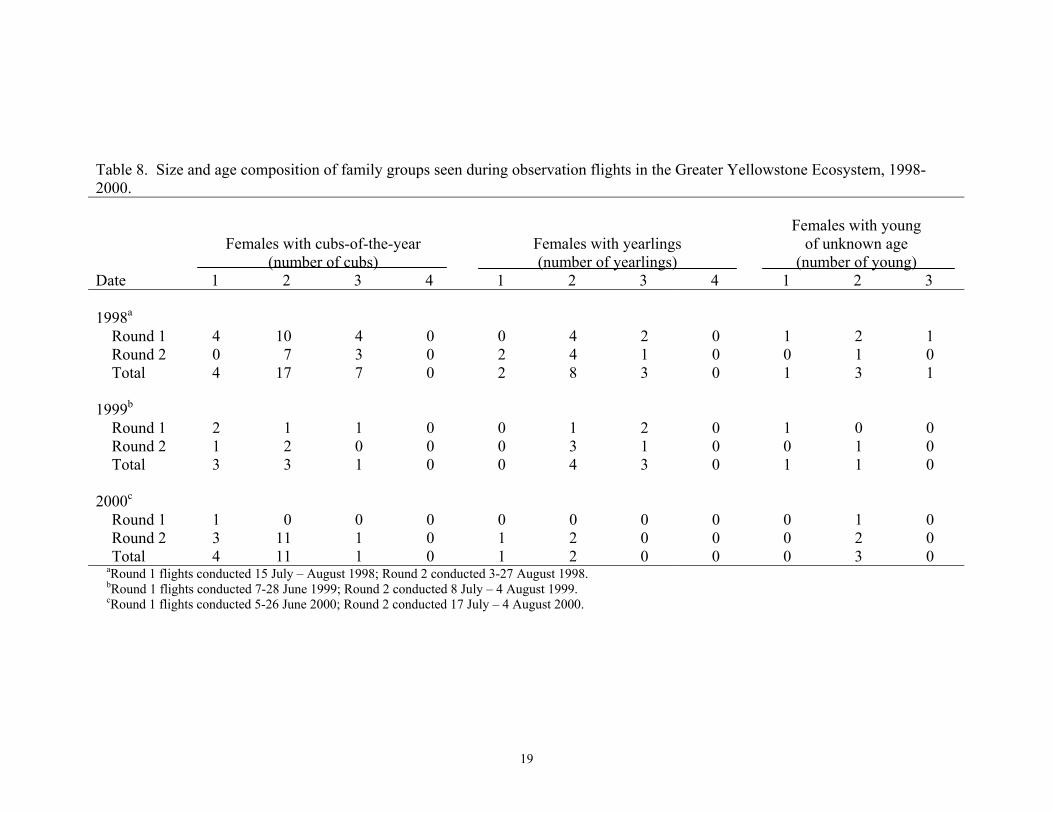
During 1998, round 1 was flown 15 July - 6 August and round 2 was flown 3-27 August. Each round consisted of 37 flights with 73.6 hours of observation during round 1 and 75.4 hours of observation during round 2; the average duration of flights was 2.0 hours (Table 7). One hundred seventy-one bear sightings, excluding dependent young, were recorded during observation flights. This included 5 radio-marked bears, 122 solitary unmarked bears, and 44 unmarked female with young (Table 7). Observation rates were 1.15 bears/hour for all bears or 0.31 females with young/hour. Ninety-six young (59 COY, 27 yearlings, and 10 unknown age) were observed (Table 8). Observation rates were 0.19 females with COY/hour for and 0.09 females with yearlings/hour. Flights were conducted 7-28 June for round 1 and 8 July - 4 August for round 2 during 1999. Each round consisted of 37 flights, with 79.7 and 74.1 hours of observation during rounds 1 and 2, respectively. The average duration of flights was 2.1 hours (Table 7). Fifty-one bear sightings, excluding dependent young, were recorded during observation flights (1 radio-marked bear, 34 solitary unmarked bears, and 16 unmarked female with young; Table 7). Observation rates were 0.33 bears/hour for all bears or 0.11 females with young/hour. Thirty-three young (13 COY, 17 yearlings, and 3 of unknown age) were observed (Table 8). Observation rates for both females with COY and females with yearlings were 0.05/hour. During 2000, round 1 was flown 5-26 June and round 2 was conducted 17 July - 4 August. Round 1 consisted of 23 flights (48.7 hours of observation) and round 2 consisted of 36 flights (83.6 hours of observation); the average duration of flights was 2.2 hours (Table 7). Excluding dependent young, 84 bear sightings (3 radio-marked bears, 59 solitary unmarked bears, and 22 unmarked females with young) were recorded during observation flights (Table 7). Observation rates were 0.63 bears/hour for all bears or 0.17 females with young/hour. Forty young (29 COY, 5 yearlings, and 6 of unknown age) were observed (Table 8). Observation rates were 0.12 females with COY/hour and 0.02 females with yearlings/hour.
18
Table 7. Annual summary statistics for observation flights conducted in the Greater Yellowstone Ecosystem during 1987-2000. Bears seen Marked Unmarked Observation rate (bears/hour) Date
Observation period
Total hours
Number of
flights Average
hours/flight Lone With
young Lone With
young Total All
bears With
young With COYa
1987 Total 47.2 20 2.4 35b 0.74 1988 Total 33.9 17 2.0 62b 0.66 1989 Total 88.7 37 2.4 87b 0.98 1990 Total 86.0 39 2.2 81b 0.94 1991 Total 99.2 46 2.2 257b 2.59 1992 Total 68.7 31 2.2 204b 2.97 1993 Total 58.4 29 2.0 43b 0.74 1994 Total 64.5 32 2.0 112b 1.75 1995 Total 65.2 30 2.2 70b 1.07 1996 Total 77.1 35 2.2 105b 1.36 1997c Round 1
Round 2 Total
55.5 59.3
114.8
26 24 50
2.1 2.5 2.3
1 1 2
1 1 2
38 30 68
20 18 38
60 49
109
1.08 0.83 0.95
0.34
0.17 1998d Round 1
Round 2 Total
73.6 75.4
149.0
37 37 74
2.0 2.0 2.0
1 2 3
2 0 2
54 68
122
26 18 44
83 88
171
1.13 1.17 1.15
0.31
0.19 1999e Round 1
Round 2 Total
79.7 74.1
153.8
37 37 74
2.2 2.0 2.1
0 0 0
0 1 1
13 21 34
8 8
16
21 30 51
0.26 0.39 0.33
0.11
0.05 2000f Round 1
Round 2 Total
48.7 83.6
132.3
23 36 59
2.1 2.3 2.2
0 3 3
0 0 0
8 51 59
2 20 22
10 74 84
0.21 0.89 0.63
0.17
0.12 a COY = cub-of-the-year. b Only includes unmarked bears. Checking for radio-marks on observed bears was added to the protocol starting in 1997. c Round 1 flights conducted 24 July � 17 August 1997; Round 2 conducted 25 August � 13 September 1997. d Round 1 flights conducted 15 July � 6 August 1998; Round 2 conducted 3-27 August 1998. e Round 1 flights conducted 7-28 June 1999; Round 2 conducted 8 July � 4 August 1999. f Round 1 flights conducted 5-26 June 2000; Round 2 conducted 17 July � 4 August 2000.
19
Table 8. Size and age composition of family groups seen during observation flights in the Greater Yellowstone Ecosystem, 1998-2000.
Females with cubs-of-the-year (number of cubs)
Females with yearlings (number of yearlings)
Females with young of unknown age
(number of young) Date 1 2 3 4 1 2 3 4 1 2 3 1998a Round 1 4 10 4 0 0 4 2 0 1 2 1 Round 2 0 7 3 0 2 4 1 0 0 1 0 Total 4 17 7 0 2 8 3 0 1 3 1 1999b Round 1 2 1 1 0 0 1 2 0 1 0 0 Round 2 1 2 0 0 0 3 1 0 0 1 0 Total 3 3 1 0 0 4 3 0 1 1 0 2000c Round 1 1 0 0 0 0 0 0 0 0 1 0 Round 2 3 11 1 0 1 2 0 0 0 2 0 Total 4 11 1 0 1 2 0 0 0 3 0 aRound 1 flights conducted 15 July � August 1998; Round 2 conducted 3-27 August 1998. bRound 1 flights conducted 7-28 June 1999; Round 2 conducted 8 July � 4 August 1999. cRound 1 flights conducted 5-26 June 2000; Round 2 conducted 17 July � 4 August 2000.

20
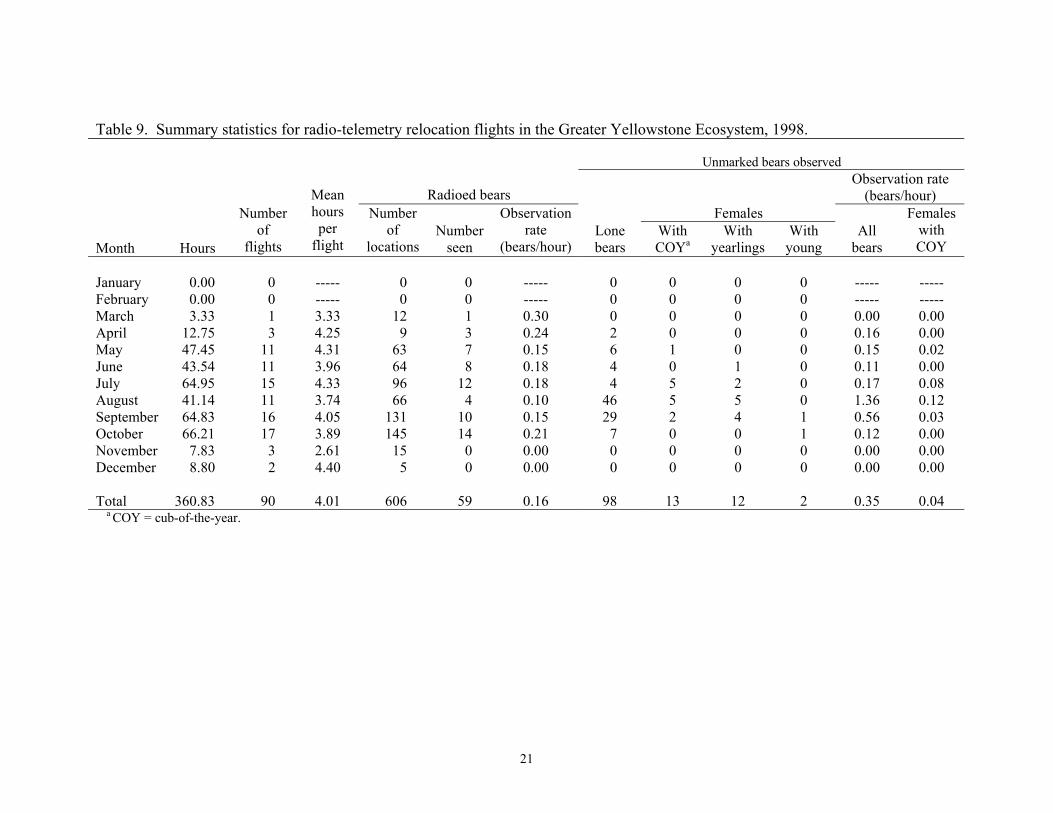
Telemetry Relocation Flights (Karrie West, Interagency Grizzly Bear Study Team) Ninety telemetry relocation flights were conducted during 1998, resulting in 360.8 hours of search time (ferry time to and from airports excluded; Table 9). Flights were conducted at least once during all months except January and February, but 90% occurred May-October. During telemetry flights, 606 locations of bears equipped with radiotransmitters were collected, 59 (9.7%) of which included a visual sighting. One hundred twenty-five sightings of unmarked bears were also obtained during telemetry flights, including 98 solitary bears, 13 females with COY, 12 females with yearlings, and 2 females with young of unknown age. Rate of observation for all unmarked bears during telemetry flights was 0.35 bears/hour. Rate of observing females with COY was 0.04/hour, which was considerably less than during observation flights (0.19/hour) in 1998. During 1999, 96 telemetry relocation flights were conducted, totaling 397.4 hours of search time (Table 10). Flights were conducted at least once during all months; 93% occurred April-November. During telemetry flights, 900 locations of marked bears were obtained, 73 (8.1%) of which included a visual sighting. One hundred forty-eight sightings of unmarked bears were obtained during telemetry flights (122 solitary bears, 10 females with COY, 13 females with yearlings, and 3 females with young of unknown age). Rate of observation for all unmarked bears during telemetry flights was 0.37 bears/hour. Rate of observing females with COY was 0.03/hour, which was similar to that of observation flights (0.05/hour) in 1999. One hundred eleven telemetry relocation flights were flown in 2000, resulting in 444.0 hours of search time (Table 11). Flights were conducted at least once during all months except February; 90% occurred April-November. During telemetry flights 1,090 locations of marked bears were collected, 127 (11.6%) of which included a visual sighting. Eighty-one unmarked bears were observed during telemetry flights, including 75 solitary bears, 2 females with COY, 3 females with yearlings, and 1 female with young of unknown age. Rate of observation for all unmarked bears during telemetry flights was 0.18 bears/hour. Rate of observing females with COY was 0.005/hour, which was considerably less than during observation flights (0.12/hour) in 2000.
21
Table 9. Summary statistics for radio-telemetry relocation flights in the Greater Yellowstone Ecosystem, 1998. Unmarked bears observed Radioed bears
Observation rate (bears/hour)
Females Month Hours
Number of
flights
Mean hours per
flight
Number of
locationsNumber
seen
Observation rate
(bears/hour)Lone bears
With COYa
With yearlings
With young
All bears
Females with COY
January 0.00 0 ----- 0 0 ----- 0 0 0 0 ----- ----- February 0.00 0 ----- 0 0 ----- 0 0 0 0 ----- ----- March 3.33 1 3.33 12 1 0.30 0 0 0 0 0.00 0.00 April 12.75 3 4.25 9 3 0.24 2 0 0 0 0.16 0.00 May 47.45 11 4.31 63 7 0.15 6 1 0 0 0.15 0.02 June 43.54 11 3.96 64 8 0.18 4 0 1 0 0.11 0.00 July 64.95 15 4.33 96 12 0.18 4 5 2 0 0.17 0.08 August 41.14 11 3.74 66 4 0.10 46 5 5 0 1.36 0.12 September 64.83 16 4.05 131 10 0.15 29 2 4 1 0.56 0.03 October 66.21 17 3.89 145 14 0.21 7 0 0 1 0.12 0.00 November 7.83 3 2.61 15 0 0.00 0 0 0 0 0.00 0.00 December 8.80 2 4.40 5 0 0.00 0 0 0 0 0.00 0.00 Total 360.83 90 4.01 606 59 0.16 98 13 12 2 0.35 0.04 a COY = cub-of-the-year.

22
Table 10. Summary statistics for radio-telemetry relocation flights in the Greater Yellowstone Ecosystem, 1999. Unmarked bears observed Radioed bears
Observation rate (bears/hour)
Females Month Hours
Number of
flights
Mean hours per
flight
Number of
locationsNumber
seen
Observation rate
(bears/hour)Lone bears
With COYa
With yearlings
With young
All bears
Females with COY
January 4.58 1 4.58 13 0 0.00 0 0 0 0 0.00 0.00 February 3.25 1 3.25 3 0 0.00 0 0 0 0 0.00 0.00 March 0.97 1 0.97 5 0 0.00 0 0 0 0 0.00 0.00 April 30.93 10 3.09 65 5 0.16 1 0 0 0 0.03 0.00 May 40.30 9 4.48 95 16 0.40 16 0 0 0 0.40 0.00 June 19.62 6 3.27 39 2 0.10 2 0 0 0 0.10 0.00 July 23.26 5 4.65 44 5 0.21 7 0 1 0 0.34 0.00 August 63.17 15 4.21 139 28 0.44 84 7 9 0 1.58 0.11 September 68.64 15 4.58 190 7 0.10 11 2 3 3 0.28 0.03 October 59.44 13 4.57 140 4 0.07 0 0 0 0 0.00 0.00 November 63.80 14 4.56 134 6 0.90 1 1 0 0 0.03 0.02 December 19.42 6 3.24 33 0 0.00 0 0 0 0 0.00 0.00 Total 397.38 96 4.14 900 73 0.18 122 10 13 3 0.37 0.03 a COY = cub-of-the-year.

23
Table 11. Summary statistics for radio-telemetry relocation flights in the Greater Yellowstone Ecosystem, 2000. Unmarked bears observed Radioed bears
Observation rate (bears/hour)
Females Month Hours
Number of
flights
Mean hours per
flight
Number of
locationsNumber
seen
Observation rate
(bears/hour)Lone bears
With COYa
With yearlings
With young
All bears
Females with COY
January 2.90 1 2.90 3 0 0.00 0 0 0 0 0.00 0.00 February 0.00 0 ----- 0 0 ----- 0 0 0 0 ----- ----- March 5.84 3 1.95 9 0 0.00 0 0 0 0 0.00 0.00 April 38.39 9 4.27 74 7 0.18 3 0 0 0 0.08 0.00 May 47.01 11 4.27 103 17 0.36 18 0 1 0 0.40 0.00 June 39.80 10 3.98 91 9 0.23 2 0 0 0 0.05 0.00 July 59.90 16 3.74 158 13 0.22 12 2 0 1 0.25 0.03 August 75.40 19 3.97 210 38 0.50 26 0 2 0 0.37 0.00 September 56.36 12 4.70 159 19 0.34 5 0 0 0 0.09 0.00 October 48.50 11 4.41 139 20 0.41 9 0 0 0 0.19 0.00 November 47.84 12 3.99 121 4 0.08 0 0 0 0 0.00 0.00 December 22.08 7 3.15 23 0 0.00 0 0 0 0 0.00 0.00 Total 444.02 111 4.00 1,090 127 0.29 75 2 3 1 0.18 0.00 a COY = cub-of-the-year.
24
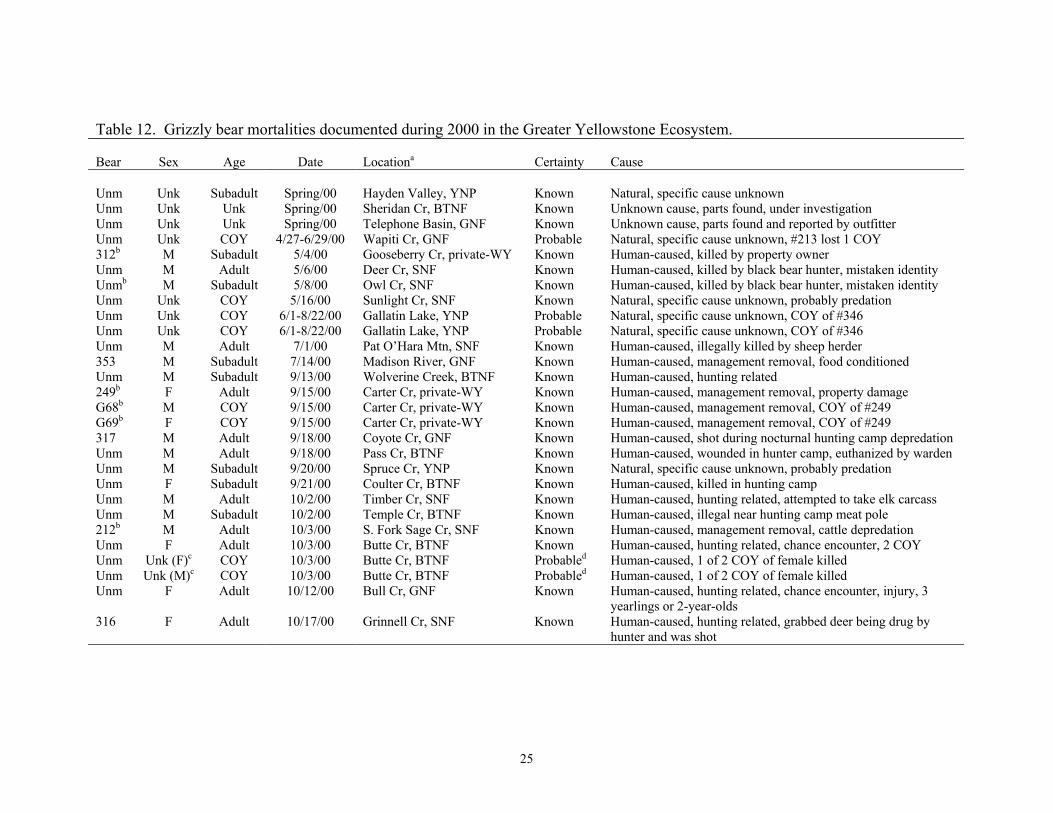
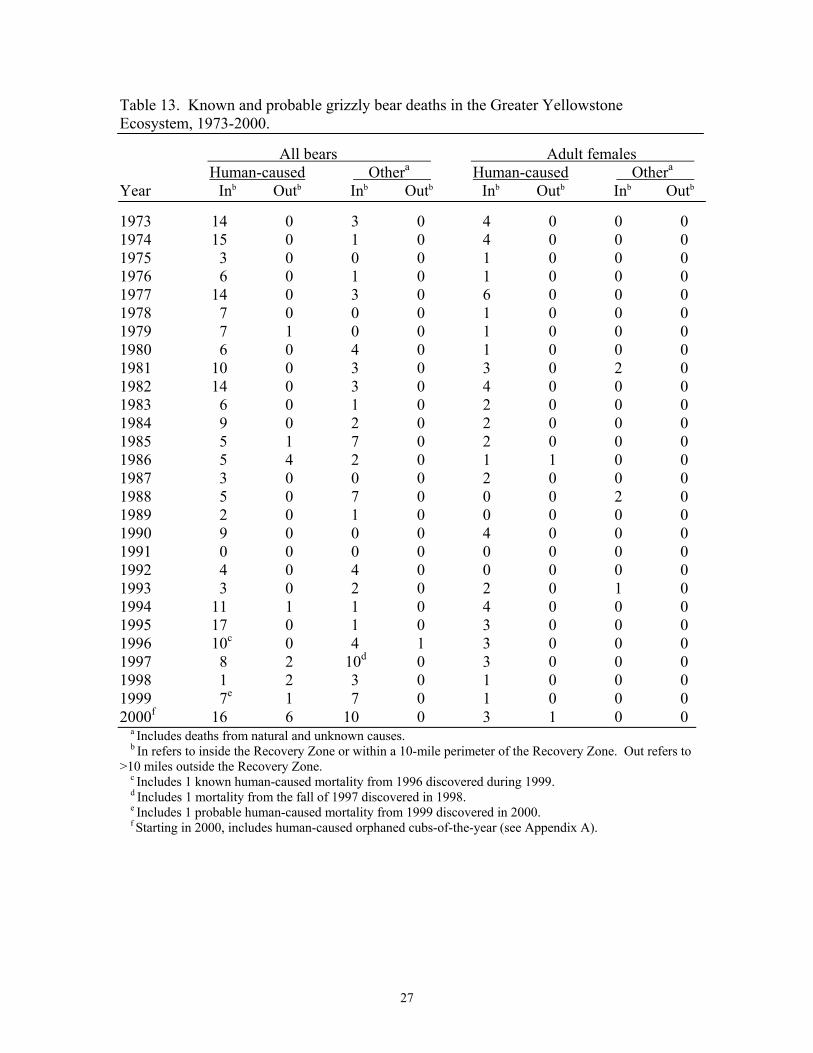
Grizzly Bear Mortalities (Mark A. Haroldson, Interagency Grizzly Bear Study Team; and Kevin Frey, Montana Fish, Wildlife and Parks) We continue to use the definitions provided in Craighead et al. (1988) to classify grizzly bear mortalities in the Greater Yellowstone Ecosystem relative to the degree of certainty regarding each event. Those cases in which a carcass is physically inspected or when a management removal occurs are classified as �known� mortalities. Those instances where evidence strongly suggests a mortality has occurred but no carcass is recovered are classified as �probable� mortalities. When evidence is circumstantial, with no prospect for additional information, a �possible� mortality is designated. The Grizzly Bear Recovery Plan (USFWS 1993: 41-44) provides criteria for determining if known human-caused grizzly bear mortalities have exceeded annual thresholds. Although not clearly stated, Appendix F of the Grizzly Bear Recovery Plan (USFWS 1993) intended that only known human-caused grizzly bear mortalities occurring within the Yellowstone Grizzly Bear Recovery Zone and a 10-mile perimeter area count against mortality quotas. The U.S. Fish and Wildlife Service has clarified this oversight with an amendment to the Recovery Plan. In addition, beginning in 2000, probable mortalities were included in the calculation of mortality thresholds, and COY orphaned as a result of human causes will be designated as probable mortalities (see Appendix A). Prior to these changes, COY orphaned after 1 July were designated possible mortalities (Craighead et al. 1988). Sex of probable mortalities will be randomly assigned as described in Appendix A. Of the human-caused mortalities documented during 2000 (Table 12), 19, 3, and 1 were known, probable, and possible, respectively. Two probable mortalities resulted from the known death of a female grizzly bear accompanied by 2 COY that occurred on 3 October. Six of the known human-caused grizzly bear mortalities occurred >10 miles outside the Recovery Zone, and as such, were not applied to the mortality threshold (Tables 13 and 14). Sixteen known and probable human-caused grizzly bear mortalities, including 3 adult females and 6 total females, were applied to the mortality threshold (USFWS 1993) for 2000. Using these results, both total human-caused and female mortalities were under annual mortality thresholds (Table 14). Although human-caused mortality thresholds were not exceeded, the high number of hunting related mortalities occurring in 2000 were a concern. Of the 23 known, probable and possible human-caused mortalities documented in the GYE during 2000, 16 were hunting related. The annual number of hunting related grizzly bear mortalities has been increasing since the early 1990s suggest an upward trend (see section on Hunter Numbers). Factors likely contributing to this trend were an increasing and expanding grizzly bear population (Schwartz et al. 2002), and possibly a seasonal increase in bear densities in early elk harvest area (Haroldson et al. in preparation). The best information we have indicated that hunter numbers remained relatively constant during the last decade (see section on Hunter Numbers).
25
Table 12. Grizzly bear mortalities documented during 2000 in the Greater Yellowstone Ecosystem. Bear Sex Age Date Locationa Certainty Cause Unm Unk Subadult Spring/00 Hayden Valley, YNP Known Natural, specific cause unknown Unm Unk Unk Spring/00 Sheridan Cr, BTNF Known Unknown cause, parts found, under investigation Unm Unk Unk Spring/00 Telephone Basin, GNF Known Unknown cause, parts found and reported by outfitter Unm Unk COY 4/27-6/29/00 Wapiti Cr, GNF Probable Natural, specific cause unknown, #213 lost 1 COY 312b M Subadult 5/4/00 Gooseberry Cr, private-WY Known Human-caused, killed by property owner Unm M Adult 5/6/00 Deer Cr, SNF Known Human-caused, killed by black bear hunter, mistaken identity Unmb M Subadult 5/8/00 Owl Cr, SNF Known Human-caused, killed by black bear hunter, mistaken identity Unm Unk COY 5/16/00 Sunlight Cr, SNF Known Natural, specific cause unknown, probably predation Unm Unk COY 6/1-8/22/00 Gallatin Lake, YNP Probable Natural, specific cause unknown, COY of #346 Unm Unk COY 6/1-8/22/00 Gallatin Lake, YNP Probable Natural, specific cause unknown, COY of #346 Unm M Adult 7/1/00 Pat O�Hara Mtn, SNF Known Human-caused, illegally killed by sheep herder 353 M Subadult 7/14/00 Madison River, GNF Known Human-caused, management removal, food conditioned Unm M Subadult 9/13/00 Wolverine Creek, BTNF Known Human-caused, hunting related 249b F Adult 9/15/00 Carter Cr, private-WY Known Human-caused, management removal, property damage G68b M COY 9/15/00 Carter Cr, private-WY Known Human-caused, management removal, COY of #249 G69b F COY 9/15/00 Carter Cr, private-WY Known Human-caused, management removal, COY of #249 317 M Adult 9/18/00 Coyote Cr, GNF Known Human-caused, shot during nocturnal hunting camp depredation Unm M Adult 9/18/00 Pass Cr, BTNF Known Human-caused, wounded in hunter camp, euthanized by warden Unm M Subadult 9/20/00 Spruce Cr, YNP Known Natural, specific cause unknown, probably predation Unm F Subadult 9/21/00 Coulter Cr, BTNF Known Human-caused, killed in hunting camp Unm M Adult 10/2/00 Timber Cr, SNF Known Human-caused, hunting related, attempted to take elk carcass Unm M Subadult 10/2/00 Temple Cr, BTNF Known Human-caused, illegal near hunting camp meat pole 212b M Adult 10/3/00 S. Fork Sage Cr, SNF Known Human-caused, management removal, cattle depredation Unm F Adult 10/3/00 Butte Cr, BTNF Known Human-caused, hunting related, chance encounter, 2 COY Unm Unk (F)c COY 10/3/00 Butte Cr, BTNF Probabled Human-caused, 1 of 2 COY of female killed Unm Unk (M)c COY 10/3/00 Butte Cr, BTNF Probabled Human-caused, 1 of 2 COY of female killed Unm F Adult 10/12/00 Bull Cr, GNF Known Human-caused, hunting related, chance encounter, injury, 3
yearlings or 2-year-olds 316 F Adult 10/17/00 Grinnell Cr, SNF Known Human-caused, hunting related, grabbed deer being drug by
hunter and was shot

26
Table 12. Continued. Bear Sex Age Date Locationa Certainty Cause Unm F Adult 10/20/00 Tappan Cr, SNF Possible Human-caused, hunting related, chance encounter, human
injury, blood trail, no carcass recovered, 2 large young Unm M Subadult 10/26/00 Dallas Fork, BTNF Known Human-caused hunting related, chance encounter Unm F COY 10/26/00 Papoose Cr, SNF Known Unknown cause, found by hunters, necropsy could not determine
cause of death Unm Unk (M)e Adult 11/5/00 Houlihan Cr, SNF Probable Human-caused, hunting related, chance encounter, bear was hit
hard with 3 shots, lung shot, carcass not recovered Unm M Subadult 11/20/00 Horse Cr, SNF Known Unknown cause, found by hunters and carcass recovered,
necropsy revealed no specific cause of death but could not rule out poison, traces of organophosphates found
a BTNF = Bridger-Teton National Forest, GNF = Gallatin National Forest, SNF = Shoshone National Forest, YNP = Yellowstone National Park. b Occurred >10 miles outside the Recovery Zone. c Sex based on a 50:50 male:female sex ratio and determined from an independent draw for each event (see Appendix A). d Under new rules, cubs-of-the-year orphaned from human causes are called probable mortalities (see Appendix A). e Sex based on a 59:41 male:female sex ratio and determined from an independent draw for each individual (see Appendix A).
27
Table 13. Known and probable grizzly bear deaths in the Greater Yellowstone Ecosystem, 1973-2000. All bears Adult females Human-caused Othera Human-caused Othera Year Inb Outb Inb Outb Inb Outb Inb Outb 1973 14 0 3 0 4 0 0 0 1974 15 0 1 0 4 0 0 0 1975 3 0 0 0 1 0 0 0 1976 6 0 1 0 1 0 0 0 1977 14 0 3 0 6 0 0 0 1978 7 0 0 0 1 0 0 0 1979 7 1 0 0 1 0 0 0 1980 6 0 4 0 1 0 0 0 1981 10 0 3 0 3 0 2 0 1982 14 0 3 0 4 0 0 0 1983 6 0 1 0 2 0 0 0 1984 9 0 2 0 2 0 0 0 1985 5 1 7 0 2 0 0 0 1986 5 4 2 0 1 1 0 0 1987 3 0 0 0 2 0 0 0 1988 5 0 7 0 0 0 2 0 1989 2 0 1 0 0 0 0 0 1990 9 0 0 0 4 0 0 0 1991 0 0 0 0 0 0 0 0 1992 4 0 4 0 0 0 0 0 1993 3 0 2 0 2 0 1 0 1994 11 1 1 0 4 0 0 0 1995 17 0 1 0 3 0 0 0 1996 10c 0 4 1 3 0 0 0 1997 8 2 10d 0 3 0 0 0 1998 1 2 3 0 1 0 0 0 1999 7e 1 7 0 1 0 0 0 2000f 16 6 10 0 3 1 0 0 a Includes deaths from natural and unknown causes. b In refers to inside the Recovery Zone or within a 10-mile perimeter of the Recovery Zone. Out refers to >10 miles outside the Recovery Zone. c Includes 1 known human-caused mortality from 1996 discovered during 1999. d Includes 1 mortality from the fall of 1997 discovered in 1998. e Includes 1 probable human-caused mortality from 1999 discovered in 2000. f Starting in 2000, includes human-caused orphaned cubs-of-the-year (see Appendix A).

28
Table 14. Annual count of unduplicated females with cubs-of-the-year (COY), and known and probablea human-caused grizzly bear mortalities within the Recovery Zone and the 10-mile perimeter, 1990-2000. Calculations of mortality thresholds (USFWS 1993) do not include mortalities or unduplicated females with cubs documented outside the 10-mile perimeter.
U.S. Fish and Wildlife Service
Grizzly Bear Recovery Plan mortality thresholds
Total human-caused mortality Total female mortality
Human-caused mortality Human-caused mortality 6-year running averages
Year
Unduplicated females w/
COY Total Female Adult female Total Female Adult female
Minimum population estimate
4% of minimum population
Year result
30% of total mortality
Year result
1990 25 9 6 4 4.8 2.7 1.5 201 8.0 2.4 1991 24 0 0 0 4.0 2.2 1.2 219 8.8 2.6 1992 25 4 1 0 3.8 1.8 1.0 255 10.2 3.1 1993 19 3 2 2 3.8 1.8 1.0 241 9.6 Under 2.9 Under 1994 20 10 3 3 4.7 2.0 1.5 215 8.6 Under 2.6 Under 1995 17 17 7 3 7.2 3.2 2.0 175 7.0 Exceeded 2.1 Exceeded 1996 33 10 4 3 7.3 2.8 1.8 223 8.9 Under 2.7 Exceeded 1997 31 7 3 2 8.5 3.3 2.2 266 10.7 Under 3.2 Exceeded 1998 35 1 1 1 8.0 3.3 2.3 339 13.6 Under 4.1 Under 1999 32 5 1 1 8.3 3.2 2.2 343 13.7 Under 4.1 Under 2000 35 16 6 3 9.3 3.7 2.2 354 14.2 Under 4.2 Under a Beginning in 2000, probable human-caused mortalities are used in calculation of annual mortality thresholds (see Appendix A).

29
Six natural mortalities, including 3 known and 3 probable losses were documented during 2000. Evidence suggested that 2 known (1 cub and 1 subadult) losses were likely due to predation by bears. Three probable cub losses involved 2 radiocollared females. One female lost a litter of twins between June and August, the other female lost a single cub from a litter of triplets between April and July. Four mortalities from unknown caused were also documented during 2000. One was discovered and reported by hunters on 20 November. The carcass of this subadult male was retrieved and sent to the Wyoming State Lab for necropsy. Although no specific cause could be determined, traces of organophosphates were discovered, suggesting poisoning as a cause of death. One probable human-caused mortality was added to the mortality record for 1999. This subadult male was originally captured in 1998 in response to nuisance activity near an orchard and home site. He was transported to Chipmunk Creek, Yellowstone National Park, and later appeared in an orchard near Parker, Idaho, in late September 1998. He was captured and relocated in the Gallatin National Forest. No aerial locations were obtained from this release date until the spring of 1999. Two locations were obtained before the collar went on mortality during mid-April. The collar was retrieved on 30 June 1999 and exhibited suspicious circumstances. After examining the collar, IGBST concluded that probably an illegal mortality had occurred and the appropriate law enforcement agencies were notified.

30
Annual Home Range Size and Movements (Ron Grogan, Wyoming Game and Fish Department) During 2000, we located 35 bears (18 females, 17 males) at least once during each of 3 tracking seasons (spring, summer, and fall) and ≥12 times throughout the entire year. Minimum convex polygon home ranges for these bears ranged from 14 � 856 km2 (Table 15). Bear #213, a female with COY, displayed the smallest home range (14 km2) of any individual, while adult male bear #339 had the largest home range (856 km2). Lone adult females displayed the smallest home range size ( x = 164 km2; SD = 114; n = 6) of any cohort, while adult males had the largest home ranges ( x = 386 km2; SD = 211; n = 15). While no bears exhibited unusually large home ranges or movements in 2000, bear #213, an adult female with cubs, had a very small home range of only 14 km2. Her largest movement between successive locations was 5 km, between 6 October and 20 October. Bear #342, another adult female with cubs, also had an unusually small home range of 23 km2. Only 6 bears, all adult males, had annual home ranges >500 km2 (Table 15), and no bears had home ranges exceeding 1,000 km2 during 2000. We also calculated the mean distance (km) traveled per day per animal across cohorts during 2000 (Table 16). While average movement rates between tracking seasons (all cohorts combined) were very similar, the greatest mean seasonal movements occurred during the spring and summer ( x = 0.8 km, SD = 0.4; x = 0.8 km, SD = 0.2), respectively. Fall movements were slightly lower ( x = 0.6 km, SD = 0.2). Subadult females exhibited the greatest rates of movement during the spring. However, during the summer and fall, adult males exhibited the largest movement rates.

31
Table 15. Annual home range sizes (km2) of grizzly bears located ≥12 times and during all 3 seasons of 2000 in the Greater Yellowstone Ecosystem.
1975-87 cohort mean
Cohort Bear Number of locations MCPa MCP (SD)
Females Adult ---- ---- 164b 281 (196) With Cubs 213 13 14 231 (136)
295 33 396 325 27 196
327 23 252 342 17 23 With yearlings 308 24 134 338 (244) Lone Adult 128 23 106 236 (114)
166 15 333 316 12 55 346 20 115 349 22 281 351 16 94
Unknown status 303 15 62 Subadult 305 14 75 365 (191) 334 33 94 350 17 318 357 16 79 358 18 212 Males Adult 80 12 212 874 (630) 201 26 440 212 14 170 287 15 516 291 25 515 292 14 381
313 19 680 317 14 467 328 18 237 329 15 174 336 22 209 339 17 856 348 24 533 354 11 137 356 19 268
Subadult 352 20 318 698 (598) 355 15 79 a Minimum Convex Polygon b Mean home range size for all adult female bears.

32
Table 16. Seasonal rates of movement for radio-marked grizzly bears in the Greater Yellowstone Ecosystem during 1997-2000. Mean km/day/animal 1975-87 Season Cohorta 1997 1998 1999 2000 Mean (SD) Spring Adult females with COY 0.9 0.9 0.9 0.5 0.7 (0.3)
Females with yearling 2.2 0.2 0.7 0.4 1.1 (0.7) Lone adult females 1.5 1.1 0.9 0.6 1.0 (0.6) Unknown adult females 0.1 1.1 N/A 0.6 N/A N/A Subadult females 2.2 0.7 1.0 1.6 N/A N/A Adult males 2.3 1.1 1.1 1.0 1.3 (0.8) Subadult males 0.3 0.9 1.6 0.7 1.1 (0.6)
Summer Adult females with COY 0.6 1.6 1.2 0.9 1.3 (1.0) Females with yearling 2.1 0.9 0.6 0.7 1.7 (0.9) Lone adult females 1.1 1.8 1.0 0.8 1.3 (0.7) Unknown adult females N/A 1.7 0.9 0.6 N/A N/A Subadult females 1.6 1.5 1.7 0.7 N/A N/A Adult males 2.4 1.7 1.9 1.1 1.9 (1.1) Subadult males 1.6 1.5 1.1 0.6 1.1 (0.9)
Fall Adult females with COY 1.0 1.5 1.2 0.5 1.2 (1.0) Females with yearling 1.4 1.3 0.1 0.3 1.6 (0.9) Lone adult females 2.1 0.8 0.7 0.5 1.0 (0.7) Unknown adult females N/A 1.1 N/A N/A N/A N/A Subadult females 1.1 0.5 1.0 0.4 N/A N/A Adult males 1.1 1.6 1.8 0.9 1.4 (0.8) Subadult males 1.0 1.0 1.6 0.8 1.1 (0.8)
a COY = cub-of-the-year.
33
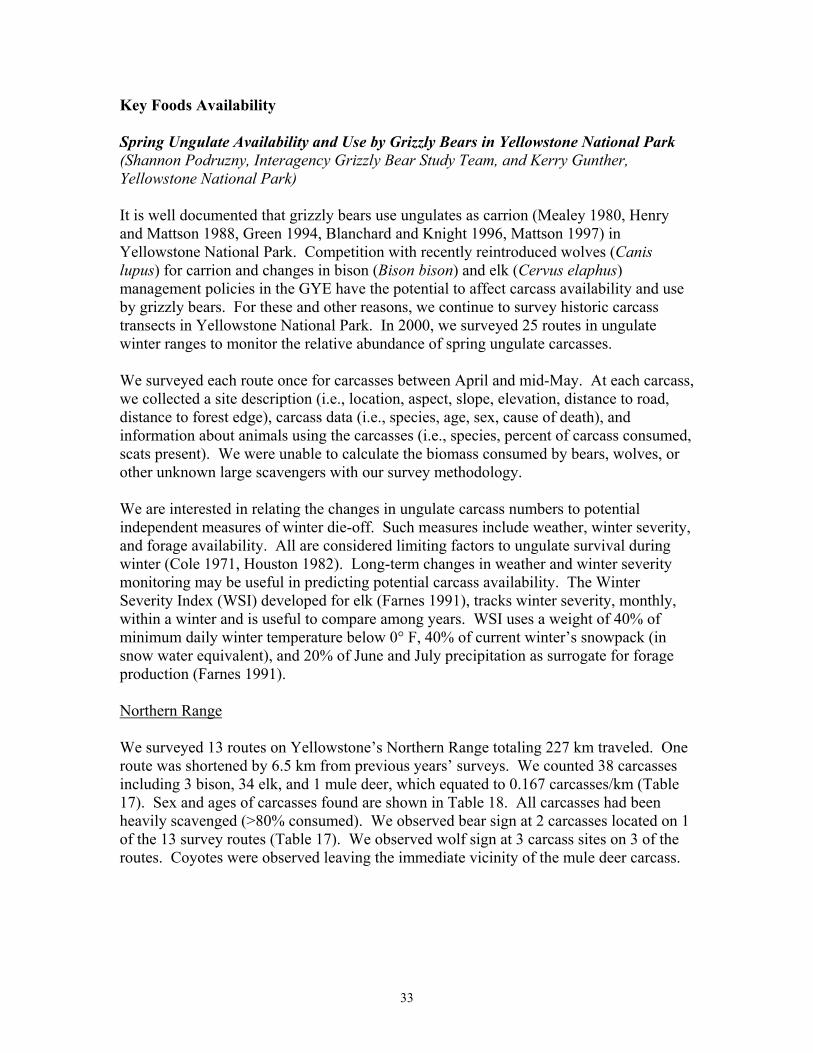
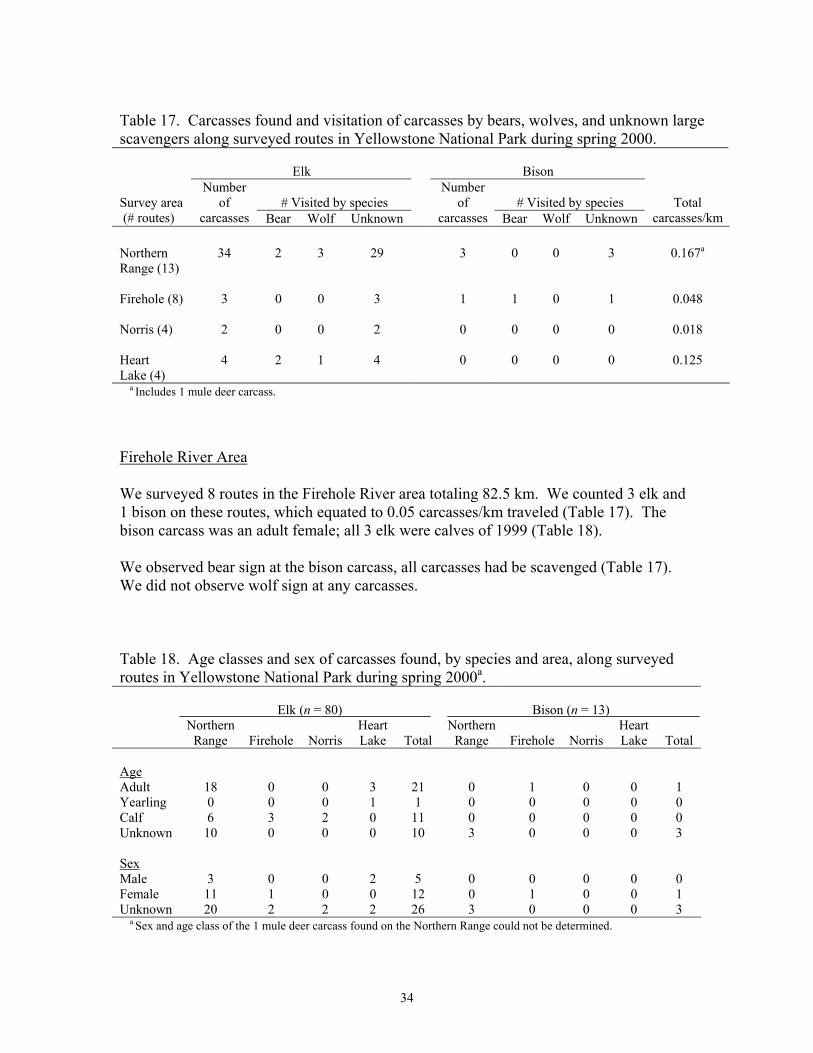
Key Foods Availability Spring Ungulate Availability and Use by Grizzly Bears in Yellowstone National Park (Shannon Podruzny, Interagency Grizzly Bear Study Team, and Kerry Gunther, Yellowstone National Park) It is well documented that grizzly bears use ungulates as carrion (Mealey 1980, Henry and Mattson 1988, Green 1994, Blanchard and Knight 1996, Mattson 1997) in Yellowstone National Park. Competition with recently reintroduced wolves (Canis lupus) for carrion and changes in bison (Bison bison) and elk (Cervus elaphus) management policies in the GYE have the potential to affect carcass availability and use by grizzly bears. For these and other reasons, we continue to survey historic carcass transects in Yellowstone National Park. In 2000, we surveyed 25 routes in ungulate winter ranges to monitor the relative abundance of spring ungulate carcasses. We surveyed each route once for carcasses between April and mid-May. At each carcass, we collected a site description (i.e., location, aspect, slope, elevation, distance to road, distance to forest edge), carcass data (i.e., species, age, sex, cause of death), and information about animals using the carcasses (i.e., species, percent of carcass consumed, scats present). We were unable to calculate the biomass consumed by bears, wolves, or other unknown large scavengers with our survey methodology. We are interested in relating the changes in ungulate carcass numbers to potential independent measures of winter die-off. Such measures include weather, winter severity, and forage availability. All are considered limiting factors to ungulate survival during winter (Cole 1971, Houston 1982). Long-term changes in weather and winter severity monitoring may be useful in predicting potential carcass availability. The Winter Severity Index (WSI) developed for elk (Farnes 1991), tracks winter severity, monthly, within a winter and is useful to compare among years. WSI uses a weight of 40% of minimum daily winter temperature below 0° F, 40% of current winter�s snowpack (in snow water equivalent), and 20% of June and July precipitation as surrogate for forage production (Farnes 1991). Northern Range We surveyed 13 routes on Yellowstone�s Northern Range totaling 227 km traveled. One route was shortened by 6.5 km from previous years� surveys. We counted 38 carcasses including 3 bison, 34 elk, and 1 mule deer, which equated to 0.167 carcasses/km (Table 17). Sex and ages of carcasses found are shown in Table 18. All carcasses had been heavily scavenged (>80% consumed). We observed bear sign at 2 carcasses located on 1 of the 13 survey routes (Table 17). We observed wolf sign at 3 carcass sites on 3 of the routes. Coyotes were observed leaving the immediate vicinity of the mule deer carcass.
34
Table 17. Carcasses found and visitation of carcasses by bears, wolves, and unknown large scavengers along surveyed routes in Yellowstone National Park during spring 2000. Elk Bison
# Visited by species # Visited by species Survey area (# routes)
Number of
carcasses Bear Wolf Unknown
Number of
carcasses Bear Wolf Unknown Total
carcasses/km Northern Range (13)
34 2 3 29 3 0 0 3 0.167a
Firehole (8) 3 0 0 3 1 1 0 1 0.048 Norris (4) 2 0 0 2 0 0 0 0 0.018 Heart Lake (4)
4 2 1 4 0 0 0 0 0.125
a Includes 1 mule deer carcass. Firehole River Area We surveyed 8 routes in the Firehole River area totaling 82.5 km. We counted 3 elk and 1 bison on these routes, which equated to 0.05 carcasses/km traveled (Table 17). The bison carcass was an adult female; all 3 elk were calves of 1999 (Table 18). We observed bear sign at the bison carcass, all carcasses had be scavenged (Table 17). We did not observe wolf sign at any carcasses. Table 18. Age classes and sex of carcasses found, by species and area, along surveyed routes in Yellowstone National Park during spring 2000a. Elk (n = 80) Bison (n = 13)
Northern Range Firehole Norris
Heart Lake Total
Northern Range Firehole Norris
Heart Lake Total
Age Adult 18 0 0 3 21 0 1 0 0 1 Yearling 0 0 0 1 1 0 0 0 0 0 Calf 6 3 2 0 11 0 0 0 0 0 Unknown 10 0 0 0 10 3 0 0 0 3 Sex Male 3 0 0 2 5 0 0 0 0 0 Female 11 1 0 0 12 0 1 0 0 1 Unknown 20 2 2 2 26 3 0 0 0 3 a Sex and age class of the 1 mule deer carcass found on the Northern Range could not be determined.

35
Norris Geyser Basin We surveyed 4 routes in the Norris Geyser Basin totaling 17 km. We counted 2 calf elk and no bison carcass, which equated to 0.12 carcasses/km traveled (Tables 17 and 18). The carcasses had been almost completely consumed; we found no concrete evidence of use by either bears or wolves (Table 17). Heart Lake We surveyed 4 routes in the Heart Lake thermal basin covering 32 km. We counted 4 elk carcasses equating to 0.13 carcasses/km. Two carcasses were used by grizzly bears, 1 by wolves, and all by coyotes (Table 17). One carcass was a yearling (calf of 1998); the other 3 were adults (Table 18). According to the WSI, the winter of 1999-2000 presented average conditions (Figure 5). There were fewer ungulate carcasses observed than in the previous year, and our index of carcass abundance was lower in 1999-2000 compared to the relatively severe winter of 1996-97 (Figure 6). We found a significant correlation between the WSI and numbers of carcasses found on the Northern Range (R2 = 0.74, n = 7, F = 14.51, P = 0.013) and in the Norris and Firehole Geyser Basins (R2 = 0.62, n = 12, F = 16.06, P = 0.002). We will continue these surveys for at least 1 more year, in part to determine if the strong relationship between the number of observed carcasses and the WSI persists.
Figure 5. Winter Severity Index (WSI) for elk on the Northern Range, Yellowstone National Park, 1948-2000. WSI values of 3 to 4 indicate very mild winters, 0 average, and �3 to �4 very severe winters.
-4
-2
0
2
4
1949
1952
1955
1958
1961
1964
1967
1970
1973
1976
1979
1982
1985
1988
1991
1994
1997
2000
Year
Win
ter S
ever
ity In
dex

36
Figure 6. Winter Severity Index (WSI) derived for elk on the Northern Range and ungulate carcasses/km along transects in 2 survey areas, Yellowstone National Park, 1986-2000.
-2
-1.5
-1
-0.5
0
0.5
1
1.5
2Ca
rcas
ses/
km
-4
-3
-2
-1
0
1
2
3
4
1986
1987
1988
1989
1990
1991
1992
1993
1994
1995
1996
1997
1998
1999
2000
WSI
Firehole/NorrisNorthern RangeWSI
37
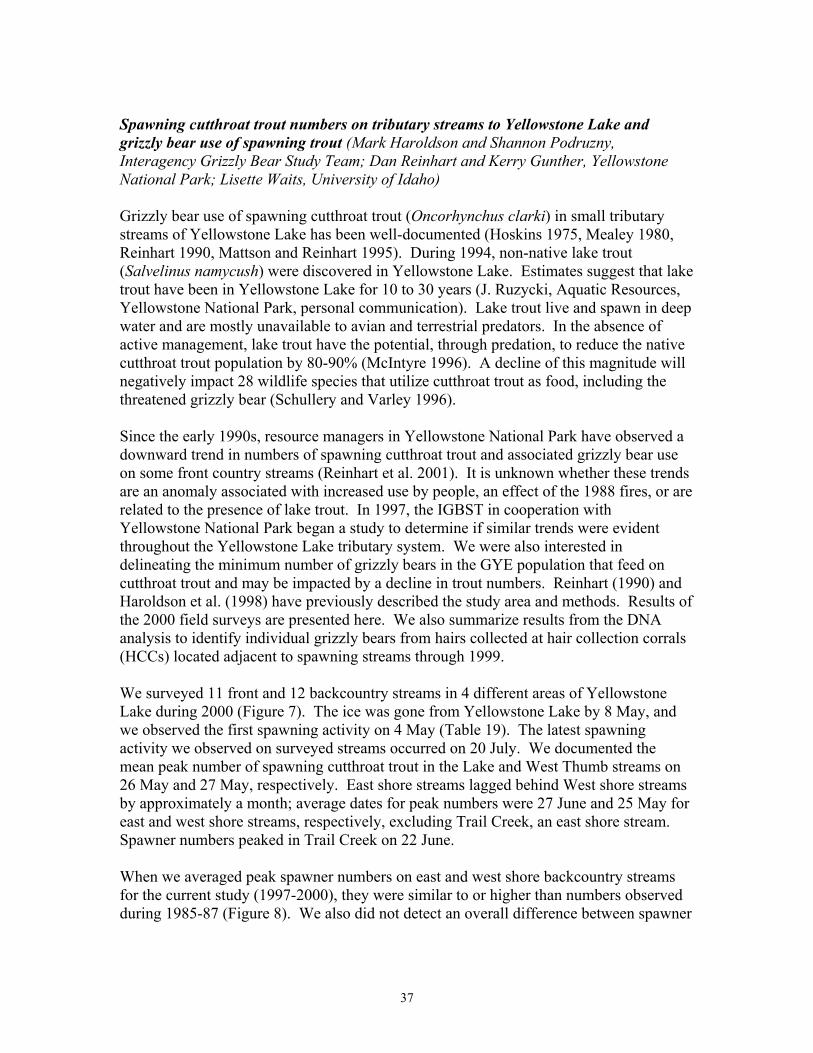
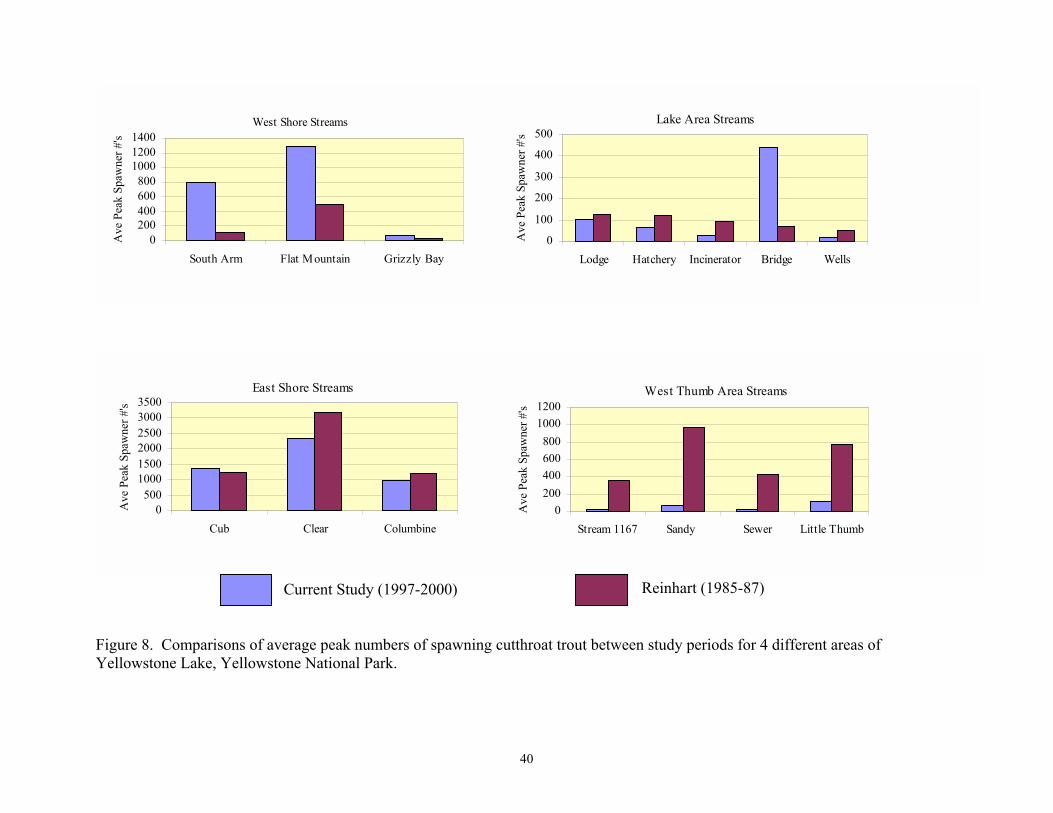
Spawning cutthroat trout numbers on tributary streams to Yellowstone Lake and grizzly bear use of spawning trout (Mark Haroldson and Shannon Podruzny, Interagency Grizzly Bear Study Team; Dan Reinhart and Kerry Gunther, Yellowstone National Park; Lisette Waits, University of Idaho) Grizzly bear use of spawning cutthroat trout (Oncorhynchus clarki) in small tributary streams of Yellowstone Lake has been well-documented (Hoskins 1975, Mealey 1980, Reinhart 1990, Mattson and Reinhart 1995). During 1994, non-native lake trout (Salvelinus namycush) were discovered in Yellowstone Lake. Estimates suggest that lake trout have been in Yellowstone Lake for 10 to 30 years (J. Ruzycki, Aquatic Resources, Yellowstone National Park, personal communication). Lake trout live and spawn in deep water and are mostly unavailable to avian and terrestrial predators. In the absence of active management, lake trout have the potential, through predation, to reduce the native cutthroat trout population by 80-90% (McIntyre 1996). A decline of this magnitude will negatively impact 28 wildlife species that utilize cutthroat trout as food, including the threatened grizzly bear (Schullery and Varley 1996). Since the early 1990s, resource managers in Yellowstone National Park have observed a downward trend in numbers of spawning cutthroat trout and associated grizzly bear use on some front country streams (Reinhart et al. 2001). It is unknown whether these trends are an anomaly associated with increased use by people, an effect of the 1988 fires, or are related to the presence of lake trout. In 1997, the IGBST in cooperation with Yellowstone National Park began a study to determine if similar trends were evident throughout the Yellowstone Lake tributary system. We were also interested in delineating the minimum number of grizzly bears in the GYE population that feed on cutthroat trout and may be impacted by a decline in trout numbers. Reinhart (1990) and Haroldson et al. (1998) have previously described the study area and methods. Results of the 2000 field surveys are presented here. We also summarize results from the DNA analysis to identify individual grizzly bears from hairs collected at hair collection corrals (HCCs) located adjacent to spawning streams through 1999. We surveyed 11 front and 12 backcountry streams in 4 different areas of Yellowstone Lake during 2000 (Figure 7). The ice was gone from Yellowstone Lake by 8 May, and we observed the first spawning activity on 4 May (Table 19). The latest spawning activity we observed on surveyed streams occurred on 20 July. We documented the mean peak number of spawning cutthroat trout in the Lake and West Thumb streams on 26 May and 27 May, respectively. East shore streams lagged behind West shore streams by approximately a month; average dates for peak numbers were 27 June and 25 May for east and west shore streams, respectively, excluding Trail Creek, an east shore stream. Spawner numbers peaked in Trail Creek on 22 June. When we averaged peak spawner numbers on east and west shore backcountry streams for the current study (1997-2000), they were similar to or higher than numbers observed during 1985-87 (Figure 8). We also did not detect an overall difference between spawner

38
Figure 7. Location of cutthroat trout spawning streams surveyed for fish numbers and grizzly bear use during 2000.
Lake Area Streams
West Thumb Streams
West Shore Streams
East Shore Streams

39
Table 19. Beginning, peak, and ending dates and peak numbers of spawning cutthroat trout observed by stream on Yellowstone Lake, Yellowstone National Park, 2000. Stream name (SONYEW number)
Beginning
date
Peak date
Peak
number
End date
Front country streams
Lake Area streams
Lodge Creek (1203) 5/9 5/22 67 6/14 Hotel Creek (1202) - - 0 - Hatchery Creek (1201)a 5/4 5/22 47 5/29 Incinerator Creek (1199) 5/9 5/29 59 6/14 Wells Creek (1198) 5/22 5/29 15 6/6 Bridge Creek (1196)a 5/4 5/29 15 6/14 West Thumb Area streams
Stream 1177 (1177) 6/7 6/7 47 6/14 Little Thumb Creek (1176) 5/30 6/5 74 6/27 Stream 1167 (1167) 5/16 5/16 3 5/30 Sandy Creek (1166) 5/16 5/24 107 6/5 Sewer Creek (1164) 5/24 5/24 15 6/5 Backcountry streams East shore
Little Creek (1091) 6/8 6/8 36 6/22 Cub Creek (1093)a 6/22 7/5 789 7/20 Clear Creek (1095)a 6/22 6/29 1,626 7/20 Columbine Creek (1099)a 6/22 7/5 1,242 7/20 Foam Creek (1103) 6/22 6/22 47 7/11 Trail Creek (1113)a 5/17 6/22 137 7/11 West shore
East Eagle Creek (1126)a 5/16 5/23 88 6/14 West Eagle Creek (1127) 5/23 5/23 27 6/7 Stream 1138 (1138)a 5/16 5/30 409 6/28 Stream 1141 (1141)a 5/23 5/30 116 6/28 Stream 1150 (1150) 5/29 5/29 26 6/14 Flat Mountain Creek (1155)a 5/16 5/23 1,711 7/20 Delusion Lake Outlet (1158)b - - 0 - a Data indicated that the cutthroat spawn had begun prior to initiation of surveys. b Fry were observed in stream on 7 June 2000.
40
Figure 8. Comparisons of average peak numbers of spawning cutthroat trout between study periods for 4 different areas of Yellowstone Lake, Yellowstone National Park.
East Shore Streams
0500
100015002000250030003500
Cub Clear Columbine
Ave
Pea
k Sp
awne
r #'s
West Shore Streams
0200400600800
100012001400
South Arm Flat Mountain Grizzly Bay
Ave
Pea
k Sp
awne
r #'s
West Thumb Area Streams
0200400600800
10001200
Stream 1167 Sandy Sewer Little ThumbA
ve P
eak
Spaw
ner #
's
Lake Area Streams
0
100
200
300
400
500
Lodge Hatchery Incinerator Bridge Wells
Ave
Pea
k Sp
awne
r #'s
Current Study (1997-2000) Reinhart (1985-87)

41
numbers on front country streams surveyed in the Lake area when compared to previous studies. However, streams in the West Thumb area continued to show substantial reduction in peak numbers of spawning trout when compared to the previous study period (Figure 8). Lake trout abundance continues to be a likely explanation for the observed decline in cutthroat trout spawner numbers in the West Thumb area. Numbers of netted lake trout grew from 2 in 1994 to 12,875 during 2000. A total of 25,753 lake trout were netted between 1994 and 2000. Much of the netting efforts and 96% of the lake trout captures occurred in the West Thumb area (Jeff Lutch, Aquatic Resources, Yellowstone National Park, personal communication). Most deep-water hydro-acoustic targets also point to higher lake trout densities in the West Thumb area (J. Ruzycki, Aquatic Resources, Yellowstone National Park, personal communication). By 1999, lake trout had been caught in the furthest extent of all arms of Yellowstone Lake (Dan Mahony, Aquatic Resources, Yellowstone National Park, personal communication). We measured bear tracks discovered during each stream survey to estimate the minimum number of unique bears that visited and foraged on a particular stream during the spawning period (Table 20). However, these values represent only an index to the number of unique individual bears using surveyed streams because we cannot determine if an individual visits more than 1 stream. Generally, backcountry streams exhibited higher peak numbers of spawning fish and bears visited them more when compared to front country streams, which contained fewer fish. We established HCCs on 11 streams during 1998; we included 6 additional streams in 1999 and 2000. We ran these for the entire cutthroat trout spawning season during 2000. In total, we collected 434 hair samples from baited and unbaited HCCs and 38 samples from tree branches along streams. We selected all samples that included >10 hair strands for DNA analysis. Methodology used for DNA extraction from hair samples and identification of individual grizzly bears that visited cutthroat trout spawning streams are described by Haroldson et al. (1999). During 1997-2000, 75 individual bears have been identified from hair samples obtained in association with cutthroat trout spawning streams (Table 21). Numbers of individual bears identified declined from numbers presented in previous annual reports due to new analysis guidelines based on the statistical probability of each sample representing a unique individual (Woods et al. 1999, Waits et al. 2001). Forty-four bears have only been identified from samples in 1 out of 4 years, 18 have been identified as having been at streams in 2 years, 12 individuals in 3 years, and 1 individual was identified in all 4 years of the study. During 2000, approximately 40% (n = 19) of the cutthroat spawning streams on which bear fishing is known to occur were sampled for bear hair. The highest number of individual grizzly bears identified was 38 and coincided with our expanded effort in 2000. We concluded spawning stream surveys and grizzly bear hair collection efforts during the 2000 field season. A detailed analysis of data collected for this project will be submitted to a peer-reviewed journal during 2001.

42
Table 20. Estimated number of bearsa by species as indicated by detailed track analysis, and number of hair samples collected using hair collection corrals (HCC) by stream on Yellowstone Lake, Yellowstone National Park, 2000.
Stream (SONYEW number) Number of
grizzly bears Number of black bears
Hair samples collected
Front country streams
Lake Area streams
Lodge Creek (1203) 1 1 0 Hotel Creek (1202) 0 0 No HCC Hatchery Creek (1201) 1 2 13 Incinerator Creek (1199) 1 0 No HCC Wells Creek (1198) 0 0 No HCC Bridge Creek (1196) 2 1 14 West Thumb Area streams
Stream 1177 (1177) 0 0 25 Little Thumb Creek (1176) 1 1 5 Stream 1167 (1167) 0 0 No HCC Sandy Creek (1166) 1 0 0 Sewer Creek (1164) 0 0 0 Backcountry streams East shore
Little Creek (1091) 3 1 7 Cub Creek (1093) 3-4 1 20 Clear Creek (1095) 1 0 18 Columbine Creek (1099) 2 1 32 Foam Creek (1103) 1 1 67 Trail Creek (1113) 4 0 91 West shore East Eagle Creek (1126) 3 3 37 West Eagle Creek (1127) 3 1 No HCC Stream 1138 (1138) 2 2 58 Stream 1141 0 0 20 Stream 1150 (1150) 2 1 13 Flat Mountain Creek (1155) 4 1 49 Delusion Lake Outlet (1158) 0 0 3 a Number of bears using each stream does not sum to a definite number of bears visiting spawning streams as movements of bears between streams are not considered.

43
Table 21. Summary of bear hair samples collected at cutthroat trout spawning streams on Yellowstone Lake, Yellowstone National Park, and analyzed for individual identification, 1997-2000.
Species identification
Year
Number
of streams sampled
Number of hair
samples collected
Number
of samples with
>10 stands
Number
of samples with DNA extracted
Grizzly bear
Black bear
Samples identified
to individual grizzly bear
Number of individual
grizzly bears
Cumulative number of
unique grizzly bears identified
1997 10 360 193 143 101 42 62 18 18
1998 12 332 173 158 113 45 84 29 42
1999 17 529 318 301 238 63 165 35 58
2000 19 472 297 273 198 75 150 38 75

44
Grizzly Bear Use of Insect Aggregation Sites Documented from Aerial Telemetry and Observations (Dan Bjornlie, Wyoming Game and Fish Department; and Mark Haroldson, Interagency Grizzly Bear Study Team) Army cutworm moths (Euxoa auxiliaris) were first recognized as an important food source for grizzly bears in the GYE during the mid 1980s (Mattson et al. 1991b, French et al. 1994). Early observations indicated that moths, and subsequently bears, showed specific site fidelity. These sites are generally high alpine areas dominated by talus and scree adjacent to areas with abundant alpine flowers. Such areas are referred to as �insect aggregation sites.� Since their discovery, numerous bears have been counted on or near these aggregation sites due to excellent sightability from a lack of trees and simultaneous use by multiple bears. Complete tabulation of grizzly presence at insect sites is nearly impossible. Not all observations of bears feeding at insect aggregation sites are specifically recorded as such, and the boundaries of sites are not clearly known. It may be possible that size and location of insect aggregation sites fluctuate from year to year with moth abundance. Prior to 1997, we delineated insect aggregation sites with convex polygons drawn around locations of bears seen feeding on moths and buffered these polygons by 500 m. The problem with this technique was that small sites were overlooked. From 1997-99 the method for defining insect aggregation sites was to inscribe a 1-km circle around clusters of observations in which bears were seen feeding on insects in talus/scree habitats (Ternent and Haroldson 2000). This method allowed trend in bear use of moth sites to be annually monitored by recording the number of bears documented in each circle (i.e., site). A new technique was developed in 2000 based on analysis from Ternent et al. (in preparation). Using this technique, sites were delineated by buffering by 500 m only the locations of bears observed actively feeding at insect aggregation sites. The borders of the overlapping buffers at individual insect sites were dissolved to produce a single polygon for each site. This new definition of �known� sites substantially decreased the number of sites described compared to past years in which locations from both feeding and non-feeding bears were used. Therefore, analysis for this report was completed for all years using this new technique. Areas suspected as insect aggregation sites but dropped from the known sites list using this technique will be termed �possible� sites and will be monitored in upcoming years for locations of actively feeding bears. These sites may then be added back to the known sites list. Monitoring bear presence within the unique boundary of each insect site would be more desirable than defining a site by a buffer based on bear locations, but it is not possible because the location of each unique boundary is presently unknown. In fact, only a few sites have been investigated by ground reconnaissance. Besides monitoring trend in use each year, ongoing research is also attempting to answer other questions, such as where do migrating moths originate and what are the implications for bears from agricultural moth control efforts (Robison 1999).

45
Presently, we know of 26 insect aggregation sites within the GYE (Table 22), with another 24 possible sites that will continue to be monitored. One new possible site was documented in 2000. The percentage of known sites with documented use by bears changes from year to year, suggesting that some years are better moth years than others (Figure 9). For example, the years 1993-95 were probably poor moth years because the percentage of known sites used by bears (Figure 9) and the number of observations recorded at insect sites (Table 22) were low. These years also had substantially more nuisance management activity than other years (Gunther et al. 2000). The number of insect aggregation sites used by bears in 2000 decreased from 17 to 14 and was slightly below the 5-year average of 14.4 sites/year from 1995-99. The percentage of total known sites used also decreased in 2000 (Figure 9), suggesting that grizzly bear use of insect aggregation sites in 2000 was slightly below average. Table 22. The number of moth sites in the Greater Yellowstone Ecosystem known annually, the number actually used by bears, and the total number of telemetry relocations or aerial observations of bears recorded at each site during 1986-2000. Year
Number of moth sites knowna
Number of moth sites usedb
Number of locations or observationsc
1986 5 1 4 1987 6 4 12 1988 7 4 42 1989 11 9 46 1990 12 9 64 1991 15 13 140 1992 18 15 88 1993 18 2 4 1994 19 7 14 1995 22 12 23 1996 23 13 64 1997 23 14 67 1998 25 16 121 1999 26 17 142 2000 26 14 78 Total
909
a The year of discovery was considered the first year a telemetry location or aerial observation was documented at a site. Sites were considered known every year thereafter regardless of whether or not additional locations were documented. b A site was considered used if ≥1 location or observation was documented within the site that year. c May include replicate sightings or telemetry relocations.

46
Figure 9. Annual number of known moth sites and percent of known sites at which either telemetry relocations of marked bears or visual observations of unmarked bears were recorded, Greater Yellowstone Ecosystem, 1986-2000. The IGBST maintains an annual list of unduplicated females observed with COY (see Table 4). Since 1986, when moth sites were initially included in aerial observation surveys, 373 initial sightings of unduplicated females with COY have been recorded, of which 80 (21%) have occurred at (within 500 m, n = 56) or near (within 1,500 m, n = 24) moth sites (Table 23). Notably, peaks in the number of initial sightings recorded at moth sites correspond with annual trends in the total number of locations (Table 23) and the percent of moth sites with documented use (Figure 9). In 2000, 5 of the 37 (13.5%) sightings of unduplicated females with COY were recorded at moth sites. This was slightly lower than the 5-year average of 15.2% from 1995-99; also suggesting that 2000 was below average for moth site use. Survey flights at insect aggregation sites obviously contribute to the count of unduplicated females with COY, however, it typically is low, ranging from 0 to 13 initial sightings/year since 1986 (Table 23). If these sightings are excluded, an increasing trend in the annual number of unduplicated sightings of female with COY is still evident. This implies that some other factor besides observation effort at moth aggregation sites is responsible for the increase in sightings of female with cubs.
0
6
12
18
24
30
1986
1987
1988
1989
1990
1991
1992
1993
1994
1995
1996
1997
1998
1999
2000
No.
Site
s K
now
n
0
20
40
60
80
100
% S
ites
Use
d
No. Sites Known% Used

47
Table 23. Number of initial sightings of unduplicated females with cubs-of-the-year (COY) that occurred on or near moth sites, number of sites where such sightings were documented, and the mean number of sightings per site in the Greater Yellowstone Ecosystem.
Initial sightings Within 500 mb Within 1,500 mc
Year
Unduplicated females with
COYa
Number of moth sites with
an initial sightingb N % N %
1986 25 0 0 0.0 1 4.0 1987 13 0 0 0.0 0 0.0 1988 19 1 2 10.5 2 10.5 1989 16 1 1 6.3 1 6.3 1990 25 2 2 8.0 2 8.0 1991 24 8 9 37.5 13 54.2 1992 25 6 7 28.0 10 40.0 1993 20 2 2 10.0 2 10.0 1994 20 2 4 20.0 5 25.0 1995 17 1 1 5.9 2 11.8 1996 33 4 4 12.1 8 24.2 1997 31 4 7 22.6 8 25.8 1998 35 4 5 14.3 9 25.7 1999 33 4 7 21.2 8 24.2 2000 37 5 5 13.5 9 24.3
Total 373 56 80 Mean 24.9 2.9 3.7 14.0 5.3 19.6
a Initial sightings of unduplicated females with COY; see Table 4. b Moth site is defined as a 500-m buffer drawn around a cluster of observations of bears actively feeding. Twenty-six sites have been identified as of 2000. c This distance is 3 times what is defined as a moth site for this analysis, since some observations could be made of bears traveling to and from moth sites.

48
The Ecological Relationship Between a Rocky Mountain Threatened Species and a Great Plains Agricultural Pest (Hillary Robison, Ph.D. candidate, University of Nevada, Reno) Project Summary Army cutworm moth (ACM) adults migrate from Great Plains agricultural areas to the Rocky Mountains and aggregate in high-elevation talus slopes. These ACM aggregations provide and important food resource for grizzly bears. Much is known about the agricultural aspect of the life history of ACMs. However, relatively little is known about their alpine and migratory ecology and their population genetics. Summer and fall 2000 was the second field season of this study, which aims to elucidate how ACM ecology and population genetics may impact grizzly bear conservation. This information will help us understand factors that affect the number of ACMs reaching the high elevation areas where they are a food source for bears. The results of this study will provide groundwork for further investigations of the affects of moth variability and abundance on grizzly bear fecundity and mortality, as well as provide insights to biologists that may help them make management decisions. Background and Significance A link between army cutworm moth migration and grizzly bear conservation.--In 1952, grizzly bears were found feeding on army cutworm moths and ladybird beetles (Coccinella spp. and Hippodamia spp.) aggregated in talus slopes (Chapman et al. 1955). Since this discovery, grizzly bears have been seen feeding on ACMs in the summer and fall at several remote high elevation moth aggregation sites in Montana and Wyoming (Craighead et al. 1982, Servheen 1983, Klaver et al. 1986, Mattson et al. 1991b, French et al. 1994, O�Brien and Lindzey 1994, White 1996). Army cutworm moths are a critical summer and fall food source for grizzly bears. Grizzly bears excavate the moths from the talus and consume them by the thousands from July through September (Chapman et al. 1955, Pruess 1967, Mattson et al. 1991b, French et al. 1994, White 1996). When compared to other food sources, ACMs are the highest source of digestible energy available to grizzly bears (Mealey 1975, Pritchard and Robbins 1990, French et al. 1994, Craighead et al. 1995, White 1996). Over a 30-day period, a grizzly bear feeding extensively on ACMs can consume 47% of its annual energy budget (White 1996). When ACMs and whitebark pine nuts (WBPNs) are abundant in the fall, grizzly bears move to high elevations to forage on these rich food sources and in doing so geographically separate themselves from areas of human activity. Due to this geographic separation, far fewer grizzly bear management situations and grizzly bear mortalities are recorded during years when ACMs are present than during years when ACMs are absent (Gunther et al. 1993, 1994, 1995, 1996, 1997). Whitebark pine resources are similarly important, as abundance of WBPNs in the fall is positively correlated with increased grizzly bear fecundity, but inversely correlated with grizzly bear mortality and the number of grizzly bear management actions (Mattson et al. 1992; Gunther et al. 1993, 1995). Cyclic crashes in the WBPN crop and the potential damage to whitebark pine from

49
blister rust increase the importance of understanding the factors affecting ACM abundance at high-elevation grizzly bear foraging sites. In 1991 and 1992, an average of 44% of all known grizzly bears in the GYE foraged at ACM aggregation sites in the Absaroka Mountains, Wyoming (O�Brien and Lindzey 1994). Female grizzly bears comprised 40% of these bears (O�Brien and Lindzey 1994). Female grizzly bear survivorship and reproduction is important to grizzly bear population persistence (Bunnell and Tait 1981, Eberhardt 1990, Craighead and Vyse 1996). Cub production depends on adequate pre-hibernation weight gain and fat deposition by the female (Rogers 1987) and may reflect the quantity and quality of available food (Stringham 1990, McLellan 1994). Since female grizzly bears comprise a large percentage of all bears foraging at moth aggregation sites in the Absaroka Mountains and because the goal of the Endangered Species Act is to recover species and to ensure their persistence through time, the availability of ACMs to grizzly bears is important to the conservation of the grizzly bear population. Biology of the army cutworm moth.--The ACM is a native North American agricultural pest whose distribution ranges from California to Kansas and from Alberta, Canada, to Arizona and New Mexico. Adult moths lay their eggs in the fall (Strickland 1916, Burton et al. 1980). The larvae feed on a wide variety of host plants including small grains, alfalfa and sugar beets until early winter and then over-winter underground. The adult moths emerge in May and migrate to high-elevation talus slopes in the Rocky Mountains (Pruess 1967). Once ACMs reach the mountains, they remain there from July through September. At night, the moths forage on the nectar of high-alpine flowers (Pruess 1967, French et al. 1994). During the day, the moths hide in talus rockslides (Pruess 1967, French et al. 1994, O�Brien and Lindzey 1994, White 1996). From late August through the beginning of October, the moths back-migrate to the Great Plains and oviposit into the soil (Pruess 1967, Burton et al. 1980). Project Objectives The main objectives of this study are to determine ACM origins, to determine whether ACMs interbreed or comprise different migratory groups, and to determine if ACMs harbor pesticides. Genetic data have been used to answer migration questions and have proved to be efficient at differentiating populations or groups of populations (Queller et al. 1993, Estoup et al. 1995, Garcìa-Moreno et al. 1996, Bolten et al. 1997, Palsboll et al. 1997, Rankin-Baransky et al. 1997). Female moths can be examined in order to determine if they are mated (K. Pruess, University of Nebraska, personal communication; D. LaFontaine, Agriculture Canada, personal communication). Determining ACM origins and site fidelity is important because pressures on ACMs in natal areas, whether natural (e.g., weather patterns) or human-caused (e.g., pesticides or habitat loss), may affect moth recruitment and the numbers of adults reaching high-elevation sites. Analysis of ACM microsatellite data will allow determination of where ACMs originate and whether ACMs are interbreeding at high elevation sites. To complement genetic data, physical evidence will also be collected to determine whether ACMs mate in high elevations and, therefore, are capable of interbreeding there prior to their return to agricultural areas.

50
Managers will be able to use the information gathered in this study to help foresee the availability of ACMs to bears in high-elevation areas. This approach may prove more feasible in helping foresee ACM availability than visiting the remote aggregation sites. Work in Progress Field sampling High elevation.--Black-light traps are used from mid-July to late August to catch ACMs at moth aggregation sites. Crews collect ACMs for genetic analyses, for pesticide analysis, and for evaluation of female reproductive status. To date, ACMs have been collected from a total of 11 high-elevation sites, including 9 sites in Wyoming, 1 site in Washington, and 1 site in New Mexico. In summer 2000, ACMs were collected from the 5 high-elevation sites in Wyoming that were sampled in 1999, as well as from 4 new sites in Wyoming. The U.S. Fish and Wildlife Service in Lacey, Washington also collected and sent ACM samples, which they collected in high-elevation areas in the Cascades. Low elevation.--In the late summer and early fall, field crews trap ACMs in agricultural areas with pheromone traps. The crew�s trapping efforts are coordinated with the ACM trapping programs of university agricultural extension services in Nebraska, Montana, and South Dakota. In fall 1999, ACMs were collected at 15 areas in the states of Montana, Wyoming, Nebraska, and South Dakota. In fall 2000, the number of agricultural areas sampled in these states increased to 41 and included 8 new sites in Idaho and 1 new site in northeastern Utah. The sampling effort was expanded in 2000 in order to sample a 360-degree radius around the high-elevation study areas. Laboratory Procedures All the samples that were collected for pesticide residue analysis during the 1999 field season were sent to the U.S. Geological Survey�s CERC laboratory in Missouri. The lab found only non-significant traces of pesticides in the moths. The genetic data are being analyzed in the Laboratory of Ecological and Evolutionary Genetics at the University of Nevada, Reno (UNR). Extraction of DNA from the ACM samples collected in 1999 and 2000 began when funds became available in May 2000 and is continuing. The ACM DNA has been screened for microsatellite loci and primers have been designed to amplify these loci. Currently, polymerase chain reactions (PCRs) are being optimized for each of the ACM microsatellite loci. Analysis of the variability at the microsatellite loci is occurring concurrently with PCR optimization. Project completion date: Summer 2003.
51
Project Products The results of this research will be written in manuscript form and submitted to several peer-reviewed journals. A Ph.D. thesis will be submitted to a dissertation committee at the UNR, the results will be presented in a public defense, and the thesis will be bound and archived at the UNR. Funding Sources Rob & Bessie Welder Wildlife Foundation Yellowstone Park Foundation International Bear Association � Bevins Fund Sigma Xi American Museum of Natural History U.S. Forest Service, Region 1 Yellowstone National Park, Bear Management Office Interagency Grizzly Bear Study Team Wyoming Game and Fish Department (1999) Cooperators Interagency Grizzly Bear Study Team Yellowstone National Park, Bear Management Office U.S. Forest Service, Region 1 Montana State University, Bozeman Agricultural Extension Agents Wyoming Game and Fish Department
52
Whitebark Pine Cone Production (Mark Haroldson and Shannon Podruzny, Interagency Grizzly Bear Study Team) Whitebark pine cone production averaged 5.7 cones/tree for 18 of 19 transects read during 2000 (Table 24). Transect F was not read due to the Beaver Creek fire, which forced the closure of that portion of the Gallatin National Forest during late July and early August, when transects are normally read. Cone production was generally poor on transects (Table 25). Three exceptions where good cone production occurred were in Deaf Jim Canyon (transect A) near the northern boundary of Yellowstone National Park, and transects T and U located in the southeastern portion of the GYE (Figure 10). Although cone production for 2000 was poor, many observers reported considerable numbers of last year�s cones still on the trees and ground. The mean 1999 results of 39 cones/tree was the second highest observed since we began reading whitebark pine transects in 1980 (Figure 11). Whitebark pine scats were found throughout the spring and summer, indicating that grizzly bears used last year�s over-wintered cones well into the fall of 2000. Near exclusive use of whitebark pine seeds occurs during years in which mean cone production on transects exceeds 20 cones/tree (Blanchard 1990, Mattson et al. 1992). During years of low whitebark pine seed availability, grizzly bears range wider and seek alternate foods, which often brings them in close proximity to human activities during the fall. This often results in an increase in the number of management captures and transports (Figure 11), and human-caused mortality. During August through October of 2000 only 8 management captures involving bears 2 years of age or older (independent) resulted in transport or removal of nuisance individuals. All of these management actions were outside of the recovery zone boundary; 2 actions occurred outside the 10-mile perimeter. During September through November, 11 known and probable hunting related grizzly bear mortalities occurred in the GYE. The poor 2000 whitebark pine cone crop likely influenced this relatively high total. Whitebark pine is potentially threatened in the GYE by an introduced fungus, white pine blister rust. Blister rust has already decimated whitebark pine in northwest Montana (Keane and Arno 1993). Infection occurs in the GYE, but as yet has not caused extensive tree mortality (Smith and Hoffman 1998). The potential loss of whitebark pine seeds may be particularly devastating to grizzlies in the GYE because few alternative fattening foods are available during late summer and fall. During 2000, field crews visited 17 of 19 whitebark pine cone production transects in the GYE to survey the extent of blister rust infection on transects. Fifty-three percent (9 of 17) of transects visited contained trees that were definitely infected with blister rust. Another 47% (8 of 17) were possibly infected. We found a total of 7 dead trees on 4 transects. Of the 163 live trees examined, 31% were definitely infected with blister rust and an additional 50% were likely infected. Thirty-one trees had no evidence of infection. Mountain pine beetles were found on 4 transects. Field crews also conducted photo documentation of each tree on transects so that the rate of blister rust spread and potential mortalities of trees can be ascertained. The 2 transects not visited in 2000 will be examined for blister rust in 2001.
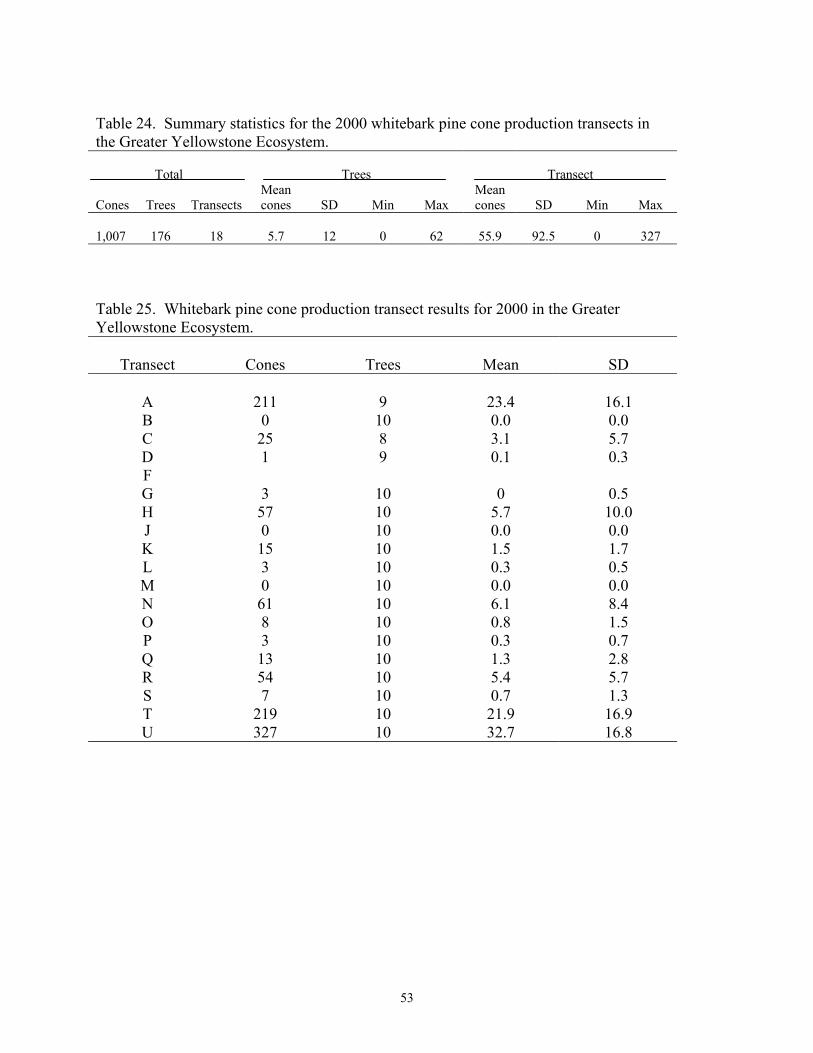
53
Table 24. Summary statistics for the 2000 whitebark pine cone production transects in the Greater Yellowstone Ecosystem.
Total Trees Transect Cones Trees Transects
Mean cones SD Min Max
Mean cones SD Min Max
1,007 176 18 5.7 12 0 62 55.9 92.5 0 327 Table 25. Whitebark pine cone production transect results for 2000 in the Greater Yellowstone Ecosystem.
Transect Cones Trees Mean SD
A 211 9 23.4 16.1 B 0 10 0.0 0.0 C 25 8 3.1 5.7 D 1 9 0.1 0.3 F G 3 10 0 0.5 H 57 10 5.7 10.0 J 0 10 0.0 0.0 K 15 10 1.5 1.7 L 3 10 0.3 0.5 M 0 10 0.0 0.0 N 61 10 6.1 8.4 O 8 10 0.8 1.5 P 3 10 0.3 0.7 Q 13 10 1.3 2.8 R 54 10 5.4 5.7 S 7 10 0.7 1.3 T 219 10 21.9 16.9 U 327 10 32.7 16.8

54
Figure 10. Location of whitebark pine cones production transects in the Greater Yellowstone Ecosystem.
#Y
#Y
#Y
#Y
#Y
#Y
#Y
#Y
#Y#Y
#Y
#Y #Y
#Y#Y
#Y#Y
#Y #Y
Bridger-Teton NF
Shoshone NF
Gallatin NF
Yellowstone NP
Targhee NF
Custer NF
Beaverhead
Grand Teton
Beaverhead NF
Gallatin NF
Gallatin NF
Shoshone NF
AB
C
D
F
G
H
J
KL
M
N O
P
Q
R
T U
S
N
Greater Yellowstone Ecosystem#Y Transects
20 0 20 40 Kilometers
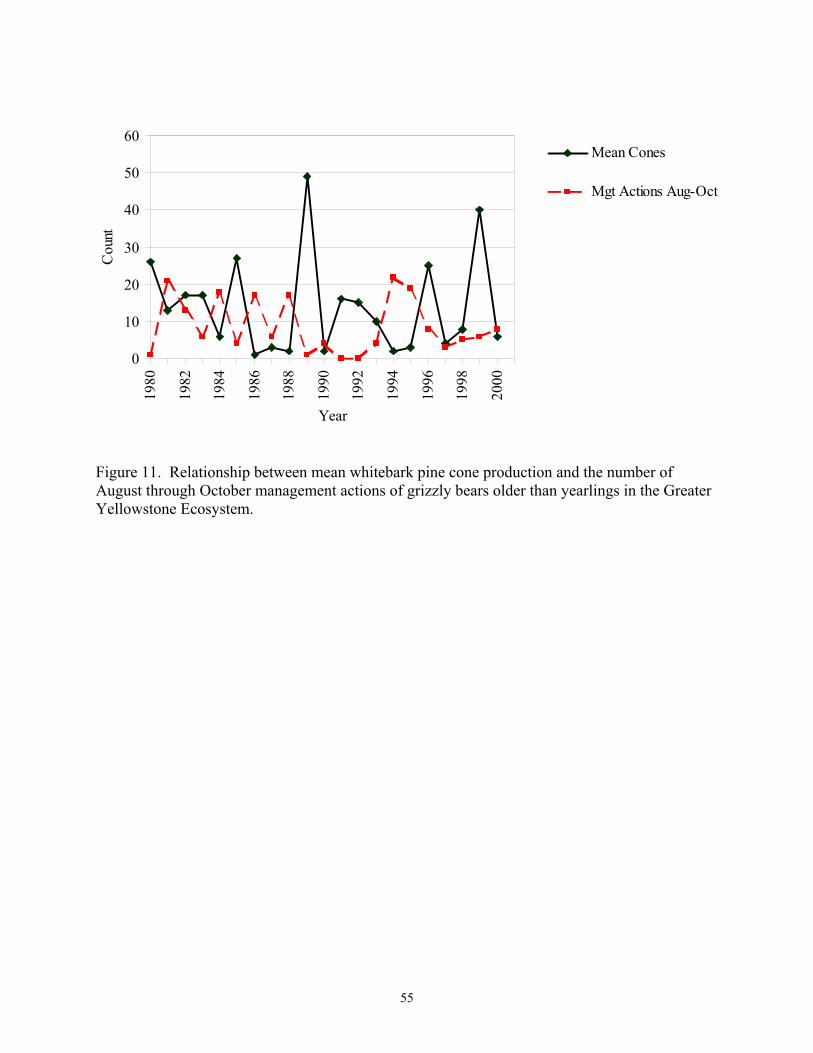
55
Figure 11. Relationship between mean whitebark pine cone production and the number of August through October management actions of grizzly bears older than yearlings in the Greater Yellowstone Ecosystem.
0
10
20
30
40
50
6019
80
1982
1984
1986
1988
1990
1992
1994
1996
1998
2000
Year
Cou
nt
Mean Cones
Mgt Actions Aug-Oct
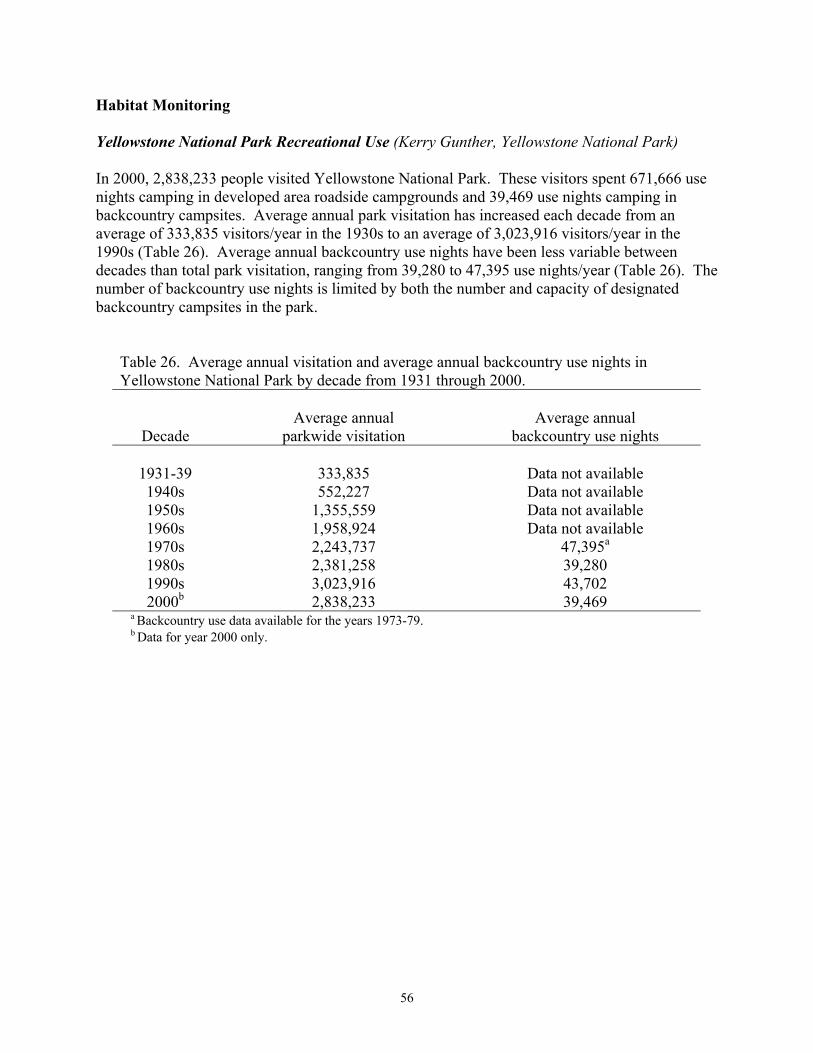
56
Habitat Monitoring Yellowstone National Park Recreational Use (Kerry Gunther, Yellowstone National Park) In 2000, 2,838,233 people visited Yellowstone National Park. These visitors spent 671,666 use nights camping in developed area roadside campgrounds and 39,469 use nights camping in backcountry campsites. Average annual park visitation has increased each decade from an average of 333,835 visitors/year in the 1930s to an average of 3,023,916 visitors/year in the 1990s (Table 26). Average annual backcountry use nights have been less variable between decades than total park visitation, ranging from 39,280 to 47,395 use nights/year (Table 26). The number of backcountry use nights is limited by both the number and capacity of designated backcountry campsites in the park.
Table 26. Average annual visitation and average annual backcountry use nights in Yellowstone National Park by decade from 1931 through 2000.
Decade Average annual
parkwide visitation Average annual
backcountry use nights
1931-39 333,835 Data not available 1940s 552,227 Data not available 1950s 1,355,559 Data not available 1960s 1,958,924 Data not available 1970s 2,243,737 47,395a
1980s 2,381,258 39,280 1990s 3,023,916 43,702 2000b 2,838,233 39,469
a Backcountry use data available for the years 1973-79. b Data for year 2000 only.

57
Grand Teton National Park Recreational Use (Steve Cain, Grand Teton National Park) In 2000, total visitation in Grand Teton National Park was 4,041,286 people, including recreational, commercial (e.g. Jackson Hole Airport), and incidental (e.g. traveling through the Park on U.S. Highway 191 but not recreating) use. Recreational visits alone totaled 2,603,068. Backcountry user nights totaled 32,332. Long-term trends of total visitation and backcountry user nights by decade are shown in Table 27.
Table 27. Average annual visitation and average annual backcountry use nights in Grand Teton National Park by decade from 1951 through 2000.
Decade Average annual
parkwide visitationa Average annual
backcountry use nights
1950s 1,104,357 Data not available 1960s 2,326,584 Data not available 1970s 3,357,718 25,267 1980s 2,659,852 23,420 1990s 2,662,940 20,663 2000b 2,603,068 32,332
a In 1983 a change in the method of calculation for parkwide visitation resulted in decreased numbers. Another change in 1992 increased numbers. Thus, parkwide visitation data for the 1980s and 1990s are not strictly comparable. b Data for year 2000 only.

58
The Effect of Environmental Variability on Grizzly Bear Habitat Use: Year Two (Doug Ouren, Interagency Grizzly Bear Study Team) Introduction The overall design of this project is to utilize existing data, expertise, and newly collected information from advanced technologies to evaluate the impact of anthropogenic influences on grizzly bear habitat selection. To achieve this goal we have developed the following objectives:
• Quantify spatial and temporal patterns of grizzly bear habitat selection. • Quantify spatial and temporal patterns of human activities. • Evaluate potential relationships between habitat use and road density. • Evaluate potential relationships between habitat use and intensity and types of human
activity • Evaluate potential relationships between habitat selection and land management status.
The first year progress report can be found in Ouren (2000). The specific objectives of the second year of this project were to:
• Deploy 16 Telonics GEN-II GPS collars • Retrieve remaining collars from the previous season • Deploy vehicle counters • Conduct preliminary home range analysis on data
Collar Deployment and Retrieval For this study, the IGBST was able to instrument 15 grizzly bears during the 2000 trapping season. Of the 15 grizzly bears collared, 6 were adult females, 1 was a subadult female, 7 were adult males, and 1 was a subadult male. The first collar was deployed 3 May 2000 and the last collar was deployed 22 September 2000. The collars used this year were the Telonics GEN-II store on board GPS systems, which include a GPS receiver, datalog memory, parameter memory, system processor, and a VHF beacon transmitter. These systems attempted to collect a location every 210 minutes and were programmed with a duty cycle to power down the GPS receiver on 15 November 2000 and power up 15 April 2001. Therefore, these collars attempt to collect data only throughout the non-denning season. There was also an attempt to collect a VHF location approximately every 10 days. Collars were equipped with the CR-2 Telonics programmable breakaway collar release device that had been programmed for collar removal on different dates throughout summer 2001. Just prior to den emergence, all collars were still operating with the exception of 2 collars: 1 was shed by bear #80 and we lost VHF contact with the other. The retrieved collar from bear #80 had successfully collected a location on 68.7% of its attempts. This is in comparison to an average rate of just 33% during the 1999 season. Preliminary analysis comparing home range delineation using the 95% kernel home range estimator indicates that GPS location data provides a more discrete home range based on density of use than the location data provided by the VHF data (Figure 12).

59
Figure 12. Home ranges calculated using GPS and VHF telemetry data. Collars that were deployed in the 1999 field season had an operational life of 4 months; thus, the majority of these collars were retrieved and retired in the fall of 1999. Retrieval of the 2 remaining 1999 collars was attempted during 2000 field season. Several unsuccessful attempts were made to collect the collar that bear #332 had shed in the area of Bobcat Creek on the South Fork of the Shoshone River, but each of these attempts was met with weather created obstacles. The VHF on this collar is no longer operational and it has been declared a non-recoverable collar. The second collar also malfunctioned and we were not able to retrieve it.
GPS Kernel Home Range VHF Kernel Home Range Parks

60
Deploying Vehicle Counters The impact of human activities on grizzly bears is an important factor in the GYE. One of the most prevalent human activities is the use of motorized transportation systems. These transportation systems provide increased access into grizzly bear habitat and thus increase the risk of mortality and dilute the effectiveness their habitat (Brannon 1984, Archibald et al. 1987, Mattson et al. 1987, McLellan and Shackleton 1988, Kasworm and Manley 1990, Mace et. al. 1996). Results of studies by Aune and Kasworm (1989) found that 63% of 43 grizzly bear mortalities on the Rocky Mountain front occurred within 1 km of the nearest road. Historically in the GYE this question of impact has been addressed by looking at road densities and not the intensity of use on those roads. While this project will develop and utilize information on road densities it will also collect information on the intensity of motorized transportation use to explore the strength of the relationship between motorized use and grizzly bear habitat use. To address the question of intensity of use during the 2000 field season we tested and deployed eight counters. The vehicle counters were PER-12-T sensors (Compu-Tech Systems; Electronic Counting Systems, Bend, Oregon) that detect heat and motion up to 100 feet from the sensor head. The Gallatin National Forest provided funding for these counters. Study site (Taylors Fork and Buck Creek drainages in the Madison mountain range in southwestern Montana) was based on multiple use land practices, somewhat limited motorized access, and the fact we have GPS-collared bears in the area. Vehicle counters were deployed in early August 2000 and collected late November 2000. Data was downloaded throughout the summer and fall. Figure 13 shows data collected from 1 of the 8 counters. This counter was placed on the main fork of the Taylors Fork drainage. As the graph shows, the bulk of the use occurs between 0530 and 2100 hours. Conversely, there was a window of time when there was little to no use on these roads from 2100 to 0530 hours. The pattern of use on Route 191, the highway that provides access to the Taylors Fork, also shows continual use from approximately 0430 hours to just after midnight. These data also illustrates the times of heavy use (including weekends, summer, and the beginning of hunting seasons) and times of light use (i.e., during the time of forest closures due to wild fires). The other 7 counters showed similar patterns of use, but fewer total vehicle trips as one proceeded up the drainages. Year 2001 Collar Deployment.--During the upcoming field seasons we will attempt to deploy 14 new or refurbished GPS collars. We will focus collar deployment on multiple-use lands. The majority of lands managed as multiple-use that are in grizzly bear recovery zone are within the Hilgard, Gallatin, and Henrys Lake BMUs. Data from these areas will provide important information when addressing the questions of differing habitat selection in parks and wilderness areas versus lands managed for multiple use.

61
Figure 13. Vehicle counter data collected from August through October in 2000. For the 2001 field season, we will deploy 10 vehicle counters as described for 2000 and we will test seismic and magnetic vehicle counters for their application of use for this project. In addition to counting of vehicles, we will inventory the motorized and non-motorized access points of entry for the Hilgard, Gallatin, and Henrys Lake BMUs to give us a better idea on quantifying human activities. We also will conduct an experiment to look at the effects of vegetation type, slope, elevation, and aspect on the ability of collars to successfully collect GPS locations. For this experiment, researchers will use 5 Telonics GPS collars instrumented identically to those placed on bears, collars will be put in various vegetation types, elevations, slopes, and aspects as per a pre-defined sampling scheme. The objective of this project is to assess bias of GPS locations. In addition to the GPS collaring, collar testing, and data collection efforts, this project will collect various ancillary geo-spatial data sets to help in the analysis of grizzly bear habitat selection. These data sets include but are not limited to satellite imagery and aerial photography at various resolutions, climate data, topographic information, land use/change information, and data on roads and trails throughout the ecosystem.
Taylor Fork Vehicle Counts
0:00
2:24
4:48
7:12
9:36
12:00
14:24
16:48
19:12
21:36
0:00
8/4/20
00
8/11/2
000
8/18/2
000
8/25/2
000
9/1/20
00
9/8/20
00
9/15/2
000
9/22/2
000
9/29/2
000
10/6/
2000
10/13
/2000
10/20
/2000
10/27
/2000
Date
Tim
e
Hunting Season BeginsFire Closure

62
Trends in Elk Hunter Numbers within the Grizzly Bear Recovery Zone plus the 10-mile Perimeter Area (Dave Moody, Wyoming Game and Fish Department; Jeff Copeland, Idaho Department of Fish and Game; and Kurt Alt, Montana Department of Fish, Wildlife and Parks) The State wildlife agencies in Idaho, Montana, and Wyoming annually estimate the number of people hunting most major game species. We used state estimates for the number of elk hunters by hunt area as an index of hunter numbers for the Grizzly Bear Recovery Zone plus the 10-mile perimeter area. Because some hunt area boundaries did not conform exactly to the Recovery Zone and 10-mile perimeter area, field personnel familiar with each area were queried to estimate hunter numbers within the Recovery Zone plus the 10-mile perimeter area. Elk hunters were tallied because they represent the largest cohort of hunters for individual species. While there are sheep, moose, and deer hunters using the Recovery Zone and 10-mile perimeter area, their numbers are fairly small and many hunt in conjunction with elk, especially in Wyoming, where seasons overlap. Elk hunter numbers represent a reasonably accurate index of total hunter numbers within areas occupied by grizzly bears in the GYE. We generated a complete data set from all states from 1990 to 2000 (Table 28). Elk hunter numbers increased from a low of 33,350 in 1990 to just over 40,000 in 1991. These numbers fluctuated <7% from 1992 to 1996, averaging about 38,600. This trend primarily reflects increasingly liberal elk seasons in this region in the late 1980s and early 1990s in an attempt to stabilize or decrease elk herds in Wyoming and Montana. In 1988, Idaho implemented more restrictive hunting seasons in an effort to increase bull:cow ratios for their herds. Hunter numbers in Idaho have actually decreased slightly since 1990. The majority of the increase in hunters during the early 1990s occurred within Montana, especially during 1991. Hunter numbers were fairly constant in Wyoming from 1990 to 1999. Numbers decreased by approximately 3,000 from 1999 to 2000 due to more restrictive seasons. Incomplete data sets from Montana in 1997, 1998, and 2000, preclude trend analysis. Table 28. Estimated number of elk hunters within the Grizzly Bear Recovery Zone plus a 10-mile perimeter in Idaho, Montana, and Wyoming, for the years 1990-2000. Year State 1990 1991 1992 1993 1994 1995 1996 1997 1998 1999 2000 Idaho 3,172 2,292 2,573 2,962 2,682 2,366 3,102 2,869 2,785 2,883 a
Montana 13,988 21,502 19,321 18,238 20,042 18,783 18,044 a a 15,223 a Wyoming 16,190 16,233 17,154 17,105 17,053 17,464 16,283 17,458 15,439 15,727 12,812 Total 33,350 40,027 39,048 38,305 39,777 38,713 37,429 33,833 a Hunter number estimates not currently available.
63
There are several lines of speculation as to why hunter-related bear losses have increased. Initially, there was some speculation that that bear losses were correlated with increased hunter numbers. While there were increases in individual states during the past 10-year period, there has not been a significant increase in total hunter numbers. Other hypotheses include too many hunters in occupied grizzly habitat, an increasing bear population with increased odds of bear-hunter encounters, and improper human reactions to bear encounters. It is commonly accepted that some bear losses could be avoided if people followed the recommended standards for human behavior in bear country. To that end, State wildlife and federal land agencies have attempted to reduce the losses by expanding information and education programs. �Living in Bear Country� workshops are conducted annually in most of the gateway communities in Wyoming, and licensed outfitters and guides have instituted increased training for their members and clientele. The success of these programs will be directly reflected in grizzly bear moralities associated with hunters. We will continue to monitor hunter numbers and grizzly bear hunter conflicts in an attempt to provide information that will help managers make ungulate hunting more compatible with grizzly bear conservation.

GRIZZLY BEAR - HUMAN CONFLICTS, CONFRONTATIONS, AND MANAGEMENT ACTIONS IN
THE GREATER YELLOWSTONE ECOSYSTEM 2000
INTERAGENCY GRIZZLY BEAR COMMITTEE YELLOWSTONE ECOSYSTEM SUBCOMMITTEE REPORT
Compiled by Yellowstone National Park � November 2001
Written By:
Kerry A. Gunther - Yellowstone National Park Mark T. Bruscino - Wyoming Game and Fish Department Steve Cain - Grand Teton National Park Jeff Copeland - Idaho Department of Fish and Game Kevin Frey - Montana Fish, Wildlife and Parks Mark A. Haroldson - Interagency Grizzly Bear Study Team Charles C. Schwartz - Interagency Grizzly Bear Study Team

65
TABLE OF CONTENTS LIST OF TABLES.........................................................................................................................66 LIST OF FIGURES .......................................................................................................................68 INTRODUCTION ........................................................................................................................ 69 ACKNOWLEDGMENTS ............................................................................................................ 69 METHODS ................................................................................................................................... 71 RESULTS ..................................................................................................................................... 71
Availability Of Bear Foods During 2000................................................................................. 71
Grizzly Bear-Human Conflicts ................................................................................................ 73
Grizzly Bear-Human Confrontations........................................................................................73
Grizzly Bear Management Captures........................................................................................ 84
Human-Caused Grizzly Bear Mortalities................................................................................. 84
AGENCY SUMMARIES ............................................................................................................. 97
Grand Teton National Park ...................................................................................................... 97
Idaho Department Of Fish and Game ...................................................................................... 97
Montana Fish, Wildlife and Parks ........................................................................................... 97
Wyoming Game and Fish Department .................................................................................. 101
Yellowstone National Park .................................................................................................... 104
DISCUSSION............................................................................................................................. 106
Year 2000 Overview.............................................................................................................. 106
Geographic Areas With High Numbers Of Conflicts ............................................................ 107
Current Management Concerns ............................................................................................. 107
Concerns For The Future ....................................................................................................... 108
APPENDIX B. Feasibility of using portable electric fencing to prevent damage to livestock and apiaries by bears and other predators .............................................................. 122

66
LIST OF TABLES Table Page
29 Number of incidents of grizzly bear-human conflicts reported within different wildlife management agency jurisdictions in the Greater Yellowstone Ecosystem, 2000 ............................................................................................................ 74
30 Number of incidents of grizzly bear-human conflicts reported within different land ownership areas in the Greater Yellowstone Ecosystem, 2000 ............................. 76
31 Number of incidents of grizzly bear-human conflicts reported within different Bear Management Units inside the designated Greater Yellowstone Ecosystem Recovery Zone, 2000 ..................................................................................................... 77
32 Number of incidents of grizzly bear-human conflicts reported in different Bear Management Units in the Greater Yellowstone Ecosystem outside of the designated grizzly bear Recovery Zone, 2000............................................................... 78
33 Number of incidents of grizzly bear-human confrontations reported within different wildlife management agency jurisdictions in the Greater Yellowstone Ecosystem, 2000 ............................................................................................................ 79
34 Number of incidents of grizzly bear-human confrontations reported within different land ownership areas in the Greater Yellowstone Ecosystem, 2000 .............. 81
35 Number of incidents of grizzly bear-human confrontations reported within different Bear Management Units inside the Greater Yellowstone Ecosystem grizzly bear Recovery Zone, 2000 ................................................................................. 82
36 Number of incidents of grizzly bear-human confrontations reported in different Bear Management Units in the Greater Yellowstone Ecosystem outside of the designated grizzly bear Recovery Zone, 2000 ........................................ 83
37 Grizzly bears captured during management actions in the Greater Yellowstone Ecosystem, 2000 ............................................................................................................ 85
38 Number of incidents where grizzly bears were captured in management actions within different wildlife management agency jurisdictions in the Greater Yellowstone Ecosystem, 2000 ....................................................................................... 86
39 Number of incidents where grizzly bears were captured in management actions within different landownership areas in the Greater Yellowstone Ecosystem, 2000 ............................................................................................................ 88
67
40 Number of incidents where grizzly bears were captured in management
actions in different Bear Management Units inside the Greater Yellowstone Ecosystem grizzly bear Recovery Zone, 2000............................................................... 89
41 Number of incidents where grizzly bears were captured in management actions in different Bear Management Units outside of the designated grizzly bear Recovery Zone in the Greater Yellowstone Ecosystem, 2000 .................. 90
42 Number of incidents of known human-caused grizzly bear mortalities within different wildlife management agency jurisdictions in the Greater Yellowstone Ecosystem, 2000 ....................................................................................... 91
43 Known human-caused grizzly bear mortalities in the Greater Yellowstone Ecosystem, 2000 ............................................................................................................ 92
44 Number of incidents of known human-caused grizzly bear mortalities within different land ownership areas in the Greater Yellowstone Ecosystem, 2000 .............. 94
45 Number of incidents of human-caused grizzly bear mortalities within each Bear Management Unit inside the Greater Yellowstone Ecosystem grizzly bear Recovery Zone, 2000 ............................................................................................. 95
46 Number of incidents of human-caused grizzly bear mortalities within each Bear Management Unit in the Greater Yellowstone Ecosystem that occurred outside of the designated grizzly bear Recovery Zone, 2000 ........................................ 96
47 Number of incidents of different types of grizzly bear-human conflicts in 2000 compared to the average number of conflicts recorded from 1992-99 in the Greater Yellowstone Ecosystem..........................................................................106

68
LIST OF FIGURES Figure Page
14 Map of Bear Management Units (BMUs) inside (1-18) the Greater Yellowstone Ecosystem grizzly bear Recovery Zone and designated BMUs outside (19-28) of the recovery zone boundary, 2000 ................................................... 70
15 Locations of grizzly bear-human conflicts reported in the Greater
Yellowstone Ecosystem, 2000 ....................................................................................... 75
16 Locations of grizzly bear-human confrontations reported in the Greater Greater Yellowstone Ecosystem, 2000.......................................................................... 80
17 Locations of management actions where grizzly bears were captured in the
Greater Yellowstone Ecosystem, 2000.......................................................................... 87
18 Locations of known human-caused grizzly bear mortalities in the Greater Yellowstone Ecosystem, 2000 ....................................................................................... 93

69
INTRODUCTION Conservation of grizzly bears in the GYE (Figure 14) requires protecting sufficient habitat and maintaining sustainable levels of human-caused mortality. Most human-caused grizzly bear mortalities are directly related to grizzly bear-human conflicts or confrontations. To effectively allocate resources for implementing management actions designed to prevent grizzly bear-human conflicts and confrontations from occurring, land and wildlife managers need baseline information as to the types, causes, locations, and trends in these types of incidents. To address this need, we record all grizzly bear-human conflicts, confrontations, management captures, and human-caused grizzly bear mortalities reported in the GYE annually. The objective of this report is to promote the reduction and/or prevention of incidents of bear-caused human injuries, property damages, livestock depredations, confrontations, and human-caused grizzly bear mortalities through dissemination of information to the public and preventative rather than reactive management actions involving grizzly bears. This report will assist both government agencies and non-government organizations in setting priorities for allocating resources to reduce bear-human conflicts and confrontations. Prioritization will enable available personnel and funding to be focused on correcting the most prevalent types of bear-human conflicts and confrontations occurring in the ecosystem, especially those that lead to the highest numbers of human-caused grizzly bear mortalities. This report is intended to be a summary. Interested parties should contact the appropriate agency with wildlife management jurisdiction for detailed information concerning any of the incidents listed in this document.
ACKNOWLEDGMENTS We acknowledge Darren Ireland for producing GIS maps of the data. In addition to the authors listed, the following individuals were instrumental in supplying, summarizing, or clarifying data: Mark Biel (Bear Management Office, Yellowstone National Park) Heath Corrigan (Bear Management Office, Yellowstone National Park) Brian DeBolt (Wyoming Game and Fish Department) Darren Ireland (Bear Management Office, Yellowstone National Park) Dave Moody (Wyoming Game and Fish Department) Shannon Podruzny (Interagency Grizzly Bear Study Team)

70
Figure 14. Map of designated Bear Management Units (BMUs) inside (1 � 18) the Greater Yellowstone Ecosystem grizzly bear recovery zone and designated BMUs outside (19 � 28) of the recovery zone boundary, 2000.
HILLGARD (1)
GALLATIN (2)
HELLROARING/BEAR (3)
BOULDER/SLOUGH (4)
CRANDALL/SUNLIGHT (6)
LAMAR (5)
WASHBURN (9)
MADISON (11)
HENRY'S LAKE (12)
PLATEAU (13)
FIREHOLE/HAYDEN (10)
PELICAN/CLEAR (8)
SHOSHONE (7)
THOROFARE (15)
TWO OCEAN/LAKE (14)
BECHLER/TETON (18)
BUFFALO/SPREAD CREEK (17)
SOUTH ABSAROKA (16)
Beaverhead (19)
Bozeman (20)
Livingston (21)
Beartooth (22)
Clark's Fork (23)
Meeteetse (24)
Wind River (25)
Gros Ventre (26)
Big Hole (27)
Island Park (28)
70 0 70 140 Kilometers
N
EW
S
Major LakesBear Management Unit BoundariesYNP BoundaryGrizzly Bear Recovery Zone

71
METHODS Methods of data collection and definitions of terms and abbreviations used in this report are described in detail by Gunther et al. (2000). The following new terminology is used in this report: Season: In all previous reports, the active, non-denning bear seasons were defined as spring (March, April, May), summer (June, July, August), and fall (September, October, November). Starting with this report, season dates are based on major changes in bear behavior and food habits as defined for the GYE by Mattson et al. (1999). Spring Season: Den emergence through 15 May. Winter-killed ungulate carcasses are the primary, high-quality bear food during the spring season (Mattson et al. 1999). Estrous Season: 16 May through 15 July. Breeding activity is a primary behavior during this season. The primary, high-quality bear foods during the estrous season are elk calves and spawning cutthroat trout (Mattson et al. 1999). Early Hyperphagia: 16 July through 31 August. This season is characterized by the onset of hyperphagia and consumption of army cutworm moths (Mattson et al. 1991b), over-wintered whitebark pine nuts when present (Mattson et al. 1992), and roots (Mattson et al. 1991a). Hyperphagia is the period of intensive search for high-energy foods as bears prepare for hibernation (Nelson et al. 1983). Late Hyperphagia: 1 September through den entrance. The primary high-quality bear food during late hyperphagia is the current year�s production of whitebark pine seeds (Mattson et al. 1992). RESULTS Availability of Bear Foods Although not quantitatively measured, the availability of important high quality bear foods in the GYE were qualitatively assessed by experienced biologists using diagnostic field sign. In 2000, grizzly bear foods were below average during the spring and late hyperphagia seasons, but above average during estrous and early hyperphagia. The winter of 1999-2000 was mild, resulting in below average numbers of winter-killed elk and bison carcasses. Although the year 2000 production of whitebark pine seeds in the fall was also below average, there was an abundance of over-wintered whitebark pine seeds left over from the above average cone production of the previous year. Grizzly bears fed on the over-wintered whitebark pine seeds throughout the estrous and early hyperphagia seasons. Army cutworm moths were also abundant during early hyperphagia. By late hyperphagia, few over-wintered whitebark pine seeds remained and the current years seed production was well below average. In addition, the summer was hot and dry causing vegetal foods to desiccate early. The lack of whitebark pine seeds, in combination with poor abundance of other vegetal foods due to severe drought conditions, resulted in food stress among many bears in the ecosystem during the late hyperphagia season.

72
Spring--The winter of 1999-2000 was considered to be a fairly normal, mild winter in the Madison/Firehole and the Upper and Lower Northern winter ranges (P. Farnes, Snowcap Hydrology, personal communication). As a result of the mild winter, the number of winter-killed elk and bison carcasses counted on transect sites were lower than the long-term average recorded from 1992-99. Winter-killed ungulate carcasses are an important high-quality food source for bears in early spring before most vegetal foods become available to bears (Mattson and Knight 1992). During early to mid-spring, scavenging the relatively few ungulate carcasses available and digging earthworms were the most frequently observed grizzly bear feeding activities in the GYE. During spring, grizzly bears also dug up and ate pocket gophers (Thomomys talpoides) and their food caches in localized areas where they were abundant. Estrous--Elk calves are usually an important food source during the estrous season (Gunther and Renkin 1990). However, in 2000, elk calves did not appear to be preyed upon as extensively by bears as in past years. Instead, as snow melted in higher elevation whitebark pine areas, grizzly bears fed on the abundant whitebark pine seeds left over from the previous fall. The numbers of spawning cutthroat trout counted in Yellowstone Lake tributaries were similar to the long-term averages (1989-99) on most streams except for those in the West Thumb area, which were below average (D. Reinhart, National Park Service, personal communication). However, on all tributary streams around Yellowstone Lake, the length of the cutthroat trout spawning season was shorter than usual due to drought conditions. Spawning cutthroat trout were consumed by bears with home ranges adjacent to Yellowstone Lake during the late spring and estrous seasons. Cutthroat trout rank as one of the highest sources of digestible energy available to bears in the Yellowstone ecosystem (Pritchard and Robbins 1990). Throughout the estrous season, grizzly bears also grazed clover (Trifolium spp.) in localized areas where it was abundant. Early Hyperphagia--Grizzly bears continued to feed on over-wintered whitebark pine seeds and clover throughout the early hyperphagia season. Root foods were also abundant during this season. Army cutworm moths, an important early hyperphagia bear food (Mattson et al. 1991a, 1991b), were present and attracted large numbers of bears to high elevation moth aggregation sites on the eastern side of the ecosystem. However, the duration of the moth season may have been shorter than normal due to the hot, dry summer that caused high-elevation alpine vegetation from which moths obtain nectar to desiccate early. Throughout the early hyperphagia season, some individual bears scavenged livestock carcasses (cattle and sheep) and preyed upon livestock on private land and public grazing allotments in the Wyoming portion of the ecosystem. Late hyperphagia--During late hyperphagia, grizzly bears in the Wyoming portion of the ecosystem continued to prey on and scavenge livestock. In the Henry�s Lake area, grizzly bears fed on the fall migration of kokanee salmon (Oncorhynchus nerka). Whitebark pine seeds are an important late hyperphagia food because of their high fat content and potential abundance as a prehibernation food source (Mattson and Jonkel 1990). The production of whitebark pine cones during the fall, as measured at transects sites, was below average in most areas of the ecosystem. The 1 exception was the Deaf Jim Knob area where many cones were observed. Excavations of red squirrel (Tamiasciurus hudsonicus) middens for whitebark pine seeds left over from the previous fall, was the most frequently observed grizzly bear feeding activity throughout the late spring, estrous, and early hyperphagia seasons. By late hyperphagia, there appeared to be very

73
little of the previous years seeds left, and due to the poor production of pine seeds in 2000, bears began to seek alternative foods associated with human activities at lower elevations. During the fall hunting season, many bears scavenged the gut piles of hunter-killed ungulates. The grizzly bear activity near low-elevation human developments and near concentrations of human ungulate hunting activity led to many conflicts with people and subsequent human-caused bear mortality. Grizzly Bear-Human Conflicts There were 152 grizzly bear-human conflicts reported in the GYE in 2000 (Table 29, Figure 15). These incidents included bears obtaining anthropogenic foods (45%, n = 69), killing livestock (32%, n = 49), damaging property in unsuccessful attempts to obtain anthropogenic foods (11%, n = 17), obtaining fruits and vegetables from gardens and orchards (5%, n = 7), damaging beehives (4%, n = 6), and injuring people (3%, n = 4). Fifty-seven percent (n = 86) of the reported incidents of grizzly bear-human conflict occurred on private land in the states of Wyoming (42%, n = 64) and Montana (14%, n = 22) (Table 30). Forty-three percent (n = 66) of the bear-human conflicts occurred on public land administered by the U.S. Forest Service (38%, n = 57) and the National Park Service (6%, n = 9) (Table 30). Less than half (40%, n = 61) of the reported grizzly bear-human conflicts occurred within the designated Recovery Zone (Table 31). Most (60%, n = 91) of the reported conflicts occurred outside of the Recovery Zone boundary (Table 32). Twenty-three percent (n = 35) of the total conflicts occurred >10 miles beyond the Recovery Zone boundary. Inside of the Recovery Zone, incidents of bears obtaining anthropogenic foods were the most common type of conflict reported (n = 40). Outside of the Recovery Zone, depredation on livestock (n = 47) was the most common type of conflict. Most (25%, n = 15) incidents of bear-human conflict inside the Recovery Zone occurred in the Hellroaring/Bear BMU (Table 31). Four BMUs inside the Recovery Zone (1, 9, 13, 15) did not have any grizzly bear-human conflicts reported (Table 31). Most conflicts outside of the recovery zone occurred in the Meeteetse BMU and in areas >10 miles beyond the Recovery Zone boundary. Grizzly Bear-Human Confrontations Ninety-seven grizzly bear-human confrontations were reported in the GYE in 2000 (Table 33, Figure 16). There were 48 (50%) incidents of grizzly bears entering developed areas, 22 (23%) incidents of aggressive interactions where no one was hurt, 12 (12%) incidents where grizzly bears approached or followed people, 11 (11%) incidents where grizzly bears entered occupied backcountry camps, 2 (2%) incidents where grizzly bears claimed and would not give up hunter-killed wildlife carcasses, and 1 (1%) incident of concern for human safety due to grizzly bears frequenting a road corridor. Most (85%, n = 82) reported confrontations occurred on public land (Table 34). Only 16% (n = 15) of the reported confrontations occurred on private land. Most (85%, n = 82) reported confrontations with grizzly bears occurred within the designated Yellowstone ecosystem grizzly bear Recovery Zone (BMUs 1 - 18) (Table 35). Relatively few (15%, n = 15) grizzly bear-human confrontations occurred outside of the designated Recovery Zone boundary (Table 36). Only 4 (4%) confrontations were reported >10 miles beyond the recovery zone boundary. Grizzly bears entering developed areas were the most common type of

74
Table 29. Number of incidents of grizzly bear-human conflicts reported within different wildlife management agency jurisdictions in the Greater Yellowstone Ecosystem, 2000. Agencya
Total conflicts
Human injuries
Property damages
Anthropogenic foods
Gardens/ orchards
Bee hives
Livestock depredations
GTNP/JDR 1 0 0 0 0 0 1b
IFG 1 0 0 0 0 0 1c
MTFWP 40 1 3 33 2 0 1c
WGF 102 1 8 36 5 6 46d
YNP 8 2 6 0 0 0 0
Total
152
4
17
69
7
6
49e
a GTNP/JDR=Grand Teton National Park/J. D. Rockefeller, Jr. Memorial Parkway; IFG=Idaho Department of Fish and Game; MTFWP=Montana Department of Fish, Wildlife and Parks; WGF=Wyoming Game and Fish Department, YNP=Yellowstone National Park b Incident involved cattle. c Incident involved sheep. d Includes 40 incidents of cattle and 6 of sheep depredations. e Includes 41 incidents of cattle and 8 of sheep depredations.

75
Figure 15. Locations of grizzly bear-human conflicts reported in the Greater Yellowstone Ecosystem, 2000.

76
Table 30. Number of incidents of grizzly bear-human conflicts reported within different land ownership areas in the Greater Yellowstone Ecosystem, 2000. Land ownera
Total conflicts
Human injuries
Property damages
Anthropogenic foods
Gardens/ orchards
Bee hives
Livestock depredations
BLM 0 0 0 0 0 0 0
BNF 0 0 0 0 0 0 0
BTNF 16 0 0 1 0 0 15
CNF 2 0 1 1 0 0 0
GNF 16 1 1 13 0 0 1
GTNP/JDR 1 0 0 0 0 0 1
ID-private 0 0 0 0 0 0 0
ID-state 0 0 0 0 0 0 0
MT-private 22 0 1 19 2 0 0
MT-state 0 0 0 0 0 0 0
SNF 22 1 5 8 0 0 8
TNF 1 0 0 0 0 0 1
WY-private 64 0 3 27 5 6 23
WY-state 0 0 0 0 0 0 0
YNP 8 2 6 0 0 0 0
Total
152
4
17
69
7
6
50
a BLM = Bureau of Land Management, BNF = Beaverhead National Forest, BTNF = Bridger-Teton National Forest, CNF = Custer National Forest, GNF = Gallatin National Forest, GTNP/JDR = Grand Teton National Park/J.D. Rockefeller, Jr. Memorial Parkway, SNF = Shoshone National Forest, TNF = Targhee National Forest, YNP = Yellowstone National Park

77
Table 31. Number of incidents of grizzly bear-human conflicts reported within different Bear Management Units inside the designated Greater Yellowstone Ecosystem grizzly bear Recovery Zone, 2000. Bear Management Unit Name/Number
Total conflicts
Human injuries
Property damages
Anthropogenic foods
Gardens/ orchards
Bee hives
Livestock depredations
Hilgard (1) 0 0 0 0 0 0 0
Gallatin (2) 3 1 1 1 0 0 0
Hellroaring/Bear (3) 15 0 1 11 2 0 1
Boulder/Slough (4) 1 1 0 0 0 0 0
Lamar (5) 3 0 1 2 0 0 0
Crandall/Sunlight (6) 6 0 1 4 0 0 1
Shoshone (7) 6 0 4 2 0 0 0
Pelican/Clear (8) 3 1 2 0 0 0 0
Washburn (9) 0 0 0 0 0 0 0
Firehole/Hayden (10) 1 0 1 0 0 0 0
Madison (11) 9 0 0 9 0 0 0
Henry's Lake (12) 9 0 0 9 0 0 0
Plateau (13) 0 0 0 0 0 0 0
Two Ocean Plateau (14) 1 0 1 0 0 0 0
Thorofare (15) 0 0 0 0 0 0 0
South Absaroka (16) 2 0 1 1 0 0 0
Buffalo/Spread Creek (17) 1 0 0 1 0 0 0
Bechler/Teton (18) 1 0 1 0 0 0 0 Total
61
3
14
40
2
0
2
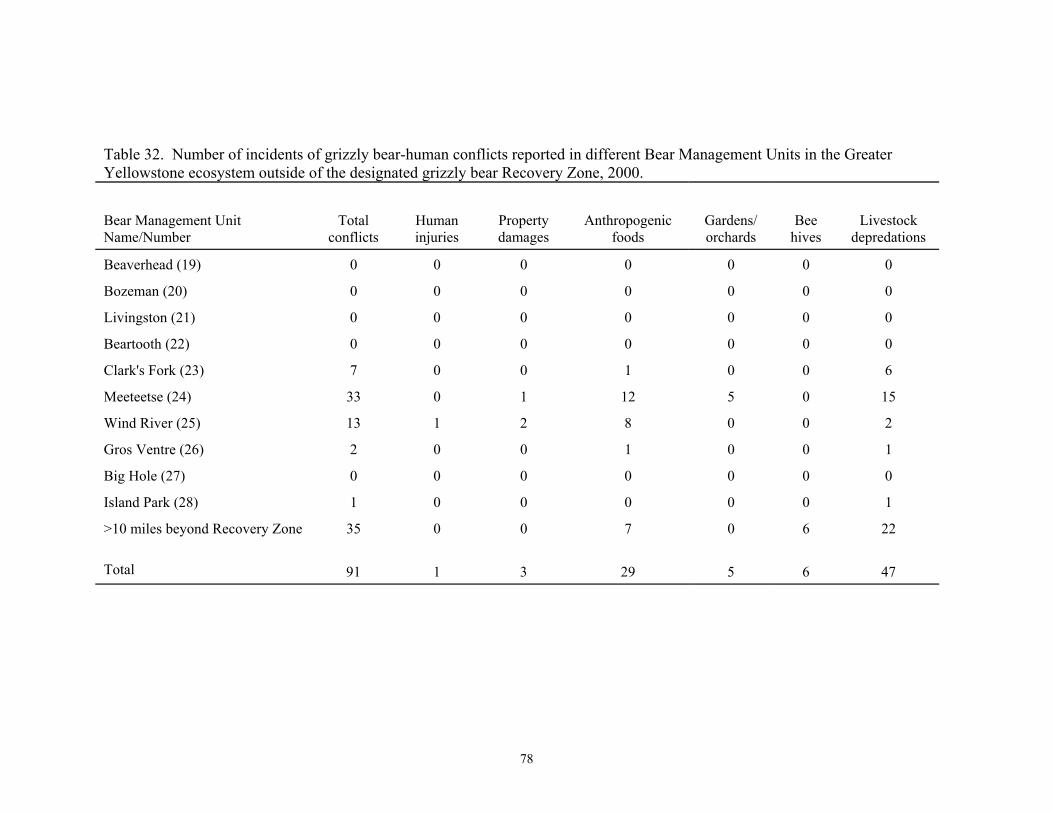
78
Table 32. Number of incidents of grizzly bear-human conflicts reported in different Bear Management Units in the Greater Yellowstone ecosystem outside of the designated grizzly bear Recovery Zone, 2000. Bear Management Unit Name/Number
Total
conflicts
Human injuries
Property damages
Anthropogenic foods
Gardens/ orchards
Bee hives
Livestock depredations
Beaverhead (19) 0 0 0 0 0 0 0
Bozeman (20) 0 0 0 0 0 0 0
Livingston (21) 0 0 0 0 0 0 0
Beartooth (22) 0 0 0 0 0 0 0
Clark's Fork (23) 7 0 0 1 0 0 6
Meeteetse (24) 33 0 1 12 5 0 15
Wind River (25) 13 1 2 8 0 0 2
Gros Ventre (26) 2 0 0 1 0 0 1
Big Hole (27) 0 0 0 0 0 0 0
Island Park (28) 1 0 0 0 0 0 1
>10 miles beyond Recovery Zone 35 0 0 7 0 6 22 Total
91
1
3
29
5
6
47
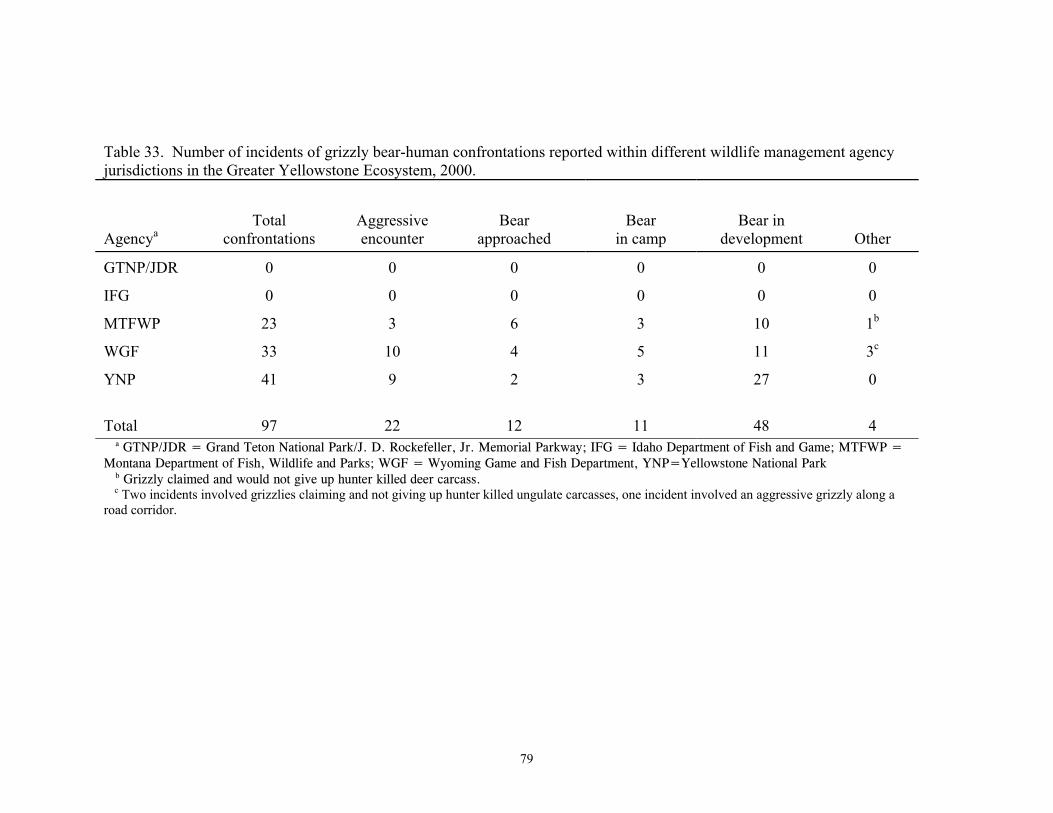
79
Table 33. Number of incidents of grizzly bear-human confrontations reported within different wildlife management agency jurisdictions in the Greater Yellowstone Ecosystem, 2000. Agencya
Total confrontations
Aggressive encounter
Bear approached
Bear in camp
Bear in development
Other
GTNP/JDR 0 0 0 0 0 0
IFG 0 0 0 0 0 0
MTFWP 23 3 6 3 10 1b
WGF 33 10 4 5 11 3c
YNP 41 9 2 3 27 0
Total
97
22
12
11
48
4
a GTNP/JDR = Grand Teton National Park/J. D. Rockefeller, Jr. Memorial Parkway; IFG = Idaho Department of Fish and Game; MTFWP = Montana Department of Fish, Wildlife and Parks; WGF = Wyoming Game and Fish Department, YNP=Yellowstone National Park b Grizzly claimed and would not give up hunter killed deer carcass. c Two incidents involved grizzlies claiming and not giving up hunter killed ungulate carcasses, one incident involved an aggressive grizzly along a road corridor.

80
Figure 16. Locations of grizzly bear-human confrontations reported in the Greater Yellowstone Ecosystem, 2000.

81
Table 34. Number of incidents of grizzly bear-human confrontations reported within different land ownership areas in the Greater Yellowstone Ecosystem, 2000. Land ownera
Total confrontations
Aggressive encounter
Bear approached
Bear in camp
Bear in development
Other
BLM 0 0 0 0 0 0
BNF 0 0 0 0 0 0
BTNF 7 2 1 3 1 0
CNF 2 0 1 1 0 0
GNF 12 3 4 2 2 1b
GTNP/JDR 0 0 0 0 0 0
ID-private 0 0 0 0 0 0
ID-state 0 0 0 0 0 0
MT-private 9 0 1 0 8 0
MT-state 0 0 0 0 0 0
SNF 20 8 3 2 4 3c
TNF 0 0 0 0 0 0
WY-private 6 0 0 0 6 0
WY-state 0 0 0 0 0 0
YNP 41 9 2 3 27 0
Total
97
22
12
11
48
4
a BLM = Bureau of Land Management, BNF = Beaverhead National Forest, BTNF = Bridger-Teton National Forest, CNF = Custer National Forest, GNF = Gallatin National Forest, GTNP/JDR = Grand Teton National Park/J.D. Rockefeller Jr. Memorial Parkway, SNF = Shoshone National Forest, TNF = Targhee National Forest, YNP = Yellowstone National Park b Grizzly bear claimed and would not give up a hunter-killed deer carcass. c Two incidents involved hunter-killed ungulate carcasses, 1 an aggressive bear along a road.

82
Table 35. Number of incidents of grizzly bear-human confrontations reported within different Bear Management Units inside the Greater Yellowstone Ecosystem grizzly bear Recovery Zone, 2000. Bear Management Unit Name/Code
Total confrontations
Aggressive encounters
Bear approached
Bear in camp
Bear in development
Other
Hilgard (1) 1 0 1 0 0 0
Gallatin (2) 5 1 1 0 3 0
Hellroaring/Bear (3) 10 2 1 1 5 1a
Boulder/Slough (4) 3 0 1 1 1 0
Lamar (5) 3 2 0 1 0 0
Crandall/Sunlight (6) 6 0 1 2 2 1a
Shoshone (7) 9 2 3 0 2 2ab
Pelican/Clear (8) 6 4 0 0 2 0
Washburn (9) 2 1 0 0 1 0
Firehole/Hayden (10) 17 2 0 0 15 0
Madison (11) 4 0 1 0 3 0
Henry's Lake (12) 0 0 0 0 0 0
Plateau (13) 1 0 0 1 0 0
Two Ocean Plateau (14) 8 0 2 2 4 0
Thorofare (15) 3 1 0 2 0 0
South Absaroka (16) 3 2 0 1 0 0
Buffalo/Spread Creek (17) 1 0 0 0 1 0
Bechler/Teton (18) 0 0 0 0 0 0
Total
82
17
11
11
39
4
a Defense of hunter-killed wildlife carcass. b Human safety concerns involving a bear frequenting the roadway.
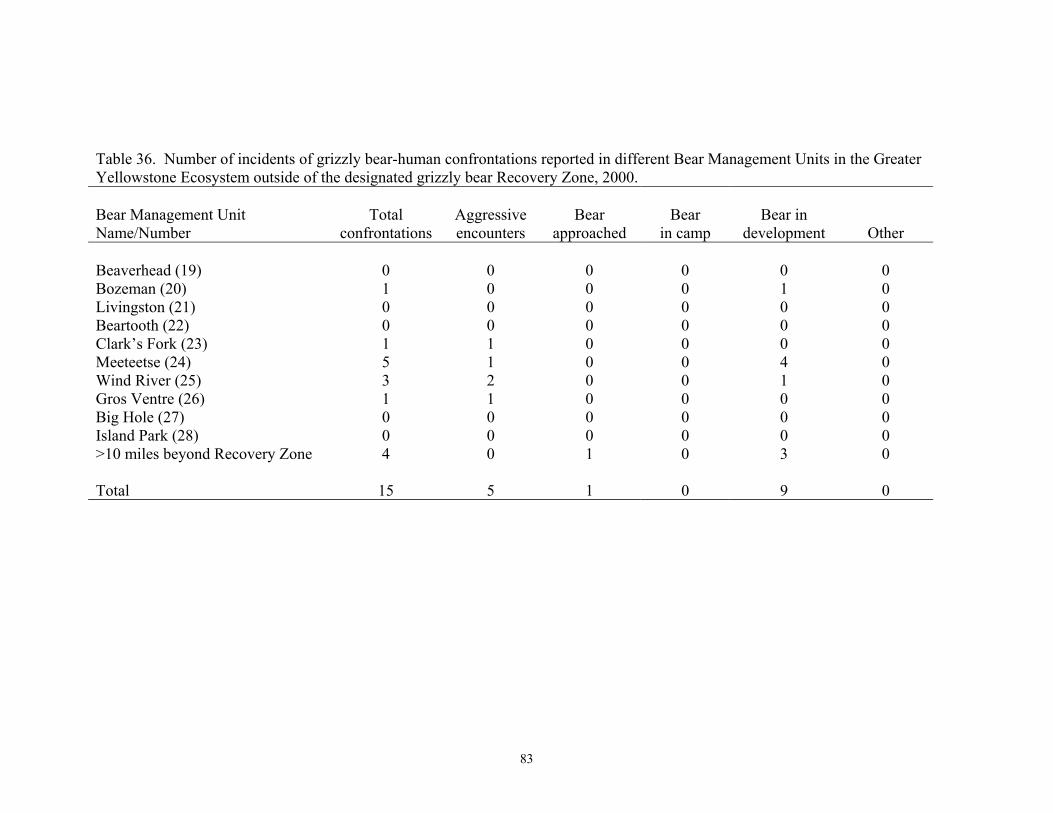
83
Table 36. Number of incidents of grizzly bear-human confrontations reported in different Bear Management Units in the Greater Yellowstone Ecosystem outside of the designated grizzly bear Recovery Zone, 2000. Bear Management Unit Name/Number
Total confrontations
Aggressive encounters
Bear approached
Bear in camp
Bear in development
Other
Beaverhead (19) 0 0 0 0 0 0 Bozeman (20) 1 0 0 0 1 0 Livingston (21) 0 0 0 0 0 0 Beartooth (22) 0 0 0 0 0 0 Clark�s Fork (23) 1 1 0 0 0 0 Meeteetse (24) 5 1 0 0 4 0 Wind River (25) 3 2 0 0 1 0 Gros Ventre (26) 1 1 0 0 0 0 Big Hole (27) 0 0 0 0 0 0 Island Park (28) 0 0 0 0 0 0 >10 miles beyond Recovery Zone 4 0 1 0 3 0 Total
15
5
1
0
9
0

84
confrontation reported both inside and outside of the Recovery Zone boundary. Grizzly bear-human confrontations occurred most often in the Firehole/Hayden (18%, n = 17) and Hellroaring/Bear (10%, n = 10) BMUs. BMUs 12 and 18 inside the Recovery Zone did not have any confrontations reported. Wyoming does not systematically record all grizzly bear-human confrontations as they are numerous and often go unreported. Confrontations are probably not as consistently reported as conflicts in all wildlife jurisdictions. Grizzly Bear Management Captures There were 17 individual grizzly bears captured in 12 management actions in 2000 (Tables 37 and 38, Figure 17). Multiple bears in family groups were caught in 4 incidents (siblings #361 and 362, adult female #135 and cub-of-the-year (COY) #371, adult female #249 with COY #s G68 and G69, and adult female #234 with COY #s G70 and G71). One individual bear (#353) was caught twice in management actions. In 8 incidents nuisance bears were captured and translocated to remote areas away from human activities. In 1 incident a nuisance grizzly bear (#365) was captured, radio-marked, and released at the capture site. In 3 incidents grizzly bears involved in conflicts (1 killing cattle, 1 getting into garbage, and 1 getting into grain) were captured and removed from the ecosystem (cattle killer and bear getting into garbage were euthanized, bear getting into grain was sent to a zoo). Seven management actions where grizzly bears were captured occurred on private property, all in Wyoming (Table 39). Five incidents where bears were captured in management actions occurred on public land administered by the U.S. Forest Service. Less than half (33%, n = 4) of the incidents where grizzly bears were captured in management actions occurred within the designated Recovery Zone (Table 40), most (67%, n = 8) occurred outside of the Recovery Zone boundary (Table 41). Human-Caused Grizzly Bear Mortalities Nineteen grizzly bears are known to have died due to human causes in 17 separate incidents in 2000 (Tables 42 and 43, Figure 18). Eleven grizzly bears were killed by hunters (4 incidents involved carcasses, 3 involved bears entering backcountry camps, 2 involved mistaken identification by black bear hunters, 1 involved an attack on a hunter, and 1 involved a bear that charged a hunter). Five grizzly bears were removed in 3 management actions (1 adult male cattle killer, 1 subadult male obtaining anthropogenic foods, and a female with 2 COY obtaining anthropogenic foods). Two grizzly bears were killed in defense of property (1 defense of a dog, 1 defense of sheep). One grizzly bear was killed in a poaching incident. Most (82%, n = 14) known incidents of human-caused grizzly bear mortality occurred on public land administered by the U.S. Forest Service; only 3 (18%) human-caused mortalities occurred on private land (Table 44). Eleven (65%) incidents of human-caused grizzly bear mortality occurred inside (Table 45) and 6 (35%) outside of the Recovery Zone boundary (Table 46). Four (24%) incidents of human-caused grizzly bear mortality occurred further than 10 miles outside of the Recovery Zone boundary.

85
Table 37. Grizzly bears captured during management actionsa in the Greater Yellowstone Ecosystem, 2000. Areas in bold parenthesis indicate area where bear was first involved in bear-human conflicts and was translocated from.
Date Bear Sex Ageb Locationc Reason captured Release sitec
5/31 353 M Subadult Madison River, GNF Anthropogenic foods-garbage Teepee Creek, GNF
7/6 361 M Yearling Grinnell Creek, SNF Roadside habituated bear-human safety concerns Robinson Creek, SNF
7/6 362 M Yearling Grinnell Creek, SNF Roadside habituated bear-human safety concerns Robinson Creek, SNF
7/14 353 M Subadult Madison Arm Resort, GNF Anthropogenic foods-garbage Euthanized
7/30 365 F Adult Gilbert Creek, SNF Livestock depredation-cattle Released on site
9/10 135 F Adult North Fork Shoshone River, WY-private Anthropogenic foods-human foods Buffalo Plateau, SNF
9/10 371 F COY North Fork Shoshone River, WY-private Anthropogenic foods-human foods Buffalo Plateau, SNF
9/15 249 F Adult Carter Creek, WY-private (from South Fork Shoshone, WY-private, 1995)
Anthropogenic foods-grain Sent to zoo (WSU)
9/14 G68 M COY Carter Creek, WY-private Anthropogenic foods-grain Sent to zoo (WSU)
9/14 G69 F COY Carter Creek, WY-private Anthropogenic foods-grain Sent to zoo (WSU)
9/19 372 M Subadult North Fork Shoshone River, WY-private Anthropogenic foods-garbage Wind River, SNF
9/26 374 M Subadult South Fork Shoshone River, WY-private Anthropogenic foods-compost Sunlight Basin, SNF
9/29 234 F Adult South Fork Shoshone River, WY-private (from South Fork Shoshone, WY-private, 1994)
Eating apples in yard Parque Creek, SNF
9/29 G70 M COY South Fork Shoshone R, WY-private Eating apples in yard Parque Creek, SNF
9/29 G71 M COY South Fork Shoshone R, WY-private Eating apples in yard Parque Creek, SNF
10/3 375 M Subadult Whit Creek, WY-private Eating apples in yard Wood River, SNF
10/3 212 M Adult South Fork Sage Creek, SNF Livestock depredation-cattle Euthanized
10/21 376 M Subadult June Creek, WY-private Anthropogenic foods-garbage Togwotee Creek, BTNF a Does not include non-target bears that were captured and released on site. b COY = cub-of-the-year. c BTNF = Bridger-Teton National Forest, GNF = Gallatin National Forest, SNF = Shoshone National Forest, BTNF = Bridger-Teton National Forest, WSU = Washington State University

86
Table 38. Number of incidents where grizzly bears were captured in management actions within different wildlife management agency jurisdictions in the Greater Yellowstone Ecosystem, 2000.
Agencya
Total captures
Translocated
Released on site
Sent to zoo
Euthanized
Accidental management
death
GTNP/JDR 0 0 0 0 0 0
IFG 0 0 0 0 0 0
MTFWP 2 1 0 0 1 0
WGF 10 7 1 1 1 0
YNP 0 0 0 0 0 0
Total
12
8
1
1
2
0
a GTNP/JDR = Grand Teton National Park/J. D. Rockefeller, Jr. Memorial Parkway; IFG = Idaho Department of Fish and Game; MTFWP = Montana Department of Fish, Wildlife and Parks; WGF = Wyoming Game and Fish Department, YNP = Yellowstone National Park

87
Figure 17. Locations of management actions where grizzly bears were captured in the Greater Yellowstone Ecosystem, 2000.

88
Table 39. Number of incidents where grizzly bears were captured in management actions within different land ownership areas in the Greater Yellowstone Ecosystem, 2000.
Agencya
Total captures
Translocated
Released on site
Sent to zoo
Euthanized
Accidental management
death
BLM 0 0 0 0 0 0
BNF 0 0 0 0 0 0
BTNF 0 0 0 0 0 0
CNF 0 0 0 0 0 0
GNF 2 1 0 0 1 0
GTNP/JDR 0 0 0 0 0 0
ID-private 0 0 0 0 0 0
MT-private 0 0 0 0 0 0
SNF 3 2 1b 0 0 0
TNF 0 0 0 0 0 0
WY-private 7 5c 0 1b 1 0
WY-State 0 0 0 0 0 0
YNP 0 0 0 0 0 0
Total
12
8c
1
1b
2
0
a BLM = Bureau of Land Management, BNF = Beaverhead National Forest, BTNF = Bridger-Teton National Forest, CNF = Custer National Forest, GNF = Gallatin National Forest, GTNP/JDR = Grand Teton National Park/J.D. Rockefeller Jr. Memorial Parkway, SNF = Shoshone National Forest, TNF = Targhee National Forest, YNP = Yellowstone National Park. b Incident involved a female with 2 cubs-of-the-year. c Two of these incidents involved female grizzly bears accompanied by cub-of-the-year.

89
Table 40. Number of incidents where grizzly bears were captured in management actions in different Bear Management Units inside the Greater Yellowstone Ecosystem grizzly bear Recovery Zone, 2000.
Bear Management Unit Name/Code
Total bears captured
Translocated
Released on site
Sent to zoo
Euthanized
Accidental management
death
Hilgard (1) 0 0 0 0 0 0
Gallatin (2) 0 0 0 0 0 0
Hellroaring/Bear (3) 0 0 0 0 0 0
Boulder (4) 0 0 0 0 0 0
Lamar/Slough (5) 0 0 0 0 0 0
Crandall/Sunlight (6) 1 0 1 0 0 0
Shoshone (7) 1 1 0 0 0 0
Pelican/Clear (8) 0 0 0 0 0 0
Washburn (9) 0 0 0 0 0 0
Firehole/Hayden (10) 0 0 0 0 0 0
Madison (11) 2 1 0 0 1 0
Henry's Lake (12) 0 0 0 0 0 0
Plateau (13) 0 0 0 0 0 0
Two Ocean Plateau (14) 0 0 0 0 0 0
Thorofare (15) 0 0 0 0 0 0
South Absaroka (16) 0 0 0 0 0 0
Buffalo/Spread Creek (17) 0 0 0 0 0 0
Bechler/Teton (18) 0 0 0 0 0 0
Total
4
2
1
0
1
0

90
Table 41. Number of incidents where grizzly bears were captured in management actions in different Bear Management Units outside of the designated grizzly bear recovery zone in the Greater Yellowstone Ecosystem, 2000.
Bear Management Unit (Name/Number)
Total bears
captured Translocated Released on site
Sent to zoo Euthanized
Accidental management
death
Beaverhead (19) 0 0 0 0 0 0
Bozeman (20) 0 0 0 0 0 0
Livingston (21) 0 0 0 0 0 0
Beartooth (22) 0 0 0 0 0 0
Clark's Fork (23) 0 0 0 0 0 0
Meeteetse (24) 6 6 0 0 0 0
Wind River (25) 0 0 0 0 0 0
Gros Ventre (26) 0 0 0 0 0 0
Big Hole (27) 0 0 0 0 0 0
Island Park (28) 0 0 0 0 0 0
>10 miles beyond Recovery Zone 2 0 0 1 1 0 Total
8
6
0
1
1
0

91
Table 42. Number of incidents of human-caused grizzly bear mortalities within different wildlife management agency jurisdictions in the Greater Yellowstone Ecosystem, 2000.
Management removals Other human-caused grizzly bear mortality
Agency
Total
To zoo
Euthanized
Accidental
Research accident
Illegal
Self defense Road-killed Other
GTNP/JDR 0 0 0 0 0 0 0 0 0
IFG 0 0 0 0 0 0 0 0 0
MTFWP 3 0 1 0 0 0 2 0 0
WGF 14 1 1 0 0 1 7 0 4b
YNP 0 0 0 0 0 0 0 0 0
Total
17
1
2
0
0
1
9
0
4b
a GTNP/JDR = Grand Teton National Park/J. D. Rockefeller, Jr. Memorial Parkway; IFG = Idaho Department of Fish and Game; MTFWP = Montana Department of Fish, Wildlife and Parks; WGF = Wyoming Game and Fish Department, YNP = Yellowstone National Park b Includes 2 incidents of mistaken identification by black bear hunters, and 2 incidents of defense of property (1 involving sheep and 1 involving a dog).

92
Table 43. Known human-caused grizzly bear mortalities in the Greater Yellowstone Ecosystem, 2000. Date Bear Sex Agea Locationb Cause 5/4 #312 M Subadult Gooseberry Creek, WY-private (from
South Fork Shoshone, WY-private, 1999)
Defense of property-dog/close encounter- no charges filed
5/6 Unm M Adult Deer Creek, SNF Mistaken identification-black bear hunter, illegal-fined 5/8 Unm M Subadult Owl Creek, SNF Mistaken identification-black bear hunter, illegal-fined 7/1 Unm M Adult Pat O�Hara Creek, SNF Defense of property-sheep, illegal-fined 7/14 #353 M Subadult Madison Arm, GNF (from Madison
River, MT-private, 2000) Management removal-euthanized, anthropogenic foods
9/13 Unm Unk.
Subadult Wolverine Creek, BTNF Hunter self defense-at carcass, no charges filed
9/15 #249 F Adult Carter Creek, WY-private (from South Fork Shoshone, WY-private, 1995)
Management removal-to zoo, anthropogenic foods
9/15 #G68 M COY Carter Creek, WY-private Management removal-to zoo, anthropogenic foods 9/15 #G69 F COY Carter Creek, WY-private Management removal-to zoo, anthropogenic foods 9/18 #317 M Adult Coyote Creek/Hellroaring, GNF Hunter self defense-in camp, no charges filed 9/18 Unm M Adult Pass Creek, BTNF Hunter self defense-in camp, no charges filed 9/21 Unm F Subadult Coulter Creek, BTNF Hunter self defense-in camp, no charges filed 10/2 Unm M Subadult Temple Creek, SNF In hunter camp, illegal-fined 10/2 Unm M Adult Timber Creek, BTNF Hunter self defense-at carcass, no charges filed 10/3 #212 M Adult South Fork Sage Creek, WY-private
(from South Fork Shoshone, WY-private, 1997)
Management removal-euthanized, cattle killer
10/3 Unm F Adult Butte Creek, BTNF Hunter self defense-bear charged (orphaned 2 cubs-of-the-year), no charges filed
10/12 Unm F Adult Bull Creek, GNF Hunter self defense-human injury (orphaned 3 yearlings) 10/17 #316 F Adult Grinnell Creek, SNF Hunter self defense-at carcass, no charges filed 10/26 Unm M Subadult Dallas Fork, BTNF Hunter self defense-bear charged hunters a COY = cub-of-the-year. b BTNF = Bridger-Teton National Forest, GNF=Gallatin National Forest, SNF = Shoshone National Forest.

93
Figure 18. Locations of known human-caused grizzly bear mortalities in the Greater Yellowstone Ecosystem, 2000.

94
Table 44. Number of incidents of known human-caused grizzly bear mortalities within different land ownership areas in the Greater Yellowstone Ecosystem, 2000.
Management removals Other human-caused grizzly bear mortality
Land ownera
Total
To zoo
Euthanized
Accidental
Research accident
Illegal
Self defense
Road-killed
Other
BLM 0 0 0 0 0 0 0 0 0
BNF 0 0 0 0 0 0 0 0 0
BTNF 6 0 0 0 0 0 6 0 0
CNF 0 0 0 0 0 0 0 0 0
GNF 3 0 1 0 0 0 2 0 0
GTNP/JDR 0 0 0 0 0 0 0 0 0
ID-private 0 0 0 0 0 0 0 0 0
MT-private 0 0 0 0 0 0 0 0 0
SNF 5 0 0 0 0 2 1 0 2b
TNF 0 0 0 0 0 0 0 0 0
WY-private 3 1 1 0 0 0 0 0 1c
YNP 0 0 0 0 0 0 0 0 0 Total
17
1
2
0
0
2
9
0
3
a BLM = Bureau of Land Management, BNF = Beaverhead National Forest, BTNF = Bridger-Teton National Forest, CNF = Custer National Forest, GNF = Gallatin National Forest, GTNP/JDR = Grand Teton National Park/J.D. Rockefeller Memorial Parkway, SNF = Shoshone National Forest, TNF = Targhee National Forest, YNP = Yellowstone National Park. b Includes 2 incident of a grizzly bear killed by a black bear hunter. c Includes 1 incident of a grizzly bear killed in defense of a dog.

95
Table 45. Number of incidents of human-caused grizzly bear mortalities within each Bear Management Unit inside the Greater Yellowstone Ecosystem grizzly bear Recovery Zone, 2000. Management removals Other human-caused grizzly bear mortality
Bear Management Unit Name/Code
Total
To zoo
Euthanized
Accidental
Research accident
Illegal
Self defense Road-killed
Other
Hilgard (1) 0 0 0 0 0 0 0 0 0
Gallatin (2) 0 0 0 0 0 0 0 0 0
Hellroaring/Bear (3) 1 0 0 0 0 0 1 0 0
Boulder (4) 1 0 0 0 0 0 1 0 0
Lamar/Slough (5) 0 0 0 0 0 0 0 0 0
Crandall/Sunlight (6) 2 0 0 0 0 1 1 0 0
Shoshone (7) 1 0 0 0 0 0 1 0 0
Pelican/Clear (8) 0 0 0 0 0 0 0 0 0
Washburn (9) 0 0 0 0 0 0 0 0 0
Firehole/Hayden (10) 0 0 0 0 0 0 0 0 0
Madison (11) 1 0 1 0 0 0 0 0 0
Henry's Lake (12) 0 0 0 0 0 0 0 0 0
Plateau (13) 0 0 0 0 0 0 0 0 0
Two Ocean Plateau (14) 2 0 0 0 0 0 2 0 0
Thorofare (15) 2 0 0 0 0 0 2 0 0
South Absaroka (16) 1 0 0 0 0 0 0 0 1a
Buffalo/Spread Creek (17) 0 0 0 0 0 0 0 0 0
Bechler/Teton (18) 0 0 0 0 0 0 0 0 0
Total
11
0
1
0
0
1
8
0
1a
a Mistaken identification, killed by a black bear hunter.

96
Table 46. Number of human-caused grizzly bear mortalities within each Bear Management Unit in the Greater Yellowstone Ecosystem that occurred outside of the designated grizzly bear Recovery Zone, 2000.
Management removals Other human-caused grizzly bear mortality
Bear Management Unit Name/Code
Total
To zoo
Euthanized
Accidental
Research accident
Illegal
Self defense Road-killed
Accidental
Beaverhead (19) 0 0 0 0 0 0 0 0 0
Bozeman (20) 0 0 0 0 0 0 0 0 0
Livingston (21) 0 0 0 0 0 0 0 0 0
Beartooth (22) 0 0 0 0 0 0 0 0 0
Clark�s Fork (23) 1 0 0 0 0 0 0 0 1a
Meeteetse (24) 0 0 0 0 0 0 0 0 0
Wind River (25) 0 0 0 0 0 0 0 0 0
Gros Ventre (26) 1 0 0 0 0 1 0 0 0
Big Hole (27) 0 0 0 0 0 0 0 0 0
Island Park (28) 0 0 0 0 0 0 0 0 0
>10 miles beyond Recovery Zone 4 1 1 0 0 0 0 0 2b
Total
6
1
1
0
0
1
0
0
3
a Defense of sheep. b One incident involved defense of a dog and one incident involved mistaken identification by a black bear hunter.

97
2000 AGENCY SUMMARIES
Grand Teton National Park No management actions were taken on nuisance grizzly bears in Grand Teton National Park in 2000. Nuisance grizzly bear activity was comprised of a single cattle depredation (1 calf) on an authorized grazing allotment within the Park but outside of the grizzly bear recovery area. No other grizzly bear-human conflicts were documented during the year. In cooperation with the IGBST, 3 culvert traps were set for a total of 73 trap nights between 20 April and 24 May. This trapping effort was conducted in an effort to trap grizzlies for radio-collaring. Five grizzly bears (2 females, 3 males) and 2 black bears (both male) were caught. Idaho There was only 1 grizzly bear-human conflict reported in Idaho in 2000. An unmarked grizzly bear killed 13 sheep on an allotment in Scalp Creek near Aldus Lake trailhead in Clark County. A culvert trap and snares were set by Wildlife Services for 4 nights, but the bear eluded capture. No aggressive encounters or anthropogenic food incidents were reported in southeast Idaho. Two radio-instrumented grizzly bears (#346 and #373) were present in the Island Park and Plateau BMUs, using the kokanee spawning run during the fall. Montana Conflicts--There were 63 reported and investigated grizzly bear/human conflicts in Montana within the GYE during 2000. This was an increase of 16% from the 53 conflicts in 1999, which had increased by 34% from the 34 conflicts in 1998. For the preceding 9 years (1991-99), the average number of bear/human conflicts in Montana is 34. Approximately 51% of the bear/human conflicts occurred on public land and 48% occurred on private land in 2000. During 1999, the percentage of conflicts on public and private land was 60 and 40, respectively. Unnatural food attractants (unsecured and secured) accounted for 48% of all bear/human conflicts in Montana during 2000. This was an increase from 1998 and 1999, where unnatural food related conflicts accounted for 44% and 15% of all bear/human conflicts, respectively. Natural food abundance and availability has a direct correlation on the level of bear/human conflicts associated with unnatural foods at developed areas or backcountry camps. On average, situations caused by non-secured unnatural foods continue to be the major cause of bear/human conflicts in Montana. During 2000, 3 bear groups (1 subadult male, 2 females with 2 COY each), attributed to 33 of the unnatural food related conflicts. Most of these conflicts could be avoided if people would make a continued serious effort to secure all unnatural food attractants. Except for 3 livestock depredations, all management captures of grizzly bears in southwest Montana during the past 10 years have been a result of unnatural foods. Euthanized or live removal of bears due to

98
unnatural foods during this period has resulted in 14 bears being eliminated from the GYE in Montana. This type of conflict is more easily addressed than confrontational conflicts and should be possible to minimize. We, the managing agencies, should continue to make extensive efforts to solve the unsecured-unnatural food problem. As reported in the Conflict Reports since 1997 (Gunther et al. 1998, 1999, 2000), confrontational bear/human conflicts are continuing to increase in Montana. Some of these confrontations are very serious and have lead to human injuries and grizzly bear mortalities. During 2000, 1 person was injured and 2 grizzly bears were killed in backcountry conflict situations associated with big game hunting. Confrontational conflicts (17) comprised 27% of the total bear/human conflicts in 2000. Of these 17 confrontational conflicts, 14 occurred on public land, with 12 or 70% of these occurring in backcountry areas. During 1999, 40% or 21 of the total bear/human conflicts were confrontations, where 19 of the 21 confrontations occurred on public land and 17 (89%) of these 19 occurred in the backcountry. During 1999 and 1998, no grizzly bears were killed and no humans were injured by grizzly bears due to hunting related activities in southwest Montana. In this management project, research is ongoing to document and investigate methods to help minimize confrontational conflicts. Managing agencies and the public will need to accept that confrontational conflicts along with associated human injuries and bear mortalities will be a very difficult problem to minimize and still maintain a degree of human acceptance and tolerance of bears. Everyone should realize that certain activities of bears and humans (i.e. summer camping, hiking, fall hunting season, unsecured food storage) will continue to bring bears and humans together in confrontational situations and the associated risks of these confrontations. The need continues for education and information about proper actions to help reduce all types of bear/human conflicts while recreating or living in bear country. Conflict reduction, front country/residences and camps--As stated in the 1999 Conflict Report (Gunther et al. 2000), Gardiner has continual problems with bears being attracted to and feeding in apple orchards and gardens when natural fall foods are very limited. During 1999, electric fence was used in several other locations to discourage black bears from apple trees and gardens, in hope that it would prove successful and be used on grizzly bears in 2000. These efforts proved successful and were used on grizzly bears during 2000 in the Gardiner and West Yellowstone areas. In the Corwin Springs area north of Gardiner, electric fence was installed during the spring season to discourage a female grizzly bear (#325) with 2 cubs from feeding on unsecured garbage. Prior to installation, Montana Fish, Wildlife and Parks (MTFWP) personnel spent several nights in a vehicle near the dumpsters discharging cracker rounds at the family group in an attempt to aversively condition them. This met with very limited success. Consequently, Park County Refuse Service was contacted and 3 of 4 dumpsters were moved to the fenced area at Gardiner. The fourth was not moved because a private business refused to cooperate. This dumpster was electrified on site. Subsequent to fencing, the bear family group was observed attempting to obtain food
99
from the dumpster. They were shocked several times and left the area. This bear family group then moved into the backcountry and remained there for the summer. In late August, they returned to a private apple orchard along the Yellowstone River. This orchard was electric fenced and the bears again left the area and remained in the backcountry for the rest of the fall season. An individual grizzly bear was also shocked at this same orchard and did not return to the residence. Assistance was given to these people in cleaning up apples that had fallen to the ground. During late October, a third electric fence was installed at a residence in Crevice Creek east of Jardine. Investigation revealed 3 individual grizzly bears had been in the yard and attempting to get into a poultry shed that contained birds and grain. After fencing around the poultry shed and pen, no other complaints were received from the owner and the bears left the area. All 3 of these electric fencing efforts were left in place until December, to assure that all bears in the area had denned. At Corwin Springs, discussions with Park County Refuse and Royal Teton Ranch about moving the dumpsters to Gardiner, led to construction of a bear-proof fenced enclosure during the summer. The Royal Teton Ranch was the main user of these dumpsters and they provided labor and some materials in the construction of the enclosure. MTFWP provided financial assistance for materials to help minimize long-term conflicts with grizzly and black bears in the area. Recommendations were provided in construction of the enclosure to assure that it would be bear-proof and well constructed. Park County requested the shape and dimensions of the enclosure for ease of service. In conjunction with Yellowstone National Park-Bear Management, MTFWP will provide electric or barbwire to the top of the fence. This enclosure will also be open to public use. During the last 4 years, West Yellowstone has had grizzly bears frequenting the city limits and residences in the surrounding area, where the bears have received unnatural food rewards. Personal contacts and public service announcements (radio, newspaper) of the situation and food storage ordinances have helped resolve some of the potential problems. However, bears continue to get unnatural food rewards from public campgrounds and residences due to non-compliance with guideline methods for food storage and the adopted ordinances. Cooperation with the Gallatin County Sheriff�s Office, to warn the public of the enforceable food storage ordinance in the rural area around West Yellowstone continues. Aversive conditioning (electric fencing and cracker rounds - harassment) of several bears in the Hebgen Lake area alleviated the need for capture and relocation of the bears. Electric fencing was used to protect grain storage sheds and trailers at 3 locations with continual bear conflicts. During 2000, fencing efforts prevented the need to trap and relocate a female with 2 COY. The fencing methods have changed with numerous applications and have proven to be a reasonably good method of detouring bears away from residences and human activities. During August, the Beaver Creek Fire caused a large base camp of firefighters and staff to develop in occupied grizzly bear habitat. Lectures were given at the 6 a.m. briefings to the firefighting leaders and workers about grizzly bear activity in the fire area, food storage procedures, and confrontational conflict avoidance methods. The base camp was monitored for bear activity and advised of any food/attractant problems. With the increasing human growth/development of the areas surrounding Yellowstone National

100
Park (YNP) and recovery of the grizzly bear population, educational efforts and enforcement of regulations will need to continue. Conflict reduction, backcountry/hunting--During the summer months (May-August), grizzly bear awareness signs directed at campers and recreationists were posted in areas of high bear use. These areas vary year to year due to bear food availability and bear use. Campsites were monitored for compliance to food storage ordinances and warned of possible conflicts when camps were kept unsecured. Extensive efforts were again made by the U.S. Forest Service - Gardiner District and MTFWP to educate hunters and minimize bear/human conflicts in the Absaroka-Beartooth (AB-BT) Wilderness. This hunting area has a high concentration of hunters and grizzly bears during September and October. The grizzly bears have learned to utilize the created food source (elk viscera). People and bears are in close proximity to one another during the fall season. Although documented confrontational bear/human conflicts happen regularly, relatively few serious conflicts occur considering the number of people and bears in the area. There were 2 grizzly bears killed in the AB-BT area during the early fall elk hunting season, in spite of serious efforts to minimize bear/human conflicts there. No grizzly bears were killed or humans injured during the 1999 or 1998 hunting seasons. Educational efforts directed at big game hunters continued in the Gallatin, Yellowstone, and Madison River drainages from September through November. Bear safety and information signs related to hunting were posted and maintained at trailheads (28) in creeks of these river drainages, within the primary conservation area of the Yellowstone Grizzly Bear Recovery Area. Hunter camps were visited to inform the public of bears, proper food storage, and conflict avoidance. Management Captures--During 2000, 1 grizzly bear was captured and translocated from the West Yellowstone area due to unnatural food conflict situations. Extensive efforts to work with the public on sanitation requirements and aversive conditioning techniques were unsuccessful. This subadult male bear was recaptured approximately 6 weeks after relocation and euthanized due to numerous unnatural food rewards on public land and developing bold behavior. On average, 4 grizzly bears have been captured and translocated each year, due to management situations in Montana. Management captures of grizzly bears have varied from a low of 0 during 1991, 1992, and 1999, up to a high of 12 captures during 1995. Due to extensive application of electric fence (see Conflict Reduction) and cracker/rubber shotgun rounds to condition the bears in the West Yellowstone and Gardiner areas, 2 female grizzly bears with 2 COY each and 2 other individual bears were kept from management capture situations and possible removal from the ecosystem. From 1991 through 2000, 30 grizzly bears have been captured 37 times due to conflict-caused management actions. Of these management captures, 28 have been the result of non-secured unnatural foods and the occasional associated property damage.
101
Bear Mortalities--In the Montana portion of the GYE during 2000, 4 grizzly bear mortalities were reported and investigated. A subadult male bear was euthanized on 14 July, after being captured/relocated and recaptured due to unnatural food conflicts and bold behavior in the West Yellowstone area. Parts (skin, bones) of a subadult of unknown sex were found in Telephone Basin in Buffalo Fork Creek in early summer. It appeared to have been scavenged or fed upon. An adult male bear was killed in self-defense on 19 September in Coyote Creek, Gallatin National Forest. On 12 October, a female bear was killed in self-defense in the North - Middle Fork Bull Creek, Gallatin National Forest. One hunter was injured during this conflict situation. Chance close-encounter confrontations with bears and people are very difficult to avoid or minimize. Occasionally people are injured and bears are killed during these types of confrontations. From 1992 through 2000, there have been 30 known grizzly bear deaths and 7 live removals (zoos) within Montana. Of these 37 grizzly bear losses, 38% have been related to unnatural food conflicts, 24% have been related to hunting/self-defense conflicts, and 16% have been killed through illegal activities. Natural and unknown caused deaths have each resulted in 8% of the known grizzly bear mortalities. Livestock depredation has resulted in 5% of the total loss of grizzly bears. Of this total (37) bear mortality, 23 (62%) individuals were assumed resident of Montana, 7 or 19% of the bears moved into Montana after being translocated from Wyoming into YNP, 5 or 14% of the bears had naturally moved into Montana from YNP or Wyoming, and 2 or 5% of the bears had been translocated into Montana from Wyoming. There have been increases in grizzly bear sightings (verified and non-verified), bear/human conflicts, and grizzly bear mortalities occurring in areas that are increasingly farther away from the recognized recovery line of the GYE. The need for grizzly bear management efforts will become ever-demanding in the future. We can no longer assume that areas outside of the Recovery Zone are not occupied by grizzly bears. During 1998, a grizzly bear killed livestock 80 miles from the Recovery Zone boundary. Grizzly bears have been observed within 10 miles of Livingston and Bozeman during the last 2 years. Wyoming (outside the National Park System) There were 112 human-grizzly bear conflicts in Wyoming during 2000, an increase of 24% from the number recorded in 1999 (n = 90), and an increase of 33% from the previous 5-year average (1995-99) of 84 incidents/year. The short-term increase is attributable to poor natural food conditions during the fall resulting in bears searching widely for foods. The long-term trend is largely attributable to an increase in bear numbers and distribution. Bears have repopulated federal lands managed for multiple uses and private lands well outside of Yellowstone National Park and the surrounding wilderness areas during the past decade resulting in greater potential for conflicts with people and their property. Agriculture Damage--Forty cattle were killed or injured by grizzly bears in Wyoming during 2000, which is a 22% reduction from losses (n = 49) in 1999, but a 14% increase

102
from the 5-year average (1995-99) of 35 cattle/year. Seven cattle depredations occurred on grazing allotments on the Shoshone National Forest (SNF), 10 losses occurred on the Bridger-Teton National Forest (BTNF), and 23 on private lands in the Cody and Dubois areas. One male bear (212) was killed by management authorities after continuous depredations on private and public lands and a previous attempt to relocate him failed. No bears were relocated during 2000 because of cattle depredations, although 1 adult female with cubs was radioed and released for monitoring because the entire family group could not be captured. Twenty-eight sheep were killed in 6 incidents during 2000, which is a 62% reduction in the number of incidents (n = 16), and a 7% reduction in the number of sheep killed (n = 30) during 1999. The 6 incidents that occurred in 2000 is a 67% reduction from the 5-year average (1995-99) of 18 incidents/year. Three sheep were killed during 1 incident on the SNF in the Pat O�Hara Mountain area northwest of Cody. The herder killed a male grizzly bear during the incident and buried the carcass. The carcass was discovered by a Forest Service employee and an investigation resulted in fines to both the herder and the sheep owner. In 5 additional incidents, 25 sheep were killed in 3 adjacent bands on the BTNF. The damage appeared to be caused by 1 adult bear (based on track size), although these allotments have had numerous damage incidents caused by multiple grizzly bears since 1996. No bears were captured or killed as a result of this year�s damage. The reduction in sheep depredation incidents is partially attributable to 2 allotments on the Targhee National Forest, with histories of grizzly bear damage, not being stocked during 2000. One allotment was vacant as part of the normal grazing rotation and the other permit holder chose to graze on an alternate allotment this year outside of known occupied grizzly bear habitat. There is a high potential for chronic damage on these two allotments if they are restocked with sheep in the future. Six incidents of apiary damage occurred during 2000, all occurring on private lands in the Cody area. The number of apiary damage problems has varied from 0 to 14/year during the past 5 years (1995-99). In all of this year�s incidents, further damage was prevented by erecting permanent or temporary electric fences to exclude bears from the hives. Sites fenced with temporary materials during 2000 will be permanently protected in the spring of 2001. Electric fencing has been very successful at preventing damage to apiaries at many locations in Wyoming during the past 10 years. Property Damage--Property damage incidents increased 257% in 2000 (n = 25) from the number of incidents in 1999 (n = 7) and increased 212% from the previous 5-year average of 8 incidents/year. Types of incidents included damage to camps, vehicles, bird feeders, and buildings. The Wyoming Game and Fish Department (WGFD) provided assistance with materials and technical advice, and managed bears when needed to prevent further property damage. Anthropogenic Food Rewards--Bears were able to access non-natural foods in 35 incidents during 2000. In 17 of the incidents they caused property damage while

103
attempting to obtain human food, garbage, pet or livestock feeds. One incident occurred on the BTNF, 10 incidents occurred on the SNF, and 24 occurred on private lands in the Cody and Dubois areas. Harvested Game Animals--The WGFD received numerous reports of bears consuming harvested game animals that had been left in the field or improperly stored, but only 2 incidents of bears obtaining a carcass that had been properly stored. A bear was able to remove a bighorn sheep that had been hung in a tree, completely consuming the carcass. A female grizzly with COY damaged an outbuilding at a cabin site and consumed the carcass of an elk that had been hung in the building. Human Injuries--One bear-caused human injury occurred in Wyoming during 2000. A non-resident hunter was injured by a female grizzly bear accompanied by two yearling cubs in a close encounter while the man was deer hunting on the SNF. The bears had briefly encountered the hunter�s partner just moments before the incident, turned and ran about 50 yards downhill running into the second hunter. The adult female charged once, knocking the man down, biting him on the shoulders and arms. The man�s hunting partner shot once at the bear injuring it. Although it left a small blood trail, no carcass was recovered and the status of her injury remains unknown. The hunter required hospitalization and received numerous stitches to close the wounds he received in the incident. Human Caused Bear Deaths--Sixteen human caused bear mortalities and one injury occurred in Wyoming in 2000. A family group of 3 bears (female 249 with 2 COY) were sent to a research facility after repeated damage on private lands. Bear 249 had been moved on 2 previous occasions but returned to her home range and continued to damage property. Male bear 212 was killed after repeated livestock depredations and after he returned from being moved to a wilderness site. He had been known to kill livestock since 1993 in the Cody area. One male bear was illegally killed by a sheepherder after it killed several sheep near Cody. The herder and sheep owner were prosecuted and fined for the killing. One female grizzly was injured by gunfire after injuring a deer hunter north of Dubois. Based on evidence collected at the scene, it appeared that the bear was not seriously injured, and no carcass was recovered. Three bears were killed in encounters in hunting camps, 2 were killed when they acted aggressively while attempted to claim game carcasses from hunters, 2 were killed mistakenly for black bears by spring black bear hunters, and 4 were killed in close encounters with ungulate hunters. Bear Management Activities--Human-bear conflicts occurred throughout the non-denning period in Wyoming, remaining at relatively low levels throughout the spring and early summer and then increasing in late summer and fall. In addition to the 4 bears removed because of chronic damage histories, 11 grizzlies were captured because of nuisance activities. Eight of the 11 were relocated and 3 were released at the capture site because only part of the family group could be caught. An additional 5 bears were captured and released during management activities without being moved because they were non-target captures. Throughout the non-denning season, WGFD personnel

104
provided educational information and technical assistance to prevent and solve conflict incidents to numerous individuals, groups, and businesses in northwest Wyoming. Yellowstone National Park There were 6 incidents where grizzly bears damaged property and 2 grizzly bear-inflicted human injuries in YNP in 2000. Due to the relatively few conflicts that occurred, no grizzly bears were captured in management actions. Property Damage--On 25 March 2000 at 9:45 a.m., a maintenance worker at the Old Faithful water treatment plant returned to his snowmobile after being in the water plant for approximately 1 hour and found the seat to his snowmobile completely torn up by a grizzly bear. Fresh grizzly bear tracks were found leading up to and away from his snowmobile. No management action was taken against the bear.
On 31 May 2000 at 5:00 a.m., a park resident at the South Entrance government housing area looked out the window and saw an adult size grizzly bear chewing on and destroying his child�s rubber bouncy ball that had been left out in the yard. No management action was taken against the bear. On 8 July 2000 at 6:30 p.m., a Student Conservation Association (SCA) work crew camped at Red Creek was approximately 150 yards from where their tents were pitched when they saw a small subadult grizzly walk past them on the side-hill. Upon returning to their tent site, they discovered that the bear had torn the fly on one tent and strewn some packs around, dragging one approximately 20 feet. There was no food in the packs as it was all hung in the cooking area approximately 150 yards away. The SCA work camp was temporarily closed, no action was taken against the bear. On 9 September 2000 at 12:47 a.m., a resident heard noises at the window of their apartment at the East Entrance government housing area. Upon investigating the window in the morning they discovered that the aluminum window frame was bent and that there was a grizzly bear paw print on the glass. Since the bear was unsuccessful at gaining entry and did not receive a food reward, no action was taken against the bear. Rangers increased patrols and monitoring of the area. On 11 September 2000 at 1:30 a.m., a resident at the East Entrance housing area was awaken to the sound of breaking glass and then heard grunting outside. Grizzly bear paw prints were found on the broken glass. Grizzly tracks were also observed in the mud at the base of the window. The grizzly had torn the window screen and broken the glass. Since the bear did not receive a food reward no action was taken against the bear. Increased bear patrol and monitoring of the area was continued. On 15 September 2000 in the evening, a subadult grizzly bear entered backcountry campsite 3L2 along Cache Creek and tore open a pack ripping the fabric. The bear also dug the ground in the area where the group had been dumping their dishwater. After not finding any food, the bear left the campsite. Since the bear did not receive a food reward,

105
no action was taken against the bear. Campsite 3L2 and nearby campsite 3L1 were closed temporarily to camping, and �bear frequenting area� signs were posted at the trailhead.
Bear Inflicted Human Injuries--On 30 July 2000 at approximately 10:00 a.m., 2 men day-hiking on the Avalanche Peak trail stopped to remove some layers of clothing when they heard, then saw an adult female grizzly and 1 yearling walking towards them. Both hikers immediately dropped to the ground, face down, with their hands protecting their necks and played dead. The adult female grizzly approached them and bit 1 man on the hand. The bear only sniffed the second man. The man who was bitten was treated at the Lake Hospital and then released the same day. Injuries consisted of minor puncture wounds and scratches to the right hand. The incident was considered normal defensive behavior by a female grizzly bear protecting her yearling. No action was taken against the bear. The Avalanche Peak trail was closed to hiking for several weeks. On 1 September 2000 at approximately 3:30 p.m., a man on horseback who had been riding by himself on the Daly Creek trail stopped for lunch. The man stated that he was sitting under a tree trying to avoid heavy rainfall. His horse was hobbled nearby. He reported that while eating his lunch his horse snorted, he turned to his left and saw a grizzly bear �practically on top of him�. The bear swatted him, knocking him face first into a tree. He tripped on his rain pants and landed face down with the bear straddling him. He got out his bear spray, rolled over, and sprayed the bear in the face and mouth. The bear rolled off of him coughing. He received minor abrasions to his cheek and forehead on the right side of his face. His glasses were also broken and his shirt torn. The man received medical treatment and was released the same day. Concerns for the Future in Yellowstone National Park--Strong public education and sanitation programs have kept the number of bear-human conflicts and human-caused grizzly bear mortalities in YNP relatively low in recent years. Continuation of these programs is essential to further reducing and preventing bear-human conflicts within the park. Due to more than a decade with few conflicts, complacency in implementing and enforcing YNP�s Bear Management sanitation programs is a concern, as few current park employees were around in the past years when conflicts were common. Management of human habituated (but not food conditioned) grizzly bears feeding on natural foods adjacent to roadside corridors, often with hundreds of people watching and photographing within distances of 20 to 50 m, continues to be the most challenging bear management issue in the park (Gunther and Biel 1999). In 2000, park staff responded to 110 bear-jams involving grizzly bears, to provide visitors with interpretive information and traffic control, as well as to monitor visitor�s behavior in order to prevent them from approaching and/or feeding the bears involved. Habituated bears have learned to live in close proximity to people while being involved in relatively few conflicts in the park. If park visitors can learn to behave appropriately around habituated bears in a manner that does not put them or the bears at risk, it can be beneficial to both bears and people. Bears would benefit by the reduction in the number of bears removed in management actions and by gaining access to previously unavailable (due to management actions) high-quality habitat adjacent to park road corridors. Park visitors would benefit by being able
106
to watch and photograph bears involved in natural behavior in their natural habitat. New innovative strategies for managing people and habituated bears at bear-jams need to be developed to reduce the potential for bear-human conflicts with, and human-caused mortality of, habituated grizzly bears that frequent road corridors in YNP.
DISCUSSION Year 2000 Overview In 2000, there was a below average abundance of winter-killed ungulate carcasses in spring. During the estrous season, whitebark pine seeds left over from the previous fall were abundant as snow melted in the high-elevation whitebark pine zone. Bears continued to feed on over-wintered whitebark pine seeds throughout the early hyperphagia season. Army cutworm moths were also abundant during early hyperphagia. By late hyperphagia, few over-wintered whitebark pine seeds remained and the current year�s production was significantly below average. In addition, severe drought conditions throughout the GYE resulted in most vegetal bear foods becoming desiccated early. Due to below average abundance of high-quality bear foods during late hyperphagia, the number of conflicts, especially incidents of bears obtaining anthropogenic foods, were higher than the long-term average recorded from 1992-99 (Table 47). Although most types of conflicts were above average, the number of livestock depredations in 2000 were lower than the number recorded each of the previous 3 years, reversing the trend of increasing livestock depredations in recent years. Table 47. Number of incidents of different types of grizzly bear-human conflicts in 2000 compared to the average number of conflicts recorded from 1992-99 in the Greater Yellowstone Ecosystem.
Time period Type of conflict 2000 1992-99 average Human Injury 4 4 ± 3 SD Property Damage 17 13 ± 9 SD Anthropogenic Foods 69 33 ± 29 SD Gardens/Orchards 7 5 ± 3 SD Bee Hives 6 3 ± 5 SD Livestock Depredations 49 48 ± 24 SD Total Conflicts 152 105 ± 43 SD
Hyperphagia is the period of intensive search for high-energy foods as bears prepare for hibernation (Nelson et al. 1983). Over-wintered whitebark pine seeds and army cutworm moths were abundant in 2000 and provided bears with good foraging opportunities at high elevation during early hyperphagia. This separated bears spatially from human activities. However, drought conditions and the poor fall production of the current years whitebark pine seeds resulted in bears being nutritionally stressed during late

107
hyperphagia. As a result, bears sought anthropogenic foods in association with human activities at lower elevations. This led to an above average number of incidents of bears obtaining anthropogenic foods and subsequently led to high numbers of management removals of grizzly bears from the ecosystem. In addition, an above average number of grizzly bears had confrontations with hunters and were killed in self-defense. Geographic Areas with High Numbers of Conflicts Most of the grizzly bear-human conflicts that occurred in 2000, occurred in 4 distinct geographic areas of the ecosystem (Figure 15). Many of the conflicts in these 4 areas were caused by just a few individual grizzly bears. The 4 areas where most conflicts occurred included the North Fork and South Fork areas of the Shoshone River where bears killed cattle and sheep, obtained garbage, and damaged apiaries, orchards, buildings, and vehicles; the Green River area where bears killed cattle; and the Dunoir River drainage where bears damaged vehicles, obtained garbage, and killed cattle. The North and South Forks of the Shoshone River and Green River areas have consistently had more conflicts than other areas of the ecosystem each of the last 4 years (1997-2000). Future pre-emptive management and public education efforts should be directed at reducing conflicts in these 4 geographic areas. Current Management Concerns In 2000, there were a higher than usual number of human-caused grizzly bear mortalities. Years with high numbers of human-caused grizzly bear mortality continue to be a significant concern for land and wildlife managers in the GYE. Over the last 9 years (1992-2000) there have been 74 known human-caused grizzly bear mortalities in the GYE. The most prevalent causes of human-caused grizzly bear mortality during this time period were the killing of bears in defense of life and property (43%, n = 32) and management removal (31%, n = 23) of bears involved in bear-human conflicts. Other sources of human-caused grizzly bear mortality included incidents of poaching (12%, n = 9), mistaken identification by black bear hunters (7%, n = 5), bears being electrocuted by downed power-lines (4%, n = 3), and bears being hit and killed by vehicles (3%, n = 2). Defense of life (n = 29) and property (n = 3) kills of grizzly bears have been the highest source of human-caused grizzly bear mortality over the last 9 years. Defense of life and property kills included incidents with hunters (n = 28), incidents at private homes and cabins (n = 3), and incidents on federal grazing leases (n = 1). Increased hunter education efforts and promotion of the use of bear pepper spray during confrontations with bears have been emphasized over the last few years in an effort to reduce the number of self-defense kills of grizzly bears by hunters. Bear pepper sprays containing capsicum appear to be potentially useful in deterring aggressive bears in a variety of field situations (Herrero and Higgins 1998). Management removal of nuisance grizzly bears (n = 23), especially food conditioned bears, has been the second highest source of human-caused bear mortality in the

108
ecosystem over the last 9 years. Management related mortalities included removal of grizzly bears that were conditioned to anthropogenic foods (n = 11) as well as those involved in livestock depredations (n = 5), damaging property in an attempt to obtain human foods (n = 4), management handling accidents (n = 2), and human injuries (n = 1). Living in bear country workshops, backcountry camping information, trailhead and campground signs, press releases, information handouts and mailings, and personal contacts have been used to inform the public on methods to reduce bear-human conflicts while living, working, and visiting bear country. Continuation and expansion of these programs as well as analysis of their effectiveness is necessary to further reduce and/or prevent grizzly bear-human conflicts, especially during years with shortages of natural bear foods. Other sources of human-caused grizzly bear mortality such as poaching (n = 9), black bear hunters (n = 5), power-lines (n = 3), and road-kill (n = 2), are relatively infrequent in comparison to defense of life and property kills and management removals of food condition bears. Of these sources of mortality, mistaken identification by black bear hunters is likely the most preventable type. Better hunter education techniques and methods of dispensing information on grizzly bear identification and distribution in the GYE would likely contribute towards reducing the frequency of these mortalities. More law enforcement presence or higher rewards for turning in poachers would likely contribute towards a reduction in incidents of poaching. Concerns for the Future The majority of conflicts in 2000 occurred outside of the Recovery Zone boundary. The most prevalent types of conflicts that occurred outside of the Recovery Zone boundary were livestock depredations and incidents of grizzly bears obtaining anthropogenic foods. Incidents of grizzly bears killing livestock, obtaining human foods, and damaging property in search of human foods are likely to increase outside of the recovery zone as bear numbers increase beyond the recovery zone boundary. Due to grizzly bears becoming more common in areas beyond the Recovery Zone boundary, sanitation and public education programs designed to reduce bear-human conflicts should be expanded into these areas. At present, highly selective control of livestock-depredating grizzly bears has resulted in only the most chronic depredators being removed from the GYE population. At some point the level of human tolerance of grizzly bear depredations on livestock will likely be exceeded, especially in areas far from the Recovery Zone boundary. At that point, predator control actions against depredating grizzly bears will likely increase as well. The interface areas between occupied grizzly bear habitat and livestock producing agricultural areas are likely to be a continual challenge to grizzly bear managers in the GYE. Future management should address pre-emptive management actions designed to reduce grizzly bear depredations on livestock and incidents of bears obtaining anthropogenic foods outside of the existing Recovery Zone. The state of Wyoming is experimenting with use of electric fence to reduce grizzly bear depredation on sheep at evening bed-grounds (Appendix B).
109
As the grizzly bear population increases and recovery goals are met, the problem of habituated bears foraging for natural foods along roadsides as currently being observed in YNP, is likely to increase and expand to other areas of the ecosystem outside of YNP. Within the last few years, habituated bears have started to appear along the North Fork highway east of YNP. Management of human habituated (but not food conditioned) grizzly bears feeding on natural foods adjacent to roadside corridors is becoming a significant bear management challenge both inside national parks and on national forests (Gunther and Biel 1999). We recommend developing and evaluating new strategies for managing people and habituated bears at roadside bear-jams, to reduce the potential for bear-human conflicts with, and human-caused mortality of, habituated grizzly bears that frequent road corridors on public lands. New innovative strategies for managing people and habituated bears along public land roadside corridors could potentially benefit grizzly bear conservation throughout the GYE.

110
LITERATURE CITED Archibald, W. R., R. Ellis, and A. N. Hamilton. 1987. Responses of grizzly bears to
logging truck traffic in the Kimquist River Valley, British Columbia. International Conference for Bear Research and Management 7:251-257.
Aune, K., and W. Kasworm. 1989. Final Report. East Front Grizzly Studies. Montana
Department of Fish, Wildlife and Parks, Helena. Basile, J. 1982. Grizzly bear distribution in the Yellowstone area, 1973-79. U.S. Forest
Service Research Note INT-321. 11pp. Blanchard, B. 1985. Field techniques used in the study of grizzly bears. National Park
Service, Interagency Grizzly Bear Study Team report. 24pp. Blanchard, B. M. 1987. Size and growth patterns of the Yellowstone grizzly bear.
International Conference for Bear Research and Management 7:99-107. Blanchard, B. M. 1990. Relationship between whitebark pine cone production and fall
grizzly bear movements. Pages 362-363 in W. C. Schmidt and K. J. McDonald, compilers. Proceedings of symposium on whitebark pine ecosystems: ecology and management of a high-mountain resource. U.S. Forest Service General Technical Report INT-270. U.S. Department of Agriculture, Forest Service, Ogden, Utah.
Blanchard, B. M., and R. R. Knight. 1991. Movements of Yellowstone grizzly bears,
1975-87. Biological Conservation 58:41-67. Blanchard, B. M., and R. R. Knight. 1996. Effects of wildfire on grizzly bear
movements and foraging strategies. Pages 117-122 in J. M. Greenlee, editor. Proceedings of the second biennial scientific conference on the Greater Yellowstone Ecosystem. International Association of Wildland Fire, Fairfield, Washington.
Blanchard, B. M., R. R. Knight, and D. J. Mattson. 1992. Distribution of Yellowstone
grizzly bears during the 1980s. American Midland Naturalist 128:332-338. Bolten, A., K. Bjorndahl, H. Martins, T. Dellinger, M. Biscotio, S. Encalada, and J. R.
Spotila. 1997. Loggerhead transatlantic developmental migrations demonstrated by mtDNA sequence analysis. Proceedings � Sea Turtle Biology and Conservation Workshop.
Brannon, R. D. 1984. Influence of roads and developments on grizzly bears in
Yellowstone National Park. M.S. Thesis, Montana State University, Bozeman.
111
Bunnell, F. L., and D. E. N. Tait. 1981. Population dynamics of bears�Implications. Pages 75-98 in C. W. Fowler and T. D. Smith, editors. Dynamics of large mammal populations. John Wiley and Sons, New York, New York.
Burton, R. L., J. K. Starks, and D. C. Peters. 1980. The army cutworm. Bulletin B-749,
Agricultural Experimental Station, Oklahoma State University. 35pp. Chapman, J. A., J. I. Romer, and J. Stark. 1955. Ladybird beetle and army cutworm
adults as food for grizzly bears in Montana. Ecology 36:156-158. Cole, G. F. 1971. An ecological rationale for the natural or artificial regulation of native
ungulates in parks. Transactions of the North American Wildlife and Natural Resources Conference 36:417-425.
Craighead, F. L., and E. R. Vyse. 1996. Brown/grizzly bear metapopulations. Pages
325-351 in D. McCullough, editor. Metapopulations and Wildlife Conservation Management. Island Press, Washington, D.C.
Craighead, J. J., K. R. Greer, R. R. Knight, and H. I. Pac. 1988. Grizzly bear mortalities
in the Yellowstone Ecosystem, 1959-1987. Report of the Montana Department of Fish, Wildlife and Parks; Craighead Wildlife Institute; Interagency Grizzly Bear Study Team; and National Fish and Wildlife Foundation. 12pp plus data.
Craighead, J. J., J. Sumner, and J. A. Mitchell. 1995. The grizzly bears of Yellowstone:
their ecology in the Yellowstone ecosystem, 1959-1992. Island Press, Washington, D.C.
Craighead, J. J., J. S. Sumner, and G. B. Scaggs. 1982. A definitive system for analysis
of grizzly bear habitat and other wilderness resources. Wildlife-Wildlands Institute Monograph 1. University of Montana Foundation, Missoula.
Eberhardt, L. L. 1990. Survival rates required to sustain bear populations. Journal of
Widlife Management 54:587-590. Eberhard, L. L. 1995. Population trend estimates from reproductive and survival data.
Pages 13-19 in R. R. Knight and B. M. Blanchard, editors. Yellowstone grizzly bear investigations: report of the Interagency Grizzly Bear Study Team, 1994. National Biological Service, Bozeman, Montana.
Eberhardt, L. L., B. M. Blanchard, and R. R. Knight. 1994. Population trend of
Yellowstone grizzly bear as estimated from reproductive and survival rates. Canadian Journal of Zoology 72:360-363.
Estoup, A., L. Garnery, M. Solignac, and J. Comeut. 1995. Microsatellite variation in
honey bee (Apis mellifera L.) populations: hierarchical genetic structure and test of the infinite allele and stepwise mutation models. Genetics 140:679-695.

112
Farnes, P. E. 1991. A scaled index of winter severity. 59th Proceedings of the Western Snow Conference, 12-15 April 1991, Juneau, Alaska. 4pp.
French, S. P., M. G. French, and R. R. Knight. 1994. Grizzly bear use of army cutworm
moths in the Yellowstone ecosystem. International Conference for Bear Research and Management 9:389-399.
Garcia-Moreno, J., M. D. Matocq, M. S. Roy, E. Geffen, and R. K. Wayne. 1996.
Relationships and genetic purity of the endangered Mexican wolf based on analysis of microsatellite loci. Conservation Biology 10(2):376-389.
Green, G. I. 1994. Use of spring carrion by bears in Yellowstone National Park. M.S.
Thesis, University of Idaho, Moscow. Gunther, K. A., K. Aune, S. Cain, T. Chu, and C. M. Gillin. 1993. Grizzly bear-human
conflicts in the Yellowstone Ecosystem, 1992. Interagency Grizzly Bear Committee, Yellowstone Ecosystem Subcommittee report. U.S. Department of Interior, National Park Service, Yellowstone National Park. 22pp.
Gunther, K. A., and M. J. Biel. 1999. Reducing human-caused black and grizzly bear
mortality along roadside corridors in Yellowstone National Park. Pages 25-27 in: Proceedings of the International Conference on Wildlife Ecology and Transportation. FL-ER-73-99.
Gunther, K. A., M. Bruscino, S. Cain, T. Chu, K. Frey, and R. R. Knight. 1994. Grizzly
bear-human conflicts, confrontations, and management actions in the Yellowstone Ecosystem, 1993. Interagency Grizzly Bear Committee, Yellowstone Ecosystem Subcommittee report. U.S. Department of Interior, National Park Service, Yellowstone National Park. 29pp.
Gunther, K. A., M. Bruscino, S. Cain, T. Chu, K. Frey, and R. R. Knight. 1995. Grizzly
bear-human conflicts, confrontations, and management actions in the Yellowstone Ecosystem, 1994. Interagency Grizzly Bear Committee, Yellowstone Ecosystem Subcommittee report. U.S. Department of Interior, National Park Service, Yellowstone National Park. 37pp.
Gunther, K. A., M. Bruscino, S. Cain, T. Chu, K. Frey, and R. R. Knight. 1996. Grizzly
bear-human conflicts, confrontations, and management actions in the Yellowstone Ecosystem, 1995. Interagency Grizzly Bear Committee, Yellowstone Ecosystem Subcommittee report. U.S. Department of Interior, National Park Service, Yellowstone National Park. 39pp.

113
Gunther, K. A., M. Bruscino, S. Cain, T. Chu, K. Frey, and R. R. Knight. 1997. Grizzly bear-human conflicts, confrontations, and management actions in the Yellowstone Ecosystem, 1996. Interagency Grizzly Bear Committee, Yellowstone Ecosystem Subcommittee report. U.S. Department of Interior, National Park Service, Yellowstone National Park. 43pp.
Gunther, K. A., M. T. Bruscino, S. Cain, T. Chu, K. Frey, M. A. Haroldson, and C. C.
Schwartz. 1998. Grizzly bear-human conflicts, confrontations, and management actions in the Yellowstone ecosystem, 1997. Interagency Grizzly Bear Committee, Yellowstone Ecosystem Subcommittee report. U.S. Department of the Interior, National Park Service. Unpublished report. 45pp.
Gunther, K. A., M. T. Bruscino, S. Cain, J. Copeland, K. Frey, M. A. Haroldson, and C.
C. Schwartz. 1999. Grizzly bear-human conflicts, confrontations, and management actions in the Yellowstone ecosystem, 1998. Interagency Grizzly Bear Committee, Yellowstone Ecosystem Subcommittee report. U.S. Department of the Interior, National Park Service. Unpublished report. 56pp.
Gunther, K. A., M. T. Bruscino, S. Cain, J. Copeland, K. Frey, M. A. Haroldson, and C.
C. Schwartz. 2000. Grizzly bear-human conflicts, confrontations, and management actions in the Yellowstone ecosystem, 1999. Pages 55-108 in C. C. Schwartz and M. A. Haroldson, editors. Yellowstone grizzly bear investigations: annual report of the Interagency Grizzly Bear Study Team, 1999. U.S. Geological Survey, Bozeman, Montana. 62pp.
Gunther, K. A., and R. R. Renkin. 1990. Grizzly bear predation on elk calves and other
fauna of Yellowstone National Park. International Conference on Bear Research and Management 8:329-334.
Haroldson, M. A., R. A. Swalley, S. Podruzny, C. C. Schwartz, M. Ternent, G. Holm,
and D. Moody. 1998. Yellowstone grizzly bear investigations: annual report of the Interagency Grizzly Bear Study Team, 1997. U.S. Geological Survey, Biological Resources Division, Bozeman, Montana. 54pp.
Haroldson, M., D. Reinhart, K. Gunther, and L. Waits. 1999. Spawning cutthroat trout
numbers on tributary streams to Yellowstone Lake and grizzly bear use of spawning trout. Pages 33-40 in C. C. Schwartz and M. A. Haroldson, editors. Yellowstone grizzly bear investigations: annual report of the Interagency Grizzly Bear Study Team, 1998. U.S. Geological Survey, Bozeman, Montana. 72pp.
Haroldson, M. A., C. C. Schwartz, S. Cherry, and D. Moody. In preparation. Possible
effects of elk harvest on fall distribution of grizzly bears in the Greater Yellowstone Ecosystem.
114
Henry, J., and D. J. Mattson. 1988. Spring grizzly bear use of ungulate carcasses in the Firehole River drainage: third year progress report. Pages 51-59 in R. R. Knight, B. M. Blanchard, and D. J. Mattson. Yellowstone grizzly bear investigations: annual report of the Interagency Grizzly Bear Study Team, 1987. National Park Service, Bozeman, Montana.
Herrero, S., and A. Higgins. 1998. Field use of capsicum spray as bear deterrent. Ursus
10:533-537. Hoskins, W. P. 1975. Yellowstone Lake tributary study. Interagency Grizzly Bear
Study Team, Bozeman, Montana, unpublished report. 31pp. Houston, D. B. 1982. The northern Yellowstone elk. Macmillan Publishing Company,
New York, New York. 474pp. Kasworm, W. F., and T. L. Manley. 1990. Road and trail influences on grizzly bears and
black bears in northwest Montana. International Conference for Bear Research and Management 8:79-84.
Keane, R. E., and S. F. Arno. 1993. Rapid decline of whitebark pine in western
Montana: evidence from 20-year remeasurements. Western Journal of Applied Forestry 8: 44-47.
Klaver, R. W., J. J. Claar, D. B. Rockwell, H. R. Mayes, and C. F. Acevedo. 1986.
Grizzly bears, insects, and people: bear management in the McDonald Peak region, Montana. Pages 204-211 in G. Contreras and K. Evans, compilers. Proceedings of the Grizzly Habitat Sumposium. U.S. Forest Service General Technical Report INT-207. U.S. Forest Service Intermountain Research Station, Ogden, Utah.
Knight, R. R., D. J. Mattson, and B. M. Blanchard. 1984. Movements and habitat use of
the Yellowstone grizzly bear. National Park Service, Interagency Grizzly Bear Study Team report. 177pp.
Knight, R. R., B. M. Blanchard, and L. L. Eberhardt. 1995. Appraising status of the
Yellowstone grizzly bear population by counting females with cubs-of-the-year. Wildlife Society Bulletin 23:245-248.
Knight, R. R., and L. L. Eberhardt. 1985. Population dynamics of Yellowstone grizzly
bears. Ecology 66:323-334. Mace, R. D., J. S. Waller, T. L. Manley, L. J. Lyon, and H. Zuuring. 1996. Relationships
among grizzly bear, roads, and habitat in the Swan Mountains, Montana. Journal of Applied Ecology 33:1395-1404.
115
Mattson, D. J. 1997. Use of ungulates by Yellowstone grizzly bears Ursus arctos. Biological Conservation 81:161-177.
Mattson, D. J., K. Barber, R. Maw, and R. Renkin. 1999. Coefficients of productivity
for Yellowstone�s grizzly bear habitat. U.S. Geological Survey Forest and Rangeland Ecosystem Science Center, Corvallis, Oregon. 95pp.
Mattson, D. J., B. M. Blanchard, and R. R. Knight. 1991a. Food habits of Yellowstone
grizzly bears. Canadian Journal of Zoology 69:1619-1629. Mattson, D. J., B. M. Blanchard, and R. R. Knight. 1992. Yellowstone grizzly bear
mortality, human-habituation, and whitebark pine seed crops. Journal of Wildlife Management 56:432-442.
Mattson, D. J., C. M. Gillin, S. A. Benson, and R. R. Knight. 1991b. Bear feeding
activity at alpine insect aggregation sites in the Yellowstone ecosystem. Canadian Journal of Zoology 69:2430-2435.
Mattson, D. J., and C. Jonkel. 1990. Stone pines and bears. Pages 223-236 in W. C.
Schmidt and K. J. McDonald, compilers. Proceedings-symposium on whitebark pine ecosystems: ecology and management of a high-mountain resource. U.S. Forest Service General Technical Report INT-270.
Mattson, D. J., and R. R. Knight. 1992. Spring bear use of ungulates in the Firehole
River Drainage of Yellowstone National Park. Pages 5-93 - 5-120 in J. D. Varley and W. G. Brewster, editors. Wolves for Yellowstone? a report to the United States Congress, Volume IV Research and Analysis. National Park Service, Yellowstone National Park, Wyoming.
Mattson, D. J., R. R. Knight, and B. M. Blanchard. 1987. The effects of developments
and primary roads on grizzly bear habitat use in Yellowstone National Park, Wyoming. International Conference for Bear Research and Management 7:259-273.
Mattson, D. J., and D. P. Reinhart. 1995. Influences of cutthroat trout (Oncorhynchus
clarki) on behavior and reproduction of Yellowstone grizzly bears (Ursus arctos), 1975-1989. Canadian Journal of Zoology 73:2072-2079.
McIntyre, J. D. 1996. Review and assessment of possibilities for protecting the cutthroat
trout of Yellowstone Lake from introduced lake trout. Pages 28-33 in J. D. Varley and P. Schullery, editors. The Yellowstone Lake crisis: confronting a lake trout invasion. National Park Service report. Yellowstone National Park, Wyoming.

116
McLellan, B. N. 1994. Density-dependent population regulation of brown bears. Pages 15-24 in M. Taylor, editor. Density-dependent population regulation of black, brown, and polar bears. International Conference for Bear Research and Management 9, Monograph Series 3.
McLellan, B. N., and D. M. Shackleton. 1988. Grizzly bears and resource extraction
industries: effects of roads on behavior, habitat use and demography. Journal of Applied Ecology 25:451-460.
Mealey, S. P. 1975. The natural food habits of free ranging grizzly bears in Yellowstone
National Park, 1973-1974. M.S. Thesis, Montana State University, Bozeman. Mealey, S. P. 1980. The natural food habits of grizzly bears in Yellowstone National
Park, 1973-74. International Conference for Bear Research and Management 4:281-292.
Nelson, R. A., G. E. Folk, E. W. Pfeifer, J. J. Craighead, C. J. Jonkel, and D. L. Steiger.
1983. Behavior, biochemistry, and hibernation in black, grizzly and polar bears. International Conference on Bear Research and Management 5:284-290.
O�Brien, S. L, and F. G. Lindzey. 1994. Grizzly bear use of moth aggregation sites and
summer ecology of army cutworm moths in the Absaroka Mountains, Wyoming. Final Report to the Wyoming Game and Fish Department. Wyoming Cooperative Fish and Wildlife Research Unit, University of Wyoming, Department of Zoology-Physiology, Laramie. 279pp. [plus 15 pages of preface including cover]
Ouren, D. 2000. The effect of environmental variability on grizzly bear habitat use:
year one. Pages 50-53 in C. C. Schwartz and M. A. Haroldson, editors. Yellowstone grizzly bear investigations: annual report of the Interagency Grizzly Bear Study Team, 1999. U.S. Geological Survey, Bozeman, Montana. 128pp.
Palsboll, P. J., J. Allen, M. Bèrubè, P. J. Clapham, T. P. Feddersen, P. S. Hammond, R.
R. Hudson, H. Jorgensen, S. Katona, A. H. Larsen, F. Larsen, J. Lein, D. K. Mattila, J. Sigurjònsson, R. Sears, T. Smith, R. Sponer, P. Stevick, and N. Olen. 1997. Genetic tagging of humpback whales. Nature 388:767-769.
Pritchard, G. T., and C. T. Robbins. 1990. Digestive and metabolic efficiencies of
grizzly and black bears. Canadian Journal of Zoology 68:1645-1651. Pruess, K. P. 1967. Migration of the army cutworm, Chorizagrotis auxiliaris
(Lepidoptera: Noctuidae). I. evidence for migration. Annals of the Entomological Society of America 60(5):910-920.
Queller, D. C., J. E. Strassmann, and C. R. Hughes. 1993. Microsatellites and kinship.
TREE 8(8):285-288.

117
Rankin-Baransky, K., C. J. Williams, B. W. Bowen, S. E. Encalada, and J. R. Spotila. 1997. Origin of loggerhead sea turtles in the Western N. Atlantic as determined by mtDNA sequence anayalsis. Proceedings � Sea Turtle Biology and Conservation Workshop.
Reinhart, D. P. 1990. Grizzly bear use of cutthroat trout spawning streams in tributaries
of Yellowstone Lake. M.S. Thesis, Montana State University, Bozeman. Reinhart, D. P., M. A. Haroldson, D. J. Mattson, and K. A. Gunther. 2001. Effects of
exotic species on Yellowstone�s grizzly bears. Western North American Naturalist 61(3):277-288.
Robison, H. 1999. Moth project summary and description of fieldwork for summer and
fall 1999. Unpublished summary submitted to the Interagency Grizzly Bear Study Team. U.S. Geological Survey, Bozeman, Montana. 2pp.
Rogers, L. L. 1987. Effects of food supply and kinship on social behavior, movements,
and population growth of black bears in northeastern Minnesota. Wildlife Monographs No. 97.
Schullery, P., and J. D. Varley. 1996. Cutthroat trout and the Yellowstone Ecosystem.
Pages 12-21 in J. D. Varley and P. Schullery, editors. The Yellowstone Lake crisis: confronting a lake trout invasion. National Park Service report. Yellowstone National Park, Wyoming.
Schwartz, C. C., M. A. Haroldson, K. Gunther, and D. Moody. 2002. Distribution of
grizzly bears in the Greater Yellowstone Ecosystem. Ursus 14:in press. Servheen, C. 1983. Grizzly bear food habits, movements, and habitat selection in the
Mission Mountains, Montana. Journal of Wildlife Management 47:1026-1035. Smith, J., and J. Hoffman. 1998. Status of white pine blister rust in Intermountain
Region white pines. U.S. Forest Service Intermountain Region, State and Private Forestry, Forest Health Protection Report No. R4-98-02. 24pp.
Strickland, E. H. 1916. The army cutworm (Euxoa [Chorizagrotis] auxiliaris Grote).
Canadian Department of Agriculture, Entomological Branch Bulletin 13. 31pp. Stringham, S. F. 1990. Grizzly bear reproductive rate relative to body size. International
Conference for Bear Research and Management 8:433-443. Ternent, M., and M. Haroldson. 2000. Grizzly bear use of insect aggregation sites
documented from aerial telemetry and observations. Pages 36-39 in C.C. Schwartz and M. A. Haroldson, editors. Yellowstone grizzly bear investigations: annual report of the Interagency Grizzly Bear Study Team, 1999. U.S. Geological Survey, Bozeman, Montana.
118
Ternent, M. A., M. A. Haroldson, D. D. Bjornlie, and D. S. Moody. In preperation.
Determing grizzly bear use of moth aggregation sites in the Greater Yellowstone. Ursus 12:0000-0000.
U.S. Fish and Wildlife Service. 1993. Grizzly bear recovery plan. Missoula, Montana.
181pp. U.S. Fish and Wildlife Service. 2000. Draft conservation strategy for the grizzly bear in
the Yellowstone Area. U.S. Fish and Wildlife Service, Missoula, Montana. 138pp.
Waits, L. P., G. Juikart, and P. Taberlet. 2001. Estimating the probability of identity
among genotypes: cautions and guidelines. Melecular Ecology:in press. White, D., Jr. 1996. Two grizzly bear studies: moth feeding ecology and male
reproductive biology. Ph.D. Dissertation, Montana State University, Bozeman. Woods, J. G, D. Paetkau, D. Lewis, B. N. McLellan, M. Proctor, and C. Strobek.. 1999.
Genetic tagging free-ranging black and brown bears. Wildlife Society Bulletin 27:616-627.

119
APPENDIX A. Official memorandum dated 15 February 2001, on inclusion of �probable� grizzly bear mortalities in calculation of mortality thresholds. From Chris Servheen on behalf of the Interagency Grizzly Bear Study Team (IGBST), Northern Continental Divide Ecosystem (NCDE) Technical Team, Wayne Wakkinen, and Wayne Kasworm, to the Interagency Grizzly Bear Committee. The IGBST met in Bozeman, Montana, on 3 October 2000 to discuss the need to clarify mortality criteria contained within the Grizzly Bear Recovery Plan (USFWS 1993). Based upon this discussion, recommendations were made on clarification of the protocols used for recording grizzly mortalities. These recommendations were reviewed and comments were received from the NCDE Technical Team, Wayne Wakkinen for the Selkirk ecosystem, and Wayne Kasworm for the Cabinet/Yaak ecosystem. Based on this review and discussion by the combined technical specialists, researchers and managers of the 4 ecosystems where most grizzly bears exist, we suggest the following changes to the mortality monitoring protocol. This represents the combined opinions of the people in the state and federal agencies knowledgeable about grizzly bear research, monitoring, and management in these ecosystems. The U.S. Fish and Wildlife Service will append these changes to the 1993 Grizzly Bear Recovery Plan in 2001. The 1993 Recovery Plan, as written, is not entirely clear as to how human-caused mortalities will be tallied. On pages 19, 33, and 42, reference is made to �known human-caused mortalities.� But the references provided on page 42 (Knight et al. 1989, 1990, 1991, 1992, 1993) contain tables that provide mortalities which are classified as both �known� and �probable.� After considerable discussion, it became apparent that there was some confusion as to weather probable mortalities are and/or should be included in calculations to assess mortality quotas. We agreed that �probable� mortalities should be counted against the established mortality quota. Operating under this premise, we focused on what defines a �probable� mortality. We feel that the definitions provided by Craighead et al. (1988:6) are adequate. These are: • Known: Carcass recovered or evidence to indicate known status due to radio
telemetry. • Probable: Strong evidence to indicate mortality; report by highly reliable sources,
but no carcass was recovered. • Possible: Presumptive evidence of death, but no immediate prospect of validation. We discussed each definition and felt that some examples might provide more clear guidance when classifying bears in these categories. • Known deaths require a carcass, management removal, or a cut radiocollar.
Deployed collars that have the appearance (not clear) of being cut should receive additional forensic review for definitive proof.
• Probable includes those cases where there is supportive evidence that a bear was wounded. No one definition of what constituted �strong evidence�, was agreed upon, and there should probably not be one. Circumstances of each reported

120
instance should be considered. However, we do provide the following examples as guides. Probable includes those cases where evidence of blood, hair, or other tissues clearly indicates wounding; observations suggesting wounding (i.e., there was a bear observed by numerous individuals with entrails hanging from its abdomen); and/or visual observation indicating the bear displayed abnormal behavior (dangling limb). We also recommend that cubs-of-the-year that accompany an adult female classified as a �known� mortality be considered �probable� mortalities. The literature is unclear on the probability of survival for orphaned cubs. Craighead et al. (1988) used 1 July, after that date they classified cubs-of-the-year (COY) of a known dead female as �possible� mortalities. We believe this date was too early in the season to ensure with some reasonable degree of certainty that a cub would survive. Since a cub learns about food resources from the female, it was discussed that a cub orphaned prior to learning all 3 seasons� food resources would have a low likelihood of survival. However, we could not determine an exact date with any certainty and no data exist to support one. We therefore recommend that any cub orphaned during its first year of life be considered a probable mortality.
• Possible deaths (not counted for recovery criteria) include hearsay evidence of a poaching or malicious death.
Because classification into probable and possible is subjective, we recommend keeping the established protocol where the mortality record keepers in each ecosystem review each case to determine classification based upon the best available information. We also recommend that the mortality record keepers in each ecosystem maintain a file on each case with a clear record indicating why a bear was classified as probable or possible. We have begun documentation of grizzly mortalities using these definitions with the 2000 data. Because our recommendations require counting �probable� mortalities against the mortality quota, and because there is a female quota, each probable mortality must be assigned sex. We discussed how to assign sex to these bears as follows. • In most situations where a wounded bear is reported (potential probable mortality),
the individual involved knows if the bear was alone or with offspring. Therefore probable deaths where COY are reported present, will be classified as sex = female.
• Lone bears classified as probable deaths will be assigned sex based upon statistics available from known deaths in that ecosystem. For example, the percentage of males and females in the GYE for known deaths (n = 97) between 1975-98, excluding natural mortalities, management removals, and females with young is 59% and 41% respectively. Therefore we recommend assigning sex to probable mortalities in the GYE at 59:41 male:female. For each bear we will draw a random number between 1 and 100. If the number is ≤59, sex = male; if the number is >59, sex = female. This same procedure will be used in each ecosystem using historic sex ratio data from 1975 (or as available) to the present.

121
• COY will be assigned sex based a 50:50 sex ratio at birth (as per Eberhardt et al. 1994). For each bear we will draw a random number between 1 and 100. If the number is 1-50, sex = male; if the number is 51-100, sex = female.
We also recommend that the historic mortality database currently housed at Montana Fish, Wildlife and Parks be reviewed and corrected for each ecosystem by the record keeper in that ecosystem in cooperation with local managers, researchers, and law enforcement officials. We are aware of some discrepancies between classifications of known, probable, and possible mortalities. We are also aware of several mortalities that are still listed as �under investigation� that are years old. Once this is completed, we can recalculate mortalities as per the recovery plan.
LITERATURE CITED Craighead, J. J., K. R. Greer, R. R. Knight, and H. I. Pac. 1988. Grizzly bear mortalities
in the Yellowstone ecosystem, 1959-1987. Montana Fish,Wildlife and Parks; Craighead Wildlife-Wildlands Institute; Interagency Grizzly Bear Study Team; and National Fish and Wildlife Foundation. 102pp.
Eberhardt, L. L., B. M. Blanchard, and R. R. Knight. 1994. Population trend of the
Yellowstone grizzly bear as estimated from reproductive and survival rates. Canadian Journal of Zoology 72:360-363.
Knight, R., B. Blanchard, and D. Mattson. 1989. Yellowstone grizzly bear
investigations: annual report of the Interagency Grizzly Bear Study Team, 1988. National Park Service, Bozeman, Montana. 34pp.
Knight, R., B. Blanchard, and D. Mattson. 1990. Yellowstone grizzly bear
investigations: annual report of the Interagency Grizzly Bear Study Team, 1989. National Park Service, Bozeman, Montana. 33pp.
Knight, R., B. Blanchard, and D. Mattson. 1991. Yellowstone grizzly bear
investigations: annual report of the Interagency Grizzly Bear Study Team, 1990. National Park Service, Bozeman, Montana. 15pp.
Knight, R., B. Blanchard, and D. Mattson. 1992. Yellowstone grizzly bear
investigations: annual report of the Interagency Grizzly Bear Study Team, 1991. National Park Service, Bozeman, Montana. 31pp.
Knight, R., B. Blanchard, and D. Mattson. 1993. Yellowstone grizzly bear
investigations: annual report of the Interagency Grizzly Bear Study Team, 1992. National Park Service, Bozeman, Montana. 26pp.
U.S. Fish and Wildlife Service. 1993. Grizzly bear recovery plan. Missoula, Montana.
181pp.

122
APPENDIX B
Feasibility of Using Portable Electric Fencing
To Prevent Damage to Livestock and Apiaries
by Bears and Other Predators
Prepared for:
ANIMAL DAMAGE MANAGEMENT BOARD
by Brian DeBolt
Wyoming Game and Fish Department 11/20/00
123
ACKNOWLEDGMENTS I would like to thank Hank Uhden, Ron Micheli, and the entire Animal Damage Management Board for providing financial support of this project. I would also like to thank Dick and Mary Thoman, Jon Robinett, and Ed Griffith for letting us test the system in field situations. Mark Bruscino, Ron Grogan, Mike Hooker, and Tim Fagan with the Wyoming Game & Fish Department provided technical and logistical support.
INTRODUCTION Damage by predators to livestock and property continues to be a serious problem for wildlife managers in Wyoming. Many techniques including the use of guard dogs (Green and Woodruff 1989), barricade lights, sirens, rubber bullets, and other deterrent devices have been used in attempts to decrease damage caused by black bears, grizzly bears, coyotes, and other wildlife. Permanent electric fencing has been very effective in reducing damage by bears and other predators (Madel 1996). However, fencing remote areas, such as sheep bed-grounds in Wyoming, would require a less traditional, more portable type of fence. The purpose of this project was to determine the feasibility and effectiveness of such a system.
STUDY AREA AND METHODS Initially, we tested the fence�s ability to repel bears in areas where grizzlies historically visited. The first site was on the Diamond G Ranch in the Dunoir valley north of Dubios, WY, where high concentrations of bears during the spring have been documented. We placed 3 mule deer carcasses at a remote site on the ranch and erected the fence around them. We installed 2 150-foot sections of ElectronetTM temporary fence. The fence was an 8-strand, 33-inch-high polywire fence supported by built-in Fiberglass support posts every 12 feet. The bottom wire was neutral and then each wire from bottom to top alternated positive then negative. Each 150-foot section weighed 10 lbs. The fence was energized by an IntellishockTM 55B, 12 volt charger equipped with a 40 watt solar charger and a 40 amp. sealed lead acid deep cycle battery. The system was purchased from Premier Sheep Supplies, Ltd., 2031 300th Street, Washington, Iowa 52353. The second site was a dump site/bone yard on the Hoodoo Ranch in the South Fork of the Shoshone drainage, southwest of Cody, Wyoming. We raked the dirt around the perimeter of the fences and frequent observations of the sites were conducted to determine bear activity and to monitor fence function. We then tested the fence�s capabilities of reducing grizzly bear depredations on the Tosi, Elk Ridge, Rock Creek, and Lime Creek sheep allotments in the Upper Green River area of the Bridger-Teton National Forest where sheep losses have increased steadily since 1996. We installed sections of the temporary fence around areas where sheep were bedded at night. We collected data on ease of set-up and disassembly, ability of herders

124
to herd the sheep into the pens, effectiveness in deterring predators, and the durability of the system. We also tested the system at apiaries in the South Fork of the Shoshone. Fences were placed around beehives at several locations where damage by grizzly bears had occurred historically.
RESULTS Ability of Fence to Deter Bears and Other Predators The fence system was used at 6 sites between 1 May 2000 and 8 November 2000 for 118 nights. Sixteen grizzly bears and 2 coyotes were known to have visited and none succeeded in entering the fence perimeters. There may have been other animals that attempted to breach the fence that we were unable to detect, however, at no time did any bear appear to have penetrated the fence when it was functioning properly. Once the fence was reconnected improperly after livestock operators added carcasses to the Hoodoo site and bears were able to knock down the non-functional fence and feed on the carcasses. After the fence was properly fixed, no bears were able to enter. There was no evidence of bear activity at the sheep bedground sites. Ease of Set-up and Disassembly Assembly and disassembly times varied depending on the number of sections necessary to fence each site. On the sheep allotment site, it took 2 people with 1 truck and 1 4-wheeled ATV 2 hours to erect 12 sections of fence. It took 1 hour to dismantle with the same tools and manpower. On average for the other sites, it took 1 person approximately 30 minutes to erect and 15 minutes to take down the fence (up to 4 150-foot sections). The only tools required were occasionally pliers and a knife (such as a LeathermanTM Tool) and a rubber mallet. Overall fence deployment was very easy and used minimal time and manpower, although at times the lightweight posts were extremely difficult to plant in rocky substrate. Ability of Herders to Use Fence--It was difficult for us and the herder to get the sheep inside the pen each night. The fence was turned off until all of the sheep were inside. Meanwhile lambs were becoming tangled in the fence and ewes were biting at the strands, and at times sheep were able to escape over or beneath the fence prior to it being energized. However, once inside and the charger turned on the sheep appeared unaffected by the fence and did not attempt to get out. Durability of the System When properly constructed, the portable fence system consistently pulsed at 9 to 10 thousand volts. There was minimal fraying in the ElectronetTM and some of the Fiberglass tabs on the posts were broken during summer 2000. Overall, the system handled rainy, windy, and snowy conditions well. Portions of the fence were pulled to

125
the ground by bears on 2 occasions, but still pulsed at 4 to 5 thousand volts and continued to repel animals from entering despite being partially grounded. ADMB Funds Allocation Expenditure to date: $2925.55 in materials (out of $3300.00 grant) Department manpower in conjunction with damage control field work. Time line for remaining revenues: Replace and/or repair any necessary materials (batteries, wires, posts) winter 2000-2001.
CONCLUSIONS The electric fence system is very effective in deterring bears and possibly other predators. Applications of the system are very diverse including preventing occasional damage that occurs in or around grain sheds, beehives, fruit orchards, and small livestock pastures, or pens in front-country situations. Applications are much more limited in remote areas such as domestic sheep bed-grounds. It would require substantial manpower to set up, maintain, and dismantle the system as frequently as necessary to utilize multiple bed-grounds throughout the season. Additionally, the solar panel may be difficult to transport via horseback, however, it would likely be effective in situations when a sheep band is currently experiencing substantial depredation on a regular basis and temporary protection was a priority. We have yet to determine the long-term durability of the system. Repeated use of the fences has already shown some fraying of the material, but so far it still appears to be functioning exceptionally well. Replacement costs every 3-4 years might be acceptable in relation to damage liability to agencies. Additionally, benefits to preserving wildlife may far outweigh those costs. The system has some limitations when utilized in uneven or rocky terrain. The fences usually pulse at about 9500 to 11000 Volts which appears adequate to deter most predators in most situations.
SYNOPSIS Since many predators are sympatric with livestock over much of Wyoming, and the distribution of those protected carnivores (i.e. wolves and grizzly bears) is expanding, the need for non-lethal methods of predator control is crucial. Livestock producers, environmental organizations, the public, and wildlife managers are determined to reduce damage caused by wildlife while at the same time, maintaining healthy and well distributed wildlife populations. Portable electric fencing has widespread application for non-lethal control. Portable electric fence systems could potentially be implemented to reduce damage to haystacks and small crop fields by wild ungulates. Monies used toward electric fencing projects would be an investment in the future of multiple land use and wildlife coexistence. The more tools that managers have at their disposal to promote coexistence, the less damage will be incurred and the more wildlife species will be tolerated.

126
LITERATURE CITED
Green, J., and R. Woodruff. 1989. Livestock-guarding dogs reduce depredation by
bears. Pages 49-54 in Bear-people conflicts: proceedings of a symposium on management strategies. Northwest Territories Department of Renewable Resources. Yellowknife, Canada.
Madel, M. J. 1996. Rocky Mountain Front Grizzly Bear Management Program.
Montana Department of Fish, Wildlife and Parks, Helena. 80 pp.