yield increases with lo-solids cooking - tappi · lo-solids cooking is a family of cooking...
TRANSCRIPT

Yield Increases with Lo-Solids® Cooking
Bertil StrombergAndritz Inc.

Lo-Solids cooking is a family of cooking technology usingdifferent flow-sheet arrangements depending on the individualdigester.
It is currently used in about 60 SW and HW digesters.
In 14 of the HW digesters, significant yield increases have beenconfirmed.
Lo-Solids HW digesters using AQ have realized higher thanexpected yield increases.
Introduction

• Yield Increases Experienced in 14 Hardwood Lo-Solids Digesters
• Yield Determination• Cellulose and Hemi
• Operating Conditions
• Lab Supporting Evidence
• AQ
Presentation Outline
• Yield Increases Experienced in 14 Hardwood Lo-Solids Digesters
• Yield Determination• Cellulose and Hemi
• Operating Conditions
• Lab Supporting Evidence
• AQ
Presentation Outline

Mill Yield Increase Method of Determination
A 4 % Wood Consumption Decrease (4 years) M-P Equation (4 studies)
B 4 % Wood Consumption Decrease ( 3 years)
C 2 % M-P Equation (3 studies)
D 1 % M-P Equation (2 studies)
E 2 - 3 % Black Liquor SolidsM-P Equation (2 studies)
F 1.6 % Wood Consumption Decrease ( 2 years)
Hardwood Yield IncreaseMeasured Mill Data, Lo-Solids® Cooking
G 1 - 2 % M-P Equation
Wood
Mixed So. US
Mixed No. US
Mixed So. US
Euca. So. America
Mixed Ea. Canada
Mixed So. US
Birch Finland

2.4 % M-P EquationProduction Data
1.5 % Pulp Composition Data
1.5 % Wood Consumption Data (2 years)
3 % M-P EquationWood Consumption Data (2 years)
2 - 3 % Short term trials
2 - 3 % Wood Consumption data (3 years)
1.5 – 2.5 % Black Liquor Solids
Hardwood Yield IncreaseMeasured Mill Data, Lo-Solids® Cooking
Mill Yield Increase Method of DeterminationWood
Birch Finland
Mixed Japan
Euca. So. America
Euca. Spain
Mixed Japan
Mixed So. USH
I
J
K
L
M
N
Mixed No. US

• Yield Increases Experienced in 14 Hardwood Lo-Solids Digesters
• Yield Determination• Cellulose and Hemi
• Operating Conditions
• Lab Supporting Evidence
• AQ
Presentation Outline

• Wood Consumption
• Black Liquor Solids
• Recovery Boiler Steam Generation
• Pulp Composition
Yield Determination Methods

Lignin Free TotalKappa Yield Glucan Xylan Galactan Mannan Hemi , %
14.7 54.3% 43.2 9.3 0.19 0.09 18.1
13.2 52.8% 42.9 9.2 0.09 0.11 18.014.6 54.0% 43.0 9.5 0.13 0.11 18.5
14.8 54.8% 43.4 9.4 0.20 0.09 18.2
Lower Yield ? Lower Hemi Fraction in Pulp
Yield loss can not be measured by carbohydrate testing only.
Differences in total yield are to a large part due to differences in cellulose yield.This observation is different than what is reported for softwoods.
Lab Pulping of Eucalyptus with Different Alkali Profiles
Yield Determination by Pulp Composition

45
46
47
48
49
50
51
52
0.25 0.27 0.29 0.31 0.33 0.35
17 - 23% EAon wood
17% EA w/AQ
Hemi Fraction in Pulp
Lign
in F
ree
Yiel
d, %
on
BD
Woo
dYield Determination by Pulp Composition

45
46
47
48
49
50
51
52
10 12 14 16 18 20
Kappa
Lign
in F
ree
Yiel
d,
% o
n B
D w
ood
23 % EA
21 % EA
17 % EA
17% EA w/AQ
Alkali Charge
M-P Calibration Curve Example, HWYield Determination by Pulp Composition

4546474849505152
2.5 2.7 2.9 3.1 3.3 3.5 3.7 3.9 4.1
Log (V)/(G'2)
Lign
in F
ree
Yiel
d,
% o
n B
D w
ood
17 - 23% EA
17% EA w/AQ
Alkali Chargey = 3.6528x + 36.382R2 = 0.9544
M-P Calibration Curve Example, HWYield Determination by Pulp Composition

4546474849505152
2.5 2.7 2.9 3.1 3.3 3.5 3.7 3.9 4.1
Log (V)/(G'2)
Lign
in F
ree
Yiel
d,
% o
n B
D w
ood
Mill Pulp
Lab Pulps
M-P Calibration Curve Example, HWYield Determination by Pulp Composition

44
46
48
50
52
54
56
2 2.5 3 3.5 4 4.5 5
log(V)/(G')2
Lign
in-F
ree
Yiel
d,
% o
n w
ood
S.USS.USS.USS.USS.USN.USN.USN.USN.USN.USEuc.Euc.BirchJap.
y=3.6x
M-P Calibration CurvesFor Different Hardwoods

• Yield Increases Experienced in 14 Hardwood Lo-Solids Digesters
• Yield Determination• Cellulose and Hemi
• Operating Conditions
• Lab Supporting Evidence
• AQ
Presentation Outline

Mill Yield Increase Method of Determination
A 4 % Wood Consumption Decrease (4 years) M-P Equation (4 studies)
B 4 % Wood Consumption Decrease ( 3 years)
C 2 % M-P Equation (3 studies)
D 1 % M-P Equation (2 studies)
E 2 - 3 % Liquor Solids (Mill data) M-P Equation(2 studies)
F 1.6 % Wood Consumption Decrease ( 6 mo. ave)
Hardwood Yield IncreaseMeasured Mill Data, Lo-Solids® Cooking
G 1 - 2 % M-P Equation
Wood
Mixed So. US
Mixed No. US
Mixed So. US
Euca. So. America
Mixed Ea. Canada
Mixed So. US
Birch Finland

9092949698
100102
92 93 94 95 96 97 98
Fiscal Year
Rela
tive
Woo
d Us
age
(% R
elat
ive
to 1
992)
Conv. Cook1-v. steam EMCC
1-v. hyd.
Lo-SolidsCooking
Mill “A” Wood Usage

Mill Yield Increase Method of Determination
A 4 % Wood Consumption Decrease (4 years) M-P Equation (4 studies)
B 4 % Wood Consumption Decrease ( 3 years)
C 2 % M-P Equation (3 studies)
D 1 % M-P Equation (2 studies)
E 2 - 3 % Liquor Solids (Mill data) M-P Equation(2 studies)
F 1.6 % Wood Consumption Decrease ( 6 mo. ave)
Hardwood Yield IncreaseMeasured Mill Data, Lo-Solids® Cooking
G 1 - 2 % M-P Equation
Wood
Mixed So. US
Mixed No. US
Mixed So. US
Euca. So. America
Mixed Ea. Canada
Mixed So. US
Birch Finland

45
46
47
48
49
50
51
52
10 12 14 16 18 20Kappa
Lign
in F
ree
Yiel
d, %
on
BD
woo
d
Unbl. Mill Pulps
Unbl. Lab Pulps
Mill “A” Pulp YieldM-P Equation

Mill Yield Increase Method of Determination
A 4 % Wood Consumption Decrease (4 years) M-P Equation (4 studies)
B 4 % Wood Consumption Decrease ( 3 years)
C 2 % M-P Equation (3 studies)
D 1 % M-P Equation (2 studies)
E 2 - 3 % Liquor Solids (Mill data) M-P Equation(2 studies)
F 1.6 % Wood Consumption Decrease ( 6 mo. ave)
Hardwood Yield IncreaseMeasured Mill Data, Lo-Solids® Cooking
G 1 - 2 % M-P Equation
Wood
Mixed So. US
Mixed No. US
Mixed So. US
Euca. So. America
Mixed Ea. Canada
Mixed So. US
Birch Finland

80
90
100
110
-8 -7 -6 -5 -4 -3 -2 -1 0 1 2 3 4 5 6 7 8
W eek (p rio r to an d fo llo w in g tran sitio n)
Relative W
ood U
sage (%)
E M C C
L o-S olids
Mill “B” Wood Usage
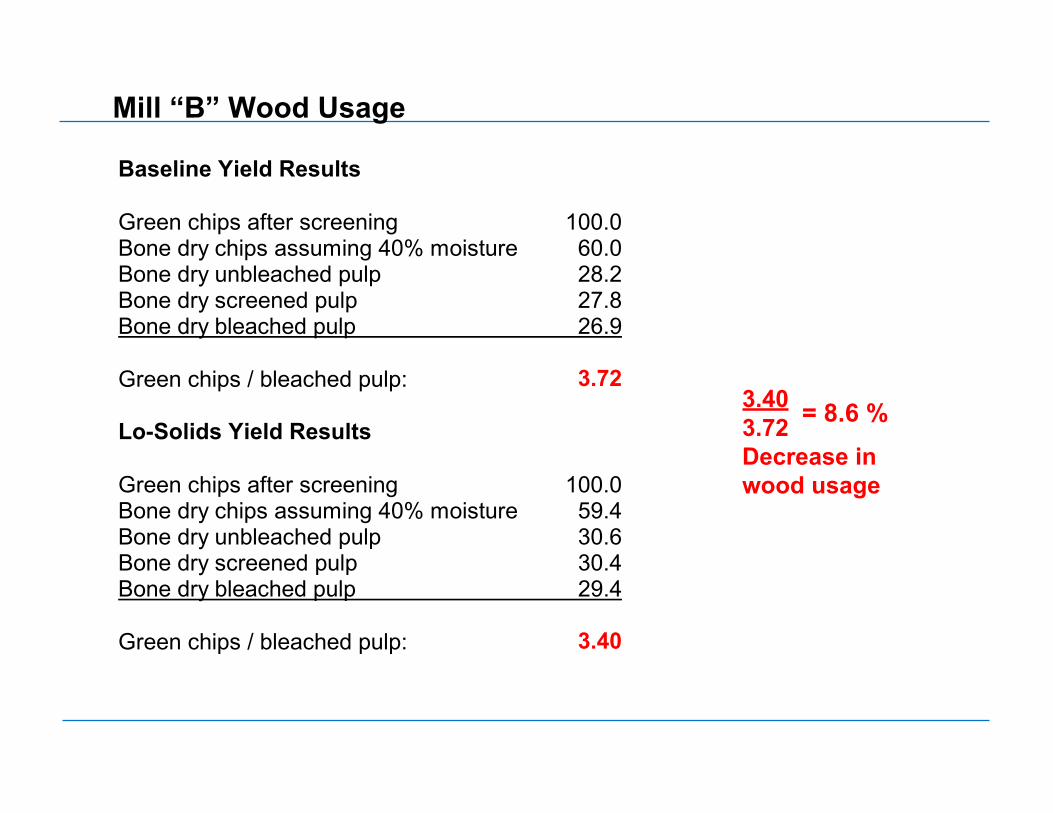
Baseline Yield Results Green chips after screening 100.0 Bone dry chips assuming 40% moisture 60.0 Bone dry unbleached pulp 28.2 Bone dry screened pulp 27.8 Bone dry bleached pulp 26.9 Green chips / bleached pulp: 3.72 Lo-Solids Yield Results Green chips after screening 100.0 Bone dry chips assuming 40% moisture 59.4 Bone dry unbleached pulp 30.6 Bone dry screened pulp 30.4 Bone dry bleached pulp 29.4 Green chips / bleached pulp: 3.40
Mill “B” Wood Usage
3.40 = 8.6 % 3.72 Decrease inwood usage

Hardwood Yield IncreaseMeasured Mill Data, Lo-Solids® Cooking
Mill Yield Increase Method of Determination
A 4 - 5 % Wood Consumption Decrease (4 years) M-P Equation (4 studies)
B 4 - 5 % Wood Consumption Decrease ( 3 years)
C 2 % M-P Equation (3 studies)
D 1 % M-P Equation (2 studies)
E 2 - 3 % Liquor Solids (Mill data) M-P Equation(2 studies)
F 1.6 % Wood Consumption Decrease ( 6 mo. ave)
G 1 - 2 % M-P Equation

Batch Lo-Solids Lo-Solids Mill Pulps Feb. 1997 Sept. 1997 (average) (average) (average)
Kappa 15.8 13.3 13.0 Log(V)/(G’)2 3.28 3.48 3.47 Lignin-Free Yield (Y’) 49.0† 49.9† 49.9†
Mill “C” Pulp YieldM-P Equation

Mill Yield Increase Method of Determination
A 4 % Wood Consumption Decrease (4 years) M-P Equation (4 studies)
B 4 % Wood Consumption Decrease ( 3 years)
C 2 % M-P Equation (3 studies)
D 1 % M-P Equation (2 studies)
E 2 - 3 % Liquor Solids (Mill data) M-P Equation(2 studies)
F 1.6 % Wood Consumption Decrease ( 6 mo. ave)
Hardwood Yield IncreaseMeasured Mill Data, Lo-Solids® Cooking
G 1 - 2 % M-P Equation
Wood
Mixed So. US
Mixed No. US
Mixed So. US
Euca. So. America
Mixed Ea. Canada
Mixed So. US
Birch Finland

EMCC Lo-Solids Mill Pulps Mill Pulps Avg Avg Kappa 10.2 10.6 Log(V)/(G’)2 3.36 3.58 Lignin-Free Yield (Y’) 49.4† 50.2†
Mill “D” Pulp YieldM-P Equation

Mill Yield Increase Method of Determination
A 4 % Wood Consumption Decrease (4 years) M-P Equation (4 studies)
B 4 % Wood Consumption Decrease ( 3 years)
C 2 % M-P Equation (3 studies)
D 1 % M-P Equation (2 studies)
E 2 - 3 % Liquor Solids (Mill data) M-P Equation(2 studies)
F 1.6 % Wood Consumption Decrease ( 6 mo. ave)
Hardwood Yield IncreaseMeasured Mill Data, Lo-Solids® Cooking
G 1 - 2 % M-P Equation
Wood
Mixed So. US
Mixed No. US
Mixed So. US
Euca. So. America
Mixed Ea. Canada
Mixed So. US
Birch Finland

49
50
51
52
53
54
55
56
10 12 14 16 18 20Kappa
Lign
in F
ree
Yiel
d, %
on
BD
woo
d
Unbl. Mill Pulp
Unbl. Lab Pulps
Mill “E” Pulp YieldM-P Equation

Mill Yield Increase Method of Determination
A 4 % Wood Consumption Decrease (4 years) M-P Equation (4 studies)
B 4 % Wood Consumption Decrease ( 3 years)
C 2 % M-P Equation (3 studies)
D 1 % M-P Equation (2 studies)
E 2 - 3 % Black Liquor SolidsM-P Equation (2 studies)
F 1.6 % Wood Consumption Decrease ( 2 years)
Hardwood Yield IncreaseMeasured Mill Data, Lo-Solids® Cooking
G 1 - 2 % M-P Equation
Wood
Mixed So. US
Mixed No. US
Mixed So. US
Euca. So. America
Mixed Ea. Canada
Mixed So. US
Birch Finland

2.4 % M-P EquationProduction Data
1.5 % Pulp Composition Data
1.5 % Wood Consumption Data (2 years)
3 % M-P EquationWood Consumption Data (2 years)
2 - 3 % Short term trials
2 - 3 % Wood Consumption data (3 years)
1.5 – 2.5 % Black Liquor Solids
Hardwood Yield IncreaseMeasured Mill Data, Lo-Solids® Cooking
Mill Yield Increase Method of DeterminationWood
Birch Finland
Mixed Japan
Euca. So. America
Euca. Spain
Mixed Japan
Mixed So. USH
I
J
K
L
M
N
Mixed No. US

• Yield Increases Experienced in 14 Hardwood Lo-Solids Digesters
• Yield Determination• Cellulose and Hemi
• Operating Conditions
• Lab Supporting Evidence
• AQ
Presentation Outline

14 digesters operating on hardwood report higher pulp yield
All use post-impregnation extraction
Operating Conditions

Lo-Solids DigesterPost-Impregnation Extraction
Impregnation Zone
To Recovery

Lo-Solids Cooking:
100 120 140 160
Conv
Temperature, °C
Lo-Solids
0 10 20 30
Conv
Alkali Conc, EA NaOH g/l
Lo-Solids
• Yield Increases Experienced in 14 Hardwood Lo-Solids Digesters
• Yield Determination• Cellulose and Hemi
• Operating Conditions
• Lab Supporting Evidence
• AQ
Presentation Outline
0
5
10
15
20
25
0 50 100 150 200 250 300 350Time, minutes
EA, g/l (NaOH)
0
20
40
60
80
100
120
140
160
180Temp, C
BC
Alkali Profile
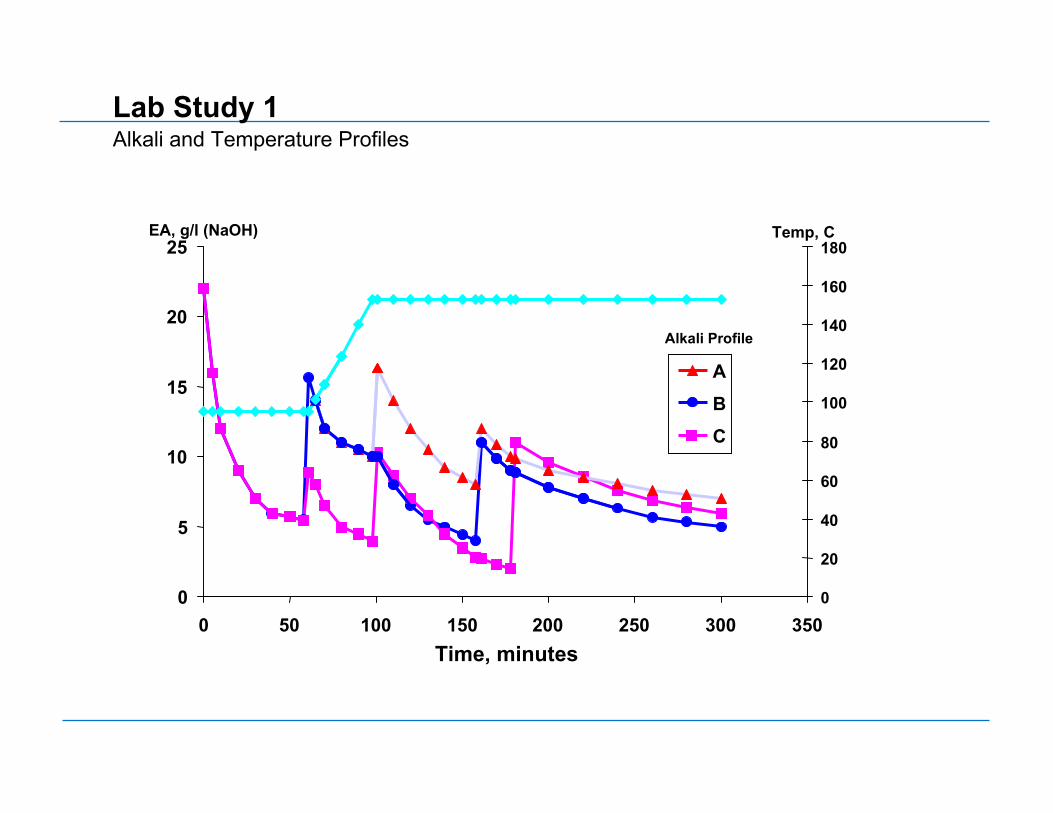
Lab Study 1Alkali and Temperature Profiles
A

48
50
52
54
56
58
10 15 20 25 30 35Kappa Number
Tota
l Yie
ld, %
on
BD
woo
d
C
B
A
Alkali Profile
153 ºC
Lab Study 1Effect of Alkali Profile on Yield

0
5
10
15
20
25
0 50 100 150 200 250 300 350Time, minutes
EA, g/l (NaOH)
0
20
40
60
80
100
120
140
160
180Temp, CB
C
Alkali Profile
Lab Study 1Alkali and Temperature Profiles
A
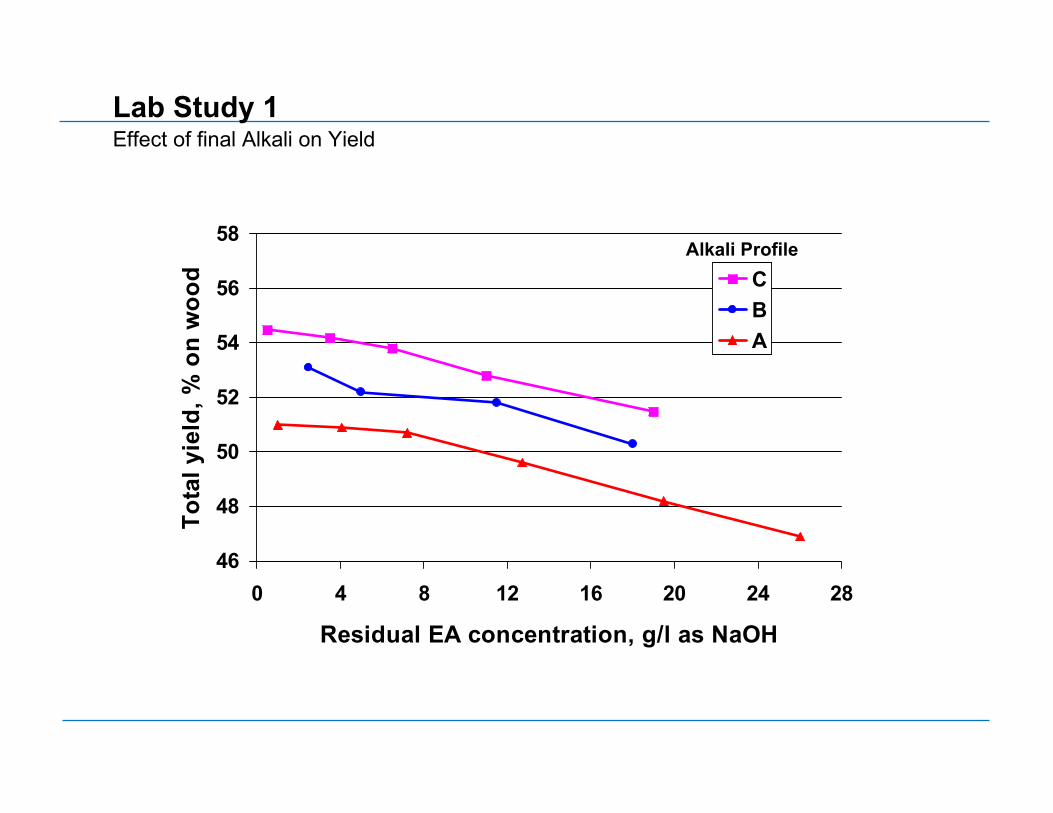
46
48
50
52
54
56
58
0 4 8 12 16 20 24 28
Residual EA concentration, g/l as NaOH
Tota
l yie
ld, %
on
woo
d CBA
Alkali Profile
Lab Study 1Effect of final Alkali on Yield

0
5
10
15
20
25
0 50 100 150 200 250 300 350Time, minutes
EA, g/l (NaOH)
0
20
40
60
80
100
120
140
160
180Temp, C
Temp 1Temp 2
Lab Study 1Alkali and Temperature Profiles

48
50
52
54
56
58
10 15 20 25 30 35
Final Kappa Number
Tota
l Yie
ld,
% o
n B
D w
ood
153 C
165 C
Cook 2 Temp
Alkali Profile C
Lab Study 1Effect of Temperature on Yield

0.0
5.0
10.0
15.0
20.0
25.0
30.0
35.0
40.0
45.0
0 50 100 150 200 250 300 350
T im e, m inutes
EA conc, g/l NaO
H
0
20
40
60
80
100
120
140
160
180
Temperature
, C
C K
Low E A
H igh E A
Tem p.
Lab Study 2Hardwood Alkali Profile Study

54.0
37.5
13.7
36.1
13.6
35.9
12.3
52.050.3
0
10
20
30
40
50
60
Total Yield, % C ellulose yield, % X ylan yield, %
Yield, %
, correc
ted to
kap
pa 17
Low E A kappa 17.1
C K kappa 18.1
H igh E A kappa 16.6
Lab Study 2Yields, brownstock

0
5
10
15
20
25
30
0 50 100 150 200 250 300 350Time, minutes
Xyla
n an
d EA
, g/l
0
20
40
60
80
100
120
140
160
Tem
pera
ture
, C
XylanEATemp.
Lab Study 2Dissolved xylan profiles,CK

0
5
10
15
20
25
30
0 50 100 150 200 250 300 350Time, minutes
Xyla
n an
d EA
, g/l
0
20
40
60
80
100
120
140
160
Tem
pera
ture
, C
XylanEATemp.
Lab Study 2Dissolved xylan profiles,High EA

0
5
10
15
20
25
30
0 50 100 150 200 250 300 350
T im e, m inutes
Xylan
and EA, g
/l
0
20
40
60
80
100
120
140
160
Temperature, C
X ylan
E A
Tem p.
Lab Study 2Dissolved xylan profiles,Low EA

02468
101214161820
0 50 100 150 200 250 300 350Time, minutes
Xyla
n, g
/l
CKLow EAHigh EA
Lab Study 2Dissolved xylan profiles

• Yield Increases Experienced in 14 Hardwood Lo-Solids Digesters
• Yield Determination• Cellulose and Hemi
• Operating Conditions
• Lab Supporting Evidence
• AQ
Presentation Outline

110 °C147 °C
144 °C157 °C
156 °C
143 °C
13m3/t
5m3/t
DF 1.5 m3/t
WHITELIQUOR
3m3/t
6m3/t
Chips + 8 % AA (NaOH)
9 % AA
1.5 %AA
Mill “M”Data for Lo-Solids + Lo-Level operation
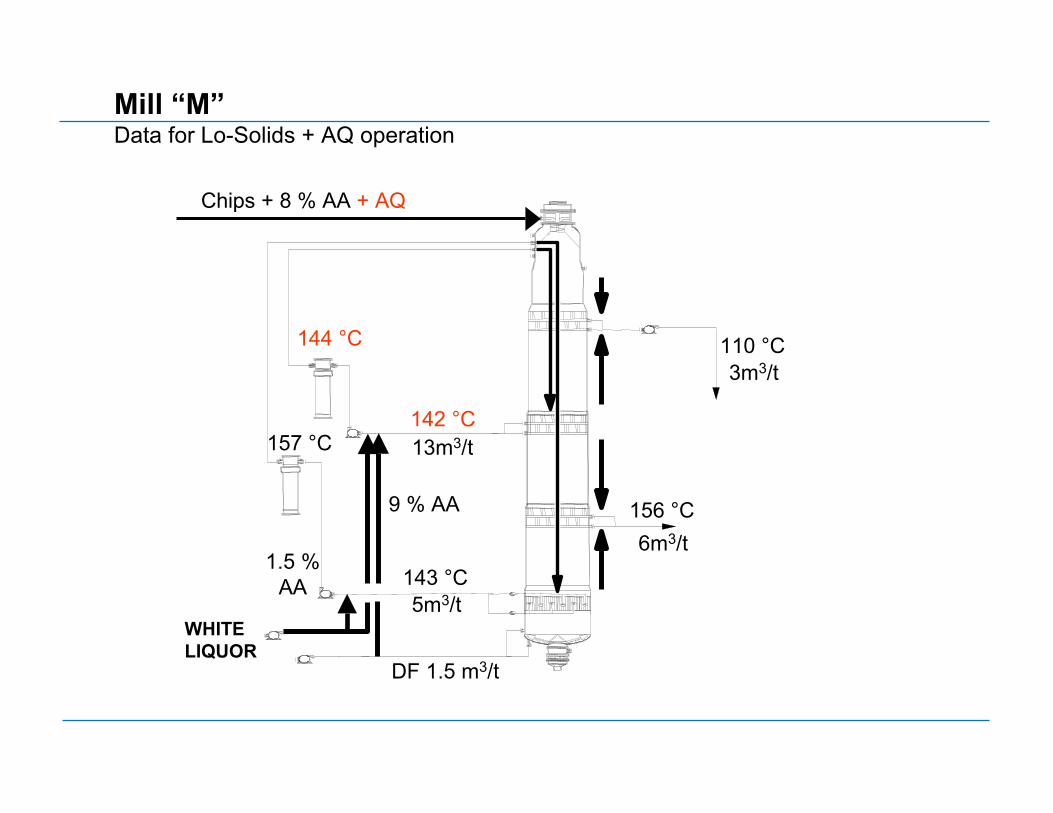
110 °C144 °C
142 °C157 °C
156 °C
143 °C
13m3/t
5m3/t
DF 1.5 m3/t
WHITELIQUOR
3m3/t
6m3/t
Chips + 8 % AA + AQ
9 % AA
1.5 %AA
Mill “M”Data for Lo-Solids + AQ operation

Yield Increase 0 % with AQ
Cooking Temperature Decrease
No
Cook Type Conventional Lo-Solids + Lo-Level
Mill “M”Effects of AQ Addition
+ 2 %, no AQ
+ 4 % with AQ
Yes
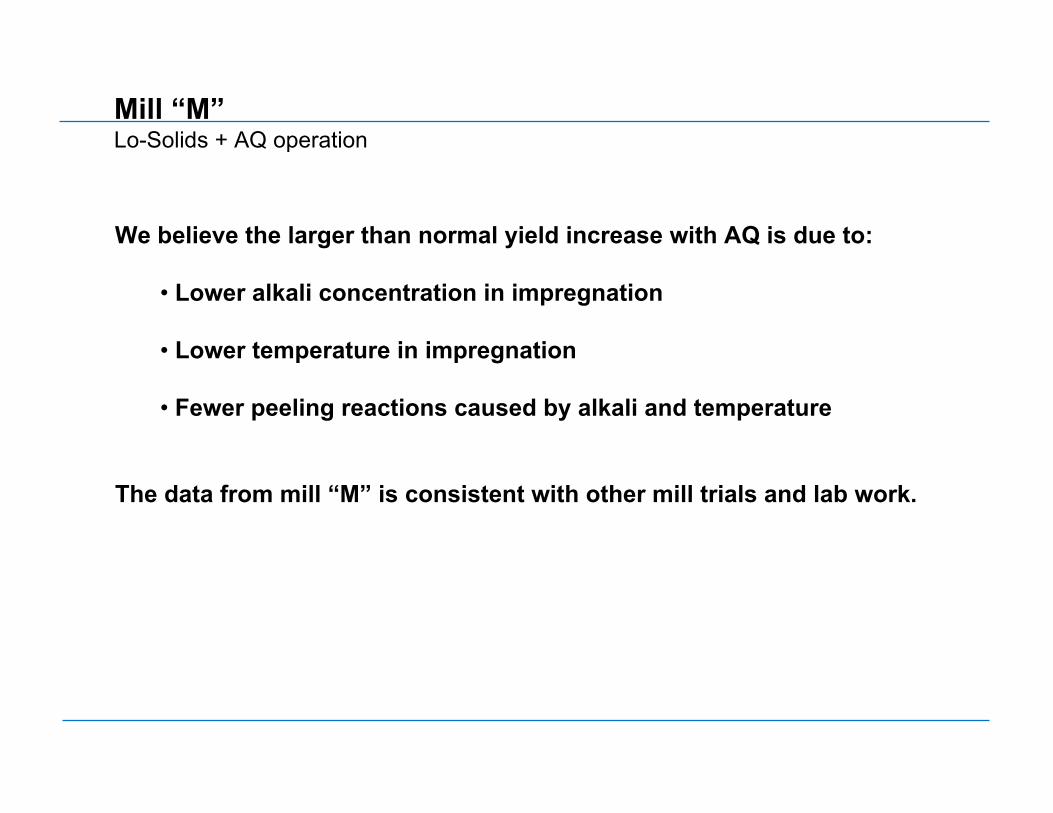
We believe the larger than normal yield increase with AQ is due to:
• Lower alkali concentration in impregnation
• Lower temperature in impregnation
• Fewer peeling reactions caused by alkali and temperature
The data from mill “M” is consistent with other mill trials and lab work.
Mill “M”Lo-Solids + AQ operation

Lo-Solids cooking has given a yield increase of 1- 4 % in 14hardwood digesters
In addition digester capacity, bleachability and pulp qualityimprove.
All these digesters have post-impregnation extraction and lowalkali concentration in all cook zones
AQ in combination with Lo-Solids cooking give larger than expectedyield improvements.
Conclusions