yinka dene guide to surface water quality standards (v. 4 ... dene 'uzah'ne guide...
TRANSCRIPT
- 1 -
- 1 -
Yinka Dene ‘Uza’hné Guide to Surface Water
Quality Standards
Version 4.1 March 18, 2016
- i -
CONTENTS
1. INTRODUCTION TO THE YINKA DENE ‘UZA’HNÉ GUIDE TO SURFACE WATER QUALITY STANDARDS ............................................................................................................................... 1
2. NUMERICAL WATER QUALITY STANDARDS ............................................................................. 1
(a) Derivation of WQS for Class I Waters: High Cultural or Ecological Significance Waters ........................................................................................................................... 2
(b) Derivation of WQS for Class II Waters: Sensitive Waters ............................................. 3 (c) Derivation of WQS for Class III Waters: Typical Waters ............................................... 4
3. PROCEDURES FOR DERIVING SITE-SPECIFIC WATER QUALITY STANDARDS ........................... 5
4. GUIDANCE FOR YINKA DENE ‘UZA’HNÉ SURFACE WATER MANAGEMENT POLICY ............... 6
(a) Guidelines for Characterising Baseline Water Quality Conditions ............................... 7 (b) General Objectives for Effluent Discharges to Receiving Waters ................................. 8 (c) Guidelines for Establishing and Regulating Initial Dilution Zones ................................ 9
(i) For lakes, IDZs should have a maximum radius of 100 m or 25% of the width of the lake, whichever is smaller. In addition, IDZs should not exceed 10% of the available lake volume and not extend closer to shore than the mean low water mark, and .............................................................. 10
(ii) For streams and rivers, IDZs should not exceed (a) the lesser of the maximum width, perpendicular to the path of the stream, or 100 m, or 25% of the width of the stream, and (b) the maximum length, parallel to the path of the stream, of a point 100 m upstream of the discharge and a point downstream, which is the lesser of 100 m or the distance at which the width of the effluent plume equals the maximum allowable width of the mixing zone; ............................................................................... 10
(d) Methods for Deriving Effluent Quality Criteria ........................................................... 11 (e) Guidelines for Aquatic Effects Monitoring ................................................................. 11
5. CONSIDERATIONS FOR IMPLEMENTING WATER QUALITY STANDARDS .............................. 13
(a) Documenting the Development of WQS .................................................................... 13 (b) Monitoring for Attainment of Narrative WQS ............................................................ 14 (c) Monitoring for Compliance with Numerical WQS ...................................................... 15
6. SUMMARY AND CONCLUSIONS ............................................................................................. 17
7. REFERENCES CITED .................................................................................................................. 17

- ii -
LIST OF ACRONYMS
AEMP = Aquatic Effects Monitoring Program AMP = adaptive management plan B.C. = British Columbia CIP = continuous improvement plan COPC = chemical of potential concern CSM = conceptual site model EEMP = Environmental Effects Monitoring Program EQC = effluent quality criteria ha = hectare IDZ = initial dilution zone RCP = Reclamation and Closure Plan SBEB = science-based environmental benchmark SNP = surveillance network program SSWQO = site-specific water quality objective SSWQS = site-specific water quality standard WQS = water quality standard WMP = Water Management Plan

- 1 -
1. INTRODUCTION TO THE YINKA DENE ‘UZA’HNÉ GUIDE TO SURFACE WATER QUALITY STANDARDS
As provided for in Section 2 of the Yinka Dene ‘Uza’hné Surface Water Management Policy, the policy has three distinct technical elements:
• Narrative water management objectives;
• Water classification system; and
• Numerical WQSs.
The first two elements are described within the Yinka Dene ‘Uza’hné Surface Water Management Policy. With respect to numerical WQSs, this Yinka Dene ‘Uza’hné Guide to Surface Water Quality Standards is intended to support implementation of the Yinka Dene ‘Uza’hné Surface Water Management Policy by:
• Describing the process for establishing numerical water quality standards (WQSs) for each class of water;
• Describing procedures for deriving site-specific WQSs;
• Providing guidance for implementing the Yinka Dene ‘Uza’hné Surface Water Management Policy; and
• Articulating expectations related to the implementation of WQSs.
2. NUMERICAL WATER QUALITY STANDARDS
A step-wise process has been developed for establishing WQSs for surface waters located within our Territories. More specifically, the WQS establishment process involves the following steps:
• Classify the surface water system relative to the level of protection that needs to be provided. Surface water bodies that support unique cultural uses, support species-at-risk, provide unique habitats, or support unique species assemblages shall be classified as Class I - Waters of High Cultural or Ecological Significance. Waters that support sensitive taxa or species of concern and/or important traditional resource uses shall be classified as Class II - Sensitive Waters. All other surface water bodies shall be classified as Class III - Typical Waters;
• Evaluate existing and potential land and water uses to support identification of chemicals of potential concern (COPCs; MacDonald et al. 2009; Clark et al. 2010 for guidance on evaluating water quality issues and concerns); and
• Develop numerical WQSs for COPCs using procedures that are appropriate for the water body under consideration. Class I - Waters of High Cultural or Ecological Significance should not be degraded by land or water use activities (i.e., should not

- 2 -
be substantially altered in terms of quality or quantity). For these water bodies, WQSs shall be developed by applying the non-degradation strategy (i.e., using the background concentration procedure; BCP). Class II - Sensitive Waters should be afforded an enhanced level of protection by establishing WQSs that allocate no more than 50% of the assimilative capacity of receiving waters. Class III - Typical Waters should be managed to protect the designated uses of the aquatic ecosystem. For these water bodies, WQSs shall be developed by applying the use-protection strategy.
The procedures that may be used to establish numerical WQSs using the three water management strategies are described in the following sections of this document. It is important to note that these procedures are focussed on the derivation of numerical WQSs for water chemistry. In addition, WQSs may be required for other environmental attributes including:
• Surface water toxicity;
• Sediment chemistry;
• Sediment toxicity;
• Invertebrate-tissue chemistry;
• Fish-tissue chemistry;
• Bird-tissue chemistry; and/or
• Mammal-tissue chemistry.
The need for such additional WQSs will depend on the nature of the activities that are being conducted within the watershed, the types of COPCs that may be released into the environment and the fate of the COPCs that are released from each contaminant source. The methods for developing effluent quality criteria (EQC) based on WQSs as well as guidance on the establishment of initial dilution zones (IDZs), are provided in Sections 4(b) through 4(d).
(a) Derivation of WQS for Class I Waters: High Cultural or Ecological Significance Waters
Using the non-degradation strategy, numerical WQSs are established to avoid degradation of baseline water quality conditions (i.e., using the BCP). The BCP provides a basis for deriving numerical WQSs that can be applied to maintain background conditions or restore water quality to pre-development conditions. In this procedure, the natural background concentrations of COPCs at a site are determined and used to define the acceptable water quality conditions for the area (MacDonald 1997). Natural background concentrations are those concentrations that have not been significantly altered by local human activities (although water quality conditions may be altered somewhat by regional or global activities). Whenever possible, water quality data collected prior to development are used to determine background conditions within a watershed. When such data are not available, water quality data collected at stations located upstream of human

- 3 -
activities within the watershed or at appropriately-selected reference sites must be used to establish background conditions (BCMOE 2013a).
Numerical WQSs can be established in a number of ways using the BCP. However, all of these methods are based on first determining background water quality conditions within the water body under consideration and then defining WQSs that reflect temporal variability in background water quality conditions. Because the concentrations of many water quality variables can exhibit substantial daily, seasonal, and/or annual variability, WQSs can be established at the upper limit of background concentrations (e.g., the 95th percentile of the data). However, this approach results in WQSs that are strongly biased towards conditions that occur within the receiving water during only a portion of the year (e.g., during turbid flow conditions). For this reason, it is essential to determine background conditions for relevant time periods (e.g., based on months, seasons, flow periods) by normalizing to water quality conditions (i.e., turbidity levels) and/or forms of the COPC (e.g., concentrations of dissolved metals are typically less variable than total metals). Once background conditions have been defined using appropriate statistical methods (i.e., by calculating the 95% upper prediction limit of the mean for long-term average WQS and the 95th percentile for the maximum WQS), the numerical WQSs can be established at background levels or at a level that is slightly (e.g., 10%) above background levels (MacDonald 1997; CCME 2003). WQSs are typically expressed in terms of a monthly mean and maximum concentration for each COPC.
For Class I Waters - Waters of High Cultural and Ecological Significance, numerical WQSs need to be established using the non-degradation approach. Table 1 provides a listing of the water quality stations that were used to estimate background water quality conditions within our Territories (i.e., using water quality data for the Endako River, Francois Lake, and the Stellako River) and reference water quality conditions (i.e., using water quality data for the Babine River). Table 2 summarizes the background water quality conditions, while Table 3 summarizes reference water quality conditions in the Babine River. These data provide a basis for establishing preliminary WQSs for Class I - Waters of High Cultural or Ecological Significance within our Territories.
(b) Derivation of WQS for Class II Waters: Sensitive Waters
For Class II - Sensitive Waters, the water management objectives are to provide an enhanced level of protection for aquatic organisms, minimize the degradation of receiving waters, and protect traditional uses of natural resources. These objectives can be realized by allocating no more than 50% of the assimilative capacity of a water body. Application of this procedure requires determination of background conditions and compilation of numerical water quality guidelines (WQGs) for the most sensitive water use for each COPC. The numerical WQS for each COPC is then determined using the following equation:
WQS = [BKGD] + ([WQG]-[BKGD]) x 0.5
Where [BKGD] is the background concentration of a COPC and WQG is the WQG for the most sensitive water use. Such WQSs will provide ecological receptors with enhanced protection by maintaining COPC concentrations substantially below the WQGs. The above equation provides a basis for calculating WQSs for waters where 50% of the assimilative capacity is allocated to facilitate resource development. The equation can be adjusted to calculate alternative WQSs, as well (e.g.,

- 4 -
40% of assimilative capacity - substitute 0.4 for 0.5 in the equation). For bioaccumulative COPCs, human health needs to be afforded an enhanced level of protection.
(c) Derivation of WQS for Class III Waters: Typical Waters
The use-protection strategy provides a consistent scientific basis for establishing WQSs that accommodate multiple water uses of aquatic ecosystems. Using this strategy, ambient WQSs are established using the following procedure:
• Identify designated water uses;
• Compile numerical WQGs for each water use for each COPC [i.e., B.C. WQGs and Canadian Council of Ministers of the Environment (CCME) WQGs; select the lower of the two values for use in WQS development];
• For each COPC, select the WQG for the most sensitive water use (e.g., aquatic life, wildlife, human health) as the preliminary WQS. Adjust the WQGs to reflect the conditions at the site under consideration (i.e., WQGs may need to be adjusted to reflect site water hardness);
• Compare the preliminary WQS to the upper limit of background concentrations to determine if the WQS is consistently achievable at the station under consideration; and
• Adjust the preliminary WQS, as necessary, to ensure that it is consistently achievable from the perspective of background concentrations by implementing the BCP (note: no adjustment is permissible to address loadings of COPCs from local anthropogenic sources; such adjustments are typically conducted by considering an alternative form of the COPC; e.g., dissolved metals). Procedures for adjusting preliminary WQSs to account for site-specific factors are described in Section 3 of this document.
The water uses that must be protected in surface waters within our Territories include:
• Raw water for drinking water supply;
• Recreation and aesthetics;
• Freshwater aquatic life;
• Wildlife; and
• Agriculture (including irrigation and livestock watering).
A summary of the B.C. WQGs for the protection of aquatic life for selected COPCs is provided in Table 4. Table 5 provides a summary of the CCME WQGs for the protection of aquatic life. Table 6 provides a listing of the preliminary WQSs that have been established for typical surface waters within our Territories. It is important to note that these WQSs do not include tissue-based WQSs or
- 5 -
toxicity-based WQSs. For water quality variables that have WQGs that are dependent on pH, temperature, and/or water hardness, background levels of these toxicity-modifying factors should be used to calculate the WQSs.
3. PROCEDURES FOR DERIVING SITE-SPECIFIC WATER QUALITY STANDARDS
For most surface waters within our Territories, preliminary WQSs can be established using the procedures specified for the class of water under consideration. The WQSs, so derived, apply to surface waters throughout our Territories unless it can be demonstrated that site-specific water quality standards (SSWQSs) are required for certain COPCs to support water management activities. In such cases, SSWQSs may be developed, provided that they are derived using approved procedures (i.e., MacDonald 1997; BCMOE 2013a; MacDonald et al. 2016). Any SSWQSs that are derived for surface waters within our Territories must be reviewed and approved by Nadleh Whut’en and Stellat’en, including the rationale for deriving SSWQSs, work plans, water quality data and information, toxicity testing results, and SSWQSs documentation.
Four procedures have been described for deriving SSWQSs (MacDonald 1997; CCME 2003), including:
• Background concentration procedure (BCP);
• Recalculation procedure;
• Water-effect ratio (WER) procedure; and
• Resident species procedure.
The BCP is described in Section 2(a). The other three procedures are briefly described below. Additional guidance on the application of these procedures is provided in MacDonald (1997), CCME (2003), BCMOE (2013a) and MacDonald et al. (2016).
The recalculation procedure represents one option for deriving SSWQSs. The recalculation procedure is used when there are differences between the taxa (i.e., type of species) present at the site under consideration and the taxa that were included in the aquatic toxicity data set used to calculate the generic WQG for a substance (MacDonald 1997; BCMOE 2013a). This procedure accounts for any differences in sensitivities of taxa present at the site compared to those used to derive the generic WQG. With the recalculation procedure, taxa that are not present (now or historically) at the site or nearby waters are eliminated from the toxicological data set that was used to calculate the generic WQG (MacDonald 1997; BCMOE 2013a). In addition, taxa not reflected in the database that occur at the site are added to the data set, provided the necessary toxicity data are available. Then, a SSWQS is calculated using the remaining data in the same way that the generic WQG was calculated, provided that the minimum data requirements for deriving the WQG are still met. If they are not, additional toxicity testing on resident species in laboratory water must be performed to generate enough data to calculate a SSWQS (MacDonald 1997; BCMOE 2013al MacDonald et al. 2016).
- 6 -
The second option for deriving SSWQSs is the WER procedure. This procedure provides a robust method for modifying generic WQGs to account for unique characteristics at the site in question. The premise of the WER procedure is that physical and/or chemical characteristics of water can differ among sites and may affect the bioavailability and, hence, toxicity of environmental contaminants (MacDonald 1997; CCME 2003; BCMOE 2013a). For example, increased water hardness is known to decrease the acute toxicity of certain metals (e.g., cadmium, copper, lead, nickel, and zinc) to fish (CCREM 1987; Nagpal 1999). Similarly, the toxicity of ammonia to fish is affected by pH and temperature (MacDonald et al. 1987). These factors are accounted for in the derivation of generic WQGs. However, there may be other factors (e.g., dissolved organic carbon, suspended particulate matter) at a site that could affect the bioavailability of the COPC under investigation. These factors are typically not accounted for in the derivation of the generic WQGs. The WER procedure provides a science-based method for accounting for such factors, thereby deriving SSWQSs that are specific to site conditions (MacDonald 1997; BCMOE 2013a).
To develop a WER, acute and/or short-term chronic (i.e., to evaluate sub lethal effects) toxicity tests are conducted with indicator and/or resident species using both site water and laboratory water. Indicator species are non-resident species that are known to be acceptable surrogates for resident species (MacDonald 1997; BCMOE 2013a). Rainbow trout (Oncorhynchus mykiss), fathead minnow (Pimephales promelas), the water flea Ceriodaphnia dubia, and the alga Selenastrum capricornutum (now known as Pseudokirchneriella subcapitata) are commonly used as indicator species because they are widely available, easy to culture, and consistently provide reliable results (Willingham 1988; MacDonald et al. 1989). In addition, these species are representative of those that are frequently present in waters within B.C. (MacDonald 1997; CCME 2003; MacDonald et al. 2016). The results of these toxicity tests are used to calculate the ratio of the toxicity of the COPC in site water to its toxicity in laboratory water (that is, the WER; MacDonald 1997; BCMOE 2013a). Toxicity data on at least one fish and one invertebrate species are needed to calculate the geometric mean WER, which is then applied to the generic WQG to convert it to a SSWQS (USEPA 1994). For example, if a COPC is half as toxic in site water as it is in laboratory water, the generic WQG would be multiplied by a WER of two to obtain the SSWQS (BCMOE 2013a).
The final approach for calculating SSWQSs is the resident species procedure. The resident species procedure accounts for both the sensitivity of species present at the site in question and the influence of water quality characteristics on toxicity at that site (MacDonald 1997; CCME 2003; BCMOE 2013a). To apply this procedure, new toxicity tests are conducted with species that are resident at the site, using water from the site (i.e., upstream of any discharges from point or non-point sources). When enough data are generated to meet the minimum data requirements for deriving WQGs, SSWQSs are developed following the protocol for deriving generic WQGs (MacDonald 1997; CCME 2007; BCMOE 2012; 2013a). Although the resident species procedure generates very accurate SSWQSs, the cost of conducting all the required bioassays is often substantial and can be prohibitive (MacDonald 1997; BCMOE 2013a).
4. GUIDANCE FOR YINKA DENE ‘UZA’HNÉ SURFACE WATER MANAGEMENT POLICY
The Yinka Dene ‘Uza’hné Surface Water Management Policy describes narrative water management objectives, a water classification system, and technical procedures for establishing narrative and numeric water quality standards. Implementation of the Yinka Dene ‘Uza’hné Surface Water
- 7 -
Management Policy also requires guidance on various related issues, such as technical procedures for characterising baseline water quality conditions, objectives for waste discharges, guidelines for IDZ delineation, procedures for deriving EQC, and guidelines for aquatic effects monitoring. Additional information on these topics is provided in this section.
(a) Guidelines for Characterising Baseline Water Quality Conditions
Determination of water quality conditions in a watershed under baseline (i.e., pre-development) conditions represents an important element of the overall water management process. In our Territories, proponents are required to design and implement a baseline monitoring program that provides sufficient data and information on the physical, chemical, and biological characteristics of water bodies potentially affected by their project to:
• Characterize aquatic resources at risk;
• Identify the pathways and mechanisms through which aquatic resources could be affected by the project;
• Support the evaluation of the nature, magnitude, spatial extent, and significance of any project-related impacts and the effectiveness of any mitigation activities that are proposed to address the predicted impacts;
• Support the development of numerical WQSs that can be used in the environmental assessment and permitting processes; and
• Facilitate the design of an Aquatic Effects Monitoring Program (AEMP) that will enable “before and after” and “control and influenced” (BACI) evaluations of water quality conditions.
While the need for baseline monitoring data is apparent, neither the federal government nor provincial government agencies have established detailed guidance that fully defines the requirements for collecting, evaluating, and compiling baseline water quality data and related information to support environmental assessments and subsequent permitting. Without a clear understanding of the baseline data requirements for either of these processes, the data that have been collected by the project proponents, to characterize baseline conditions, have frequently been inadequate or incomplete.
Nadleh Whut’en and Stellat’en have established the following guidelines for characterizing baseline water quality conditions. Such monitoring programs must:
• Be designed in accordance with “Guidance on the Development of Baseline Monitoring Programs for Oil and Gas Development Projects in the NWT” (SFF 2008) and in general accordance with “Guidelines for Designing and Implementing Aquatic Effects Monitoring Programs for Development Projects in the Northwest Territories” (INAC 2009a to 2009h);
- 8 -
• Include collection of data on the physical, chemical, and biological characteristics of the water body (ies) under consideration for a period of not less than three years, including, at minimum, monthly sampling and two 5-in-30-day sampling events at each station each year;
• Include a quality assurance/quality control (QA/QC) program sufficient to assure the quality of the baseline data;
• Include an evaluation of the resultant data quality (i.e., data validation) to determine which data can be used to assess baseline conditions;
• Compile the resultant data in a project database in an appropriate format that facilitates access to the data by all interested parties over the entire life of the project; and,
• Include a detailed evaluation of baseline conditions, including annual reporting of the monitoring results and associated data analyses.
(b) General Objectives for Effluent Discharges to Receiving Waters
Numerical WQSs define the conditions that need to be achieved in receiving waters to ensure that the narrative WQSs are met. While such numerical WQSs provide essential tools for managing water resources, they do not provide a comprehensive basis for ensuring that the narrative WQSs are met. In addition, general objectives for effluent discharges, guidelines for IDZs, and numerical EQCs are required to ensure that wastewater discharges do not adversely affect receiving waters. The general objectives for effluent discharges are discussed in this section, while requirements related to IDZs and EQCs are described in the following sections of this chapter (i.e., Sections 4(c) and 4(d)).
To guide the development of permit conditions that are consistent with the guiding principles established by Nadleh Whut’en and Stellat’en related to the deposit of waste from a project to the receiving environment, the following objectives for effluent discharges must be met:
• Water quality and quantity in the receiving environment shall be maintained at a level that allows for current and future water quality requirements to be met (such requirements are determined using the water classification system); and,
• The amount of waste to be deposited to the receiving environment shall be minimized.
The following waste prevention/minimization hierarchy of preferred options is intended to guide waste management practices for development projects that includes:
• Source Reduction - Waste should be prevented or reduced at the source whenever feasible;

- 9 -
• Reuse/Recycle - Waste that cannot be prevented should be reused or recycled in an environmentally-safe manner whenever feasible;
• Treatment - Waste that cannot be prevented or recycled/reused should be treated in an environmentally-safe manner whenever feasible; and,
• Discharge - Discharge or deposit of waste into the environment should be employed only as a last resort and must meet EQCs.
In all cases, the intent of prescribing specific waste management practices is to achieve the objectives for effluent discharges listed above. In addition to these overarching objectives, a series of general objectives for effluent discharges need to be met to ensure that the narrative intent of the WQSs is achieved, including:
• Effluent discharges must be free from substances in concentrations or combinations that are acutely toxic or may be harmful to human, animal, or aquatic life;
• Effluent discharges must be free from substances that settle to form putrescent or otherwise objectionable sludge deposits, or that will adversely affect wildlife;
• Effluent discharges must be free from debris, oil, grease, scum, or other materials in amounts sufficient to be noticeable in the receiving water;
• Effluent discharges must be free from colour, turbidity, or odour-producing materials that would adversely affect aquatic life or wildlife, significantly alter the natural colour of the receiving water, or result in undesirable taste or odour in treated water; and
• Effluent discharges must be free from nutrients in concentrations that create nuisance growths of aquatic weeds or algae, or that result in an unacceptable degree of eutrophication of the receiving water.
(c) Guidelines for Establishing and Regulating Initial Dilution Zones
A physical mixing zone can be defined as the area within which an effluent mixes with receiving water, such that complete mixing has occurred outside the limits of the physical mixing zone (CCME 2009). The dimensions of the physical mixing zone depend on the characteristics of the effluent discharge (e.g., density, outfall design, temperature, flow rate, COPC concentrations) and the characteristics of the receiving water body (e.g., depth, current velocity, turbulence, wave action). Accordingly, the size and location of the physical mixing zone can change over time. In addition to determining the characteristics of the physical mixing zone, environmental managers typically establish an allocated mixing zone to provide a basis for regulating effluent discharges. According to CCME (2009), the allocated mixing zone or IDZ is defined as the area contiguous with a point source (effluent discharge site) or a delimited non-point source where:
The discharge mixes with ambient water and where concentrations of some substances may not comply with water quality guidelines or objectives. The mixing
- 10 -
zone is an area of acceptable, but not acutely toxic, impact that does not affect the overall quality of the receiving water. In general, the integrity of the water body as a whole is protected even if environmental quality objectives (EQOs) are exceeded within the mixing zone, as long as the effluent does not cause significant mortality inside the zone and respects the EQOs at the edge of the zone.
The following criteria for IDZs are intended to support consistency in the regulation of effluent discharges to receiving water bodies within our Territories (Hatfield 2012), including:
• The dimensions of an IDZ should be restricted to avoid adverse effects on the designated uses of the receiving water system (i.e., the mixing zone should be as small as possible), as follows;
(i) For lakes, IDZs should have a maximum radius of 100 m or 25% of the width of the lake, whichever is smaller. In addition, IDZs should not exceed 10% of the available lake volume and not extend closer to shore than the mean low water mark, and
(ii) For streams and rivers, IDZs should not exceed (a) the lesser of the maximum width, perpendicular to the path of the stream, or 100 m, or 25% of the width of the stream, and (b) the maximum length, parallel to the path of the stream, of a point 100 m upstream of the discharge and a point downstream, which is the lesser of 100 m or the distance at which the width of the effluent plume equals the maximum allowable width of the mixing zone;
• IDZs should not impinge on critical fish or wildlife habitats (e.g., spawning or rearing areas of fish, over-wintering habitats of migratory waterfowl);
• IDZs must not be established such that drinking water intakes are contained therein and must be established to maintain a minimum of 1 km separation from the drinking water intake in lakes and 1 km in the downstream direction in rivers;
• IDZs should not be allocated for persistent, toxic and bioaccumulative substances;
• The placement of IDZs must not block the migration of fish or other aquatic organisms into tributaries;
• Conditions at the edge of the IDZ must not be chronically toxic to aquatic organisms;
• Conditions within IDZs should not result in unacceptable levels of eutrophication or the presence of toxic blooms of algae;
• Conditions within IDZs should not result in attraction of aquatic life or wildlife, thereby causing increased exposure to COPCs. Where discharges produce hazardous ice conditions, wildlife access to such areas should be barred;

- 11 -
• Mixing zones should not be used as an alternative to reasonable and practical pollution prevention, including wastewater treatment;
• Accumulation of toxic substances in sediment to toxic levels should not occur in the mixing zone. The potential for such conditions to occur may be evaluated using Canadian sediment quality guidelines and/or assessed using standardized sediment toxicity tests;
• IDZs should be free from debris, oil, grease, scum, or other materials in amounts sufficient to be noticeable in the receiving water; and
• IDZs should be free from colour, turbidity, or odour-producing materials that would adversely affect aquatic life or waterfowl, significantly alter the natural colour of the receiving water, or directly or through interaction among themselves or with chemicals used in water treatment, result in undesirable taste or odour in treated water.
These criteria represent a key element of the framework for managing water quality conditions in our Territories.
(d) Methods for Deriving Effluent Quality Criteria
Effluent quality criteria are narrative statements and/or numerical values that must be met to assure protection of receiving waters. In our Territories, effluent quality criteria (i.e., discharge limits) need to be established at levels that will ensure that narrative and numeric WQSs are met at the edge of the IDZ. For riverine receiving water systems, the numerical EQC are determined using information on the flow of the effluent (EF), the flow of the receiving water body (RF), total flow after mixing (TF), average background concentrations of COPCs in the water body (BKGD), and the WQSs or WQOs, generally as follows:
WQS = [(BKGD*RF) + (EQC*EF)] / TF
or, isolating the EQC term:
EQC = [(WQS*TF) - (BKGD*RF)] / EF
For lake environments, information on initial dilution rates following effluent discharge is needed to calculate the EQC (i.e., based on the rate of effluent discharge, the volume of the IDZ, and the rate of effluent dispersion). Effluent dispersion models are typically employed to support these calculations.
In addition to numerical EQCs, narrative EQCs will be established for most effluent discharges. Section 4(c) identifies general criteria for regulating effluent discharges. Effluent quality must be maintained such that all of these criteria are met. Furthermore, effluents must not be acutely toxic to aquatic organisms, based on the results of short-term toxicity tests with fish and aquatic invertebrates.
(e) Guidelines for Aquatic Effects Monitoring

- 12 -
Aquatic effects monitoring is required in the vicinity of developmental projects to address issues and concerns raised by communities and regulatory agencies relative to the environmental effects of the project on the aquatic ecosystem. More specifically, AEMPs attempt to measure changes, over time, in the water quality, sediment quality and/or biological characteristics of the receiving waterbody in response to wastewater discharges and/or other activities associated with the project. Such AEMPs are usually designed to:
• Determine if there has been a change in the measured variables from baseline conditions;
• Determine if project-related activities are the source of the change in the measured variables;
• Determine if the measured results exceed predictions made in the environmental assessment; and/or
• Determine if the measured change is likely to cause a significant adverse environmental impact.
As aquatic effects monitoring is commonly included as a condition for the Environmental Management Act (EMA) permits issued in B.C., there is a need to provide project proponents with guidance on the design of AEMPs. The federal government recently developed “Guidelines for Designing and Implementing Aquatic Effects Monitoring Programs for Development Projects in the Northwest Territories,” which includes:
• Plain Language Summary of the Guidelines for Designing and Implementing Aquatic Effects Monitoring Programs for Development Projects in the Northwest Territories (INAC 2009a);
• Guidelines for Designing and Implementing Aquatic Effects Monitoring Programs for Development Projects in the Northwest Territories: Overview Report (INAC 2009b);
• Recommended Procedures for Identifying Issues and Concerns Associated with Development Projects (INAC 2009c);
• Recommended Procedures for Problem Formulation to Support the Design of Aquatic Effects Monitoring Programs (INAC 2009d);
• Recommended Procedures for Developing Data Quality Objectives and a Conceptual Study Design for Aquatic Effects Monitoring Programs (INAC 2009e);
• Recommended Procedures for Detailed Designs for Aquatic Effects Monitoring Programs (INAC 2009f);
• Recommended Procedures for Documenting and Verifying Conceptual and Detailed Designs of Aquatic Effects Monitoring Programs (INAC 2009g); and

- 13 -
• Recommended Procedures for Evaluating, Analysing, Interpreting, and Reporting Data and Information Collected under Aquatic Effects Monitoring Programs (INAC 2009h).
Collectively, these documents provide project proponents with clear guidance for developing and implementing AEMPs that provide the data and information needed to assess the effects on the aquatic environment associated with discharges of wastewater and other activities associated with development projects. This guidance shall be used to design AEMPs that will be conducted within our Territories.
5. CONSIDERATIONS FOR IMPLEMENTING WATER QUALITY STANDARDS
The methods for developing preliminary WQSs were described in the previous sections of this document (see MacDonald et al. 2016 for more information). In addition, the procedures for evaluating the applicability of the preliminary WQSs and establishing numerical WQSs were described. This chapter further supports the WQS-development process by articulating expectations for documenting the derivation of WQSs and for monitoring for evaluating attainment of the WQSs.
(a) Documenting the Development of WQS
Water quality standards represent essential science-based tools for managing aquatic ecosystems. The development of such WQSs needs to be documented to support their review and evaluation. The documentation prepared to support review and evaluation of the WQSs that are proposed for a water body in our Territories must include:
• Introduction - This section of the document needs to include a description of the study area (including the class of water under investigation), a description of the issues and concerns in the watershed, a brief description of the rationale for deriving WQSs and an overview of the approach that will be applied to derive the WQSs.
• Water Uses in the Study Area - This section of the document needs to describe all of the designated water uses of the water body, all of the consumptive and non-consumptive uses of water that could influence water quality conditions (e.g., industrial water uses, municipal water uses, hydro power generation), and all of the designated uses in downstream areas.
• Contaminant Sources - This section of the document needs to describe all of the existing point and non-point sources of contaminants in the watershed. In addition, any development projects that are proposed in the watershed need to be described, including potential effects on water quality conditions. The information on contaminant sources should be used to establish a list of COPCs in the water body, as well as the rationale for the COPCs that were identified.
• Baseline Water Quality Conditions - This section of the document should describe the historical sources of baseline water quality data and the baseline monitoring

- 14 -
program(s) that have been implemented in the study area. In addition, this section of the document should provide a description of the quality (i.e., usability) of the baseline water quality data that were compiled. Summaries of the baseline water quality data that are available also need to be provided.
• Baseline Hydrological and/or Limnological Conditions - This section of the document needs to describe the available information on the hydrology and/or limnology of the water body(ies) under investigation. Summaries of the available climatic data also need to be provided in this section.
• Structure of the Aquatic Ecosystem - This section of the document needs to describe the historical sources of information on the aquatic organisms and aquatic-dependent wildlife that occur or ought to occur in the study area. In addition, any biological surveys that have been conducted in the study area need to be described and the results of these surveys need to be summarized. Lists of species that occur or ought to occur at the site need to be prepared and included in the document. An evaluation of the adequacy of the information for identifying the aquatic organisms that occur or ought to occur at the site is also required.
• Water Quality Standards - This section of the document needs to identify the substances for which numerical WQSs are required, describe the procedures that were used to derive the numerical WQSs, present any and all data and information that were used to derive the WQS, and present the proposed WQSs for each water quality variable (i.e., COPC). The proposed WQSs must clearly describe where and when they are intended to apply.
• Proposed Monitoring Program - This section of the document needs to describe the monitoring program that is proposed to provide the data and information needed to evaluate attainment of the WQSs. The proposed monitoring program should identify all of the proposed sampling stations and rationale for their selection, describe the proposed frequency and timing of sampling and identify all of the media types and variables that will be measured.
• Summary and Recommendations - This section needs to provide a succinct summary of the information presented in the document, present the recommended WQSs, and describe any recommendations for further work that is needed to reduce uncertainty in the WQSs.
• Literature Cited - This section of the document needs to include a comprehensive list of all of the documents and information that were used during the course of the investigation.
• Appendices - All of the raw data and information used in the WQS derivation process should be compiled and presented in appendices to the document.
(b) Monitoring for Attainment of Narrative WQS
- 15 -
Monitoring to assess attainment of the narrative WQSs typically includes physical, chemical, biological and toxicological indicators (i.e., with an AEMP). Guidance on the design, implementation and interpretation of the results of such monitoring programs is provided in the Guidelines for Aquatic Effects Monitoring (INAC 2009a to 2009g). In general, proponents will assume the primary responsibility for designing and implementing attainment monitoring programs; however, Nadleh Whut’en and Stellat’en will be responsible for review and approval of conceptual design documents, field sampling plans, quality assurance project plans, data reports and interpretive reports.
(c) Monitoring for Compliance with Numerical WQS
To be effective, a monitoring program must have both a well-defined purpose and objectives that support effective management of water resources (Ward 1979; Schilperoort and Groot 1983). Whitfield (1988) summarized the reasons for conducting water quality monitoring into five categories, including:
• Assessment of compliance with WQSs;
• Trend assessment;
• Estimation of mass;
• Environmental impact; and/or
• General.
Whitfield and Clark (2001) developed a systematic method for optimizing the design of water quality monitoring programs, and demonstrated the cost-effectiveness of monitoring programs designed to target key ecosystem characteristics likely to be responsive to specific types of interventions. This method relies on knowledge of the forces that drive change, in conjunction with signal analysis, to focus monitoring programs on the data most likely to yield information on the sensitivity and resilience of the ecosystem (Whitfield et al. 1999). This approach is consistent with the data quality objectives (DQOs) process described by USEPA (2009) and summarized in Clark et al. (2010). DQOs optimize the collection of water quality data since only data needed to support the decision are collected. Additionally, DQOs provide a high level of transparency in decisions related to monitoring program design.
Water quality conditions are known to vary substantially both temporally and spatially. This underlying variability in water quality data makes it challenging to distinguish patterns in water quality conditions from the apparent noise in the system. Potential sources of variability and strategies to address them are summarized in Table 4. Acquisition and evaluation of data characterizing sources of variability in water quality conditions provide a means of designing and optimizing sampling programs for assessing status and trends.
One of the principal objectives of status assessment monitoring programs is to determine whether or not specific water quality targets (e.g., WQSs) are being met (Whitfield 1988). The effectiveness of compliance monitoring programs is often expressed as the ratio of detected violations to actual

- 16 -
violations of the targets (Schilperoort and Groot 1983), with the true frequency of exceedance established through continuous monitoring or intensive surveys of water quality.
In some cases, the sampling required to assess compliance is specified in the WQS itself. For example, the water quality guideline for fecal coliforms is written as a geometric mean concentration of five samples collected at equal intervals over a 30-day period (Nagpal et al. 2006). Therefore, monitoring to assess compliance with the WQS must involve separate collections of samples at six-day intervals. Accordingly, the WQS defines a fixed-frequency sampling program as the most appropriate for assessing compliance.
In other cases, practitioners are afforded more latitude in the design of compliance monitoring programs, with the most appropriate sampling strategies being those that have high effectiveness to cost ratios. Whitfield (1988) identified two additional monitoring approaches that could be used to cost-effectively assess compliance with WQSs, including sequential sampling and Markovian sampling (which is a type of exceedance-driven sampling).
Sequential sampling is a hypothesis testing-driven approach that involves random or stratified sampling, with decisions related to future sampling determined by the monitoring results. More specifically, the sampling data are used to determine if the system is in compliance (null hypothesis; Ho; i.e., WQS has not been exceeded), out of compliance (alternate hypothesis; Ha; i.e., WQS has been exceeded), or the outcome is uncertain (i.e., the result is within the range of uncertainty for the measurement; e.g., WQS + 20%). In the case of the third option, the water quality assessment is continued by making additional observations.
Markovian sampling is an approach that involves collection of samples at a variable frequency, depending on the status of the system under investigation. That is, infrequent sampling is undertaken when the system is in control and more frequent sampling is conducted when the system is tending towards non-compliance. In this approach, water quality at a particular station is viewed as a continuous process that can be scaled into levels of acceptability. For example, the possible range of outcomes for a water quality variable can be divided into multiple categories based on proximity to the WQS value (e.g., <0.1 x WQS - safe; 0.1-<0.5 x WQS - marginal; 0.5- 0.99 x WQS - alert; and, >WQS - non-compliance). Decisions about the frequency of sampling are then made based on the measured concentrations of each analyte and the period of time that the analyte concentration has been within a particular range. Where a suite of different variables needs be analysed on each sampling occasion, the frequency is determined by those variables closest to non-compliance, or most often non-compliant.
In general, exceedance-driven sampling is considered to be the most appropriate for assessing compliance with acute-type WQSs, while fixed-frequency sampling is most relevant for assessing compliance with chronic-type WQSs. One advantage of the fixed-frequency sampling approach is that the number of samples and, hence, costs, can be determined prior to program implementation. This is not the case for exceedance-driven sampling. One of the advantages of the exceedance-driven approach is that it supports determination of the optimum number of samples before implementing the program, if sufficient information exists to estimate the probability of observing outcomes in each category. However, incomplete knowledge of the true variability in water quality conditions can negate this advantage. In addition, the amount of time needed to analyse the samples can render the exceedance driven approach difficult to implement.

- 17 -
6. SUMMARY AND CONCLUSIONS
The Yinka Dene ‘Uza’hné Guide to Surface Water Quality Standards is intended to support implementation of the Yinka Dene ‘Uza’hné Surface Water Management Policy. This supporting policy framework consists of four distinct elements:
• Numerical water quality standards;
• Procedures for deriving water quality standards;
• Guidance for implementing the Yinka Dene ‘Uza’hné Surface Water Management Policy; and
• Considerations for implementing water quality standards.
This document provides additional resources that are essential for implementing the policy in a manner that ensures that the narrative water management objectives are consistently met throughout our Territories.
7. REFERENCES CITED
BCMOE (British Columbia Ministry of Environment). 2012. Derivation of water quality guidelines to protect aquatic life in British Columbia. Water Protection and Sustainability Branch, Environmental Sustainability and Strategic Policy Division, British Columbia Ministry of Environment. 34 p.
BCMOE (British Columbia Ministry of Environment). 2013a. Guidance for the derivation and application of water quality objectives in British Columbia. Water Protection and Sustainability Branch. Ministry of Environment.140 pp + vii.
BCMOE (British Columbia Ministry of Environment). 2013b. The effluent permitting process under the Environmental Management Act: An overview for mine project applicants. Victoria, British Columbia. Available at http://www2.gov.bc.ca/gov/DownloadAsset?assetId=2F43387DE13240BE9D B1B18D5CEE96B3.
BCMOE (British Columbia Ministry of Environment). 2015. Water quality: Water quality guidelines (criteria) reports. Approved water quality guidelines. Environmental Protection Division. Victoria, British Columbia. Available at http://www.env.gov.bc.ca/wat/wq/wq_guidelines.html.
CCME (Canadian Council of Ministers of the Environment). 2003. Guidance on the site-specific application of water quality guidelines in Canada: Procedures for deriving numerical water quality objectives. Canadian Environmental Guidelines. Canadian Council of Ministers of the Environment. Ottawa.
CCME (Canadian Council of Ministers of the Environment). 2007. A protocol for the derivation of water quality guidelines for the protection of aquatic life 2007. Canadian Water Quality Guidelines for the Protection of Aquatic Life. Canadian Council of Ministers of the Environment. Ottawa.
- 18 -
CCME (Canadian Council of Ministers of the Environment). 2009. Canada-wide strategy for the management of municipal wastewater effluent. Endorsed by CCME Council of Ministers, February 17, 2009, Whitehorse.
CCME (Canadian Council of Ministers of the Environment). 2015a. Canadian Environmental Quality Guidelines Summary Table. Water quality guidelines for the protection of aquatic life. Canadian Environmental Quality Guidelines. Winnipeg, Manitoba. Available at http://st-ts.ccme.ca/en/index. html?chems=all&chapters=1.
CCME (Canadian Council of Ministers of the Environment). 2015b. Canadian Environmental Quality Guidelines Summary Table. Water quality guidelines for the protection of agriculture. Canadian Environmental Quality Guidelines. Winnipeg, Manitoba. Available at http://st-ts.ccme.ca/en/index. html?chems=all&chapters=2.
CCREM (Canadian Council of Resource and Environment Ministers). 1987. Canadian water quality guidelines. Task Force on Water Quality Guidelines. Ottawa, Canada.
Clark, M.J.R., D.D. MacDonald, P.H. Whitfield, and M.P. Wong. 2010. Designing monitoring programs for water quality based on experience in Canada. Part II - Monitoring Tools - Problem Characterization and Data Quality Objectives. Trends in Analytical Chemistry 29(5):385-398.
Dixon, W. and B. Chiswell. 1996. Review paper: Review of aquatic monitoring program design. Water Research 30(9): 1935-1948.
Hatfield Consultants. 2012. Receiving water classification system for the Northwest Territories. Version 3. Draft. Prepared for Aboriginal Affairs and Northern Development Canada, NWT Region. Prepared by Hatfield Consultants, North Vancouver, B.C.
INAC (Indian and Northern Affairs Canada). 2009a. Guidelines for designing and implementing aquatic effects monitoring programs for development projects in the Northwest Territories: Plain Language Summary. Prepared for Water Resources Division. Yellowknife, Northwest Territories.
INAC (Indian and Northern Affairs Canada). 2009b. Guidelines for designing and implementing aquatic effects monitoring programs for development projects in the Northwest Territories: Overview. Prepared for Water Resources Division. Yellowknife, Northwest Territories. Prepared by MacDonald Environmental Sciences Ltd., Nanaimo, British Columbia, Zajdlik and Associates, Rockwood, Ontario and INAC.
INAC (Indian and Northern Affairs Canada). 2009c. Guidelines for designing and implementing aquatic effects monitoring programs for development projects in the Northwest Territories: Volume 1- Recommended procedures for identifying issues and concerns associated with development projects. Prepared for Water Resources Division. Yellowknife, Northwest Territories. Prepared by MacDonald Environmental Sciences Ltd., Nanaimo, British Columbia, Zajdlik and Associates, Rockwood, Ontario and INAC.
INAC (Indian and Northern Affairs Canada). 2009d. Guidelines for designing and implementing aquatic effects monitoring programs for development projects in the Northwest Territories:
- 19 -
Volume 2 - Recommended procedures for developing the problem formulation to support the design of aquatic effects monitoring identifying issues and concerns associated with development projects. Prepared for Water Resources Division. Yellowknife, Northwest Territories. Prepared by MacDonald Environmental Sciences Ltd., Nanaimo, British Columbia, Zajdlik and Associates, Rockwood, Ontario and INAC.
INAC (Indian and Northern Affairs Canada). 2009e. Guidelines for designing and implementing aquatic effects monitoring programs for development projects in the Northwest Territories: Volume 3 - Recommended procedures for developing data quality objectives and a conceptual study design. Prepared for Water Resources Division. Yellowknife, Northwest Territories. Prepared by MacDonald Environmental Sciences Ltd., Nanaimo, British Columbia, Zajdlik and Associates, Rockwood, Ontario and INAC.
INAC (Indian and Northern Affairs Canada). 2009f. Guidelines for designing and implementing aquatic effects monitoring programs for development projects in the Northwest Territories: Volume 4 - Recommended procedures for developing detailed designs for aquatic effects monitoring programs. Prepared for Water Resources Division. Yellowknife, Northwest Territories. Prepared by Zajdlik and Associates, Rockwood, Ontario, MacDonald Environmental Sciences Ltd., Nanaimo, British Columbia and INAC.
INAC (Indian and Northern Affairs Canada). 2009g. Guidelines for designing and implementing aquatic effects monitoring programs for development projects in the Northwest Territories: Volume 5 - Recommended procedures for documenting and verifying conceptual and detailed designs of aquatic effects monitoring programs. Prepared for Water Resources Division. Yellowknife, Northwest Territories. Prepared by MacDonald Environmental Sciences Ltd., Nanaimo, British Columbia, Zajdlik and Associates, Rockwood, Ontario and INAC.
INAC (Indian and Northern Affairs Canada). 2009h. Guidelines for designing and implementing aquatic effects monitoring programs for development projects in the Northwest Territories: Volume 6 - Recommended procedures for evaluating, compiling, interpreting, and reporting data collected under aquatic effects monitoring programs. Prepared for Water Resources Division. Yellowknife, Northwest Territories. Prepared by MacDonald Environmental Sciences Ltd., Nanaimo, British Columbia, Zajdlik and Associates, Rockwood, Ontario and INAC.
MacDonald, D.D. 1997. Water quality assessment and objectives: Methods for deriving site-specific water quality objectives in British Columbia and Yukon. Prepared for B.C. Ministry of Environment, Lands and Parks. Victoria, British Columbia.
MacDonald, D.D., L.E. Fidler, and D. Valiela. 1987. Site-specific water quality criteria for fish and aquatic life in the Canadian portion of the Flathead River basin: Nitrate, nitrite, and ammonia. Water Quality Branch. Environment Canada. Vancouver, British Columbia. 127 pp.
MacDonald, D.D., W.T. Willingham, L.P.Parrish, G.J. Rodriguez, J.M. Lazorchak, and J.W. Love. 1989. Using in situ bioassays as a basis for the development of water quality objectives: A case study of the Arkansas River. Presented at the 1989 Workshop on the Derivation and Use of Water Quality Objectives. Halifax, Nova Scotia.
- 20 -
MacDonald, D.D., J. Sinclair, A. Schein, and B. Slater. 2016. Guidance Manual for Developing Water Quality Objectives for Freshwater Ecosystems in Yukon. Prepared by MacDonald Environmental Sciences Ltd. and Slater Environmental Consulting. Prepared for Yukon Environment. Whitehorse, Yukon.
Nagpal N.K. 1999. Canadian water quality guidelines for zinc. Overview. Water Management Branch. Environmental Protection Department. British Columbia Ministry of the Environment, Lands and Parks. Victoria, British Columbia.
Nagpal, N.K., L.W. Pommen, and L.G. Swain. 2006. Water Quality Guidelines: A compendium of working water quality guidelines for British Columbia. ISBN 0-7726-3774-1. Prepared for British Columbia Ministry of Environment, Lands, and Parks). Water Management Branch. Victoria, British Columbia. 28 pp.
Nadleh Whut’en and Stellat’en. 2016. Yinka Dene ‘Uza’hné Surface Water Management Policy. Fort Fraser, British Columbia.
Schilperoort, J. and S. Groot. 1983. Design and optimization of water quality monitoring networks. Presented at International Symposium of Methods and Instrumentation for the Investigation of Ground Water Systems.
SFF (Sustainable Fisheries Foundation). 2008. Guidance on the development of baseline monitoring programs for oil and gas pipeline development projects in the NWT. Prepared for Indian and Northern Affairs Canada. Prepared by Sustainable Fisheries Foundation. Nanaimo, British Columbia. 92 pp.
USEPA (U.S. Environmental Protection Agency). 1994. Interim guidance on determination and use of water-effect ratios for metals. EPA 823-B-94-001. Office of Water. Office of Science and Technology. Washington, District of Columbia.
USEPA (United States Environmental Protection Agency). 2009. National recommended water quality criteria. EPA-822-R-02-047. Office of Water. Office of Science and Technology. Cincinnati, Ohio. 24 pp.
Ward, R.C. 1979. Regulatory water quality monitoring: a systems perspective. Water Resources Bulletin 15(2): 369-380. (As cited in Dixon and Chiswell 1996).
Whitfield, P.H. 1988. Goals and data collection designs for water quality monitoring. Water Resources Bulletin 24(4):775-780.
Whitfield, P.H. and M.J.R. Clark. 2001. Using force analysis to target collection and analysis of environmental information. Environmental Management 28(1): 75-85.
Whitfield, P.H., M.J.R. Clark, and A. Cannon. 1999. Signals and noise in environmental data-characterization of non-random uncertainty in environmental monitoring. p. 86-95. In: Environmental modeling. Proceedings of the International Conference on Water, Environment, Ecology, Socio-economics and Health Engineering (WEESHE). October 18-21, 1999. Eds. Singh,
- 21 -
V.P., I.W. Seo, and J.H. Sonu. ISBN Number 1-887201-23-8. Water Resources Publications, LLC. Highlands Ranch, Colorado.
Willingham, T.W. 1988. Using in situ bioassays as a basis for the development of site-specific water quality criteria. In: D.D. MacDonald (ed.). Proceedings of the Canada - British Columbia Workshop on Water Quality Guidelines and Objectives: Focus on the Fraser. Water Quality Branch. Environment Canada. Vancouver, British Columbia. 151 pp

TABLE 1: SUPPORTING DATA FOR THE CHARACTERIZATION OF BACKGROUND CONDITIONS
- 22 -
Water Body / Station Station Description Start Date End Date
Babine River
BAB-01 Babine River September 2011 September 2012
Endako River E209353 Endako River - Upstream of Endako Mine August 1998 November 2014
Francois Lake E224945 Francois Lake West End - Deep Station February 1997 May 2008 E224946 Francois Lake East End - Deep Station February 1997 May 2008 E271703 Francois Lake Centre - Deep Station May 2008 May 2008
Stellako River 0400405 Stellako River - 10 m Upstream of CNR Bridge May 1982 August 1984 E206563 Stellako River - 500 m Upstream of Endako River May 1982 August 1986 STK-01 Stellako River - Upstream of Endako River September 2011 September 2013 STK-02 Stellako River - Downstream of Endako River September 2011 September 2013
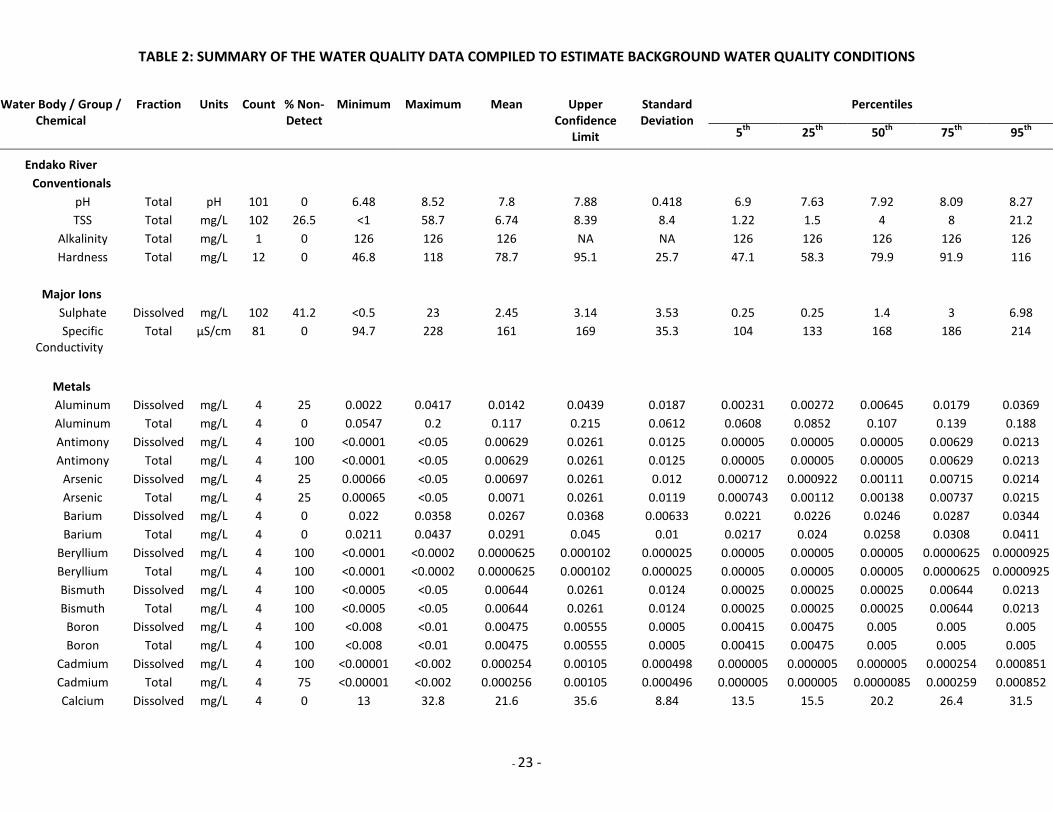
TABLE 2: SUMMARY OF THE WATER QUALITY DATA COMPILED TO ESTIMATE BACKGROUND WATER QUALITY CONDITIONS
- 23 -
Water Body / Group / Chemical
Fraction Units Count % Non-Detect
Minimum Maximum Mean Upper Confidence
Limit
Standard Deviation
Percentiles
5th 25th 50th 75th 95th
Endako River Conventionals
pH Total pH 101 0 6.48 8.52 7.8 7.88 0.418 6.9 7.63 7.92 8.09 8.27 TSS Total mg/L 102 26.5 <1 58.7 6.74 8.39 8.4 1.22 1.5 4 8 21.2
Alkalinity Total mg/L 1 0 126 126 126 NA NA 126 126 126 126 126 Hardness Total mg/L 12 0 46.8 118 78.7 95.1 25.7 47.1 58.3 79.9 91.9 116
Major Ions Sulphate Dissolved mg/L 102 41.2 <0.5 23 2.45 3.14 3.53 0.25 0.25 1.4 3 6.98 Specific
Conductivity Total µS/cm 81 0 94.7 228 161 169 35.3 104 133 168 186 214
Metals Aluminum Dissolved mg/L 4 25 0.0022 0.0417 0.0142 0.0439 0.0187 0.00231 0.00272 0.00645 0.0179 0.0369 Aluminum Total mg/L 4 0 0.0547 0.2 0.117 0.215 0.0612 0.0608 0.0852 0.107 0.139 0.188 Antimony Dissolved mg/L 4 100 <0.0001 <0.05 0.00629 0.0261 0.0125 0.00005 0.00005 0.00005 0.00629 0.0213 Antimony Total mg/L 4 100 <0.0001 <0.05 0.00629 0.0261 0.0125 0.00005 0.00005 0.00005 0.00629 0.0213
Arsenic Dissolved mg/L 4 25 0.00066 <0.05 0.00697 0.0261 0.012 0.000712 0.000922 0.00111 0.00715 0.0214 Arsenic Total mg/L 4 25 0.00065 <0.05 0.0071 0.0261 0.0119 0.000743 0.00112 0.00138 0.00737 0.0215 Barium Dissolved mg/L 4 0 0.022 0.0358 0.0267 0.0368 0.00633 0.0221 0.0226 0.0246 0.0287 0.0344 Barium Total mg/L 4 0 0.0211 0.0437 0.0291 0.045 0.01 0.0217 0.024 0.0258 0.0308 0.0411
Beryllium Dissolved mg/L 4 100 <0.0001 <0.0002 0.0000625 0.000102 0.000025 0.00005 0.00005 0.00005 0.0000625 0.0000925 Beryllium Total mg/L 4 100 <0.0001 <0.0002 0.0000625 0.000102 0.000025 0.00005 0.00005 0.00005 0.0000625 0.0000925 Bismuth Dissolved mg/L 4 100 <0.0005 <0.05 0.00644 0.0261 0.0124 0.00025 0.00025 0.00025 0.00644 0.0213 Bismuth Total mg/L 4 100 <0.0005 <0.05 0.00644 0.0261 0.0124 0.00025 0.00025 0.00025 0.00644 0.0213 Boron Dissolved mg/L 4 100 <0.008 <0.01 0.00475 0.00555 0.0005 0.00415 0.00475 0.005 0.005 0.005 Boron Total mg/L 4 100 <0.008 <0.01 0.00475 0.00555 0.0005 0.00415 0.00475 0.005 0.005 0.005
Cadmium Dissolved mg/L 4 100 <0.00001 <0.002 0.000254 0.00105 0.000498 0.000005 0.000005 0.000005 0.000254 0.000851 Cadmium Total mg/L 4 75 <0.00001 <0.002 0.000256 0.00105 0.000496 0.000005 0.000005 0.0000085 0.000259 0.000852 Calcium Dissolved mg/L 4 0 13 32.8 21.6 35.6 8.84 13.5 15.5 20.2 26.4 31.5

TABLE 2: SUMMARY OF THE WATER QUALITY DATA COMPILED TO ESTIMATE BACKGROUND WATER QUALITY CONDITIONS
- 24 -
Calcium Total mg/L 4 0 12.9 33.7 21.8 36.4 9.18 13.5 15.7 20.3 26.4 32.2 Chromium Dissolved mg/L 4 75 <0.0001 <0.005 0.000708 0.00261 0.0012 0.00005 0.00005 0.00014 0.000798 0.00216 Chromium Total mg/L 4 25 0.0002 <0.005 0.000895 0.00262 0.00108 0.000212 0.00026 0.00044 0.00108 0.00221
Metals (cont.) Cobalt Dissolved mg/L 4 100 <0.0001 <0.005 0.000662 0.00261 0.00123 0.00005 0.00005 0.00005 0.000662 0.00213 Cobalt Total mg/L 4 100 <0.0001 <0.005 0.000662 0.00261 0.00123 0.00005 0.00005 0.00005 0.000662 0.00213 Copper Dissolved mg/L 101 55.4 0.0005 0.03 0.00578 0.00694 0.00587 0.00066 0.003 0.005 0.005 0.021 Copper Total mg/L 4 25 0.00112 <0.005 0.00188 0.00279 0.000571 0.00124 0.00171 0.00196 0.00213 0.00243
Iron Dissolved mg/L 103 0 0.119 0.657 0.267 0.287 0.102 0.14 0.193 0.248 0.327 0.43 Iron Total mg/L 4 0 0.277 0.542 0.406 0.6 0.122 0.286 0.32 0.403 0.49 0.532 Lead Dissolved mg/L 88 100 <0.00005 <0.05 0.0218 0.0236 0.00816 0.0005 0.025 0.025 0.025 0.025 Lead Total mg/L 4 50 <0.00005 <0.03 0.00387 0.0157 0.00742 0.0000325 0.0000625 0.000218 0.00402 0.0128
Lithium Dissolved mg/L 3 33.3 <0.0005 0.00135 0.000933 0.00242 0.000597 0.000345 0.000725 0.0012 0.00128 0.00134 Lithium Total mg/L 3 0 0.0006 0.0015 0.00118 0.00244 0.000506 0.000685 0.00102 0.00145 0.00148 0.0015
Magnesium Dissolved mg/L 4 0 3.59 7.92 5.44 8.53 1.95 3.68 4.06 5.12 6.49 7.63 Magnesium Total mg/L 4 0 3.55 8.25 5.47 8.85 2.12 3.63 3.97 5.04 6.55 7.91 Manganese Dissolved mg/L 4 0 0.0121 0.0409 0.0301 0.0513 0.0133 0.0145 0.024 0.0337 0.0398 0.0407 Manganese Total mg/L 4 0 0.0156 0.069 0.0467 0.0827 0.0226 0.0204 0.0396 0.0512 0.0583 0.0669
Mercury Dissolved mg/L 3 100 <0.00001 <0.00001 0.000005 NA 0 0.000005 0.000005 0.000005 0.000005 0.000005 Mercury Total mg/L 3 100 <0.00001 <0.00001 0.000005 NA 0 0.000005 0.000005 0.000005 0.000005 0.000005
Molybdenum Dissolved mg/L 102 75.5 0.000742 <0.13 0.0179 0.0212 0.017 0.004 0.015 0.015 0.015 0.0547 Molybdenum Total mg/L 4 0 0.00123 0.009 0.00431 0.00958 0.00331 0.00154 0.00278 0.00351 0.00503 0.00821
Nickel Dissolved mg/L 4 75 <0.0005 <0.008 0.00134 0.0042 0.0018 0.00025 0.00025 0.000555 0.00164 0.00353 Nickel Total mg/L 4 50 <0.0005 <0.008 0.00141 0.00418 0.00175 0.000294 0.000468 0.00069 0.00163 0.00353
Phosphorus Total mg/L 4 100 <0.05 <0.1 0.0312 0.0511 0.0125 0.025 0.025 0.025 0.0312 0.0462 Potassium Dissolved mg/L 4 0 1 1.72 1.31 1.86 0.345 1.01 1.04 1.26 1.53 1.68 Potassium Total mg/L 4 0 1.04 2 1.59 2.27 0.425 1.11 1.38 1.66 1.88 1.98 Selenium Dissolved mg/L 4 100 <0.0001 <0.03 0.00379 0.0157 0.00748 0.00005 0.00005 0.00005 0.00379 0.0128 Selenium Total mg/L 4 100 <0.0001 <0.03 0.00379 0.0157 0.00748 0.00005 0.00005 0.00005 0.00379 0.0128
Silicon Dissolved mg/L 3 0 3.01 5.18 4.16 6.86 1.09 3.14 3.64 4.28 4.73 5.09 Silicon Total mg/L 3 0 3.09 5.5 4.32 7.31 1.21 3.22 3.72 4.36 4.93 5.39 Silver Dissolved mg/L 4 100 <0.00001 <0.01 0.00125 0.00523 0.0025 0.000005 0.000005 0.000005 0.00125 0.00425 Silver Total mg/L 4 100 <0.00001 <0.01 0.00125 0.00523 0.0025 0.000005 0.000005 0.000005 0.00125 0.00425

TABLE 2: SUMMARY OF THE WATER QUALITY DATA COMPILED TO ESTIMATE BACKGROUND WATER QUALITY CONDITIONS
- 25 -
Sodium Dissolved mg/L 4 0 3.57 6.01 4.74 6.48 1.09 3.66 4.01 4.7 5.43 5.89 Sodium Total mg/L 4 0 3.29 7 4.81 7.48 1.68 3.36 3.62 4.48 5.67 6.73
Strontium Dissolved mg/L 4 0 0.0774 0.203 0.132 0.223 0.0573 0.0799 0.0899 0.123 0.165 0.195 Metals (cont.)
Strontium Total mg/L 4 0 0.0785 0.216 0.138 0.236 0.0616 0.0817 0.0946 0.128 0.171 0.207 Sulfur Dissolved mg/L 4 0 0.6 1.42 0.925 1.56 0.396 0.601 0.608 0.84 1.16 1.37 Sulfur Total mg/L 4 0 0.6 1.5 0.965 1.63 0.421 0.609 0.645 0.88 1.2 1.44
Tellerium Dissolved mg/L 1 100 <0.05 <0.05 0.025 NA NA 0.025 0.025 0.025 0.025 0.025 Tellerium Total mg/L 1 100 <0.05 <0.05 0.025 NA NA 0.025 0.025 0.025 0.025 0.025 Thallium Dissolved mg/L 4 100 <0.00001 <0.03 0.00375 0.0157 0.0075 0.000005 0.000005 0.000005 0.00375 0.0128 Thallium Total mg/L 4 100 <0.00001 <0.03 0.00375 0.0157 0.0075 0.000005 0.000005 0.000005 0.00375 0.0128
Tin Dissolved mg/L 4 100 <0.0001 <0.02 0.00254 0.0105 0.00498 0.00005 0.00005 0.00005 0.00254 0.00851 Tin Total mg/L 4 100 <0.0001 <0.02 0.00254 0.0105 0.00498 0.00005 0.00005 0.00005 0.00254 0.00851
Titanium Dissolved mg/L 4 100 <0.003 <0.01 0.00412 0.00691 0.00175 0.00202 0.00412 0.005 0.005 0.005 Titanium Total mg/L 4 75 0.004 <0.01 0.00475 0.00555 0.0005 0.00415 0.00475 0.005 0.005 0.005 Uranium Dissolved mg/L 3 0 0.000126 0.00076 0.00045 0.00124 0.000317 0.00016 0.000296 0.000465 0.000612 0.00073 Uranium Total mg/L 3 0 0.00014 0.000876 0.000496 0.00141 0.000369 0.000173 0.000306 0.000471 0.000674 0.000836
Vanadium Dissolved mg/L 4 100 <0.001 <0.005 0.001 0.00259 0.001 0.0005 0.0005 0.0005 0.001 0.0022 Vanadium Total mg/L 4 100 <0.001 <0.005 0.001 0.00259 0.001 0.0005 0.0005 0.0005 0.001 0.0022
Zinc Dissolved mg/L 4 25 0.0017 0.0155 0.00852 0.0204 0.00744 0.00182 0.0023 0.00845 0.0147 0.0153 Zinc Total mg/L 4 25 <0.005 0.134 0.0501 0.143 0.0584 0.00523 0.0162 0.0319 0.0658 0.12
Zirconium Dissolved mg/L 1 100 <0.005 <0.005 0.0025 NA NA 0.0025 0.0025 0.0025 0.0025 0.0025 Zirconium Total mg/L 1 100 <0.005 <0.005 0.0025 NA NA 0.0025 0.0025 0.0025 0.0025 0.0025
Nutrients Ammonia Dissolved mg N/L 1 0 0.011 0.011 0.011 NA NA 0.011 0.011 0.011 0.011 0.011
Nitrate Dissolved mg N/L 2 50 <0.005 0.01 0.00625 0.0539 0.0053 0.00288 0.00438 0.00625 0.00812 0.00962 Nitrite + Nitrate Dissolved mg N/L 2 0 0.006 0.016 0.011 0.0745 0.00707 0.0065 0.0085 0.011 0.0135 0.0155 Total Dissolved
Phosphorus Dissolved mg/L 4 100 <0.05 <0.1 0.0312 0.0511 0.0125 0.025 0.025 0.025 0.0312 0.0462
Other
CN Total mg/L 101 54.5 <0.005 0.022 0.00571 0.00652 0.00409 0.0025 0.0025 0.0025 0.0089 0.013 Cyanide (WAD) Dissolved mg/L 33 72.7 <0.005 0.01 0.00333 0.00391 0.00161 0.0025 0.0025 0.0025 0.005 0.005

TABLE 2: SUMMARY OF THE WATER QUALITY DATA COMPILED TO ESTIMATE BACKGROUND WATER QUALITY CONDITIONS
- 26 -
Francois Lake Conventionals
Colour Total Col 20 15 <5 15 6.88 8.71 3.93 2.5 5 5 7 15 pH Total pH 10 0 5.96 7.8 7.36 7.89 0.737 5.96 7.64 7.7 7.73 7.77
TOC Total mg/L 10 0 5.7 6.9 6.03 6.31 0.386 5.7 5.8 5.9 6.07 6.72 TSS Total mg/L 27 100 <4 <5 2.31 2.41 0.246 2 2 2.5 2.5 2.5
Turbidity Total NTU 29 6.9 <0.05 0.8 0.298 0.362 0.167 0.047 0.19 0.3 0.42 0.488 Hardness Total mg/L 75 0 20 41.2 35.3 36 3.34 32.1 33.5 34.6 38 40
Major Ions Bromide Dissolved mg/L 9 100 <0.05 <0.05 0.025 NA 0 0.025 0.025 0.025 0.025 0.025 Chloride Dissolved mg/L 20 5 0.322 0.9 0.503 0.579 0.163 0.318 0.387 0.455 0.6 0.71 Fluoride Dissolved mg/L 20 0 0.04 0.07 0.051 0.0536 0.00553 0.0495 0.05 0.05 0.05 0.0605 Sulphate Dissolved mg/L 20 0 3.8 6.1 4.81 5.15 0.72 3.9 4.38 4.65 5.52 6 Specific
Conductivity Total µS/cm 20 0 2 99 76.8 89.1 26.1 2 81.8 84 86.5 93.3
TDS Dissolved mg/L 10 0 66 80 70.2 73 3.94 66 68.5 70 70 76.4
Metals Aluminum Dissolved mg/L 29 31 0.0023 1 0.0629 0.14 0.202 0.00234 0.0042 0.0071 0.025 0.31 Aluminum Total mg/L 29 34.5 0.0034 <0.06 0.021 0.0263 0.0138 0.00376 0.0085 0.0231 0.03 0.0448 Antimony Dissolved mg/L 29 58.6 <0.000005 <1 0.0414 0.0899 0.128 0.0000025 0.00005 0.00005 0.025 0.31 Antimony Total mg/L 29 55.2 <0.000005 <0.06 0.0104 0.0159 0.0145 0.0000025 0.00004 0.00007 0.03 0.03
Arsenic Dissolved mg/L 37 48.6 0.0001 <1 0.0326 0.0705 0.114 0.0001 0.00025 0.00027 0.025 0.12 Arsenic Total mg/L 37 43.2 <0.0001 <0.06 0.00831 0.0128 0.0134 0.00009 0.00025 0.0003 0.03 0.03 Barium Dissolved mg/L 29 3.45 0.0124 0.06 0.016 0.0192 0.00853 0.013 0.014 0.0144 0.015 0.0166 Barium Total mg/L 29 0 0.013 0.021 0.0149 0.0156 0.00184 0.013 0.0133 0.015 0.016 0.018
Beryllium Dissolved mg/L 29 100 <0.000002 <0.03 0.00117 0.00263 0.00384 0.000001 0.000005 0.000005 0.0005 0.0092 Beryllium Total mg/L 29 100 <0.000002 <0.001 0.000175 0.000266 0.00024 0.000001 0.000005 0.000005 0.0005 0.0005 Bismuth Dissolved mg/L 19 94.7 <0.000005 0.00011 0.0000105 0.0000223 0.0000243 0.0000025 0.0000025 0.0000025 0.00001 0.00002 Bismuth Total mg/L 19 94.7 <0.000005 0.00044 0.0000279 0.000076 0.0000999 0.0000025 0.0000025 0.0000025 0.00001 0.000053 Boron Dissolved mg/L 29 93.1 <0.002 0.9 0.0637 0.138 0.195 0.001 0.005 0.005 0.025 0.37

TABLE 2: SUMMARY OF THE WATER QUALITY DATA COMPILED TO ESTIMATE BACKGROUND WATER QUALITY CONDITIONS
- 27 -
Boron Total mg/L 29 96.6 <0.002 <0.05 0.0123 0.0165 0.0109 0.001 0.005 0.005 0.025 0.025 Metals (cont.)
Cadmium Dissolved mg/L 37 73 <0.000005 <0.1 0.00327 0.00706 0.0114 0.0000025 0.000005 0.00004 0.0025 0.012 Cadmium Total mg/L 37 62.2 <0.000005 <0.006 0.000854 0.0013 0.00133 0.0000025 0.000006 0.00005 0.003 0.003 Calcium Dissolved mg/L 35 0 8 11.9 10 10.4 0.918 8.97 9.4 9.9 10.8 11.5 Calcium Total mg/L 23 0 8.8 11.5 10.1 10.4 0.749 8.93 9.55 10 10.8 11.2
Chromium Dissolved mg/L 29 82.8 <0.0001 <0.1 0.00433 0.00916 0.0127 0.00005 0.00005 0.0002 0.0025 0.0314 Chromium Total mg/L 29 55.2 <0.0001 0.017 0.00254 0.00412 0.00417 0.00005 0.00005 0.0002 0.003 0.0096
Cobalt Dissolved mg/L 29 34.5 0.000009 <0.1 0.00415 0.009 0.0127 0.00001 0.000014 0.000017 0.0025 0.031 Cobalt Total mg/L 29 31 <0.000005 0.006 0.00125 0.00197 0.00187 0.000007 0.000011 0.00003 0.003 0.0048 Copper Dissolved mg/L 29 34.5 0.00056 <0.1 0.00464 0.00943 0.0126 0.000618 0.0007 0.00087 0.0025 0.031 Copper Total mg/L 29 34.5 0.00057 <0.006 0.00165 0.00205 0.00105 0.0006 0.00074 0.00113 0.003 0.003
Iron Dissolved mg/L 29 20.7 <0.005 <0.1 0.0177 0.0239 0.0162 0.0025 0.006 0.012 0.023 0.0524 Iron Total mg/L 29 0 0.007 0.111 0.0333 0.0437 0.0272 0.0074 0.016 0.024 0.043 0.0944 Lead Dissolved mg/L 37 62.2 <0.000005 <1 0.0325 0.0704 0.114 0.0000025 0.000012 0.00015 0.025 0.12 Lead Total mg/L 37 37.8 <0.000005 0.09 0.0101 0.0163 0.0186 0.000005 0.000022 0.0003 0.03 0.03
Lithium Dissolved mg/L 19 15.8 0.00016 0.0006 0.000375 0.000457 0.000172 0.00016 0.000235 0.00028 0.0005 0.0006 Lithium Total mg/L 19 31.6 0.00014 0.0007 0.000329 0.000413 0.000174 0.000176 0.000215 0.00025 0.0005 0.00061
Magnesium Dissolved mg/L 35 5.71 2.18 3 2.5 2.61 0.313 1.98 2.42 2.5 2.65 2.86 Magnesium Total mg/L 23 0 2.24 2.9 2.54 2.62 0.172 2.3 2.44 2.5 2.6 2.89 Manganese Dissolved mg/L 29 3.45 0.00014 0.04 0.00367 0.00705 0.00887 0.00017 0.00049 0.001 0.002 0.0199 Manganese Total mg/L 29 3.45 0.00001 0.00888 0.00273 0.00356 0.00218 0.000352 0.001 0.0022 0.0032 0.00721
Molybdenum Dissolved mg/L 29 34.5 0.0029 <0.3 0.0161 0.0302 0.0372 0.003 0.005 0.00601 0.007 0.0952 Molybdenum Total mg/L 29 34.5 0.0029 0.0143 0.00616 0.00718 0.00266 0.00298 0.005 0.005 0.00638 0.0123
Nickel Dissolved mg/L 29 34.5 0.0003 <0.5 0.0203 0.0445 0.0638 0.000324 0.00035 0.00056 0.01 0.154 Nickel Total mg/L 29 34.5 0.00032 <0.02 0.00379 0.00553 0.00459 0.000358 0.00047 0.00063 0.01 0.01
Phosphorus Total mg/L 46 41.3 <0.002 <0.1 0.022 0.0285 0.0217 0.004 0.00525 0.006 0.05 0.05 Potassium Dissolved mg/L 35 5.71 0.66 <3 0.824 0.886 0.18 0.687 0.745 0.8 0.81 1.09 Potassium Total mg/L 23 0 0.7 0.9 0.793 0.826 0.0771 0.7 0.7 0.8 0.865 0.9 Selenium Dissolved mg/L 37 70.3 <0.00004 <1 0.0333 0.0712 0.114 0.00002 0.00005 0.0001 0.025 0.14 Selenium Total mg/L 37 62.2 <0.00004 0.09 0.0099 0.0161 0.0187 0.00004 0.00005 0.0001 0.03 0.03
Silicon Dissolved mg/L 29 0 1 2.31 1.56 1.67 0.282 1.28 1.4 1.53 1.64 2.14 Silicon Total mg/L 29 0 1.21 2.3 1.56 1.66 0.265 1.3 1.38 1.46 1.69 2.11 Silver Dissolved mg/L 29 96.6 <0.000005 <0.3 0.0117 0.0263 0.0384 0.0000025 0.0000025 0.00001 0.005 0.092

TABLE 2: SUMMARY OF THE WATER QUALITY DATA COMPILED TO ESTIMATE BACKGROUND WATER QUALITY CONDITIONS
- 28 -
Metals (cont.) Silver Total mg/L 29 96.6 <0.000005 <0.01 0.00173 0.00265 0.00242 0.0000025 0.0000025 0.00001 0.005 0.005
Sodium Dissolved mg/L 35 5.71 2.72 3.8 3.11 3.26 0.453 2.35 3.09 3.12 3.36 3.52 Sodium Total mg/L 23 0 2.7 3.44 3.07 3.17 0.225 2.71 2.9 3.1 3.25 3.39
Strontium Dissolved mg/L 29 0 0.07 0.106 0.0853 0.0884 0.00804 0.076 0.079 0.0838 0.09 0.0992 Strontium Total mg/L 29 0 0.075 0.102 0.0861 0.0889 0.00723 0.0764 0.0802 0.0857 0.091 0.0996
Sulfur Dissolved mg/L 28 64.3 1.26 3380 217 527 799 1.28 1.5 1.5 1.5 1740 Sulfur Total mg/L 16 37.5 1.28 <3 1.47 1.53 0.112 1.28 1.41 1.5 1.5 1.62
Thallium Dissolved mg/L 19 84.2 <0.000002 0.000005 0.00000137 0.00000186 0.00000101 0.000001 0.000001 0.000001 0.000001 0.0000032 Thallium Total mg/L 19 100 <0.000002 <0.000002 0.000001 NA 0 0.000001 0.000001 0.000001 0.000001 0.000001
Tin Dissolved mg/L 29 37.9 <0.00001 <1 0.0414 0.0899 0.128 0.00002 0.00002 0.00006 0.025 0.31 Tin Total mg/L 29 34.5 0.00002 <0.06 0.0104 0.0159 0.0145 0.00002 0.00003 0.00016 0.03 0.03
Titanium Dissolved mg/L 29 58.6 <0.0005 <0.05 0.00279 0.00516 0.00623 0.00025 0.0008 0.001 0.001 0.017 Titanium Total mg/L 29 58.6 <0.0005 0.005 0.00136 0.0018 0.00117 0.00025 0.0008 0.001 0.0015 0.0036 Uranium Dissolved mg/L 19 0 0.00003 0.000079 0.0000555 0.0000612 0.0000119 0.000039 0.0000485 0.000055 0.00006 0.0000754 Uranium Total mg/L 19 0 0.00003 0.000077 0.0000575 0.0000629 0.0000111 0.000039 0.000055 0.000057 0.00006 0.0000734
Vanadium Dissolved mg/L 29 62.1 <0.0002 <0.3 0.0119 0.0265 0.0383 0.0001 0.0001 0.0003 0.005 0.092 Vanadium Total mg/L 29 72.4 <0.0002 <0.01 0.00187 0.00275 0.00232 0.0001 0.0001 0.00028 0.005 0.005
Zinc Dissolved mg/L 29 24.1 <0.0001 0.05 0.00442 0.00832 0.0102 0.00014 0.0004 0.001 0.0029 0.0214 Zinc Total mg/L 29 20.7 0.0002 0.012 0.00169 0.00256 0.0023 0.000212 0.0005 0.001 0.0019 0.00406
Nutrients
Ammonia Dissolved mg N/L 22 63.6 <0.002 0.013 0.00432 0.00587 0.00349 0.00107 0.0025 0.0025 0.00475 0.0118 Nitrate Dissolved mg N/L 20 0 0.002 0.067 0.0496 0.057 0.0159 0.0258 0.0418 0.0525 0.063 0.066
Nitrite + Nitrate Dissolved mg N/L 61 49.2 <0.002 0.07 0.0329 0.04 0.0275 0.001 0.0025 0.034 0.061 0.07 Orthophosphat
e Dissolved mg P/L 19 47.4 0.001 <0.05 0.0126 0.0184 0.0121 0.001 0.001 0.003 0.025 0.025
Total Dissolved Phosphorus
Dissolved mg/L 27 63 0.003 <3 0.141 0.296 0.392 0.0033 0.0045 0.05 0.05 1.06
Total Kjeldahl Nitrogen
Total mg/L 11 0 0.12 0.17 0.142 0.155 0.0194 0.12 0.13 0.13 0.16 0.17
Total Nitrogen Total mg/L 30 3.33 <0.02 0.32 0.222 0.248 0.0679 0.093 0.2 0.235 0.265 0.306 Total Organic Nitrogen
Total mg/L 11 0 0.12 0.17 0.142 0.155 0.0194 0.12 0.13 0.13 0.16 0.17
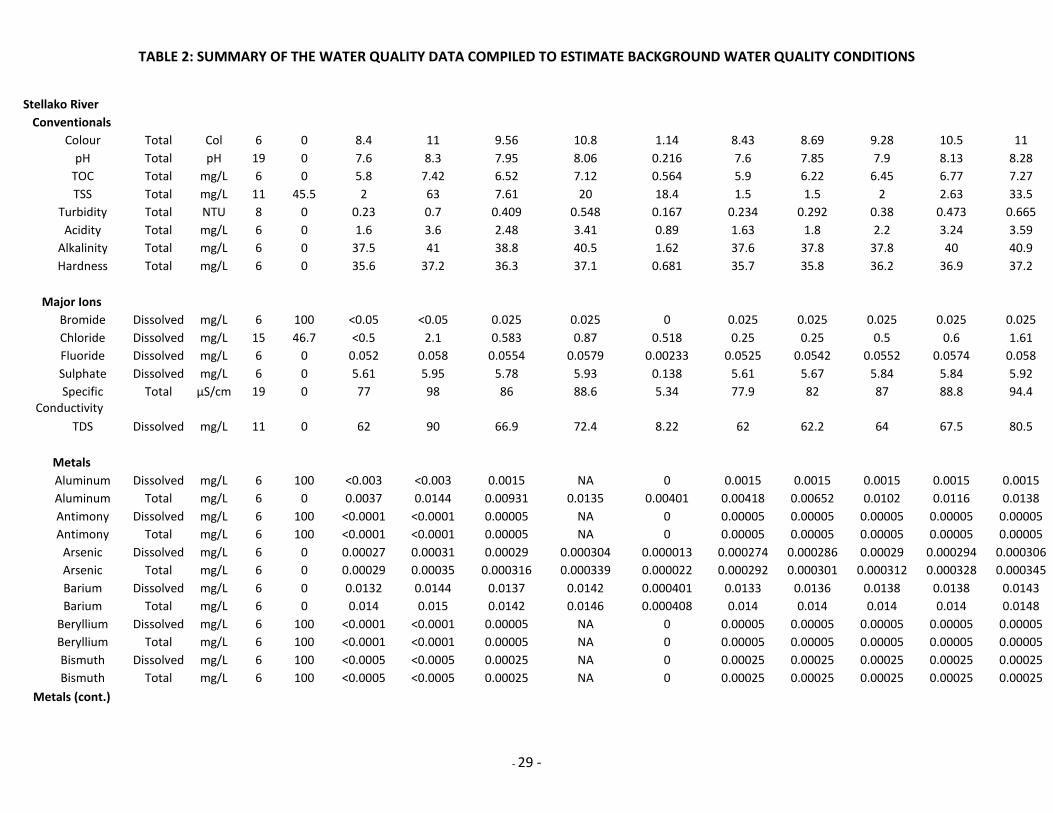
TABLE 2: SUMMARY OF THE WATER QUALITY DATA COMPILED TO ESTIMATE BACKGROUND WATER QUALITY CONDITIONS
- 29 -
Stellako River Conventionals
Colour Total Col 6 0 8.4 11 9.56 10.8 1.14 8.43 8.69 9.28 10.5 11 pH Total pH 19 0 7.6 8.3 7.95 8.06 0.216 7.6 7.85 7.9 8.13 8.28
TOC Total mg/L 6 0 5.8 7.42 6.52 7.12 0.564 5.9 6.22 6.45 6.77 7.27 TSS Total mg/L 11 45.5 2 63 7.61 20 18.4 1.5 1.5 2 2.63 33.5
Turbidity Total NTU 8 0 0.23 0.7 0.409 0.548 0.167 0.234 0.292 0.38 0.473 0.665 Acidity Total mg/L 6 0 1.6 3.6 2.48 3.41 0.89 1.63 1.8 2.2 3.24 3.59
Alkalinity Total mg/L 6 0 37.5 41 38.8 40.5 1.62 37.6 37.8 37.8 40 40.9 Hardness Total mg/L 6 0 35.6 37.2 36.3 37.1 0.681 35.7 35.8 36.2 36.9 37.2
Major Ions Bromide Dissolved mg/L 6 100 <0.05 <0.05 0.025 0.025 0 0.025 0.025 0.025 0.025 0.025 Chloride Dissolved mg/L 15 46.7 <0.5 2.1 0.583 0.87 0.518 0.25 0.25 0.5 0.6 1.61 Fluoride Dissolved mg/L 6 0 0.052 0.058 0.0554 0.0579 0.00233 0.0525 0.0542 0.0552 0.0574 0.058 Sulphate Dissolved mg/L 6 0 5.61 5.95 5.78 5.93 0.138 5.61 5.67 5.84 5.84 5.92 Specific
Conductivity Total µS/cm 19 0 77 98 86 88.6 5.34 77.9 82 87 88.8 94.4
TDS Dissolved mg/L 11 0 62 90 66.9 72.4 8.22 62 62.2 64 67.5 80.5
Metals Aluminum Dissolved mg/L 6 100 <0.003 <0.003 0.0015 NA 0 0.0015 0.0015 0.0015 0.0015 0.0015 Aluminum Total mg/L 6 0 0.0037 0.0144 0.00931 0.0135 0.00401 0.00418 0.00652 0.0102 0.0116 0.0138 Antimony Dissolved mg/L 6 100 <0.0001 <0.0001 0.00005 NA 0 0.00005 0.00005 0.00005 0.00005 0.00005 Antimony Total mg/L 6 100 <0.0001 <0.0001 0.00005 NA 0 0.00005 0.00005 0.00005 0.00005 0.00005
Arsenic Dissolved mg/L 6 0 0.00027 0.00031 0.00029 0.000304 0.000013 0.000274 0.000286 0.00029 0.000294 0.000306 Arsenic Total mg/L 6 0 0.00029 0.00035 0.000316 0.000339 0.000022 0.000292 0.000301 0.000312 0.000328 0.000345 Barium Dissolved mg/L 6 0 0.0132 0.0144 0.0137 0.0142 0.000401 0.0133 0.0136 0.0138 0.0138 0.0143 Barium Total mg/L 6 0 0.014 0.015 0.0142 0.0146 0.000408 0.014 0.014 0.014 0.014 0.0148
Beryllium Dissolved mg/L 6 100 <0.0001 <0.0001 0.00005 NA 0 0.00005 0.00005 0.00005 0.00005 0.00005 Beryllium Total mg/L 6 100 <0.0001 <0.0001 0.00005 NA 0 0.00005 0.00005 0.00005 0.00005 0.00005 Bismuth Dissolved mg/L 6 100 <0.0005 <0.0005 0.00025 NA 0 0.00025 0.00025 0.00025 0.00025 0.00025 Bismuth Total mg/L 6 100 <0.0005 <0.0005 0.00025 NA 0 0.00025 0.00025 0.00025 0.00025 0.00025
Metals (cont.)

TABLE 2: SUMMARY OF THE WATER QUALITY DATA COMPILED TO ESTIMATE BACKGROUND WATER QUALITY CONDITIONS
- 30 -
Boron Dissolved mg/L 6 100 <0.01 <0.01 0.005 NA 0 0.005 0.005 0.005 0.005 0.005 Boron Total mg/L 6 100 <0.01 <0.01 0.005 NA 0 0.005 0.005 0.005 0.005 0.005
Cadmium Dissolved mg/L 6 100 <0.00001 <0.00001 0.000005 NA 0 0.000005 0.000005 0.000005 0.000005 0.000005 Cadmium Total mg/L 6 100 <0.00001 <0.00001 0.000005 NA 0 0.000005 0.000005 0.000005 0.000005 0.000005 Calcium Dissolved mg/L 6 0 10 10.6 10.3 10.6 0.223 10 10.2 10.3 10.5 10.6 Calcium Total mg/L 6 0 10.2 11 10.6 10.9 0.291 10.3 10.4 10.6 10.8 11
Chromium Dissolved mg/L 6 33.3 <0.0001 0.00014 0.0001 0.000142 0.0000404 0.00005 0.0000638 0.000115 0.000129 0.000138 Chromium Total mg/L 6 16.7 <0.0001 0.00019 0.00014 0.00019 0.0000472 0.0000725 0.000142 0.000152 0.000155 0.000181
Cobalt Dissolved mg/L 6 100 <0.0001 <0.0001 0.00005 NA 0 0.00005 0.00005 0.00005 0.00005 0.00005 Cobalt Total mg/L 6 100 <0.0001 <0.0001 0.00005 NA 0 0.00005 0.00005 0.00005 0.00005 0.00005 Copper Dissolved mg/L 6 0 0.0006 0.0007 0.000675 0.000717 0.0000397 0.000615 0.000669 0.000695 0.000699 0.0007 Copper Total mg/L 6 0 0.00079 0.00087 0.000822 0.000852 0.0000282 0.000792 0.000804 0.000822 0.00083 0.00086
Iron Dissolved mg/L 6 100 <0.03 <0.03 0.015 NA 0 0.015 0.015 0.015 0.015 0.015 Iron Total mg/L 6 100 <0.03 <0.03 0.015 NA 0 0.015 0.015 0.015 0.015 0.015 Lead Dissolved mg/L 6 100 <0.00005 <0.00005 0.000025 NA 0 0.000025 0.000025 0.000025 0.000025 0.000025 Lead Total mg/L 6 100 <0.00005 <0.00005 0.000025 NA 0 0.000025 0.000025 0.000025 0.000025 0.000025
Lithium Dissolved mg/L 6 16.7 0.00045 0.00066 0.000534 0.0007 0.000158 0.0003 0.000488 0.000603 0.000631 0.000655 Lithium Total mg/L 6 0 0.00051 0.00085 0.000629 0.000752 0.000117 0.000525 0.000578 0.0006 0.000634 0.000799
Magnesium Dissolved mg/L 6 0 2.47 2.61 2.56 2.63 0.0598 2.48 2.53 2.6 2.61 2.61 Magnesium Total mg/L 6 0 2.52 2.68 2.62 2.69 0.0608 2.54 2.6 2.64 2.66 2.68 Manganese Dissolved mg/L 6 0 0.0001 0.00039 0.000197 0.000309 0.000107 0.000106 0.000134 0.00016 0.000224 0.000354 Manganese Total mg/L 6 0 0.00127 0.00198 0.00164 0.00196 0.000308 0.00127 0.00136 0.00171 0.00186 0.00195
Mercury Dissolved mg/L 6 100 <0.00001 <0.00001 0.000005 NA 0 0.000005 0.000005 0.000005 0.000005 0.000005 Mercury Total mg/L 6 100 <0.00001 <0.00001 0.000005 NA 0 0.000005 0.000005 0.000005 0.000005 0.000005
Molybdenum Dissolved mg/L 6 0 0.00915 0.0111 0.00992 0.0107 0.000742 0.00921 0.00945 0.00965 0.0104 0.0109 Molybdenum Total mg/L 6 0 0.0096 0.0114 0.0103 0.0111 0.000753 0.00962 0.00975 0.01 0.0108 0.0113
Nickel Dissolved mg/L 6 100 <0.0005 <0.0005 0.00025 NA 0 0.00025 0.00025 0.00025 0.00025 0.00025 Nickel Total mg/L 6 100 <0.0005 <0.0005 0.00025 NA 0 0.00025 0.00025 0.00025 0.00025 0.00025
Phosphorus Dissolved mg/L 6 100 <0.3 <0.3 0.15 NA 0 0.15 0.15 0.15 0.15 0.15 Phosphorus Total mg/L 19 31.6 0.006 <0.3 0.0581 0.0904 0.0669 0.0069 0.0075 0.012 0.15 0.15 Potassium Dissolved mg/L 6 0 0.782 0.821 0.803 0.82 0.0166 0.783 0.789 0.804 0.817 0.821 Potassium Total mg/L 6 0 0.8 0.844 0.815 0.834 0.0182 0.801 0.804 0.806 0.825 0.841
Metals (cont.) Selenium Dissolved mg/L 6 100 <0.0001 <0.0001 0.00005 NA 0 0.00005 0.00005 0.00005 0.00005 0.00005

TABLE 2: SUMMARY OF THE WATER QUALITY DATA COMPILED TO ESTIMATE BACKGROUND WATER QUALITY CONDITIONS
- 31 -
Selenium Total mg/L 6 100 <0.0001 <0.0001 0.00005 NA 0 0.00005 0.00005 0.00005 0.00005 0.00005 Silicon Dissolved mg/L 6 0 0.97 1.06 1.02 1.06 0.0339 0.978 1 1.03 1.05 1.06 Silicon Total mg/L 6 0 0.98 1.13 1.07 1.13 0.057 0.99 1.04 1.08 1.1 1.12 Silver Dissolved mg/L 6 100 <0.00001 <0.00001 0.000005 NA 0 0.000005 0.000005 0.000005 0.000005 0.000005 Silver Total mg/L 6 100 <0.00001 <0.00001 0.000005 NA 0 0.000005 0.000005 0.000005 0.000005 0.000005
Sodium Dissolved mg/L 6 0 3.35 3.8 3.53 3.74 0.194 3.36 3.4 3.45 3.69 3.79 Sodium Total mg/L 6 0 3.4 3.9 3.69 3.91 0.211 3.42 3.54 3.72 3.88 3.9
Strontium Dissolved mg/L 6 0 0.091 0.0975 0.0954 0.098 0.0025 0.0918 0.0945 0.0965 0.097 0.0974 Strontium Total mg/L 6 0 0.0956 0.105 0.0992 0.103 0.00338 0.0958 0.0969 0.099 0.1 0.104 Thallium Dissolved mg/L 6 100 <0.00001 <0.00001 0.000005 NA 0 0.000005 0.000005 0.000005 0.000005 0.000005 Thallium Total mg/L 6 100 <0.00001 <0.00001 0.000005 NA 0 0.000005 0.000005 0.000005 0.000005 0.000005
Tin Dissolved mg/L 6 100 <0.0001 <0.0001 0.00005 NA 0 0.00005 0.00005 0.00005 0.00005 0.00005 Tin Total mg/L 6 100 <0.0001 <0.0001 0.00005 NA 0 0.00005 0.00005 0.00005 0.00005 0.00005
Titanium Dissolved mg/L 6 100 <0.01 <0.01 0.005 NA 0 0.005 0.005 0.005 0.005 0.005 Titanium Total mg/L 6 100 <0.01 <0.01 0.005 NA 0 0.005 0.005 0.005 0.005 0.005 Uranium Dissolved mg/L 6 0 0.000066 0.000079 0.0000712 0.0000767 0.00000526 0.0000665 0.0000681 0.0000687 0.0000746 0.0000784 Uranium Total mg/L 6 0 0.000072 0.0000815 0.0000757 0.0000795 0.00000368 0.000072 0.0000726 0.0000752 0.0000775 0.0000806
Vanadium Dissolved mg/L 6 100 <0.001 <0.001 0.0005 NA 0 0.0005 0.0005 0.0005 0.0005 0.0005 Vanadium Total mg/L 6 100 <0.001 <0.001 0.0005 NA 0 0.0005 0.0005 0.0005 0.0005 0.0005
Zinc Dissolved mg/L 6 83.3 0.0023 <0.003 0.00163 0.00198 0.000327 0.0015 0.0015 0.0015 0.0015 0.0021 Zinc Total mg/L 6 100 <0.003 <0.003 0.0015 NA 0 0.0015 0.0015 0.0015 0.0015 0.0015
Nutrients
Ammonia Dissolved mg N/L 20 60 <0.005 0.012 0.00418 0.00538 0.00256 0.0025 0.0025 0.0025 0.00526 0.00811 Nitrate Dissolved mg N/L 16 68.8 <0.005 0.04 0.0135 0.0201 0.0123 0.0025 0.00812 0.01 0.0123 0.04 Nitrite Dissolved mg N/L 25 76 <0.001 <0.005 0.00171 0.00208 0.000905 0.0005 0.001 0.0025 0.0025 0.0025
Nitrite + Nitrate Dissolved mg N/L 18 50 0.009 0.04 0.0198 0.0264 0.0132 0.00985 0.01 0.01 0.03 0.04 Orthophosphat
e Dissolved mg P/L 24 70.8 <0.001 0.006 0.0016 0.00218 0.00136 0.0005 0.0005 0.0015 0.0015 0.004
Total Dissolved Phosphorus
Dissolved mg/L 13 0 0.003 0.017 0.00685 0.00895 0.00348 0.0036 0.005 0.007 0.007 0.0122
Nutrients (cont.)

TABLE 2: SUMMARY OF THE WATER QUALITY DATA COMPILED TO ESTIMATE BACKGROUND WATER QUALITY CONDITIONS
- 32 -
Total Kjeldahl Nitrogen
Total mg/L 19 0 0.11 0.3 0.206 0.226 0.043 0.164 0.185 0.2 0.224 0.282
Total Nitrogen Total mg/L 9 0 0.11 0.28 0.206 0.242 0.0472 0.138 0.19 0.21 0.22 0.268 Total Organic Nitrogen
Total mg/L 10 0 0.11 0.29 0.202 0.239 0.0518 0.137 0.172 0.195 0.22 0.281
Total Phosphorus
Total mg/L 6 0 0.00335 0.00545 0.00492 0.00577 0.000814 0.00369 0.00485 0.0053 0.00538 0.00544
Other
Chlorophyll a Total mg/L 1 0 0.001 0.001 0.001 NA NA 0.001 0.001 0.001 0.001 0.001 Fecal Coliforms Total MPN 1 0 2 2 2 NA NA 2 2 2 2 2
Col = colour; MPN = most probable number; N = nitrogen; NA = not applicable; NTU = nephelometric turbidity units; P = phosphorus; TDS = total dissolved solids; TOC = total organic carbon; TSS = total suspended solids; WAD = weak acid dissociable.

TABLE 3: SUMMARY OF THE WATER QUALITY DATA COMPILED TO ESTIMATE REFERENCE WATER QUALITY CONDITIONS USING DATA FOR THE BABINE RIVER
- 33 -
Water Body / Group / Chemical
Fraction Units Count % Non-Detect
Minimum Maximum Mean Upper Confidence
Limit
Standard Deviation
Percentiles
5th 25th 50th 75th 95th
Babine River Conventionals
Colour Total Col 2 0 16 17.5 16.8 26.3 1.06 16.1 16.4 16.8 17.1 17.4 pH Total pH 2 0 7.98 8.07 8.02 8.6 0.0636 7.98 8 8.02 8.05 8.07
TOC Total mg/L 2 0 6.12 7.43 6.78 15.1 0.926 6.19 6.45 6.78 7.1 7.36 TSS Total mg/L 2 100 <3 <3 1.5 NA 0 1.5 1.5 1.5 1.5 1.5
Turbidity Total NTU 2 0 0.6 0.78 0.69 1.83 0.127 0.609 0.645 0.69 0.735 0.771 Acidity Total mg/L 2 0 2.3 4 3.15 14 1.2 2.38 2.72 3.15 3.58 3.92
Alkalinity Total mg/L 2 0 39 39.7 39.4 43.8 0.495 39 39.2 39.4 39.5 39.7 Hardness Total mg/L 2 0 40.1 40.4 40.2 42.2 0.212 40.1 40.2 40.2 40.3 40.4
Major Ions Bromide Dissolved mg/L 2 100 <0.05 <0.05 0.025 0.025 0 0.025 0.025 0.025 0.025 0.025 Chloride Dissolved mg/L 2 100 <0.5 <0.5 0.25 NA 0 0.25 0.25 0.25 0.25 0.25 Fluoride Dissolved mg/L 2 0 0.037 0.044 0.0405 0.085 0.00495 0.0373 0.0387 0.0405 0.0422 0.0436 Sulphate Dissolved mg/L 2 0 4.27 4.58 4.42 6.39 0.219 4.29 4.35 4.42 4.5 4.56 Specific
Conductivity Total µS/cm 2 0 84.5 88.4 86.4 111 2.76 84.7 85.5 86.4 87.4 88.2
TDS Dissolved mg/L 2 0 63 66 64.5 83.6 2.12 63.2 63.8 64.5 65.2 65.8
Metals Aluminum Dissolved mg/L 2 0 0.0064 0.0074 0.0069 0.0133 0.000707 0.00645 0.00665 0.0069 0.00715 0.00735 Aluminum Total mg/L 2 0 0.0258 0.0286 0.0272 0.045 0.00198 0.0259 0.0265 0.0272 0.0279 0.0285 Antimony Dissolved mg/L 2 100 <0.0001 <0.0001 0.00005 NA 0 0.00005 0.00005 0.00005 0.00005 0.00005 Antimony Total mg/L 2 100 <0.0001 <0.0001 0.00005 NA 0 0.00005 0.00005 0.00005 0.00005 0.00005
Arsenic Dissolved mg/L 2 0 0.00029 0.0003 0.000295 0.000359 0.00000707 0.00029 0.000292 0.000295 0.000298 0.0003 Arsenic Total mg/L 2 0 0.00031 0.00033 0.00032 0.000447 0.0000141 0.000311 0.000315 0.00032 0.000325 0.000329 Barium Dissolved mg/L 2 0 0.0183 0.0197 0.019 0.0279 0.00099 0.0184 0.0186 0.019 0.0194 0.0196

TABLE 3: SUMMARY OF THE WATER QUALITY DATA COMPILED TO ESTIMATE REFERENCE WATER QUALITY CONDITIONS USING DATA FOR THE BABINE RIVER
- 34 -
Barium Total mg/L 2 0 0.019 0.02 0.0195 0.0259 0.000707 0.019 0.0192 0.0195 0.0198 0.02 Beryllium Dissolved mg/L 2 100 <0.0001 <0.0001 0.00005 NA 0 0.00005 0.00005 0.00005 0.00005 0.00005 Beryllium Total mg/L 2 100 <0.0001 <0.0001 0.00005 NA 0 0.00005 0.00005 0.00005 0.00005 0.00005 Bismuth Dissolved mg/L 2 100 <0.0005 <0.0005 0.00025 NA 0 0.00025 0.00025 0.00025 0.00025 0.00025
Metals (cont.) Bismuth Total mg/L 2 100 <0.0005 <0.0005 0.00025 NA 0 0.00025 0.00025 0.00025 0.00025 0.00025 Boron Dissolved mg/L 2 100 <0.01 <0.01 0.005 NA 0 0.005 0.005 0.005 0.005 0.005 Boron Total mg/L 2 100 <0.01 <0.01 0.005 NA 0 0.005 0.005 0.005 0.005 0.005
Cadmium Dissolved mg/L 2 100 <0.00001 <0.00001 0.000005 NA 0 0.000005 0.000005 0.000005 0.000005 0.000005 Cadmium Total mg/L 2 100 <0.00001 <0.00001 0.000005 NA 0 0.000005 0.000005 0.000005 0.000005 0.000005 Calcium Dissolved mg/L 2 0 11.2 11.7 11.4 14.6 0.354 11.2 11.3 11.4 11.6 11.7 Calcium Total mg/L 2 0 12 12.2 12.1 13.4 0.141 12 12 12.1 12.1 12.2
Chromium Dissolved mg/L 2 0 0.00016 0.00018 0.00017 0.000297 0.0000141 0.000161 0.000165 0.00017 0.000175 0.000179 Chromium Total mg/L 2 0 0.00017 0.00019 0.00018 0.000307 0.0000141 0.000171 0.000175 0.00018 0.000185 0.000189
Cobalt Dissolved mg/L 2 100 <0.0001 <0.0001 0.00005 NA 0 0.00005 0.00005 0.00005 0.00005 0.00005 Cobalt Total mg/L 2 100 <0.0001 <0.0001 0.00005 NA 0 0.00005 0.00005 0.00005 0.00005 0.00005 Copper Dissolved mg/L 2 0 0.00149 0.00156 0.00152 0.00197 0.0000495 0.00149 0.00151 0.00152 0.00154 0.00156 Copper Total mg/L 2 0 0.00172 0.00182 0.00177 0.00241 0.0000707 0.00172 0.00174 0.00177 0.0018 0.00182
Iron Dissolved mg/L 2 0 0.036 0.048 0.042 0.118 0.00849 0.0366 0.039 0.042 0.045 0.0474 Iron Total mg/L 2 0 0.067 0.112 0.0895 0.375 0.0318 0.0693 0.0782 0.0895 0.101 0.11 Lead Dissolved mg/L 2 100 <0.00005 <0.00005 0.000025 NA 0 0.000025 0.000025 0.000025 0.000025 0.000025 Lead Total mg/L 2 100 <0.00005 <0.00005 0.000025 NA 0 0.000025 0.000025 0.000025 0.000025 0.000025
Lithium Dissolved mg/L 2 100 <0.0005 <0.0005 0.00025 NA 0 0.00025 0.00025 0.00025 0.00025 0.00025 Lithium Total mg/L 2 100 <0.0005 <0.0005 0.00025 NA 0 0.00025 0.00025 0.00025 0.00025 0.00025
Magnesium Dissolved mg/L 2 0 2.71 2.96 2.84 4.42 0.177 2.72 2.77 2.84 2.9 2.95 Magnesium Total mg/L 2 0 2.84 2.87 2.86 3.05 0.0212 2.84 2.85 2.86 2.86 2.87 Manganese Dissolved mg/L 2 0 0.00023 0.00061 0.00042 0.00283 0.000269 0.000249 0.000325 0.00042 0.000515 0.000591 Manganese Total mg/L 2 0 0.00686 0.00888 0.00787 0.0207 0.00143 0.00696 0.00736 0.00787 0.00838 0.00878
Mercury Dissolved mg/L 2 100 <0.00001 <0.00001 0.000005 NA 0 0.000005 0.000005 0.000005 0.000005 0.000005 Mercury Total mg/L 2 100 <0.00001 <0.00001 0.000005 NA 0 0.000005 0.000005 0.000005 0.000005 0.000005
Molybdenum Dissolved mg/L 2 0 0.0005 0.0005 0.0005 NA 0 0.0005 0.0005 0.0005 0.0005 0.0005 Molybdenum Total mg/L 2 0 0.0006 0.0006 0.0006 NA 0 0.0006 0.0006 0.0006 0.0006 0.0006
Nickel Dissolved mg/L 2 50 <0.0005 0.0005 0.000375 0.00196 0.000177 0.000263 0.000312 0.000375 0.000438 0.000488

TABLE 3: SUMMARY OF THE WATER QUALITY DATA COMPILED TO ESTIMATE REFERENCE WATER QUALITY CONDITIONS USING DATA FOR THE BABINE RIVER
- 35 -
Nickel Total mg/L 2 50 <0.0005 0.00051 0.00038 0.00203 0.000184 0.000263 0.000315 0.00038 0.000445 0.000497 Phosphorus Dissolved mg/L 2 100 <0.3 <0.3 0.15 NA 0 0.15 0.15 0.15 0.15 0.15 Phosphorus Total mg/L 2 100 <0.3 <0.3 0.15 NA 0 0.15 0.15 0.15 0.15 0.15
Metals (cont.) Potassium Dissolved mg/L 2 0 0.515 0.561 0.538 0.83 0.0325 0.517 0.526 0.538 0.55 0.559 Potassium Total mg/L 2 0 0.532 0.536 0.534 0.559 0.00283 0.532 0.533 0.534 0.535 0.536 Selenium Dissolved mg/L 2 100 <0.0001 <0.0001 0.00005 NA 0 0.00005 0.00005 0.00005 0.00005 0.00005 Selenium Total mg/L 2 100 <0.0001 <0.0001 0.00005 NA 0 0.00005 0.00005 0.00005 0.00005 0.00005
Silicon Dissolved mg/L 2 0 1.73 1.83 1.78 2.42 0.0707 1.74 1.76 1.78 1.81 1.82 Silicon Total mg/L 2 0 1.81 1.92 1.86 2.56 0.0778 1.82 1.84 1.86 1.89 1.91 Silver Dissolved mg/L 2 100 <0.00001 <0.00001 0.000005 NA 0 0.000005 0.000005 0.000005 0.000005 0.000005 Silver Total mg/L 2 100 <0.00001 <0.00001 0.000005 NA 0 0.000005 0.000005 0.000005 0.000005 0.000005
Sodium Dissolved mg/L 2 0 2.1 2.4 2.25 4.16 0.212 2.12 2.18 2.25 2.32 2.38 Sodium Total mg/L 2 0 2.3 2.4 2.35 2.99 0.0707 2.3 2.32 2.35 2.38 2.4
Strontium Dissolved mg/L 2 0 0.07 0.071 0.0705 0.0769 0.000707 0.07 0.0703 0.0705 0.0707 0.071 Strontium Total mg/L 2 0 0.0732 0.0776 0.0754 0.103 0.00311 0.0734 0.0743 0.0754 0.0765 0.0774 Thallium Dissolved mg/L 2 100 <0.00001 <0.00001 0.000005 NA 0 0.000005 0.000005 0.000005 0.000005 0.000005 Thallium Total mg/L 2 100 <0.00001 <0.00001 0.000005 NA 0 0.000005 0.000005 0.000005 0.000005 0.000005
Tin Dissolved mg/L 2 100 <0.0001 <0.0001 0.00005 NA 0 0.00005 0.00005 0.00005 0.00005 0.00005 Tin Total mg/L 2 100 <0.0001 <0.0001 0.00005 NA 0 0.00005 0.00005 0.00005 0.00005 0.00005
Titanium Dissolved mg/L 2 100 <0.01 <0.01 0.005 NA 0 0.005 0.005 0.005 0.005 0.005 Titanium Total mg/L 2 100 <0.01 <0.01 0.005 NA 0 0.005 0.005 0.005 0.005 0.005 Uranium Dissolved mg/L 2 0 0.000025 0.000027 0.000026 0.0000387 0.00000141 0.0000251 0.0000255 0.000026 0.0000265 0.0000269 Uranium Total mg/L 2 0 0.000027 0.000029 0.000028 0.0000407 0.00000141 0.0000271 0.0000275 0.000028 0.0000285 0.0000289
Vanadium Dissolved mg/L 2 100 <0.001 <0.001 0.0005 NA 0 0.0005 0.0005 0.0005 0.0005 0.0005 Vanadium Total mg/L 2 100 <0.001 <0.001 0.0005 NA 0 0.0005 0.0005 0.0005 0.0005 0.0005
Zinc Dissolved mg/L 2 100 <0.003 <0.003 0.0015 NA 0 0.0015 0.0015 0.0015 0.0015 0.0015 Zinc Total mg/L 2 100 <0.003 <0.003 0.0015 NA 0 0.0015 0.0015 0.0015 0.0015 0.0015
Nutrients
Ammonia Dissolved mg N/L 2 0 0.0101 0.011 0.0106 0.0163 0.000636 0.0101 0.0103 0.0106 0.0108 0.011 Nitrate Dissolved mg N/L 2 0 0.0339 0.0379 0.0359 0.0613 0.00283 0.0341 0.0349 0.0359 0.0369 0.0377 Nitrite Dissolved mg N/L 2 100 <0.001 <0.001 0.0005 NA 0 0.0005 0.0005 0.0005 0.0005 0.0005
Orthophosphate Dissolved mg P/L 2 100 <0.001 <0.001 0.0005 NA 0 0.0005 0.0005 0.0005 0.0005 0.0005

TABLE 3: SUMMARY OF THE WATER QUALITY DATA COMPILED TO ESTIMATE REFERENCE WATER QUALITY CONDITIONS USING DATA FOR THE BABINE RIVER
- 36 -
Nutrients (cont.)
Total Kjeldahl Nitrogen
Total mg/L 2 0 0.232 0.247 0.24 0.335 0.0106 0.233 0.236 0.24 0.243 0.246
Total Phosphorus Total mg/L 2 0 0.0074 0.0075 0.00745 0.00809 0.0000707 0.0074 0.00742 0.00745 0.00748 0.0075 Col = colour; N = nitrogen; NA = not applicable; NTU = nephelometric turbidity units; P = phosphorus; TDS = total dissolved solids; TOC = total organic carbon; TSS = total suspended solids.
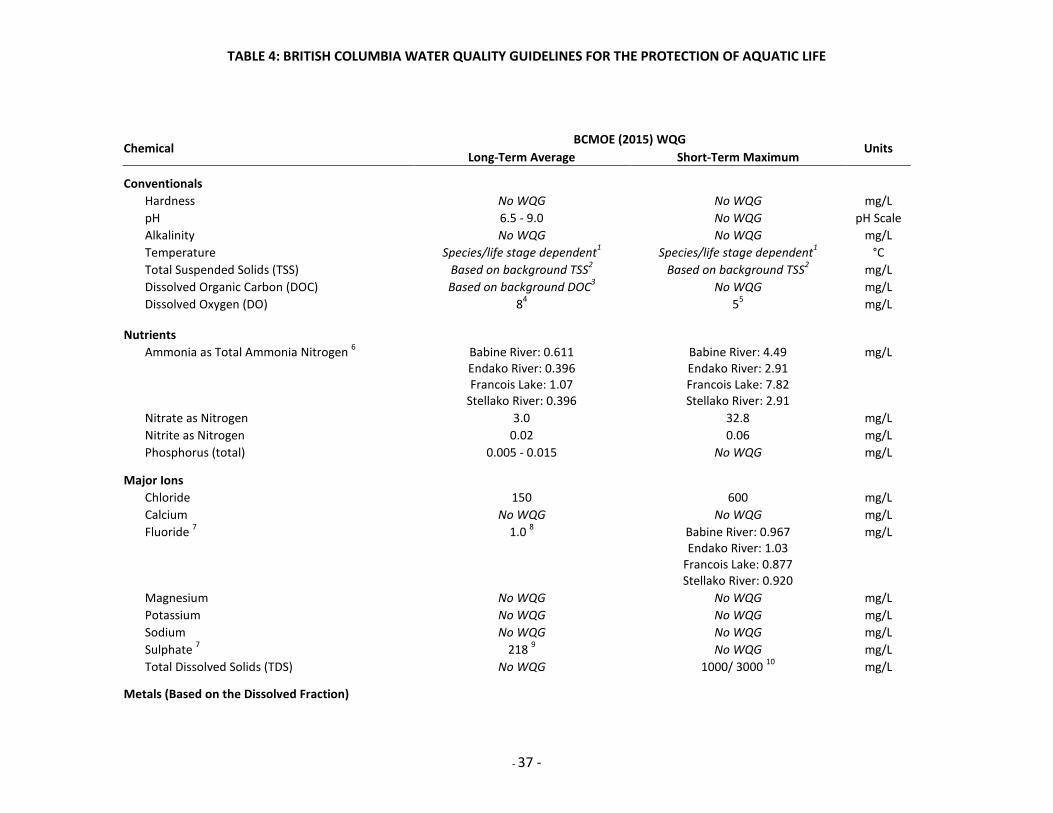
TABLE 4: BRITISH COLUMBIA WATER QUALITY GUIDELINES FOR THE PROTECTION OF AQUATIC LIFE
- 37 -
Chemical BCMOE (2015) WQG
Units Long-Term Average Short-Term Maximum
Conventionals Hardness No WQG No WQG mg/L
pH 6.5 - 9.0 No WQG pH Scale Alkalinity No WQG No WQG mg/L Temperature Species/life stage dependent1 Species/life stage dependent1 °C Total Suspended Solids (TSS) Based on background TSS2 Based on background TSS2 mg/L Dissolved Organic Carbon (DOC) Based on background DOC3 No WQG mg/L Dissolved Oxygen (DO) 84 55 mg/L
Nutrients Ammonia as Total Ammonia Nitrogen 6 Babine River: 0.611
Endako River: 0.396 Francois Lake: 1.07
Stellako River: 0.396
Babine River: 4.49 Endako River: 2.91 Francois Lake: 7.82 Stellako River: 2.91
mg/L
Nitrate as Nitrogen 3.0 32.8 mg/L Nitrite as Nitrogen 0.02 0.06 mg/L Phosphorus (total) 0.005 - 0.015 No WQG mg/L
Major Ions Chloride 150 600 mg/L
Calcium No WQG No WQG mg/L Fluoride 7 1.0 8 Babine River: 0.967
Endako River: 1.03 Francois Lake: 0.877 Stellako River: 0.920
mg/L
Magnesium No WQG No WQG mg/L Potassium No WQG No WQG mg/L Sodium No WQG No WQG mg/L Sulphate 7 218 9 No WQG mg/L Total Dissolved Solids (TDS) No WQG 1000/ 3000 10 mg/L
Metals (Based on the Dissolved Fraction)

TABLE 4: BRITISH COLUMBIA WATER QUALITY GUIDELINES FOR THE PROTECTION OF AQUATIC LIFE
- 38 -
Aluminum 50 11 100 11 µg/L Arsenic 5 No WQG µg/L Cadmium 7 Babine River: 0.0151
Endako River: 0.0173 Francois Lake: 0.0125 Stellako River: 0.0137
No WQG µg/L
Chromium (III) 8.9 No WQG µg/L Chromium (VI) 1 No WQG µg/L Copper 7 2 Babine River: 5.77
Endako River: 6.43 Francois Lake: 5.02 Stellako River: 5.36
µg/L
Lead 7 Babine River: 4.31 Endako River: 4.53 Francois Lake: 4.06 Stellako River: 4.17
Babine River: 25.5 Endako River: 31.3 Francois Lake: 19.2 Stellako River: 22.0
µg/L
Mercury (Inorganic) 0.00125 - 0.02 12 No WQG µg/L Molybdenum 1000 50 / 2000 13 µg/L Nickel 7 25 14 No WQG µg/L Selenium 2 No WQG µg/L Silver 7 0.05 15 0.1 15 µg/L Vanadium 6 No WQG µg/L Zinc 7 7.5 16 33 16 µg/L
BCMOE = British Columbia Ministry of Environment; DO = dissolved oxygen; DOC = dissolved organic carbon; TDS = total dissolved solids; TSS = total suspended solids; WQG = water quality guideline. 1 The water quality guidelines vary according to the species and life stage present in the water body. See BCMOE (2015) for details at: http://www.env.gov.bc.ca/wat/wq/BCguidelines/temptech/temperature.html. 2 The WQG is based on background TSS concentration; see the explanation from BCMOE (2015) at the following link: http://www.env.gov.bc.ca/wat/wq/BCguidelines/turbidity/turbidity.html. 3 The WQG is equal to the 30-day median ± 20% of the median background concentration (BCMOE 2015). 4 This is the 30-day mean minimum value for all life stages other than buried embryo/alevin. Buried embryo/alevin life stages require a minimum of 11 mg/L oxygen in the water column and 8 mg/L oxygen in the interstitial water (BCMOE 2015). 5 This is the instantaneous minimum for all life stages other than buried embryo/alevin. Buried embryo/alevin life stages require a minimum of 9 mg/L oxygen in the water column and 6 mg/L oxygen in the interstitial water (BCMOE 2015). 6 WQG at a temperature of 20°C and the 95th percentile pH of the water body (Babine River = 8.07, Endako River = 8.27, Francois Lake = 7.77, Stellako River = 8.28). See Tables 3 and 4 in the Overview Report under "Nitrogen - nitrate, nitrite, ammonia" at the following BCMOE (2015) link to determine the short-term and long-term WQGs, respectively, at other temperature and pH combinations: http://www.env.gov.bc.ca/wat/wq/wq_guidelines.html.
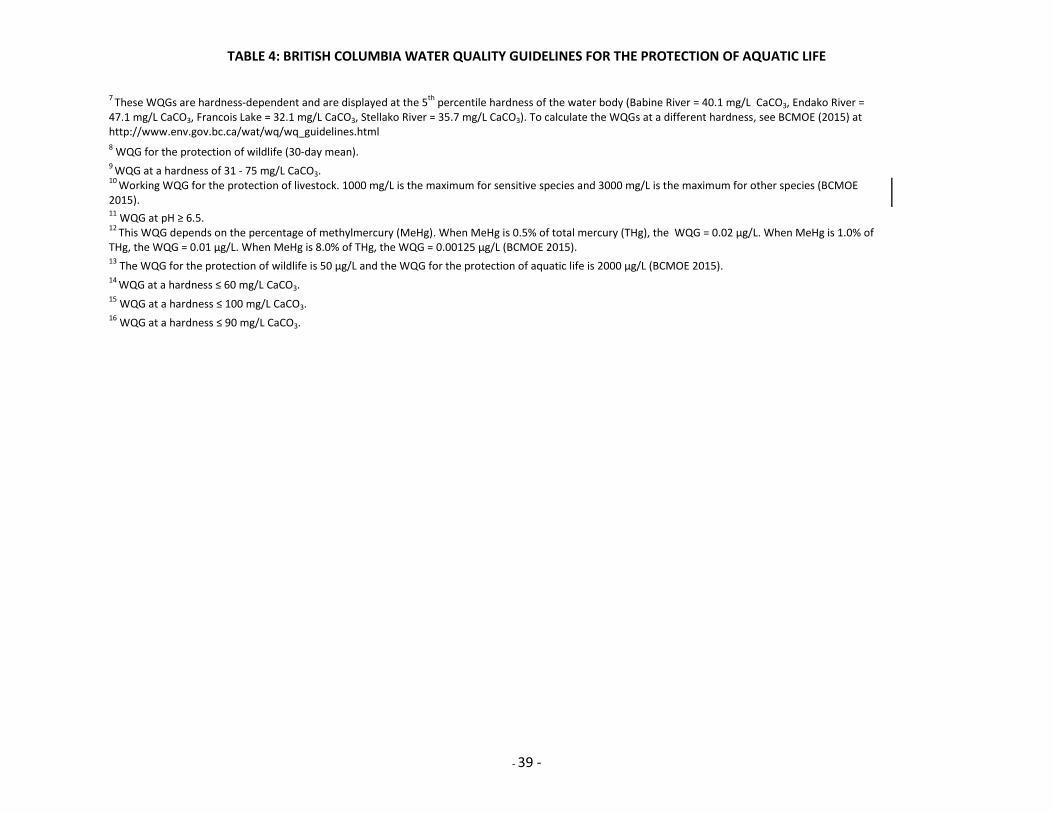
TABLE 4: BRITISH COLUMBIA WATER QUALITY GUIDELINES FOR THE PROTECTION OF AQUATIC LIFE
- 39 -
7 These WQGs are hardness-dependent and are displayed at the 5th percentile hardness of the water body (Babine River = 40.1 mg/L CaCO3, Endako River = 47.1 mg/L CaCO3, Francois Lake = 32.1 mg/L CaCO3, Stellako River = 35.7 mg/L CaCO3). To calculate the WQGs at a different hardness, see BCMOE (2015) at http://www.env.gov.bc.ca/wat/wq/wq_guidelines.html 8 WQG for the protection of wildlife (30-day mean). 9 WQG at a hardness of 31 - 75 mg/L CaCO3. 10 Working WQG for the protection of livestock. 1000 mg/L is the maximum for sensitive species and 3000 mg/L is the maximum for other species (BCMOE 2015). 11 WQG at pH ≥ 6.5. 12 This WQG depends on the percentage of methylmercury (MeHg). When MeHg is 0.5% of total mercury (THg), the WQG = 0.02 µg/L. When MeHg is 1.0% of THg, the WQG = 0.01 µg/L. When MeHg is 8.0% of THg, the WQG = 0.00125 µg/L (BCMOE 2015). 13 The WQG for the protection of wildlife is 50 µg/L and the WQG for the protection of aquatic life is 2000 µg/L (BCMOE 2015). 14 WQG at a hardness ≤ 60 mg/L CaCO3. 15 WQG at a hardness ≤ 100 mg/L CaCO3. 16 WQG at a hardness ≤ 90 mg/L CaCO3.

TABLE 5: CCME WATER QUALITY GUIDELINES FOR THE PROTECTION OF AQUATIC LIFE
- 40 -
Chemical CCME (2015a) WQG
Units Long-Term Average Short-Term Maximum
Conventionals
Hardness No WQG No WQG mg/L pH 6.5 - 9.0 No WQG pH Scale Alkalinity No WQG No WQG mg/L Temperature Narrative statement1 Narrative statement1 °C
Total Suspended Solids (TSS) Based on background TSS2 Based on background TSS2 mg/L Dissolved Organic Carbon (DOC) No WQG No WQG mg/L
Dissolved Oxygen (DO) Species/life stage dependent3 No WQG mg/L
Nutrients Ammonia as Total Ammonia Nitrogen 4 Babine River: 0.141
Endako River: 0.141 Francois Lake: 0.410 Stellako River: 0.141
No WQG mg/L
Nitrate as Nitrogen 3.0 124 mg/L Nitrite as Nitrogen 0.06 No WQG mg/L Phosphorus (total) Narrative statement5 No WQG mg/L
Major Ions Chloride 120 640 mg/L
Calcium No WQG No WQG mg/L Fluoride 0.12 No WQG mg/L Magnesium No WQG No WQG mg/L Potassium No WQG No WQG mg/L Sodium No WQG No WQG mg/L Sulphate No WQG No WQG mg/L
Total Dissolved Solids (TDS) No WQG 3000 6 mg/L
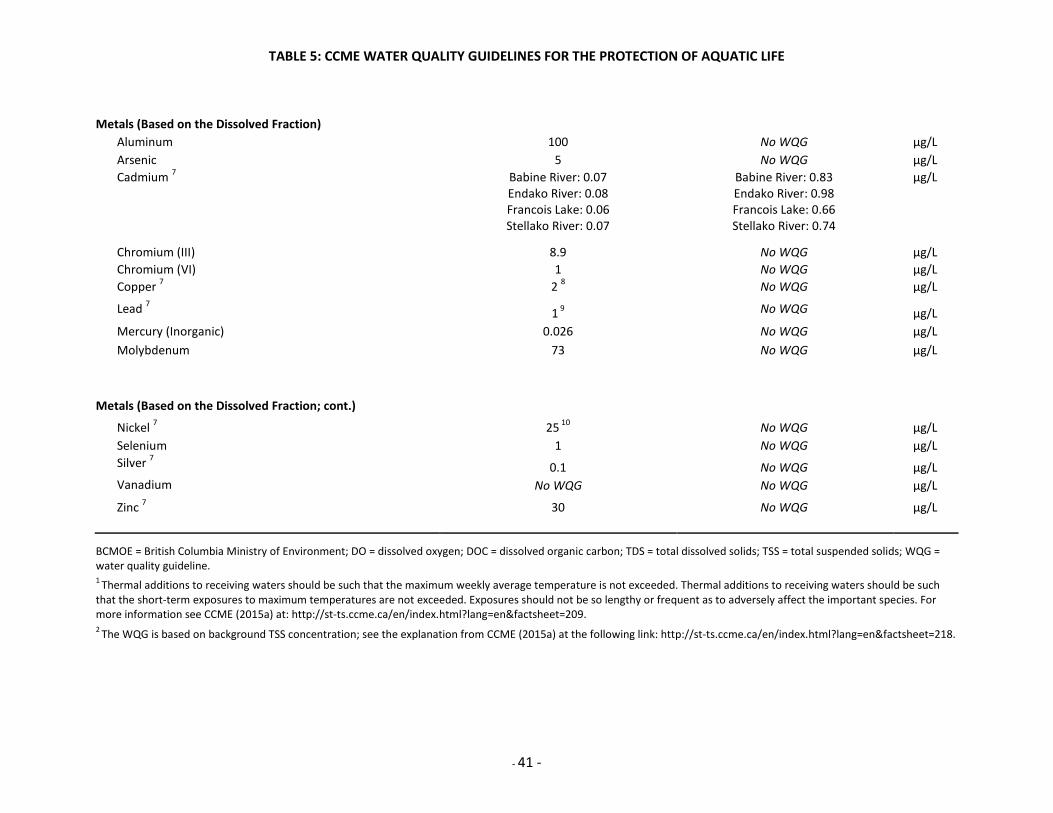
TABLE 5: CCME WATER QUALITY GUIDELINES FOR THE PROTECTION OF AQUATIC LIFE
- 41 -
Metals (Based on the Dissolved Fraction) Aluminum 100 No WQG µg/L
Arsenic 5 No WQG µg/L Cadmium 7 Babine River: 0.07
Endako River: 0.08 Francois Lake: 0.06 Stellako River: 0.07
Babine River: 0.83 Endako River: 0.98 Francois Lake: 0.66 Stellako River: 0.74
µg/L
Chromium (III) 8.9 No WQG µg/L Chromium (VI) 1 No WQG µg/L Copper 7 2 8 No WQG µg/L
Lead 7 1 9 No WQG µg/L Mercury (Inorganic) 0.026 No WQG µg/L Molybdenum 73 No WQG µg/L
Metals (Based on the Dissolved Fraction; cont.)
Nickel 7 25 10 No WQG µg/L Selenium 1 No WQG µg/L Silver 7 0.1 No WQG µg/L Vanadium No WQG No WQG µg/L
Zinc 7 30 No WQG µg/L
BCMOE = British Columbia Ministry of Environment; DO = dissolved oxygen; DOC = dissolved organic carbon; TDS = total dissolved solids; TSS = total suspended solids; WQG = water quality guideline. 1 Thermal additions to receiving waters should be such that the maximum weekly average temperature is not exceeded. Thermal additions to receiving waters should be such that the short-term exposures to maximum temperatures are not exceeded. Exposures should not be so lengthy or frequent as to adversely affect the important species. For more information see CCME (2015a) at: http://st-ts.ccme.ca/en/index.html?lang=en&factsheet=209. 2 The WQG is based on background TSS concentration; see the explanation from CCME (2015a) at the following link: http://st-ts.ccme.ca/en/index.html?lang=en&factsheet=218.

TABLE 5: CCME WATER QUALITY GUIDELINES FOR THE PROTECTION OF AQUATIC LIFE
- 42 -
3 Lowest acceptable dissolved oxygen concentration: for warm water biota: early life stages = 6 mg/L for warm water biota: other life stages = 5.5 mg/L for cold water biota: early life stages = 9.5 mg/L for cold water biota: other life stages = 6.5 mg/L (CCME 2015a).
4 WQG at a temperature of 20°C and the 95th percentile pH of the water body (Babine River = 8.07, Endako River = 8.27, Francois Lake = 7.77, Stellako River = 8.28). See CCME (2015a) at the following link to determine the WQG at other temperature and pH combinations: http://st-ts.ccme.ca/en/index.html?lang=en&factsheet=5. 5 CCME (2015a) provides trigger ranges for total phosphorus depending on the nutrient status of the water body. See the following link for details: http://st-ts.ccme.ca/en/index.html?lang=en&factsheet=167. 6 WQG for the protection of livestock (CCME 2015b). 7 These WQGs are hardness-dependent and are displayed at the 5th percentile hardness of the water body (Babine River = 40.1 mg/L CaCO3, Endako River = 47.1 mg/L CaCO3, Francois Lake = 32.1 mg/L CaCO3, Stellako River = 35.7 mg/L CaCO3). To calculate the WQGs at a different hardness, see CCME (2015a) at http://st-ts.ccme.ca/en/index.html?chems=all&chapters=1. 8 WQG at a hardness ≤ 82 mg/L CaCO3.
9 WQG at a hardness ≤ 60 mg/L CaCO3.
10 WQG at a hardness ≤ 60 mg/L CaCO3.

TABLE 6: LISTING OF PRELIMINARY WATER QUALITY STANDARDS FOR CLASS III WATERS
- 43 -
Chemical Water Quality Standard
Units Long-Term Average Short-Term Maximum
Conventionals Hardness No WQS No WQS mg/L pH 6.5 - 9.0 No WQS pH Scale Alkalinity No WQS No WQS mg/L
Temperature Species/life stage dependent1
Species/life stage dependent1 °C
Total Suspended Solids (TSS) Based on background TSS2 Based on background TSS2 mg/L
Dissolved Organic Carbon (DOC) Based on background DOC3 No WQS mg/L
Dissolved Oxygen (DO) 84 55 mg/L
Nutrients
Ammonia as Total Ammonia Nitrogen 6
Babine River: 0.141 Endako River: 0.141 Francois Lake: 0.410 Stellako River: 0.141
Babine River: 4.49 Endako River: 2.91 Francois Lake: 7.82 Stellako River: 2.91
mg/L
Nitrate as Nitrogen 3.0 32.8 mg/L Nitrite as Nitrogen 0.02 0.06 mg/L Phosphorus (total) 0.005 - 0.015 No WQS mg/L
Major Ions
Chloride 120 600 mg/L Calcium No WQS No WQS mg/L
Fluoride 7 0.12
Babine River: 0.967 Endako River: 1.03 Francois Lake: 0.877 Stellako River: 0.920
mg/L

TABLE 6: LISTING OF PRELIMINARY WATER QUALITY STANDARDS FOR CLASS III WATERS
- 44 -
Magnesium No WQS No WQS mg/L Potassium No WQS No WQS mg/L Sodium No WQS No WQS mg/L Sulphate 7 218 8 No WQS mg/L
Total Dissolved Solids (TDS) No WQS 1000/ 3000 9 mg/L
Metals (Based on the Dissolved Fraction)
Aluminum 50 10 100 10 µg/L Arsenic 5 No WQS µg/L
Cadmium 7
Babine River: 0.0151 Endako River: 0.0173 Francois Lake: 0.0125 Stellako River: 0.0137
Babine River: 0.83 Endako River: 0.98 Francois Lake: 0.66 Stellako River: 0.74
µg/L
Chromium (III) 8.9 No WQS µg/L Chromium (VI) 1 No WQS µg/L
Metals (Based on the Dissolved Fraction; cont.)
Copper 7 2 11
Babine River: 5.77 Endako River: 6.43 Francois Lake: 5.02 Stellako River: 5.36
µg/L
Lead 7 1 12
Babine River: 25.5 Endako River: 31.3 Francois Lake: 19.2 Stellako River: 22.0
µg/L
Mercury (Inorganic) 0.00125 - 0.02 13 No WQS µg/L
Molybdenum 73 50 / 2000 14 µg/L
Nickel 7 25 15 No WQS µg/L Selenium 1 No WQS µg/L Silver 7 0.05 16 0.1 16 µg/L Vanadium 6 No WQS µg/L Zinc 7 7.5 17 33 17 µg/L
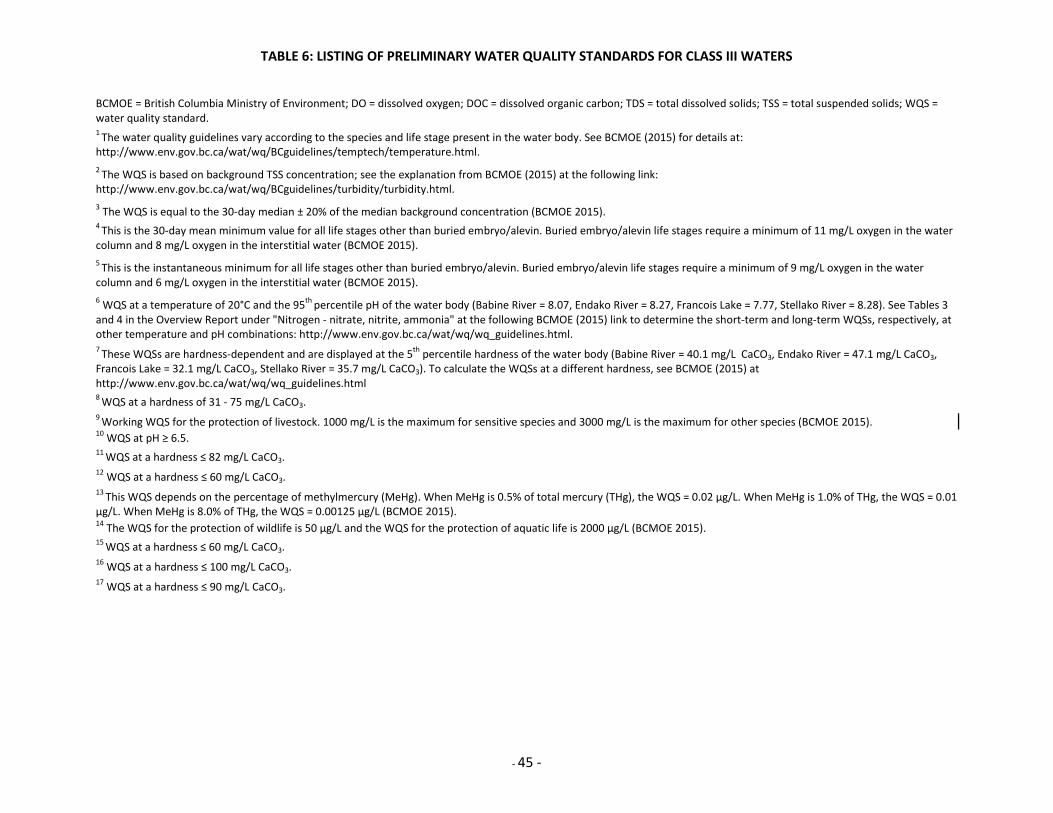
TABLE 6: LISTING OF PRELIMINARY WATER QUALITY STANDARDS FOR CLASS III WATERS
- 45 -
BCMOE = British Columbia Ministry of Environment; DO = dissolved oxygen; DOC = dissolved organic carbon; TDS = total dissolved solids; TSS = total suspended solids; WQS = water quality standard. 1 The water quality guidelines vary according to the species and life stage present in the water body. See BCMOE (2015) for details at: http://www.env.gov.bc.ca/wat/wq/BCguidelines/temptech/temperature.html. 2 The WQS is based on background TSS concentration; see the explanation from BCMOE (2015) at the following link: http://www.env.gov.bc.ca/wat/wq/BCguidelines/turbidity/turbidity.html. 3 The WQS is equal to the 30-day median ± 20% of the median background concentration (BCMOE 2015). 4 This is the 30-day mean minimum value for all life stages other than buried embryo/alevin. Buried embryo/alevin life stages require a minimum of 11 mg/L oxygen in the water column and 8 mg/L oxygen in the interstitial water (BCMOE 2015). 5 This is the instantaneous minimum for all life stages other than buried embryo/alevin. Buried embryo/alevin life stages require a minimum of 9 mg/L oxygen in the water column and 6 mg/L oxygen in the interstitial water (BCMOE 2015). 6 WQS at a temperature of 20°C and the 95th percentile pH of the water body (Babine River = 8.07, Endako River = 8.27, Francois Lake = 7.77, Stellako River = 8.28). See Tables 3 and 4 in the Overview Report under "Nitrogen - nitrate, nitrite, ammonia" at the following BCMOE (2015) link to determine the short-term and long-term WQSs, respectively, at other temperature and pH combinations: http://www.env.gov.bc.ca/wat/wq/wq_guidelines.html. 7 These WQSs are hardness-dependent and are displayed at the 5th percentile hardness of the water body (Babine River = 40.1 mg/L CaCO3, Endako River = 47.1 mg/L CaCO3, Francois Lake = 32.1 mg/L CaCO3, Stellako River = 35.7 mg/L CaCO3). To calculate the WQSs at a different hardness, see BCMOE (2015) at http://www.env.gov.bc.ca/wat/wq/wq_guidelines.html 8 WQS at a hardness of 31 - 75 mg/L CaCO3. 9 Working WQS for the protection of livestock. 1000 mg/L is the maximum for sensitive species and 3000 mg/L is the maximum for other species (BCMOE 2015). 10 WQS at pH ≥ 6.5. 11 WQS at a hardness ≤ 82 mg/L CaCO3. 12 WQS at a hardness ≤ 60 mg/L CaCO3. 13 This WQS depends on the percentage of methylmercury (MeHg). When MeHg is 0.5% of total mercury (THg), the WQS = 0.02 µg/L. When MeHg is 1.0% of THg, the WQS = 0.01 µg/L. When MeHg is 8.0% of THg, the WQS = 0.00125 µg/L (BCMOE 2015). 14 The WQS for the protection of wildlife is 50 µg/L and the WQS for the protection of aquatic life is 2000 µg/L (BCMOE 2015). 15 WQS at a hardness ≤ 60 mg/L CaCO3. 16 WQS at a hardness ≤ 100 mg/L CaCO3. 17 WQS at a hardness ≤ 90 mg/L CaCO3.