you drink & drive. you lose. campaign august 1 - september
TRANSCRIPT

TECHNICAL REPORT January 2008
Evaluation of the 2007 Labor Day
You Drink & Drive. You Lose. Campaign
August 1 - September 18, 2007
For more information please contact: Illinois Department of Transportation
Division of Traffic Safety Evaluation Unit
3215 Executive Park Drive P.O. Box 19245
Springfield, Illinois 62794

Illinois Department of Transportation Division of Traffic Safety
Evaluation Unit
The Evaluation Unit within the Division of Traffic Safety in the Illinois Department of Transportation focuses on evaluation and monitoring of various highway safety projects and programs in Illinois. The Evaluation Unit conducts research and analyses that enhance the safety and efficiency of transportation by understanding the human factors that are important to transportation programs in Illinois. The main functions of the Unit include the following: 1. Develop an in-depth analysis of motor vehicle related fatalities and injuries in Illinois using
several crash related databases (Crash data, FARS, Trauma Registry, and Hospital data, state and local police data).
2. Develop measurable long term and short term goals and objectives for the Highway Safety Program in Illinois using historical crash related databases.
3. Evaluate each highway safety project with an enforcement component (e.g., Traffic Law Enforcement Program, Local Alcohol Program, IMaGE and MAP projects) using crash and citation data provided by local and state police departments.
4. Evaluate several highway safety programs (e.g., Occupant Protection and Alcohol). This involves evaluating the effects of public policy and intervention programs that promote safe driving.
5. Design and conduct annual observational safety belt and child safety seat surveys for Illinois. This survey is based on a multi-stage random selection of Interstate Highways, US/IL Highways, and several local and residential streets.
6. Provide results of research and evaluation as well as annual enforcement activities to the National Highway Traffic Safety Administration (NHTSA) as part of the Federal Requirements of State Highway Safety Program in Illinois.
7. Provide statistical consultation to other Sections at the Division of Traffic Safety and other Divisions at IDOT.
8. Publish results of all research and evaluation at the Division and place them as PDF files at IDOT’s Website.
Using statewide public opinion survey of Illinois licensed drivers, this report evaluates the impact the “You Drink & Drive. You Lose” (a highly visible, massive enforcement effort designed to detect violators of Illinois traffic laws with special emphasis on alcohol) on drinking and driving issues during the August 2007 mobilization in Illinois. The main alcohol issues include self-reported belt use, motorists’ opinion and awareness of the existing local and state alcohol enforcement programs, such as roadside safety checks, drunken driving laws, and alcohol related media programs and slogans. The report was compiled and prepared by the Evaluation staff. Comments or questions may be addressed to Mehdi Nassirpour, Ph.D., Chief of Evaluation Unit, Bureau of Administrative Services, Division of Traffic Safety, Illinois Department of Transportation, 3215 Executive Park Drive, Springfield, Illinois 62794-9245.

Table of Contents Executive Summary ......................................................................................................... i
Introduction .................................................................................................................... 1
You Drink & Drive. You Lose. Program Model.................................................................. 1
Alcohol / Motor Vehicle Related Injuries and Fatalities..................................................... 2
Report Objectives ............................................................................................................ 4
2007 Labor Day You Drink & Drive. You Lose. Campaign in Illinois: Timeline of Activities ........................................................................................................ 5 Media & Enforcement Results ....................................................................................... 7 Media ............................................................................................................................... 8 Earned Media............................................................................................................... 8 Paid Media .................................................................................................................. 9 Enforcement ................................................................................................................... 10 Illinois State Police.................................................................................................... 10 Local Police Agencies............................................................................................... 11 Non-Funded Earned Enforcement ............................................................................ 11 Cost / Effectiveness Analysis of YDDYL Enforcement Activities .................................... 15 Illinois State Police.................................................................................................... 15 Local Enforcement .................................................................................................... 15 Limitations of Enforcement Data............................................................................... 17 Evaluation...................................................................................................................... 18 Overview of Telephone Survey Findings ....................................................................... 19 Statewide Telephone Survey .......................................................................................... 22
Appendix
Appendix A: You Drink & Drive. You Lose. 2007 Enforcement Activities and Associated Costs........................................................................................................... 44

List of Diagrams Diagram 1: 2007 You Drink & Drive. You Lose. Campaign Timeline .............................. 6
List of Figures Figure 1: Theoretical Model of You Drink & Drive. You Lose. Campaign. ....................... 2 Figure 2: Percent Belted Occupants Among Fatally Injured in Motor Vehicle Crashes by Time of Day in Illinois in 2006 .......................................................................... 3 Figure 3: Percent Alcohol Related Fatalities and Percent Belted Occupants by Time of Day in Illinois in 2006 ........................................................................................ 3 Figure 4: Total Patrol Hours Per Citation by Citation Type During 2007 You Drink & Drive. You Lose. Campaign in Illinois ............................................................. 10 Figure 5: Map of Roadside Safety Checks and Saturation Patrols During the 2007 You Drink & Drive. You Lose. Campaign ............................................................... 14 Figure 6: Awareness of You Drink & Drive. You Lose. Slogan in Illinois ....................... 20
List of Tables Table 1: Media Markets Participating in YDDYL Press Conferences ............................. 8 Table 2: Labor Day You Drink & Drive. You Lose. Campaign: Cost of Paid Media by Media Market ...................................................................................................... 9 Table 3: Summary Results of Enforcement Activities ..................................................... 13 Table 4: Enforcement Activities and Associated Costs by Type of Grantee................... 16 Table 5: MINI-Grantees Enforcement and Associated Costs ......................................... 44 Table 6: Regular Grantees with Single Grants Enforcement and Associated Costs ...... 46 Table 7: Regular Grantees with Multiple Grants Enforcement and Associated Costs.... 48 Table 8: All Grant Enforcement and Associated Costs................................................... 50

i
Executive Summary You Drink & Drive. You Lose. (YDDYL) is a highly visible, massive enforcement effort designed to detect violators of Illinois traffic laws with special emphasis on alcohol. An intense public information and education campaign runs concurrently with an enforcement blitz to inform the motoring public of the consequences of drinking and driving. During the campaign the YDDYL message is repeated in the media and enforcement of DUI laws are stepped up. The goal of the campaign is to save lives and reduce injuries resulting from motor vehicle crashes by reducing the incidence of drinking and driving in Illinois. The 2007 Labor Day YDDYL mobilization was conducted from August 1 to September 18, 2007. There were 141 local law enforcement agencies and the Illinois State Police which participated in the statewide campaign. There were an additional 24 agencies which just submitted citation information. Data presented in this report indicate the campaign was successful. Enforcement results and an in-depth evaluation of the campaign are included in this report. MEDIA 1. The Illinois Department of Transportation (IDOT) / Division of Traffic Safety (DTS) held
seven press conferences throughout the state from August 8 to August 30, 2007. The press conferences were on August 8 was held at a south-side church in Chicago focusing on minority populations. The conference on August 14 was held in Springfield and included the Illinois State Police, the Secretary of State Jesse White, and other law enforcement agencies. The conference on August 28 was held in Chicago in conjunction with the Illinois State Police (ISP), Mothers Against Drunk Driving (MADD) and local law enforcement agencies. On August 30, the press conferences were held in Collinsville, Springfield, Rock Island, and Chicago and featured a strong enforcement message of if you drink and drive, you will be caught.
2. Law enforcement agencies participating in the Labor Day campaign reported 103 print
stories, 34 radio stories, and 10 press conferences were generated as a result of the Labor Day campaign enforcement efforts.
3. IDOT/DTS created a series of Public Service Announcements called “True Stories”
featuring victims or drunk driving offenders and partnered with media outlets across the state to run these safety messages at no charge. Approximately 200 radio stations across the state were given the PSAs to run and eight cable and broadcast television stations agreed to play these announcements.
4. DTS Director Mike Stout participated in a series of radio interviews that played on about
20 stations across the state to remind motorists not to drink and drive. 5. IDOT/DTS spent $779,800 on broadcast television, cable and radio to promote the
National YDDYL campaign beginning August 13th and ending August 26th, 2007. ENFORCEMENT 6. One hundred forty-one (141) local law enforcement agencies and all Illinois State Police
(ISP) districts participated in the 2007 Labor Day alcohol mobilization. A total of 408 roadside safety checks and 613 saturation patrols were conducted during the August 17

ii
to September 3, 2007 enforcement period. An additional 24 non-funded earned enforcement agencies just submitted citation information.
7. Local law enforcement and ISP logged a total of 20,569 patrol hours and issued 30,094
citations during the Labor Day campaign. One citation was written every 41.5 minutes of enforcement.
8. Local law enforcement and ISP issued 830 DUI and alcohol-related citations. One
alcohol-related citation was written every 25.1 hours of enforcement. An additional 65 DUI and alcohol-related citations were written by non-funded earned enforcement agencies that did not submit patrol hours.
9. A total of 7,732 citations were issued for safety belt and child passenger safety seat
violations during the Labor Day campaign resulting in an average of one occupant restraint violation every 2.7 hours. An additional 255 safety belt and child safety seat citations were written by non-funded earned enforcement agencies that did not submit patrol hours.
COST EFFECTIVENESS OF ENFORCEMENT ACTIVITIES 10. The agencies included in the YDDYL cost / effectiveness analysis conducted a total of
16,445.4 patrol hours and issued 21,346 citations at a total cost of $790,648.07. On average, citations were written every 46.2 minutes of enforcement at a cost of $48.08 per citation, or $37.04 per patrol hour.
11. Thirty-nine (39) RSC mini-grantees issued one citation every 49.8 minutes. The cost per
citation for these agencies was $30.48 and cost per patrol hour was $36.76. Thirty-eight regular grantees issued one citation every 34.4 minutes. The cost per citation for these agencies was $29.61 and the cost per patrol hour was $51.65. Twenty-five grantees with multiple grants issued one citation every 40.3 minutes. The cost per citation for these agencies was $33.99 and the cost per patrol hour was $49.68. The Illinois State Police issued one citation every 91.0 minutes. The cost per citation for the ISP was $75.86 and cost per patrol hour was $50.00.
12. The enforcement data (such as total number of patrol hours and total citations) provided
by the local agencies should be interpreted with caution since the calculated indicators, such as cost per patrol hour or cost per citation, and/or citation written per X minutes vary substantially across selected local agencies.
TELEPHONE SURVEY Using pre/post telephone surveys from May through September, 2007 related to either seat belt or DUI-related enforcement and media campaigns, the following materials outline the key findings. Perceptions of DUI Enforcement 13. When asked hypothetically “If you drove after having too much to drink to drive safely,
how likely do you think you are to be stopped by a police officer?”, 45 percent of non-drinkers and 38 percent of recent drinkers indicated the likelihood of being stopped is “almost certain” or “very likely”.

iii
14. Three-quarters (74 percent) of those surveyed in September reported seeing “about the
same police presence on the roads they normally travel”, while 23 percent reported seeing police "more often”.
15. When asked “Compared to three months ago, do you think a driver who had been
drinking is now more likely to be stopped by police, less likely to be stopped, or is this about the same?” the percentage of people who said “more likely to be stopped” decreased from 36 percent in June to 27 percent in September.
16. The number of respondents in the Chicago suburbs who believed a driver who had been
drinking was “more likely to be stopped” decreased from 38.0 percent in June to 27.0 percent in September. In the southern Illinois, this number decreased from 35 percent to 33 percent from June to September.
Roadside Safety-Checks 17. In the Chicago suburbs awareness levels of roadside safety checks decreased from 56
percent in June to 46 percent in September. In the southern part of Illinois, this number decreased only slightly from 51 percent in June percent to 45 percent in September.
18. Most September respondents aware of roadside safety checks attribute their awareness
to television (40 percent), newspapers (31 percent), friends and relatives (30 percent), and radio (29 percent). Those respondents who heard about roadside safety-checks via television, newspaper, or radio learned most from news stories verses advertisements (90 percent verses 26 percent for newspapers; 71 percent verses 50 percent for television; and 55 percent verses 58 percent for radio).
19. Analysis among those who were aware of roadside safety checks by region. The
percent of applicable respondents who had personally seen a check is just short of 50 percent in the Chicago metro regions and about 45 percent for the two downstate regions. An increase of 7.0 percentage points was found in the downstate areas.
20. The number of respondents who indicated having personally seen roadside safety
checks rose from 4.2 seven percent in June to a substantially higher 9.9 percent in the September survey.
Awareness of “DUI” Roadside Safety Check. 21. The percent who indicated that, “in the past (thirty) days,” they had “seen or heard
anything about the police setting up roadside safety checks that were used primarily to check for alcohol impaired driving,” increased from 26 percent in June to nearly 30 percent in September.
22. Telephone surveys found that the percent of people who indicated that in the past (thirty)
days, they had “read, seen, or heard anything about alcohol-impaired driving in Illinois,” increased statewide from 71.0 percent in June to 74.5 percent in September. This change was evident in both Chicago metro areas where awareness rose from 75 percent in June to 80 percent in September. Of those telephone respondents who had heard or seen messages about alcohol-impaired driving, by far the greatest exposure source was television (79%).

iv
Awareness of the You Drink & Drive. You Lose Slogan 23. In June of 2003, 55 percent of those surveyed were familiar with the YDDYL slogan.
The September 2007 survey indicated those familiar with the slogan had risen to 81 percent.
24. September 2007 survey results show awareness levels for the YDDYL slogan were at
80 percent for downstate Illinois and 82 percent for the Chicago Metro region. From May to September, awareness in the Chicago suburbs increased by twelve percentage points from 73 percent in May to 84 percent in September.

1
Evaluation of the 2007 Labor Day You Drink & Drive. You Lose. Campaign
August 1 - September 18, 2007
Introduction You Drink & Drive. You Lose. (YDDYL) is a highly visible, massive enforcement effort designed
to detect violators of Illinois traffic laws with special emphasis on alcohol. An intense public
information and education campaign runs concurrently with an enforcement blitz to inform the
motoring public of the consequences of drinking and driving. During the campaign the YDDYL
message is repeated in the media and enforcement of DUI laws are stepped up. The goal of
the campaign is to save lives and reduce injuries resulting from motor vehicle crashes by
reducing the incidence of drinking and driving in Illinois. A YDDYL mobilization includes the
following components:
1. Earned Media1 2. Paid Media 3. Enforcement 4. Evaluation The 2007 Labor Day YDDYL mobilization was conducted from August 1 to September 18, 2007
with a special focus on impaired driving.
You Drink & Drive. You Lose. Program Model
YDDYL is a model of the social marketing program that combines enforcement with
communication outreach (paid and earned media). The main message regarding the benefits of
not drinking and driving is not only to save lives and prevent injuries, but to keep people from
getting tickets by the police. Several alcohol-related laws, such graduated licensing and .08
laws were passed by the Illinois legislature in the past that made it possible for police to stop
and ticket motorists who did not obey the law. As part of the YDDYL campaign, several road
side safety checks and saturation plans are conducted by local and state police departments
throughout the state where motorists are stopped and checked for alcohol.
1 Earned media is coverage by broadcast and published news services. Earned media generally begins one-week before paid media, two weeks before enforcement, and continues throughout other phases of the program. An earned media event, like a press conference and press release, typically is used to announce the ensuing enforcement program.

2
The components of the YDDYL model are paid and earned media paired with local and state
enforcement to increase the public’s awareness of the consequences of drinking and driving.
These variables work together to reduce injuries and fatalities. Figure 1 shows the components
of a YDDYL model.
Figure 1: Theoretical Model of Figure 1: Theoretical Model of ““You Drink & Drive. You Lose.You Drink & Drive. You Lose.””CampaignCampaign
EarnedMedia
Local and State
Enforcement
Awareness of Impaired
Driving
Fatalitiesand
Injuries
PaidMedia +
-+
+
++
Alcohol / Motor Vehicle Related Injuries and Fatalities
The relationship between drunk driving and fatality has been well documented in the literature
(FARS, 2006). The severity of a motor vehicle crash increases when the driver is impaired.
Individuals who drive while impaired are more likely to drive recklessly and become involved in
fatal crashes. Plus, impaired drivers are less likely to use seatbelts, thereby increasing their
own risk for serious injury in a crash.

3
Figure 2 shows the percentage of restraint use among occupants of vehicles who were killed by
time of day. As shown in this graph, only a small percentage of those who were killed between
midnight and 4:00AM, were wearing their belts.
Figure 2: Percent Belted Occupants Among Fatally Injured in Motor Vehicle Crashes by Time of Day in Illinois in 2006
61%
40%
46%41% 41%
49%
31%
48%
34%29% 30% 32%
20%
27%23% 20%
28%
35%
45%51%
72%
50%53% 53%
0%
10%
20%
30%
40%
50%
60%
70%
80%
NOON
1:00P
M
2:00P
M
3:00P
M
4:00P
M
5:00P
M
6:00P
M
7:00P
M
8:00P
M
9:00P
M
10:00
PM
11:00
PM
MIDNIG
HT
1:00A
M
2:00A
M
3:00A
M
4:00A
M
5:00A
M
6:00A
M
7:00A
M
8:00A
M
9:00A
M
10:00
AM
11:00
AM
Time
Perc
ent
Data Source: FARS 2006
Killed = 1,086Total Belted = 418
Figure 3 depicts the percentage of belted occupants and the percentage of alcohol related
fatalities by time of day. According to this graph, there is a negative relationship between the
percentage of belted occupants and the percentage of alcohol related deaths, especially during
nighttime hours. This indicates that the nighttime safety belt usage rate among those who drink
and drive is very low.
Figure 3: Percent Alcohol Related Fatalities and Percent Belted Occupant Fatalities by Time of Day in Illinois in 2006
26.9%
37.2%
55.6% 57.7%
74.9% 72.3%
33.3%25.5%
49.2%43.6%
38.2%30.2%
23.4% 26.9%
57.1%52.1%
0.0%
10.0%
20.0%
30.0%
40.0%
50.0%
60.0%
70.0%
80.0%
Noon to3:00PM
3:00PM to6:00PM
6:00PM to9:00PM
9:00PM toMidnight
Midnight to3:00AM
3:00AM to6:00AM
6:00AM to9:00AM
9:00 toNoon
Time
Perc
ent
% Alcohol Related Fatalities % Belted Occupants
Data Source: FARS 2006

4
Report Objectives The purpose of this technical report is to provide details of the activities, costs, and available
outcomes of the 2007 Labor Day YDDYL campaign. The objectives of this report are:
• To provide a summary of earned and paid media activities prior to and following the
Labor Day YDDYL campaign.
• To provide a detailed summary of enforcement activities during the campaign.
• To provide costs and effectiveness of enforcement activities.
• To determine Illinois residents' views and opinions regarding alcohol impaired driving
and enforcement.
The evaluation of this campaign includes process and outcome measures. The process
measures include documenting the activities associated with the program publicities (earned
and paid media) and enforcement activities during the campaign. The only immediate statewide
outcome measure that was used in this study was the pre and post telephone surveys of Illinois
drivers. The main and ultimate outcome measure of the campaign is based on the actual
alcohol related fatalities and injuries before and after the campaign. Unfortunately, the current
fatal and injury crash data are not yet available to measure the true impact of the YDDYL
campaign on fatalities and injuries. Once fatal and injury data are available to users, a
comparison will be made between crash data during this campaign and the data for the same
time period in previous years.

5
2007 Labor Day You Drink & Drive. You Lose. Campaign in Illinois:
Timeline of Activities
In August 2007, IDOT Division of Traffic Safety launched a statewide YDDYL campaign. In
coordination with the National Highway Traffic Safety Administration (NHTSA), and state, county
and local law enforcement agencies, the program set out to crack down on drunk drivers across
the state by means of a highly publicized enforcement campaign of impaired driving laws. As
illustrated in Diagram 1, YDDYL activities began August 1 and concluded September 18, 2007.
The following activities took place during the campaign:
August 1 – August 13, 2007: Baseline data on several combined alcohol and safety belt
issues (e.g., public education and enforcement) were collected via the motorist and
telephone surveys.
August 8 – September 25, 2007: Earned media was obtained, including seven press
conferences held August 8 in Chicago, August 14 in Springfield, August 28 in Chicago,
and August 30 in Collinsville, Springfield, Rock Island and Chicago.
August 13 – September 3, 2007: Paid media advertisements promoting YDDYL ran
from August 13 to 26. Highly publicized strict enforcement of the impaired driving laws
was conducted from August 17 to September 3.
September 4 – September 18, 2007: Post statewide motorist and telephone public
opinion surveys were conducted.

6
Diagram 1: 2007 You Drink & Drive. You Lose. Campaign Timeline AAAUGUSTUGUSTUGUST
SSSEPTEMBEREPTEMBEREPTEMBER
111 222 333 444 555 666 777 888 999 101010 111111 121212 131313 141414 151515 161616 171717 181818 191919 202020 212121 222222 232323 242424 252525 262626 272727 282828 292929 303030 313131 111 222 333 444 555 666 777 888 999 101010 111111 121212 131313 141414 151515 161616 171717 181818
EARNED MEDIAEARNED MEDIAEARNED MEDIA
WWWEEKEEKEEK 1 1 1 WWWEEKEEKEEK 2 2 2 WWWEEKEEKEEK 3 3 3
PAID MEDIAPAID MEDIAPAID MEDIA
ENFORCEMENTENFORCEMENTENFORCEMENT
WWWEEKEEKEEK 4 4 4 WWWEEKEEKEEK 5 5 5 WWWEEKEEKEEK 6 6 6 WWWEEKEEKEEK 7 7 7
MMMOTORISTOTORISTOTORIST S S SURVEYURVEYURVEY B B BASELINEASELINEASELINE PPPOSTOSTOST M M MOTORISTOTORISTOTORIST S S SURVEYURVEYURVEY
TTTELEPHONEELEPHONEELEPHONE S S SURVEYURVEYURVEY B B BASELINEASELINEASELINE PPPOSTOSTOST T T TELEPHONEELEPHONEELEPHONE S S SURVEYURVEYURVEY
(Sample consists of more than (Sample consists of more than (Sample consists of more than 700 Illinois residents)700 Illinois residents)700 Illinois residents)
(Sample consists of more than (Sample consists of more than (Sample consists of more than 700 Illinois residents)700 Illinois residents)700 Illinois residents)

7
MEDIA & ENFORCEMENT RESULTS

8
Media Earned Media
IDOT/DTS held seven press conferences throughout the state from August 8 to August 30,
2007. The press conference on August 8 was held at a south-side church in Chicago focusing
on minority populations. The conference on August 14 was held in Springfield and included the
Illinois State Police, the Secretary of State Jesse White, and other law enforcement agencies.
The conference on August 28 was held in Chicago in conjunction with the Illinois State Police
(ISP), Mothers Against Drunk Driving (MADD) and local law enforcement agencies. On August
30, the press conferences were held in Collinsville, Springfield, Rock Island, and Chicago and
featured a strong enforcement message of if you drink and drive, you will be caught. Table 1
lists the media markets participating in the YDDYL press conferences, as well as the articles
and stories generated from the publicity.
Table 1: Media Markets Participating in YDDYL Press Conferences
Media Market
Articles/Stories Generated
Chicago 40
Davenport/Rock Island 11
Metro East 26
Springfield/Champaign 16
Total: 93
In addition to the coverage generated by the press conferences, our law enforcement grantees
are required to submit articles in their local press regarding enforcement that they are planning.
Law enforcement agencies participating in our Labor Day campaign reported 103 print stories,
34 radio stories, and 10 press conferences were generated as a result of the CIOT enforcement
efforts.
In an effort to help reduce alcohol related crashes and fatalities on roadways, IDOT/DTS
created a Public Service Announcement titled “Stephanie.” In the Public Service
Announcement, it explains how Stephanie Emery, a pregnant mother, was involved in a head-
on crash caused by a female impaired driver. The crash killed Stephanie’s unborn child and left
her suffering from severe injuries. The PSA is one in a series called “True Stories” that runs
throughout the state. Approximately 200 radio stations across the state agreed to run this 30

9
second PSA in the spring of 2007 to combat alcohol related crashes and fatalities on Illinois
roadways. Each month, DTS is planning on rolling out a new “True Stories” PSA.
Finally, DTS Director Mike Stout participated in a series of radio interviews that played on
approximately 20 stations across the state to remind motorists not to drink and drive.
Paid Media
Paid alcohol enforcement messages are aired repeatedly during the YDDYL campaign publicity
period. Messages are focused on enforcement, reminding motorists to not to drink and drive.
YDDYL paid advertisement campaigns usually last two weeks. During this period, television and
radio advertisements air extensively. Paid media targeted the YDDYL message in the 23
specified counties in Illinois where about 85 percent of population resides and 70 percent of
motor vehicle crashes occur. Top-rated stations and programming were chosen based on
Arbitron and Nielson ratings systems focusing on the 18-34 year old African-American, Hispanic
and rural male demographic.
IDOT/DTS spent $779,800 on broadcast television, cable and radio to promote the National
YDDYL campaign beginning August 13th and ending August 26th, 2007. Table 2 lists the cost of
paid media by media market for the YDDYL campaign.
Table 2: Labor Day You Drink & Drive. You Lose. Campaign: Cost of Paid Media by Media Market
Media Market Dollars Spent – TV
Dollars Spent – Radio
Total Dollars Spent
Chicago $ 293,931.00 $ 291,366.00 $ 585,297.00
Davenport $ 15,768.90 $ 16,151.40 $ 31,920.30
Peoria $ 13,209.61 $ 16,173.00 $ 29,382.61
Springfield $ 15,761.70 $ 16,681.77 $ 32,443.47
Rockford $ 18,634.50 $ 14,397.30 $ 33,031.80
Metro East $ 33,161.70 $ 34,563.60 $ 67,725.30
Total: $ 390,467.41 $ 389,333.07 $ 779,800.48

10
Enforcement The You Drink & Drive. You Lose. (YDDYL) Labor Day campaign lasted two weeks. During this
period, zero-tolerance enforcement focusing on alcohol violations was carried out statewide. A
summary of the enforcement activities over the two week campaign appears in Table 3. One
hundred forty-one (141) local law enforcement agencies and all Illinois State Police (ISP)
Districts participated in the 2007 Labor Day alcohol mobilization. There were an additional 24
non-funded earned enforcement agencies which just submitted citation information. A total of
408 roadside safety checks and 613 saturation patrols were conducted during the August 17 to
September 3, 2007 enforcement period.
Local law enforcement and ISP logged a total of 20,830 patrol hours and issued 30,094 citations
during the campaign. One citation was written every 41.5 minutes of enforcement. Local law
enforcement and ISP issued a combined total of 830 DUI citations, an average of one DUI
citation written every 25.1 patrol hours. A total of 7,732 citations were issued for safety belt and
child passenger safety seat violations resulting in an average of one occupant restraint violation
written every 2.7 patrol hours. Figure 4 depicts the number of hours of Labor Day YDDYL
patrol per citation by citation type.
Figure 4: Total Patrol Hours Per Citation by Citation Type During 2007 Labor Day Campaign in Illinois
(Total Patrol Hours = 20,830 and Total Citations = 30,094)
25.1
2.7 1.0 0.70.0
5.0
10.0
15.0
20.0
25.0
30.0
DUI & Alcohol-RelatedCitations
Occupant Restraint Other Total
Citation Type
Hou
rs B
etw
een
Cita
tions
Illinois State Police Enforcement
All Illinois State Police Districts participated in statewide CIOT enforcement, covering 98 of
Illinois’ 102 counties. ISP conducted 4,094 hours of enforcement including 215 roadside safety

11
checks. Of the total 2,699 citations issued by the ISP, one hundred twenty eight (128) were DUI
and alcohol-related citations and 430 were safety belt and child safety seat citations. On
average ISP wrote one DUI citation for every 32.0 patrol hours and one safety belt / child safety
seat citation for every 9.5 patrol hours.
Local Enforcement
Local police agencies worked 16,736 hours on Labor Day alcohol enforcement, conducting 193
roadside safety checks and 613 saturation patrols. Figure 5 features a map identifying the
number and locations of roadside safety checks and saturation patrols by county. A total of
27,395 citations were written by local law enforcement agencies, or one citation was written
every 36.7 minutes of enforcement. Seven hundred and two (702) DUI citations were issued, or
one DUI citation was written every 23.8 patrol hours. In addition, 7,302 occupant restraint
violations were issued for failure to wear a safety belt or failure to properly restrain a child in a
safety seat, an average of one occupant protection citation every 2.3 patrol hours. Total
estimated enforcement cost was $790,648.
One hundred and one (101) local police agencies which had a grant with DTS participated in the
YDDYL enforcement. These agencies conducted a total of 181 roadside safety checks and 495
saturation patrols logging a total of 15,977 patrol hours and issuing 26,127 citations. One
citation was written for every 36.7 minutes of patrol by local officers during statewide
enforcement. These agencies issued 503 DUI and alcohol-related citations and 7,156 safety
belt and child safety seat citations. One DUI / alcohol-related citation was issued for every 31.2
patrol hours and one safety belt / child safety seat citation was written for every 2.2 patrol hours.
There were 40 local police agencies which participated on their own and did not receive funding
from DTS. Although they were not required to submit all of this information, these agencies
submitted both enforcement hours and citation information. They conducted a total of 12
roadside safety checks and 118 saturation patrols logging 759 patrol hours and issuing 1,268
citations. They issued 199 DUI and alcohol-related citations and 146 safety belt and child safety
seat citations. They averaged one DUI / alcohol-related citation for every 3.8 patrol hours and
one safety belt / child safety seat citation for every 5.2 patrol hours.
Non-Funded Earned Enforcement
There were 24 additional agencies which participated in the YDDYL mobilization without
receiving any funding from IDOT. Since these agencies participated in the campaign using their

12
own money, they were not required to submit detailed enforcement data to IDOT, except total
number of DUI and alcohol-related citations and total number of safety belt and child safety seat
citations. These agencies issued 1,691 total citations. Of the total 1,691 citations, sixty-five
(65) DUI and alcohol-related citations and 255 safety belt and child safety seat citations were
issued by these agencies.

13
Table 3: Summary Results of Enforcement Activities Agencies that Participated and
Submitted Complete Enforcement Data
Selected Enforcement Activities Local Police
Agencies (n=101)
Non-Funded Earned
Enforcement Agencies
(n=40)
Local Agencies
Total ISP Statewide
Total
Non-Funded Agencies that
Participated and Submitted Only
Alcohol, Safety Belt and Child Safety Seat
Citations (n=24)
GRAND TOTAL
1 2 3 4 5 6 7 8 Number of Enforcement Hours 15,977 759 16,736 4,094 20,830 NA NA Number of Roadside Safety Checks 181 12 193 215 408 NA NA Number of Saturation Patrols 495 118 613 0 613 NA NA Total Citations 26,127 1,268 27,395 2,699 30,094 1,691 28,826 One Citation Written Every X Minutes of Enforcement 36.7 35.9 36.7 91.0 41.5 NA NA Number of DUI & Alcohol Related Citations 503 199 702 128 830 65 631 DUI / Alcohol Related Citation Written Every X Hours 31.2 3.8 23.8 32.0 25.1 NA NA Safety Belt / Child Safety Seat Citations 7,156 146 7,302 430 7,732 255 15,719 Safety Belt / Child Safety Seat Citations Every X Hours 2.2 5.2 2.3 9.5 2.7 NA NA
Column 1: Lists the types of enforcement activities conducted during the YDDYL campaign. Column 2: The Local Police Agencies includes all DTS grantees (mini and year-long) that participated in the YDDYL campaign. Column 3: Non-Funded Earned Enforcement Agencies includes all agencies which did not receive funding from DTS, but submitted both enforcement hours and
citation information to DTS. Column 4: The Local Agencies Total combines the information from the Local Police Agencies (column 2) and the Non-Funded Earned Enforcement Agencies
(column 3). Column 5: The ISP includes all enforcement conducted by the Illinois State Police during the YDDYL campaign. Column 6: The Statewide Total combines the information from the Local Agencies Total (column 4) and the ISP (column 5). Column 7: Includes citation information from those agencies which participated on their own, did not receive any funding from DTS, and only submitted citation
information. Column 8: The Grand Total is the sum of enforcement activities from the Local Agencies Total (column 4), the ISP (column 5), and the Non-Funded Earned
Enforcement Agencies (column 7). The Grand Total was only calculated for Total Citations, Number of DUI & Alcohol-Related Citations, and Safety Belt / Child Safety Seat Citations.

14
FIGURE 5
4848
Map of Roadside Safety Checks and Saturation Patrols During the 2007
“You Drink & Drive. You Lose.” Campaign
This map displays the total agencies which conducted Roadside Safety Checks (RSCs) &/or Saturation Patrols (SPs) by county during the 2007 “You Drink & Drive. You Lose.” Campaign. Each circle represents the total agencies which conducted RSCs and SPs in that particular county.
88
66
11
22
33
55
44
11
11
77
55
1111
11
22
1144 11
22
11
11 11
5555
11
11
11
11
11
1111
11
11
11
44
11
11
22
11
Total agencies conducting saturation patrols - 78
Total agencies conducting roadside safety checks - 35
Total agencies conducting combination of roadside safety checks and saturation patrols - 31
66
11
11

15
Cost / Effectiveness Analysis of You Drink & Drive. You Lose.
Enforcement Activities In an effort to assess the costs and effectiveness of enforcement activities, actual
reimbursement claims paid out for local and state agencies were used to calculate cost per hour
of enforcement and cost per citation during the YDDYL campaign.
A cost / effectiveness analysis was performed for those agencies participating in YDDYL.
Table 4 summarizes enforcement activities (patrol hours, citations, number of citations written
per minute, cost per citation, cost per patrol hour, and cost of project) by grant type.
ISP, thirty-eight (38) year-round DTS grantees, 25 DTS grantees with multiple grants, and 39
YDDYL grantees were included in this cost / effectiveness analysis. Together, these agencies
conducted a total of 16,445.4 patrol hours and issued 21,346 citations during enforcement at a
total cost of $790,648.07. On average, one citation was written every 46.2 minutes during
enforcement at an average cost of $48.08 per citation, or $37.04 per patrol hour. See
Appendix A for a detailed listing of enforcement activities and costs by agency.
Illinois State Police
ISP conducted 4,094.5 patrol hours during YDDYL enforcement and issued 2,699 citations at
cost of $204,725, or $50 per patrol hour.2 One citation was written every 91.0 minutes, an
average cost of $75.86 per citation.
Local Police Agencies
As of December 19, 2007, a total of 103 agencies participating in the statewide mobilization
have submitted their claims and have been reimbursed by the Division of Traffic Safety. A total
of 39 agencies were solely Roadside Safety Check grantees, 38 agencies had only one regular
grant with DTS, and 25 agencies had multiple grants with DTS. As of these 25, they had 57
grants with DTS. Refer to Appendix A (Tables 5 – 7) to see each agencies enforcement
activities and associated costs by grant type. Table 8 (Appendix A) shows the aggregate
enforcement activities and their associated costs by grant type.
2 Note that the $50 an hour patrol figure listed for ISP is an estimate provided by ISP.

16
The 39 mini-grantees included in this analysis worked a total of 2,765 patrol hours and wrote
3,334 citations at a cost of $101,636.43, or $36.76 per patrol hour. On average, one citation
was written every 49.8 minutes during statewide enforcement at a cost of $30.48 per citation.
Thirty-eight (38) regular grantees contributed 4,092.3 patrol hours to the campaign, issuing
7,140 citations. Regular grantees issued one citation every 34.4 minutes of patrol at a cost of
$29.61 per citation or $51.65 per patrol hour.
The remaining 25 agencies with multiple grants conducted 5,493.6 patrol hours and they issued
8,173 citations during the YDDYL mobilization. These agencies issued one citation every 40.3
minutes of patrol at a cost of $33.39 per citation or $49.68 per patrol hour.
Table 4: Enforcement Activities and Associated Costs by Type of Grantee
Agency / Grant Type
Patrol Hours
Total
Citations
Citations Written Every X Minutes
Cost Per
Citation
Cost Per
Patrol Hour
Total Cost IL State Police
4,094.5 2,699 91.0 $75.86
$50.00 $204,725.00
Mini-Grantees (n=39)1
2,765.0 3,334 49.8 $30.48
$36.76 $101,636.43
Regular Grantees with Single Grants (n=38)2
4,092.3 7,140 34.4 $29.61
$51.65 $211,385.08
Regular Grantees with Multiple Grants (n=25)3
5,493.6 8,173 40.3 $33.39
$49.68 $272,901.56
Total
16,445.4 21,346 46.2 $37.04
$48.08 $790,648.07
NOTES: 1 The Mini-Grantees category includes only those agencies which received funding to conduct roadside
safety checks or saturation patrols during the YDDYL mobilization. 2 The Regular Grantees with Single Grants category includes those agencies which received funding for
only one regular year-long grant from DTS. Please refer to Table 6 for the types of grants each agency had.
3 Regular Grantees with Multiple Grants includes those agencies which received funding for multiple
grants from DTS. Please refer to Table 7 for the types of grants each agency had.

17
Limitations of Enforcement Data The enforcement data (such as total number of patrol hours and total citations) provided by
local agencies should be interpreted with caution since the calculated indicators, such as cost
per patrol hour or cost per citation, and / or a citation written per X minutes vary substantially
across selected local agencies.
For example, based on the cost per patrol hour, DTS reimbursed the Blandinsville Police
Department $561 for conducting 51.0 patrol hours resulting in $11.00 per patrol hour. On the
other hand, Park City Police Department was reimbursed $1,890 for conducing 10.0 patrol
hours resulting in $189.00 per patrol hour. Similarly, when looking at cost per citation, DTS
reimbursed Leland Grove $515.57 for writing 170 citations resulting in a cost of $3.03 per
citation issued. On the other hand, Ottawa was reimbursed $1,097.50 for only issuing 7
citations resulting in a cost of $156.79 per citation issued. Finally, there were great
discrepancies for total citations written per minutes of patrol conducted. In one case, Leland
Grove Police Department issued 170 citations over 23.0 patrol hours resulting in one citation
written for every 8.1 minutes of patrol. On the other hand, Highland Police Department issued
only 16 citations over 60.0 patrol hours resulting in one citation issued for every 225.0 minutes
of patrol (see Table 5).
Future Plan In an effort to address the concerns raised in this cost / effectiveness analysis, the Evaluation Unit is proposing to address these issues by taking the following course of action:
1. Conduct an in-depth analysis of the current data to identify those agencies considered as outliers. Since there are several different reasons for the presence of outliers, ranking and identifying outliers among local agencies will be performed separately by taking into account different indicators, such as total patrol hours, number of minutes it took to write a citation, and cost per citation.
2. Provide the list outliers to the local police agencies and ask them to verify their figures
and provide reasons for high or low values. There is a possibility that the figures local agencies provided for IDOT are incorrect.
3. Conduct an unannounced audit of the local police agencies to be sure the data are
correctly compiled and submitted to IDOT.
4. Based on the findings from the local agencies, develop a proactive plan to improve the timeliness, completeness, accuracy of the data.

18
EVALUATION

19
Evaluation As indicated earlier in this report, an evaluation of the You Drink & Drive. You Lose. (YDDYL)
campaign includes process measures (e.g., documenting the activities associated with
campaign media and enforcement activities) and outcome measures, such as pre and post
telephone surveys of Illinois drivers. The pre and post telephone surveys were conducted in
order to measure the impact of paid/earned media and enforcement activities on the public’s
knowledge and attitude toward the mobilization. The surveys were conducted through the
Survey Research Office at the University of Illinois at Springfield. In addition to the evaluation of
public perception on the campaign, we will conduct an outcome evaluation of the campaign on
motor vehicle related injuries and fatalities when the actual crash data become available in the
near future.
Overview of Telephone Survey Findings Telephone surveys found that the percent of people who indicated that “in the past (thirty) days,
they had “read, seen, or heard anything about alcohol-impaired driving in Illinois,” increased
statewide from 71 percent in June to 74.5 percent in September. This change was evident
among those surveyed in the Chicago metro areas where awareness rose from 71 percent in
June to 75 percent in September. Of those telephone respondents who had heard or seen
messages about alcohol-impaired driving, by far the greatest exposure source was television
(79%).
Telephone survey respondents were asked about their awareness of fifteen selected traffic
safety slogans, asked in a random order. Nine slogans related to drinking and driving. The
largest percentage point increase from May to September occurred for the YDDYL slogan,
experiencing an increase of nearly five percentage points in awareness. The greatest regional
increase in awareness of the YDDYL slogan was in the Chicago suburbs, where awareness
rose 12 percent from May to September.
Awareness of the You Drink & Drive. You Lose. Slogan: 2003 - 2007
In June of 2003, 55 percent of those surveyed were familiar with the YDDYL slogan. This
awareness level rose to 81 percent in the September 2007 survey. Figure 6 displays the
awareness of the YDDYL slogan from 2003 to 2007.
Detailed results of the pre / post telephone survey will be presented in the next section.

20
Figure 6: Awareness of the You Drink & Drive. You Lose. Slogan in Illinois(June 2003 through September 2007)
55%62%
78%
68%73%
78%70%
65%
77% 74%70%
76% 76%82% 81%
0%
10%
20%
30%
40%
50%
60%
70%
80%
90%
Jun2003
Jul2003
Jan2004
May2004
Jul2004
Sep2004
Apr2005
Jun2005
Sep2005
Apr2006
Jun2006
Sep2006
May2007
Jun2007
Sep2007
Survey Month and Year
Perc
enta
ge A
war
enes
s
Data Source: Telephone Survey

21
STATEWIDE TELEPHONE SURVEY

22
The Illinois Statewide Labor Day 2007
Alcohol Impaired Driving Enforcement Campaign Surveys
Conducted for
Division of Traffic Safety
Conducted by
Survey Research Office
Center for State Policy and Leadership University of Illinois at Springfield
Summary Report / Draft for Review Field Interviewing: June/early July and September, 2007
(Supplemented with Selected Findings from May 2007 Survey) Preliminary Excel tables submitted: October, 2007
Draft Report: November, 2007
Written by Richard Schuldt, Director, UIS/SRO
With assistance from Mark Winland, Interviewing Lab Manager

23
Introduction
The Illinois Department of Transportation, Division of Traffic Safety, contracted with the Survey Research Office, located in the Center for State Policy and Leadership, at the University of Illinois at Springfield to conduct three statewide telephone surveys from May through September, 2007 relating to either seat belt or DUI-related enforcement and media campaigns. The first survey was conducted in May prior to the Memorial Day weekend; the second was conducted in June, after the Memorial Day weekend; and the third survey was conducted in September, after the Labor Day weekend.
The May survey focused on questions regarding seat belt-related opinions and behaviors and took place prior to a seat belt enforcement and media campaign that took place in a time period surrounding the Memorial Day weekend. The June survey included a full set of both seat belt and DUI-related questions as did the September survey. The September survey took place after a DUI enforcement campaign that took place in a time period surrounding Labor Day weekend. Thus, the May survey served as a “pre-test” for the Memorial Day seat belt enforcement and media campaign, with the June survey serving as a “post-test” for this campaign. Similarly, the June survey serves as a “pre-test” for the Labor Day DUI enforcement campaign, with the September survey serving as a “post-test” for this campaign.3
Methodology
The sampling methodology for the three surveys was similar to that of other recent telephone surveys on seat belt and DUI initiative topics conducted for IDOT’s Division of Traffic Safety. The state was first stratified into the Chicago metro area and the remaining Illinois counties, known as “downstate.” The Chicago metro area was further stratified into the City of Chicago and the Chicago area suburbs, which included the Cook County suburbs and the suburbs in the five “collar” counties. The downstate area was further subdivided into north/central Illinois and southern Illinois. Thus, the statewide surveys had four stratified geographic regions: City of Chicago, Chicago suburban counties, and the downstate counties, subdivided into north/central Illinois and southern Illinois. Random samples of telephone numbers were purchased for each of the four stratification areas (City of Chicago, Chicago suburban counties, north/central Illinois, and southern Illinois).
Field interviewing for the latest September survey was conducted from September 4 – September 28, 2007, with well over 500 licensed drivers (549-577). Actual field interviewing for the June survey was conducted from June 2 – July 9, 2007, with over 500 licensed drivers (510-533). And, actual field interviewing for the May survey was conducted from April 18 – May 20, 2007, with about 500 licensed drivers (494-516).4
The numbers of completions for each stratification group are presented below for the three surveys. It should be noted that statewide results reported in this summary have been weighted to correct for the intentional over/under-representation of the respective regions.
3 In addition to the statewide surveys, a rural county component was added to both the May and June surveys. This component was not part of the September survey. 4 These numbers represent those interviewed for the statewide stratified sample for May and June. It should be noted that there was some attrition during the interviewing. The higher number in each range is the number responding to the first substantive question, and the lower number is the number responding to the last question.

24
2007 Seat Belt 2007 Seat Belt Post-Test / 2007 DUI Pre-Test DUI Pre-Test Post-Test May 2007 June 2007 Sept. 2007
TOTAL 505 521 563 Chicago metro area 293 326 301 City of Chicago 128 160 160 Chicago suburban counties 164 166 141 Downstate counties 212 195 261 North/central Illinois 99 96 141 Southern Illinois 113 99 120
The sampling error for the September statewide results is +/- 4.2 percent, while the
sampling errors for the June and May statewide results are +/- 4.3 percent and +/- 4.4 percent, respectively (at the 95th confidence level).5 The error for subgroups in all surveys is, of course, larger.
Each telephone number in the samples was called a maximum of six times, at differing times of the week and day. Within households, interviewers asked for the youngest licensed driver 75 percent of the time, because earlier experience showed that we under-represent younger drivers. In the other 25 percent of the time, interviewers asked for a licensed driver who was male/female (varying at random) and who had the next birthday. Replacements were accepted if that designated household member was not available. The average (median) length of completed interviews was 14 minutes for the September survey, 15 minutes for the June survey, and 10 minutes for the May survey.
In the following summary, the statewide results for each of the surveys have been weighted to arrive at a proper distribution by region, gender, and age category.6 No other weighting has been applied.
Comments on Results In the results that follow, we focus on those questions most pertinent to the DUI
initiative surrounding the 2007 Labor Day weekend. We also focus on the statewide and regional results -- and on selected results by whether respondents had an alcoholic drink in the past 30 days, specifically highlighting the results and changes that occurred in and between the June and September surveys (the DUI initiative “pre-test” and “post-test” surveys). However, we at times comment on the May results when they appear to add understanding to the later results/changes.7 In this summary report, percentages have sometimes been rounded to integers,
5 The sampling errors (and number of completion numbers) presented here are based on the average between partial and full completion numbers. 6 The age categories used for weighting purposes are: up to 29 years old; 30s and 40s; and 50 and older. The statewide proportions for each age category were derived from data on the age distribution of Illinois licensed drivers provided by IDOT’s Division of Traffic Safety. This is the second year that age has been used in the weighting of the results, and its usage was driven by the fact that we consistently under-represent the youngest drivers despite the fact that the interviewing protocol directs interviewers to ask to speak to the youngest licensed driver three-quarters of the time. 7 Relevant comparison questions in the May 2007 survey were those which asked about awareness and experience with roadside checks in general and the one specific DUI-related question, which inquired about whether respondents had read/seen/heard anything about alcoholic impaired driving in Illinois. And, this latter question was included after about 60 percent of the targeted May completion goals were reached. Thus, it was asked of about 40

25
and percentage changes (i.e., +/- % within parentheses) refer to percentage point changes unless specifically noted.8
The Excel file. The full results are presented in the Updated IDOT 2007 Statewide DUI
Survey Tables file (an Excel file) compiled for the project. Separate worksheets are included for:
the statewide results; regional results, both for:
the two regions of Chicago metro area and downstate, and for the four stratification regions of : City of Chicago, Chicago suburbs, north/central Illinois,
and southern Illinois; selected results by whether the respondent had an alcoholic drink in the past 30 days; statewide results by gender; statewide results by age group (three categories of up to 29, 30s and 40s, and 50 and over); statewide results by race (white/non-white).
These worksheets contain relevant results for each of the three surveys, with focus on the June pre-test and September post-test surveys, and include the percentage point changes from the June to the September surveys.9 They also include a demographic portrait of the group(s) being analyzed.
Time frame in recall question wording. The time frame in the recall questions for the
September survey, the earlier May survey, and for most of the June survey completions is that of “the past 30 days.” However, at the end of June, we changed this language to read, “in the past 30 days or so, a period that includes the Memorial Day weekend.”10
percent of the May survey respondents. (We had pared the May survey down its essential seat belt-related questions so we could gain the requisite number of pre-test seat belt campaign completions prior to Memorial Day. However, upon being reminded that this DUI-related question was useful to later analysis, we included this awareness question for the remaining approximate 40 percent of the completions.) 8 When the decimal is .5, we round to the even integer. Decimals are sometimes reported when percentage numbers are small and they add to understanding of changes/differences. 9 As noted in footnote 8 below, the Excel file also includes two worksheets that analyze the June results by the time period the interview was conducted. 10 Last year (2006), interviewing spilled over into July (through July 3) and the recall time period wording was not changed. At that time we suggested that, if anything, using the “30 day” recall wording would reduce the estimated effects of the campaign in terms of “before” and “after” awareness and exposure reports. We further noted that the response effect known as “forward telescoping,” in which respondents report occurrences that actually occurred somewhat beyond the time frame asked about, would actually produce somewhat more accurate recall if the wording remained unchanged. However, this year, we decided to change the wording, effective June 28th, to explicitly let respondents know that the time frame included the period surround Memorial Day because: 1) Memorial Day weekend was a bit earlier; 2) interviewing lasted a bit longer (through and after the July 4th holiday); and 3) about one-third of the statewide respondents were still to be interviewed as we neared the last weekend in June. Because of this, the Excel worksheet mentioned above includes a worksheet where we analyze the June recall-related results by the interviewing time period. For a description of “telescoping,” see Herbert F. Weisberg, The Total Survey Error Approach (Chicago: University of Chicago Press, 2005), pp. 98-99.

26
Demographic characteristics of the June and September samples. Before reporting the DUI-
related results, it is worth noting that the weighted June and September 2007 demographic portraits of the two samples are, overall, very similar with regard to most of the characteristics asked about.
The largest differences are found for self-identified type of community, household income, and whether the respondent has children. A brief description of these differences follows. All other differences between the two samples are less sizeable.
• The September sample has somewhat fewer respondents than the June sample who say they live in “a rural area” (8.4% vs. 13.5%) and is actually closer to the May sample in this regard (9.0%). At the same time, the September sample has slightly more who say they live in “a suburb” (37% vs. 33.4%).
• The September sample has somewhat more respondents than the June sample who did not answer the household income question (17.8% vs. 11.6%), again making it more like the May sample (19.5%) in this regard. This difference is largely accounted for by the fewer September respondents who indicated annual household incomes of between $30,000 and $60,000 (22.9% in September vs. 29.3% in June).11
• The September sample has slightly more respondents who have children (39.7% vs. 36.2%) than does the June sample.
11 Most of this difference is in the proportions who reported annual household incomes between $30,000 and $45,000 (8.5% for September and 12.5% for June).

27
THE RESULTS
In the following summary of results for each question, we comment first upon the statewide results, including changes that occurred from June to September. Where applicable, we then summarize the findings by whether or not the respondent reported having had an alcoholic drink in the past thirty days. We then summarize the regional findings, first by the dichotomous regions of Chicago metro area vs. “downstate” – and then by using our four-region stratification areas: City of Chicago; Chicago suburbs; north/central Illinois; and southern Illinois. At times, portions of these summaries are omitted either because they lack relevance or because the sub-sample numbers are too small to warrant comment. Behaviors relating to drinking and driving
Frequency of drinking. “How often did you drink alcoholic beverages in the past thirty days?” Statewide, slightly more September than June respondents reported having had any alcoholic drink in the past thirty days (55% vs. 53%). During the remaining portions of this report, we sometimes refer to those who indicated ever having an alcoholic drink in the past thirty days as “drinkers” or “recent drinkers” and their counterparts as “non-drinkers.”
Examining the more specific responses, very few September respondents reported drinking every day while about one in ten (11%) reported drinking at least several days a week. Nearly one-quarter (25%) reported drinking either “once a week or less” or “only on weekends.” Almost one-fifth (20%) reported drinking only on celebrations or special occasions, and over four of ten (42%) reported not having had a drink in the recent past. Reports regarding frequency of drinking in the past three months are very similar in both the September and June surveys. See the following, for instance: the number of respondents who reported drinking at least several times a week (10.7% in September vs. 11.6% in June); the number who reported drinking “once a week or less” or “only on weekends” (24.7% in September vs. 22.8% in June ); the number who said “only on celebrations or special occasions” (19.7% in September and 18.4% in June); and the number who reported “never” drinking during the previous thirty days (42.2% in September vs. 44% in June).
Regional results. In both the September and June surveys, somewhat more Chicago metro area
than downstate respondents reported having an alcoholic beverage in the past thirty days (55% vs. 48% for June; 58% vs. 49.5% for September). And, for both areas, only slightly more September than June respondents reported doing so.
Focusing on the most recent September results for the Chicago metro area, we find almost one in ten (9.5%) reporting drinking at least several days a week, just over one-quarter (27%) saying once a week or less or only on weekends, and about one-fifth (21%) saying only on special occasions, with almost four in ten (39%) saying they never had a drink in this time period. For downstate, we find somewhat more than one in ten (13%) saying at least once a week, about one-fifth (20%) saying once a week or less or only on weekends, and 17 percent saying only on special occasions, with almost one-half (48%) saying they never drank in this time period.
For Chicago metro area respondents, we find an increase in the percent who reported drinking “once a week or less” (12% to 21%) and accompanying decreases in the adjacent categories of “several days a week” (12% to 8%) and “only on weekends” (12% to 7%). For downstate respondents, we find very little change in reported drinking behavior from June to September, with the largest difference being a small increase in the percent who said they drink at least several times a week (8.6% to 12.8%).
When examining the four-region results for the September survey, we find that about half of the
respondents in three of the regions (City of Chicago and both downstate areas) reported they did have an alcoholic drink in the past thirty days while just over 60 percent in the Chicago suburbs reported such. In the June survey, about 55 to 56 percent in three regions (southern Illinois and both Chicago metro areas) reported having had a drink while somewhat less than half (46%) of the north/central respondents said so.
In September, about one in ten respondents reported drinking at least several times a week in all regions but north/central Illinois, where a somewhat higher proportion of 14 percent said so. In June, this

28
percentage slightly increased as we move northward across regions from southern Illinois to the City of Chicago (7% for southern Illinois; 10% for north/central; 12% for the Chicago suburbs; and 14% for the City of Chicago).
Drinking and driving. “Have you ever driven a motor vehicle within two hours after drinking
alcoholic beverages?” [For the approximate 53 to 55 percent who indicated they drank alcoholic beverages in the past thirty days.] Just over one-quarter (27%) of the 55 percent of September respondents who reported drinking alcoholic beverages in the recent past reported they had driven a motor vehicle within two hours after drinking during this time period. This is higher than the number of such drivers who said so in June (34%, from the 53 percent of June respondents who were recent drinkers). For the entire sample, this translates into 18 percent who did so in June and 15 percent who did so in September.
In September, the percent of drinkers who reported having recently driven within two hours after drinking an alcoholic beverage is virtually the same in the Chicago metro area (27%) and in downstate (28%). In June, this percentage was somewhat higher for downstate drinkers (39% vs. 32% in the Chicago area). Responding drinkers in both areas show a decline from June to September, with the downstate decline more sizeable (32% to 27% for the Chicago area; 39% to 28% for downstate).
When these regional results are translated into proportions of all sample members, we find that the percent who reported that, in the past thirty days, they had driven within two hours after drinking declined just slightly in the Chicago metro area from June to September, from nearly 18 percent to just under 16 percent. This percentage declined somewhat more for downstate respondents, from nearly 19 percent in June to just under 14 percent in September.
Examination of these results across the four regions finds sizeable declines from June to September in the percent of sample members who have driven within two hours after drinking for both southern Illinois (21% to 10%) and the City of Chicago (18% to 12%), a very small decline for north/central Illinois (18% to 15%), and virtually no change in the Chicago suburbs (almost 18% in both surveys).
Number of times. “About how many times [in this time period] did you drive within two
hours after drinking?” [For the approximate 15 to 18% of total sample members who had an alcoholic beverage in the recent past and who indicated they had driven a motor vehicle after drinking during this time.] For those who had driven a motor vehicle within two hours of drinking in the recent past, more September than June respondents indicated doing so once (50% vs. 38%), but more September than June respondents also indicated doing so 10 or more times (11% vs. 5%). More June than September respondents indicated doing so twice (35% vs. 16%). The number who said three or four times (10-11%) and the number who said 5 to 9 times (11-12%) is about the same in both surveys.
Number of drinks on last occasion. “On the most recent occasion (driving within two
hours of drinking), about how many drinks did you have?” [For the approximate 15 to 18% of total sample members who indicated they had driven within two hours of drinking in the past month.] Over 40 percent of the relevant respondents in the September survey reported having had one drink compared to 30 percent in June. And, more June respondents reported having had 5 or more drinks (16% vs. 4% for September). Just over half reported having had 2 to 4 drinks in both surveys (53% for September and 54% for June) – with more June than September respondents reported having had 2 drinks (37% vs. 22% for September) while more September respondents reported having had 3 or 4 drinks (31% vs. 18% for June).
Frequency drive when too much to drink. “About how many times [in this time period] did
you drive when you thought you had too much to drink?” [For those who indicated they have driven within two hours of drinking an alcoholic beverage in the past thirty days – 18 percent of total sample in June; 15 percent of total sample in September.] In both the September and June surveys, well over nine in ten of those asked the question (those who indicated they had driven within two hours after having

29
an alcoholic drank in the past thirty days) reported never having had too much to drink when they drove in the past thirty days (95% in June and 96% in September). The proportion who said they had done so once is about 3 percent (2.8% in September and 3.6% in June) while the proportion who said they done so more than once is even less (1.6% in September and 2.1% in June).
Reports of never having done so in the past thirty days are quite similar between Chicago area drinkers and downstate drinkers in September (97% and 95%, respectively). But in June, this incidence is greater among Chicago area drinkers than among downstate drinkers (97% vs. 88%). Accordingly, it is the downstate drinkers where we find an increase from June to September in the percent who answered “never” (88% to 95%).
Further regional analysis here finds that recent drinkers in both downstate areas follow the broader downstate finding reported above (increases from June to September in the percent saying “never” – 89% to 94% for north/central Illinois, and 91% to 95% for southern Illinois). However, differences here are found between the two Chicago metro areas (an increase from 92% to 98% for the City of Chicago; a small decrease from nearly all, 99%, in June to 96% in September for the Chicago suburbs).
Assessed trend in personal drinking and driving. “Compared to three months ago, are you
now driving after drinking: more often, less often, or about the same?” [For those who indicated they have driven within two hours of drinking an alcoholic beverage in the past thirty days – 18 percent of total sample in June; 15 percent of total sample in September.] The proportion of relevant respondents who said they “never drive after drinking” is higher in September than it was in June (67% vs. 58%) while smaller proportions are found in the September survey both for those who said they drive after drinking “less often” (9% vs. 13% in June) and for those who said they do so “about the same” as they did three months ago (22% vs. 26%). No respondent in September and hardly any in June reported that they now drink and drive “more often” than they did three months ago.
In both June and September, the percent of relevant respondents who said they “never drive after drinking” is somewhat higher in the Chicago metro area than in the downstate area. But, both areas show an increase of about 8 to 9 percentage points in this percentage from June to September (60% to 69% for the Chicago area drinkers; 54% to 62% for the downstate drinkers). For the Chicago area, the complement to this increase is a decrease in those who said they were driving after drinking “less often now” (13% to 6%). For downstate, this increase is complemented by a decrease in the percent who said they were driving after drinking “about the same” (30% to 23%).
Further regional analysis shows that these changes for relevant respondents are, for the most part, found in the Chicago suburbs and north/central Illinois. In the Chicago suburbs, we find an increase from June to September in the percent who said they “never” drive after drinking (57% to 70%) and an accompanying decrease in the percent who said “less often” (16% to 4%). In north/central Illinois, we also find an increase in the percent who said they “never” drive after drinking (53% to 63%), but here we find an accompanying increase in the percent who said “about the same” (35% to 23%).
Perceptions of and attitudes about police presence and enforcement
Perceptions of DUI enforcement. Three questions in the interview solicited respondents’ perceptions about general police presence on roads and police enforcement of DUI laws. In the first question, respondents were asked how likely it is they would be stopped if they drove after having too much to drink. In the second question, respondents were asked about the relative frequency they see police on the roads they drive (compared to three months ago). And, in the third question, respondents were asked another relative question, this time regarding how likely it is that a driver who had been drinking will be stopped, compared to three months ago. 12 (Also see the next section for questions specifically relating to roadside checks.)
12 Because of possible question order effects here, we kept the order of these questions the same as in the national survey template.

30
Police enforcement of drinking laws -- a hypothetical, personalized-wording question. “If you drove after having too much to drink to drive safely, how likely do you think you are to be stopped by a police officer?” For the results of this question, we will focus on the results for those respondents who gave a substantive answer to the question.13
Of relevant September respondents statewide, over one-tenth (13%) said that being stopped by police would be “almost certain,” and just over one-quarter (27.5%) said it would be “very likely.” Nearly 40 percent (39%) said it would be “somewhat likely,” while about one in five (21%) said it would be either “somewhat unlikely” (14.5%) or “very unlikely” (6%). While slightly fewer September than June respondents reported the likelihood to be either “very certain” or “very likely” (40.9% vs. 43.6%), overall the June results do not depart much at all from the September results here.14
For the September results, recent drinkers were somewhat less likely than non-drinkers to say that their likelihood of being stopped is either “almost certain” or “very likely” (38% vs. 45%) and are more likely to say this likelihood is “somewhat likely” (42% vs. 36%). The same pattern is present in the June results. From June to September, more change actually occurred here for non-drinkers than for drinkers. For this group, we find a decrease in the percent who said “almost certain” (22% to 16%) and an accompanying increase in the percent who said “somewhat unlikely” (9% to 15%) as well as a smaller increase in the percent who said “somewhat likely” (32% to 36%). For drinkers, the September and June results are quite similar, with a small increase in the percent who said “almost certain” (9% to 12%).
In terms of regions, just over 80 percent of the respondents in both the Chicago area and the downstate area gave a substantive response in each of the two surveys. Among those giving substantive responses, the combined percent who said “almost certain” or “very likely” is slightly higher among downstate respondents than Chicago area respondents in both surveys (44.5% vs. 39% in September; 45% vs. 43% in June). As these figures indicate, this combined percentage is stable in downstate and declined just slightly in the Chicago area. A different picture emerges when we examine only the percent who said “almost certain.” Here, we find a small increase for the Chicago area from June to September (12% to 15%) and a decrease in the downstate area (17% to 11%).
Further regional analysis finds that the percent of relevant respondents who said either “almost certain” or “very likely” is quite stable from June to September in both of the downstate regions (47% and 45% for north/central Illinois; 41% and 45% for southern Illinois). However, we find an increase in this percentage from June to September for the City of Chicago (35% to 46%) and a decrease in this percentage for the Chicago suburbs (45% to 36%).
Police presence on roads. “ Compared with three months ago, do you see police on the roads
you normally drive more often, less often, or about the same? “ Nearly three-quarters (74%) of the September respondents reported seeing police “about the same” on the roads they normally drive compared with three months ago, while over one in five (23%) said they police “more often” and just 2 percent said “less often.”
13 In each surveys, about 3% said “don’t know” or refused to answer, and another approximate 14% were coded as “not drinking so they cannot relate to the question.” For future surveys of this sort, it might be better not to personalize the question. That is, instead of asking, “if you drove after having too much to drink …,” it might be better to ask respondents how likely police are to stop drivers who do this behavior. This is in line with the wording of the third question in this section. 14 This question was not asked in the May 2007 survey. But interestingly, in the past two years, the April results (similar to this year’s May results in terms of being the pre-test for the Memorial Day weekend campaign) found that proportions choosing either “almost certain” or “very likely” were higher than that in either the June or September results.

31
More June than September respondents reported seeing police on the roads they normally drive “more often” (31% vs. 23%) compared with three months ago while more September respondents reported seeing them “about the same” (74% vs. 65%).
When analyzed by recent drinking activity, we find that September recent drinkers were slightly
more likely than non-drinkers to say they had seen police on these roads “about the same” (75% vs. 72%) and somewhat less likely to say they had seen them “more often” (21% vs. 26%). The same general pattern is also found in June (67% vs. 62% for “about the same,” and 28% vs. 35% for “more often”). From June to September, increases in the percent who said “about the same” are found for both groups (72% to 72% for non-drinkers; 68% to 75% for drinkers), as are decreases in the percent who said “more often” (35% to 26% for non-drinkers; 28% to 21% for drinkers).
By region, the percent who said they see police “more often” compared to three months ago is
just over one-quarter in downstate for both the June (28%) and September (27%) surveys. For the Chicago area, this percentage is nearly one-third in June (32%) and drops to about one-fifth (21%) in September.
Further regional analysis shows that the June-to-September changes in the percent who said “more often” are largest for the Chicago suburbs where there is a 17 percentage-point decline (37% to 20%) and for southern Illinois where there is a 12 percentage-point increase (23% to 35%).

32
Police enforcement of drinking laws -- comparative, general evaluation. “ Compared to three
months ago, do you think a driver who had been drinking is now more likely to be stopped by police, less likely to be stopped, or is this about the same?” Statewide, the percent who said “more likely to be stopped” decreased from June to September (36% to 27%) while the percent who said “about the same” increased (58% in June and 67% in September). In each survey, very few said “less likely” to be stopped (1-2%).
When analyzed by recent drinking activity, we find that both the June and September results show
recent drinkers are somewhat less likely than non-drinkers to say it is “more likely” they will be stopped (34% vs. 38% in June; and 26% vs. 30% in September). And, drinkers are somewhat more likely than non-drinkers to say the likelihood of being stopped is “about the same” (61% vs. 56% in June; and 68% vs. 64% in September). From June to September, decreases of about 8 percentage points occurred for both groups in the percent who said it was “more likely” that a driver who had been drinking would be stopped (38% to 30% for non-drinkers; 34% to 26% for drinkers).
By region, the percent who said that a driver who had been drinking is “more likely” to be
stopped by policy compared to three months ago declined somewhat in the Chicago metro area, from nearly one-third (33%) in June to just over one-quarter in September (26%). In downstate, the decline was sharper, from just over 40 percent (41%) in June to just under 30 percent in September.
Further regional analysis here shows that the declines from June to September in the percent who said “more likely” to be stopped are largely found in the Chicago suburbs (38% to 27%) and in north/central Illinois (42% to 29%). Results for June and September are quite similar both for the City of Chicago (23% and 24%) and southern Illinois (35% and 33%).
Evaluations of penalties given to DUI offenders
Two questions in the interview solicited respondents’ evaluations of the penalties given to DUI offenders. One dealt with first offenders, and the other dealt with repeat offenders.15
Evaluations of penalties for first offenders. “Do you think the penalties given to drivers your
area who are guilty of their first offense for alcohol-impaired driving are: too lenient, too harsh, or about right?” By a margin of 46 percent to 27 percent, a plurality of the September statewide respondents reported the penalties for first offenders are “about right” as opposed to “too lenient.” Only 4 percent said they were “too harsh,” and nearly one-quarter (23%) did not express an opinion.
Overall, these results depart only marginally from the June results, where we found a plurality margin of 42 percent to 28 percent for “about right” as opposed to “too lenient,” with 7 percent saying the penalties are “too harsh” and 23 percent saying they do not know.
Analysis by recent drinking activity. Both the June and September results show that recent
drinkers are less likely than non-drinkers to say penalties are “too lenient” (21% vs. 38% in June; and 22% vs. 35% in September) and more likely to say they are “about right” (47% vs. 37% in June; and 50% vs. 40% in September). In terms of the percent who said penalties are “too harsh,” the June results do not show much difference between the two groups (about 7% for each), but in September drinkers were more likely to say this than non-drinkers (6% vs. 1%). Nearly one-fifth to nearly one-quarter of each group did not express an opinion. Overall, little change in the distribution of responses is found from June to September among recent drinkers. And, only somewhat more change from June to September is found among recent non-drinkers. Here, however, we do see a sizeable relative decrease in the percent who said “too harsh” -- from nearly 7 percent in June to just above 1 percent in September.
15 These questions were asked for the first time in the 2004 surveys.

33
Analysis by region. Results in the Chicago metro area are very similar in both the June and September surveys – with just over one-quarter (27%) saying the penalty is “too lenient,” about 43 to 46 percent saying “about right,” a few (2 to 5%) saying “too harsh,” and one-quarter (25%) saying they do not know. In the downstate area, the percent saying “about right” increased from 38 percent in June to 46 percent in September while the percent saying “too harsh” was cut in half (11% in June to 5% in September) and a slight decline occurred for the percent saying “too lenient” (30% to 28%). About one in five (20-21%) downstate respondents said they don’t know.
Further regional analysis shows that the distributions of responses to this question are quite similar in June and September for both of the Chicago area regions. In north/central Illinois, we find an increase in the percent saying “about right” (33% to 46%), with decreases spread across the remaining three categories. In southern Illinois, we find a decrease in the percentage saying “about right” (56% to 46%) accompanied by small to moderate increases in the percent saying they don’t know and “too lenient.”
Evaluations of penalties for repeat offenders. “Do you think the penalties given to repeat
offenders of alcohol-impaired driving are: too lenient, too harsh, or about right?” The results are virtually reversed when we move from the question about penalties given for first offenders to this question about repeat offenders. Here, by a margin of 46 percent to 31 percent, a plurality of the September respondents is found to believe that penalties are “too lenient” as opposed to “about right.” Hardly any (1%) said “too harsh” while over one in five (23%) did not express an opinion. These results are very close to the results found in the June survey.
Analysis by recent drinking activity. Both the June and September results show few differences
between recent drinkers and non-drinkers – with a plurality of both groups saying the penalties are “too lenient” in each survey (ranging from 46% to 49% ). And, for both groups, very little change occurred from June to September.
Analysis by region. Again, we see similar results in the Chicago area for the June and September
surveys – with 44 to 47 percent saying the penalties are “too lenient,” 28 to 31 percent saying the penalties are “about right,” only a few (~1%) saying “too harsh,” and about one-quarter saying they do not know. Among downstate respondents, we see a decline in the percent saying “too lenient” (50% to 43%) and an accompanying increase in the percent saying “about right” (28% to 35%). About one in five (20-22%) indicated they do not know.
Further regional analysis shows that largest changes from June to September here are found in north/central Illinois, where the percentage saying “about right” increased by 13 percentage points (25.5% to 38%) and the percentage saying “too lenient” decreased by nearly the same amount (50% to 40%). In north/central Illinois, the “about right” percent declined by nearly 7 percentage points (35% to 28%), and this was accompanied by small increases in both the “too lenient” and “too harsh” responses. In the Chicago suburbs, a small decrease is found for “about right” accompanied by a small increase for “too lenient.” For the City of Chicago, little change is found from June to September.
Roadside safety checks
Respondents were asked about their awareness and experience with roadside safety checks in general. Later in the survey instrument, they were asked about their awareness and experience with safety checks whose primary purpose was to check for alcohol-impaired driving.
It should be noted that this departs a bit from the national survey template. This was done intentionally for reasons of obtaining comparable Illinois trend data and because Illinois roadside checks are somewhat different than those in many other states.16 16 In terms of obtaining comparable data, we had asked the general roadside check question in surveys for the past several years. The wording itself is a bit different from the national template because of the nature of Illinois roadchecks, checking vehicles which pass through a roadcheck for all possible traffic violations. To make the Illinois data comparable, we added a later question which asked about road safety checks which appeared to be

34
General roadside safety-check questions
In interpreting June-to-September change here, it should be noted that there was a sizeable
increase from May to June in the percent who had seen/heard about roadside checks in the past thirty days (27% in May to 53% in June).17
Awareness of roadside safety checks. The percent who indicated that, “in the past (thirty) days,” they had “seen or heard of anything about the police setting up roadside safety checks where they stop to check drivers and vehicles” declined from over half in June to somewhat more than 40 percent in September (53% to 43%).18 This is still substantially higher than the 27 percent who indicated such in May.19
Analysis by recent drinking activity. Awareness of roadside safety checks is quite to very similar
for both the non-drinkers and drinkers in both the June and September surveys. And, for both non-drinkers and drinkers, there is a decline in awareness from June to September: from 55 percent to 42 percent for non-drinkers and from 51 percent to 41 percent for drinkers.
Analysis by region. Reported awareness of roadside safety checks decreased in the Chicago area
from more than half (54%) in June to about 40 percent in September.20 Only a slight decrease in awareness occurred downstate (52% to 49%).
Further regional analysis finds that the decline in awareness of these roadside checks from June to September is more sizeable for City of Chicago respondents (50% to 29%, -21% pts) than for Chicago suburban respondents (56% to 46%, -10% pts). The decline in awareness for southern Illinois respondents is more modest (51% to 45%, -6% pts) and is slight for north/central Illinois (52% to 50%).
Sources of awareness. Of those who had seen or heard anything about roadside safety checks,
the September percentage for those who had seen/heard about them through television is 40 percent compared to about 30 percent for the other three sources of newspapers (31%), friends and relatives (30%), and radio (29%).
Compared to the June source-of-awareness results for relevant respondents, we find increases for the mass media sources of television (32% to 40%), newspapers (24% to 31%), and radio (24% to 29%) but a small decrease for friends/relatives (35% to 30%).
Among all relevant 2007 statewide respondents, those who mentioned newspapers were far more likely to say they had heard of the safety checks from news stories than from advertisements (90% vs. 26% in September; 87% vs. 18% in June; 67% vs. 10% in May). For those who mentioned television, the proportion who were exposed through news stories is pretty constant across the three surveys (74%, 74% and 71% for May, June and September), but we see increasing percentages for those exposed through commercials (28% in May, to 41% in June, to 50% in September.) For those who mentioned radio, we also find increasing proportions citing exposure through commercials (22% in May, to 36% in June, to primarily targeted for alcohol-impaired driving. We believe these questions reflect the actual situation in Illinois while also giving us comparable data. 17 The May 2007 survey was the “pre-test” survey for the Memorial Day seat belt initiative. For these results, see the Memorial Day 2007 Seat Belt Initiative Survey Report. 18 For the June survey, awareness of roadside safety checks was 51% for interviews conducted through June 27, prior to introducing the “in the past month or so” wording change with a Memorial Day reference (described on page 3) and was 57% for interviews conducted after this, which included the July 4th holiday period. Note that 76% of the interviews in this latter period were conducted in the Chicago metro area compared to 55% in the period up to June 27. 19 For awareness of roadside safety checks, we used the final percentages after a follow-up question that confirmed the meaning of “roadside safety checks.” 20 Within the Chicago metro area, the June recognition level was nearly 50% for those interviews conducted through June 27 and was 61% for those interviews conducted after. For downstate, not enough post-June 27 interviews were conducted for useful analysis purposes.

35
58% in September). At the same time, we find decreasing proportions citing exposure through news stories (78% in May, to 63% in June, to 55% in September). The result is that, for radio, we find similar rates of exposure through commercials and news stories in September (58% and 55%, respectively).
Among recent drinkers who reported awareness of the roadside checks in the September survey,
exposure through television was reported by 45 percent, exposure through radio and through newspapers was reported by 30 percent, and exposure through friends/relatives was reported by one-quarter (25%).
An analysis of the regional source-of-exposure results for September respondents who were
aware of these roadside checks finds that about 40 percent reported exposure through television in both the Chicago metro area and downstate area while about 30 reported in each of these areas reported exposure through friends/relatives. Reported exposure through newspapers is far more frequent in the downstate area (50% vs. 20%) while reported exposure through radio is more frequent in the Chicago metro area (36% vs. 19%).
Further regional analysis here across the four statewide areas finds that, consistent with the above, percentages around 40 percent (37% to 42%) in all four areas reported exposure through television and percentages around 30 percent in all four areas did so for friends/relatives. Also consistent with the above is that reported exposure through newspapers is far more frequent in both downstate areas (49-50%) than it is in the Chicago metro area (18-20%). For radio, we find a differentiation within the Chicago metro area, with reported exposure in the Chicago suburbs (42%) more frequent than it is in the City of Chicago (15%). Radio exposure in both downstate areas stood at 19 percent.
Personally seeing roadside checks. Of those who had seen or heard anything about roadside
safety checks, the statewide percent who indicated they had personally seen such checks does not differ much in June and September – just above half for June (52%) and just below half for September (48%). Both are higher than the 39 percent who said so in May.
Analysis among those who were aware of roadside safety checks by recent drinking activity. The incidence of personally seeing a check among those who have heard of them increases only a little for drinkers from June to September (47% to 50%). But this incidence drops by about 16 percentage points for non-drinkers (60% to 44%).
Analysis among those who were aware of roadside safety checks by region. The percent of applicable respondents who had personally seen a check dropped from 60 percent in June to 50 percent in September in the metro Chicago area. This percentage increased somewhat from 38 percent to 45 percent in the downstate area.
When these results are based on all sample members (and not just those aware), we find the
percent who have seen a roadside safety check increased from just over one in ten in May (10.6%) to over one-quarter in June (27.6%) and then dropped some to just over one-fifth in September (20.6%).
Analysis by recent drinking activity. For all recent drinkers, the percent who said they had personally seen a roadside safety check drops only a little between June and September, from just under 24 percent to just under 21 percent. This drop was more sizeable for recent non-drinkers (just over 33% to nearly 19%).
Analysis by region. Again, when the percent is based on all sample members (and not just those who were aware), the percent of Chicago metro area respondents who reported personally seeing a roadside check increased from 12 percent in May to nearly one-third (32%) in June, and then decreased to about one-fifth (20%) in September. For downstate, this percentage increased from nearly 7 percent in May to nearly 20 percent in June, and then increased justly slightly to 22 percent in September.
Further regional analysis here shows that the Chicago area May-to-June increase followed by a June-to-September decline applies to both the City of Chicago (16% to 30% to 19%) and to the Chicago suburbs (10% to 34% to 20%).
However, while there was an increase in this percentage from May to June in both downstate areas, the overall downstate stability from June to September hides differences in the two downstate areas, where we find a decrease for southern Illinois (7% to 29% to 17%) and an increase in north/central Illinois (7% to 17% to 23%).

36
Personally going through a roadside check. When those who had personally seen a roadside
check, were asked whether they have “personally been through a roadside check in the past (thirty) days, either as a driver or as a passenger,” just less than two-thirds (65%) of relevant September respondents answered in the affirmative compared to 57 percent for relevant June respondents and 51 percent for relevant May respondents. Calculated on the basis of all sample members, this translates into less than one in twenty (4.2%) who said they have recently been through a roadside check in the May survey, 14 percent for June (14.4%), and one in ten (9.9%) for September.
By recent drinking activity. Among recent non-drinkers who had seen a safety check, the percent of respondents who said they had actually gone through a check increased somewhat from June to September (53% to 58%). For recent drinkers who had seen a safety check, this percentage was quite stable (65% and 64%). Based on all sample members, the percent who indicated having gone through a check decreased from June to September for non-drinkers (nearly 18% to just under 11%) and dropped only slightly drinkers (15.4% to 13.1%).
By region. When the percentage of all sample members who indicated having gone through a safety check in the past thirty days is examined, we find that – for the Chicago metro area -- this incidence increased from May to June and then declined a bit to September (7.4% to 17.9% to 14.4%). For downstate, this percent increased from very few in May to more than one in ten in both June and September (1.6% to 12.2% and 11.4%).
Further regional analysis here shows that sizeable increases occurred in this percentage from May to June in all but the City of Chicago, where there was a smaller increase. Then, from June to September, a great deal of stability in this percentage is found in both north/central Illinois (0.8% to 10.8% to 12.4%, across all three surveys) and the City of Chicago (12.3% to 15.1% to 13.4%). From June to September, a small decrease is found in the Chicago suburbs (4.4% to 19.1% to 15.2%), and a larger decrease is found in southern Illinois (2.4% to 17.8% to 10.5%).
Drinking-related roadside check questions (later in the interview)
Awareness of “DUI” roadside safety checks. The percent who indicated that, “in the past (thirty) days,” they had “seen or heard anything about the police setting up roadside safety checks that were used primarily to check for alcohol impaired driving,” increased slightly from 26 percent in June to about 30 percent in September.21
By recent drinking activity. The results show an increase in awareness for recent non-drinkers (22.5% to 29%) and only a slight increase in awareness among recent drinkers (30% to 32%) between June and September.
By region. Just over one-quarter (26-27%) of the Chicago area respondents indicated having heard about these roadside safety checks in both the June and September surveys. Awareness of them downstate increased from over one-quarter (28%) in June to 38 percent in September.22
Further regional analysis shows that, within the Chicago metro area, we actually find a modest increase in awareness of these roadside checks from June to September for the Chicago suburban area (25% to 30%) and a modest decrease in the City of Chicago (26% to 20%). Increases in awareness are found for both downstate areas (30% to 40% for north/central Illinois; 19% to 33% for southern Illinois).
21 For the June survey, awareness of “DUI” roadside safety checks was 23% for interviews conducted through June 27, prior to introducing the “in the past month or so” wording change with a Memorial Day reference (described on page 3) and was 33% for interviews conducted after this, which included the July 4th holiday period. Note that 76% of the interviews in this latter period were conducted in the Chicago metro area compared to 55% in the period up to June 27. 22 Within the Chicago metro area, the June awareness level for these checks was 19% for those interviews conducted through June 27 and was nearly 36% for those interviews conducted after. For downstate respondents, not enough post-June 27 interviews were conducted for useful analysis purposes.

37
Personally going through these roadside checks. Of those who had seen/heard of such roadside checks, the percent of those who indicated “having personally gone through [these] checks” increased somewhat from almost 14 percent in the June survey to 18 percent in the September survey. This translates into nearly 4 percent of all sample members for the June survey and just over 5 percent for the September survey (3.6% and 5.5%, respectively).
For drinkers and non-drinkers who had heard about the roadside checks, the percent who had personally gone through them declined somewhat from June to September for non-drinkers (23.5% to 16%) but more than doubled for recent drinkers (8% to almost 20%). Translated into percentages for their entire groups in the samples, we find stability from June to September in the percent of non-drinkers who had personally been through a stop (5.3% and 4.7%) and more than a two-fold increase in this percent for drinkers (2.5% to 6.2%).
By region -- for those who have heard of the roadside checks, we see an increase from June to September in the percent who indicated they personally went through such checks in both the Chicago area (13% to 16%) and downstate (13.5% to 19.7%). When translated into an incidence based on all sample members, we find a slight increase in the Chicago area from June to September (3.3% to 4.4%) and a small increase downstate (3.8% to 7.4%). Further regional analysis shows that the largest increase here occurs among north/central Illinois sample members (3.5% to 7.9%) followed by southern Illinois sample members (4.1% to 6.3%). The increase is even smaller among Chicago suburban sample members (3.3% to 4.7%) and is virtually nill among City of Chicago sample members (3.4% to 3.9%).
Messages about alcohol-impaired driving
Awareness of messages about alcohol-impaired driving. The percent who indicated that, “in
the past (thirty) days,” they had “read, seen or heard anything about alcohol impaired driving in Illinois,” increased slightly from 71 percent in June to nearly three-quarters (74.5%) in September.23 In May, it stood at 60 percent.
By recent drinking activity. In both the June and September surveys, recent drinkers were more
apt than non-drinkers to report awareness of these messages. For both groups, there are small increases in awareness from June to September (66% to 70% for non-drinkers; 75% to 78% for drinkers).
By region. The increase from June to September in reported exposure to these messages is found in the Chicago metro area (71% to 75%) but not in downstate Illinois (72% in both surveys).24 In May, the awareness level stood at about 60 percent in both the Chicago metro area and downstate.
Further regional analysis here for the June and September surveys finds that an increase in awareness of these messages is found in both Chicago metro areas (75% to 80% for the Chicago suburbs; 63% to 67% for the City of Chicago) and also in southern Illinois (64% to 69%). It is stable in north/central Illinois (75% in each survey).25
Sources of messages. Of those who had seen or heard such messages, by far the greatest
exposure source in both September and June is found for television (about 79% in both surveys).
23 For the June survey, awareness of these messages checks was 68% for interviews conducted through June 27, prior to introducing the “in the past month or so” wording change with a Memorial Day reference (described on page 3) and was 78% for interviews conducted after this, which included the July 4th holiday period. Note that 76% of the interviews in this latter period were conducted in the Chicago metro area compared to 55% in the period up to June 27. 24 Within the Chicago metro area, the June awareness level for these messages was 66% for those interviews conducted through June 27 and was 78% for those interviews conducted after. For downstate respondents, not enough post-June 27 interviews were conducted for useful analysis purposes. 25 We do not comment on May results for the four-region analysis because of the small number of respondents for the respective regions.

38
In September, television was followed by radio (50%), then billboards/bus signs (46%) and newspapers (45%), followed by posters/bumper stickers (40%). Friends/relatives (26%) followed and then came brochures/pamphlets (15%).
In June, television was followed by newspapers (52%) and billboards/bus signs (52%), then posters/bumper stickers (46%) and radio (44%). As above, friends/relatives (32%) followed and then came brochures/pamphlets (19%).
Respondents who said they were exposed through television, radio, or newspapers were asked
whether this was through a commercial/advertisement, through a news program or story, or something else. For newspapers, relevant respondents were primarily exposed through news stories rather than commercials (89% vs. 32% in September and 86% vs. 21% in June). For radio, relevant respondents somewhat more frequently identified advertisements rather than news stories (75% vs. 60% in September; 65% vs. 52% in June). For television, relevant September respondents slightly more frequently identified advertisements rather than news stories (70% vs. 63%), and relevant June respondents are very close in this regard (62% for news stories vs. 59% for advertisements).26
For recent drinkers who indicated awareness of these messages in the September survey, we also
find television, by far, to be the most frequent source of exposure (82%). TV is followed by radio (53%), newspapers (48%), billboards/bus signs (45%), posters/bumper stickers (40%), friends/relatives (30%) and lastly by brochures/pamphlets (10%).
The following presents September results by region and based on those who are aware of any
messages. For television. September television exposure among those who have seen/heard messages is
about 80 percent for three regions (83% for City of Chicago; 80% for Chicago suburbs; and 78% for north/central Illinois). It is lower in southern Illinois, where it is 73 percent.
For radio. September radio exposure among those who have seen/heard of these messages is above half for the two Chicago metro areas (59% for Chicago suburbs; 54% for City of Chicago) and about 40 percent or less for the two downstate areas (39% for southern Illinois; 35% for north/central Illinois).
For newspapers. September newspaper exposure among those who have see/heard of these messages is about half for north/central Illinois (51%) and somewhat more than 40 percent for the other three areas (43% for City of Chicago and for Chicago suburbs; 44% for southern Illinois).
For billboards or bus signs. Reported September exposure through billboards / bus signs among those who have seen/heard of these messages is just above half for southern Illinois (52%) and in the mid-40’s percents for the other three regions (47 percent in both the City of Chicago and north/central Illinois; 44 percent in the Chicago suburbs).
For posters or bumper stickers. Reported September exposure through posters / bumper stickers among those who have seen/heard of these messages is about 40 percent in all four areas.
For brochures or pamphlets. Reported September exposure through brochures / pamphlets among those who have seen/heard of these messages is nearly one in five in the City of Chicago (19%), 15 to 16 percent for the Chicago suburbs and southern Illinois, and just over one in ten (11%) for north/central Illinois.
For friends or relatives. September exposure through friends/relatives among those who have seen/heard these messages is about one-quarter in each of the four areas.
Reported trend in number of messages. Those who said they were exposed to messages about
alcohol impaired driving (71% of the June respondents and 74% of the September respondents) were asked whether ”the number of messages that [they] have seen or heard about alcohol impaired driving in the past (thirty) days is more than usual, fewer than usual, or about the same as usual.” In September, the statewide percent of these respondents saying “more than usual” was just over one in five (23%), less
26 Note that percentage results for commercials and news stories can add to more than 100 percent because respondents could indicate they were exposed through both types.

39
than that found in June (32%).27 Just over seven in ten (72%) of the September respondents said “about the same as usual,” a proportion more than that found in June (62%). Only 3 percent of the September respondents said “fewer than usual,” about the same as said so in June (4%).
By recent drinking activity. Among respondents who had seen/heard of these messages in both
June and September, recent drinkers were less likely than non-drinkers to say the number of messages they had see/heard was “more than usual” (28% vs. 38% in June; 22% vs. 28% in September) and somewhat more likely to say the number of messages was “about the same” (64% vs. 59% in June; 74% vs. 68% in September). For both non-drinkers and drinkers, we find a decline the percent who said “more than usual” (38% to 28% for non-drinkers; 28% to 22% for drinkers).
By region. Again, among respondents who had seen/heard of these messages, both the June and
September results show that more Chicago area than downstate respondents reported the number of messages they had heard in the past thirty days is “more than usual.” In both the Chicago area and downstate, this reported percentage actually declined from June to September (36% to 26% in the Chicago area; and a smaller decline of 24% to 19% in downstate).28
And further regional analysis here shows that declines in this percentage are found in each of the four areas, with the most sizeable decline being for the Chicago suburbs (38% to 26% for this suburban area; 31% to 26% for the City of Chicago; 25% to 20% for north/central Illinois; and 21% to 15% for southern Illinois).
Awareness of selected traffic safety slogans
The question. Respondents were asked about their awareness of seventeen selected traffic safety “slogans,” asked in a random order. Ten are related to drinking and driving, with nine explicitly related.
The September results. The following Table S-1 presents the most recent September results,
ordered by level of awareness. The DUI-related slogans are in italics, except for the most recent slogan which is in non-italic bold, “You drink and drive. You lose.”29
This table shows that the “You drink and drive. You lose” slogan ranks third in awareness level, at
81 percent. The only two slogans above this in awareness are “Click It or Ticket” (at 90%) and “Friends don’t let friends drive drunk” (at 83%). And, the “You drink and drive. You lose” slogan is far ahead of the slogan which ranks fourth in awareness.
27 For the June survey, the proportion of relevant respondents who said the number of messages was “more than usual” was 27% for interviews conducted through June 27, prior to introducing the “in the past month or so” wording change with a Memorial Day reference (described on page 3) and was 41% for interviews conducted after this, which included the July 4th holiday period. Note that 76% of the interviews in this latter period were conducted in the Chicago metro area compared to 55% in the period up to June 27. 28 Within the Chicago metro area, the June proportion among relevant respondents who said “more than usual” was 28% for those interviews conducted through June 27 and was 46% for those interviews conducted after. For downstate respondents, not enough post-June 27 interviews were conducted for useful analysis purposes. 29 It appears that the wording of this slogan has alternated over the years and over varying formats and communication modes between “You drink and drive, you lose” and “You drink. You drive. You lose.” Currently, both variants of this slogan can be seen in Illinois. We have used the first wording for the 2007 telephone surveys.

40
Table Slogans-1: Awareness Levels in September 2007
_____________________________________________________________________
Order Slogan Sept level _____________________________________________________________________
1 Click It or Ticket ................................................................................ 90.3% 2 Friends don’t let friends drive drunk ................................................. 82.6% 3 You drink and drive. You lose. ...................................................... 81.2% 4 Drive smart. Drive sober. ................................................................. 57.4% 5 Police in Illinois arrest drunk drivers ............................................... 52.6% 6 Buckle Up America ........................................................................... 44.4% 7 Drive hammered, get nailed. ............................................................. 38.7% 8 Stay alive in I-55 …………………………………………..………. 34.2% 9 Cells phones save lives. Pull over and report a drunken driver ....... 33.6% 10 Drunk driving. Over the limit. Under arrest ………………….……….. 27.1% 11 Wanna drink and drive, police in Illinois will show you the bars ..... 20.0% 12 Drink and drive? Police in Illinois have your number ..................... 19.4% 13 Children in back ................................................................................ 18.6% 14 Smart motorists always respect trucks .............................................. 11.8% 15 Step away from your vehicle ............................................................. 14.3% 16 Checkpoint Strikeforce ..................................................................... 8.5% 17 Operation A-B-C ............................................................................... 5.3%
____________________________________________________________________
Further analyses for the “You Drink and Drive. You Lose” major campaign slogan. We focus on the major slogan in the recent 2007 Labor Day holiday initiative, “You drink and drive. You lose,” for further analyses regarding trends and subgroups.
May to June to September trends. Statewide, reported awareness of the major DUI campaign slogan, “You drink and drive. You lose,” increased from just over three-quarters (76%) in the May survey to just over 80 percent in the June and September surveys (82% and 81%, respectively).30 In percentage point terms, it experienced the second-largest increase in recognition from May to June (behind that of “Cell phones save lives ...”, which experienced this increase at a much lower recognition level of 31% to 37%).
In all three surveys, “You drink and drive. You lose” was the third-most recognized slogan. In all three surveys, its recognition was about 10 percentage points behind the most-recognized “Click It or Ticket” slogan. In the May survey, it was about 8 percentage points behind the second-most recognized slogan, “Friends Don’t Let Friends Drive Drunk,” but it had drawn within 2 percentage points of this slogan in both the June and September surveys.
By recent drinking activity. In both June and September, we find that reported recognition of this slogan is slightly higher among recent drinkers than among recent non-drinkers. And, for each group, the June and September recognition levels are very similar (80% and 79%, respectively, for recent non-drinkers; 85% and 83% for recent drinkers).
30 For the June survey, awareness of this slogan was 80.5% for interviews conducted through June 27, prior to intro-ducing the “in the past month or so” wording change with a Memorial Day reference (described on page 3) and was 85% for interviews conducted after this, which included the July 4th holiday period. Note that 76% of the interviews in this latter period were conducted in the Chicago metro area compared to 55% in the period up to June 27.

41
By region. (See Table S-2.) Awareness levels of this slogan across the May, June and September surveys are similar for downstate respondents (82% in May; 82% in June; and 80% in September). In the Chicago metro area, we see an increase from the May awareness level of 74 percent to awareness levels of 82 percent in both June and September.31
Further regional analysis here finds that, within the Chicago metro area, the increase from the May recognition level to the June and September recognition levels is much greater in the Chicago suburbs (+12% pts) than it is in the City of Chicago (+2 to 3% pts). And, within downstate, we see that the recognition level of the slogan within north/central Illinois is stable across the three surveys, always above 80 percent. However, in southern Illinois, we find a small increase in recognition from 78 percent in May to 81 percent in June, followed by a decrease to 71 percent in September.
Table S-2 Awareness of Major DUI Slogan of 2007 Labor Day Weekend Campaign,
“You drink, you drive, you lose”* ______________________________________________________________________________
May June May to Sept June to Region 2007- Pre- June Post-Test Sept. Total. Survey test diff.* 2007 diff.* Diff.
______________________________________________________________________________ STATEWIDE …………..… 76% 82% +6% 81% -1% +5% Chicago Metro ....................... 74% 82% +8% 82% +0% +8% City of Chicago ………….. 75% 78% +3% 77% -1% +2% Chicago suburbs ……….... 73% 85% +12% 84% -0% +12% Downstate …………………. 82% 82% +0% 80% -2% -2% North/central Illinois ……. 83% 82% -1% 83% +1% +0% Southern Illinois ………... 78% 81% +3% 71% -11% -7%
______________________________________________________________________________ *Differences are based on actual differences, not the rounded integer results presented. These are percentage point increases/decreases.
The 2002 through 2007 trends. Because there were media/enforcement campaigns going back to calendar year 2002 for which we have awareness information for numerous selected traffic safety slogans and for both seat belt-related and DUI-related campaigns, it is worth presenting the full cross-sectional trend results. These are presented in Table S-3, according to level of awareness in the September 2007 survey. The most recent DUI-related slogan is in italic bold.
31 Within the Chicago metro area, the June awareness for this slogan was 80% for those interviews conducted through June 27 and was 85% for those interviews conducted after. For downstate respondents, not enough post-June 27 interviews were conducted for useful analysis purposes.

42
Table Slogans - 3 Awareness of Selected Traffic Safety Slogans, April 2002 through September 2007
Slogan Apr ‘02
Jun’02
Nov ‘02
Dec ‘02
May ‘03
Jun’03
July ‘03
Jan ‘04
May ‘04
July ‘04
Sept ‘04
Apr ‘05
Jun ‘05
Sept ‘05
Apr ‘06
Jun ‘06
Sept ’06
May ‘07
Jun ‘07
Sept ‘07
Click It or Ticket 41% 71% 67% 71% 67% 85% 83% 87% 84% 90% 88% 81% 91% 87% 84% 91% 88% 89% 94% 90% Friends don’t let friends drive drunk na na na na na 89% 89% 86% 85% 90% 85% 86% 82% 80% 86% 82% 80% 84% 84% 83%
You drink and drive. You lose na na na na na 55% 62% 78% 68% 73% 78% 70% 65% 77% 74% 70% 76% 76% 82% 81%
Drive smart, drive sober 61% 62% 58% 62% 65% 67% 66% 68% 65% 67% 63% 60% 57% 57% 54% 60% 56% 60% 64% 57%
Police in Illinois arrest drunk drivers* 40% 39% 33% 36% 29% 48% 50% 54% 51% 55% 54% 53% 47% 51% 49% 45% 49% 50% 52% 53%
Buckle Up America 60% 60% 53% 54% 48% 53% 55% 53% 52% 64% 51% 52% 45% 45% 50% 50% 46% 48% 47% 44% Drive hammered, get nailed na na na na na 30% 52% 46% 45% 46% 41% 37% 32% 38% 37% 39% 41% 38% 41% 39%
Cell phones save lives. Pull over and report a drunk driver.
36% 41% 45% 44% 39% 46% 42% 40% 43% 46% 36% 35% 40% 37% 37% 34% 39% 31% 37% 34%
Stay Alive on I-55 na na na na na na na na na na na na na na na na na na 31% 34% Wanna drink and drive, police in Illinois will show you the bars*
40% 39% 33% 36% 29% 24% 30% 30% 27% 30% 28% 29% 21% 25% 23% 24% 22% 23% 26% 20%
Drunk driving. Over the limit. Under arrest. na na na na na na na na na na na na na na na na na 29% 24% 27%
Drink and drive? Police in Illinois have your number
na na na na na 22% 24% 26% 24% 24% 22% 22% 19% 18% 20% 19% 21% 20% 20% 19%
Children in back 20% 25% 19% 21% 22% 24% 25% 24% 20% 26% 20% 20% 22% 18% 22% 19% 19% 20% 17% 19% Step away from your vehicle na na na na na na 16% na 13% 14% 16% 14% 13% 16% 17% 12% 14% 12% 12% 14%
Smart motorists always respect trucks 6% 12% 8% 11% 11% 11% 12% 9% 12% 10% 9% 10% 8% 7% 12% 10% 6% 9% 10% 12%
Operation A-B-C 4% 6% 4% 6% 7% 5% 6% 6% 6% 6% 5% 4% 5% 3% 5% 5% 3% 3% 6% 5% Checkpoint Strikeforce na na na na na na 9% na 10% 9% 8% 12% 8% 10% 10% 10% 7% 8% 5% 8%
*Prior to the June 2003 Post-test survey, this was one slogan.

43
APPENDIX

44
Appendix A: You Drink & Drive. You Lose. 2007 Enforcement Activities and Associated Costs
TABLE 5: MINI-GRANTEES ENFORCEMENT AND ASSOCIATED COSTS
1 2 3 4 5 6 7 8
Grant Type Agency Total Hours
Total Citations
Citation Written Every X Minutes
Cost Per Citation
Cost Per Patrol Hour
Amount Claim Processed For
MINI Arlington Heights Police Department 140.0 321 26.2 $ 24.98 $ 57.28 $ 8,019.09
MINI Bartonville Police Department 82.5 92 53.8 $ 24.16 $ 26.94 $ 2,222.56
MINI Blandinsville Police Department 51.0 10 306.0 $ 56.10 $ 11.00 $ 561.00
MINI Cahokia Police Department 141.5 206 41.2 $ 27.53 $ 40.08 $ 5,671.28
MINI Cook County Sheriff's Office 42.0 60 42.0 $ 30.70 $ 43.86 $ 1,842.17
MINI Countryside Police Department 21.0 24 52.5 $ 40.85 $ 46.69 $ 980.50
MINI Danville Police Department 35.0 40 52.5 $ 35.04 $ 40.05 $ 1,401.70
MINI Decatur Police Department 117.0 107 65.6 $ 40.19 $ 36.75 $ 4,300.00
MINI DeKalb Police Department 55.0 59 55.9 $ 48.33 $ 51.85 $ 2,851.54
MINI Effingham County Sheriff's Office 16.0 16 60.0 $ 29.23 $ 29.23 $ 467.66
MINI Flora Police Department 105.0 49 128.6 $ 75.69 $ 35.32 $ 3,708.74
MINI Grandview Police Department 10.0 6 100.0 $ 32.50 $ 19.50 $ 195.00
MINI Harwood Heights Police Department 65.0 52 75.0 $ 33.62 $ 26.90 $ 1,748.32
MINI Highland Police Department 60.0 16 225.0 $ 130.14 $ 34.70 $ 2,082.25
MINI Jerome Police Department 308.0 766 24.1 $ 10.07 $ 25.05 $ 7,716.40
MINI Leland Grove Police Department 23.0 170 8.1 $ 3.03 $ 22.42 $ 515.57
MINI Lombard Police Department 40.0 26 92.3 $ 83.09 $ 54.01 $ 2,160.27
MINI Lostant Police Department 105.0 36 175.0 $ 102.08 $ 35.00 $ 3,675.00
MINI Marseilles Police Department 150.0 46 195.7 $ 114.39 $ 35.08 $ 5,262.00
MINI Mattoon Police Department 43.0 20 129.0 $ 73.85 $ 34.35 $ 1,476.94
MINI McLean County Sheriff's Office 18.0 51 21.2 $ 10.01 $ 28.36 $ 510.54
MINI Melrose Park Police Department 222.0 571 23.3 $ 21.58 $ 55.50 $ 12,321.06
MINI Morton Grove Police Department 110.0 6 1100.0 $ 877.77 $ 47.88 $ 5,266.60
MINI New Lenox Police Department 30.0 65 27.7 $ 21.68 $ 46.98 $ 1,409.45
MINI Niles Police Department 6.0 71 5.1 $ 9.97 $ 17.96 $ 707.76
MINI Orland Hills Police Department 45.0 52 51.9 $ 35.69 $ 41.24 $ 1,855.86
MINI Ottawa Police Department 30.0 7 257.1 $ 156.79 $ 36.58 $ 1,097.50
MINI Park City Police Department 30.0 55 10.9 $ 34.36 $ 63.00 $ 1,890.00
MINI Park Forest Police Department 50.0 48 62.5 $ 40.83 $ 39.20 $ 1,960.00
MINI Paxton Police Department 90.0 15 360.0 $ 148.63 $ 24.77 $ 2,229.45
MINI Plainfield Police Department 65.0 85 45.9 $ 21.43 $ 28.02 $ 1,821.55
MINI Pulaski County Sheriff's Office 54.0 2 1620.0 $ 365.35 $ 13.53 $ 730.70
MINI Roselle Police Department 51.0 32 95.6 $ 73.64 $ 46.20 $ 2,356.34
MINI South Barrington Police Department 31.0 14 132.9 $ 91.66 $ 41.39 $ 1,283.20
MINI South Jacksonville Police Department 30.0 8 225.0 $ 79.56 $ 21.22 $ 636.49
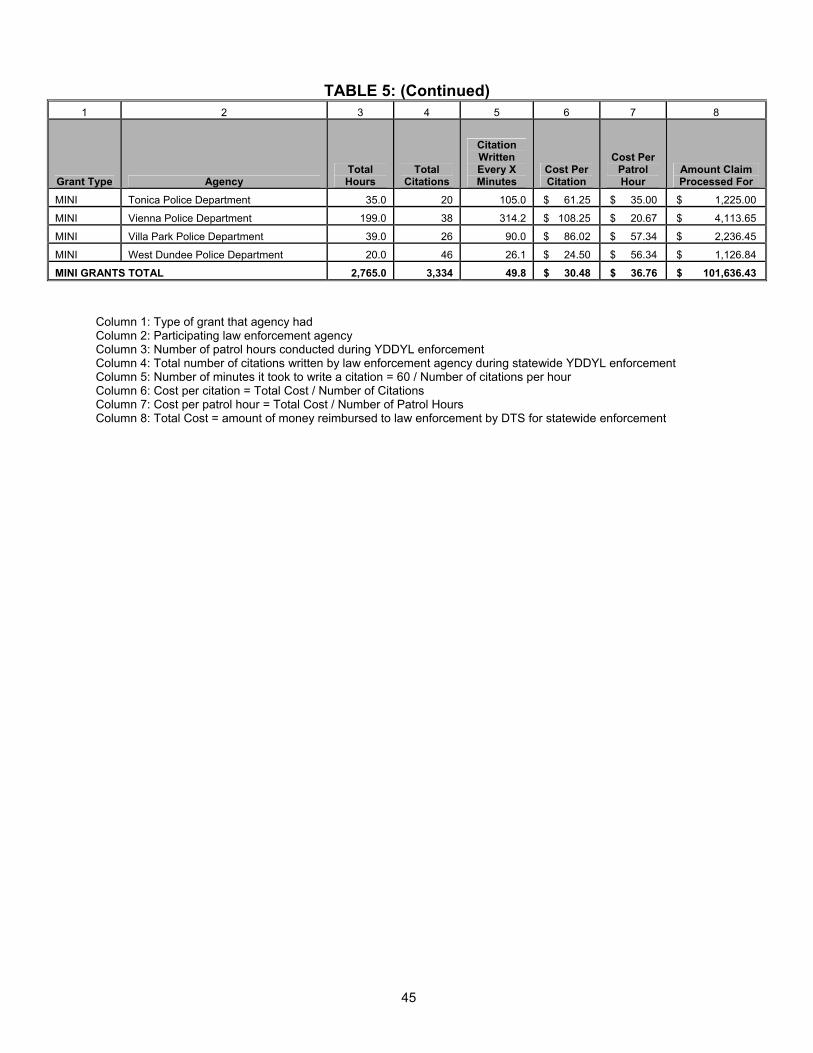
45
TABLE 5: (Continued)
1 2 3 4 5 6 7 8
Grant Type Agency Total Hours
Total Citations
Citation Written Every X Minutes
Cost Per Citation
Cost Per Patrol Hour
Amount Claim Processed For
MINI Tonica Police Department 35.0 20 105.0 $ 61.25 $ 35.00 $ 1,225.00
MINI Vienna Police Department 199.0 38 314.2 $ 108.25 $ 20.67 $ 4,113.65
MINI Villa Park Police Department 39.0 26 90.0 $ 86.02 $ 57.34 $ 2,236.45
MINI West Dundee Police Department 20.0 46 26.1 $ 24.50 $ 56.34 $ 1,126.84
MINI GRANTS TOTAL 2,765.0 3,334 49.8 $ 30.48 $ 36.76 $ 101,636.43
Column 1: Type of grant that agency had Column 2: Participating law enforcement agency Column 3: Number of patrol hours conducted during YDDYL enforcement Column 4: Total number of citations written by law enforcement agency during statewide YDDYL enforcement Column 5: Number of minutes it took to write a citation = 60 / Number of citations per hour Column 6: Cost per citation = Total Cost / Number of Citations Column 7: Cost per patrol hour = Total Cost / Number of Patrol Hours Column 8: Total Cost = amount of money reimbursed to law enforcement by DTS for statewide enforcement

46
TABLE 6: REGULAR GRANTEES WITH SINGLE GRANTS ENFORCEMENT AND
ASSOCIATED COSTS 1 2 3 4 5 6 7 8
Grant Type Agency Total Hours
Total Citations
Citation Written Every X Minutes
Cost Per Citation
Cost Per Patrol Hour
Amount Claim Processed For
IMAGE Belvidere Police Department 177.0 257 41.3 $ 34.45 $ 50.02 $ 8,853.67
IMAGE Berwyn Police Department 309.0 595 31.2 $ 26.76 $ 51.53 $ 15,921.33
IMAGE Blue Island Police Department 180.0 421 25.7 $ 19.06 $ 44.58 $ 8,025.17
IMAGE Brookfield Police Department 96.0 99 58.2 $ 46.37 $ 47.82 $ 4,590.59
IMAGE Columbia Police Department 95.0 105 54.3 $ 37.64 $ 41.60 $ 3,951.75
IMAGE East Peoria Police Department 105.0 185 34.1 $ 29.27 $ 51.56 $ 5,414.25
IMAGE Fairmont City Police Department 69.0 97 42.7 $ 22.85 $ 32.13 $ 2,216.90
IMAGE Glen Carbon Police Department 88.5 99 53.6 $ 40.33 $ 45.12 $ 3,993.11
IMAGE Hickory Hills Police Department 104.0 187 33.4 $ 24.98 $ 44.92 $ 4,672.00
IMAGE Homewood Police Department 95.0 202 28.2 $ 25.46 $ 54.13 $ 5,142.78
IMAGE Jacksonville Police Department 124.0 189 39.4 $ 26.27 $ 40.05 $ 4,965.87
IMAGE Madison Police Department 83.0 111 44.9 $ 25.44 $ 34.02 $ 2,823.76
IMAGE Markham Police Department 100.0 232 25.9 $ 18.67 $ 43.33 $ 4,332.54
IMAGE Metamora Police Department 108.0 109 59.4 $ 28.19 $ 28.45 $ 3,072.35
IMAGE Oak Lawn Police Department 164.5 466 21.2 $ 19.97 $ 56.56 $ 9,304.65
IMAGE Orland Park Police Department 127.0 387 19.7 $ 21.33 $ 65.00 $ 8,255.47
IMAGE Oswego Police Department 183.0 355 30.9 $ 31.31 $ 60.75 $ 11,116.80
IMAGE Palatine Police Department 113.0 253 26.8 $ 29.43 $ 65.90 $ 7,446.42
IMAGE Palos Heights Police Department 105.0 195 32.3 $ 33.41 $ 62.04 $ 6,514.22
IMAGE Pekin Police Department 128.0 173 44.4 $ 32.50 $ 43.92 $ 5,622.03
IMAGE Peoria County Sheriff’s Office 128.0 164 46.8 $ 42.62 $ 54.61 $ 6,989.86
IMAGE Stephenson County Sheriff’s Office 111.0 191 34.9 $ 32.11 $ 55.25 $ 6,132.99
IMAGE Winnetka Police Department 90.0 105 51.4 $ 56.09 $ 65.44 $ 5,889.60
LAP Buffalo Grove Police Department 53.0 107 29.7 $ 30.77 $ 62.12 $ 3,292.24
LAP Skokie Police Department 92.0 187 29.5 $ 35.28 $ 71.71 $ 6,596.92
LAP Waukegan Police Department 216.5 194 67.0 $ 55.26 $ 49.52 $ 10,721.13
MAP Addison Police Department 16.0 11 87.3 $ 63.23 $ 43.47 $ 695.53
MAP Carbondale Police Department 26.0 30 52.0 $ 22.31 $ 25.74 $ 669.15
MAP Edwardsville Police Department 44.0 46 57.4 $ 40.64 $ 42.48 $ 1,869.29
MAP Lake Zurich Police Department 47.0 65 43.4 $ 52.49 $ 72.60 $ 3,412.08
MAP SIU-Carbondale Police Department 35.5 43 0.0 $ 41.71 $ 50.52 $ 1,793.53
RSC Palos Hills Police Department 53.8 242 13.3 $ 7.73 $ 34.79 $ 1,871.57
SEP Carol Stream Police Department 92.0 200 27.6 $ 23.48 $ 51.03 $ 4,695.10
SEP Champaign Police Department 39.0 92 25.4 $ 17.63 $ 41.58 $ 1,621.59
SEP McHenry County Sheriff's Office 76.0 124 36.8 $ 26.05 $ 42.50 $ 3,229.80
SEP Rock Island Police Department 51.0 112 27.3 $ 19.05 $ 41.83 $ 2,133.20

47
TABLE 6: (Continued)
1 2 3 4 5 6 7 8
Grant Type Agency Total Hours
Total Citations
Citation Written Every X Minutes
Cost Per Citation
Cost Per Patrol Hour
Amount Claim Processed For
TLEP Peoria Police Department 134.5 260 31.0 $ 42.58 $ 82.32 $ 11,071.45
TLEP Springfield Police Department 384.0 250 92.2 $ 52.54 $ 34.20 $ 13,134.31
IMAGE GRANTS SUBTOTAL 2,767.5 5,177 32.1 $ 27.65 $ 51.73 $ 143,162.06
LAP GRANTS SUBTOTAL 361.5 488 44.4 $ 42.23 $ 57.01 $ 20,610.29
MAP GRANTS SUBTOTAL 133.0 195 40.9 $ 50.54 $ 74.10 $ 9,855.71
RSC GRANTS SUBTOTAL 53.8 242 13.3 $ 7.73 $ 34.79 $ 1,871.57
SEP GRANTS SUBTOTAL 258.0 528 29.3 $ 22.12 $ 45.27 $ 11,679.69
TLEP GRANTS SUBTOTAL 518.5 510 61.0 $ 47.46 $ 46.68 $ 24,205.76
REGULAR GRANTS TOTAL 4,092.3 7,140 34.4 $ 29.61 $ 51.65 $ 211,385.08
Column 1: Type of grant that agency had Column 2: Participating law enforcement agency Column 3: Number of patrol hours conducted during YDDYL enforcement Column 4: Total number of citations written by law enforcement agency during statewide YDDYL enforcement Column 5: Number of minutes it took to write a citation = 60 / Number of citations per hour Column 6: Cost per citation = Total Cost / Number of Citations Column 7: Cost per patrol hour = Total Cost / Number of Patrol Hours Column 8: Total Cost = amount of money reimbursed to law enforcement by DTS for statewide enforcement Program Descriptions: CMV-SBEP – Commercial Motor Vehicle Safety Belt Enforcement Program CMV-SEP – Commercial Motor Vehicle Speed Enforcement Program IMAGE – Integrated Mini-Grant Enforcement Program LAP – Local Alcohol Program MAP – Mini-Grant Alcohol Program OPEZ – Occupant Protection Enforcement Zone RSC – Roadside Safety Check SEP – Speed Enforcement Program TLEP – Traffic Law Enforcement Program

48
TABLE 7: REGULAR GRANTEES WITH MULTIPLE GRANTS ENFORCEMENT AND
ASSOCIATED COSTS 1 2 3 4 5 6 7 8
Grant Type Agency Total Hours
Total Citations
Citation Written Every X Minutes
Cost Per Citation
Cost Per Patrol Hour
Amount Claim Processed For
LAP Algonquin Police Department 151.0 100 90.6 $ 91.66 $ 60.70 $ 9,165.53
SEP Algonquin Police Department 81.0 161 30.2 $ 25.14 $ 49.98 $ 4,048.20
MAP Alton Police Department 37.0 30 74.0 $ 58.50 $ 47.43 $ 1,755.06
MINI Alton Police Department 104.0 91 68.6 $ 30.61 $ 26.78 $ 2,785.22
CMV-SBEP Barrington Hills Police Department 16.0 16 60.0 $ 49.80 $ 49.80 $ 796.72
MINI Barrington Hills Police Department 50.0 255 11.8 $ 6.15 $ 31.39 $ 1,569.41
IMAGE Burnham Police Department 85.0 121 42.1 $ 29.01 $ 41.30 $ 3,510.52
OPEZ Burnham Police Department 40.0 89 27.0 $ 7.85 $ 17.46 $ 698.32
IMAGE Calumet City Police Department 99.0 293 20.3 $ 17.94 $ 53.09 $ 5,256.15
MINI Calumet City Police Department 155.0 53 175.5 $ 137.51 $ 47.02 $ 7,287.80
SEP Calumet City Police Department 261.0 839 18.7 $ 14.93 $ 48.00 $ 12,529.09
CMV-SBEP Carol Stream Police Department 104.0 281 22.2 $ 20.94 $ 56.58 $ 5,884.19
MINI Carol Stream Police Department 51.0 39 78.5 $ 61.84 $ 47.29 $ 2,411.85
CMV-SBEP Carpentersville Police Department 50.0 60 50.0 $ 48.41 $ 58.09 $ 2,904.70
MAP Carpentersville Police Department 70.0 40 105.0 $ 100.30 $ 57.32 $ 4,012.13
MINI Carpentersville Police Department 70.0 67 62.7 $ 56.76 $ 54.33 $ 3,803.00
CMV-SBEP Chicago Heights Police Department 45.0 109 24.8 $ 18.35 $ 44.45 $ 2,000.27
LAP Chicago Heights Police Department 73.0 73 60.0 $ 61.76 $ 61.76 $ 4,508.58
MAP East Hazel Crest Police Department 11.0 16 41.3 $ 30.31 $ 44.09 $ 485.03
MINI East Hazel Crest Police Department 35.0 42 50.0 $ 30.71 $ 36.85 $ 1,289.63
IMAGE East Moline Police Department 123.0 166 44.5 $ 36.42 $ 49.15 $ 6,045.64
MINI East Moline Police Department 195.0 75 156.0 $ 84.56 $ 32.52 $ 6,341.63
LAP Elgin Police Department 144.0 209 15.5 $ 28.36 $ 41.16 $ 5,926.98
MINI Elgin Police Department 18.0 40 27.0 $ 25.42 $ 56.49 $ 1,016.90
SEP Elgin Police Department 86.0 219 23.6 $ 21.15 $ 53.86 $ 4,631.94
IMAGE Elk Grove Village Police Department 126.0 248 30.5 $ 31.79 $ 62.58 $ 7,885.04
MINI Elk Grove Village Police Department 30.0 49 36.7 $ 31.16 $ 50.90 $ 1,526.90
MAP Glendale Heights Police Department 46.0 51 54.1 $ 46.61 $ 51.67 $ 2,376.96
SEP Glendale Heights Police Department 12.0 15 48.0 $ 38.71 $ 48.38 $ 580.60
CMV-SBEP Joliet Police Department 80.0 138 34.8 $ 33.85 $ 58.40 $ 4,671.60
MINI Joliet Police Department 285.0 280 61.1 $ 41.06 $ 40.34 $ 11,497.88
SEP Joliet Police Department 160.0 336 28.6 $ 26.82 $ 56.33 $ 9,012.05
MINI Lincolnwood Police Department 80.0 11 436.4 $ 389.56 $ 53.57 $ 4,285.20
TLEP Lincolnwood Police Department 132.0 174 45.5 $ 44.26 $ 58.34 $ 7,701.27
IMAGE Mendota Police Department 95.0 78 73.1 $ 49.37 $ 40.53 $ 3,850.52
MINI Mendota Police Department 30.0 10 180.0 $ 94.52 $ 31.51 $ 945.20
IMAGE Monmouth Police Department 105.0 78 80.8 $ 60.61 $ 45.02 $ 4,727.57
MINI Monmouth Police Department 80.0 34 141.2 $ 35.25 $ 14.98 $ 1,198.35
SEP Monmouth Police Department 83.0 114 43.7 $ 25.40 $ 34.89 $ 2,895.49
IMAGE Park Ridge Police Department 164.8 312 31.7 $ 36.98 $ 70.03 $ 11,537.17
OPEZ Park Ridge Police Department 72.5 145 0.0 $ 29.37 $ 58.74 $ 4,258.65

49
TABLE 7: (Continued)
1 2 3 4 5 6 7 8
Grant Type Agency Total Hours
Total Citations
Citation Written Every X Minutes
Cost Per Citation
Cost Per Patrol Hour
Amount Claim Processed For
MINI Peoria Heights Police Department 88.0 44 120.0 $ 49.20 $ 24.60 $ 2,164.84
SEP Peoria Heights Police Department 88.0 180 29.3 $ 19.70 $ 40.30 $ 3,546.33
IMAGE Quincy Police Department 136.0 126 64.8 $ 45.72 $ 42.36 $ 5,761.00
MINI Quincy Police Department 40.3 11 220.0 $ 120.90 $ 32.98 $ 1,329.92
LAP Sangamon County Sheriff's Office 187.0 122 92.0 $ 75.93 $ 49.53 $ 9,262.85
MINI Sangamon County Sheriff's Office 27.0 12 135.0 $ 84.14 $ 37.40 $ 1,009.69
SEP Sangamon County Sheriff's Office 239.0 557 25.7 $ 20.84 $ 48.56 $ 11,605.75
MINI Schaumburg Police Department 126.0 86 87.9 $ 82.02 $ 55.98 $ 7,054.02
SEP Schaumburg Police Department 92.0 204 27.1 $ 24.63 $ 54.62 $ 5,024.63
IMAGE Wheaton Police Department 190.0 382 29.8 $ 25.81 $ 51.89 $ 9,859.70
SEP Wheaton Police Department 108.0 216 30.0 $ 26.21 $ 52.42 $ 5,661.42
LAP Will County Sheriff's Office 96.0 93 61.9 $ 147.49 $ 142.88 $ 13,716.46
MINI Will County Sheriff's Office 25.0 13 115.4 $ 98.71 $ 51.33 $ 1,283.20
SEP Will County Sheriff's Office 233.0 487 28.7 $ 26.79 $ 56.00 $ 13,048.77
MAP Williamson County Sheriff’s Office 48.0 66 43.6 $ 30.76 $ 42.29 $ 2,030.04
MINI Williamson County Sheriff's Office 35.0 17 123.5 $ 54.59 $ 26.51 $ 928.00
CMV-SBEP GRANTS SUBTOTAL 295.0 604 29.3 $ 26.92 $ 55.11 $ 16,257.48
IMAGE GRANTS SUBTOTAL 1,123.8 1,804 37.4 $ 32.39 $ 52.00 $ 58,433.31
LAP GRANTS SUBTOTAL 651.0 597 65.4 $ 71.32 $ 65.41 $ 42,580.40
MAP GRANTS SUBTOTAL 212.0 203 62.7 $ 52.51 $ 50.28 $ 10,659.22
MINI GRANTS SUBTOTAL 1,524.3 1,229 74.4 $ 48.60 $ 39.18 $ 59,728.64
OPEZ GRANTS SUBTOTAL 112.5 234 28.8 $ 21.18 $ 44.06 $ 4,956.97
SEP GRANTS SUBTOTAL 1,443.0 3,328 26.0 $ 21.81 $ 50.30 $ 72,584.27
TLEP GRANTS SUBTOTAL 132.0 174 45.5 $ 44.26 $ 58.34 $ 7,701.27 REGULAR GRANTS WITH MULTIPLE GRANTS TOTAL 5,493.6 8,173 40.3 $ 33.39 $ 49.68 $ 272,901.56
Column 1: Type of grant that agency had
Column 2: Participating law enforcement agency Column 3: Number of patrol hours conducted during YDDYL enforcement Column 4: Total number of citations written by law enforcement agency during statewide YDDYL enforcement Column 5: Number of minutes it took to write a citation = 60 / Number of citations per hour Column 6: Cost per citation = Total Cost / Number of Citations Column 7: Cost per patrol hour = Total Cost / Number of Patrol Hours Column 8: Total Cost = amount of money reimbursed to law enforcement by DTS for statewide enforcement Program Descriptions: CMV-SBEP – Commercial Motor Vehicle Safety Belt Enforcement Program CMV-SEP – Commercial Motor Vehicle Speed Enforcement Program IMAGE – Integrated Mini-Grant Enforcement Program LAP – Local Alcohol Program MAP – Mini-Grant Alcohol Program OPEZ – Occupant Protection Enforcement Zone RSC – Roadside Safety Check SEP – Speed Enforcement Program TLEP – Traffic Law Enforcement Program

50
TABLE 8: ALL GRANT ENFORCEMENT AND ASSOCIATED COSTS 1 2 3 4 5 6 7 8
Grant Type Agency # Patrol Hours
Total Citations
Citation Written Every X Minutes
Cost Per Citation
Cost Per Patrol Hour Total Cost
MINI GRANTS TOTAL 4,289.3 4,563 56.4 $ 35.36 $ 37.62 $ 161,365.07 REGULAR GRANTS TOTAL 8,061.6 14,084 29.3 $ 30.14 $ 55.11 $ 424,558.00 ILLINOIS STATE POLICE TOTAL 4,094.5 2,699 91.0 $ 75.85 $ 50.00 $ 204,725.00
GRAND TOTAL 16,445.4 21,346 46.2 $ 37.04 $ 48.08 $ 790,648.07
Column 1: Type of grant that agency had Column 2: Participating law enforcement agency Column 3: Number of patrol hours conducted during CIOT enforcement Column 4: Total number of citations written by law enforcement agency during statewide CIOT enforcement Column 5: Number of minutes it took to write a citation = 60 / Number of citations per hour Column 6: Cost per citation = Total Cost / Number of Citations Column 7: Cost per patrol hour = Total Cost / Number of Patrol Hours Column 8: Total Cost = amount of money reimbursed to law enforcement by DTS for statewide enforcement