you will enjoy all the comforts of financial world when
TRANSCRIPT

Disclosures and Disclaimer : This report must be read with the disclosures in the Disclosure appendix, and with the Disclaimer, which forms part of it. This document does not contain any investment views or opinions.
Comfort Securities Limited
Daily Research Reports
You will enjoy all the comforts of financial world when you alight with us.

Comfort
Flows From
WISDOM…
Welcome to
The world out there is uncertain. On this backdrop, the market volatility is bound to increase. Believe us, even the big
investors’ sentiment will oscillate—and that is why it is important for us to safely navigate these difficult times.
To do so, Comfort Securities Ltd. brings you this daily market commentary which will help you to sharpen your instincts
on investments in equity markets, gold, silver, crude-oil, USD/INR, the Dow Jones index, Hang Seng index, Euro-Dollar,
etc. On the next few pages, you can learn more about the same. We would love to answer any further questions you may
have in a one-one discussion.
We are pleased to inform you that this report features contributions from the finest analytical minds in the business and
are distinguished by our proactive consulting approach, timely advice, and specific recommendations. We take
satisfaction in seeing clients realize their dreams.
The Comfort Securities team would like to take this opportunity to thank our readers for their support and feedback over
the years. We hope you enjoyed reading this daily newsletter. Above all, we wish that this experience is both
professionally and personally rewarding.
If you have any queries please do contact me or any member of Comfort Securities Ltd. team and we would be glad to
assist.
Best Regards,
Comfort Securities Ltd.Call Us: Tel: 91-22-28811259
Comfort Securities Ltd.
Comfort Securities Limited
Enjoy Your Comfort Zone.
Invest Smart. Build Wealth.
Welcome Note
Thursday05th July, 2018
Stock Of The Day: (F & O)
Forecast and Analysis
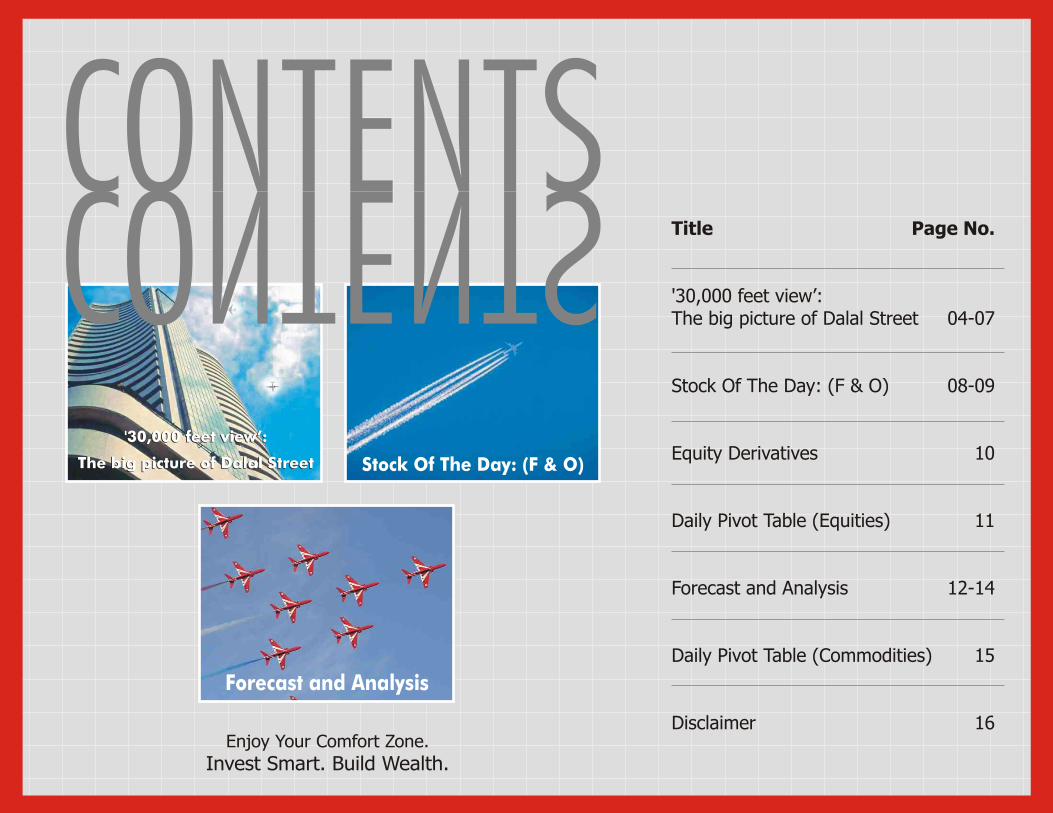
CONTENTSCONTENTS
Enjoy Your Comfort Zone.
Invest Smart. Build Wealth.
Title Page No.
'30,000 feet view’: The big picture of Dalal Street 04-07
Stock Of The Day: (F & O) 08-09
Equity Derivatives 10
Daily Pivot Table (Equities) 11
Forecast and Analysis 12-14
Daily Pivot Table (Commodities) 15
Disclaimer 16
'30,000 feet view’:
The big picture of Dalal Street
'30,000 feet view’:
The big picture of Dalal Street

Enjoy Your Comfort Zone.
Invest Smart. Build Wealth.
'30,000 feet view’: newsletter provides insights and themes for Indian equity markets. We also try and cover international themes for the day. This newsletter is quite popular with traders as it covers the most preferred trading strategy for Sensex/Nifty for the day.
In Chart of the day section, we recommend a stock which is likely to move significantly in the short term, clearly defining the supports, the resistances and bias for the stock.
In a nutshell, '30,000 feet view’: covers themes and insights for the day.
‘30,000 feet view’: The big picture of Dalal Street

www.comfortsecurities.co.inEnjoy Your Comfort Zone.
Invest Smart. Build Wealth.
Nifty Outlook
Intraday
Medium Term
Long Term
Key Levels to Watch
Nifty Support
Nifty Resistance
Pivot Level
Nifty
Outlook for the Day
INDICES
Nifty
Bank Nifty
Nifty Auto Index
Nifty FMCG Index
Nifty Infra Index
Nifty IT Index
Nifty Media Index
Nifty Midcap Index
Nifty Metal Index
Nifty Pharma Index
Nifty Reality Index
Nifty Smallcap Index
Sensex
SGX Nifty
‘30,000 feet view’: The big picture of Dalal Street
Good Morning & Welcome to Thursday’s trading action at Dalal Street, dated 5th July 2018.
In yesterday’s session, bulls partied at Dalal Street and it was truly a "when the cat's away
the mice will play" situation (Wall Street was closed in observance of Independence Day).
Now, when markets open today, caution will again come into play as China readies tariffs
on the U.S. and the EU looks to gather together -- the big auto-making countries to agree a
new trade deal.
Digging deeper, China is expected to begin imposing tariffs on $34 billion of U.S. goods this
Friday, and the Trump administration’s tariffs on up to $50 billion in Chinese imports are
due to take effect the same day, July 6th.
Our call of the day suggests caution should be the buzzword as the big investors’ camp
are unlikely to make big bets as the U.S. President Donald Trump’s campaign to correct
unfair trade conditions with its trading partners continues to reverberate worldwide stock
markets.
Away from trade war concerns, traders will turn some focus to the monthly U.S. jobs
report, due this Friday.
What Technical Tells Us on Nifty: In Wednesday’s trade, the benchmark Nifty logged
modest gains, up 70 points at 10770. Index heavyweights HDFC, HDFC Bank and
Reliance Industries were star performers leading from the front.
The negative takeaway was that the market breadth, indicating the overall health of the
market, was negative. The BSE Mid-Cap index fell 0.17%. The BSE Small-Cap index rose
0.38%. Both these indices underperformed the Sensex.
Technically speaking, the must watch support levels are placed at 10557. The technical
landscape will worsen only if Nifty slips below the 10,557 mark as that would open the door
to massive technical selling, possibly quickly to the 10,327-10,375 zone. Intraday support
seen at 10621.
The biggest hurdles’ are at 10851.
In today’s session, Nifty may most likely trade lackluster and the benchmark most probably
will repeatedly move between positive and negative territory. Aggressive buying advised
only above Nifty 10851 mark.
The price action for Nifty is suggesting that we are likely to see a 10,551-10901
range in near term with slight neutral/positive bias. Hence, establishing long
positions on any intraday weakness with strict stop below 10621 should be the preferred
trading strategy for the day.
Outlook for Thursday: Range bound session likely.
The positive catalyst boosting sentiments at Dalal Street in yesterday’s session was the
upbeat June services PMI data. Interestingly, Dalal Street was seen rebounding in
yesterday’s trade, despite the Indian Rupee falling hard.
Judging at early trends at SGX Nifty, it appears to be a quiet morning for Dalal Street. But
we suspect, volatility may hit the roof as day progresses amidst heightened U.S.-China
trade tensions.
Amid this backdrop, brace yourself for a volatile session as sentiments could get rattled.
Expect our benchmark Nifty to behave erratically — up and down hundreds of points in a
single day.
10770 0.65%
26434 0.88%
10914 1.25%
29108 0.46%
3061 -0.11%
14126 -0.68%
3011 -0.23%
4899 0.31%
3370 0.13%
9400 0.80%
270 0.47%
7212 0.44%
35645 0.75%
10769 -0.04%
Volatile session likely.
Neutral (10645-10777)
Neutral (10301-11001)
Neutral (11301)
10691 & 10621
10777 & 10851
10301

www.comfortsecurities.co.inEnjoy Your Comfort Zone.
Invest Smart. Build Wealth.
Technical Strategy
‘30,000 feet view’: The big picture of Dalal Street
Global Markets:
• The blue-chip Dow Jones index continues to hover near its 200-day moving average
(24,293). Any successive close will be interpreted as a bearish signal.
• Elsewhere in Asia, Japan’s Nikkei is now at a 2 ½ month low; China’s Shanghai
Composite is now at fresh two-year low and most importantly is in a bear market,
trading more than 20% lower than its January 24 high. Hong Kong’s Hang Seng
index is now languishing near 6-month low.
Commodity Cues:
• In commodities, oil prices were trading firm at 3-1/2 year high, fast approaching to
close above the $75 a barrel mark. Oil is holding ground at its highest levels since
2014 in the wake of the biggest weekly decline of the year for domestic crude
supplies. Crude oil is also moving higher on concerns that the ramped up oil
production by Saudi Arabia will be insufficient to make up for disruptions to Libyan
and Venezuelan oil output.
• Gold futures finished sharply higher Wednesday, clawing back from to its lowest
finish since December.
• Industrial metals, meanwhile, remained in focus, amid trade friction and questions
about China’s economic expansion. Platinum prices are at their lowest settlement
since late 2008.
• Prices of the metal, used widely in construction applications, have tumbled roughly
11% since June 7 as China’s trade relations and any economic fallout are watched.
• Copper prices extended losses to a fifth straight session. Copper prices are at their
lowest since August 2017.
Currencies & Bonds:
• The US Dollar index was seen struggling for direction near the 95 mark.
• USD/INR inched up in yesterday's trade amidst value buying. Key interweek support
seen at 67.45. Hurdles now seen at 69.11. Interweek Strategy: Buy between 68.21-
68.30 zone, targeting 69.11 and then aggressive targets at 70-70.05 zone with stop
below 67.45.
Macro Watch:
• Amidst an escalating trade dispute with the U.S., growth in China’s manufacturing
sector cooled slightly in June.
• Caution likely to prevail at our stock markets on the buy side primarily on backdrop
of rising interest rate environment. The prospect of hawkish RBI and then
aggressive Fed action may throw the markets a curveball. The Fed remains on a
path of higher interest rates and balance sheet run-off, providing support for the
U.S. dollar and this theme could work as negative catalyst for our stock markets.
• All eyes will be on release of Federal Reserve minutes of June 12-13 meeting, when
FOMC policy makers raised the benchmark rate a quarter point for the second time
this year and lifted the median forecast to four total increases in 2018.
• U.S. payrolls are due Friday.
Stocks To Watch:
• Our chart of the day suggests establishing long positions in stocks like NIIT
TECH, BIOCON & INDUSIND BANK.
HDFC
Action
Target
Support
Resistance
Holding Period
1922
BUY
1985
1865/1837.50
1945/1985
21 Days.
HDFC’s stock price enjoyed a strong session in
yesterday’s trade, up 2.28%.
The stock is signaling a major breakout from a
higher consolidation zone on the daily charts.
The stock is in bullish position where it wants to
ascent towards its all-time-high at 1986.
The momentum oscillators are in buy mode, and
the major confirmation of the same on any move
above 1942, and such up move needs to be
backed by increases in volumes.
Key support to watch in near term is at 1865 and
then at 1835 zone. Intraday supports seen at
1901 zone.
Establish long positions at CMP, targeting 1942
zone and then aggressive targets located at
1981-1985 zone. Aggressive 3-months targets
seen at 2045-2051 zone. Stop at 1865.

www.comfortsecurities.co.inEnjoy Your Comfort Zone.
Invest Smart. Build Wealth.
‘30,000 feet
view’: The big
picture of
Dalal Street
‘30,000 feet view’: The big picture of Dalal Street
• Bullish stocks: NIIT TECH, BIOCON, LUPIN, BERGER PAINTS, BHARAT
FINANCIAL, INDUSIND BANK, JUBILANT FOODS, TATA ELXSI, BAJAJ FINANCE,
MARICO.
• Bearish stocks: ICICI BANK, IDFC, IDEA CELLULAR.
• Show Me the Money: BUY JUBILANT FOODS (CMP 1429): Jubilant Foods is
aiming to close above its all-time-high placed at 1435. The sequence of higher
high/low still intact on daily, weekly and monthly charts. Interweek Strategy: Buy
between 1409-1415 zone, targeting 1451 and then more aggressive targets located
at 1501 mark. Stop below 1397.
• Infosys to announce June-quarter results on July 13. Hindustan Unilever to consider
Q1 result on July 16
• Cabinet approves a minimum support price for monsoon-sown crops including rice
and pulses . Cabinet raises paddy prices by over and above production. Common
grade paddy price set at Rs1750/100kg, Corn MSP set at Rs1700vs Rs1131 cost,
Rice MSP set at Rs1750vs Rs1166 cost. Pigeon Pea MSP set at Rs5675vs Rs3432 ,
Sunflower MSP set at Rs5388vs Rs3592. Cabinet approves re-capitalization of some
rural banks.
• Q1 results to trickle in: TCS 10 July, INFY 13 July, HUL July 16, ASHOK LEYLAND 17
July, RBL BANK, 19 July, KOTAK BANK 19 July, BAJAJ AUTO 20 July, WIPRO 20 July,
HDFC 30 July
• Stocks banned in F&O segment for today: NIL.
Bulls Vs. Bears: Time to Pick a Side!!
Dalal Street to trade cautiously as at the moment, there seem to be more of headwinds
than tailwinds.
Preferred trade on Nifty: Nifty (10770): Sell between 10795-10801 zone, targeting
10701 and then at 10621-651 zone with stop at 10901.
Preferred trade on Bank Nifty: Bank Nifty (26434): Sell at CMP, targeting 26001 zone
and then at 24901-25101 zone with strict stop at 27201.
Daily Chart of Nifty:

Enjoy Your Comfort Zone.
Invest Smart. Build Wealth.
Comfort stock of the day
Stock Of The Day: (F & O)
When we want to see what's happening far off, we will reach for the binoculars. The binocular helps us to steer out of danger and also accurately spots our targets.
When it comes to trading / investing, that's exactly how Stock Of The Day: (F & O) introduces to the momentum stocks from the list of Future & Option segment, defining their support and resistance levels, and attempts to forecast their movement with a short /medium term perspective.
Stock Of The Day: (F & O)

R2STOCKS LTP S1 S2 R1 TRADING STRATEGYBIAS
Enjoy Your Comfort Zone.
Invest Smart. Build Wealth. www.comfortsecurities.co.in
Stock Of The Day: (F & O)
The stock has signaling a major breakout from a higher consolidation on daily charts. Interweek Strategy: Establish long positions between 277-280 zone, targeting 295 and then aggressive targets located at 305-311 zone. Stop below 273.05.
The stock is signaling a major rebound from an oversold zone on daily charts. Interweek support seen at 603. Interweek Strategy: Establish long positions at CMP, targeting 639-645 zone and then aggressive targets located at 651 mark. Stop below 619.
A probable 'Ascending triangle pattern' seen on Monthly charts. The stock likely to enjoy strong sessions above 555 mark. Intraday support seen at 532. Interweek Strategy: Buy at CMP, targeting 555 and then at 571-575 zone. Stop below 531.
Jubilant Foods is aiming to close above its all-time-high placed at 1435. The sequence of higher high/low still intact on daily, weekly and monthly charts. Intermonth Strategy: Buy between 1409-1415 zone, targeting 1451 and then more aggressive targets located at 1501 mark. Stop below 1397.
The interweek risk is on the upside with immediate targets at 1151-1156 zone. Momentum oscillators signaling major strength. Interweek Strategy: Buy at CMP, targeting 1156 and then at 1185-1192 zone with stop below 1089.
Jubilant Foods is on a steady roll. Aggressive intermonth targets at 1501.
BERGER PAINTS
BIOCON
HAVELLS
JUBILANT FOODS
NIIT TECH
286.2 273 259 295 311 Positive
628.85 619 603 645 651 Positive
546.05 532 521 555 575 Positive
1431.1 1407 1351 1451 1501 Positive
1113 1089 1075 1156 1192 Positive

www.comfortsecurities.co.inEnjoy Your Comfort Zone.
Invest Smart. Build Wealth.
EQUITY DERIVATIVESLooking into the future from present.
Changes in Open Interest (OI) in yesterday’s trade.
Nifty Spot
Bank Nifty Future
VIX
Premium
Nifty Future OI
Bank Nifty Spot OI
BSE Cash Vol. (Rs. in Cr)
NSE Cash Vol.(Rs. in Cr)
NSE Derivative Vol. (Rs. in Cr)
Index Future Volumes
Stock Future Volumes
Index Option Volumes
Stock Option Volumes
Total
Cash Volumes (INR in Cr.)
YesterdayDay Before Yesterday
Derivatives Vol.(INR in Cr.)
No of contracts
Turnover (Rs. In cr.)
Major Changes in Nifty Options (OI)
Thursday05th July, 2018
Market Summary:
In Wednesday’s trade, the benchmark Nifty logged modest gains, up 70 points at 10770.
Index heavyweights HDFC, HDFC Bank and Reliance Industries were star performers
leading from the front.
The negative takeaway was that the market breadth, indicating the overall health of the
market, was negative. The BSE Mid-Cap index fell 0.17%. The BSE Small-Cap index rose
0.38%. Both these indices underperformed the Sensex.
Amongst the sectoral indices, outperforming the Sensex/Nifty were BSE Auto index (up
1.31%), the BSE Healthcare Index (up 0.80%), the BSE Bankex Index (up 0.69%).
Amongst the sectoral indices, underperforming the Sensex/Nifty were BSE India
Infrastructure index (down 0.64%), the BSE IT Index (down 0.60%), the BSE TECK index
(down 0.55%).
Amongst stock specific action, positive bias was seen in stocks like Bajaj Auto (up
4.42%), Lupin (up 3.86%), Maruti (up 2.78%).
Among stocks drifting down were: HINDPETRO (down 2.59%), Grasim (down 2.01%),
Cipla (down 1.98%).
Judging by yesterday’s trading action, the bias for Nifty continues to be neutral/positive,
with key intraday support to watch at 10,691. Confirmation of weakness only if Nifty
moves below 10,557 mark. Hurdles to watch are at 10,851 mark.
Maximum Call Open Interest (OI) stands at 11000 Strike Price, followed by 10800 Strike
Price. Call Buying was seen mostly at the Strike Prices from 10,750-10,850.
Maximum Put OI contracts were seen at strike price 10,600 followed by 10,500 strike
price. Put writing was the theme for strikes prices 10150-10850.
As per Friday’s provisional data available on the NSE, Foreign institutional investors (FIIs)
sold shares worth Rs.284.58 crore. Domestic institutional investors, on the other hand,
bought shares worth Rs 611.01 crore in the Indian equity market.
Highest OI Nifty: Calls 11000: 36.74 L - Puts 10600: 51.76 L
Highest OI Bank Nifty: Calls 27000: 5.85 L - Puts 25500: 6.96 L
Change in Stock Open Interest (OI) in previous day’s trade.
Long Buildup: RELIANCE, RBL BANK, COAL INDIA, LUPIN, GAIL.
Short Buildup: NBCC, NALCO, HINDPETRO, REC, ONGC.
Short Covering: TATA STEEL, SUN PHARMA, MOTHERSON, IBHSGFIN, CADILA
Long Unwinding: CIPLA, TATA GLOBAL, CENTURY.
Stocks banned in F&O segment for today: NIL.
New In Ban: NIL.
Out of Ban: NIL.
Future Call: BUY ASHOK LEYLAND JULY FUTURES at CMP 126.30.
Targets: 133 and then at 143. Stop: 121.65. Holding Period: 0-3
days. Analyst’s Remark: Oversold Zone. (Ashok Leyland July Futures
CMP 126.30).
Option Call: Buy BANK NIFTY JULY CE strike price 26200 at CMP
259.80. Profit: Unlimited. Maximum Loss: Rs. 10392. Stop: Exit Call
Option if Bank Nifty moves below 26100. (Bank Nifty July Futures
CMP 26425).
10769.90 (+0.65%)
26433.95 (+088%)
12.6575 (-2.63%)
+01 vs +24
2.11 crores (-1.00%)
22.39 lakhs (+5.43%)
2889.89 2029.49
25098.4 24545.16
872090 574868
210022 19259
668023 44581
7667048 774378
474334 33872
9019427 872090
Calls in lakhs (%Change)
10800 28.81 (+2%)
10700 25.78 (-6%)
11000 36.74 (+1%)
Puts in lakhs (% Change)
10600 51.76 (0%)
10700 27.12 (+18%)
10500 36.46 (+6%)
www.comfortsecurities.co.in
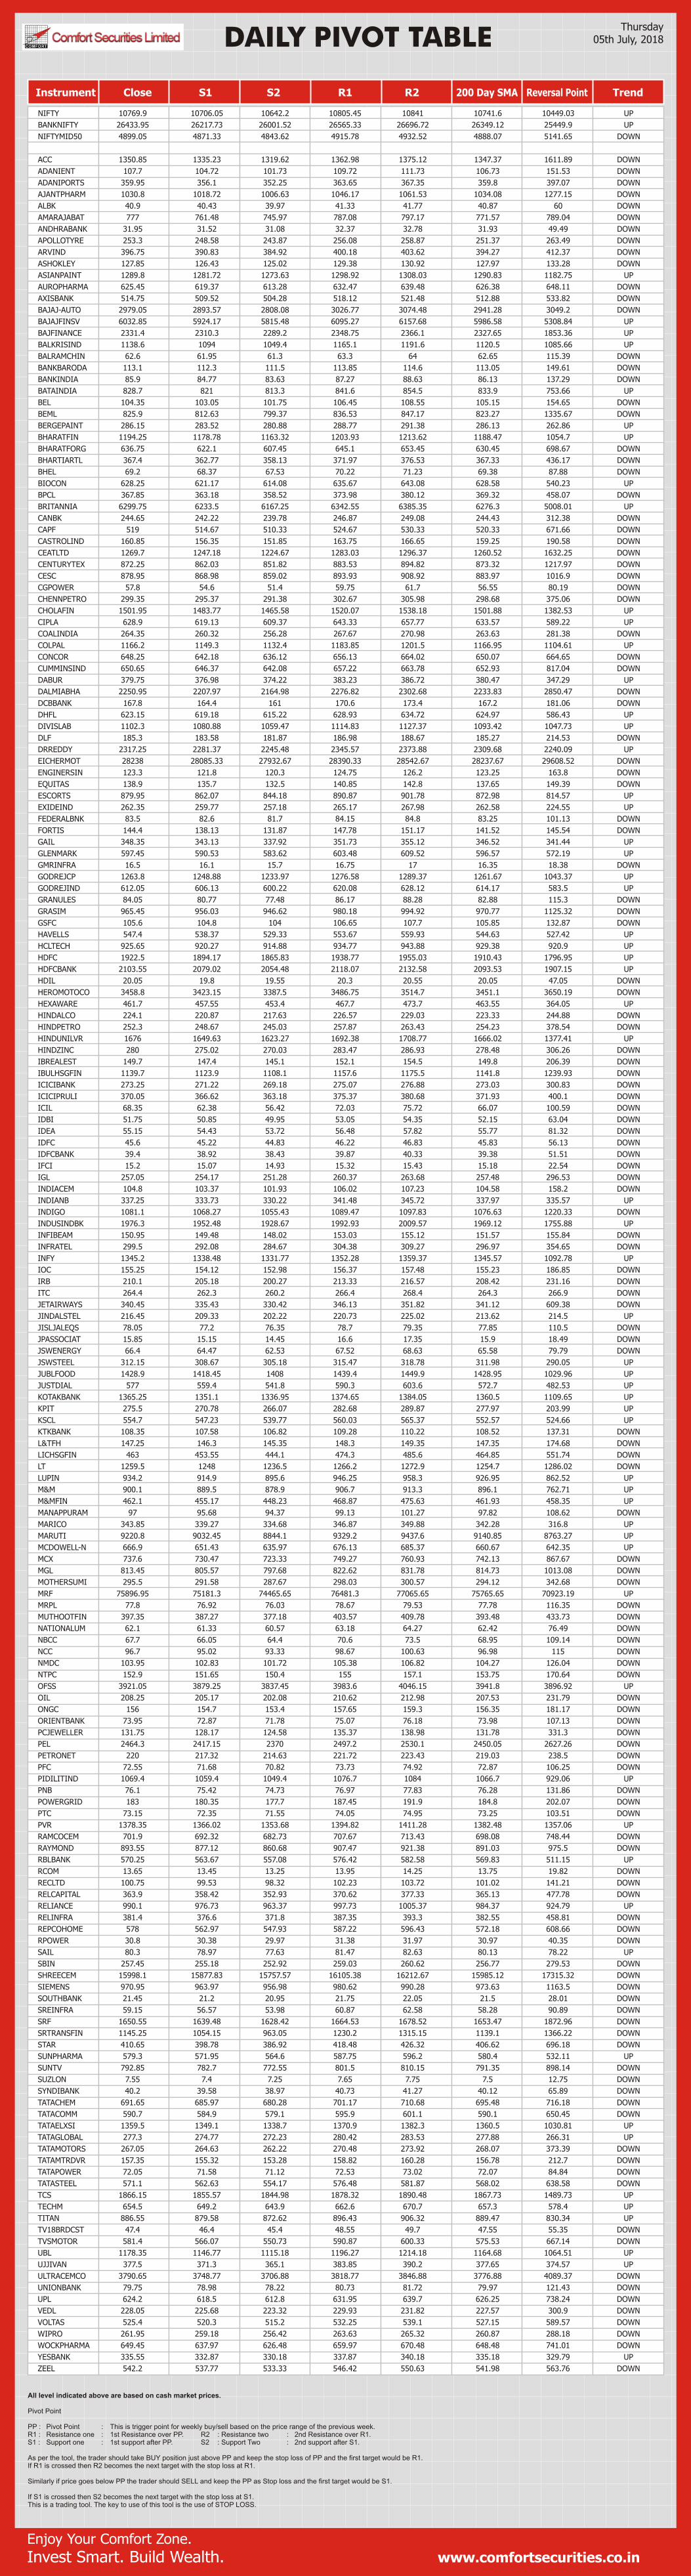
DAILY PIVOT TABLE
Enjoy Your Comfort Zone.
Invest Smart. Build Wealth.
Instrument Close S1 S2 R1 R2 200 Day SMA Reversal Point Trend
All level indicated above are based on cash market prices.
Pivot Point
PP : Pivot Point : This is trigger point for weekly buy/sell based on the price range of the previous week.R1 : Resistance one : 1st Resistance over PP. R2 : Resistance two : 2nd Resistance over R1.S1 : Support one : 1st support after PP. S2 : Support Two : 2nd support after S1.
As per the tool, the trader should take BUY position just above PP and keep the stop loss of PP and the first target would be R1.If R1 is crossed then R2 becomes the next target with the stop loss at R1.
Similarly if price goes below PP the trader should SELL and keep the PP as Stop loss and the first target would be S1.
If S1 is crossed then S2 becomes the next target with the stop loss at S1.This is a trading tool. The key to use of this tool is the use of STOP LOSS.
Thursday05th July, 2018
NIFTY 10769.9 10706.05 10642.2 10805.45 10841 10741.6 10449.03 UP
BANKNIFTY 26433.95 26217.73 26001.52 26565.33 26696.72 26349.12 25449.9 UP
NIFTYMID50 4899.05 4871.33 4843.62 4915.78 4932.52 4888.07 5141.65 DOWN
ACC 1350.85 1335.23 1319.62 1362.98 1375.12 1347.37 1611.89 DOWN
ADANIENT 107.7 104.72 101.73 109.72 111.73 106.73 151.53 DOWN
ADANIPORTS 359.95 356.1 352.25 363.65 367.35 359.8 397.07 DOWN
AJANTPHARM 1030.8 1018.72 1006.63 1046.17 1061.53 1034.08 1277.15 DOWN
ALBK 40.9 40.43 39.97 41.33 41.77 40.87 60 DOWN
AMARAJABAT 777 761.48 745.97 787.08 797.17 771.57 789.04 DOWN
ANDHRABANK 31.95 31.52 31.08 32.37 32.78 31.93 49.49 DOWN
APOLLOTYRE 253.3 248.58 243.87 256.08 258.87 251.37 263.49 DOWN
ARVIND 396.75 390.83 384.92 400.18 403.62 394.27 412.37 DOWN
ASHOKLEY 127.85 126.43 125.02 129.38 130.92 127.97 133.28 DOWN
ASIANPAINT 1289.8 1281.72 1273.63 1298.92 1308.03 1290.83 1182.75 UP
AUROPHARMA 625.45 619.37 613.28 632.47 639.48 626.38 648.11 DOWN
AXISBANK 514.75 509.52 504.28 518.12 521.48 512.88 533.82 DOWN
BAJAJ-AUTO 2979.05 2893.57 2808.08 3026.77 3074.48 2941.28 3049.2 DOWN
BAJAJFINSV 6032.85 5924.17 5815.48 6095.27 6157.68 5986.58 5308.84 UP
BAJFINANCE 2331.4 2310.3 2289.2 2348.75 2366.1 2327.65 1853.36 UP
BALKRISIND 1138.6 1094 1049.4 1165.1 1191.6 1120.5 1085.66 UP
BALRAMCHIN 62.6 61.95 61.3 63.3 64 62.65 115.39 DOWN
BANKBARODA 113.1 112.3 111.5 113.85 114.6 113.05 149.61 DOWN
BANKINDIA 85.9 84.77 83.63 87.27 88.63 86.13 137.29 DOWN
BATAINDIA 828.7 821 813.3 841.6 854.5 833.9 753.66 UP
BEL 104.35 103.05 101.75 106.45 108.55 105.15 154.65 DOWN
BEML 825.9 812.63 799.37 836.53 847.17 823.27 1335.67 DOWN
BERGEPAINT 286.15 283.52 280.88 288.77 291.38 286.13 262.86 UP
BHARATFIN 1194.25 1178.78 1163.32 1203.93 1213.62 1188.47 1054.7 UP
BHARATFORG 636.75 622.1 607.45 645.1 653.45 630.45 698.67 DOWN
BHARTIARTL 367.4 362.77 358.13 371.97 376.53 367.33 436.17 DOWN
BHEL 69.2 68.37 67.53 70.22 71.23 69.38 87.88 DOWN
BIOCON 628.25 621.17 614.08 635.67 643.08 628.58 540.23 UP
BPCL 367.85 363.18 358.52 373.98 380.12 369.32 458.07 DOWN
BRITANNIA 6299.75 6233.5 6167.25 6342.55 6385.35 6276.3 5008.01 UP
CANBK 244.65 242.22 239.78 246.87 249.08 244.43 312.38 DOWN
CAPF 519 514.67 510.33 524.67 530.33 520.33 671.66 DOWN
CASTROLIND 160.85 156.35 151.85 163.75 166.65 159.25 190.58 DOWN
CEATLTD 1269.7 1247.18 1224.67 1283.03 1296.37 1260.52 1632.25 DOWN
CENTURYTEX 872.25 862.03 851.82 883.53 894.82 873.32 1217.97 DOWN
CESC 878.95 868.98 859.02 893.93 908.92 883.97 1016.9 DOWN
CGPOWER 57.8 54.6 51.4 59.75 61.7 56.55 80.19 DOWN
CHENNPETRO 299.35 295.37 291.38 302.67 305.98 298.68 375.06 DOWN
CHOLAFIN 1501.95 1483.77 1465.58 1520.07 1538.18 1501.88 1382.53 UP
CIPLA 628.9 619.13 609.37 643.33 657.77 633.57 589.22 UP
COALINDIA 264.35 260.32 256.28 267.67 270.98 263.63 281.38 DOWN
COLPAL 1166.2 1149.3 1132.4 1183.85 1201.5 1166.95 1104.61 UP
CONCOR 648.25 642.18 636.12 656.13 664.02 650.07 664.65 DOWN
CUMMINSIND 650.65 646.37 642.08 657.22 663.78 652.93 817.04 DOWN
DABUR 379.75 376.98 374.22 383.23 386.72 380.47 347.29 UP
DALMIABHA 2250.95 2207.97 2164.98 2276.82 2302.68 2233.83 2850.47 DOWN
DCBBANK 167.8 164.4 161 170.6 173.4 167.2 181.06 DOWN
DHFL 623.15 619.18 615.22 628.93 634.72 624.97 586.43 UP
DIVISLAB 1102.3 1080.88 1059.47 1114.83 1127.37 1093.42 1047.73 UP
DLF 185.3 183.58 181.87 186.98 188.67 185.27 214.53 DOWN
DRREDDY 2317.25 2281.37 2245.48 2345.57 2373.88 2309.68 2240.09 UP
EICHERMOT 28238 28085.33 27932.67 28390.33 28542.67 28237.67 29608.52 DOWN
ENGINERSIN 123.3 121.8 120.3 124.75 126.2 123.25 163.8 DOWN
EQUITAS 138.9 135.7 132.5 140.85 142.8 137.65 149.39 DOWN
ESCORTS 879.95 862.07 844.18 890.87 901.78 872.98 814.57 UP
EXIDEIND 262.35 259.77 257.18 265.17 267.98 262.58 224.55 UP
FEDERALBNK 83.5 82.6 81.7 84.15 84.8 83.25 101.13 DOWN
FORTIS 144.4 138.13 131.87 147.78 151.17 141.52 145.54 DOWN
GAIL 348.35 343.13 337.92 351.73 355.12 346.52 341.44 UP
GLENMARK 597.45 590.53 583.62 603.48 609.52 596.57 572.19 UP
GMRINFRA 16.5 16.1 15.7 16.75 17 16.35 18.38 DOWN
GODREJCP 1263.8 1248.88 1233.97 1276.58 1289.37 1261.67 1043.37 UP
GODREJIND 612.05 606.13 600.22 620.08 628.12 614.17 583.5 UP
GRANULES 84.05 80.77 77.48 86.17 88.28 82.88 115.3 DOWN
GRASIM 965.45 956.03 946.62 980.18 994.92 970.77 1125.32 DOWN
GSFC 105.6 104.8 104 106.65 107.7 105.85 132.87 DOWN
HAVELLS 547.4 538.37 529.33 553.67 559.93 544.63 527.42 UP
HCLTECH 925.65 920.27 914.88 934.77 943.88 929.38 920.9 UP
HDFC 1922.5 1894.17 1865.83 1938.77 1955.03 1910.43 1796.95 UP
HDFCBANK 2103.55 2079.02 2054.48 2118.07 2132.58 2093.53 1907.15 UP
HDIL 20.05 19.8 19.55 20.3 20.55 20.05 47.05 DOWN
HEROMOTOCO 3458.8 3423.15 3387.5 3486.75 3514.7 3451.1 3650.19 DOWN
HEXAWARE 461.7 457.55 453.4 467.7 473.7 463.55 364.05 UP
HINDALCO 224.1 220.87 217.63 226.57 229.03 223.33 244.88 DOWN
HINDPETRO 252.3 248.67 245.03 257.87 263.43 254.23 378.54 DOWN
HINDUNILVR 1676 1649.63 1623.27 1692.38 1708.77 1666.02 1377.41 UP
HINDZINC 280 275.02 270.03 283.47 286.93 278.48 306.26 DOWN
IBREALEST 149.7 147.4 145.1 152.1 154.5 149.8 206.39 DOWN
IBULHSGFIN 1139.7 1123.9 1108.1 1157.6 1175.5 1141.8 1239.93 DOWN
ICICIBANK 273.25 271.22 269.18 275.07 276.88 273.03 300.83 DOWN
ICICIPRULI 370.05 366.62 363.18 375.37 380.68 371.93 400.1 DOWN
ICIL 68.35 62.38 56.42 72.03 75.72 66.07 100.59 DOWN
IDBI 51.75 50.85 49.95 53.05 54.35 52.15 63.04 DOWN
IDEA 55.15 54.43 53.72 56.48 57.82 55.77 81.32 DOWN
IDFC 45.6 45.22 44.83 46.22 46.83 45.83 56.13 DOWN
IDFCBANK 39.4 38.92 38.43 39.87 40.33 39.38 51.51 DOWN
IFCI 15.2 15.07 14.93 15.32 15.43 15.18 22.54 DOWN
IGL 257.05 254.17 251.28 260.37 263.68 257.48 296.53 DOWN
INDIACEM 104.8 103.37 101.93 106.02 107.23 104.58 158.2 DOWN
INDIANB 337.25 333.73 330.22 341.48 345.72 337.97 335.57 UP
INDIGO 1081.1 1068.27 1055.43 1089.47 1097.83 1076.63 1220.33 DOWN
INDUSINDBK 1976.3 1952.48 1928.67 1992.93 2009.57 1969.12 1755.88 UP
INFIBEAM 150.95 149.48 148.02 153.03 155.12 151.57 155.84 DOWN
INFRATEL 299.5 292.08 284.67 304.38 309.27 296.97 354.65 DOWN
INFY 1345.2 1338.48 1331.77 1352.28 1359.37 1345.57 1092.78 UP
IOC 155.25 154.12 152.98 156.37 157.48 155.23 186.85 DOWN
IRB 210.1 205.18 200.27 213.33 216.57 208.42 231.16 DOWN
ITC 264.4 262.3 260.2 266.4 268.4 264.3 266.9 DOWN
JETAIRWAYS 340.45 335.43 330.42 346.13 351.82 341.12 609.38 DOWN
JINDALSTEL 216.45 209.33 202.22 220.73 225.02 213.62 214.5 UP
JISLJALEQS 78.05 77.2 76.35 78.7 79.35 77.85 110.5 DOWN
JPASSOCIAT 15.85 15.15 14.45 16.6 17.35 15.9 18.49 DOWN
JSWENERGY 66.4 64.47 62.53 67.52 68.63 65.58 79.79 DOWN
JSWSTEEL 312.15 308.67 305.18 315.47 318.78 311.98 290.05 UP
JUBLFOOD 1428.9 1418.45 1408 1439.4 1449.9 1428.95 1029.96 UP
JUSTDIAL 577 559.4 541.8 590.3 603.6 572.7 482.53 UP
KOTAKBANK 1365.25 1351.1 1336.95 1374.65 1384.05 1360.5 1109.65 UP
KPIT 275.5 270.78 266.07 282.68 289.87 277.97 203.99 UP
KSCL 554.7 547.23 539.77 560.03 565.37 552.57 524.66 UP
KTKBANK 108.35 107.58 106.82 109.28 110.22 108.52 137.31 DOWN
L&TFH 147.25 146.3 145.35 148.3 149.35 147.35 174.68 DOWN
LICHSGFIN 463 453.55 444.1 474.3 485.6 464.85 551.74 DOWN
LT 1259.5 1248 1236.5 1266.2 1272.9 1254.7 1286.02 DOWN
LUPIN 934.2 914.9 895.6 946.25 958.3 926.95 862.52 UP
M&M 900.1 889.5 878.9 906.7 913.3 896.1 762.71 UP
M&MFIN 462.1 455.17 448.23 468.87 475.63 461.93 458.35 UP
MANAPPURAM 97 95.68 94.37 99.13 101.27 97.82 108.62 DOWN
MARICO 343.85 339.27 334.68 346.87 349.88 342.28 316.8 UP
MARUTI 9220.8 9032.45 8844.1 9329.2 9437.6 9140.85 8763.27 UP
MCDOWELL-N 666.9 651.43 635.97 676.13 685.37 660.67 642.35 UP
MCX 737.6 730.47 723.33 749.27 760.93 742.13 867.67 DOWN
MGL 813.45 805.57 797.68 822.62 831.78 814.73 1013.08 DOWN
MOTHERSUMI 295.5 291.58 287.67 298.03 300.57 294.12 342.68 DOWN
MRF 75896.95 75181.3 74465.65 76481.3 77065.65 75765.65 70923.19 UP
MRPL 77.8 76.92 76.03 78.67 79.53 77.78 116.35 DOWN
MUTHOOTFIN 397.35 387.27 377.18 403.57 409.78 393.48 433.73 DOWN
NATIONALUM 62.1 61.33 60.57 63.18 64.27 62.42 76.49 DOWN
NBCC 67.7 66.05 64.4 70.6 73.5 68.95 109.14 DOWN
NCC 96.7 95.02 93.33 98.67 100.63 96.98 115 DOWN
NMDC 103.95 102.83 101.72 105.38 106.82 104.27 126.04 DOWN
NTPC 152.9 151.65 150.4 155 157.1 153.75 170.64 DOWN
OFSS 3921.05 3879.25 3837.45 3983.6 4046.15 3941.8 3896.92 UP
OIL 208.25 205.17 202.08 210.62 212.98 207.53 231.79 DOWN
ONGC 156 154.7 153.4 157.65 159.3 156.35 181.17 DOWN
ORIENTBANK 73.95 72.87 71.78 75.07 76.18 73.98 107.13 DOWN
PCJEWELLER 131.75 128.17 124.58 135.37 138.98 131.78 331.3 DOWN
PEL 2464.3 2417.15 2370 2497.2 2530.1 2450.05 2627.26 DOWN
PETRONET 220 217.32 214.63 221.72 223.43 219.03 238.5 DOWN
PFC 72.55 71.68 70.82 73.73 74.92 72.87 106.25 DOWN
PIDILITIND 1069.4 1059.4 1049.4 1076.7 1084 1066.7 929.06 UP
PNB 76.1 75.42 74.73 76.97 77.83 76.28 131.86 DOWN
POWERGRID 183 180.35 177.7 187.45 191.9 184.8 202.07 DOWN
PTC 73.15 72.35 71.55 74.05 74.95 73.25 103.51 DOWN
PVR 1378.35 1366.02 1353.68 1394.82 1411.28 1382.48 1357.06 UP
RAMCOCEM 701.9 692.32 682.73 707.67 713.43 698.08 748.44 DOWN
RAYMOND 893.55 877.12 860.68 907.47 921.38 891.03 975.5 DOWN
RBLBANK 570.25 563.67 557.08 576.42 582.58 569.83 511.15 UP
RCOM 13.65 13.45 13.25 13.95 14.25 13.75 19.82 DOWN
RECLTD 100.75 99.53 98.32 102.23 103.72 101.02 141.21 DOWN
RELCAPITAL 363.9 358.42 352.93 370.62 377.33 365.13 477.78 DOWN
RELIANCE 990.1 976.73 963.37 997.73 1005.37 984.37 924.79 UP
RELINFRA 381.4 376.6 371.8 387.35 393.3 382.55 458.81 DOWN
REPCOHOME 578 562.97 547.93 587.22 596.43 572.18 608.66 DOWN
RPOWER 30.8 30.38 29.97 31.38 31.97 30.97 40.35 DOWN
SAIL 80.3 78.97 77.63 81.47 82.63 80.13 78.22 UP
SBIN 257.45 255.18 252.92 259.03 260.62 256.77 279.53 DOWN
SHREECEM 15998.1 15877.83 15757.57 16105.38 16212.67 15985.12 17315.32 DOWN
SIEMENS 970.95 963.97 956.98 980.62 990.28 973.63 1163.5 DOWN
SOUTHBANK 21.45 21.2 20.95 21.75 22.05 21.5 28.01 DOWN
SREINFRA 59.15 56.57 53.98 60.87 62.58 58.28 90.89 DOWN
SRF 1650.55 1639.48 1628.42 1664.53 1678.52 1653.47 1872.96 DOWN
SRTRANSFIN 1145.25 1054.15 963.05 1230.2 1315.15 1139.1 1366.22 DOWN
STAR 410.65 398.78 386.92 418.48 426.32 406.62 696.18 DOWN
SUNPHARMA 579.3 571.95 564.6 587.75 596.2 580.4 532.11 UP
SUNTV 792.85 782.7 772.55 801.5 810.15 791.35 898.14 DOWN
SUZLON 7.55 7.4 7.25 7.65 7.75 7.5 12.75 DOWN
SYNDIBANK 40.2 39.58 38.97 40.73 41.27 40.12 65.89 DOWN
TATACHEM 691.65 685.97 680.28 701.17 710.68 695.48 716.18 DOWN
TATACOMM 590.7 584.9 579.1 595.9 601.1 590.1 650.45 DOWN
TATAELXSI 1359.5 1349.1 1338.7 1370.9 1382.3 1360.5 1030.81 UP
TATAGLOBAL 277.3 274.77 272.23 280.42 283.53 277.88 266.31 UP
TATAMOTORS 267.05 264.63 262.22 270.48 273.92 268.07 373.39 DOWN
TATAMTRDVR 157.35 155.32 153.28 158.82 160.28 156.78 212.7 DOWN
TATAPOWER 72.05 71.58 71.12 72.53 73.02 72.07 84.84 DOWN
TATASTEEL 571.1 562.63 554.17 576.48 581.87 568.02 638.58 DOWN
TCS 1866.15 1855.57 1844.98 1878.32 1890.48 1867.73 1489.73 UP
TECHM 654.5 649.2 643.9 662.6 670.7 657.3 578.4 UP
TITAN 886.55 879.58 872.62 896.43 906.32 889.47 830.34 UP
TV18BRDCST 47.4 46.4 45.4 48.55 49.7 47.55 55.35 DOWN
TVSMOTOR 581.4 566.07 550.73 590.87 600.33 575.53 667.14 DOWN
UBL 1178.35 1146.77 1115.18 1196.27 1214.18 1164.68 1064.51 UP
UJJIVAN 377.5 371.3 365.1 383.85 390.2 377.65 374.57 UP
ULTRACEMCO 3790.65 3748.77 3706.88 3818.77 3846.88 3776.88 4089.37 DOWN
UNIONBANK 79.75 78.98 78.22 80.73 81.72 79.97 121.43 DOWN
UPL 624.2 618.5 612.8 631.95 639.7 626.25 738.24 DOWN
VEDL 228.05 225.68 223.32 229.93 231.82 227.57 300.9 DOWN
VOLTAS 525.4 520.3 515.2 532.25 539.1 527.15 589.57 DOWN
WIPRO 261.95 259.18 256.42 263.63 265.32 260.87 288.18 DOWN
WOCKPHARMA 649.45 637.97 626.48 659.97 670.48 648.48 741.01 DOWN
YESBANK 335.55 332.87 330.18 337.87 340.18 335.18 329.79 UP
ZEEL 542.2 537.77 533.33 546.42 550.63 541.98 563.76 DOWN

Enjoy Your Comfort Zone.
Invest Smart. Build Wealth.
Comfort ‘Forecast and Analysis’
Forecast and Analysis is a daily newsletter that provides technical update on all the major instruments of the world like Gold, Silver, Crude Oil, US Dollar Index and USD/INR. We define their support and resistance levels and attempt to forecast their movement with a short / medium term perspective. Also in the report, a trader will find bias for the mentioned instruments.
This newsletter is also quite popular with a market participant who loves to have insight & theme on MCX Gold, MCX Silver as well MCX Crude-Oil.
Forecast and Analysis

Instrument TRADING STRATEGYLTP S1 S2 R1 R2 Bias
www.comfortsecurities.co.in
MCX GOLD
MCX SILVER
MCX CRUDE OIL
MCX COPPER
MCX NATURAL GAS
USD-INR
Forecast and Analysis …Direction at a glance
Enjoy Your Comfort Zone.
Invest Smart. Build Wealth.
In yesterday's trade, MCX Gold was seen trading rangebound. Bias continues to be neutral. Confirmation of strength above 31251. Interweek Strategy: Establish long positions at CMP, targeting 31001 zone and then at 31201-31251 zone with stop at 29991.
Silver prices too were seen trading range bound. Bias continues to be neutral. Establish short positions between 40251-40501 zone, targeting 39481 and then at 38641-38701 zone with stop at 40701.
The biggest support level to watch is at 4945. Interweek strategy: Buy only on dips between 4945-5001 zone, targeting 5250 zone and then at 5445-5505 zone with stop at 4901.
Copper prices were seen drifting down in yesterday's trade. Support now seen at 437.50. Confirmation of strength only above 469. Interweek strategy: Establish buy positions above 555, targeting 469 and then at 483-485 zone with stop at 433.
Natural Gas prices were seen consolidating in yesterday's trade. Key supports now at 185. Interweek strategy: Establish long positions at CMP, targeting 207 and then aggressive targets at 217-223 zone with stop at 185.
USD/INR inched up in yesterday's trade despite strength in domestic stock markets. Key interweek support seen at 67.45. Hurdles now seen at 69.11. Interweek Strategy: Buy between 68.21-68.30 zone, targeting 69.11 and then aggressive targets at 70-70.05 zone with stop below 67.45.
30575 30251 30001 31251 31750 Neutral
3951 39001 38641 40451 41751 Neutral
5079 4945 4627 5245 5505 Positive
442 438 421 455 469 Neutral
198.80 197.50 185.00 207.00 225.00 Positive
68.73 68.21 67.45 69.11 70.05 Positive
MCX CRUDE OIL: Intraday hurdles seen at 5245. Positive bias.

Instrument TRADING STRATEGYLTP S1 S2 R1 R2
www.comfortsecurities.co.in
GOLD $
SILVER ($)
WTI CRUDE OIL ($ )
EUR/USD
Forecast and Analysis …Sailing global trend
Bias
DOW JONES
US Dollar Index
Enjoy Your Comfort Zone.
Invest Smart. Build Wealth.
Gold attempts a rebound in a rebound session. Strength seen only above $1268.
In yesterday's trade, gold prices were seen rebounding in yesterday's trade. Confirmation of strength only above 1268. Interweek strategy: Establish long positions at CMP, targeting 1268 zone and then at 1291-1297 zone with stop at 1239.
Silver prices were seen inching up, tracking strength in gold prices. Confirmation of strength only above 17.05. Interweek strategy: Establish long positions between 15.90-16.01 zone, targeting 17.05 and then at 17.95-18.01 zone with stop at 15.05.
Crude-Oil prices was seen consolidating in yesterday's trade. Major hurdles now seen at 77-77.50 zone. Interweek strategy: Buy between 71.45-72.05 zone, targeting 77.50 zone and then at 79-81.05 with stop at 71.05.
The EUR/USD was seen inching up in yesterday's trade. Technically, the bias continues to be neutral with key support to watch on EUR/USD at 1.1505. Hurdles seen at 1.1901.
The U.S. dollar traded sideways in yesterday's trade. Technically, bias continues to be positive. Hurdles at 97.50. Downside well supported at 92.50. Major weakness now below 92.50. Upside targets now at 99.
The Dow Jones Industrial Average was shut for the Independence Day holiday Dow Jones Industrial Average futures were seen rising 64 points, or 0.3%, to 24,277. Expect Wall Street to struggle as trade tensions between the U.S. and its major trading partners continued to show signs of escalating.. Negative bias.
1255 1245 1239 1268 1297 Neutral
16.07 15.75 15.05 17.05 18.01 Neutral
73.84 71.45 67.45 77.5 81.05 Neutral
1.1642 1.1505 1.4445 1.1901 1.2205 Neutral
94.68 92.50 89.25 97.50 99.00 Positive
24174 23405 22501 25505 26125 Negative

www.comfortsecurities.co.in
DAILY PIVOT TABLE
Enjoy Your Comfort Zone.
Invest Smart. Build Wealth.
CommodityExchange Close S1 S2 R1 R2200 Day
SMA Reversal
Point Trend
MCX ALUMINUM
MCX CARDAMOM
NCDEX CASTOR
NCDEX CHANA
MCX COPPER
MCX COTTON
MCX CRUDE-OIL
MCX GOLD
NCDEX GAUR GUM
NCDEX GAUR SEED
NCDEX JEERA
MCX LEAD
MCX MENTHA OIL
MCX NATURAL GAS
MCX NICKLE
NCDEX RM SEED
MCX SILVER
NCDEX SUGAR
NCDEX SOYA BEAN
MCX ZINC
144.2 142.82 141.43 146.42 148.63 142.55 152.25 DOWN
1012.7 1001.17 989.63 1028.07 1043.43 1036.36 956.3 UP
4190 4163.33 4136.67 4215.33 4240.67 4242.17 4086 UP
3580 3534.33 3488.67 3609.33 3638.67 4155.73 3368 UP
445.75 442.37 438.98 451.17 456.58 451.1 459.97 DOWN
22280 22180 22080 22380 22480 20122.45 21780 UP
5080 4992.33 4904.67 5170.33 5260.67 4053.02 4821 UP
30493 30300.33 30107.67 30629.33 30765.67 30130.27 30810.5 DOWN
8240 8161.67 8083.33 8328.67 8417.33 8562.16 7838 UP
3884.5 3849.33 3814.17 3924.33 3964.17 3957.99 3704 UP
18370 18118.33 17866.67 18608.33 18846.67 17740.97 17050 UP
164.35 163.48 162.62 165.53 166.72 161.37 168.95 DOWN
1318.9 1292.97 1267.03 1331.87 1344.83 1415.53 1172.7 UP
198.4 196.73 195.07 199.93 201.47 188.12 196 UP
984.5 974 963.5 1003.6 1022.7 856.88 1060.3 DOWN
4028 4009 3990 4043 4058 3954.31 3937 UP
39078 38795.66 38513.33 39236.66 39395.33 39142.84 40065 DOWN
2709 2709 2709 2709 2709 3619.22 2651 UP
3579 3551.67 3524.33 3615.67 3652.33 3369.59 3433 UP
192.85 191.12 189.38 196.07 199.28 211.87 204.75 DOWN
Thursday05th July, 2018

Comfort Securities Ltd.
DISCLAIMER: This is solely for information of clients of Comfort Securities Ltd. and does not construe to be an investment advice. It is also not intended as an offer or solicitation for the purchase and sale of any financial instruments. Any action taken by you on the basis of the information contained herein is your responsibility alone and Comfort Securities Ltd. its subsidiaries or its employees or associates will not be liable in any manner for the consequences of such action taken by you. We have exercised due diligence in checking the correctness and authenticity of the information contained in this recommendation, but Comfort Securities Ltd. or any of its subsidiaries or associates or employees shall not be in any way responsible for any loss or damage that may arise to any person from any inadvertent error in the information contained in this recommendation or any action taken on basis of this information.
Technical analysis studies market psychology, price patterns and volume levels. It is used to forecast future price and market movements. Technical analysis is complementary to fundamental analysis and news sources. The recommendations issued herewith might be contrary to recommendations issued by Comfort Securities Ltd. in the company research undertaken as the recommendations stated in this report is derived purely from technical analysis. Comfort Securities Ltd. has based this document on information obtained from sources it believes to be reliable but which it has not independently verified; Comfort Securities Ltd. makes no guarantee, representation or warranty and accepts no responsibility or liability as to its accuracy or completeness. The opinions contained within the report are based upon publicly available information at the time of publication and are subject to change without notice. The information and any disclosures provided herein are in summary form and have been prepared for informational purposes. The recommendations and suggested price levels are intended purely for trading purposes. The recommendations are valid for the day of the report however trading trends and volumes might vary substantially on an intraday basis and the recommendations may be subject to change. The information and any disclosures provided herein may be considered confidential. Any use, distribution, modification, copying, forwarding or disclosure by any person is strictly prohibited. The information and any disclosures provided herein do not constitute a solicitation or offer to purchase or sell any security or other financial product or instrument. The current performance may be unaudited. Past performance does not guarantee future returns. There can be no assurance that investments will achieve any targeted rates of return, and there is no guarantee against the loss of your entire investment.
POTENTIAL CONFLICT OF INTEREST DISCLOSURE (as on date of report)Disclosure of interest statement – • Analyst interest of the stock /Instrument(s): - No. • Firm interest of the stock / Instrument (s): - No.
Enjoy Your Comfort Zone. Invest Smart. Build Wealth. www.comfortsecurities.co.in
Registered Office Mumbai:
Comfort Securities Ltd.
A-301, Hetal Arch, S.V. Road, Opp. Natraj Mkt.,
Malad (W), Mumbai 400 064
Phone: 91-22-28811259, 28449765, 28825509
Fax: 91-22-28892527
Email: [email protected]
Comfort Securities Limited
605, 6th Floor, DDA2 Building,
New Delhi 110058,
Janakpuri District Center,
Janakpuri, Delhi, 110058
011 4568 0560
Comfort Securities Ltd
2nd Floor, Shop No S14, T 14,
Friends Tower, Sanjay Place,
Agra