young people in education and training 2017 · web view11 young people in education and training...
TRANSCRIPT

Australian vocational education and training statistics
Young people in education and training 2017
National Centre for Vocational Education Research
HighlightsThis publication presents a summary of statistics relating to young people aged 15 to 19 years who participated in education and training with an Australian provider in 2017. It brings together data from multiple sources.A snapshot as at August 2017 shows there were 1.5 million Australians aged 15 to 19 years, of which an estimated 82.8% participated in education and training. An estimated: 57.1% were at school— 14.3% were enrolled in a VET in Schools program— 42.9% were at school but not participating in a VET in Schools program 16.1% were enrolled in higher education 4.4% were undertaking an apprenticeship or traineeship, which was not part
of a VET in Schools program 5.2% were enrolled in other VET programs (not a VET in Schools program or
an apprenticeship or traineeship).During the 2017 calendar year, among all students aged 15 to 19 years who participated in education and training with an Australian provider, there were an estimated: 847 000 school students 237 700 VET in Schools students 353 100 higher education students 76 500 apprentice and trainee commencements 705 100 VET students 312 000 government-funded VET students.
© Commonwealth of Australia, 2018
With the exception of the Commonwealth Coat of Arms, the Department’s logo, any material protected by a trade mark and where otherwise noted all material presented in this document is provided under a Creative Commons Attribution 3.0 Australia <creativecommons.org/licenses/by/3.0/au> licence.
The details of the relevant licence conditions are available on the Creative Commons website (accessible using the links provided) as is the full legal code for the CC BY 3.0 AU licence <creativecommons.org/licenses/by/3.0/legalcode>.
The Creative Commons licence conditions do not apply to all logos, graphic design, artwork and photographs. Requests and enquiries concerning other reproduction and rights should be directed to the National Centre for Vocational Education Research (NCVER).
This document should be attributed as NCVER 2018, Australian vocational education and training statistics: young people in education and training 2017, NCVER, Adelaide.
This work has been produced by NCVER on behalf of the Australian Government and state and territory governments, with funding provided through the Australian Government Department of Education and Training.
The views and opinions expressed in this document are those of NCVER and do not necessarily reflect the views of the Australian Government or state and territory governments.
ISSN 1838-7942TD/TNC 134.04
Comments and suggestions regarding this publication are welcomed and should be forwarded to NCVER.
Published by NCVER, ABN 87 007 967 311
Level 5, 60 Light Square, Adelaide, SA 5000PO Box 8288 Station Arcade, Adelaide SA 5000, Australia
Phone +61 8 8230 8400 Email [email protected] Web <https://www.ncver.edu.au> <http://www.lsay.edu.au>

Follow us: <https://twitter.com/ncver> <https://www.linkedin.com/company/ncver>
Young people in education and training 2017 3
ContentsIntroductionData sourcesMore informationYoung people in summaryParticipation estimateSectoral tables 10Terms
21Explanatory notes 24
Tables1 Estimate of participation of Australians aged 15 to 19 years in education and training by age and sex,
as at August 2017 92 School students aged 15 to 19 years by selected student characteristics, 2013―17 103 VET in Schools students aged 15 to 19 years by selected student characteristics, 2013―17 114 VET in Schools students aged 15 to 19 years by selected major program characteristics, 2013―17 125 Higher education students aged 15 to 19 years by selected student characteristics, 2013―17 136 Higher education students aged 15 to 19 years by selected major course characteristics, 2013―17 147 Apprenticeship and traineeship commencements for those aged 15 to 19 years by selected
characteristics, 2013―1715
8 Apprenticeship and traineeship commencements for those aged 15 to 19 years by selected training characteristics, 2013―17 16
9 Estimated total VET students aged 15 to 19 years by selected student characteristics, 2015―17 1710 Total VET program enrolments among students aged 15 to 19 years by selected program
characteristics, 2015―1718
11 Government-funded VET students aged 15 to 19 years by selected student characteristics, 2013―17 1912 Government-funded VET students aged 15 to 19 years by selected major program characteristics,
2013―17 20

IntroductionThe Australian education and training system offers a range of education options for young people. This publication provides a summary of statistics relating to young people aged 15 to 19 years who participated in education and training during 2017. Information on participation is presented for school students, VET in Schools students1, higher education students, apprenticeship and traineeship commencements, and vocational education and training (VET) students.Table 1 provides an estimate of participation in education and training by Australians aged 15 to 19-yearsat a point in time – as at August 2017, with duplicate students removed through the assignment of an ‘activity’ based on a hierarchy (for further information, refer to the methodology used to estimate participation in the explanatory notes on page 24).The sectoral tables (tables 2 to 12) provide statistics on the different types of education and training undertaken by all young people (both domestic and international students) during a calendar year. It is important to note student behaviour may change throughout a calendar year, with some students undertaking more than one education and training activity.Tables 9 and 10 provide an estimate of the extent and nature of all VET activity undertaken by young people from 2015 to 2017.Tables 11 and 12 present data for government-funded VET activity undertaken by young people from 2013 to 2017. This activity is broadly defined as all Commonwealth and state/territory government-funded training.
Data sourcesThis publication sources data from various statistical collections to obtain a complete picture of the education and training activities of young people aged 15 to 19 years. These include the: Australian Bureau of Statistics National Schools Statistics Collection NCVER National VET in Schools Collection Department of Education and Training Higher Education Statistics Collection NCVER National Apprentice and Trainee Collection NCVER National VET Provider Collection.
More informationThe data in this publication may be revised for a variety of reasons. For the latest and additional data on young people aged 15 to 19 years, please visit the National Centre for Vocation Education Research (NCVER) Portal <https://www.ncver.edu.au>.
1 VET in Schools refers to the vocational education and training undertaken by school students as part of their senior secondary certificate of education (SSCE).
Young people in education and training 2017 5

Young people in summary
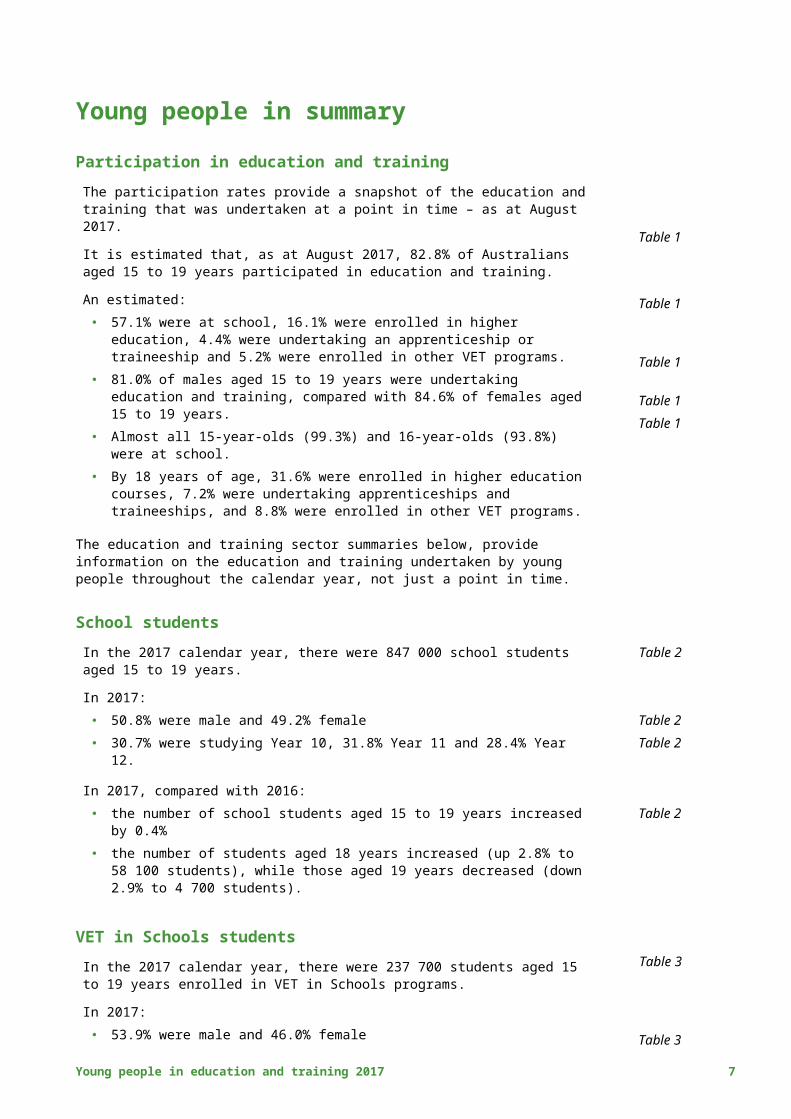
Participation in education and trainingThe participation rates provide a snapshot of the education and training that was undertaken at a point in time – as at August 2017.It is estimated that, as at August 2017, 82.8% of Australians aged 15 to 19 years participated in education and training. An estimated: 57.1% were at school, 16.1% were enrolled in higher education, 4.4%
were undertaking an apprenticeship or traineeship and 5.2% were enrolled in other VET programs.
81.0% of males aged 15 to 19 years were undertaking education and training, compared with 84.6% of females aged 15 to 19 years.
Almost all 15-year-olds (99.3%) and 16-year-olds (93.8%) were at school.
By 18 years of age, 31.6% were enrolled in higher education courses, 7.2% were undertaking apprenticeships and traineeships, and 8.8% were enrolled in other VET programs.
Table 1
Table 1
Table 1
Table 1Table 1
The education and training sector summaries below, provide information on the education and training undertaken by young people throughout the calendar year, not just a point in time.
School studentsIn the 2017 calendar year, there were 847 000 school students aged 15 to 19 years.
Table 2
In 2017: 50.8% were male and 49.2% female 30.7% were studying Year 10, 31.8% Year 11 and 28.4% Year 12.
Table 2Table 2
In 2017, compared with 2016: the number of school students aged 15 to 19 years increased by 0.4% the number of students aged 18 years increased (up 2.8% to 58 100
students), while those aged 19 years decreased (down 2.9% to 4 700 students).
Table 2
VET in Schools students In the 2017 calendar year, there were 237 700 students aged 15 to 19 years enrolled in VET in Schools programs.
Table 3
In 2017: 53.9% were male and 46.0% female 55.7% were enrolled in certificate II qualifications and 33.4% in
certificate III
Table 3Table 4
the most popular field of education was Society and culture (18.6%), followed by Management and commerce (18.1%) and Food, hospitality
Table 4
6 Australian vocational education and training statistics
and personal services (16.3%) 8.4% were undertaking a school-based apprenticeship or traineeship
that was part of a VET in Schools program.Table 3
In 2017, compared with 2016: the number of VET in Schools students aged 15 to 19 years increased
by 1.7% the number undertaking a school-based apprenticeship or traineeship
that was part of a VET in Schools program increased by 17.5% to 19 900
the largest increase in student numbers was in Queensland (up 10.4% to 83 500)
student numbers increased across all age levels between 15 and 18 years, with the largest increases among those aged 16 years (up 2.1% to 95 800) and 17 years (up 1.8% to 83 200)
there was an increase in the number of students enrolled in certificate II qualifications (up 0.2% to 132 500) and in certificate III (up 5.5% to 79 300), while students enrolled in certificate I qualifications experienced a further year-on-year decline (down 3.7% to 18 900).
Table 3
Table 3
Table 3
Table 3
Table 4
Higher education studentsIn the 2017 calendar year, there were 353 100 higher education students aged 15 to 19 years.
Table 5
In 2017: 43.8% were male and 56.2% female 91.1% were full-time students 86.9% of students were enrolled in a bachelor’s degree the most popular field of education was Management and commerce
(22.7%), followed by Society and culture (18.9%).
Table 5Table 5Table 6Table 6
In 2017, compared with 2016: the number of higher education students aged 15 to 19 years
increased by 3.0% there was a further year-on-year increase in the number of students
whose usual place of residence was outside Australia (up 11.2% to 73 800 students)
student numbers increased across all qualification levels, with the largest increase at bachelor degree level (up 1.6% to 306 800)
the number of students studying non-AQF2 courses increased (up 5.4% to 17 200 students), accounting for 4.9% of all higher education students.
Table 5Table 5
Table 6
Table 6
Apprentices and trainees In the 2017 calendar year, there were 76 500 apprenticeship and traineeship commencements among those aged 15 to 19 years.
Table 7
In 2017:2 ‘Non-AQF’ courses include enabling and non-award courses.
Young people in education and training 2017 7

65.1% were male and 34.9% female 36.9% commenced their training contract part-time 86.5% commenced training in certificate III qualifications 52.5% of commencements were in trade occupations and 47.5% were
in non-trade occupations.
Table 7Table 7Table 8Table 8
In 2017, compared with 2016: apprenticeship and traineeship commencements remained steady commencements increased in Queensland (up 9.4% to 19 800) and New
South Wales (up 3.4% to 22 800)
Table 7Table 7
commencements in trade occupations increased (up 3.6% to 40 100), while commencements in non-trade occupations decreased (down 2.3% to 36 300).
Table 8
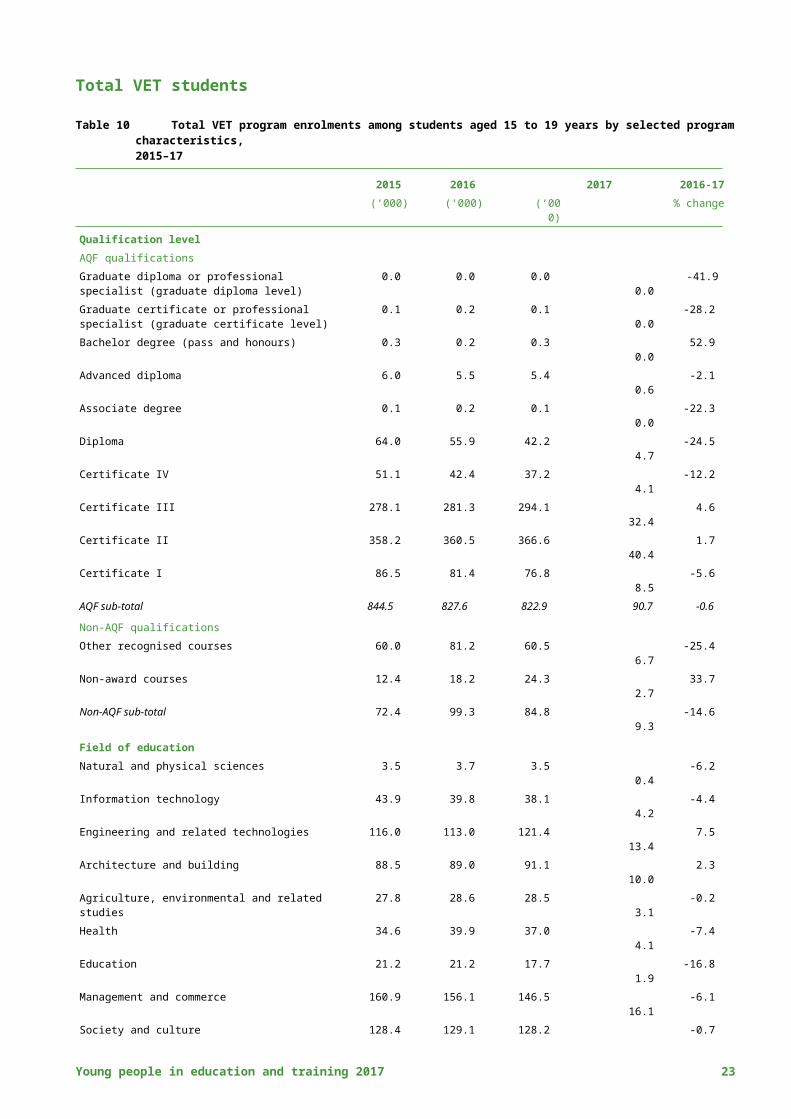
Total VET students In the 2017 calendar year, there were an estimated 705 100 VET students aged 15 to 19 years. In 2017:
Table 9
53.3% were male and 45.4% female 85.1% were part-time students 45.6% were attending school
Table 9Table 9 Table 9
40.4% of program enrolments were in certificate II qualifications and 32.4% in certificate III
the most popular field of education was Management and commerce (16.1%), followed by Food, hospitality and personal services (14.8%) and Society and culture (14.1%).
Table 10
Table 10
In 2017, compared with 2016: the estimated number of VET students aged 15 to 19 years remained
steady the largest increase in student numbers, based on delivery location,
was in New South Wales (up 7.7% to 214 300) and the largest decrease was in Queensland (down 7.0% to 159 400)
the number of apprentices and trainees undertaking off-the-job training increased (up 3.2% to 115 000)
the number of program enrolments decreased by 2.1% to 907 700, with the largest decrease in diploma qualifications (down 24.5% to 42 200) followed by certificate IV (down 12.2% to 37 200)
the number of non-AQF course enrolments decreased by 14.6% to 84 800.
Table 9
Table 9
Table 9
Table 10
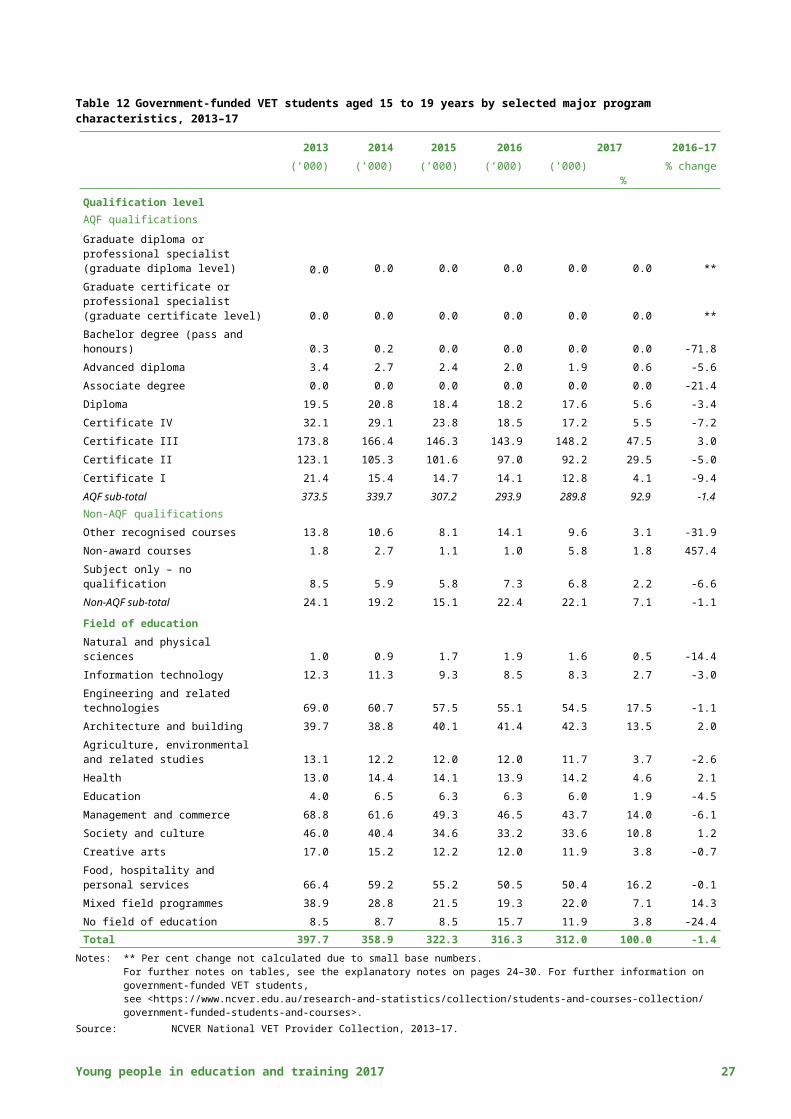
Government-funded VET students In the 2017 calendar year, there were 312 000 government-funded VET students aged 15 to 19 years. In 2017:
Table 11
8 Australian vocational education and training statistics

56.7% were male and 43.2% female 84.3% were part-time students 47.5% were enrolled in certificate III qualifications and 29.5% in
certificate II the most popular fields of education were Engineering and related
technologies (17.5%), followed by Food, hospitality and personal services (16.2%) and Management and commerce (14.0%).
Table 11Table 11Table 12Table 12
In 2017, compared with 2016: the number of government-funded VET students declined by 1.4% the largest decrease in student numbers, based on the state or
territory that administered the funding, was in Victoria (down 9.1% to 53 800) followed by Western Australia (down 3.5% to 33 500)
the number of apprentices and trainees undertaking off-the-job training increased (up 3.8% to 101 000)
the number of students enrolled in certificate III qualifications increased (up 3.0% to 148 200 students), while numbers decreased in certificate II (down 5.0% to 92 200 students), certificate IV (down 7.2% to 17 200 students) and certificate I (down 9.4% to 12 800 students).
Table 11Table 11
Table 11
Table 12
Young people in education and training 2017 9

Participation estimateTable 1 Estimate of participation of Australians aged 15 to 19 years in education and training by age and sex, as at
August 2017
15 years 16 years 17 years 18 years 19 years Total
MalesAt schoolVET in Schools programs (%) 11.9 31.0 27.0 6.0 0.5 15.0School without participation in VET in Schools (%) 87.2 61.3 49.4 14.4 1.0 41.6Not at schoolHigher education (%) 0.1 0.4 10.5 26.7 27.6 13.4Apprenticeship or traineeship (%) 0.3 1.9 5.1 10.7 14.1 6.6Other VET (%) 0.8 2.1 3.4 7.1 7.7 4.3In education and training (%)^ 100.2 96.8 95.4 64.9 51.0 81.0Not in education and training (%)^ -0.2 3.2 4.6 35.1 49.0 19.0Total 15 to 19 years (%) 100.0 100.0 100.0 100.0 100.0 100.0Total 15 to 19 years (’000) 145.2 149.2 150.4 154.7 160.6 760.1
FemalesAt schoolVET in Schools programs (%) 11.5 28.2 23.5 4.5 0.5 13.4School without participation in VET in Schools (%) 88.1 67.3 56.7 13.5 1.0 44.3Not at schoolHigher education (%) 0.1 0.6 15.9 36.8 38.7 18.9Apprenticeship or traineeship (%) 0.1 0.5 1.4 3.6 4.2 2.0Other VET (%) 0.8 2.8 4.6 10.5 10.9 6.0In education and training (%)^ 100.5 99.4 102.1 68.9 55.3 84.6Not in education and training (%)^ -0.5 0.6 -2.1 31.1 44.7 15.4Total 15 to 19 years (%) 100.0 100.0 100.0 100.0 100.0 100.0Total 15 to 19 years (’000) 138.1 141.2 144.0 146.8 152.4 722.5
TotalAt schoolVET in Schools programs (%) 11.7 29.7 25.3 5.3 0.5 14.3School without participation in VET in Schools (%) 87.6 64.2 53.0 14.0 1.0 42.9Not at schoolHigher education (%) 0.1 0.5 13.1 31.6 33.0 16.1Apprenticeship or traineeship (%) 0.2 1.2 3.3 7.2 9.3 4.4Other VET (%) 0.8 2.5 4.0 8.8 9.3 5.2In education and training (%)^ 100.4 98.1 98.7 66.8 53.1 82.8Not in education and training (%)^ -0.4 1.9 1.3 33.2 46.9 17.2Total 15 to 19 years (%) 100.0 100.0 100.0 100.0 100.0 100.0Total 15 to 19 years (’000) 283.3 290.4 294.4 301.5 313.0 1482.6
Notes: ^Although every effort has been made to avoid double-counting, the inherent overlap between data collections, the level of ‘not known’ data for key data elements and limitations in deriving a true point-in-time estimate have resulted in more people in education and training than the total number of 15 and 17-year-olds (based on ABS population data). For further notes on tables, see the explanatory notes on pages 24–30. For this table refer to explanatory notes 8-13 on pages 25-26.
Sources: Derived from Australian Bureau of Statistics (ABS) Schools, Australia, 2017, cat.no.4221.0; NCVER National VET in Schools Collection; NCVER National Apprentice and Trainee Collection, based on June 2017 estimates; NCVER National VET Provider Collection; Department of Education Higher Education Statistics Collection; ABS Australian demographic statistics December 2017, cat.no.3101.0, table 59.
10 Australian vocational education and training statistics

Sectoral tables
School students
Table 2 School students aged 15 to 19 years by selected student characteristics, 2013–17
2013 2014 2015 2016 2017 2016–17(’000) (’000) (’000) (’000) (’000) % % change
State or territory of the schoolNew South Wales 261.2 263.7 265.4 265.8 264.8 31.3 -0.4Victoria 216.0 219.2 222.6 225.0 227.5 26.9 1.1Queensland 153.5 155.7 157.5 159.6 161.2 19.0 1.0South Australia 64.4 65.2 65.8 65.8 65.1 7.7 -1.1Western Australia 73.6 75.7 83.6 83.7 84.3 9.9 0.7Tasmania 20.6 21.0 20.8 20.5 20.2 2.4 -1.6Northern Territory 7.3 7.3 7.3 7.4 7.7 0.9 4.9Australian Capital Territory 15.8 16.1 16.3 16.3 16.3 1.9 -0.2
SexMales 413.5 419.8 427.6 429.3 430.5 50.8 0.3
Females 398.8 403.9 411.7 414.7 416.6 49.2 0.5
Age15 years 280.6 282.6 284.2 283.0 281.3 33.2 -0.6
16 years 265.6 268.5 270.5 273.0 272.5 32.2 -0.2
17 years 208.2 214.1 224.0 226.7 230.4 27.2 1.6
18 years 52.7 53.4 55.3 56.5 58.1 6.9 2.8
19 years 5.2 5.1 5.2 4.8 4.7 0.6 -2.9
Student remoteness (ARIA+) regionMajor cities
Student remoteness information is not available
Inner regionalOuter regionalRemote Very remoteOutside AustraliaNot known
Mode of studyFull-time 801.5 812.9 828.8 833.9 837.0 98.8 0.4
Part-time 10.8 10.8 10.5 10.1 10.0 1.2 -0.9
School levelYear 7 or below 0.0 0.1 0.1 0.1 0.0 0.0 -40.3
Year 8 1.3 1.3 1.4 1.3 1.2 0.1 -5.4
Year 9 60.1 61.8 62.3 62.3 63.0 7.4 1.2
Year 10 255.1 257.7 260.8 260.3 259.7 30.7 -0.2
Year 11 254.5 264.9 267.8 270.7 269.0 31.8 -0.6
Year 12 228.4 224.6 234.2 236.3 240.4 28.4 1.7
Ungraded secondary 12.9 13.4 12.7 13.0 13.5 1.6 4.0
Total 812.3 823.7 839.3 844.0 847.0 100.0 0.4For notes on tables, see the explanatory notes on pages 24–30. For further information on school students, see <http://www.abs.gov.au/AUSSTATS/[email protected]/MF/4221.0>.Source: Australian Bureau of Statistics, Schools, Australia, 2017, cat.no.4221.0.
Young people in education and training 2017 11

VET in Schools students
Table 3 VET in Schools students aged 15 to 19 years by selected student characteristics, 2013–17
2013 2014 2015 2016 2017 2016–17(’000) (’000) (’000) (’000) (’000) % % change
State or territory of the senior secondary assessment authorityNew South Wales 60.0 59.9 53.8 52.2 49.9 21.0 -4.4Victoria 47.9 48.9 49.5 48.9 48.3 20.3 -1.2
Queensland 84.0 77.1 87.5 75.7 83.5 35.1 10.4
South Australia 11.8 12.1 12.3 12.6 10.7 4.5 -14.9Western Australia 24.6 27.0 33.2 35.5 36.6 15.4 2.9Tasmania 5.0 6.0 4.8 3.1 3.4 1.4 7.1Northern Territory 1.6 2.0 1.9 2.3 2.2 0.9 -4.2Australian Capital Territory 4.8 3.5 3.6 3.3 3.1 1.3 -5.4
Sex
Males 126.9 125.6 132.4 125.7 128.2 53.9 2.0Females 112.8 111.0 114.0 107.9 109.4 46.0 1.4
Age
15 years 42.9 42.3 42.1 38.9 39.5 16.6 1.716 years 96.8 95.6 99.5 93.9 95.8 40.3 2.117 years 80.3 79.1 85.2 81.7 83.2 35.0 1.818 years 17.9 17.5 17.7 17.3 17.4 7.3 0.219 years 1.9 2.1 1.9 1.9 1.8 0.8 -4.3
Student remoteness (ARIA+) region
Major cities 139.0 135.0 142.8 138.2 143.3 60.3 3.7Inner regional 58.4 57.0 57.8 53.7 53.3 22.4 -0.8Outer regional 28.9 28.7 30.1 26.0 27.5 11.6 5.9Remote 5.0 4.9 5.4 4.7 4.8 2.0 2.2Very remote 2.3 2.4 2.6 2.3 2.4 1.0 5.7Outside Australia 0.3 0.4 0.5 0.2 0.6 0.3 183.3Not known 5.7 8.1 7.3 8.6 5.9 2.5 -31.9
School-based apprentice and trainee status
School-based apprentices and trainees 21.7 20.5 19.7 16.9 19.9 8.4 17.5Other VET in Schools students 218.1 216.1 226.8 216.8 217.8 91.6 0.5
Total 239.7 236.6 246.5 233.7 237.7 100.0 1.7For notes on tables, see the explanatory notes on pages 24–30. For further information on VET in Schools students, see <https://www.ncver.edu.au/data/collection/vet-in-schools>.Source: NCVER National VET in Schools Collection, 2013–17.
12 Australian vocational education and training statistics

Table 4 VET in Schools students aged 15 to 19 years by selected major program characteristics, 2013–17
2013 2014 2015 2016 2017 2016–17(’000) (’000) (’000) (’000) (’000) % % change
Qualification levelDiploma or higher 1.9 2.1 3.9 2.7 3.5 1.5 31.1Certificate IV 3.7 4.0 3.6 3.5 3.1 1.3 -12.4Certificate III 67.6 76.7 77.9 75.2 79.3 33.4 5.5Certificate II 133.8 125.6 135.4 132.1 132.5 55.7 0.2Certificate I 31.0 25.9 24.0 19.6 18.9 7.9 -3.7Other 1.7 2.4 1.7 0.5 0.5 0.2 -12.4
Field of educationNatural and physical sciences 0.8 0.7 1.1 1.1 1.2 0.5 9.7Information technology 18.2 18.1 18.6 15.7 14.8 6.2 -5.4Engineering and related technologies 25.0 24.1 26.3 24.4 25.9 10.9 6.4Architecture and building 19.7 19.7 20.5 20.0 19.7 8.3 -1.5Agriculture, environmental and related studies
7.8 8.1 8.5 8.3 8.4 3.6 2.0
Health 7.2 7.5 7.9 7.7 8.1 3.4 5.6Education 1.0 0.7 1.6 0.9 0.8 0.4 -4.3Management and commerce 42.9 38.7 41.4 40.6 43.1 18.1 6.3Society and culture 36.7 41.8 43.2 41.4 44.2 18.6 6.7Creative arts 19.5 19.1 19.3 18.5 17.5 7.3 -5.6Food, hospitality and personal services 40.9 39.1 39.1 37.4 38.7 16.3 3.5Mixed field programmes 20.1 17.3 17.9 17.7 15.1 6.3 -14.9No field of education - 1.7 1.1 0.1 0.1 0.0 -12.2
Total 239.7 236.6 246.5 233.7 237.7 100.0 1.7For notes on tables, see the explanatory notes on pages 24–30. For further information on VET in Schools students, see <https://www.ncver.edu.au/data/collection/vet-in-schools>.Source: NCVER National VET in Schools Collection, 2013–17.
Young people in education and training 2017 13

Higher education students
Table 5 Higher education students aged 15 to 19 years by selected student characteristics, 2013–17
2013 2014 2015 2016 2017 2016–17(’000) (’000) (’000) (’000) (’000) % % change
State or territory of providerNew South Wales 90.7 94.7 99.8 102.5 106.0 30.0 3.4
Victoria 80.8 85.1 88.7 92.4 95.5 27.0 3.4
Queensland 61.1 62.7 63.9 64.5 66.0 18.7 2.3
South Australia 19.9 20.9 21.0 22.2 22.8 6.5 2.7
Western Australia 36.9 38.1 35.4 35.6 36.5 10.3 2.3
Tasmania 5.5 5.6 6.0 5.5 5.5 1.6 0.3
Northern Territory 1.0 1.0 1.2 1.1 1.1 0.3 -5.5
Australian Capital Territory 7.3 7.7 8.0 8.5 9.5 2.7 12.0
Multi-state 8.3 9.3 10.2 10.6 10.3 2.9 -2.6
Sex Males 135.4 141.9 146.1 150.1 154.5 43.8 3.0
Females 176.1 183.0 188.1 192.9 198.6 56.2 3.0
Age15 years 0.7 0.8 0.7 0.7 0.7 0.2 -1.1
16 years 2.9 3.0 3.4 3.4 3.8 1.1 11.9
17 years 52.1 53.8 52.7 51.9 53.8 15.2 3.7
18 years 120.2 124.4 130.1 134.0 136.3 38.6 1.7
19 years 135.6 142.9 147.4 152.9 158.6 44.9 3.7
Student remoteness (ARIA+) regionMajor cities 211.6 218.8 221.8 223.7 225.5 63.9 0.8
Inner regional 34.4 35.0 35.5 35.3 35.6 10.1 0.9
Outer regional 14.3 14.6 14.9 15.0 15.1 4.3 1.0
Remote 1.3 1.3 1.3 1.3 1.3 0.4 3.1
Very remote 0.4 0.4 0.4 0.4 0.4 0.1 1.0
Outside Australia 49.0 54.1 59.7 66.3 73.8 20.9 11.2
Not known 0.4 0.7 0.6 0.8 1.4 0.4 64.7
Mode of studyFull-time 287.0 299.2 306.6 313.6 321.9 91.1 2.6
Part-time 24.5 25.7 27.6 29.3 31.3 8.9 6.8
Total 311.5 324.9 334.2 342.9 353.1 100.0 3.0For notes on tables, see the explanatory notes on pages 24–30. For further information on higher education students, see <https://education.gov.au/student-data>.Source: Department of Education and Training Higher Education Statistics Collection, 2013–17.
14 Australian vocational education and training statistics

Table 6 Higher education students aged 15 to 19 years by selected major course characteristics, 2013–17
2013 2014 2015 2016 2017 2016–17(’000) (’000) (’000) (’000) (’000) % % change
Qualification levelAQF qualificationsPostgraduate courses 0.3 0.3 0.3 0.4 0.4 0.1 7.8Bachelor degree (pass and honours) 279.4 290.2 297.4 302.1 306.8 86.9 1.6
Advanced diploma 1.8 1.4 1.6 1.0 1.2 0.3 23.5
Associate degree 3.0 2.6 2.7 2.9 2.9 0.8 2.5
Diploma 13.3 15.4 17.3 19.8 24.1 6.8 21.4
Other undergraduate courses 0.3 0.4 0.5 0.5 0.5 0.2 9.5
AQF sub-total 298.1 310.3 319.7 326.6 336.0 95.1 2.9Non-AQF qualifications
Enabling courses 8.8 9.6 9.4 11.1 11.5 3.2 3.4
Non-award courses 4.6 5.0 5.1 5.2 5.7 1.6 9.6
Non-AQF sub-total 13.4 14.6 14.5 16.3 17.2 4.9 5.4
Field of educationNatural and physical sciences 35.7 37.4 38.1 39.2 40.0 11.3 2.1
Information technology 10.6 11.5 12.6 13.6 16.2 4.6 19.4
Engineering and related technologies 25.2 25.7 26.0 26.8 26.7 7.6 -0.5
Architecture and building 7.2 6.8 7.3 7.6 8.9 2.5 16.9
Agriculture, environmental and related studies
4.1 4.0 3.8 4.0 3.4 1.0 -13.6
Health 43.3 45.3 47.3 48.7 50.2 14.2 2.9
Education 20.6 21.2 20.7 19.6 20.0 5.7 2.2
Management and commerce 67.8 72.0 75.5 78.6 80.2 22.7 2.1
Society and culture 59.9 62.0 64.1 64.7 66.9 18.9 3.4
Creative arts 28.5 29.3 29.4 29.5 29.2 8.3 -1.2
Food, hospitality and personal services
0.1 0.1 0.1 0.4 0.6 0.2 42.1
Mixed field programmes 3.9 4.6 4.3 5.0 5.2 1.5 3.8
Non-award courses 4.6 5.0 5.1 5.2 5.7 1.6 9.6
Total 311.5 324.9 334.2 342.9 353.1 100.0 3.0For notes on tables, see the explanatory notes on pages 24–30. For further information on higher education students, see <https://education.gov.au/student-data>.Source: Department of Education and Training Higher Education Statistics Collection, 2013–17.
Young people in education and training 2017 15

Apprentices and trainees
Table 7 Apprenticeship and traineeship commencements for those aged 15 to 19 years by selected characteristics, 2013–17
2013 2014 2015 2016 2017 2016–17(’000) (’000) (’000) (’000) (’000) % % change
State or territory of contract registrationNew South Wales 23.7 21.6 20.7 22.0 22.8 29.8 3.4Victoria 22.1 20.7 19.8 20.2 18.1 23.7 -10.2
Queensland 19.7 17.5 17.3 18.1 19.8 25.9 9.4
South Australia 6.0 5.5 4.9 4.8 4.7 6.2 -1.3Western Australia 8.5 8.5 7.5 6.6 6.9 9.0 4.0Tasmania 2.0 2.1 2.0 2.0 1.8 2.4 -8.7Northern Territory 0.9 0.9 0.8 0.7 0.7 1.0 3.2Australian Capital Territory 1.5 1.4 1.4 1.5 1.6 2.1 7.8
Sex
Males 51.0 48.6 48.2 48.4 49.8 65.1 2.8Females 33.4 29.6 26.2 27.5 26.7 34.9 -2.9
Age
15 years 9.7 8.2 7.8 7.6 7.7 10.1 0.916 years 16.2 14.8 14.5 14.7 15.5 20.3 5.117 years 18.8 17.5 16.7 17.1 17.1 22.4 0.318 years 23.2 22.0 20.9 21.8 21.5 28.1 -1.119 years 16.5 15.7 14.5 14.7 14.6 19.1 -0.4
Student remoteness (ARIA+) region
Major cities 51.1 47.3 45.6 46.9 46.4 60.6 -1.2Inner regional 20.6 19.4 18.3 18.7 19.2 25.1 2.7Outer regional 9.8 8.8 8.0 8.0 8.5 11.1 6.0Remote 1.6 1.4 1.3 1.2 1.4 1.8 12.1Very remote 0.8 0.7 0.7 0.6 0.7 0.9 10.5Outside Australia - - - - - - -Not known 0.5 0.5 0.5 0.4 0.3 0.4 -17.7
Mode of study
Full-time 52.1 48.5 46.7 46.9 48.2 63.1 2.8Part-time 32.2 29.7 27.7 29.0 28.2 36.9 -2.5
School status
At school 20.7 19.3 18.2 19.0 20.1 26.3 6.0Not at school 62.6 58.8 56.1 56.9 56.3 73.7 -1.0Not known 1.0 0.0 0.0 0.0 0.0 0.0 **
School-based status
School-based 17.1 17.4 16.2 16.4 17.3 22.6 5.1Not school-based 67.3 60.8 58.2 59.5 59.2 77.4 -0.5
Total 84.4 78.1 74.3 75.9 76.5 100.0 0.7Note: ** Per cent change not calculated due to small base numbers.For notes on tables, see the explanatory notes on pages 24–30. For further information on apprentices and trainees, see <https://www.ncver.edu.au/research-and-statistics/collection/apprentices-and-trainees-collection>.Source: NCVER National Apprentice and Trainee Collection, 2013–17.
16 Australian vocational education and training statistics

Table 8 Apprenticeship and traineeship commencements for those aged 15 to 19 years by selected training characteristics, 2013–17
2013 2014 2015 2016 2017 2016–17(’000) (’000) (’000) (’000) (’000) % % change
Qualification levelDiploma or higher 0.8 0.8 0.5 0.5 0.5 0.6 -11.3Certificate IV 3.7 3.6 2.8 2.6 1.9 2.5 -25.8Certificate III 70.8 65.4 64.3 65.0 66.1 86.5 1.6Certificate II 8.9 8.4 6.7 7.1 7.2 9.4 2.1Certificate I 0.1 0.0 0.1 0.6 0.7 1.0 14.0
Occupation (ANZSCO) group
Managers 1.4 0.9 0.7 0.7 0.2 0.3 -66.3Professionals 0.2 0.1 0.1 0.1 0.1 0.1 -25.4Technicians and trades workers 41.2 39.2 39.7 38.7 40.1 52.5 3.6Community and personal service workers
15.3 14.4 12.8 13.5 13.2 17.3 -2.4
Clerical and administrative workers 8.0 7.3 6.3 6.7 6.7 8.8 1.2Sales workers 12.6 10.7 9.8 10.8 9.5 12.4 -11.9Machinery operators and drivers 1.4 1.7 1.2 1.4 2.3 3.0 60.4Labourers 4.4 3.9 3.8 4.0 4.3 5.6 7.6
Total 84.4 78.1 74.3 75.9 76.5 100.0 0.7For notes on tables, see the explanatory notes on pages 24–30. For further information on apprentices and trainees, see <https://www.ncver.edu.au/research-and-statistics/collection/apprentices-and-trainees-collection>.Source: NCVER National Apprentice and Trainee Collection, 2013–17.
Young people in education and training 2017 17

Total VET students
Table 9 Estimated total VET students aged 15 to 19 years by selected student characteristics, 2015–17
2015 2016 2017 2016-17(‘000) (‘000) (‘000) % % change
State or territory where the training was delivered
New South Wales 210.8 199.0 214.3 30.4 7.7
Victoria 189.2 177.0 176.4 25.0 -0.3
Queensland 173.9 171.4 159.4 22.6 -7.0
South Australia 37.8 35.7 31.4 4.5 -12.0
Western Australia 66.7 66.6 67.3 9.5 1.0
Tasmania 9.9 9.7 8.7 1.2 -10.3
Northern Territory 5.3 5.2 5.3 0.8 1.8
Australian Capital Territory 10.6 10.2 10.3 1.5 0.9
Overseas 11.2 11.1 10.0 1.4 -9.5
Other 15.1 19.5 21.8 3.1 11.9
Sex
Males 388.2 370.9 376.0 53.3 1.4
Females 329.5 324.9 320.1 45.4 -1.5
Age
15 years 78.8 78.6 81.3 11.5 3.3
16 years 164.7 159.3 157.9 22.4 -0.9
17 years 173.6 166.4 165.0 23.4 -0.8
18 years 160.5 154.2 153.6 21.8 -0.4
19 years 152.6 146.2 146.8 20.8 0.4
Student remoteness (ARIA+) region
Major cities 419.7 410.8 416.3 59.0 1.3
Inner regional 167.8 158.8 157.0 22.3 -1.1
Outer regional 78.9 72.5 71.2 10.1 -1.8
Remote 12.6 11.7 11.1 1.6 -5.4
Very remote 6.3 5.6 5.5 0.8 -3.4
Outside Australia 24.1 22.4 21.6 3.1 -3.6
Not known 21.3 23.6 22.4 3.2 -4.8
Mode of study
Full-time 107.8 108.5 105.3 14.9 -2.9
Part-time 622.9 596.9 599.8 85.1 0.5
School status
At school 339.1 322.4 321.7 45.6 -0.2
Not at school 317.7 305.0 307.7 43.6 0.9
Not known 73.9 78.0 75.6 10.7 -3.0
Apprentice/trainee status
Apprentices and trainees undertaking off-the-job training
111.2 111.5 115.0 16.3 3.2
Not apprentices and trainees 619.5 593.9 590.1 83.7 -0.6
Total 730.6 705.4 705.1 100.0 -0.0
For notes on tables, see the explanatory notes on pages 24–30. For further information on total VET students, see <https://www.ncver.edu.au/research-and-statistics/collection/students-and-courses-collection/total-vet-students-and-courses>.Source: NCVER National VET Provider Collection, 2015–17 and NCVER National VET in Schools Collection, 2015–17.
18 Australian vocational education and training statistics

Total VET students
Table 10 Total VET program enrolments among students aged 15 to 19 years by selected program characteristics, 2015–17
2015 2016 2017 2016-17(‘000) (‘000) (‘000) % change
Qualification levelAQF qualificationsGraduate diploma or professional specialist (graduate diploma level)
0.0 0.0 0.0 0.0 -41.9
Graduate certificate or professional specialist (graduate certificate level)
0.1 0.2 0.1 0.0 -28.2
Bachelor degree (pass and honours) 0.3 0.2 0.3 0.0 52.9Advanced diploma 6.0 5.5 5.4 0.6 -2.1Associate degree 0.1 0.2 0.1 0.0 -22.3Diploma 64.0 55.9 42.2 4.7 -24.5Certificate IV 51.1 42.4 37.2 4.1 -12.2Certificate III 278.1 281.3 294.1 32.4 4.6Certificate II 358.2 360.5 366.6 40.4 1.7Certificate I 86.5 81.4 76.8 8.5 -5.6AQF sub-total 844.5 827.6 822.9 90.7 -0.6
Non-AQF qualifications
Other recognised courses 60.0 81.2 60.5 6.7 -25.4Non-award courses 12.4 18.2 24.3 2.7 33.7Non-AQF sub-total 72.4 99.3 84.8 9.3 -14.6
Field of education
Natural and physical sciences 3.5 3.7 3.5 0.4 -6.2Information technology 43.9 39.8 38.1 4.2 -4.4Engineering and related technologies 116.0 113.0 121.4 13.4 7.5Architecture and building 88.5 89.0 91.1 10.0 2.3Agriculture, environmental and related studies 27.8 28.6 28.5 3.1 -0.2Health 34.6 39.9 37.0 4.1 -7.4Education 21.2 21.2 17.7 1.9 -16.8Management and commerce 160.9 156.1 146.5 16.1 -6.1Society and culture 128.4 129.1 128.2 14.1 -0.7Creative arts 50.5 49.8 46.9 5.2 -5.9Food, hospitality and personal services 134.5 130.5 134.2 14.8 2.8Mixed field programmes 87.5 87.6 85.9 9.5 -1.9No field of education 19.6 38.5 28.8 3.2 -25.0Total 916.9 926.9 907.7 100.0 -2.1
Note: Data in this table are based on program enrolments, not students. A student can be enrolled in more than one program. Therefore thetotal in this table will not match that of table 9. For further notes on tables, see the explanatory notes on pages 24–30. For further information on total VET students, see <https://www.ncver.edu.au/research-and-statistics/collection/students-and-courses-collection/total-vet-students-and-courses>.
Source: NCVER National VET Provider Collection, 2015–17 and NCVER National VET in Schools Collection, 2015–17.
Young people in education and training 2017 19

Government-funded VET students
Table 11 Government-funded VET students aged 15 to 19 years by selected student characteristics, 2013–17
2013 2014 2015 2016 2017 2016–17(’000) (’000) (’000) (’000) (’000) % % change
State or territory that funds or accredits the trainingNew South Wales 144.6 137.5 121.2 128.1 128.0 41.0 -0.0Victoria 105.0 85.5 69.9 59.1 53.8 17.2 -9.1
Queensland 64.5 63.5 66.9 68.0 71.5 22.9 5.2
South Australia 28.3 18.7 15.7 14.0 13.1 4.2 -6.0Western Australia 40.4 38.3 36.1 34.7 33.5 10.7 -3.5Tasmania 6.5 7.0 5.0 5.2 4.9 1.6 -5.5Northern Territory 4.2 4.4 3.9 4.0 3.8 1.2 -3.2Australian Capital Territory 4.3 3.9 3.5 3.2 3.3 1.0 3.2SexMales 218.4 198.5 180.7 178.3 177.0 56.7 -0.8Females 178.5 160.0 141.3 137.6 134.6 43.2 -2.2Age15 years 31.8 24.4 20.7 20.6 23.7 7.6 15.116 years 82.7 71.6 66.0 65.2 65.3 20.9 0.117 years 94.6 85.7 80.3 78.7 75.7 24.3 -3.718 years 97.4 89.1 79.6 78.2 74.9 24.0 -4.219 years 91.2 88.1 75.6 73.5 72.3 23.2 -1.7Student remoteness (ARIA+) regionMajor cities 232.3 210.0 187.0 183.6 183.7 58.9 0.1Inner regional 97.9 88.3 81.2 80.0 78.6 25.2 -1.7Outer regional 46.8 41.4 38.7 38.1 36.9 11.8 -3.0Remote 8.2 7.6 7.2 6.8 6.9 2.2 0.3Very remote 3.9 3.7 3.6 3.4 3.6 1.1 6.1Outside Australia 0.5 0.1 0.3 0.2 0.2 0.1 28.6Not known 8.1 7.8 4.3 4.2 2.1 0.7 -50.8Mode of studyFull-time 70.3 67.8 53.1 49.3 48.9 15.7 -0.8Part-time 327.4 291.1 269.1 267.0 263.1 84.3 -1.5School statusAt school 166.9 139.8 128.0 126.0 123.2 39.5 -2.2Not at school 219.4 213.4 188.5 184.4 183.3 58.8 -0.6Not known 11.4 5.7 5.8 5.9 5.4 1.7 -8.0Apprentice/trainee statusApprentices and trainees undertaking off-the-job training
114.6 103.0 96.6 97.3 101.0 32.4 3.8
Not apprentices and trainees 283.0 255.9 225.7 218.9 211.0 67.6 -3.6Total 397.7 358.9 322.3 316.3 312.0 100.0 -1.4
For notes on tables, see the explanatory notes on pages 24–30. For further information on government-funded VET students, see <https://www.ncver.edu.au/research-and-statistics/collection/students-and-courses-collection/government-funded-students-and-courses>.Source: NCVER National VET Provider Collection, 2013–17.
20 Australian vocational education and training statistics
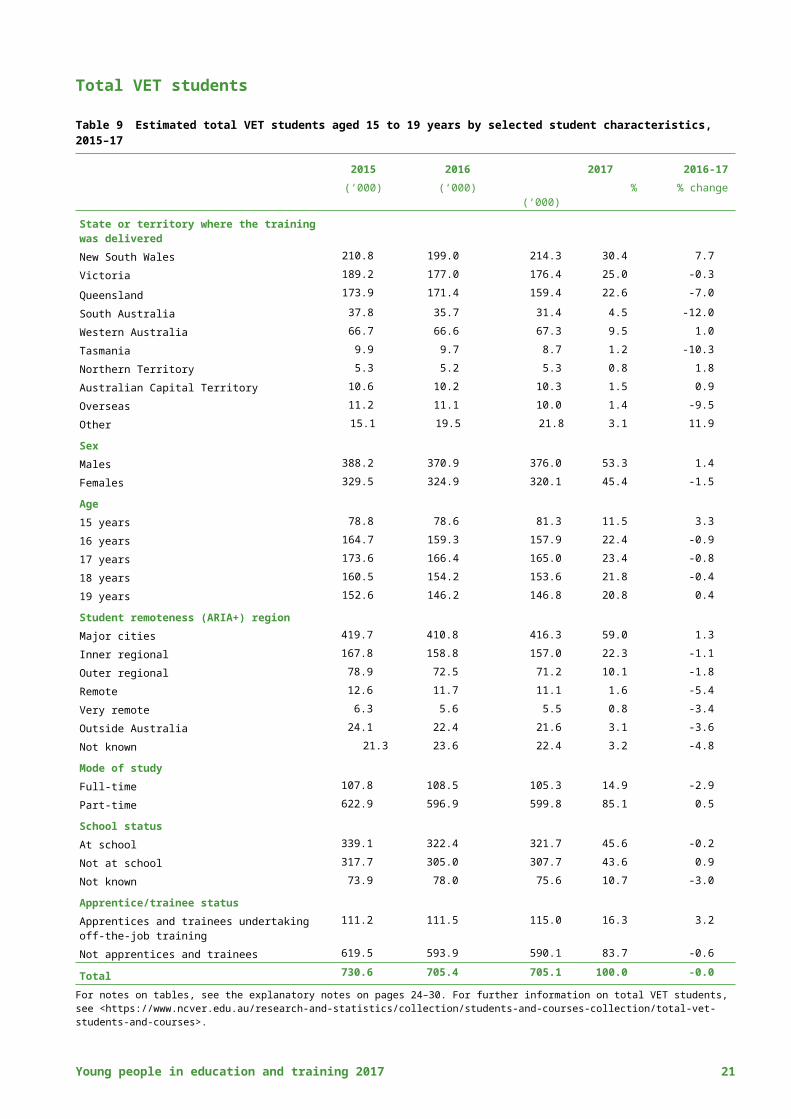
Table 12 Government-funded VET students aged 15 to 19 years by selected major program characteristics, 2013–17
2013 2014 2015 2016 2017 2016–17(’000) (’000) (’000) (’000) (’000) % % change
Qualification levelAQF qualifications
Graduate diploma or professional specialist (graduate diploma level) 0.0 0.0 0.0 0.0 0.0 0.0 **Graduate certificate or professional specialist (graduate certificate level) 0.0 0.0 0.0 0.0 0.0 0.0 **Bachelor degree (pass and honours) 0.3 0.2 0.0 0.0 0.0 0.0 -71.8Advanced diploma 3.4 2.7 2.4 2.0 1.9 0.6 -5.6Associate degree 0.0 0.0 0.0 0.0 0.0 0.0 -21.4Diploma 19.5 20.8 18.4 18.2 17.6 5.6 -3.4Certificate IV 32.1 29.1 23.8 18.5 17.2 5.5 -7.2Certificate III 173.8 166.4 146.3 143.9 148.2 47.5 3.0Certificate II 123.1 105.3 101.6 97.0 92.2 29.5 -5.0Certificate I 21.4 15.4 14.7 14.1 12.8 4.1 -9.4AQF sub-total 373.5 339.7 307.2 293.9 289.8 92.9 -1.4Non-AQF qualificationsOther recognised courses 13.8 10.6 8.1 14.1 9.6 3.1 -31.9Non-award courses 1.8 2.7 1.1 1.0 5.8 1.8 457.4Subject only – no qualification 8.5 5.9 5.8 7.3 6.8 2.2 -6.6Non-AQF sub-total 24.1 19.2 15.1 22.4 22.1 7.1 -1.1
Field of educationNatural and physical sciences 1.0 0.9 1.7 1.9 1.6 0.5 -14.4Information technology 12.3 11.3 9.3 8.5 8.3 2.7 -3.0Engineering and related technologies 69.0 60.7 57.5 55.1 54.5 17.5 -1.1Architecture and building 39.7 38.8 40.1 41.4 42.3 13.5 2.0Agriculture, environmental and related studies 13.1 12.2 12.0 12.0 11.7 3.7 -2.6Health 13.0 14.4 14.1 13.9 14.2 4.6 2.1Education 4.0 6.5 6.3 6.3 6.0 1.9 -4.5Management and commerce 68.8 61.6 49.3 46.5 43.7 14.0 -6.1Society and culture 46.0 40.4 34.6 33.2 33.6 10.8 1.2Creative arts 17.0 15.2 12.2 12.0 11.9 3.8 -0.7Food, hospitality and personal services 66.4 59.2 55.2 50.5 50.4 16.2 -0.1Mixed field programmes 38.9 28.8 21.5 19.3 22.0 7.1 14.3No field of education 8.5 8.7 8.5 15.7 11.9 3.8 -24.4Total 397.7 358.9 322.3 316.3 312.0 100.0 -1.4
Notes: ** Per cent change not calculated due to small base numbers.For further notes on tables, see the explanatory notes on pages 24–30. For further information on government-funded VET students, see <https://www.ncver.edu.au/research-and-statistics/collection/students-and-courses-collection/government-funded-students-and-courses>.
Source: NCVER National VET Provider Collection, 2013–17.
Young people in education and training 2017 21

Terms
School sectorAge of the student is as at 1 July of the collection year.Full-time students are those who undertook a workload equivalent to, or greater than that prescribed for a full-time student of that year level. This may vary between states and territories and from year to year.Part-time students are those who undertook a workload less than that specified as full-time. Part-time secondary student estimates vary considerably between states and territories, as each education authority has different policies and organisational arrangements.Secondary education typically commences after completion of primary education, at around 12 years of age, and lasts for five or six years. In all states and territories, except South Australia, secondary education may span Year 7 to Year 12. In South Australia it may span Year 8 to Year 12. Students are persons who, prior to the census date, were formally enrolled in a school and active in a course of study other than preschool or TAFE (technical and further education) courses. Students not present at school on the census date were included if they were expected to be absent for fewer than four continuous weeks (excluding school vacations).School level comprises pre-Year 1 through to Year 12, plus ungraded primary and ungraded secondary.Schools (other than a special school) satisfy the following criteria: Their major activity is the provision of full-time day primary or secondary education or the
provision of primary or secondary distance education. They are headed by a principal (or equivalent) responsible for the school’s internal operation. It is possible for students to enrol for a minimum of four continuous weeks, excluding school vacation
breaks.The term ‘school’ includes schools in institutions and hospitals, mission schools and similar establishments. The term excludes preschools, kindergarten centres, pre-primary schools or pre-primary classes in, or attached to, non-special schools, senior technical and agricultural colleges, evening schools, continuation classes and institutions such as business or coaching colleges.
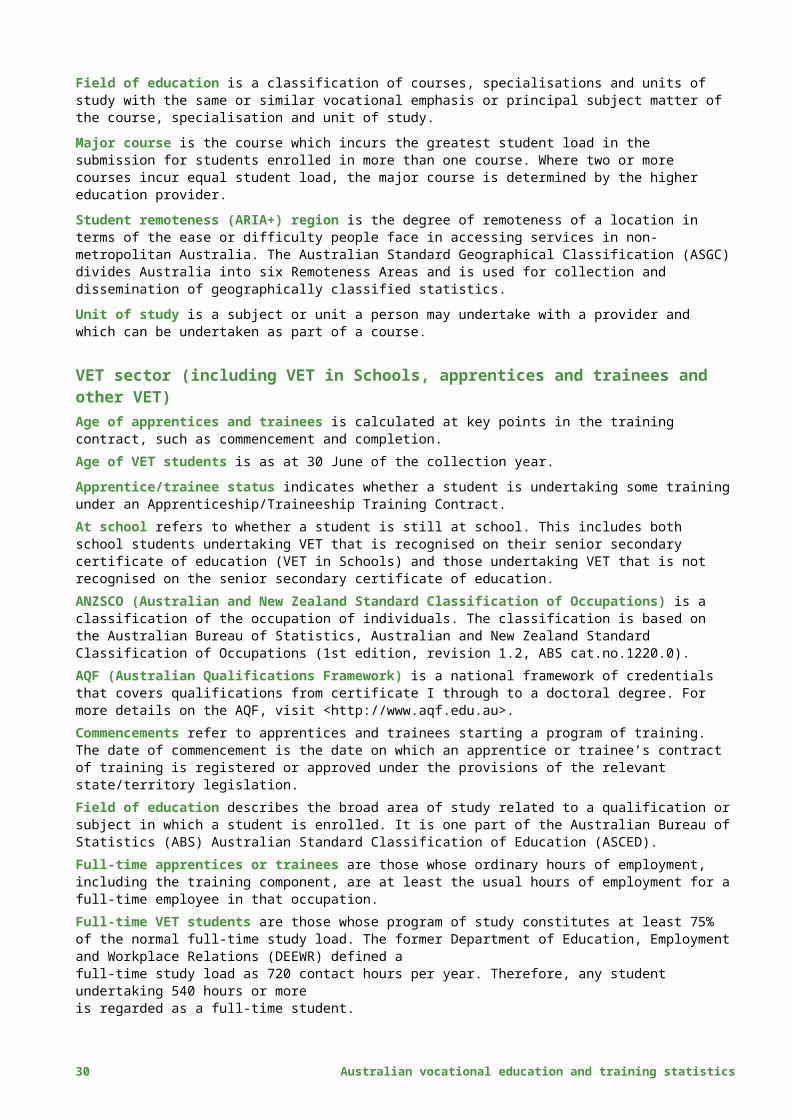
Higher education sectorAge of the student is as at 30 June of the collection year.AQF (Australian Qualifications Framework) is a national framework of credentials that covers qualifications from certificate I through to a doctoral degree. For more details on the AQF, visit <http://www.aqf.edu.au>.Census date is the date on which a student's enrolment is taken to be finalised.Full-time students are those whose student load, aggregated across all units of study (including work experience in industry units) for all courses in the collection year, is equivalent to the level required by a student undertaking at least 0.75 equivalent full-time student load (EFTSL) per year.Field of education is a classification of courses, specialisations and units of study with the same or similar vocational emphasis or principal subject matter of the course, specialisation and unit of study. Major course is the course which incurs the greatest student load in the submission for students enrolled in more than one course. Where two or more courses incur equal student load, the major course is determined by the higher education provider.
22 Australian vocational education and training statistics
Student remoteness (ARIA+) region is the degree of remoteness of a location in terms of the ease or difficulty people face in accessing services in non-metropolitan Australia. The Australian Standard Geographical Classification (ASGC) divides Australia into six Remoteness Areas and is used for collection and dissemination of geographically classified statistics.Unit of study is a subject or unit a person may undertake with a provider and which can be undertaken as part of a course.
VET sector (including VET in Schools, apprentices and trainees and other VET) Age of apprentices and trainees is calculated at key points in the training contract, such as commencement and completion.Age of VET students is as at 30 June of the collection year.Apprentice/trainee status indicates whether a student is undertaking some training under an Apprenticeship/Traineeship Training Contract.At school refers to whether a student is still at school. This includes both school students undertaking VET that is recognised on their senior secondary certificate of education (VET in Schools) and those undertaking VET that is not recognised on the senior secondary certificate of education.ANZSCO (Australian and New Zealand Standard Classification of Occupations) is a classification of the occupation of individuals. The classification is based on the Australian Bureau of Statistics, Australian and New Zealand Standard Classification of Occupations (1st edition, revision 1.2, ABS cat.no.1220.0).AQF (Australian Qualifications Framework) is a national framework of credentials that covers qualifications from certificate I through to a doctoral degree. For more details on the AQF, visit <http://www.aqf.edu.au>.Commencements refer to apprentices and trainees starting a program of training. The date of commencement is the date on which an apprentice or trainee’s contract of training is registered or approved under the provisions of the relevant state/territory legislation.Field of education describes the broad area of study related to a qualification or subject in which a student is enrolled. It is one part of the Australian Bureau of Statistics (ABS) Australian Standard Classification of Education (ASCED).Full-time apprentices or trainees are those whose ordinary hours of employment, including the training component, are at least the usual hours of employment for a full-time employee in that occupation.Full-time VET students are those whose program of study constitutes at least 75% of the normal full-time study load. The former Department of Education, Employment and Workplace Relations (DEEWR) defined a full-time study load as 720 contact hours per year. Therefore, any student undertaking 540 hours or more is regarded as a full-time student.Government-funded VET refers to all Commonwealth and state/territory government-funded training delivered by technical and further education (TAFE) institutes, other government providers (such as universities), community education providers and other registered providers. In-training refers to apprentices and trainees who are actively training at the end of each quarter under the terms of their training contract and who have not completed, cancelled, withdrawn or suspended their training, or had their training contract expire without meeting all of the prescribed requirements of their program.Major program relates to the highest qualification attempted by a student in the reporting year.Non-trades refer to those apprentices and trainees employed in occupations outside the trades. ‘Non-trades’ includes all occupations listed under the Australian and New Zealand Standard Classification of Occupations (ANZSCO 1st edition, revision 2) with the exception of major group 3 (Technicians and trades workers).
Young people in education and training 2017 23

Other VET in Schools programs are VET subjects and courses undertaken as part of a student’s senior secondary certificate of education (SSCE) and provide credit towards a nationally recognised VET qualification. These programs exclude VET subjects and courses undertaken as part of a school-based apprenticeship or traineeship.Part-time apprentices and trainees are defined as those whose ordinary hours of employment, including the training component, are fewer than full-time. Part-time provisions vary across Australia and across occupations, with ‘part-time’ defined by each state and territory.School-based apprentices and trainees combine attendance at school with formal engagement with the workplace and study towards a nationally recognised vocational qualification.School status indicates whether a student is still at school or not.Senior secondary certificate of education (SSCE) recognises the successful completion of senior secondary education and provides pathways to further study at university, TAFE institutes, and to the world of work. SSCE is usually gained through two years of full-time study following completion of Year 10. In some states, however, it may also be possible to commence the SSCE prior to Year 11. The SSCE may also be gained by older candidates.Student remoteness (ARIA+) region is the degree of remoteness of a location in terms of the ease or difficulty people face in accessing services in non-metropolitan Australia. The Australian Standard Geographical Classification (ASGC) divides Australia into six Remoteness Areas and is used for collection and dissemination of geographically classified statistics. Subject enrolment is the registration of a student at a training delivery location for undertaking a module, unit of competency or subject.Students are individuals who were enrolled in a subject or completed a qualification during the reporting period.Total VET refers to all domestic and overseas VET activity delivered by all types of Australian training providers. It reports on students who undertook government-subsidised training and those who undertook training on a fee-for-service basis.Trades refers to those apprentices and trainees employed in trades occupations under major group 3 (Technicians and trades workers) of the Australian and New Zealand Standard Classification of Occupations (ANZSCO 1st edition, revision 2).VET in Schools refers to the vocational education and training (VET) undertaken by school students as part of their senior secondary certificate of education (SSCE).Vocational education and training (VET) is education (excluding higher education) which gives people work-related knowledge and skills.
24 Australian vocational education and training statistics

Explanatory notes
Scope1 The data on school students are sourced from the (non-finance) National Schools Statistics
Collection, which is published by the Australian Bureau of Statistics (ABS) in its annual publication, Schools, Australia. The collection covers government and non-government schools, students and staff, as at the first Friday in August of the reference year. The scope is all establishments whose major activity is the administration of the provision of full-time day primary, secondary and/or special education, or primary or secondary education by distance education. Students who are undertaking technical and further education, tertiary studies, apprenticeships, work placements, VET in Schools or a combination of such pathways in addition to ‘normal’ school subjects are in the scope of the collection, regardless of the year of schooling in which these alternative pathways are undertaken. For further information on school students, see <http://www.abs.gov.au/AUSSTATS/[email protected]/MF/4221.0>.
2 The data on VET in Schools students are sourced from the NCVER National VET in Schools Collection. From 2014, this collection is compiled under the Australian Vocational Education and Training Management Information Statistical Standard (AVETMISS), release 7.0. The collection includes activity from 1 January to 31 December of the reference year. The scope is all activity undertaken as part of a student’s senior secondary certificate of education (SSCE) that provides credit towards a nationally recognised VET qualification. For further information on VET in Schools students, see <https://www.ncver.edu.au/data/collection/vet-in-schools>.
3 The data on higher education students are sourced from the Higher Education Statistics Collection, which is published by the Australian Government Department of Education and Training. The scope is students enrolled in higher education courses from 1 January to 31 December of the reference year. The collection includes activity reported by all higher education providers approved under Subsection 19—70(1) of the Higher Education Support Act 2003. For further information on higher education students, see <https://education.gov.au/student-data>.
4 An apprentice or trainee is a person who undertook a contract of training with an employer and a training provider. The data on apprentices and trainees are sourced from the NCVER National Apprentice and Trainee Collection (June 2017 estimates). This collection is compiled under AVETMISS, release 7.0. Due to lags in processing numbers, recent quarterly activity is estimated. For further information on apprentices and trainees, see <https://www.ncver.edu.au/research-and-statistics/collection/apprentices-and-trainees-collection>.
5 The data on total VET activity statistics are sourced from the NCVER National VET Provider Collection and National VET in Schools Collection, with duplicated training and student activity removed. These collections are compiled under AVETMISS, release 7.0. The collection includes activity from 1 January to 31 December of the reference year. Year-on-year training activity comparisons for total VET activity are presented for 2015 to 2017 data only. 2014 was both the first and a transition year, whereby several training providers were granted exemptions from reporting, while others did not report their training activity. Many training providers also reported data for the first time. For further information on total VET students, see <https://www.ncver.edu.au/research-and-statistics/collection/students-and-courses-collection/total-vet-students-and-courses>.
6 The data on government-funded VET students were derived from the NCVER National VET Provider Collection. From 2014, this collection is compiled under AVETMISS, release 7.0. The
Young people in education and training 2017 25

collection includes activity from 1 January to 31 December of the reference year. The scope is all domestic government-funded VET activity delivered by all Australian training providers. For further information on government-funded VET students, see <https://www.ncver.edu.au/research-and-statistics/collection/students-and-courses-collection/government-funded-students-and-courses>.
7 Data on the 15 to 19-year-old population were derived from the ABS Australian demographic statistics December 2017. This publication contains estimates of the resident population of Australian states and territories as at 30 June of each reference year. For further information on population statistics, see <http://www.abs.gov.au/AUSSTATS/[email protected]/allprimarymainfeatures/C3AC94C0AE80617ACA25830D0012C41D?opendocument>.
Methodology for education and training estimate as at August 20178 Table 1 provides an estimate of participation in education and training by Australians aged
15 to 19 years as at August 2017. Where possible, the data were based on counts of individuals as at 31 August 2017. If this date was not possible, the closest date to 31 August 2016 was selected. As a result, the number of: school students is as at 4 August 2017 apprentices and trainees is as at 30 September 2017 total persons is as at 30 June 2017 higher education students is based on students enrolled in at least one unit of study
with a census date between 1 June and 30 September 2017 (inclusive) government-funded VET students, total VET students and VET in Schools students are as
at 31 August 2017.
9 The estimates provided in table 1 were derived from various data collections. To avoid double-counting, students who participated in more than one education and training sector were allocated an ‘activity’ based on a hierarchy (at school with participation in VET in Schools, at schools with no participation in VET in Schools, higher education, apprenticeships or traineeships and other VET programs). For example, school students undertaking an apprenticeship or traineeship were not included in the data on young people engaged in an apprenticeship or traineeship, as they are covered in the schools collection.
10 The scope of the data and methodology used to derive the estimate for ‘other VET programs’ was changed for the August 2014 estimate. The source was changed from government-funded VET students to total VET students. As a result of the changes, the estimate in table 1 of this 2017 publication is comparable with table 1 of the 2014 to 2016 publications but should not be compared with any years prior to 2014. Further details on the methodology are provided below.
Methodology of the education and training activity of Australians aged 15 to 19 years
Activity Data source Data derivation rules
At schoolSchool with participation in VET in Schools programs
NCVER National VET in Schools Collection
VET in Schools students with at least one subject enrolment with a start date on or before 31 August 2017 and an end date on or after 31 August 2017. VET in Schools students with an overseas postal address were excluded.
School without participation in VET in Schools
ABS National Schools Statistics Collection; NCVER National VET in Schools Collection
School students in the National Schools Statistics Collection as at 4 August 2017 minus VET in Schools students (excluding those with an overseas postal address) as at 31 August 2017 in the NCVER National VET in Schools Collection. Full-fee-paying overseas students (FFPOS) whose ‘Australian resident’ status may be ambiguous were included.
Not at schoolHigher education Department of Students with at least one unit of study enrolment with a census date
26 Australian vocational education and training statistics
Education and Training Higher Education Statistics Collection
between 1 June 2017 and 30 September 2017 inclusive. Excludes students recorded as being a New Zealand citizen, a student with a temporary entry permit, a diplomat or a dependant of a diplomat, or a student residing outside Australia during the unit of study.
Apprenticeship or traineeship
NCVER National Apprentice and Trainee Collection
Apprentices and trainees in-training as at 30 September 2017. Apprentices and trainees at school were excluded. Apprentices and trainees with an overseas postal address were excluded.
Other VET programs NCVER National VET Provider Collection (total VET scope)
Total VET students with at least one subject enrolment with a start date on or before 31 August 2017 and an end date on or after 31 August 2017. Students with an overseas postal address were excluded. Students at school, enrolled in at least one VET in Schools subject and/or undertaking an apprenticeship or traineeship were excluded.
PopulationTotal students aged 15 to 19 years
ABS Australian demographic statistics
Persons aged 15 to 19 years as at 30 June 2017. These data include international students if they are living in Australia for 12 out of 16 months.
Young people in education and training 2017 27

11 There may be a small overlap in the statistics in table 1 between the higher education sector and other sectors, which could not be removed. For example, a student enrolled in higher education and undertaking an apprenticeship or traineeship at the same time may be counted twice.
12 The participation estimates for total students in table 1 includes students for which the gender is reported as ‘unknown’.
13 Although every effort has been made to avoid double-counting, the inherent overlap between data collections, the level of ‘not known’ data for key data element, inability to use USI as a matching keys and limitations in deriving a true point-in-time estimate have resulted in more people in education and training than the total number of 15 and 17-year-olds (based on ABS population data).
14 The data in table 1 do not match the data in the sectoral tables (tables 2—12) for the following reasons: The statistics in table 1 only include students as at August 2017 and apprentices and
trainees as at September 2017. The sectoral tables capture all students and apprentice and trainee commencements in the reference year, with the exception of schools data, which are based on a census date in August each year.
The statistics in table 1 exclude international students (where possible), whereas international students are included in most sectoral tables.
The estimate in table 1 attempts to address the double-counting of students due to overlaps between the coverage of the collections and young people participating in more than one education and training activity. This methodology was not applied to the sectoral tables.
A de-duplication process has been applied to total VET student counts in table 9 of this publication. This process has not been applied to the calculation of participation rates in table 1. Please refer to points 30—36 of the explanatory notes for further information on the de-duplication of total VET student counts.
Data quality and comparability issues
VET in Schools students15 VET in Schools data may not be comparable across states and territories due to differences
in definitional and compilation practices used by states and territories to populate some fields. For example, the inclusion of students below Year 11 in the National VET in Schools Collection varies by state and territory.
16 In 2017 the South Australian Department consolidated its data reporting collections. This resulted in an overall decrease both in student numbers and with reported duplicate records. Only records reported by the SACE Board were included in the 2017 VET in Schools Collection.
17 There are data quality issues associated with the 2013 VET in Schools data from the Northern Territory, with school type and school-based apprentice and trainee data not reported.
18 From 2014, the data cover all VET in Schools delivery in the Northern Territory. Previous years’ data for the Northern Territory were reported based on SACE reporting scope and therefore omit students without a SACE registration, including all middle years students.
19 Due to an issue with processing the 2015 Australian Capital Territory data submission, the number of school-based apprentices and trainees reported for the ACT in 2015 was under reported as 55. The reported number should be 140.
28 Australian vocational education and training statistics

20 VET in Schools data for the Australian Capital Territory (ACT) is for VET studied by students where the registered training organisation (RTO) was an ACT college or was one campus of an RTO incorporating multiple colleges, and the outcomes were certificated by the ACT Board of Senior Secondary Studies. It does not include VET studied by students with external RTOs.
21 For the Australian Capital Territory, the 2017 data covers only VET in Schools students who enrolled in qualifications and achieved at least one competency.
22 In WA, Year 12 students are currently certified under the WA Certificate of Education (WACE) 2016 policy. This policy stipulates, as one of the requirements, a student has to complete at least four Year 12 ATAR courses or successfully complete a certificate II (or higher) Vocational Education and Training (VET) qualification to achieve a WACE. As the WACE is a credential based on Year 11 and 12 achievement, the 2017 Year 12 students may have started working towards the achievement of their WACE as early as year 10 in 2015. Any Year 10 VET certificate level achievement will contribute to the WACE achievement.
23 In Victoria, The VCAA collects data relating to enrolments in and completion of VET units of competency by students who are enrolled into the VCE or VCAL. Whilst the enrolments sit within VET certificates the VCAA does not collect data regarding the certificate completion, this responsibility lies with the RTO. The 24 VCAA approved VCE VET programs provide a mechanism where the qualification completion requirements are imbedded within the structure of the program and specify credit into the VCE or VCAL. This data should not be used to identify certificate completion.
24 In 2015, the reporting of Victorian students by school type was based on the provider type responsible for issuing the VET Certificate or Statement of Attainment. The Senior Secondary Certificate enrolment school (home school) of students undertaking VET by school type was: Government school - 30,160, Catholic school - 11,665, Independent school - 5,095 and Other – 4,575.
25 Changes in numbers of VET in Schools students in Tasmania should be treated with caution as both data collection methodologies and quality assurance have improved in recent years.
26 The change in Tasmanian VET in School student numbers over the 2011―13 period was mainly due to changes in the post-compulsory education and training system in Tasmania. This impacted on the methodology for counting VET in Schools students because 2012 data were collected using a methodology different from other years. As a result, 2011 and 2013 and onwards data are not comparable with 2012 data, and caution should be exercised in comparing data between years.
27 In 2015, a major RTO in Tasmania had reduced VET in Schools activity.
Government-funded VET students28 Changes to reporting scope — from 2016, all fee-for-service activity (including that
delivered by TAFE institutes and other government providers) has been excluded from the scope of government-funded activity, so that government-funded VET students data now only reports Commonwealth and state/territory government-funded training activity. The new scope has been backdated to 2003 in all NCVER resources. Fee-for-service activity from TAFE and other government, adult and community education and other registered training organisations is reported in the total VET students data.
29 If a student has enrolled with more than one training provider during a collection period it is possible for a student to be counted more than once, so government-funded student counts may be inflated in this publication. The possibility for the same student to enrol in more than one government-funded program is subject of local jurisdictional policy.
Young people in education and training 2017 29
30 The significant increase in VET activity in New South Wales between 2015 and 2016 can be attributed to the commencement of the Smart and Skilled Targeted Priorities Prevocational and Part Qualifications program in late 2015 and a number of policy changes implemented in 2016 after the first stage review of Smart and Skilled.
31 In 2017 South Australia reported as one consolidated submission (505 – Department of State Development) instead of the previous four submissions (500 — TAFE SA, 530 — SA ACE, 550 — SA Private Providers and 580 — SA VIS (VET in Schools assessed by TAFE). As student counts are calculated by submitter, there was previously some duplication of government-funded student numbers in the state. However, duplicate students have now been almost entirely removed in this single submission. This change of submission would have contributed slightly to the decline in student numbers in South Australia between 2016 and 2017.
32 The funding of the South Australian entitlement scheme — ‘Skills for All’ — changed in 2014, which capped the training for many qualifications and led to a decline in government-funded student and subject enrolments in South Australia.
33 For the 2015 reporting year, Tasmania endeavoured to uniquely identify each student, irrespective of how many RTOs they attended. The methodology was not continued for 2016 and returned to the original practice of uniquely distinguishing an individual within a training organisation. Consequently, student numbers in 2015 are not comparable with previous or subsequent years.
Total VET students34 In November 2012, the then COAG Standing Council on Tertiary Education Skills and
Employment (SCOTESE) agreed to the introduction of mandatory reporting of all nationally recognised training activity from 2014 onwards. This is referred to as ‘total VET activity’ (TVA) to reflect that it reports on students who undertook government-subsidised training as well as those who undertook training on a fee-for-service basis. The data on total VET students and program enrolments in tables 1, 9 and 10 were derived from the total VET activity data.
35 Since the introduction of ‘total VET activity’, NCVER has applied a process to identify and remove duplicate training activity where the same activity is reported for the same training provider in the same collection period via different data submitters.
36 When duplicate training activity is identified, the following hierarchy is applied, whereby only the training activity at the highest hierarchy level is reported: data submitted by a State Training Authority data submitted by a Board of Study (or State Training Authority on behalf of a Board of
Study) data submitted directly to the NCVER by a registered training organisation.
37 From 1 January 2015, all new and continuing students undertaking nationally recognised VET in Australia are required to have a unique student identifier (USI) to receive a qualification or statement of attainment. The USI is a randomly generated alpha-numeric code recorded against any nationally recognised training undertaken and remains with an individual for life. The implementation of the USI provides a mechanism with which to identify and potentially remove duplicate student records. NCVER has developed a two-step process to de-duplicate total VET student counts, which uses the USI where available and a count of distinct client identifiers within each submission for the residual data.
38 The de-duplication method outlined above has been applied to student counts from 2015 onwards in table 9 of this publication. Caution must be used when comparing year-on-year de-duplicated student counts, due to differing rates of duplication across reported variables (for example, age, state or territory of student residence), which in part could be due to varying rates of USI provision.
30 Australian vocational education and training statistics

39 For further information on the de-duplication process please refer to the fact sheet: De-duplication of training activity and student counts in ‘total VET activity’ located at <https://www.ncver.edu.au/research-and-statistics/collection/students-and-courses-collection/total-vet-activity-fact-sheets>.
Apprentice and trainee commencements40 From 1 July 2012 the Australian Government discontinued the $1500 standard employer
commencement incentive payment and increased the standard completion incentive by $500 to $3000 for existing worker apprentices and trainees in non-National Skills Needs List occupations. The observed changes to commencements and completion levels need to be seen in the context of this policy change. Further details on incentive changes may be found in the 2012―13 Budget <http://www.budget.gov.au/2012-13/content/bp2/html/bp2_expense-15.htm>.
41 In April 2012, the Victorian Department of Education and Early Childhood Development announced through Refocusing vocational training in Victoria that it would refocus subsidy rates for VET courses to better target the areas of greatest public benefit and future jobs growth. New fee and funding rates were effective from 1 July 2012 for all new courses comments. Changes to these subsidy rates may influence employer decisions on whether to commence trainees in some VET courses.
Young people in education and training 2017 31
State or territory42 ‘State or territory’ of school (table 2) and higher education (table 5) students refers to the
state and territory of the provider/school. 43 ‘State or territory’ of VET in Schools (table 3) students refers to the state or territory of the
data submitter (the senior secondary assessment authority).44 ‘State or territory’ of apprenticeship and traineeship commencements (table 7) refers to
the state or territory of contract registration.45 ‘State or territory’ of total VET students (table 9) refers to the state or territory where the
training was delivered. The category of 'other' includes other Australian territories (for example, Christmas Island) and 'not known'. 'Other' also includes a mixed category (where the student is associated with more than one state or territory of training delivery location).
46 ‘State or territory’ of government-funded VET students (table 11) refers to the state or territory that funds or accredits the training.
Student remoteness (ARIA+) region47 Student remoteness is based on the Access/Remoteness Index of Australia (ARIA+),
developed by the National Centre for Social Applications of Geographic Information Systems. ARIA+ is now the standard ABS-endorsed measure of remoteness. In tables 3, 5, 7, 9 and 11, student remoteness (ARIA+) is determined from ARIA+ remoteness regions and ABS SA2 regions.
48 ‘Outside Australia’ for VET in Schools (table 3) refers to the overseas postal address of students studying in Australia only.
48 ‘Outside Australia’ for higher education (table 5) and total VET students (table 9) refers to the overseas postal address of students studying both in Australia and overseas.
49 ‘Outside Australia’ for government-funded (table 11) refers to the overseas postal address of students studying in Australia only.
Additional information50 Note that percentages presented in this publication are reported to one decimal place.
Other numbers, after aggregation, have been rounded to the nearest hundred. Rounding can lead to situations where the numbers in the body of a given table might not add to the rounded totals.
51 A dash (-) represents a true zero figure, with no data reported in this category.52 na represents ‘not applicable’.53 ** Per cent change not calculated due to small base numbers.54 The NCVER National VET Provider Collection and the NCVER National VET in Schools
Collection contain students whose sex was not reported. These unknown data have not been separately reported in tables 1, 2, 3, 5, 7, 9 and 11, whereas the total includes all students, including those with unknown status. Therefore, some figures may not sum to the total.
55 The category ‘other’ in the ‘qualification level’ data element in table 4 includes: education not elsewhere classified; statements of attainment not identifiable by level; bridging and enabling courses; and other courses that do not lead to a qualification under the AQF.
56 ‘Apprentices and trainees’ in tables 9 and 11 refer to apprentices and trainees enrolled in the VET system for off-the-job training.
32 Australian vocational education and training statistics

57 The category ‘postgraduate courses’ in the ‘qualification level’ data element in table 6 includes doctorate by research, doctorate by coursework, master degree by research, master degree by coursework and other postgraduate courses and graduate diploma/postgraduate diploma (pass or honours) extending skills and knowledge in a professional area previously studied.
58 Caution should be taken when using data with many ‘not known’ responses. Data are reported as ‘not known’ for the following reasons: information was not collected partial reporting exemptions are present that allow training providers to submit ‘not
known’ student demographic data a student has not responded to a question on the enrolment form a student has asked for their information not to be disclosed and used for reporting
purposes invalid information was supplied where duplicate student records have conflicting demographic information, for example
where the same student is reported as both Indigenous and non-Indigenous.
Young people in education and training 2017 33

