youth attitude tracking study 1998
TRANSCRIPT
July 2000DMDC Report No. 2000-019
Youth Attitude Tracking Study
1999 Propensity andAdvertising Report

For additional copies of this report,contact:
Defense Technical Information CenterATTN: DTIC-BRR
Defense Document Information Center8725 John J. Kingman Rd., Suite #0944
Ft. Belvoir, VA 22060-6218
(703) 767-8274
Ask for Report by ADA-385236

DMDC Report No. 2000-019June 14, 2000
YOUTH ATTITUDE TRACKING STUDY
1999 PROPENSITY AND ADVERTISING REPORT
Michael J. Wilson, James B. Greenlees, Tracey Hagerty, Cynthia v. Helba and D. Wayne Hintze Westat
Jerome D. LehnusDefense Manpower Data Center
Defense Manpower Data Center1600 Wilson Boulevard, Suite 400, Arlington, VA 22209-2593

Acknowledgments
ii
ACKNOWLEDGMENTS
This administration of the Youth AttitudeTracking Study (YATS) marks the 10th year thatWestat, Inc. has conducted the survey for theDepartment of Defense (DoD). YATS continuesto provide DoD and the individual militaryservices with information on enlistment propensityas well as attitudes and opinions of today's youth.The 1999 survey was conducted with over 10,000American youth between the ages of 16 and 24using a Computer Assisted Telephone Interview(CATI) methodology. The 1999 surveyadministration was conducted between August30, 1999 and November 21, 1999 by Westat,under contract DASW01-96-C-0041 as part ofthe Joint Market Research Program. This annualreport presents findings from the 1999 interviewswhich cover topics such as enlistment propensity,reasons for entering or not entering the military,advertising awareness, and slogan recognition.As always, the primary measure in YATS ismilitary propensity. Many individuals havecontributed their time and energy into making the1999 administration a success, and we would liketo recognize their efforts here.
First, the YATS Project Directors, Dr. Michael JWilson and Mr. D. Wayne Hintze, would like tothank several individuals outside of Westat whoprovided guidance throughout the projectDr.W.S. Sellman, Director for Accession Policy[OASD(FMP)], Dr. Anita Lancaster, AssistantDirector for Program Management, DefenseManpower Data Center (DMDC), and Dr.Jerome Lehnus, (DMDC). Dr. Sellman and Dr.Lancaster provided the insight and guidance thatallowed us to keep the
proper focus during the project. Dr. Lehnusprovided the detailed direction and technicalreview for the study as the Senior Scientist incharge of YATS. We would also like to thankthe members of the Joint Market Analysis andResearch Committee (JMARC) for their inputand feedback that led to the revised 1999 surveyinstrument and their review of several keydeliverables.
Finally, we would like to thank the manyprogrammers, statisticians, and analysts that arevital to the success of a large CATI project likeYATS. The successful data collection effort isdue to the guidance of Ms. Brenda Simpson andMs. Pat Warren who shared responsibilities asthe Telephone Research Center (TRC)operations manager. The project directors wouldalso like to thank several programmers whosupported the project: Ms. Katie Hubbell, Ms.Fauzia Tirmazi, and Ms. Yannett Gaspare.Thanks are also due to Ms. Mary Ann Deak whoperformed and led essential data editing andquality control activities and to Mr. Jim Greenleesand Ms. Tracey Hagerty who have supportedYATS as project analysts for several years,contributing to many products such as this report.We are also thankful for the attention to detailand patience exhibited by Ms. Sonja Ouellette inproducing this report.
Finally, our thanks are extended to over 300interviewers and supervisors who worked sodiligently to collect the data, and the 10,000 youngmen and women who took time out of their busyschedules to share their personal views, opinions,and attitudes.
iii
EXECUTIVE SUMMARY
The Youth Attitude Tracking Study (YATS) hasbeen conducted annually since 1975 for thepurpose of collecting information from Americanyouth on topics such as their future plans, currentevents, military recruiting advertising, and mediahabits. The primary focus of YATS has been tomeasure enlistment propensity—active duty,Reserve/National Guard, composite, and Service-specific propensity.
Over the past two decades, YATS has been theprimary source of information for Department ofDefense officials regarding youth enlistmentpropensity. The 1999 YATS survey collectedinformation during 30-minute interviews with anationally representative sample of 10,054 youthbetween the ages of 16 and 24.
Demographic Profile
The characteristics of the American youthpopulation, the primary recruiting market of theArmed Services, are changing over time.Because these variables are related to propensity,changes in the demographic profile are of specialinterest to military recruiting officials. Gradualchanges are occurring in the racial/ethniccomposition of the population and the educationaland career aspirations of youth.
Most youth indicate they hope to achieve at leasta Bachelor’s degree. The number of high schoolgraduates and the number of youth completingsome college is increasing steadily while thenumber of college graduates is hardly increasingat all.
Employment trends for youth who havecompleted high school, but not completed college,have improved. For young men, unemploymenthas dropped from slightly above 10 percent in1995 to about 8.5 percent in 1999. In constantdollars, weekly earnings are increasing for youngmen.
There has been a decrease in the proportion ofveteran parents (who have been positiveinfluencers in the past). Current projectionsindicate that the percent of enlistment-eligibleyouth who have parents who have been in themilitary will decrease from 26 percent in 1998 to16 percent in 2005.
Enlistment Propensity
Propensity is defined in YATS as the percent ofyouth who say they will “definitely” or “probably”enter military service. This propensity measurehas been shown to be a valid indicator ofenlistment behavior. For most youth, propensityfor military service is general, not tied to only onespecific Military Service. Most youth who areinterested in military service cite interest in two ormore Services.
Propensity is related to several demographiccharacteristics. Generally, propensity:
• Is higher for men than women;
• Declines with age;
• Declines with increasing educationalattainment;
• Is higher for unemployed than employedyouth;
• Is highest for Hispanic youth, followed byBlack youth, and lowest for White youth;
• Is higher for youth who are not married;and
• Varies by region: higher in the South andWest and lowest in the North Centralregion.
Young men’s propensity for military service roseduring the Cold War, dropped following OperationDesert Storm, and declined in the past several

iv
years. Generally, young women’s propensity formilitary service has been constant since 1984.Propensity trends for White, Black and Hispanicyouth are distinct, as are patterns for the differentServices.
Entering Military Service: ToJoin or Not to Join?
There are many factors that affect the decisionby youth to join or avoid the military. Some ofthese factors are at least partially controllable(youth have some control over how well they doin school) while others are not (youth do notcontrol the job market). Consequently, individualreasons to join or not enter military service arevery dynamic in nature. Nonetheless, there arestatistical patterns and trends in reasons providedby YATS.
Reasons for Joining. Reasons offered by youthinclude both tangible (e.g., educational funding,job training, pay) and intangible (e.g., duty tocountry, discipline, self-esteem) reasons. As onewould expect, youth interested in military serviceoffer more reasons for joining than those who donot expect to join the military. In general,although different segments of the youthpopulation offer the same reasons for joining,group differences are largely predictable. Forexample, somewhat more women (37%) thanmen (32%) mention money for education as areason for joining. High school seniors are morelikely than high school graduates to mention dutyto their country; high school graduates who havenot gone to college are more likely to cite jobsecurity, retirement benefits, and travel.
Reasons for Increased Interest in MilitaryService. Some of the reasons for increasedinterest in military service, such as money foreducation and job training, are similar to thosementioned as reasons for joining. Youth alsomention personal communications (conversationswith people who are, or have been, in the military,recruiter contact, and military advertising) and
changing circumstances (difficulty in school) asreasons for increased interest in military service.
Reasons for Not Joining. Youth most oftenmention military lifestyle as a reason for notentering military service. This may be aperception based on conversations they have hadwith veterans or peers or by other sources ofinfluence such as television, movies, etc. Youthalso mention the length of military commitmentand threat to life as reasons for not entering themilitary.
Many youth mention conflicting interests, ratherthan something objectionable about the military.They may, for example, mention they have a jobthey like. Some mention family obligations that donot allow them to seriously consider a militarycareer. Few youth mention that they are notqualified to serve.
Race/ethnic groups mention reasons for notjoining with different frequency.
• White youth are more likely thanminorities to mention other careerinterests, or to object to the length ofcommitment;
• Black youth are more likely to mentionthreat to life or to say that killing is againsttheir beliefs;
• Black youth are less likely to mentionfamily obligations than youth of otherrace/ethnic backgrounds; and
• Hispanic men and women are more likelyto mention family obligations, whileHispanic men are less likely to object tothe military lifestyle.
Reasons for Decreased Interest in MilitaryService. To a large degree, reasons fordecreased interest mirror reasons offered for notjoining. As with reasons for joining,communications play a role. Some youth reportthat talking to people who are, or have been, inthe military increased their interest in military
Executive Summary
v
service; others report these conversationsdecreased their interest. More youth reportincreased interest, so the net effect is positive.Similarly, some youth report talking to a recruiterincreased their interest; others reportconversations with recruiters decreased theirinterest. But, more report increased thandecreased interest as a result of talking to arecruiter.
As with conversations with recruiters and otherswho have been in the military, news events havea positive effect on interest in military service forsome youth, and a negative effect on the interestof other youth. With news events, however, theeffect is more often negative than positive.
Military Advertising Awareness
The Department of Defense spends considerableresources in developing advertising campaignsthat will reach and persuade youth to enlist in themilitary. YATS contains survey questions onrecall of military advertising and recognition ofmilitary slogans. Advertising awareness ishighest for Army and Marine Corps activeadvertising, and recall rates for young men aresignificantly higher than for women. Awarenessof active Service advertising is higher thanReserve or National Guard advertising, and twiceas many youth recall Army Reserve advertisingcompared to Army National Guard advertising.Advertising awareness is also correlated withcertain demographic characteristics:
• Army and Marine Corps advertisingawareness increases as age increases;
• Recall of Service advertising increases aseducational attainment increases;
• Recall is highest among youth who havealready earned a college degree; and
• White youth are generally more likely torecall active Service advertising thanBlack or Hispanic youth.
Trends in active Service advertising recall havedeclined steadily for Army, Marine Corps, andAir Force advertising between 1993 and 1999.The largest drop over the entire period occurredfor Air Force advertising awareness.
YATS respondents were also asked if theyremembered hearing or seeing Joint Serviceadvertising—advertising that names each Service.Recall of Joint Service advertising has continuedto drop since 1993 and is actually higher amongwomen than men for the first time ever in 1999.
Youth were also asked to identify slogans used inmilitary advertising campaigns. Correctrecognition of Service slogans is higher amongmen than women, and three slogans continue tobe most often correctly identified by young men:Be All You Can Be (Army), Aim High (AirForce), and The Few. The Proud (MarineCorps). In general, correct recognition of MarineCorps, Air Force, and Coast Guard advertisingslogans has decreased since 1990, whilerecognition of Navy slogans has increased.
Finally, recruiter contact continues to be stronglyrelated to advertising recall. Recruiter contactrates were significantly higher among youth whorecalled military advertising than those who didnot.
Recruiting Outlook
The 1999 YATS data paint a bleak view forfuture recruiting. Using YATS, policy makerscan tie demographic findings to propensity to jointhe military. The demographic profile of thetarget recruiting population is changing as more oftoday’s youth go to college. Since propensitydeclines with increasing educational attainment,policy makers should expect a negative impact onrecruiting.
Each year, there are fewer enlistment-eligibleyouth with veteran parents. Parents who areveterans have been some of the more positiveinfluencers in the past. American youth
vi
responding to YATS questions list conversationswith people who have been in the military as oneof the reasons for increased interest in joiningmilitary service.
Youth also list military advertising as one of thereasons for increased interest in the military—yet
Service advertising recall has been declining since1993. Overall, demographic and economic trendscombined with YATS findings suggest theDepartment of Defense will need to findadditional ways to address its recruitingchallenges.

vii
TABLE OF CONTENTS
Chapter Page
ACKNOWLEDGEMENTS ............................................................................... ii
EXECUTIVE SUMMARY ................................................................................ iii
1 INTRODUCTION ............................................................................................. 1-1
Overview of the Report......................................................................................... 1-1
Survey Methodology ............................................................................................. 1-2
2 SELECTION AND DEMOGRAPHIC CHARACTERISTICSOF THE 1999 YATS YOUTH........................................................................... 2-1
Introduction .......................................................................................................... 2-1
Overview ............................................................................................................. 2-1
Demographic Characteristics of the 1999 YATS Respondent Population .................. 2-1
Population Trends ................................................................................................. 2-6
Summary.............................................................................................................. 2-15
3 ENLISTMENT PROPENSITY FOR MILITARY SERVICE .......................... 3-1
Introduction .......................................................................................................... 3-1
Overview ............................................................................................................. 3-1
Propensity Measures............................................................................................. 3-1
Propensity-Related Factors.................................................................................... 3-4
Propensity for Specific Services............................................................................. 3-12
Trends in Propensity ............................................................................................. 3-15
Summary.............................................................................................................. 3-28
4 REASONS FOR ENTERING OR NOT ENTERINGMILITARY SERVICE ...................................................................................... 4-1
Introduction .......................................................................................................... 4-1
Overview ............................................................................................................. 4-1
Reasons for Entering Military Service .................................................................... 4-2
Historical Trends in Reasons for Joining ................................................................. 4-5
Alternative Perspective on Reasons for Joining....................................................... 4-7
Reasons for Not Enlisting in the Military................................................................. 4-9
Reasons for Declining Propensity........................................................................... 4-12
Summary.............................................................................................................. 4-14

viii
Chapter Page
5 MILITARY ADVERTISING AWARENESS .................................................... 5-1
Introduction .......................................................................................................... 5-1
Overview ............................................................................................................. 5-1
Advertising Awareness ......................................................................................... 5-3YATS Measures ............................................................................................. 5-3
Awareness of Active/Reserve Advertising ............................................................. 5-3Demographic Correlates of Advertising Awareness ...................................... 5-5Trends in Advertising Awareness .................................................................. 5-9
Joint Advertising Awareness ................................................................................. 5-11YATS Measures ............................................................................................. 5-11Trends in Joint Advertising Awareness.......................................................... 5-11
Trends in Slogan Recognition................................................................................. 5-12YATS Measures ............................................................................................. 5-13Army Slogan Recognition .............................................................................. 5-13Navy Slogan Recognition .............................................................................. 5-14Marine Corps Slogan Recognition ................................................................ 5-15Air Force Slogan Recognition ....................................................................... 5-16Coast Guard Slogan Recognition.................................................................. 5-17
Advertising Awareness and Recruiter Contact........................................................ 5-18YATS Measures ............................................................................................. 5-18
Summary.............................................................................................................. 5-20
REFERENCES .................................................................................................. R-1

ix
Appendices
Appendix Page
A Supplementary Data Tables for Chapter 2.......................................................... A-1
B Estimating Veteran Fathers............................................................................... B-1
C Supplementary Data Tables for Chapter 3.......................................................... C-1
D 1999 YATS Topline Tables (Supplementary Data Tables for Chapter 3) .............. D-1
E Supplementary Data Tables for Chapter 4.......................................................... E-1
F Supplementary Data Tables for Chapter 5.......................................................... F-1

x
List of Tables
Table Page
2-1 Age Distribution of YATS Sample and Survey Population, by Gender ...................... 2-2
2-2 School Status by Gender........................................................................................ 2-3
2-3 Employment Status by Gender and School Status (percent)...................................... 2-5
2-4 Race/Ethnic Distribution of YATS Sample and Survey Population, by Gender........... 2-5
2-5 Educational Achievement by Race/Ethnic Group (percent) ...................................... 2-8
2-6 Average Undergraduate Tuition, Fees, Room and Board Paid byFull-Time-Equivalent Students................................................................................ 2-11
2-7 Sources of College Funding, by Gender (percent).................................................... 2-12
3-1 Propensity by Education, Gender............................................................................ 3-6
3-2 Propensity by Employment, Gender........................................................................ 3-7
3-3 Propensity by Income Prospects in Military vs. Civilian Jobs .................................... 3-8
3-4 Propensity by Perceived Difficulty in Getting a Civilian Job...................................... 3-8
3-5 Propensity by Race/Ethnicity ................................................................................. 3-9
3-6 Propensity of High School Juniors and Seniors by Mother’s Education...................... 3-10
3-7 Propensity by Geographic Region........................................................................... 3-11
3-8 1999 Propensity: Active Duty and National Guard/Reserves .................................... 3-13
3-9 Percent of Youth Indicating Propensity for Multiple Active Services ........................ 3-13
3-10 Percent of Youth Indicating Propensity for Both Active andReserve Service and for Both Reserves and National Guard.................................... 3-14
xi
Table Page
4-1 Main Reasons for Joining Among Young Men and Womenby Composite Active Propensity ............................................................................ 4-3
4-2 Main Reasons for Joining Among Young Men and Womenby Race/Ethnicity.................................................................................................. 4-4
4-3 Main Reasons for Increased Interest in the Military AmongYoung Men and Women ....................................................................................... 4-8
4-4 Main Reasons Not to Enlist Among Young Men and Womenby Composite Active Propensity ............................................................................ 4-10
4-5 Main Reasons Not to Enlist Among Young Men and Womenby Race/Ethnicity.................................................................................................. 4-11
4-6 Main Reasons for Decreased Interest in the Military AmongYoung Men and Women ....................................................................................... 4-13
5-1 Service Advertising Awareness, by Component and Gender .................................... 5-4
5-2 Active Service Advertising Awareness, by Education and Gender............................ 5-7
5-3 Active Service Advertising Awareness, by Race/Ethnicity and Gender..................... 5-8
5-4 Service Advertising Slogans: Years in Which Service Slogans Appearedin YATS Survey and Service Advertising Campaigns .............................................. 5-12
5-5 Recruiter Contact by Advertising Awareness and Gender ....................................... 5-18
5-6 Recruiter Contact by Service-Specific Advertising Awareness and Gender .............. 5-19

xii
List of Figures
Figure Page
2-1 Age Distribution of YATS Population, by Gender.................................................... 2-2
2-2 Schematic of Education Status Categories .............................................................. 2-4
2-3 Regional Distribution of YATS Population .............................................................. 2-6
2-4 Population Trends, 18-19 Year-Olds....................................................................... 2-7
2-5 Population Trends, 18-19 Year-Old Blacks and Hispanics........................................ 2-7
2-6 Median Income, Men and Women 25 Years-Old and Over...................................... 2-9
2-7 Educational Trends and Projections ........................................................................ 2-10
2-8 Percent Unemployment Among 19-24 Year-Old High SchoolGraduate Non-Students Who Do Not Have Bachelor’s Degrees.............................. 2-13
2-9 CPI Adjusted Median Weekly Earnings of 19-24 Year-Old HighSchool Graduate Non-Students Who Do Not Have Bachelor’s Degrees................... 2-13
2-10 Percent of Veteran Fathers of YATS Age Respondents ......................................... 2-14
3-1 Relationship of Propensity to Age Among Young Men............................................ 3-4
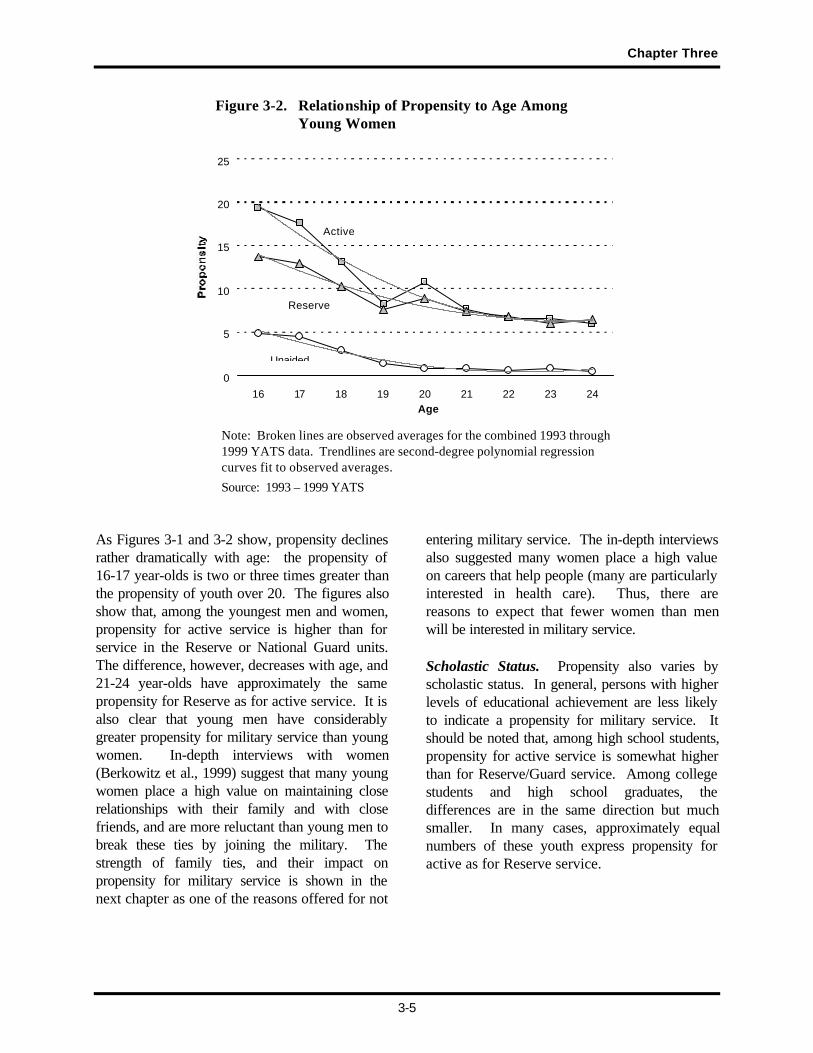
3-2 Relationship of Propensity to Age Among Young Women....................................... 3-5
3-3 Relationship of Propensity for Military Service to High SchoolSeniors’ Likelihood of Attending College Within a Year of Graduation...................... 3-7
3-4 National Guard and Reserve Propensity by Gender ................................................. 3-14
3-5 Unaided Propensity Trends.................................................................................... 3-16
3-6 Active Composite Propensity Trends...................................................................... 3-17
3-7 Active Composite Propensity Trends Among White Youth ...................................... 3-18
3-8 Active Composite Propensity Trends Among Black Youth ...................................... 3-19
3-9 Active Composite Propensity Trends Among Hispanic Youth .................................. 3-20
xiii
Figure Page
3-10 Trends in Propensity for Service in the Army.......................................................... 3-21
3-11 Trends in Propensity for Service in the Navy .......................................................... 3-22
3-12 Trends in Propensity for Service in the Marine Corps .............................................. 3-23
3-13 Trends in Propensity for Service in the Air Force.................................................... 3-24
3-14 Trends in Propensity for Service in the Coast Guard................................................ 3-25
3-15 Trends in Propensity for Service in the Reserve Components................................... 3-26
3-16 Trends in Propensity for Service in the Army/Air National Guard............................. 3-27
4-1 Trends in Common Reasons for Entering Military ServiceAmong Young Men .............................................................................................. 4-6
4-2 Trends in Common Reasons for Entering Military ServiceAmong Young Women.......................................................................................... 4-6
5-1 Service Advertising Budgets.................................................................................. 5-2
5-2 Active Service Advertising Awareness Among Men, by Age .................................. 5-5
5-3 Active Service Advertising Awareness Among Women, by Age.............................. 5-6
5-4 Trends in Active Service Advertising Awareness Among Men................................ 5-9
5-5 Trends in Active Service Advertising Awareness Among Women ........................... 5-10
5-6 Trends in Joint Advertising Awareness................................................................... 5-11
5-7 Trends in Correct Army Slogan Recognition ........................................................... 5-13
5-8 Trends in Correct Navy Slogan Recognition............................................................ 5-14
5-9 Trends in Correct Marine Corps Slogan Recognition ............................................... 5-15
5-10 Trends in Correct Air Force Slogan Recognition ..................................................... 5-16
5-11 Trends in Correct Coast Guard Slogan Recognition................................................. 5-17


1-1
1. INTRODUCTION
The yearly cycle of activities for the YouthAttitude Tracking Study (YATS) has beenrelatively constant since the mid-1980s: Earlyeach summer, representatives of the ArmedServices’ recruiting activities meet to discuss thecomposition of the YATS questionnaire. Therepresentatives page through the entire 80-pluspage questionnaire, deciding which questions stay,which need to modified, and which can bedropped to make room for new questions. Newquestions are pre-tested, using small groups ofsurrogate respondents, to identify potentialsources of misinterpretation. The computersystem which controls the telephone interviews isreprogrammed. Approximately 10,000 telephoneinterviews are conducted from Septemberthrough mid-November by 300 specially trainedinterviewers to determine how attitudes towardthe military are changing. “Topline” memorandaprovide initial results to the Services in December,and complete data files are delivered at thebeginning of January. Analyses of the YATSdata continue throughout the year.
YATS has been providing the Armed Serviceswith information on youth attitudes since 1975.Shortly after the termination of the military draft,DoD realized that, to compete for youth withcommercial and educational institutions, it neededongoing information on youth attitudes: what wasimportant to youth, and how youth viewed militaryservice. YATS was created to address theseneeds. Information from YATS is used by eachof the Services, and by their advertising agencies.Data from YATS are also used by think tanks,such as RAND, to evaluate youth and recruitingissues. YATS is the primary measure ofpropensity for military service, a commonbenchmark of attitudes toward military service.
This report is the primary vehicle fordisseminating findings from the YATS survey.1The next section provides an overview of each ofthe following chapters. The final section of thischapter describes data collection methodology.
Overview of the Report
This report provides four related perspectives onthe current recruiting market: demographics ofthe youth population, propensity for militaryservice, reasons for and barriers to enteringmilitary service, and the impact of recruitingefforts (particularly advertising awareness).
Chapter 2, Selection and DemographicCharacteristics of the 1999 YATS Youth,begins with a description of the YATS youthpopulation, and continues with demographictrends shaping the recruiting market. It providesdemographic information on both the YATSsample (the youth who were actually interviewed)and population (all youth who were eligible to besurveyed). The chapter describes the distributionof American youth with respect to gender, age,scholastic status, employment, race/ethnicity, andgeographic location. Chapter 2 goes on topresent trends in population growth amongWhites, Blacks and Hispanics, and differences ineducational achievement. For the latter, itdescribes trends in scholastic achievement, andfactors affecting postsecondary education—whyeveryone wants a college degree, and why thismay be difficult for some. Chapter 2 also drawsfrom the Current Population Survey (CPS)2 for 1 Each of the Recruiting Services and RAND receive complete
data files. Briefings, conference presentations, and topicreports that are prepared generally focus on specific topics.
2 CPS is a large on-going survey conducted for the Bureau ofLabor Statistics by the Census Bureau. We have included CPSdata in the YATS report because it allows us to speak at apopulation level that is relevant to recruiting.

Introduction
1-2
data on youth unemployment and wages. Wealso draw on CPS data to provide trends in thenumber of veteran-fathers in the population.
Chapter 3, Enlistment Propensity for MilitaryService , provides a description of current youthpropensity, correlates of propensity, and historicaltrends in propensity. The chapter first describesYATS propensity measures and explain how theyare valid predictors of enlistment behavior. It alsodraws on in-depth interviews conducted withYATS respondents to help understand what isbeing measured. The second section of Chapter3 describes the relationship between propensityand a variety of youth characteristics—gender,age, school status, educational prospects,employment, employment prospects,race/ethnicity, mother’s education, marital status,father’s veteran status, having friends in themilitary, and geographic location. The thirdsection describes propensity for specific Services.Finally, Chapter 3 describes trends in propensityfrom 1984 through 1999. It describes trends fordifferent propensity measures for differentrace/ethnic groups, for active and Reserveservice, and for specific active Services.
Chapter 4, Reasons for Entering or NotEntering Military Service, examines reasonsfor entering military service and barriers tomilitary service as stated by youth. The chapterdraws on direct questions (“Why would youjoin?” “Why would you not join?”) and onquestions about changing interest in the military(e.g., those who said their interest increased wereasked why it increased; those who said theirinterest decreased were asked why it decreased).Chapter 4 evaluates differences in stated reasonsfor joining, distinguishing between youth who saythey will “definitely” or “probably” join,3 betweenrace/ethnic groups, between school
3 As described in Chapter 3, these are designated as “positively
propensed” for military service.
status groups, between those who know someonewho has been in the military and those who donot, and between men and women. The chapterevaluates barriers to military service with respectto the same variables. Chapter 4 also providestrends in principal reasons for joining.
Chapter 5, Military Advertising Awareness,describes youth awareness of recruitingadvertising, recognition of slogans used in thatadvertising, and the correlation of advertisingawareness to recruiter contact. The chapterprovides advertising information for each branchof active Service (Army, Navy, etc.) as well asfor Reserve components. It also providesinformation on Joint Advertising. It describes theprincipal correlates of advertising awareness(gender, age, education, and race/ethnicity), andexamines trends in advertising awareness andslogan recognition. Finally, Chapter 5 providesdata showing a positive correlation betweenadvertising awareness and recruiter contact.
The intended audience of this report is militaryrecruiting managers. The intent throughout is topresent the information in a manner that willfacilitate understanding of general trends andrelationships. The report uses tables or graphs inthe body of the report. Additional “dataappendices” present the same information ingreater detail than is in the body of the report.These appendices include the data from the tablesand the graphs in the body of the report, alongwith estimates of standard error and sample size.
Survey Methodology
The survey methodology used in the Fall 1999administration remains essentially unchangedfrom that used in recent years. Surveyed youthwere between 16 and 24 years old. Youthcurrently in the military (including thosecontracted to serve in the military and waiting to

Chapter One
1-3
depart for basic training) and those who hadpreviously served were ineligible. The samplealso excludes youth attending a Military ServiceAcademy or enrolled in college ROTC. A totalof 290,000 telephone numbers were sampledusing a list-assisted random digit dialing (RDD)methodology for the generation of the sample.Details of the methodology used for the 1999YATS administration can be found in The Fall1999 YATS Sample Design, Selection, andWeighting Report (Wilson and Chu, 2000).
Over three hundred interviewers were recruitedand trained to collect survey data using computer-assisted-telephone-interviewing (CATI)technology. The thirty-minute YATS interviewswere administered from August 30, 1999 throughNovember 21, 1999. A total of 10,054 YATSinterviews were completed during the field period.


2-1
2. SELECTION AND DEMOGRAPHIC CHARACTERISTICSOF THE 1999 YATS YOUTH
Introduction
The Armed Services are currently experiencingdifficulty in meeting recruitment needs—a goalto enlist approximately 200,000 youth a year. Acursory investigation of the youth populationsuggests a sufficient number of youth fromwhich to recruit—nearly 4 million youth becomeage eligible each year. However, many of theyouth are not qualified for military service basedon moral, mental, and physical standards. And acloser inspection of youth demographiccharacteristics, which convey information aboutcareer plans and educational aspirations, suggestthat recruiting goals are formidable.
Overview
This chapter provides an overview ofdemographic characteristics and trends in theyouth population that are related to the recruitingchallenge. The first section, DemographicCharacteristics of the 1999 YATS RespondentPopulation, provides a description of the youthpopulation. The second section, PopulationTrends, gives additional detail on youthdemographics like education and employment,and shows how those characteristics arechanging in ways that affect the Services’ abilityto meet recruiting goals.
This chapter is related to subsequent chapters inthe report. Chapter 3 shows how propensityvaries among different population segments.Chapter 4 describes reasons for entering themilitary, and barriers to enlistment. Chapter 5describes youth awareness of the Services’recruiting advertising efforts. All three chaptersrelate to demographic considerations presentedin this chapter.
Demographic Characteristicsof the 1999 YATS RespondentPopulation
The YATS population is the pool of young menand women from which the military recruitsenlisted personnel and officers. In particular, it isthe population of young Americans, 16-24 yearsof age, who have never served in the military.This section describes the YATS population interms of several key demographics: gender, age,education, employment, and geographic location.The section also provides important YATSsurvey information and the number of youthactually interviewed with respect to gender, age,educational status, and race/ethnicity.
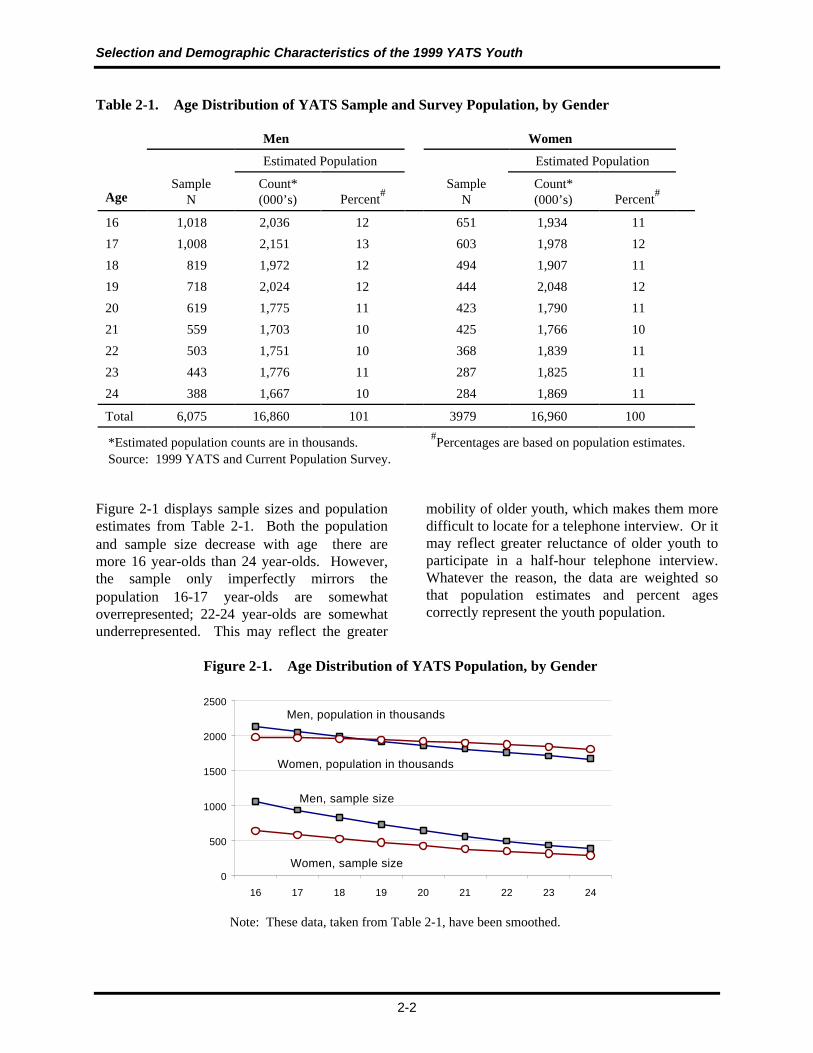
Gender and Age. In the 1999 YATSadministration, a total of 10,054 surveys werecompleted with 6,075 men and 3,979 women.Table 2-1 presents the unweighted as well as theweighted age distribution of YATS youth bygender. The unweighted numbers (labeled“Sample N”) are the actual number ofrespondents who completed the interview. Theweighted numbers (labeled “EstimatedPopulation”) show the number of youth in thepopulation. For example, 1,018 16-year-old mencompleted the YATS telephone interview. Thesemen represent 2,036,000 16-year-old men in theAmerican youth population who have neverserved in the military.
Selection and Demographic Characteristics of the 1999 YATS Youth
2-2
Table 2-1. Age Distribution of YATS Sample and Survey Population, by Gender
Men Women
Estimated Population Estimated Population
AgeSample
NCount*(000’s) Percent#
SampleN
Count*(000’s) Percent#
16 1,018 2,036 12 651 1,934 11
17 1,008 2,151 13 603 1,978 12
18 819 1,972 12 494 1,907 11
19 718 2,024 12 444 2,048 12
20 619 1,775 11 423 1,790 11
21 559 1,703 10 425 1,766 10
22 503 1,751 10 368 1,839 11
23 443 1,776 11 287 1,825 11
24 388 1,667 10 284 1,869 11
Total 6,075 16,860 101 3979 16,960 100
*Estimated population counts are in thousands. #Percentages are based on population estimates.Source: 1999 YATS and Current Population Survey.
Figure 2-1 displays sample sizes and populationestimates from Table 2-1. Both the populationand sample size decrease with agethere aremore 16 year-olds than 24 year-olds. However,the sample only imperfectly mirrors thepopulation16-17 year-olds are somewhatoverrepresented; 22-24 year-olds are somewhatunderrepresented. This may reflect the greater
mobility of older youth, which makes them moredifficult to locate for a telephone interview. Or itmay reflect greater reluctance of older youth toparticipate in a half-hour telephone interview.Whatever the reason, the data are weighted sothat population estimates and percent agescorrectly represent the youth population.
Figure 2-1. Age Distribution of YATS Population, by Gender
0
500
1000
1500
2000
2500
16 17 18 19 20 21 22 23 24
Men, population in thousands
Women, population in thousands
Men, sample size
Women, sample size
Note: These data, taken from Table 2-1, have been smoothed.

Chapter Two
2-3
School Status. Table 2-2 shows the number ofrespondents, estimated population, and percentof the population by current school status. Theschool status categories used in Table 2-2 aremutually exclusive and are defined as follows:
Students
• Younger high school students − youthcurrently enrolled in the 9th through 11thgrade of high school;
• High school seniors − youth currentlyenrolled in the 12th grade of high school;
• Postsecondary/Graduate students −students currently attending a college,university, or postsecondary business/vocational school;
Non-Students
• Non-completers − youth who are notenrolled in school and have not graduatedfrom high school;
• High school graduates − youth notcurrently enrolled who have graduatedhigh school but have not attended college;
• Some college − youth not currentlyenrolled who have attended some collegebut have not earned a bachelor’s or higherdegree; and
• College graduates − youth not currentlyenrolled who have earned a bachelor’sdegree.
As indicated in Table 2-2, educationalachievement is somewhat higher among youngwomen than young men: fewer drop out of highschool; more attend and graduate from college.
Table 2-2. School Status by Gender
Men Women
Estimated Population Estimated Population
Education StatusSample
NCount*(000’s) Percent#
SampleN
Count*(000’s) Percent#
Students
Younger H.S. students 1,285 2,704 16 696 2,179 13H.S. seniors 950 2,268 13 618 2,265 13Postsecondary 1,781 4,547 27 1,399 5,529 33
Non-Students
Non-completers 698 2,648 16 343 2,012 12H.S. graduates 818 3,014 18 481 2,819 17Some college 314 973 6 244 1,193 7College graduates 212 664 4 185 906 5
*Estimated population counts are in thousands. #Percentages are based on population estimates.Source: 1999 YATS.

Selection and Demographic Characteristics of the 1999 YATS Youth
2-4
Figure 2-2 displays various relationships betweenthe educational status categories. Double-headedarrows indicate transitions that can flow in twodirections. Thus, high school students can dropout of school, and high school dropouts (non-completers) can return to high school. Heavier
arrows indicate most common paths. Forexample, Figure 2.2 illustrates the fact that morehigh school seniors go immediately to college thanbecome high school graduate non-students.
Figure 2-2. Schematic of Education Status Categories
YoungerH.S. Students
H.S. Seniors
PostsecondaryStudents
NonCompleters
H.S.Graduates
SomeCollege
CollegeGraduates
Students Non-Students
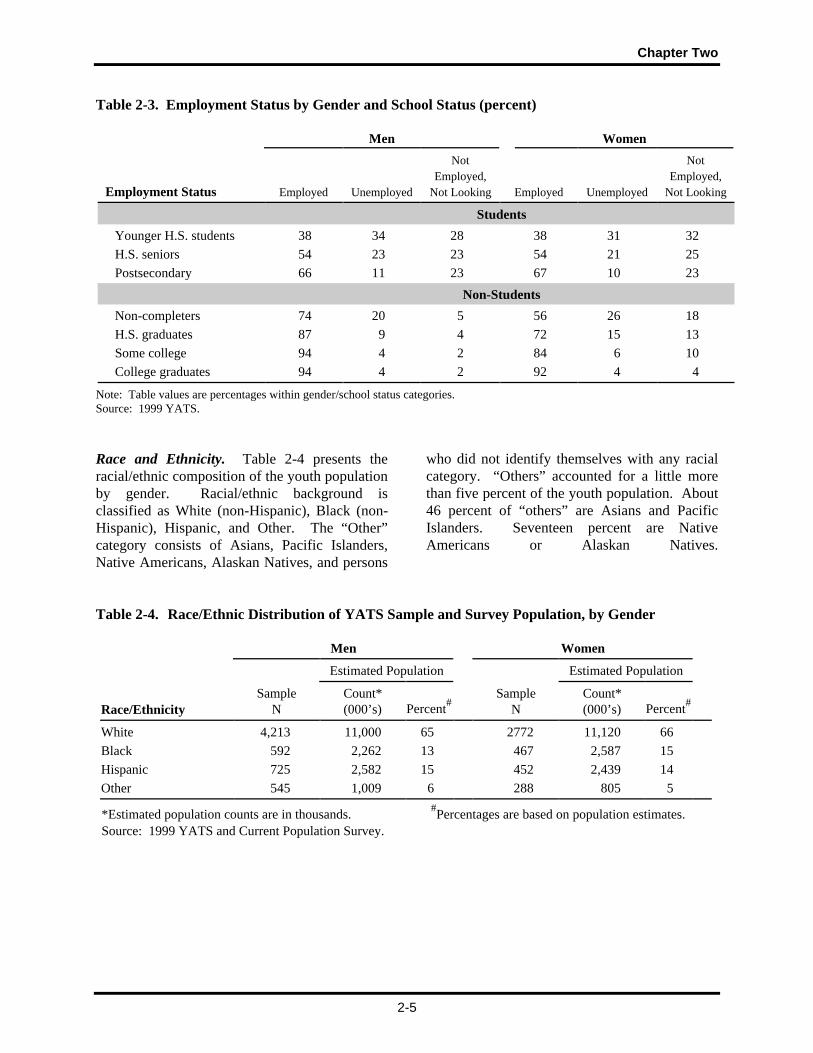
Employment. Table 2-3 shows employmentstatus of the 1999 YATS population, by genderand school status. The table values show thepercent of youth in each employment status. Forexample, 54 percent of high school senior malesare employed, 23 percent are unemployed (i.e.,they do not have a job but are looking for a job),and 23 percent are neither working nor seeking
work. It is noteworthy that among students, theemployment status of men and women is verysimilar. Among the non-students differencesbetween men and women are greater. Eighteenpercent of female high school dropouts are notworking and not seeking work, while only 5percent of male high school dropouts are notworking and not seeking work.
Chapter Two
2-5
Table 2-3. Employment Status by Gender and School Status (percent)
Men Women
Employment Status Employed Unemployed
NotEmployed,
Not Looking Employed Unemployed
NotEmployed,
Not Looking
Students
Younger H.S. students 38 34 28 38 31 32H.S. seniors 54 23 23 54 21 25Postsecondary 66 11 23 67 10 23
Non-Students
Non-completers 74 20 5 56 26 18H.S. graduates 87 9 4 72 15 13Some college 94 4 2 84 6 10College graduates 94 4 2 92 4 4
Note: Table values are percentages within gender/school status categories.Source: 1999 YATS.
Race and Ethnicity. Table 2-4 presents theracial/ethnic composition of the youth populationby gender. Racial/ethnic background isclassified as White (non-Hispanic), Black (non-Hispanic), Hispanic, and Other. The “Other”category consists of Asians, Pacific Islanders,Native Americans, Alaskan Natives, and persons
who did not identify themselves with any racialcategory. “Others” accounted for a little morethan five percent of the youth population. About46 percent of “others” are Asians and PacificIslanders. Seventeen percent are NativeAmericans or Alaskan Natives.
Table 2-4. Race/Ethnic Distribution of YATS Sample and Survey Population, by Gender
Men Women
Estimated Population Estimated Population
Race/EthnicitySample
NCount*(000’s) Percent#
SampleN
Count*(000’s) Percent#
White 4,213 11,000 65 2772 11,120 66Black 592 2,262 13 467 2,587 15Hispanic 725 2,582 15 452 2,439 14Other 545 1,009 6 288 805 5
*Estimated population counts are in thousands. #Percentages are based on population estimates.Source: 1999 YATS and Current Population Survey.
Selection and Demographic Characteristics of the 1999 YATS Youth
2-6
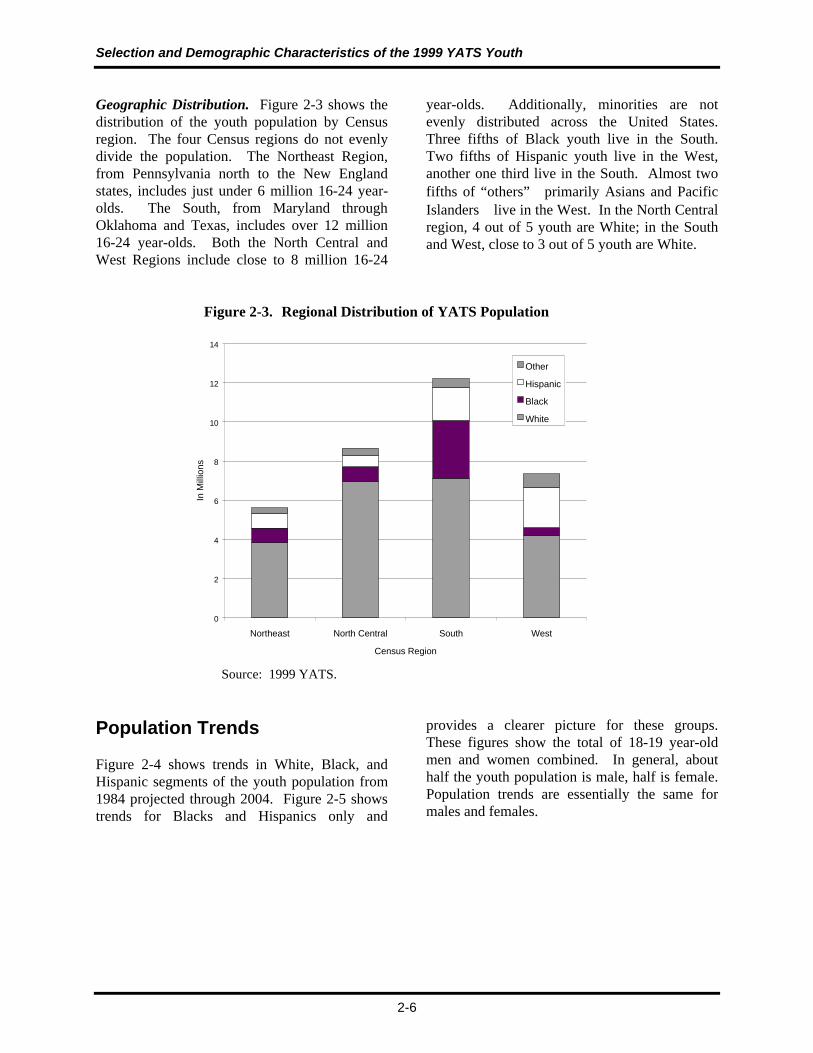
Geographic Distribution. Figure 2-3 shows thedistribution of the youth population by Censusregion. The four Census regions do not evenlydivide the population. The Northeast Region,from Pennsylvania north to the New Englandstates, includes just under 6 million 16-24 year-olds. The South, from Maryland throughOklahoma and Texas, includes over 12 million16-24 year-olds. Both the North Central andWest Regions include close to 8 million 16-24
year-olds. Additionally, minorities are notevenly distributed across the United States.Three fifths of Black youth live in the South.Two fifths of Hispanic youth live in the West,another one third live in the South. Almost twofifths of “others”primarily Asians and PacificIslanderslive in the West. In the North Centralregion, 4 out of 5 youth are White; in the Southand West, close to 3 out of 5 youth are White.
Figure 2-3. Regional Distribution of YATS Population
0
2
4
6
8
10
12
14
Northeast North Central South West
Census Region
In M
illio
ns
Other
Hispanic
Black
White
Source: 1999 YATS.
Population Trends
Figure 2-4 shows trends in White, Black, andHispanic segments of the youth population from1984 projected through 2004. Figure 2-5 showstrends for Blacks and Hispanics only and
provides a clearer picture for these groups.These figures show the total of 18-19 year-oldmen and women combined. In general, abouthalf the youth population is male, half is female.Population trends are essentially the same formales and females.

Chapter Two
2-7
Figure 2-4. Population Trends, 18-19 Year-Olds
0
1000
2000
3000
4000
5000
6000
7000
1984 1986 1988 1990 1992 1994 1996 1998 2000 2002 2004
(tho
usan
ds)
White
Black
Hispanic
Source: http://www.census.gov/population (Oct 1999); CurrentPopulation Reports, P25-1130.
The youth population is increasing. In 1994,there were approximately 6.6 million 18-19 year-olds in the population, in 2004, there will beabout 7.9 million 18-19 year-oldsan increaseof about 1.7 percent per year. Blacks willincrease from about 1 million in 1994 to about1.2 million in 2004 (also an increase of 1.7
percent per year); Hispanics will increase fromabout 934 thousand in 1994 to about 1.3 millionin 2004 (an increase of 3.2 percent per year).While the largest increase in the youthpopulation, in absolute numbers, will be amongWhites, the largest increase, as a percentage ofits current size, will be among Hispanics.
Figure 2-5. Population Trends, 18-19 Year-OldBlacks and Hispanics
0
200
400
600
800
1000
1200
1400
1984 1986 1988 1990 1992 1994 1996 1998 2000 2002 2004
(thou
sand
s)
Black
Hispanic
Source: http://www.census.gov/population (Oct 1999); CurrentPopulation Reports, P25-1130.

Selection and Demographic Characteristics of the 1999 YATS Youth
2-8
Table 2-5 shows educational achievement levelsamong different race and ethnic groups. Thepercent graduating from high school is shown forthose over the age of 19 because most highschool students have graduated by that age.Similarly, the percent of college graduates isshown for those over 23 years of age. To showrecent patterns of educational achievement, wehave excluded persons over 30 years of age.Differences in educational achievement amongrace and ethnic groups is significant: fewerBlacks and Hispanics graduate from high school,
or receive college degrees than Whites. AmongHispanics, educational achievement issignificantly lower for immigrants than U.S. bornHispanics. About one-half of enlistment-ageHispanics are immigrants. Although the figuresare not included in Table 2-5, we also examinedhigh school graduation rates among immigrantsand non-immigrants of other race/ethnic groups.Generally, the findings were similar (e.g., fewerimmigrant Whites graduate from high schoolthan native-born Whites).
Table 2-5. Educational Achievement by Race/Ethnic Group (percent)
High School GraduatesAmong 19-30 Year-Olds
College Graduates (BA/BS)Among 23-30 Year-Olds
Men Women Men WomenWhite 91 93 31 35Black 84 86 14 16Hispanic 58 64 7 10
Hispanic, U.S. born 76 76 11 13Hispanic, foreign born 44 53 5 8
Other 91 91 42 46
Note: “U.S. born” includes persons born in Puerto Rico or U.S. outlying areas, and all persons whoseparents are U.S. citizens.Source: Current Population Survey, September – November 1999.
Postsecondary Education Aspirations. Mostyouth aspire to go to college. The 1999 YATSresults show 82 percent of male high schoolseniors and 91 percent of female high schoolseniors planned to continue their education afterhigh school. Eighty-nine percent of those whoplan to continue hoped to get at least aBachelor’s degree. The motivation for higher
education is clear. Higher education meanshigher relative salaries. In 1997, adults 18 andolder holding a bachelor’s degree earned anaverage annual income of $40,478 compared to a$22,895 annual income earned by those withonly a high school diploma. Figure 2-6 showsthe median income for men and women, 25 yearsold and over, by educational achievement.

Chapter Two
2-9
Figure 2-6. Median Income, Men and Women 25 Years-Old and Over
0 10 20 30 40 50 60 70 80 90
Doctorate
Professional degree
Master's Degree
Bachelor's Degree
Associate's Degree
Some College, no degree
High School Graduate
9-12th Grade, no diploma
Annual Income ($ thousands)
Women
Men
Note: Graph based on the median annual income of year-round full-time workers25 years old and over (1997).Source: Digest of Education Statistics, 1997.
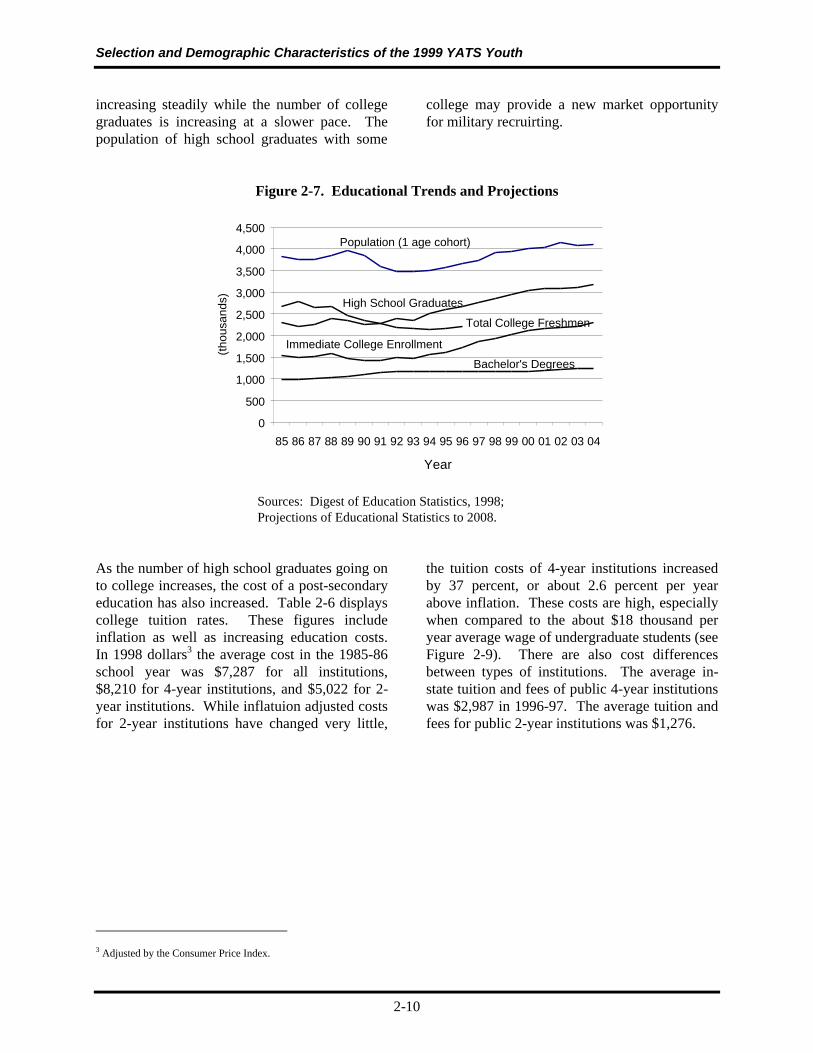
Figure 2-7 shows education trends andprojections. Between 1999 and 2004, the youthpopulation is expected to increase from 3.9million to over 4 million per age cohort (Day,Jennifer C., 1996). The number of high schoolgraduates will increase more or lessproportionally, from slightly under 3 million toover 3 million (Gerald, Debra E. and Hussar,William J., 1997). Less than half of high schoolgraduates are men (see Table 2-5). The percentof high school graduates who have enrolled incollege within a year of graduation (shown as“Immediate College Enrollment” in Figure 2-7)has been increasing gradually, from 58 percent in1985 to 67 percent in 1997 (Snyder, Thomas D.,Hoffman, Charlene M., and Gedees, Claire M.,1999). If this rate continues to increase, it wouldreach about 72 percent in 2005.1 In this case, thenumber of high school graduates not going on tocollege within a year will remain nearly constant
1 This is based on a simple linear projection of the 1985 through 1997
percent increase, projected to 2005.
at about 900 thousand per year. Becausewomen’s educational enrollment rates are greaterthan men’s, more than half of these will bewomen.
However, many youth who enroll in college donot do so within a year of graduating from highschool. Thus, the “Immediate CollegeEnrollment” shown in Figure 2-7 underestimatesthe percent of youth attending college. Thenumber of youth enrolling in college for the firsttime is shown in Figure 2-7 as “Total CollegeFreshmen” (Snyder, Thomas D.; Hoffman,Charlene M, and Gedees, Claire M., 1999).2
While the number of youth enrolling in collegewithin a year of high school graduation is abouttwo-thirds of the number of high schoolgraduates, first-time College Freshmen representabout 85 percent of the number of high schoolgraduates. These figures suggest that militaryrecruiting goals are formidable. However, the thenumber of youth completing some college is 2 The college freshmen in a particular year are drawn from multiple
preceding high school graduation classes. Thus, the fact that acollege freshman class in 1991 is as large as the high schoolgraduation classes does not imply that 100 percent of 1991 highschool graduation class went to enrolled in college.
Selection and Demographic Characteristics of the 1999 YATS Youth
2-10
increasing steadily while the number of collegegraduates is increasing at a slower pace. Thepopulation of high school graduates with some
college may provide a new market opportunityfor military recruirting.
Figure 2-7. Educational Trends and Projections
0
500
1,000
1,500
2,000
2,500
3,000
3,500
4,000
4,500
85 86 87 88 89 90 91 92 93 94 95 96 97 98 99 00 01 02 03 04
Year
(tho
usan
ds)
Population (1 age cohort)
High School Graduates
Total College Freshmen
Immediate College Enrollment
Bachelor's Degrees
Sources: Digest of Education Statistics, 1998;Projections of Educational Statistics to 2008.
As the number of high school graduates going onto college increases, the cost of a post-secondaryeducation has also increased. Table 2-6 displayscollege tuition rates. These figures includeinflation as well as increasing education costs.In 1998 dollars3 the average cost in the 1985-86school year was $7,287 for all institutions,$8,210 for 4-year institutions, and $5,022 for 2-year institutions. While inflatuion adjusted costsfor 2-year institutions have changed very little,
3 Adjusted by the Consumer Price Index.
the tuition costs of 4-year institutions increasedby 37 percent, or about 2.6 percent per yearabove inflation. These costs are high, especiallywhen compared to the about $18 thousand peryear average wage of undergraduate students (seeFigure 2-9). There are also cost differencesbetween types of institutions. The average in-state tuition and fees of public 4-year institutionswas $2,987 in 1996-97. The average tuition andfees for public 2-year institutions was $1,276.

Chapter Two
2-11
Table 2-6. Average Undergraduate Tuition, Fees, Room and Board Paidby Full-Time-Equivalent Students
AllInstitutions
4-YearInstitutions
2-YearInstitutions
1985-86 4,885 5,504 3,3671986-87 5,206 5,964 3,2951987-88 5,494 6,272 3,2631988-89 5,869 6,725 3,5731989-90 6,207 7,212 3,7051990-91 6,562 7,602 3,9301991-92 7,077 8,238 4,0921992-93 7,452 8,758 4,2071993-94 7,931 9,296 4,4491994-95 8,306 9,728 4,6331995-96 8,800 10,330 4,7251996-97 9,206 10,841 4,8951997-98 9,536 11,227 5,075
Source: Digest of Education Statistics, U.S. Department of Education, Office ofEducational Research and Improvement.
As postsecondary education costs rise, studentsrely on a variety of economic resources. In 1999,YATS respondents currently enrolled in theirfreshman or sophomore years reported sources oftheir educational funding. Table 2-7 shows thepercent of men and women affirming that each ofthese was a source of their college funding. Forexample, 68 percent of the men and
65 percent of the women affirmed that theyreceived money from parents or relatives tosupport their education. They were also asked toidentify the greatest source of funding.4 Table2.7 also includes these data.
4 If they had mentioned only one source, it was assumed to be the
greatest source of funding. Of the 1,700 college freshmen andsophomores we interviewed, slightly more than 100 mentionedonly their parents as a source of funding and slightly more than100 mentioned only their own money.

Selection and Demographic Characteristics of the 1999 YATS Youth
2-12
Table 2-7. Sources of College Funding, by Gender (percent)
Men Women
Source Greatest Some Funding Greatest Some Funding
Parents/relatives 39 68 38 65Student loans 14 41 17 44Own money 24 81 16 75Grants 10 39 12 40Academic scholarships 8 34 12 39Athletic scholarships 3 11 1 5
Source: 1999 YATS.
5The data reveal some differences among White,Black, and Hispanic men and women.
• Whites were more likely than minoritiesto identify their parents as a source offunds.
• Minorities were more likely to mentiongrants as a source of funds—Blacks morethan Hispanics.
• Hispanic men were more likely tomention athletic scholarships.
5 The number of minority men and women included in this sample
was smallranging from 50 Black men to 80 Hispanic men.Such small sample sizes mean that estimates are imprecise ± 10percentage points. This confidence interval was computed usingthe standard formula 1.96 npq / .
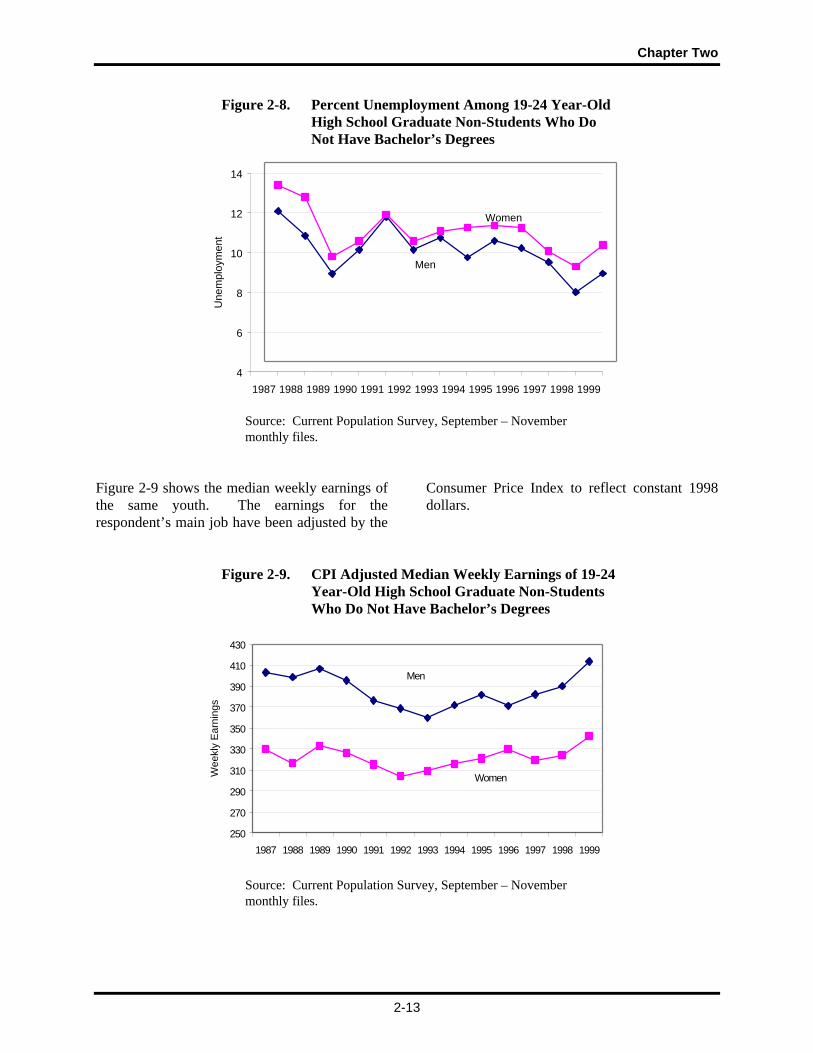
Employment Trends. Generally, youth leavinghigh school face three choices: college, civilianemployment, and military service. Most youthwant to go to college (see previous discussion).The current economy also provides ampleemployment options for youth pursuing collegeas well as those who have stopped pursuing theireducation. Figure 2-8 shows that unemploymentamong high school graduates who are notstudents and have not earned a Bachelor’s degreehas declined significantally since 1995, althoughit rose slightly in 1999.
Chapter Two
2-13
Figure 2-8. Percent Unemployment Among 19-24 Year-OldHigh School Graduate Non-Students Who DoNot Have Bachelor’s Degrees
4
6
8
10
12
14
1987 1988 1989 1990 1991 1992 1993 1994 1995 1996 1997 1998 1999
Une
mpl
oym
ent
Women
Men
Source: Current Population Survey, September – Novembermonthly files.
Figure 2-9 shows the median weekly earnings ofthe same youth. The earnings for therespondent’s main job have been adjusted by the
Consumer Price Index to reflect constant 1998dollars.
Figure 2-9. CPI Adjusted Median Weekly Earnings of 19-24Year-Old High School Graduate Non-StudentsWho Do Not Have Bachelor’s Degrees
250
270
290
310
330
350
370
390
410
430
1987 1988 1989 1990 1991 1992 1993 1994 1995 1996 1997 1998 1999
Wee
kly
Ear
ning
s
Men
Women
Source: Current Population Survey, September – Novembermonthly files.

Selection and Demographic Characteristics of the 1999 YATS Youth
2-14
The Declining Number of Veterans. Anotherimportant factor in the dwindling pool of militaryrecruits is that there are fewer fathers of youngadults who have served in the military than in thepast. At the end of the Cold War, we estimatethat over 40 percent of fathers of 18 year-oldshad served in the U.S. Armed Forces. In 1998,only 26 percent had fathers who were veterans.By 2005, we expect only 16 percent ofenlistment-eligible youth will have parents whohave been in the military (Figure 2-10 andAppendix B). Studies by individual Services,
including the Air Force and Navy, have foundthat the majority of fathers of new recruits areveterans. This suggests that sons of veterans aremore likely to enlist than sons of non-veterans.Research studies also demonstrate theimportance of the declining veteran populationfor recruiting. The decrease of parents whoserved in the military and increase of parentswho went to college has undoubtedly contributedto today’s recruiting challenges.
Figure 2-10. Percent of Veteran Fathers of YATS AgeRespondents
0
10
20
30
40
50
60
1984 1987 1990 1995 1998 2001 2004
Per
cen
t
Source: Current Population Survey, October 1990

Chapter Two
2-15
Summary
The population of youth from which theArmed Services must recruit enlisted personnelis varied and growing. The population wasdescribed in terms of demographicvariablesgender, age, school status,employment, race/ethnicity, and geographicregion. These variables are intercorrelated:educational achievement obviously varies by age,as well as race/ethnicity and, more subtly, bygender. The race/ethnic composition of thepopulation varies from one geographic region toanother. The next chapter will show that thesevariables are all related to propensity for militaryservice.
Secondary and postsecondary education isa driving force among emerging youth. Mostyouth aspire to achieve at least a Bachelor’sdegree. About 85 percent of high schoolgraduates enroll in college, about 65 percentwithin a year of high school graduation.However, the number of Bachelor’s degreesawarded each year is only about 40 percent of thenumber of high school graduates each year.While the number of high school graduates andthe number of youth completing some collegeclasses is increasing steadily, the number ofcollege graduates is increasing at a much slowerrate.
Employment options for youth who havecompleted high school but not completed collegehave improved in the past few years,. For theseyoung men, unemployment has dropped fromabout 10 percent in 1995 to about 8.5 percent in1999. In constant dollars, weekly earnings arealso increasing for these young men.
Finally, we note that the percent of youthwhose parents were in the military is decreasing.We expect the percent of enlistment-eligibleyouth who have parents who have been in themilitary to decrease—from 26 percent in 1998 toa projected 16 percent in 2005.
Overall, demographic and economic trendssuggest the Services will have difficulty meetingrecruiting goals. In particular, it will beincreasingly difficult to meet enlistment goalswithout drawing either from the pool of non-highschool graduates or the pool of those who havecompleted some college.


3-1
3. ENLISTMENT PROPENSITY FOR MILITARY SERVICE
Introduction
YATS is best known for the information itprovides on youth propensity for service in theArmed Forces. This chapter presents currentinformation on American youth’s propensity formilitary service. Throughout this chapter, wereference different propensity measures. For allmeasures, “propensity” is the percent of youthindicating military service is a likely event in theirfuture; moreover, “propensity” always refers to aresponse to a survey question, or to severalquestions.
Overview
The chapter is divided into five sections.
• The first section describes the PropensityMeasures for active military service andservice in the Reserves that are includedin the YATS. It describes researchshowing that these measures arecorrelated with enlistment behavior. Italso describes qualitative research thatprovides some insights into thecircumstances and thought processes thatdrive youth survey responses. Theseinsights are helpful in interpretingpropensity statistics.
• The second section identifies PropensityRelated Factors , such as gender, age,and race/ethnicity. This section providesinformation about these relationships.
• The third section describes Propensityfor Specific Services. This sectionshows how propensity for differentServices overlaps (youth expresspropensity for multiple Services) and howpropensity for active duty correlates withpropensity for the Reserves.Demographic differences in Service-specific propensity are noted.
• The fourth section describes Trends inPropensity, showing how propensity haschanged in the transition from the militarythat confronted Communist forces throughthe Cold War to the reduced military ofthe post Cold War era. This sectiondisplays distinct trends for aided andunaided propensity, for Service-specificpropensity, and for race/ethnic groups.
• A Summary section concludes thechapter.
This chapter is related to the other chapters in thisreport. This chapter shows how many of thedemographic variables presented in Chapter 2 arerelated to propensity for military service. Whilethis chapter describes propensity for militaryservice, Chapter 4 provides insight into reasonsfor entering military service and barriers tomilitary service. Chapter 5 describes recruitingadvertising, and shows its relationship todemographic considerations and other recruitingefforts.
Propensity Measures
The questions measuring youth propensity haveremained unchanged since the first YATS surveywas conducted in 1975. Prior to any mention ofmilitary service by the YATS interviewer,respondents are asked about their future plans:
“Now let’s talk about your plans(after you get out of high school/forthe next few years). What do youthink you might be doing?”
Common responses include going to school,working, and entering the military. Respondentsare encouraged to indicate all of the things theymight be doing, and those who mention militaryservice in general, or one of the Servicesspecifically, are counted as having provided an“unaided mention” of military service“unaided” because the topic of military service is

Enlistment Propensity for Military Service
3-2
first mentioned by the respondent, not theinterviewer. “Unaided propensity” is the percentof respondents providing an unaided mention offuture military service. After the discussion offuture plans, each respondent is asked:
How likely is it that you will beserving on active duty in the [Army,Navy, Marine Corps, Air Force,Coast Guard]?
The question is asked for each Service. Theorder of the questions changes from onerespondent to the next to eliminate any ordereffect. Those who say they will “definitely” or“probably” be serving on active duty are countedas having propensity for the Service named.Propensity for a specific Service is reported asthe percent of respondents who indicatepropensity for that Service. “Active compositepropensity” is the percentage who indicate apropensity for one or more of the four activeDoD Services1Army, Navy, Marine Corps, andAir Force. YATS also includes questions similarto that above, asking about service in theReserves and National Guard.
How likely is it that you will beserving in the [Reserves, NationalGuard]?
Since 1990, these questions have followedquestions about active duty. Half therespondents, randomly selected, are asked firstabout service in the Reserves, then are askedabout service in the National Guard. The otherhalf of respondents are asked about service in theNational Guard first. “Reserve compositepropensity” is the percentage who indicate theywill “definitely” or “probably” serve in either inthe Reserves or National Guard.
Research shows that YATS propensity measuresare valid measures of enlistment behavior. Arecent RAND study (Orvis, Sastry & McDonald,
1 Except in wartime, the Coast Guard is part of the Departmentof Transportation.
1996) shows that high-quality youth2 providing anunaided mention of plans to enlist are seven timesmore likely to enlist than those who say they will“probably not” or “definitely not” serve. Thosewho, in response to a direct question about themilitary, say they will “definitely” or “probably”serve are three times more likely to enlist thanthose who say they will “probably not” or“definitely not” serve. This study is not unique.RAND found substantially the same relationshipsin previous studies (Orvis, Gahart, & Ludwig,1992). Brice Stone et al. found similar results in a1993 study (Stone, Turner, & Wiggins, 1993).The empirical predictive validity of YATSpropensity as a measure of enlistment behaviorhas been shown repeatedly over the past 15years.
The empirical validity of propensitynotwithstanding, some discussion of the nature ofwhat YATS measures is merited. In generalEnglish usage, propensity might be defined as anatural inclination or predisposition to dosomething. An analysis by Orvis (1992) suggeststhat these measures capture an “underlyingattitudinal or taste-for-service dimension.” Thus,they have a propensity for military service.
Youth who think they will probably not serve inthe military do not necessarily have apredisposition against military service, however.To help us understand factors influencing youth’spropensity responses, we recently conducted in-depth interviews with over 200 young men andwomen (Berkowitz et al., 1997, Berkowitz, et al.,1999). These differed from the normal YATSinterviews in the level of structure of theinterview. In the normal YATS interviews,interviewers are required to read each questionverbatim, and responses are tabulated in accordwith specific instructions. In the in-depthinterviews, the interviewers conductedconversations with youth about a prescribedrange of topics dealing with career decisions and
2 High school students and high school graduates whose AFQTscore is projected to be in the top half of the population.

Chapter Three
3-3
attitudes toward military service. Thus, thedetailed qualitative data from the in-depthinterviews provide greater understanding of thefactors affecting youth responses to propensityquestions. The following examples from theseinterviews show the variety of circumstancesaffecting youth’s propensity for military service.
• Alfred3 has known since he was 13 thathe wanted to join the Army. His life planis modeled after his father. He expects totake Army ROTC in college, graduate asa commissioned officer, retire from themilitary, and get a civilian job where he“won’t have to wear a suit.”
• Bob turned down a college footballscholarship because he thought he coulddo better. He recently lost a part-time jobas a server and busboy, and does not seecollege as an option. He expects to enlist.
• David grew up in a family with constantworries about making ends meet. Hedropped out of college after a verymarginal freshman year. His friends incollege also got caught up in partying anddropped out even sooner. He plans toenlist in the Navy for 4 years, and use thisexperience to develop better discipline andsave money for college.
• Frank has only recently learned that hehas been awarded full footballscholarships to several 4-year universities.Before receiving notification, he wasseriously considering enlisting as a way ofpaying for college. At that time, he wasconcerned that a shoulder injury sustainedduring his senior year of high school mightkeep him from getting offers.
• Harry, a high school senior, is waiting tohear about the outcome of his applicationsfor financial aid and scholarships forcollege. “If I don’t got the money to payor the student aid scholarships, I’ll just
3 The bulleted stories are true; the names are fictitious.
have to go into the militarybecause theyhave that G.I. Bill stuff.”
• Ike’s position varies: “I can be sure oneday and the next don’t know.” He feelshis parents say the choice is up to himbecause they do not want to get blamed ifhe “messes up.”
• John’s father dropped out of college andjoined the Marines to “straighten himselfout.” The father feels strongly his sonshould not have to do the same.
• Kevin, soon to graduate from college,considers the military bureaucraticallyhidebound, rewarding obedience andconformity, and sees himself as thrivingbest in milieu that encourage individualinitiative and risk-taking.
• Larry opposes military service on moraland religious grounds.
• Neal’s commute from the Bronx toQueens to work is about as far from homeas he wants to go.
These stories, and others like them, help interpretour propensity statistics. Generally, responses areconsistent with the wording of the propensityquestions: they reflect the respondent’s currentappraisal of the “probability” of entering militaryservice. “Taste” for military service clearly playsa role (consider Alfred, Kevin, Larry, and Neal).Current circumstances, which might changerather quickly, also affect the likelihood that ayouth will choose to enter the military (considerBob, David, Frank, and Harry).4
4 The in-depth interviews provided insight into the changeable
nature of propensity, but the phenomenon is not new. Youthin Transition (Bachman, 1979), which evaluated propensityof the same individuals at multiple points in their high schoolcareer, found that most youth who said they were likely toenter military service one year had revised their assessmentthe following year. RAND (Orvis, 1996), finds that half ofthe YATS respondents enlisting had previously indicated theywould “probably not” or “definitely not” enter militaryservice, indicating clearly that many youth reconsider theirpropensity for military service.
Enlistment Propensity for Military Service
3-4
The changeable nature of each individual’s plansdoes not lessen the significance of propensity as ameasure of interest in military service. Theunemployment status of each individual in thelabor force can change from one day to the next.Nonetheless, the unemployment rate is a valuablemeasure of the economy. The propensity of eachyouth may change with changing circumstances.Still, propensitythe percentage of youth at aparticular point in time who feel they will“definitely” or “probably” enter themilitaryprovides a useful measure of thedifficulty the Services will encounter in meetingrecruiting goals.
Finally, we should note that, while we tend tothink of these YATS questions as a measure ofenlistment propensity, our in-depth interviewsremind us that some youth’s plans includeentering one of the Service Academies, or takingROTC in college. Alfred’s story is a case inpoint.
Propensity-Related Factors
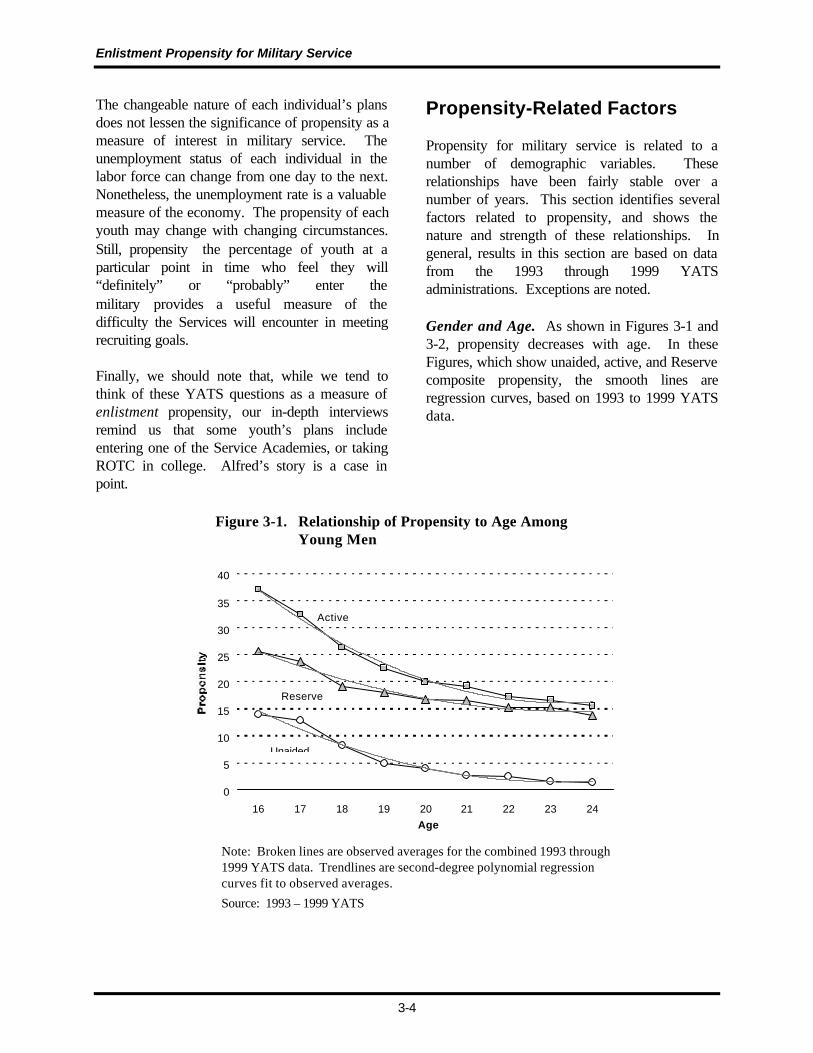
Propensity for military service is related to anumber of demographic variables. Theserelationships have been fairly stable over anumber of years. This section identifies severalfactors related to propensity, and shows thenature and strength of these relationships. Ingeneral, results in this section are based on datafrom the 1993 through 1999 YATSadministrations. Exceptions are noted.
Gender and Age. As shown in Figures 3-1 and3-2, propensity decreases with age. In theseFigures, which show unaided, active, and Reservecomposite propensity, the smooth lines areregression curves, based on 1993 to 1999 YATSdata.
Figure 3-1. Relationship of Propensity to Age AmongYoung Men
0
5
10
15
20
25
30
35
40
16 17 18 19 20 21 22 23 24Age
Active
Reserve
Unaided
Note: Broken lines are observed averages for the combined 1993 through1999 YATS data. Trendlines are second-degree polynomial regressioncurves fit to observed averages.
Source: 1993 – 1999 YATS
Chapter Three
3-5
Figure 3-2. Relationship of Propensity to Age AmongYoung Women
0
5
10
15
20
25
16 17 18 19 20 21 22 23 24Age
Active
Reserve
Unaided
Note: Broken lines are observed averages for the combined 1993 through1999 YATS data. Trendlines are second-degree polynomial regressioncurves fit to observed averages.
Source: 1993 – 1999 YATS
As Figures 3-1 and 3-2 show, propensity declinesrather dramatically with age: the propensity of16-17 year-olds is two or three times greater thanthe propensity of youth over 20. The figures alsoshow that, among the youngest men and women,propensity for active service is higher than forservice in the Reserve or National Guard units.The difference, however, decreases with age, and21-24 year-olds have approximately the samepropensity for Reserve as for active service. It isalso clear that young men have considerablygreater propensity for military service than youngwomen. In-depth interviews with women(Berkowitz et al., 1999) suggest that many youngwomen place a high value on maintaining closerelationships with their family and with closefriends, and are more reluctant than young men tobreak these ties by joining the military. Thestrength of family ties, and their impact onpropensity for military service is shown in thenext chapter as one of the reasons offered for not
entering military service. The in-depth interviewsalso suggested many women place a high valueon careers that help people (many are particularlyinterested in health care). Thus, there arereasons to expect that fewer women than menwill be interested in military service.
Scholastic Status. Propensity also varies byscholastic status. In general, persons with higherlevels of educational achievement are less likelyto indicate a propensity for military service. Itshould be noted that, among high school students,propensity for active service is somewhat higherthan for Reserve/Guard service. Among collegestudents and high school graduates, thedifferences are in the same direction but muchsmaller. In many cases, approximately equalnumbers of these youth express propensity foractive as for Reserve service.

Enlistment Propensity for Military Service
3-6
Table 3-1. Propensity by Education, Gender
Men Women
Education LevelUnaided
Propensity
ActiveCompositePropensity
ReserveCompositePropensity
UnaidedPropensity
ActiveCompositePropensity
ReserveCompositePropensity
Students
H.S. Juniors 14 37 25 6 19 14
H.S. Seniors 12 30 22 5 16 12
Postsecondary Vo-Tech 3 17 15 0 7 7
2-Year College 2 16 15 1 7 7
4-Yr College
Freshmen 2 12 12 0 6 6
Sophomores 1 10 9 0 4 5
Juniors 1 9 9 0 5 4
Seniors 2 8 6 0 3 2
Graduate Students 1 7 6 0 2 1
Non-Students
H.S. Dropouts 5 31 25 1 12 10
H.S. Grads (no college) 4 19 16 1 8 7
Some College (not BS) 1 11 11 0 6 6
College Grads (BS +) 1 5 4 0 2 1
Source: 1993 – 1999 YATS
Educational Prospects. Historical YATS dataalso show that propensity varies, not only byone’s educational achievements or status, but alsoas a function of one’s educational prospects.5
Figure 3-3 illustrates the relationship between
5 In the 1991, 1992, and 1993 YATS administrations, half of
the respondents had been interviewed previously. Thus, wewere able to identify which of the high school seniorsinterviewed in a particular year were, in fact, full time collegestudents the following year. Furthermore, we were able toidentify factors that were predictive of college attendance,and to predict with modest accuracy the probability that aparticular respondent would, in fact, be a full-time collegestudent the year after he or she was a high school senior.The predictive factors: the highest math course taken inhigh school (first year algebra through calculus), whether theytook business math, whether they said they planned to go tocollege full time, whether they had taken college entranceexaminations, high school grades, whether their mother hadgone to college, and whether, as a high school senior theywere 17 years old (some are 18).
propensity for military service and the likelihoodof attending college. Among school seniors whoare very unlikely to go to college, about 40percent of the males and 25 percent of thefemales indicate a propensity for military service.Propensity is around 10 percent for both male andfemale high school seniors who are most likely toattend college a year after high school graduation.Thus, it appears that propensity is inverselyrelated to one’s educational prospects, as well asone’s educational status.
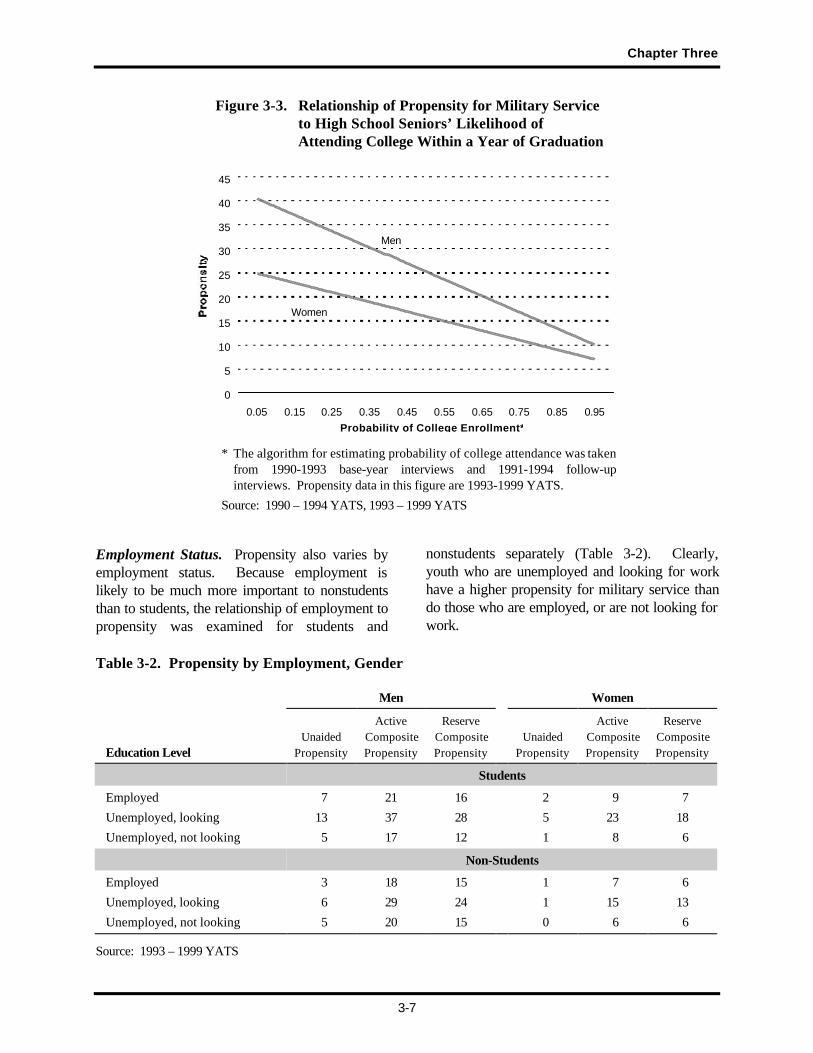
Chapter Three
3-7
Figure 3-3. Relationship of Propensity for Military Serviceto High School Seniors’ Likelihood ofAttending College Within a Year of Graduation
0
5
10
15
20
25
30
35
40
45
0.05 0.15 0.25 0.35 0.45 0.55 0.65 0.75 0.85 0.95Probability of College Enrollment*
Men
Women
* The algorithm for estimating probability of college attendance was takenfrom 1990-1993 base-year interviews and 1991-1994 follow-upinterviews. Propensity data in this figure are 1993-1999 YATS.
Source: 1990 – 1994 YATS, 1993 – 1999 YATS
Employment Status. Propensity also varies byemployment status. Because employment islikely to be much more important to nonstudentsthan to students, the relationship of employment topropensity was examined for students and
nonstudents separately (Table 3-2). Clearly,youth who are unemployed and looking for workhave a higher propensity for military service thando those who are employed, or are not looking forwork.
Table 3-2. Propensity by Employment, Gender
Men Women
Education LevelUnaided
Propensity
ActiveCompositePropensity
ReserveCompositePropensity
UnaidedPropensity
ActiveCompositePropensity
ReserveCompositePropensity
Students
Employed 7 21 16 2 9 7
Unemployed, looking 13 37 28 5 23 18
Unemployed, not looking 5 17 12 1 8 6
Non-Students
Employed 3 18 15 1 7 6
Unemployed, looking 6 29 24 1 15 13
Unemployed, not looking 5 20 15 0 6 6
Source: 1993 – 1999 YATS

Enlistment Propensity for Military Service
3-8
Employment Prospects. Propensity depends onemployment prospects as well as employmentstatus. YATS provides two measures ofperceived employment prospects: anticipatedcivilian earnings compared to military service, andperceived difficulty in finding a job. To evaluateperceived earnings, nonstudents are askedwhether, over the next few years, they would
expect to earn more in the military or in a civilianjob. Students are asked a similar question:whether they would make more in a military or acivilian job after they finish their education. AsTable 3-3 shows, propensity is considerablyhigher among those who would expect to earnmore in the military than in a civilian job.
Table 3-3. Propensity by Income Prospects in Military vs. Civilian Jobs
Men Women
Expected relative earningsin military vs. civilianemployment
UnaidedPropensity
ActiveCompositePropensity
ReserveCompositePropensity
UnaidedPropensity
ActiveCompositePropensity
ReserveCompositePropensity
More in military job 16 45 33 5 21 16Military/civilian same 7 22 17 1 10 8More in civilian job 2 13 11 1 5 4
Source: 1995 – 1999 YATS
YATS also asks youth how difficult it is go get ajob in their community. As Table 3-4 shows,
propensity increases with the perceived difficultyin obtaining a civilian job in their community.
Table 3-4. Propensity by Perceived Difficulty in Getting a Civilian Job
Men Women
Perceived difficultyin getting a job
UnaidedPropensity
ActiveCompositePropensity
ReserveCompositePropensity
UnaidedPropensity
ActiveCompositePropensity
ReserveCompositePropensity
Almost impossible 10 35 26 3 14 11Very difficult 8 26 21 3 14 11Somewhat difficult 6 22 17 2 9 8Not difficult 4 17 14 1 8 6
Source: 1995 – 1999 YATS
Race/Ethnicity. Since 1992, propensity amongHispanics males has been higher than amongBlack males, and Black male propensity has beenhigher than White male propensity (Table 3-5).The propensity of other minority populations(Asians, Pacific Islanders, American Indians,Eskimos and Aleutian Natives) is also higher thanthat of Whites.
Propensity for Hispanic and Black females issimilar and both are higher than the propensity formilitary service expressed by White females.Other female minority populations also expresshigher propensity for military service than doWhite females.

Chapter Three
3-9
Table 3-5. Propensity by Race/Ethnicity
Men Women
Race/EthnicityUnaided
Propensity
ActiveCompositePropensity
ReserveCompositePropensity
UnaidedPropensity
ActiveCompositePropensity
ReserveCompositePropensity
Total PopulationWhite 5 16 12 1 6 4Black 8 30 26 4 19 17Hispanic 8 39 29 2 19 15Asian 4 26 22 0 13 12American Indian 7 28 20 3 13 10
High School SeniorsWhite 10 24 17 2 10 7Black 14 36 30 11 28 21Hispanic 16 44 32 5 24 17
High School GraduatesWhite 1 7 6 0 2 2Black 2 18 18 1 11 11Hispanic 2 21 19 0 11 9
Source: 1993 – 1999 YATS
As noted earlier, educational achievement isrelated to both race/ethnicity (Chapter 2) andpropensity (Table 3-1). As Table 3-5 shows,educational achievement alone does not explaindifferences in propensity between Whites andminorities. The propensity of White high schoolseniors and White high school graduates whohave not gone on to college is considerably lowerthan that of Blacks and Hispanics6 with the samelevel of educational achievement.
Parents’ Education. In the in-depth interviews,we sought, among other things, to betterunderstand factors affecting career decision-making in general, and consideration of militaryservice specifically. These interviews suggested
6 Separate estimates for Asians, Pacific Islanders, American
Indians and Eskimos who were high school seniors or highschool graduates were not included because of sample sizerestrictions (they represent significantly smaller portions ofthe population, and of the YATS sample, than Blacks orHispanics).
that children of educated, affluent parents wereunlikely to seriously consider military serviceor,at least, they did not consider enlisting. Surveyinformation from enlisted personnel7 show limitedsupport for this finding.
In Fiscal Year 1997, 17 percent of arepresentative sample of active duty enlistedrecruits reported their mother had not completedhigh school, while 19 percent said their motherhad graduated from college. Comparable figuresfor the civilian population were 15 percent and 21percent.8
7 The Survey of Recruit Socioeconomic Backgrounds collected
information from a representative sample of about 20,000new recruits annually.
8 These figures are reported in Population Representation inthe Military Services (FY 1997, page 7-6). Data on militaryrecruits is taken from the on-going survey of recruitsocioeconomic backgrounds and is based on approximately15,000 active-duty recruits. Civilian comparisons are drawnfrom the Current Population Survey.

Enlistment Propensity for Military Service
3-10
As Table 3-6 shows, high school juniors andseniors whose mothers who have graduated fromcollege have a lower propensity than do thosewhose mothers have not. In addition, thosewhose mothers who have graduated from highschool have a lower propensity than those whose
mothers have not. The difference in propensity,however, between children of high schoolgraduates who have completed some collegecourses (but not graduated) and sons of motherswho have only completed high school is quitesmall.
Table 3-6. Propensity of High School Juniors and Seniors by Mother’s Education
Men Women
Mother’s EducationUnaided
Propensity
ActiveCompositePropensity
ReserveCompositePropensity
UnaidedPropensity
ActiveCompositePropensity
ReserveCompositePropensity
Less than H.S. Grad 19 50 33 8 27 21H. S. Grad 14 35 23 6 19 14Some College 13 33 25 4 16 11College Graduate 10 23 18 3 11 8
Source: 1993 – 1999 YATS
Marital Status. The relationship of marriage topropensity for military service is complex.Marital status, like propensity, varies with age andeducation: younger men and women are lesslikely to be married, and nonstudents are morelikely to be married than students. Among highschool grads, single men and women aresignificantly more likely to express propensity formilitary service than are their marriedcounterparts. The propensity of single men is10% higher than that of married men. As onemight expect, marriage has a more dramaticnegative effect on the propensity of women.
Influencers with Military Experience.Information from different sources suggests thatveterans and current military members have apositive influence on enlistment. Many YATSrespondents point to contact with persons whoare or have been in the military as a basis forchanging interest in military service (see Chapter4). A Navy study (Schmitz & Boyer, 1996)found that enlistment rates are correlated withmilitary/veteran populationyouth from countieswith high military/veteran populations are morelikely to enlist than those from counties with fewveterans or military personnel. In recent years,
we have asked YATS respondents whether theirparents and close relatives have been in themilitary, or whether they have friends their sameage with military experience.
Having friends with military experience is relatedto age. Sixteen year-olds will have few friendswith military experience, because most of theirfriends will be too young to have been in themilitary. Older youth are more likely to havefriends with military experience but, for a varietyof reasons, will have lower propensity for militaryexperience. Thus, evaluating the relationship ofpropensity to having friends in the military issomewhat complicated.
Examination of the 1995–1999 YATS datashowed the relationship we expected among malehigh school seniors. One-third of male highschool seniors whose fathers had been in themilitary expressed propensity for military service,compared to 27 percent among those saying theirfathers had not been in the military. Propensitywas 32 percent among male high school seniorssaying they had friends with military experience,compared to 28 percent among those saying noneof their friends had

Chapter Three
3-11
been in the military. Among female high schoolseniors and all graduates, however, we found nostatistically significant differences in propensitybetween those whose friends had been in themilitary and those whose friends had not served.
Geographic Region. Propensity for militaryservice varies somewhat by geographic region.Over the past several years, propensity formilitary service has been relatively high in the
South and West, and relatively low in theNortheast and North Central regions, as shown inTable 3-7. These statistics appear partly to bethe result of the geographic distribution ofminorities. Examination of propensity amongWhites shows only relatively small regionaldifferences, suggesting that regional differencesare, to a large extent, a function of minoritypopulations.
Table 3-7. Propensity by Geographic Region
Men Women
Census RegionUnaided
Propensity
ActiveCompositePropensity
ReserveCompositePropensity
UnaidedPropensity
ActiveCompositePropensity
ReserveCompositePropensity
All Race/Ethnic GroupsNortheast 5 21 17 2 12 9North Central 5 17 13 2 8 7South 7 24 19 3 14 12West 6 24 18 3 14 9
Whites OnlyNortheast 5 16 13 2 8 6North Central 5 14 11 1 6 5South 5 18 14 2 7 5West 5 17 12 2 9 6
Source: 1993 – 1999 YATS
Gender Differences. Clearly, from thepreceding discussion, fewer women than men areinterested in military service. In any particularcategory (e.g., H.S. seniors & Hispanics), thepropensity of women was lower than that of men.In general, the differences are proportional:review of Table 3-1, for example, shows that thecomposite and unaided propensity of women isgenerally about half that of men. However,women’s propensity is not uniformly half that ofmen. Some salient exceptions include:
• Active composite propensity of femalehigh school dropouts is almost one thirdthat of comparable males (Table 3-1).
• The active composite propensity formarried women is one third that ofmarried men.
• Gender differences in propensity are notconsistent across different race/ethnicbackgrounds. Black women’s propensityis disproportionately high, relative to thatof Black men, while White women’spropensity is relatively low whencompared to that of White men. (Table 3-5).

Enlistment Propensity for Military Service
3-12
Propensity for SpecificServices
As mentioned earlier, YATS respondents areasked the likelihood of their serving on active dutyin each of the Armed Servicesthe Army, Navy,Marine Corps, Air Force, and Coast Guard. Theyare asked about each of these Services, in turn,though the order in which they are asked israndomized so that no Service is consistentlymentioned first (or last).9
Historically, propensity has been most closelymonitored for 16-21 year-olds with no more than2 years of postsecondary education.10 Prior to1990, youth who had completed more than twoyears of postsecondary education, or had enrolledfor their third year, were not interviewed. Also,prior to 1990, residents of Alaska and Hawaiiwere not interviewed (their exclusion has virtuallyno impact on propensity estimates). Theselimitations are appropriate for evaluating theenlistment potential of the youth marketonlyabout 1 in 5 enlisted accessions is over 21 yearsold, and few have completed any collegecourses.11 To assure continuity with YATSstatistics from earlier years, the statisticspresented in this section are limited to thepopulation included in YATS prior to 1990.
9 The sequence of questions in the interview schedule is: CoastGuard, Army, Air Force, Marine Corps, and Navy. A startingpoint is randomly selected, and respondents are asked thelikelihood of serving in each Service, in the order given. Forexample, if Air Force is randomly selected as a startingpoint, the respondent is asked about the Air Force, MarineCorps, Navy, Coast Guard, and Army, in that order.
10 Youth who have completed two years and enrolled for athird year are excluded; those who have completed two years,but not enrolled for a third year are included.
11 Population Representation in the Military Services
Table 3-8 shows the propensity (percent sayingthey would “definitely” or “probably” be on activeduty) for each active Service, and for the“National Guard” and “Reserves.”
Relatively few youth express a propensity for oneService only. Most either indicate they areinterested in no military service, or they indicatesome likelihood with respect to multiple Services.Table 3-9 shows the percent of youth indicating apropensity for each Service who also indicate apropensity to join another Service. For example,among the men indicating they would “definitely”or “probably” be in the Army, 76 percent alsoindicated they would “definitely” or “probably” bein at least one other active Service.
That youth express propensity for multipleservices is not surprising. Youth responding tothese questions generally are independentlyevaluating the likelihood of different events(joining the Army, joining the Navy, etc.) on a 4-point scale (“definitely,” “probably,” “probablynot,” and “definitely not”). Even though it is veryunlikely they will join two Services, they may feelit likely that they will join a Service and, as theyare undecided, they may “rate” different Servicesthe same. One might, for example, give theArmy, Navy, and Air Force a “probable” ratingindicating it is fairly likely they might join any ofthese but, because of personal preference, saythey will “probably not” join the Marines.
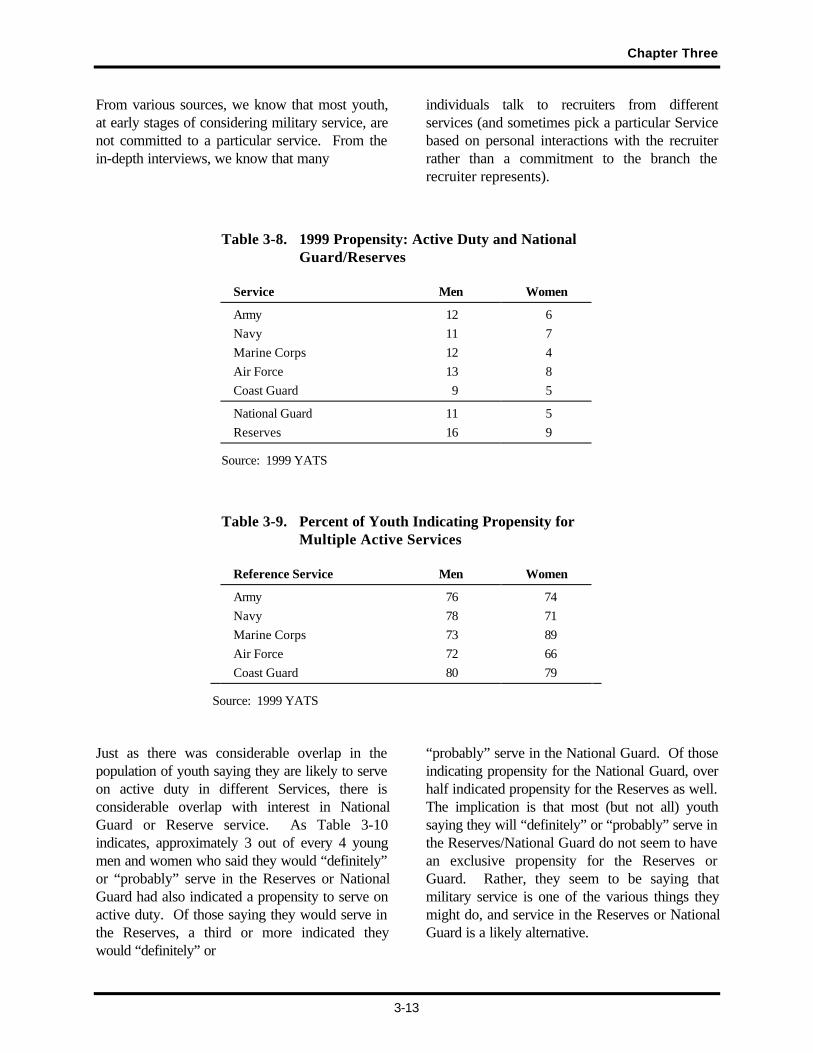
Chapter Three
3-13
From various sources, we know that most youth,at early stages of considering military service, arenot committed to a particular service. From thein-depth interviews, we know that many
individuals talk to recruiters from differentservices (and sometimes pick a particular Servicebased on personal interactions with the recruiterrather than a commitment to the branch therecruiter represents).
Table 3-8. 1999 Propensity: Active Duty and National Guard/Reserves
Service Men Women
Army 12 6 Navy 11 7 Marine Corps 12 4 Air Force 13 8 Coast Guard 9 5
National Guard 11 5 Reserves 16 9
Source: 1999 YATS
Table 3-9. Percent of Youth Indicating Propensity for Multiple Active Services
Reference Service Men Women
Army 76 74 Navy 78 71 Marine Corps 73 89 Air Force 72 66 Coast Guard 80 79
Source: 1999 YATS
Just as there was considerable overlap in thepopulation of youth saying they are likely to serveon active duty in different Services, there isconsiderable overlap with interest in NationalGuard or Reserve service. As Table 3-10indicates, approximately 3 out of every 4 youngmen and women who said they would “definitely”or “probably” serve in the Reserves or NationalGuard had also indicated a propensity to serve onactive duty. Of those saying they would serve inthe Reserves, a third or more indicated theywould “definitely” or
“probably” serve in the National Guard. Of thoseindicating propensity for the National Guard, overhalf indicated propensity for the Reserves as well.The implication is that most (but not all) youthsaying they will “definitely” or “probably” serve inthe Reserves/National Guard do not seem to havean exclusive propensity for the Reserves orGuard. Rather, they seem to be saying thatmilitary service is one of the various things theymight do, and service in the Reserves or NationalGuard is a likely alternative.

Enlistment Propensity for Military Service
3-14
Table 3-10. Percent of Youth Indicating Propensity for Both Active and Reserve Service andfor Both Reserves and National Guard
Men Women
Active Other Reserve Active Other Reserve
Reserves 75 39 73 34 National Guard 77 62 72 56
Source: 1993 – 1999 YATS
Respondents who indicate they will “definitely” or“probably” serve in the Reserves are asked inwhich branch (Army, Navy, Marine Corps, AirForce, or Coast Guard) they are likely to beserving. Similarly, those who indicate they maybe serving in the National Guard are asked to
indicate whether they are likely to serve in theArmy National Guard or the Air National Guard.Figure 3-4 provides estimates of the percent ofyoung men and women expressing propensity toserve in different branches of the Reserves andNational Guard.
Figure 3-4. National Guard and Reserve Propensity by Gender
National Guard
Don't Know3%
Air Guard40%
Army Guard57%
Reserve
Army34%
Navy16%
Air Force22%
Marine20%
Don't Know2%
Coast Guard6%
National Guard
Don't Know7%
Air Guard40%
Army Guard53%
Reserve
Army34%
Navy16%
Air Force22%
Marine20%
Don't Know2%
Coast Guard6%
Women
Men
Source: 1999 YATS

Chapter Three
3-15
Service Differences. Historically, propensity forsome Services has been higher than for others.More youth, for example, have indicated theywere likely to join the Air Force than haveindicated they were likely to join the MarineCorps. In general, the factors related topropensity for one Service are the same as thoserelated to propensity for any other Service.Factors related to propensity for service in theReserves are the same as factors related topropensity for active duty service. Not only arethe factors the same, but the quantitativerelationships are similar. For example, Figures 3-1 and 3-2, which show the relationship of age andunaided or active composite propensity might,with appropriate adjustment of the propensityscale, would also show the relationship of age andpropensity for the Army, Navy, National Guard,etc. There are a few relatively minor exceptions:
• Women have a relatively low propensityfor the Marine Corps. In the past fewyears, women’s propensity for mostServices has been about half that of men;women’s propensity to join the Marines isabout a third that of men.
• Hispanics have relatively high propensityfor the Marines.
• Male high school dropouts have relativelylow propensity for the Air Force; collegegraduates have relatively high propensityfor the Air Force. Among women,propensity for the Air Force seems todecline less with education level than forthe other Services.
• Mother’s education has a somewhat lowercorrelation to Air Force propensity thanwith propensity for other Services;mother’s education has a relatively highcorrelation with propensity for the Armyand Marine Corps.
Trends in Propensity
Fewer youth today have a propensity for militaryservice than during the last years of the ColdWar. In general, young men’s propensity formilitary service rose during the 1980’s, reached ahigh point in 1991 following Operation DesertStorm, dropped precipitously in 1992, andcontinues to slowly decline. In general, youngwomen’s propensity has remained relativelystable over the past 15 years. However, thesepatterns are not universal: trends in propensitydiffer for aided and unaided propensity, differ byrace/ethnic group, and differ by Service.
The figures in this section show observed valuesof propensity for each year since 1984, andinclude trendlines suggesting long-term trends.12
To a small degree, the observed values willinclude some sampling error. In the followingcharts, sampling error will almost always be lessthan 2 percentage points, and usually less than 1percentage point. That is, the propensity estimateshown for a particular year will usually be within1 percentage point of what we would find if weinterviewed every youth in America. For minoritypopulations (Blacks and Hispanics), samplingerror will be larger because estimates are basedon fewer observations. For minorities, samplingerror will almost always be less than 6 percentagepoints and usually less than 3 percentage points.
12 Generally, we fit linear regression lines to observed data for
two periods: 1984 – 1989 and 1993 – 1999. In manyinstances, the fitted regression line was very nearly level; inthose cases, we simply inserted a constant trendline. In someinstances, the 1993 – 1999 trend appeared to be acontinuation of the 1984 – 1989 trend; in such cases, asingle trendline was fit. In many instances, the regressionline, fit for example to 1984 – 1989 data, is extended toillustrate a continuing trend, or departure from the trend.While the trendlines we have included fit the data reasonablywell, the reader should note that other trendlines might alsofit the data reasonably well. The notes below each figureexplain the procedures used for the trendlines in the figure.
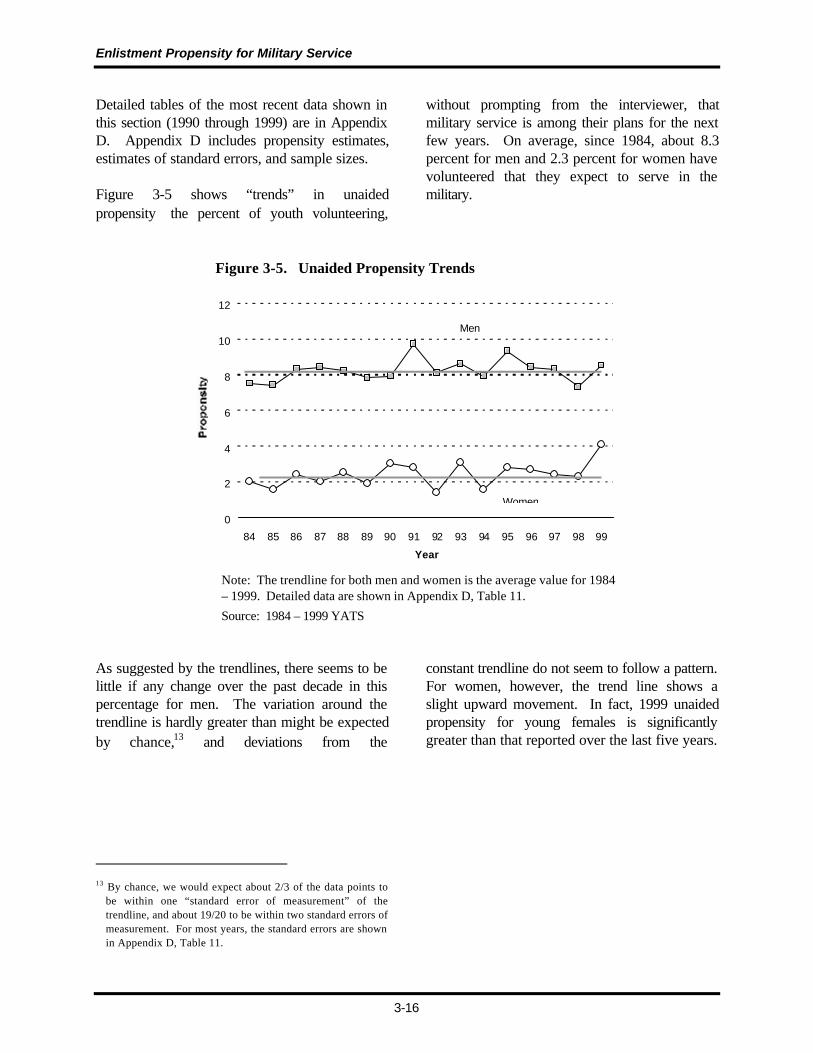
Enlistment Propensity for Military Service
3-16
Detailed tables of the most recent data shown inthis section (1990 through 1999) are in AppendixD. Appendix D includes propensity estimates,estimates of standard errors, and sample sizes.
Figure 3-5 shows “trends” in unaidedpropensitythe percent of youth volunteering,
without prompting from the interviewer, thatmilitary service is among their plans for the nextfew years. On average, since 1984, about 8.3percent for men and 2.3 percent for women havevolunteered that they expect to serve in themilitary.
Figure 3-5. Unaided Propensity Trends
0
2
4
6
8
10
12
84 85 86 87 88 89 90 91 92 93 94 95 96 97 98 99
Year
Men
Women
Note: The trendline for both men and women is the average value for 1984– 1999. Detailed data are shown in Appendix D, Table 11.
Source: 1984 – 1999 YATS
As suggested by the trendlines, there seems to belittle if any change over the past decade in thispercentage for men. The variation around thetrendline is hardly greater than might be expectedby chance,13 and deviations from the
13 By chance, we would expect about 2/3 of the data points to
be within one “standard error of measurement” of thetrendline, and about 19/20 to be within two standard errors ofmeasurement. For most years, the standard errors are shownin Appendix D, Table 11.
constant trendline do not seem to follow a pattern.For women, however, the trend line shows aslight upward movement. In fact, 1999 unaidedpropensity for young females is significantlygreater than that reported over the last five years.

Chapter Three
3-17
Figure 3-6 shows trends in Active CompositePropensitythe percent of responding to specificquestions about the Army, Navy, Marine Corps,and Air Force, saying they will “definitely” or“probably” be on active duty in the next fewyears. Active Composite Propensity has changedsignificantly in the past several years. From 1984through 1991, young men’s propensity for military
service increased about ½ percentage point peryear. Between 1991 and 1994, it droppedconsiderablyfrom nearly 35 percent to about 26percent. From 1995 through 1999, young men’spropensity has been nearly constant, but 1999shows a significant increase, to 29 percent.Although women’s propensity has fluctuatedsomewhat, the long-term trend is constant.
Figure 3-6. Active Composite Propensity Trends
0
5
10
15
20
25
30
35
40
84 85 86 87 88 89 90 91 92 93 94 95 96 97 98 99
Year
Men
Women
Note: The first trendline for men is based on 1984 – 1989 propensity,projected to 1991. The second trendline for men is the average value for1994 – 1999. The trendline for women is the average value for 1984 – 1999.Detailed data are shown in Appendix D, Tables 1 and 2.
Source: 1984 – 1999 YATS

Enlistment Propensity for Military Service
3-18
Figure 3-7 shows Active Composite Propensitytrends among White youth. Given thatapproximately 70 percent of youth are White, it isnot surprising that trends in propensity amongWhite youth closely resemble trends among allyouth. Among young White men, propensitytrended upwards through the 1980s, increasing
about ½ percentage point per year. Between1992 and 1998, White men’s propensity hastrended downward (on average three-quarters ofa percentage point per year). Around 8 percent ofyoung White women have said that they would“definitely” or “probably” serve since the 1980s.
Figure 3-7. Active Composite Propensity Trends AmongWhite Youth
0
5
10
15
20
25
30
35
40
84 85 86 87 88 89 90 91 92 93 94 95 96 97 98 99
Year
Men
Women
Note: The first trendline for men is based on 1984 – 1989 propensity,projected to 1991. The second trendline for men is based on 1993 – 1999propensity. The trendline for women is the average value for 1984 – 1999.Detailed data are shown in Appendix D, Tables 14 and 15.
Source: 1984 – 1999 YATS

Chapter Three
3-19
Figure 3-8 shows Active Composite Propensitytrends among Black youth. In the late 1980s,young Black men’s propensity was high andincreasing. In 1990, during Operations DesertShield/Desert Storm, Black men’s propensitydropped considerably. At that time, Blackleadership in this country suggested that, in theevent of a ground war in Iraq, young Blackswould suffer heavy casualties. Black men’s
propensity appeared to rebound in 1991, butdropped again in 1992. Black men’s propensityremains considerably below levels experienced in1989 and preceding years. The past few years,Black men’s propensity has remained around 33percent. In contrast, young Black women’spropensity appears to have been declining in thelate 1980s. Black women’s propensity has showna slight increase over the past 7 years.
Figure 3-8. Active Composite Propensity Trends AmongBlack Youth
0
10
20
30
40
50
60
84 85 86 87 88 89 90 91 92 93 94 95 96 97 98 99
Year
Men
Women
Note: The first trendline for men is based on 1984 – 1989 propensity,projected to 1990. The second trendline for men is the 1993 – 1999average. The first trendline for women is based on 1984 – 1989propensity, projected to 1991. The second trendline for women is basedon 1993 – 1999 propensity. Detailed data are shown in Appendix D,Tables 14 and 15.
Source: 1984 – 1999 YATS

Enlistment Propensity for Military Service
3-20
Figure 3-9 shows Active Composite Propensitytrends among Hispanic youth. The data indicatea long-term downward trend in Hispanic men’spropensity for military service from the mid-1980s
Into the 1990s. However, the pattern from 1993through 1999 indicates a gradual increase inHispanic male propensity. Hispanic women’spropensity appears to be gradually increasing.
Figure 3-9. Active Composite Propensity Trends AmongHispanic Youth
0
10
20
30
40
50
60
84 85 86 87 88 89 90 91 92 93 94 95 96 97 98 99
Year
Men
Women
Note: The first trendline for men is based on 1984 – 1992 propensity. Thesecond trendline for men is based on 1993 – 1999 propensity. Thetrendline for women is based on 1984 – 1999 propensity. Detailed data areshown in Appendix D, Tables 14 and 15.
Source: 1984 – 1999 YATS

Chapter Three
3-21
Figure 3-10 through 3-14 shows trends inpropensity for active service in each of theServices. Generally, these match trends inComposite Active propensity. Figure 3-10,showing trends for the Army, shows men’spropensity increasing in the 1980s (about ½percentage point per year), but dropping sharply
from 1991 to 1992. Approximately 12 percent ofyoung men have indicated propensity for theArmy the past few years. Women’s propensityfor the Army has been relatively constant atapproximately 6 percent.
Figure 3-10. Trends in Propensity for Service in the Army
0
2
4
6
8
10
12
14
16
18
20
84 85 86 87 88 89 90 91 92 93 94 95 96 97 98 99
Year
Men
Women
Note: The first trendline for men is based on 1984 – 1989 propensity,projected to 1992. The second trendline for men is the average value for1993 – 1999. The trendline for women is the average value for 1984 – 1999.Detailed data are shown in Appendix D, Tables 3 and 4.
Source: 1984 – 1999 YATS

Enlistment Propensity for Military Service
3-22
Figure 3-11 shows a similar pattern for the Navy.Men’s propensity increased about ½ percentagepoint per year in the late 1980s, but droppedconsiderably following Operation Desert Storm.The past few years, excluding 1999, slightly morethan 9 percent of young men say they will
“definitely” or “probably” enter active duty in theNavy. Young women’s propensity for the Navyhas fluctuated somewhat, but remained about 4.5percent.
Figure 3-11. Trends in Propensity for Service in the Navy
0
2
4
6
8
10
12
14
84 85 86 87 88 89 90 91 92 93 94 95 96 97 98 99
Year
Men
Women
Note: The first trendline for men is based on 1984 – 1989 propensity,projected to 1990. The second trendline for men is the average value for1993 – 1998. The trendline for women is the average value for 1984 – 1999.Detailed data are shown in Appendix D, Tables 5 and 6.
Source: 1984 – 1999 YATS
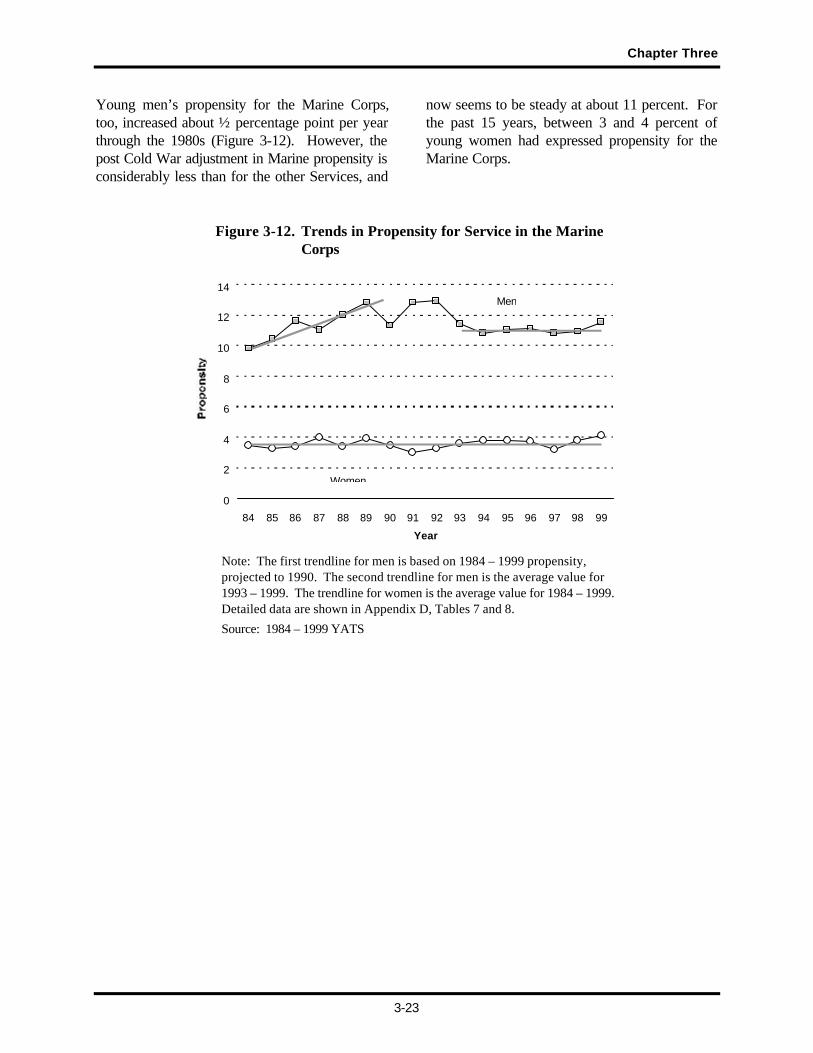
Chapter Three
3-23
Young men’s propensity for the Marine Corps,too, increased about ½ percentage point per yearthrough the 1980s (Figure 3-12). However, thepost Cold War adjustment in Marine propensity isconsiderably less than for the other Services, and
now seems to be steady at about 11 percent. Forthe past 15 years, between 3 and 4 percent ofyoung women had expressed propensity for theMarine Corps.
Figure 3-12. Trends in Propensity for Service in the MarineCorps
0
2
4
6
8
10
12
14
84 85 86 87 88 89 90 91 92 93 94 95 96 97 98 99
Year
Men
Women
Note: The first trendline for men is based on 1984 – 1999 propensity,projected to 1990. The second trendline for men is the average value for1993 – 1999. The trendline for women is the average value for 1984 – 1999.Detailed data are shown in Appendix D, Tables 7 and 8.
Source: 1984 – 1999 YATS

Enlistment Propensity for Military Service
3-24
In the 1980s, young men’s propensity for the AirForce (Figure 3-13) increased slightly (onaverage, about 1 point in 6 years). Young men’spropensity for the Air Force, like their propensityfor the Army and the Navy, dropped sharplyfollowing Operation Desert Storm. For the past 7
years, approximately 13 percent of young menindicate a propensity for the Air Force. Youngwomen’s propensity for the Air Force seems tobe slightly lower than during the Cold War, buthas been increasing slightly since 1993.
Figure 3-13. Trends in Propensity for Service in the AirForce
0
2
4
6
8
10
12
14
16
18
20
84 85 86 87 88 89 90 91 92 93 94 95 96 97 98 99
Year
Men
Women
Note: The first trendline for men is based on 1984 – 1989 propensity,projected to 1990. The second trendline for men is the average value for1993 – 1999. The first trendline for women is the 1984 – 1989 average,projected to 1992. The second trendline for women is based on the 1993 –1999 propensity. Detailed data are shown in Appendix D, Tables 9 and 10.
Source: 1984 – 1999 YATS

Chapter Three
3-25
Young men’s propensity for the Coast Guard(Figure 3-14) increased in the 1980s, but droppedto about 8 percent after the Cold War. Women’s
propensity for the Coast Guard seems to beincreasing very slightly (about 2 points in 14years).
Figure 3-14. Trends in Propensity for Service in the CoastGuard
0
2
4
6
8
10
12
84 85 86 87 88 89 90 91 92 93 94 95 96 97 98 99
Year
Men
Women
Note: The trendline for men is the average value for 1994 – 1999. Thetrendline for women is based on the 1985 – 1999 propensity. Detailed dataare shown in Appendix C, Table C-6.
Source: 1984 – 1999 YATS

Enlistment Propensity for Military Service
3-26
Propensity for the Reserves seems to follow apattern common to active Services. Through the1980s, young men’s propensity for the Reservesincreased about ½ percentage point per year(Figure 3-15). In recent years, about 16 percent
of young men indicate they join enter theReserves. Though women’s propensity hasfluctuated somewhat, the long-term trend is flat,with about 7 percent of women saying they will“definitely” or “probably” enter the Reserves.
Figure 3-15. Trends in Propensity for Service in theReserve Components
0
5
10
15
20
25
84 85 86 87 88 89 90 91 92 93 94 95 96 97 98 99
Year
Men
Women
Note: The first trendline for men is based on 1984 – 1989 propensity,projected to 1992. The second trendline for men is the average value for1993 – 1999, but excludes the 1998 data point. The trendline for women isthe average value for 1984 – 1999. Detailed data are shown in Appendix D,Tables 12 and 13.
Source: 1984 – 1999 YATS

Chapter Three
3-27
In the 1980s, young men’s propensity for theGuard (Figure 3-16) increased about 0.6 pointsper year. Guard propensity among young menfell after the Cold War and appears to have been
nearly constant at the 9 percent level since 1992.Young women’s propensity for the Army/AirGuard has fluctuated around 5 percent over thepast 15 years.
Figure 3-16. Trends in Propensity for Service in theArmy/Air National Guard
0
2
4
6
8
10
12
14
16
18
84 85 86 87 88 89 90 91 92 93 94 95 96 97 98 99
Year
Men
Women
Note: The first trendline for men is based on 1984 – 1989 propensity,projected to 1990. The second trendline for men is the average value for1993 – 1999. The trendline for women is the average value for 1984 – 1999.Detailed data are shown in Appendix D, Tables 12 and 13.
Source: 1984 – 1999 YATS
Young men and women saying they will“definitely” or “probably” serve in the Reservesare asked in which Service (Army, Navy, MarineCorps, Air Force, or Coast Guard) they are likelyto serve. The Service preferences of thosepropensed for Reserve service have been fairlystable since the end of the Cold War (see Figure3-4, page 3-19). The Army is most frequentlymentioned, but the percent specifying the Army
has decreased slightly over the past severalyears. Although relatively few respondentsmention the Navy, the percent expressingpropensity specifically for the Naval Reservesappears to have increased slightly. The datasuggest the percentages of young men preferringthe Air Force Reserves, the Marine CorpsReserves, and the Coast Guard Reserves havechanged not at all in the past several years.

Enlistment Propensity for Military Service
3-28
Summary
Propensity, which is defined in YATS as thepercent of youth saying they will “definitely” or“probably” enter military service, has been shownto be a valid indicator of enlistment behavior.Youth who say they are likely to join are morelikely to join than those who say they are unlikelyto join. Independent research suggests thatpropensity, as measured in surveys such asYATS, reflects both relatively permanent tastesor preferences (such as a reluctance to leavehome) and current circumstances (such as havingsatisfactory school or work arrangements).Youth’s propensity responses do not distinguishbetween enlistment and entering the military as anofficer (or officer-trainee).
Propensity is related to several demographicfactors:
• Men show higher levels of propensity thando women.
• Propensity declines with age.
• Propensity declines with education.Among high school seniors, those morelikely to go to college have a lowerpropensity than those less likely to go tocollege.
• Propensity is higher among unemployedyouth than among employed youth; youthwho believe they have good job prospectshave lower propensity than those whobelieve their job prospects are poor.
• Propensity is highest among Hispanics,followed by Blacks; White youth show thelowest propensity of the race/ethnicgroups.
• Propensity declines with parents’education; children of college-educatedmothers have a lower propensity thanchildren whose mothers did not attendcollege.
• Single youth have higher propensity thando youth who are married.
• High school seniors whose fathers haveserved in the military have a higherpropensity than do those whose fathers donot have military experience.
• Propensity varies by region: propensity ishigher in the South and West, lowest in theNorth Central region.
Propensity for military service is general for mostyouth, and not tied to a specific Service. Mostyouth who express propensity for one Serviceexpress propensity for multiple Services. Mostyouth who express propensity for Reservecomponents also express propensity for activeservice.
In general, young men’s propensity for militaryservice rose during the Cold War, droppedfollowing Operation Desert Storm, and has beendeclining the past several years. Young women’spropensity for military service has been constantsince 1984, with some possible fluctuations.These generalizations, however, do not hold forspecific race/ethnic groups, or for different activeServices or Reserve components. Propensitytrends for Whites, Blacks, and Hispanics aredistinct, as are propensity trends for differentServices.
4-1
4. REASONS FOR ENTERING OR NOT ENTERINGMILITARY SERVICE
Introduction
The decision to join the military (or, conversely,the decision not to join the military), is not simple.For most youth, the decision is part of theirtransition from adolescence to adulthood. It isone aspect of their effort to find an adult career.Ability, personality, opportunities, and obligationsall factor into the decision. These factors willvary, of course, from one youth to another, andfrom one moment to another. From ourconversations with youth, we know that thedecision to enlist may change as quickly as ayouth’s circumstances, or his/her understandingof those circumstances.
Overview
This chapter examines reasons for entering ordeclining military service. It is based on twotypes of questions. First, we ask youth, if theywere to enter the military why they would join.Conversely, we ask why they would not join. Thereasons offered by youth range from thehypothetical (a youth confident he will not join isinvited to offer hypothetical reasons for joining) tothe actual (the same youth is invited to offeractual reasons for not joining).
The second type of question asks respondentswhether their interest in military service haschanged over the past year. Youth who say theirinterest has increased are asked reasons for thisincrease and vice versa.
Both questions are open-endedyouth respond intheir own words. Interviewers may query therespondent to make sure the response is correctlyunderstood and captured, but do not suggestreasons not mentioned by the respondent. Theinterviewer elicits multiple responses to all thesequestions. If a youth provides one reason forenlisting, the interviewer asks whether there are
other reasons; respondents offering two reasonsare asked if there are any other reasons; and soforth. All responses are recorded using anestablished taxonomy of reasons provided to theinterviewer, but not read to the respondent. Thecategories used are based on the collectiveknowledge of recruiting officials andresearchers.1
Using open-ended questions has advantages anddisadvantages. Inevitably, we get “top-of-mind”responses. Many youth have difficulty recallingor articulating reasons for joining or not joining, orreasons for changing interest in military service.Many responses don’t fit in any category inexisting taxonomies.2 The alternative to open-ended questions would be to read a list of reasonsand asking youth to affirm or deny that differentreasons apply to them. The disadvantage to thisapproach is that it is more likely to elicit falsepositive responses.
The following sections deal first with reasons forjoining and increased interest in military service,then with reasons for not joining and decreasedinterest. Demographic variations in reasons forjoining/not joining are examined within thepopulation of 16-21 year-olds with no more thantwo years postsecondary education. This is themarket of primary interest to military recruiters.To minimize sampling error, analysis of
1 The YATS questionnaire is annually reviewed by recruiting
officials and researchers representing each of the ArmedServices as well as DoD. These reviewers are familiar notonly with prior YATS results, but also with years ofqualitative and quantitative studies of enlistment behavior.
2 Periodically, we ask interviewers to record verbatim responsesthat don’t fit existing categories. These are reviewed todiscern appropriate categories of reasons not included amongthose previously identified. Efforts in recent years haveconfirmed that our current taxonomies of reasons forjoining/not joining are complete. Thus, we are confident thatno significant response categories have been omitted.
Reasons for Entering or Not Entering Military Service
4-2
demographic factors is based on the combined1996 through 1999 YATS files. Since thereasons for joining appear to be relatively stableover these years, combining data from differentyears is appropriate, and results are applicable tothe present situation. Trends in reasons forjoining are also presented from 1991 to 1999.
A final procedural note is necessary. With a fewexceptions, youth from different demographicgroups offer the same reasons for joining/notjoining, and in the same proportions. Tablesshowing breakouts by different demographicgroups tend to be repetitive, with rows ofpercentages that vary only as a function ofsampling error. As a result, we present a fewsuch tables showing the percent of youth offeringdifferent reasons for joining/not joining, broken outby gender, propensity for military service, andrace/ethnicity. Further demographic variations inreasons for joining and not joining are discussed,but without tables in which most entries wouldsimply repeat statistics shown in earlier tables.Appendix E contains full documentation of thenumbers presented and discussed in this chapter.
Reasons for Entering MilitaryService
In the YATS interview, respondents are asked:3
If you were to consider joining themilitary, what would be the mainreasons? (Any other reasons?)
Respondents offer reasons in their own words,and are encouraged to give multiple reasons. Theinterviewer did not suggest any reasons to therespondent, but recorded responses using the list
3 To reduce response burden, many YATS questions are asked
of only a subset of respondents. Half of respondents,randomly selected, are asked why they might join and whythey might not join. Those not asked these questions areasked whether their interest in military service has increasedor decreased in the past year, and those reporting a changeare asked for reasons for the increase/decrease.
of reasons shown in Table 4-1. Some youthdeclined to offer reasons for joining, saying thatthey would not consider joining; these are shownin Table 4-1 as “would not consider.”
Men and Women. Table 4-1 shows the percentof men and women mentioning different reasonsfor joining, overall and by composite activepropensity. Frequently mentioned reasons includeboth tangible (pay for education, job training, pay),and intangible (duty to country, discipline, self-esteem) reasons for joining. Women are morelikely than men to mention educational benefitsand less likely to mention any other type of reasonfor joining.
Propensity Effects. Table 4-1 also breaks outresponses by positively propensed (they said theywould “definitely” or “probably” serve on activeduty in at least one of the Services) andnegatively propensed youth (they consistently saidthey would “probably not” or “definitely not”serve on active duty). Some reasons (e.g.,money for education, pay) seem to be equallysalient to all youth, regardless of their interest inmilitary service. Others, however, are morefrequently mentioned by youth who areconsidering joining than those not consideringjoining. Youth expressing a propensity formilitary service are more likely to mention jobtraining, duty to country, and self-esteem.
Respondents also vary in the number of reasonsoffered. The majority of respondents offer onlyone reason for joining. A few offer no reasons atall; only a few offer three or more reasons. Thelast row in Table 4-1 indicates the averagenumber of reasons mentioned by youth. Youthwith a propensity for military service offer morereasons than do youth saying they will “definitelynot” or “probably not” enter military service.This only stands to reason. Youth likely to joinwill have given military service more thought, andmore reasons for joining will come to mind.

Chapter Four
4-3
Table 4-1. Main Reasons for Joining Among Young Men and Women by Composite ActivePropensity
Men Women
Propensity Propensity
Positive Negative Total Positive Negative Total
Money for education 33 32 32 36 37 37Job training 33 20 24 29 15 17Duty to country 17 11 12 13 9 9Pay 13 12 12 12 10 11Travel 11 8 9 10 7 7Develop discipline 8 5 6 6 3 4Job security 6 5 5 6 4 4Self-esteem 10 4 6 8 3 4Would not consider 0 7 5 0 10 9Family tradition 6 3 4 6 3 3National defense 3 2 3 2 2 2Retirement benefits 4 3 3 4 2 2Physical challenge 4 3 3 3 2 2Nothing better to do 2 3 3 3 2 2
Mean number of mentions 1.5 1.2 1.3 1.4 1.1 1.1
Note: The population reported in this table includes 16-21 year-old youth with no more than two years ofpostsecondary education residing within the 48 contiguous United States. Numbers in the table are percentagesexcept for last row.
Source: 1996 - 1999 YATS
Race/Ethnicity. Table 4-2 presents reasons forjoining by racial/ethnicity. Response patterns aresimilar across racial/ethnic groups, with onlyscattered differences. White men and womenare somewhat more likely than minorities tomention money for education (as noted in Chapter2, they are somewhat more likely to go tocollege). Black men seem somewhat less likelyto mention job training or duty to country;
somewhat more likely to mention pay. Hispanicmen seem somewhat more likely to mention self-esteem. Minority women are more likely thanWhites to mention job training. Like Black men,Black women are more likely to mention pay andtravel, less likely to mention duty to country. Theaverage number of reasons mentioned does notdiffer by racial group.

Reasons for Entering or Not Entering Military Service
4-4
Table 4-2. Main Reasons for Joining Among Young Men and Women by Race/Ethnicity
Men WomenRace/Ethnicity Race/Ethnicity
White Black Hispanic White Black Hispanic
Money for education 33 29 32 38 36 33Job training 24 21 26 16 21 20Duty to country 13 10 12 11 5 10Pay 12 15 13 10 13 10Travel 8 11 8 7 10 7Develop discipline 6 5 6 4 5 3Job security 5 5 6 4 6 3Self-esteem 5 6 8 4 5 5Would not consider 5 6 3 10 8 7Family tradition 4 3 3 3 2 3National defense 3 1 2 2 1 2Retirement benefits 4 3 3 3 3 2Physical challenge 3 2 3 2 2 2Nothing better to do 3 4 3 1 3 3
Mean number of mentions 1.3 1.2 1.3 1.1 1.2 1.1
Note: The population reported in this table includes 16-21 year-old youth with no more than two years ofpostsecondary education residing within the 48 contiguous United States. Numbers in the table are percentagesexcept for last row.
Source: 1996 - 1999 YATS
School Status. The primary recruiting market forthe military Services consists of high schoolseniors and high school graduates not currentlyenrolled in postsecondary school or training.Generally, high school seniors provide the samereasons for joining as do high school graduateswho have not gone on to college. Thus, for bothseniors and graduates, the percent offering aparticular reason is approximately the same4 asthat shown in the “Total” columns of Table 4-1.There are, however, a few exceptions:
• Seniors are more likely than graduates tomention duty to country (12 vs. 9 percentamong men; 10 vs. 7 percent amongwomen).
4 That is, differences would be small, not statistically
significant.
• Seniors are less likely than graduates tomention job security (4 vs. 9 percentamong men; 3 vs. 9 percent amongwomen), travel (8 vs. 12 percent amongmen; 6 vs. 10 percent among women); andretirement benefits (3 vs. 5 percent amongmen; 2 vs. 5 percent among women).
• Male seniors are more likely thangraduates to mention money for education(40 vs. 29 percent) and family tradition (4vs. 2 percent).
• Male seniors are less likely than graduatesto mention job training (23 vs. 27 percent).
• Female seniors are more likely thangraduates to mention discipline (4 vs. 3percent) and self-esteem (5 vs. 3 percent).
High school graduates who are not in college aremuch more likely than high school seniors to haveexperience in the work place and to have tried to

Chapter Four
4-5
make a living. Thus, it is not surprising that theywould place a higher priority on practicalconsiderations (job training, job security) and alower priority on less tangible benefits (self-esteem, discipline).
Veterans. Most youth report knowing someonewho has been in the military, either their elderrelatives (e.g., parents, uncles, grandparents) orsame-age friends. In the past few years, 34percent of youth have reported their father hadbeen in the military. In general, children ofveteran5 fathers6 mention the same reasons forjoining as youth with no veteran acquaintances,however, there were some differences:
• Sons of veteran fathers are more likely tomention job training (27 vs. 23 percent) andfamily tradition (5 vs. 3 percent).
• Sons of veteran fathers are less likely tosay they “would not consider” militaryservice (3 vs. 5 percent).
• Daughters of veterans are more likely tomention family tradition (5 vs. 3 percent).
• Daughters of veterans are less likely tomention duty to their country (8 vs. 10percent).
About 49 percent of young men and womenreport having a peera friend their own age,who is or has been in the military. Differencesamong young men, where significant, are typicallysmall. Young men with friends in the military aremore likely to mention:
• Job training (28 vs. 22 percent);
• Travel (10 vs. 8 percent);
• Self-esteem and develop discipline (7 vs. 5percent);
5 We use “veteran” to designate persons who have been, or are
presently, in military service.
6 Because of the very low percent of women who were inmilitary service 20 to 40 years ago, very few enlistment ageyouth have mothers who have been in the military.
• Job security (6 vs. 5 percent);
• Retirement benefits (5 vs. 3 percent) and
• Family tradition (4 vs. 3 percent).
Young women with military friends are somewhatmore likely to mention money for education (41vs. 36 percent), pay (13 vs. 3 percent), travel (9s. 7 percent), and job security (5 vs. 3 percent).
Both young men and young women with militaryfriends are less likely to say they “would notconsider” military service (3 vs. 5 percent formen; 7 vs. 9 percent for women).
Historical Trends in Reasonsfor Joining
Figures 4-1 and 4-2 present trends in the mostcommonly mentioned reasons for enlisting in themilitary from 1991 to 1999. From 1991 through1995, the percent of young men mentioningmoney for education increased; since 1995,approximately 1 in 3 young men mention moneyfor education (Figure 4-1). In 1992, about 1 in 3young men mentioned job training; since 1993,about 1 in 4 mention job training.7 Since 1993,somewhat more than 1 in 10 young men havementioned duty to country or pay8 as a reason forjoining.
The percent of young women (Figure 4-2)mentioning money for education peaked in 1996,and dropped significantly the following two yearsbefore rebounding in 1999. The percentmentioning job training declined from 1991 to1994, but rose steadily through 1998, beforedeclining slightly in 1999. As with young men,nearly identical percentages of young women(somewhat less than 10 percent) mentioned dutyto country and pay between 1995 and 1999.
7 The drop in mentions of job training coincides with a shift in
emphasis in Army advertising away from job training in favorof money for college.
8 YATS interviewers distinguish between money in general(“pay”) and money specifically for education.

Reasons for Entering or Not Entering Military Service
4-6
Figure 4-1. Trends in Common Reasons for Entering Military ServiceAmong Young Men
0
10
20
30
40
1991 1992 1993 1994 1995 1996 1997 1998 1999
Year
Per
cent
Money for Education
Job Training
Duty to Country
Pay
Source: 1991 – 1999 YATS
Figure 4-2. Trends in Common Reasons for Entering Military ServiceAmong Young Women
0
10
20
30
40
1991 1992 1993 1994 1995 1996 1997 1998 1999
Year
Per
cent
Money for Education
Job Training
Duty to CountryPay
Source: 1991 – 1999 YATS

Chapter Four
4-7
Alternative Perspective onReasons for Joining
As described above, half of the respondents arerandomly selected and asked reasons for joining.The other half are asked:
Thinking back to this time last year,would you say your interest in joiningthe military has…
Increased greatly,Increased a little,Remained the same,Decreased a little, orDecreased greatly?
Those reporting their interest has “greatlyincreased” or “increased a little” are asked toprovide reasons for the increase. As withreasons for joining, youth respond in their ownwords. YATS interviewers are trained to classifyremarks into the categories shown in Table 4-3,and guidance on classifying remarks is included inreference manuals retained by interviewersthrough data collection. Most of the categoriesare self-explanatory, but some merit comment.The following explanations are taken from thetraining materials provided to interviewers:
• “Change in life” includes specificreferences to changes not covered by theother reasons listed, and nonspecificcomments by the respondent that life hasor will shortly change.
• “Scholastic frustration” representscomments that school is not working outfor the respondent, but does not refer to notbeing able to afford to continue withschool.
• “Circumstances unsatisfactory” applies ifthe respondent indicates dissatisfactionwith current personal living circumstances,other than those specifically related toschool or work.
• “Money for college” includes money for alltypes of education, not just college.
• “Recruiter contact” refers to personalcontact (telephone calls, recruiter visitsschool, respondent visits recruiting station,etc.) with military recruiters; receipt of mailis not considered personal contact.
• “Talk with military” indicates therespondent referring to any conversationabout military service with anyone, otherthan a recruiter, who is, or has been, in themilitary.
Respondents were encouraged to mention up tothree reasons for their increased interest; mostprovided one or two reasons.
Table 4-3 shows the percent of men and womenproviding reasons for increased interest. Thesepercentages are based on youth who said theirinterest in military service had increased. Thus,for example, of young men saying their interesthad increased, about 6 percent offered “gettingolder” as a reason for increased interest.
The most common responses to this questionmatch those offered as reasons for joining (Table4-1): money for education, job training, and aself-supporting job. Additionally, 11 percent ofyouth mention that changes in their lives have ledto an increased interest in the military. Eventhough the question asks for a reason forincreased interest, most responses seem todescribe reasons for current interest. Thus, thisquestion provides approximately the sameinformation as the “reasons for joining” question.However, it also provides information not elicitedby the “reasons for joining” question.
Many youth attribute increased interest tocommunications with others (Saw/Talked).These communications may be either thosesupported by the recruiting services (recruitercontact, advertising), or those not promulgated bythe Services (talk with military, talk with non-military, news/world events). Indeed, youth aremore likely to cite discussions with militarymembers and veterans than with recruiters as
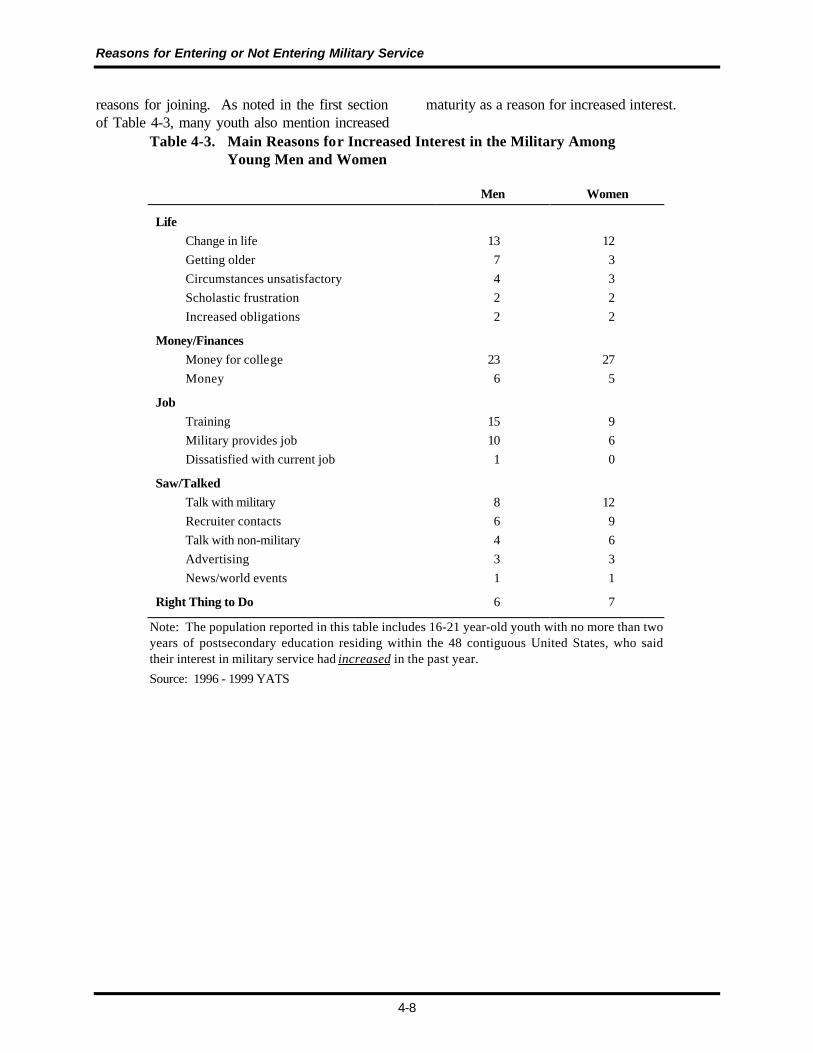
Reasons for Entering or Not Entering Military Service
4-8
reasons for joining. As noted in the first sectionof Table 4-3, many youth also mention increased
maturity as a reason for increased interest.
Table 4-3. Main Reasons for Increased Interest in the Military AmongYoung Men and Women
Men Women
LifeChange in life 13 12Getting older 7 3Circumstances unsatisfactory 4 3Scholastic frustration 2 2Increased obligations 2 2
Money/FinancesMoney for college 23 27Money 6 5
JobTraining 15 9Military provides job 10 6Dissatisfied with current job 1 0
Saw/TalkedTalk with military 8 12Recruiter contacts 6 9Talk with non-military 4 6Advertising 3 3News/world events 1 1
Right Thing to Do 6 7
Note: The population reported in this table includes 16-21 year-old youth with no more than twoyears of postsecondary education residing within the 48 contiguous United States, who saidtheir interest in military service had increased in the past year.
Source: 1996 - 1999 YATS

Chapter Four
4-9
Reasons for Not Enlistingin the Military
In the YATS interview, respondents are alsoasked to enumerate any reasons they might havefor not enlisting in the military:9
What is the main reason you wouldnot consider enlisting in the militaryservice? (Any other reasons?)
The question is open-ended (interviewers do notread the response categories), and multipleresponses are encouraged.
Reasons Not to Enlist. Table 4-4 shows thepercent of youth offering various reasons for notenlisting. Some of the categories merit anexplanation:
• “Military lifestyle” includes any responsethat refers to objectionable activities orlifestyles that youth might associate withthe military (e.g., “The military is tooregimented,” “I don’t want to be yelled atall the time”). It also includes anycomment on the respondent’s own lifestylethat might conflict with being in the military(e.g., “I want to be able to take offwhenever I want”).
• “Other career interests” is coded if therespondent mentions any work-relatedactivity or plan that presumably conflictswith entering the military (e.g., “I have ajob,” “My training at Lincoln Institutebegins next month”).
• “Threat to life” is coded for any mention ofdanger or hazards associated with militaryservice.
9 This question is asked of those in the half-sample who were
selected to provide reasons for joining.
• “Family obligations” is coded if respondentmentions family relationships as a reasonfor not joining (e.g., “I have ason/daughter,” “I got married,” “Myparents are ill”).
• “Education” is coded is the respondentmentions conflicting educational (asopposed to job training) plans.
As indicated in Table 4-4, objections to militarylifestyle represent the most common reason not toenlist. Other career interests, family obligations,the length of commitment, or hazards associatedwith military service, are also frequentlymentioned as reasons for not joining. Relativelyfew youth mention educational plans or activitiesthat preclude military service. Few mentionhealth problems or suggest they would not bequalified. Few mention negative publicitynewsstoriesin response to this question. Fewsuggest that military pay is inadequate or that theycould get more money in a civilian job (“Pay”).
The last row in the table presents the averagenumber of reasons given for not enlisting perrespondent. The fact that all averages are lessthan one means that not all youth providedreasons for not enlisting. The modal number ofreasons given was one but some youth providedmultiple reasons and some youth did not respond.The observed variability in response rates isreasonable. The average number of reasonsgiven is less for men and women with positivepropensity than those with negative propensity, asexpected.
Men and Women. Table 4-4 shows the percentof men and women mentioning different reasonsfor not entering the military. Nearly one-fifth ofmen and one-quarter of women provide aresponse associated with a distaste for perceivedmilitary lifestyle. Many youth also cite dangerassociated with military service, or the length ofcommitment associated with enlistment (evenyouth who have very little knowledge of militaryservice seem aware that enlistment typicallyrequires a 4-year commitment). Some mention
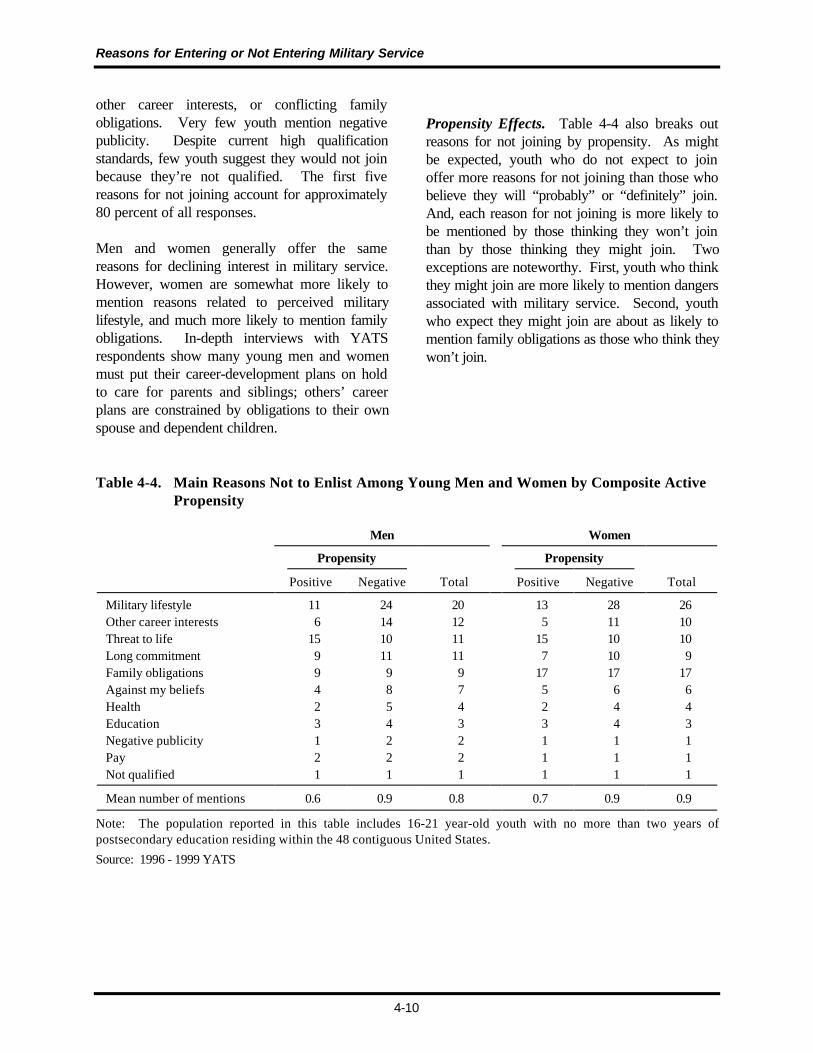
Reasons for Entering or Not Entering Military Service
4-10
other career interests, or conflicting familyobligations. Very few youth mention negativepublicity. Despite current high qualificationstandards, few youth suggest they would not joinbecause they’re not qualified. The first fivereasons for not joining account for approximately80 percent of all responses.
Men and women generally offer the samereasons for declining interest in military service.However, women are somewhat more likely tomention reasons related to perceived militarylifestyle, and much more likely to mention familyobligations. In-depth interviews with YATSrespondents show many young men and womenmust put their career-development plans on holdto care for parents and siblings; others’ careerplans are constrained by obligations to their ownspouse and dependent children.
Propensity Effects. Table 4-4 also breaks outreasons for not joining by propensity. As mightbe expected, youth who do not expect to joinoffer more reasons for not joining than those whobelieve they will “probably” or “definitely” join.And, each reason for not joining is more likely tobe mentioned by those thinking they won’t jointhan by those thinking they might join. Twoexceptions are noteworthy. First, youth who thinkthey might join are more likely to mention dangersassociated with military service. Second, youthwho expect they might join are about as likely tomention family obligations as those who think theywon’t join.
Table 4-4. Main Reasons Not to Enlist Among Young Men and Women by Composite ActivePropensity
Men Women
Propensity Propensity
Positive Negative Total Positive Negative Total
Military lifestyle 11 24 20 13 28 26Other career interests 6 14 12 5 11 10Threat to life 15 10 11 15 10 10Long commitment 9 11 11 7 10 9Family obligations 9 9 9 17 17 17Against my beliefs 4 8 7 5 6 6Health 2 5 4 2 4 4Education 3 4 3 3 4 3Negative publicity 1 2 2 1 1 1Pay 2 2 2 1 1 1Not qualified 1 1 1 1 1 1
Mean number of mentions 0.6 0.9 0.8 0.7 0.9 0.9
Note: The population reported in this table includes 16-21 year-old youth with no more than two years ofpostsecondary education residing within the 48 contiguous United States.
Source: 1996 - 1999 YATS

Chapter Four
4-11
Race/Ethnicity. Table 4-5 presents reasons notto enlist for White (not Hispanic), Black (notHispanic), and Hispanic men and women. Whitesare more likely than minorities to mention othercareer interests and to object to the longcommitment required for military service. Asmight be expected among a population that haswitnessed violence, Blacks are more likely tomention hazards associated with military service.Black men are less likely to mention family
obligations, more likely to say military service isagainst their beliefs.
As might be expected in a culture that places ahigh value on family ties, Hispanic men andwomen are more likely to mention familyobligations. Hispanic men are less likely tomention objections concerning the militarylifestyle.
Table 4-5. Main Reasons Not to Enlist Among Young Men and Women by Race/Ethnicity
Men WomenRace/Ethnicity Race/Ethnicity
White Black Hispanic White Black Hispanic
Military lifestyle 22 21 15 26 26 24Other career interests 14 7 8 12 6 6Threat to life 10 17 11 9 15 11Long commitment 13 6 11 10 7 8Family obligations 8 6 14 16 12 21Against my beliefs 6 9 6 6 7 5Health 4 2 2 5 2 4Education 4 3 3 4 3 2Negative publicity 2 1 2 1 1 2Pay 2 2 1 1 1 0Not qualified 1 0 1 1 1 1
Mean number of mentions 0.8 0.7 0.8 0.9 0.8 0.9
Note: The population reported in this table includes 16-21 year-old youth with no more than two years ofpostsecondary education residing within the 48 contiguous United States.
Source: 1996 - 1999 YATS
School Status. Generally, high school seniorsprovide the same reasons for not joining as dohigh school graduates who have not gone on tocollege. Thus, for both seniors and graduates, thepercent offering a particular reason for not joiningis approximately the same as that shown in the“Total” columns of Table 4-4. There are,however, a few exceptions:
• Seniors are more likely than graduates tomention other career interests (13 vs. 10percent among men; 11 vs. 6 percentamong women), or education plans (5 vs. 2
percent among men; 5 vs. 1 percent amongwomen).
• Seniors are less likely than graduates tomention family obligations (7 vs. 11 percentamong men; 11 vs. 26 percent amongwomen).
• Male seniors are less likely than graduatesto mention military lifestyle (19 vs. 25percent) or to say they are not qualified(0.4 vs. 2 percent).
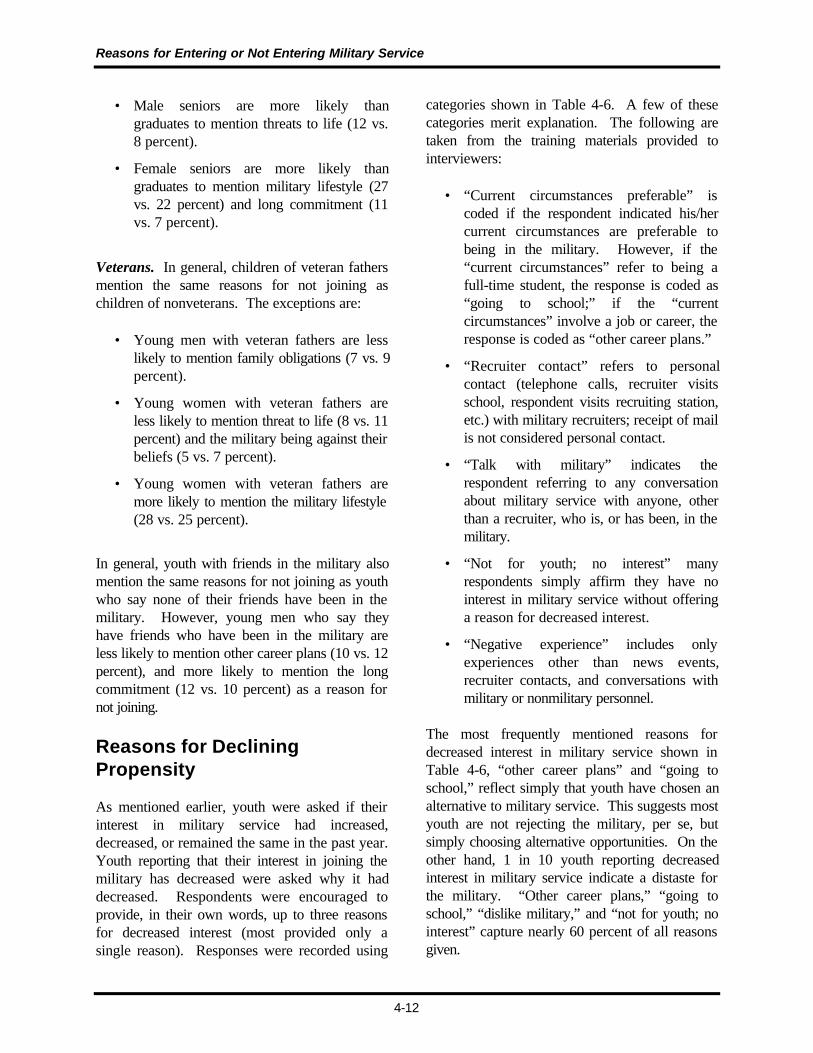
Reasons for Entering or Not Entering Military Service
4-12
• Male seniors are more likely thangraduates to mention threats to life (12 vs.8 percent).
• Female seniors are more likely thangraduates to mention military lifestyle (27vs. 22 percent) and long commitment (11vs. 7 percent).
Veterans. In general, children of veteran fathersmention the same reasons for not joining aschildren of nonveterans. The exceptions are:
• Young men with veteran fathers are lesslikely to mention family obligations (7 vs. 9percent).
• Young women with veteran fathers areless likely to mention threat to life (8 vs. 11percent) and the military being against theirbeliefs (5 vs. 7 percent).
• Young women with veteran fathers aremore likely to mention the military lifestyle(28 vs. 25 percent).
In general, youth with friends in the military alsomention the same reasons for not joining as youthwho say none of their friends have been in themilitary. However, young men who say theyhave friends who have been in the military areless likely to mention other career plans (10 vs. 12percent), and more likely to mention the longcommitment (12 vs. 10 percent) as a reason fornot joining.
Reasons for DecliningPropensity
As mentioned earlier, youth were asked if theirinterest in military service had increased,decreased, or remained the same in the past year.Youth reporting that their interest in joining themilitary has decreased were asked why it haddecreased. Respondents were encouraged toprovide, in their own words, up to three reasonsfor decreased interest (most provided only asingle reason). Responses were recorded using
categories shown in Table 4-6. A few of thesecategories merit explanation. The following aretaken from the training materials provided tointerviewers:
• “Current circumstances preferable” iscoded if the respondent indicated his/hercurrent circumstances are preferable tobeing in the military. However, if the“current circumstances” refer to being afull-time student, the response is coded as“going to school;” if the “currentcircumstances” involve a job or career, theresponse is coded as “other career plans.”
• “Recruiter contact” refers to personalcontact (telephone calls, recruiter visitsschool, respondent visits recruiting station,etc.) with military recruiters; receipt of mailis not considered personal contact.
• “Talk with military” indicates therespondent referring to any conversationabout military service with anyone, otherthan a recruiter, who is, or has been, in themilitary.
• “Not for youth; no interest”manyrespondents simply affirm they have nointerest in military service without offeringa reason for decreased interest.
• “Negative experience” includes onlyexperiences other than news events,recruiter contacts, and conversations withmilitary or nonmilitary personnel.
The most frequently mentioned reasons fordecreased interest in military service shown inTable 4-6, “other career plans” and “going toschool,” reflect simply that youth have chosen analternative to military service. This suggests mostyouth are not rejecting the military, per se, butsimply choosing alternative opportunities. On theother hand, 1 in 10 youth reporting decreasedinterest in military service indicate a distaste forthe military. “Other career plans,” “going toschool,” “dislike military,” and “not for youth; nointerest” capture nearly 60 percent of all reasonsgiven.

Chapter Four
4-13
It is useful to compare the “Saw/Talked” sectionsof Table 4-3, “Main Reasons for IncreasedInterest” and Table 4-6, “Main Reasons forDecreased Interest.” Conversations withrecruiters, persons who have been in the military,and persons who have not been in the military arecited as reasons for both increased and decreasedinterest in military service. Fortunately, the neteffect is positivethese conversations are moreoften cited as reasons for increased than fordecreased interest. Conversations with veteransand military members other than recruiters are
more frequently cited as reasons for changinginterest than conversations with recruiters.
In contrast, news and world events seem to bemore frequently cited as reasons for decreasedinterest than as reasons for increased interest.Responses to other YATS questions (notpresented in this report) indicate that militaryinvolvement in foreign countries, such as Somalia,Haiti, and Bosnia, tends to reduce interest inmilitary service.
Table 4-6. Main Reasons for Decreased Interest in the MilitaryAmong Young Men and Women
Men Women
LifeOther Career Plans 20 19Going to School 16 13Current Circumstances Preferable 7 8Employed 7 3Increased Obligation 4 10Getting Older/More Mature 2 1
Saw/TalkedTalk with Military 4 4News/World Events 2 2Recruiter Contacts 2 2Talk with Non-Military 1 1
MilitaryDislike Military 10 9Not for Youth 9 11Not Qualified 5 3Negative Experience 3 4Danger 2 2Downsizing 1 0Base Closings 0 0
Note: The population reported in this table includes 16-21 year-old youth with nomore than two years of postsecondary education residing within the 48 contiguousUnited States.
Source: 1996 - 1999 YATS

Reasons for Entering or Not Entering Military Service
4-14
Summary
This chapter examined reasons given by youth forentering military service and for not enteringmilitary service through two types of questions:direct questions asking about reasons for joiningand not joining, and questions asking aboutreasons for increased or decreased interest inmilitary service. The information we get fromthese slightly different perspectives overlaps.
Frequently mentioned reasons for joining includeboth tangible (educational funding, job training,pay) and intangible (duty to country, discipline,self-esteem) reasons. Youth interested in militaryservice offer more reasons for joining than thosenot stating they plan to join. In general, thereasons for joining do not differ by segments ofthe youth population. However, these segmentsdo show differences in the frequency of reasonsmentioned. Most group differences are bothpredictable and subtle. For example, somewhatmore women (37 percent) than men (32 percent)mention money for education as a reason forjoining. High school seniors are more likely thanhigh school graduates who have not gone tocollege to mention duty to their country;conversely, high school graduates who have notgone to college are more likely to mention jobsecurity, retirement benefits, and travel.
How often specific reasons for joining arementioned by youth has changed in the pastseveral years. From 1991 through 1995, thepercent mentioning money for educationincreased. Mentions of duty to country havedecreased. Mentions of job training have beenrelatively constant among men since 1993, butincreased until 1998 among women.
Some of the reasons for increased interest inmilitary service, such as money for education andjob training, are similar to those mentioned asreasons for joining. In addition, some youthmention communications as the basis forincreased interest: conversations with peoplewho are, or have been, in the military, recruitercontact, conversations with people who have
never been in the military, and militaryadvertising. Youth also mention changingcircumstances, such as difficulty in school, asreasons for increased interest in military service.
When examining reasons for not entering militaryservice, the perceived military lifestyle is thereason most often mentioned by youth. Thesecomments include any activities that youth mayassociate with being in the military (e.g., “tooregimented;” “I don’t want to get yelled at all thetime.”) or comments on their own lifestyle that isinconsistent with their perception of the military(e.g., “I want to be able to take off whenever Iwant.”). Youth also mention the length ofcommitment (most seem to recognize 4 years asa normal tour of duty) or threat to life.
Many youth mention conflicting interests, ratherthan something objectionable about the militaryper se. They may, for example, mention theyhave a job they like. Some mention familyobligations (e.g., “My mother is ill;” “I gotmarried.”). Very few youth say they are notqualified.
Youth from different race/ethnic groups differ inthe frequency with which they mention differentreasons for joining. Whites are more likely thanminorities to mention other career interests, or toobject to the length of commitment. Blacks aremore likely to mention threat to life or to say thatkilling is against their beliefs; conversely, they areless likely to mention family obligations. Hispanicmen and women are more likely to mention familyobligations, while Hispanic men are less likely toobject to the military lifestyle.
Reasons for decreased interest in military service,to a large degree, mirror reasons offered for notjoining. As with reasons for joining,communications play a role:
• Some youth mention talking to people whoare or have been in the military as a reasonfor decreased interest. However, thenumber who mention such conversations asa reason for decreased interest is less than

Chapter Four
4-15
the number mentioned as a reason forincreased interest. Thus, conversationswith military personnel have a net positiveeffect. The same holds true for talking to arecruiter.
• Some youth mention news events as areason for decreased interest. The numberwho mention news events as a reason fordecreased interest is greater than thenumber mentioned as a reason forincreased interest. Thus, news eventshave a net negative effect.


5-1
5. MILITARY ADVERTISING AWARENESS
Introduction
Today’s challenges facing recruiting require theDepartment of Defense to find new ways toattract young people into the U.S. military. Thetotal recruiting goal for all four Services remainsover 200,000 per year. For fiscal year (FY)1999, the Army missed its recruiting goal of74,500 by 8 percent (approximately 6,300) andthe Air Force was 5 percent (approximately1,700) short of its goal of 32,700. In FY 1998,the Navy missed its annual recruiting goal by 12percent. These shortfalls are a result of acombination of factors that include a lucrativejob market, increased college attendance, anddecreased retention of members already in themilitary (decreased retention leads to higherrecruiting goals). In order for military recruitersto achieve their recruiting missions, Serviceadvertising campaigns must be well-researchedand designed to attract high-quality youth. Theseadvertising campaigns contain several keyelements, including Service slogans, to attract theattention of qualified youth and get them toconsider the military as a career.
Overview
In this chapter, advertising awareness for eachService (Army, Navy, Marine Corps, Air Force,and Coast Guard) is examined. The chapterfocuses on demographic correlates of advertisingawareness followed by recent trends inadvertising awareness and slogan recognition. In1993, YATS advertising awareness questionswere changed to collect more detailed responses.Prior to 1993, respondents were not asked todistinguish between active and Reserve/NationalGuard advertising. As a result, advertisingawareness data collected since 1993 are notcomparable to the data collected in previousyears. Demographic correlates of advertisingawareness that appear in the tables representaggregated YATS data from 1993 to 1999.Trends in advertising awareness are presented for1993 to 1999. Slogan recognition questions have
not changed, and trends in slogan recognition arepresented for 1990 to 1999.
Finally, previous research has shown thatpersons aware of Service advertising are morelikely to contact a military recruiter than personsunaware of this advertising. Accordingly, therelationship between advertising awareness andrecruiter contact is discussed at the end of thischapter.
Using the Be All You Can Be theme, one of theadvertising industry’s most recognized slogans,Army advertising has continually evolved sincethe 1970’s. Various print, radio and televisionads have targeted subjects such as civilian careerrelevance and money for college, while sellingintangible benefits such as leadership, personalfreedom and individual growth. This advertisingportrays the Army as a high-tech, exciting placeto learn valuable job skills, do an important job,grow as a person, and to become “all you canbe.”
The Navy has always promoted traditionalbenefits such as preparation for the future,money for college, hi-tech skill training, and theadventure of travel to exotic ports of call. Thesebenefits were most recently promoted along withthe Navy’s core values of Honor, Courage andCommitment with the Let the Journey Beginadvertising campaign. Secondary benefits ofpersonal growth and teamwork are alsoemphasized in the campaign.
Aim High advertising means that youth, injoining the Air Force, can achieve their highestpotential through the Air Force’s training andeducation programs and through their qualitylifestyle. Air Force advertising grew out of a“whole person” philosophy, that the Air Forcedevelops people mentally, physically, andprofessionally.
Marine Corps advertising builds on the Marinesproud heritage as an elite fighting force. Current

Military Advertising Awareness
5-2
advertising stresses the permanent strengtheningof character resulting from Marine training.
Coast Guard advertising has generallyemphasized its’ humanitarian mission. In the late80’s and early 90’s, the Coast Guard used theslogan Be Part of the Action. Consistent withthis slogan and the Service mission, theadvertising program executions emphasized theeveryday excitement of serving in the CoastGuard. In the mid-90’s, Coast Guard advertisingadopted a new theme lineJobs ThatMatterwhich presented the humanitarianmission in a different perspective. The Jobs ThatMatter advertising executions emphasized the
idea of doing a meaningful job that is rewardingto the individual and to the country.
Figure 5-1 below displays the advertisingbudgets for each of the Services and the JointRecruiting Advertising Program (JRAP) forFiscal Years (FY) 1990-2001. (The FY 2001figure is a projected estimate.) The Army budgetis much larger than that of any other Service.Army and Navy budgets have changeddramatically in the last decade. The Air Forcebudget increased dramatically during FY 99because it started using television advertising forthe first time.
Figure 5-1. Service Advertising Budgets
0
20
40
60
80
100
120
90 91 92 93 94 95 96 97 98 99 00 01
Fiscal Year
($M) Army
Navy JRAP
Marine Corps
Air Force
Note: Constant FY 1999 dollarsSource: Accession Policy [OASD (FMP)]

Chapter Five
5-3
Advertising Awareness
YATS Measures
Questions about military advertising have beenmodified periodically to meet the needs of DoDand Service advertising managers. Since 1990,we have asked:
Within the past year, do you recallseeing or hearing any advertising thatencouraged people to enlist in one ormore of the Services?
Those who responded affirmatively were askedfollow-up questions:
For which military Services did yousee this kind of advertising? (Anyother Services?)
Respondents who were able to name a Servicewhose advertising they recalled were also askedwhether they recalled other Services. Since1993, response categories to this question havedistinguished between advertising for active dutyservice, and service in the Reserve or NationalGuard. For example, a respondent who said heor she had seen an Army advertisement would beasked whether the advertising was for the active
Army, the Army Reserves, or the Army NationalGuard. For respondents who could not recall thespecific Army advertising component, theirresponse was recorded as “Don’t Know SpecificArmy Service.”
Awareness of Active/ReserveAdvertising
Table 5-1 shows Service advertising awarenessby gender defined as recall of specific Serviceadvertising. For example, 36 percent of youngmen (16-24 years-old) recalled seeing or hearingactive Army advertising within the past yearcompared to 26 percent of young women. Ingeneral, advertising awareness is higher foractive Service advertising than Reserve orNational Guard advertising. However,awareness of Army Reserve advertising is twicethe level of Army National Guard and nearly asgreat as active. Awareness is highest for Armyand Marine Corps advertising, lower for Navyand Air Force advertising. Coast Guardadvertising recall is much lower than any of theother Services. Differences in recall rates amongmen and women are significant for activeadvertising only; rates are similar for Reserveand National Guard advertising.

Military Advertising Awareness
5-4
Table 5-1. Service Advertising Awareness, by Component and Gender
Men Women
ArmyActive 36 26Reserve 29 27National Guard 15 14Don’t Know 13 16
NavyActive 27 16Reserve 11 10Don’t Know 9 10
Marine CorpsActive 34 22Don’t Know 11 11
Air ForceActive 21 12Reserve 7 5National Guard 5 4Don’t Know 8 7
Coast GuardActive 6 3
Reserve 3 2
Don’t Know 2 2
Note: The population reported in this table includes all 16-24 year-old youth.Source: 1993 – 1999 YATS

Chapter Five
5-5
Demographic Correlates ofAdvertising Awareness
Age. Figure 5-2 displays active Serviceadvertising awareness by age for men. Army andMarine Corps advertising awareness increases as
age increases. Awareness of Navy and Air Forceadvertising recall appears to increase between theages of 16 and 20, but drops off for those over21. On the other hand, Coast Guard advertisingis relatively stable for all ages.
Figure 5-2. Active Service Advertising Awareness Among Men, by Age
0
5
10
15
20
25
30
35
40
45
16 17 18 19 20 21 22 23 24
Age
Per
cent
ArmyMarine CorpsNavy
Air Force
Coast Guard
Note: The population in this figure includes all 16-24 year-old youth.Source: 1993 – 1999 YATS
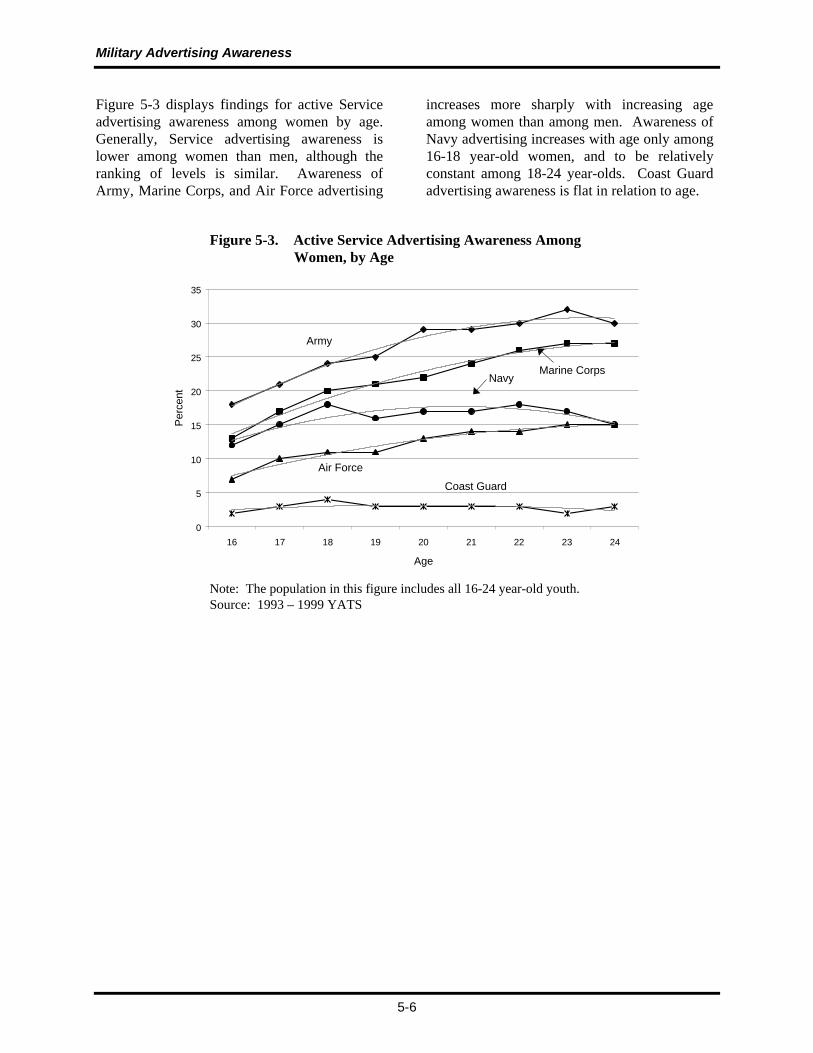
Military Advertising Awareness
5-6
Figure 5-3 displays findings for active Serviceadvertising awareness among women by age.Generally, Service advertising awareness islower among women than men, although theranking of levels is similar. Awareness ofArmy, Marine Corps, and Air Force advertising
increases more sharply with increasing ageamong women than among men. Awareness ofNavy advertising increases with age only among16-18 year-old women, and to be relativelyconstant among 18-24 year-olds. Coast Guardadvertising awareness is flat in relation to age.
Figure 5-3. Active Service Advertising Awareness AmongWomen, by Age
0
5
10
15
20
25
30
35
16 17 18 19 20 21 22 23 24
Age
Per
cent
Marine Corps
Coast Guard
Army
Navy
Air Force
Note: The population in this figure includes all 16-24 year-old youth.Source: 1993 – 1999 YATS
Chapter Five
5-7
Education. Table 5-2 shows recall of activeService advertising by education and gender. Itclassifies young men and women into studentand non-student groups. Advertising recallincreased as the level of education increased inboth the student and non-student groups. Recallis highest among young men and women who arecollege graduates, but are not currently students.
Higher awareness of advertising among moreeducated youth may be partly due to recruiterinfluence. Because of mental requirements ofmilitary service, recruiters seek out higheraptitude youth. This recruiter contact may leadto increased awareness of military advertisingthat youth are exposed to after contact.
Table 5-2. Active Service Advertising Awareness, by Education and Gender
Men WomenService
Education Army NavyMarineCorps
AirForce
CoastGuard Army Navy
MarineCorps
AirForce
CoastGuard
Students
HS Juniors 27 21 24 14 4 17 12 13 7 2HS Seniors 32 27 32 19 6 23 17 18 10 4Postsecondary 43 34 42 26 8 32 19 26 14 3
Non-StudentsDropouts 28 20 27 15 5 20 11 17 8 2HS Grads 36 26 34 20 6 27 14 20 12 3Some College 43 31 42 27 8 32 19 29 16 3BS+ 49 37 46 28 8 35 20 33 19 3
Note: The population reported in this table includes all 16-24 year-old youth.Source: 1993 – 1999 YATS

Military Advertising Awareness
5-8
Race/Ethnicity. Table 5-3 presents activeadvertising awareness by race/ethnicity andgender. Recall of active Service advertising ishigher among young White men than Blacks andHispanics. As noted above, recall of activeadvertising increases with education. Becauseeducational achievement among Blacks andHispanics is lower than among Whites and recallof active Service advertising is higher amongyoung White men than Blacks and Hispanics,one might suspect that race and ethnicdifferences are simply the result of educationaldifferences. By controlling for education, wecan determine if this is in fact true. As Table 5-3shows, White male high school seniors havehigher recall rates toward active advertising than
Black and Hispanic male high school seniors.This suggests that race/ethnic differences inrecall are not based solely on educationaldifferences. Cultural and socioeconomicvariables may account for some of thesedifferences. For example, Hispanics may watchless network television and members of lowersocioeconomic classes may read fewermagazines.
Table 5-3 also presents advertising awareness byrace/ethnicity for women. Patterns of awarenessby race/ethnicity are not consistent acrossService as they are for men. Race/ethnicdifferences in awareness among female highschool seniors are smaller than for men.
Table 5-3. Active Service Advertising Awareness, by Race/Ethnicity and Gender
Men WomenService
Race/Ethnicity Army NavyMarineCorps
AirForce
CoastGuard Army Navy
MarineCorps
AirForce
CoastGuard
White 40 31 38 24 7 28 18 24 14 3Black 29 20 26 14 4 26 14 17 9 2Hispanic 26 20 27 13 4 19 10 18 7 2Asian 28 22 23 15 4 24 14 16 9 3Indian 29 26 33 20 4 29 14 24 15 3
High School Seniors Only
White 37 30 34 21 6 24 17 19 10 4Black 25 18 22 11 5 21 18 15 8 2Hispanic 23 19 27 12 5 20 15 17 8 3
Note: The population reported in this table includes all 16-24 year-old youth.Source: 1993 – 1999 YATS

Chapter Five
5-9
Trends in Advertising Awareness
Figure 5-4 shows trends in active Serviceadvertising recall among men since 1993.Advertising awareness was highest for Armyadvertising, but only slightly higher thanawareness of advertising for the Marine Corps.Recall of Army advertising was 29 percent in1999 compared to 28 percent for the MarineCorps. Recall was lowest for Coast Guardadvertising. Recall rates have declined steadilyover this period for Army, Marine Corps, and Air
Force advertising. The largest drop has occurredfor Air Force advertising awareness - from 23percent in 1993 to 14 percent in 1999.Comparatively, Army recall dropped from 35 to29 percent and Marine Corps recall droppedfrom 35 to 28 percent over this same period.Navy and Coast Guard advertising awareness hasbeen relatively stable during this period and thus,the gap in awareness between Navy advertisingawareness and Army and Marine Corpsawareness is much smaller in 1999 than in 1993.
Figure 5-4. Trends in Active Service Advertising AwarenessAmong Men
0
5
10
15
20
25
30
35
40
93 94 95 96 97 98 99
Year
Per
cent
Army
Navy
Coast Guard
Marine Corps
Air Force
Note: The population reported in this figure includes 16-21 year-old youthwith no more than two years of postsecondary education residing within the 48contiguous United States.Source: 1993 – 1999 YATS
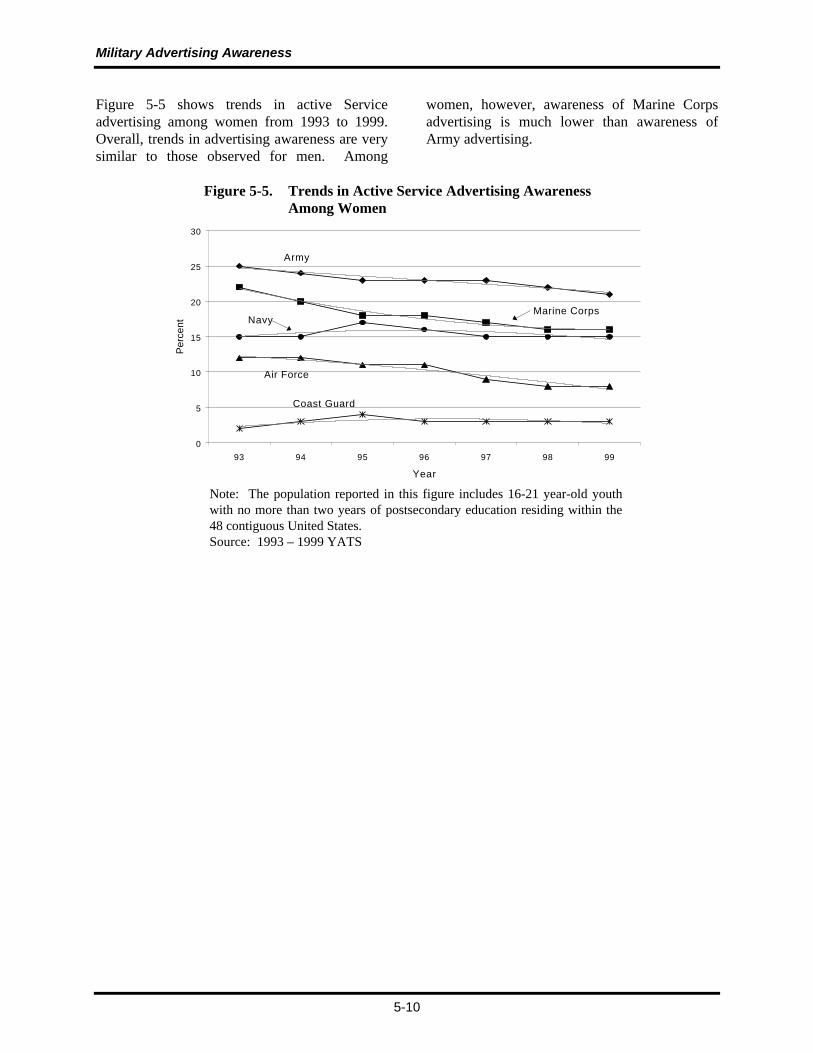
Military Advertising Awareness
5-10
Figure 5-5 shows trends in active Serviceadvertising among women from 1993 to 1999.Overall, trends in advertising awareness are verysimilar to those observed for men. Among
women, however, awareness of Marine Corpsadvertising is much lower than awareness ofArmy advertising.
Figure 5-5. Trends in Active Service Advertising AwarenessAmong Women
0
5
10
15
20
25
30
93 94 95 96 97 98 99
Year
Per
cent
Marine Corps
Coast Guard
Navy
Army
Air Force
Note: The population reported in this figure includes 16-21 year-old youthwith no more than two years of postsecondary education residing within the48 contiguous United States.Source: 1993 – 1999 YATS

Chapter Five
5-11
Joint Advertising Awareness
Youth were also surveyed about their awarenessof Joint advertising, military advertising thatmentions all of the Services in its advertisements.
YATS Measures
Youth are asked the following question duringthe YATS interview:
Do you recall seeing or hearing anyadvertising for the U.S. Armed Forcesin which all the Services wererepresented?
Unlike the previous question on advertisingrecall, this question is considered “aided,” since
the question specifically asks about Joint Serviceadvertising. Differences in aided and unaidedquestions should not be compared due tocognitive differences that are introduced basedon the way the questions are asked.
Trends in Joint AdvertisingAwareness
Figure 5-6 reveals that recall of Joint Serviceadvertising dropped sharply from 1993 to 1994,and decreased further between 1996 and 1998.In 1999, awareness of Joint Service advertisingdiffered by gender. Because of the sharperdecline in recall among young men prior to 1999,Joint Service advertising recall was at the samelevel in 1997 and 1998 for young men andwomen. However, recall increased from 13 to 17percent among women from 1998 to 1999 whileit remained at 13 percent among men.
Figure 5-6. Trends in Joint Advertising Awareness
0
5
10
15
20
25
30
35
93 94 95 96 97 98 99
Year
Per
cent
Men
Women
Note: The population reported in this figure includes 16-21 year-old youth withno more than two years of postsecondary education residing within the 48contiguous United States.Source: 1993 – 1999 YATS

Military Advertising Awareness
5-12
Trends in Slogan Recognition
Youth were also surveyed about their recognitionof Service advertising slogans – an integral partof an effective advertising campaign. One caveatabout the importance of slogan recognition is inorder. Although correct slogan recognition canbe an indicator of successful advertising, theprimary goal of military advertising is to createawareness and interest in military service, not toincrease slogan recognition. While high sloganrecognition may be an indicator of successfuladvertising, advertising should increaseawareness, interest, and enlistments to beefffective, whether or not high levels of sloganrecognition are achieved.
This section examines trends in sloganrecognition among men and women from 1990 to
1999 for each of the Services. Data in thesefigures represent responses from 16-21 year-oldyouth with no more than two years ofpostsecondary education who reside in the 48contiguous United States.
Table 5-4 displays advertising slogans and theService associated with each one by the years inwhich they appeared in the YATS survey and theadvertising campaigns of the Services. Three ofthe Services have introduced new slogans in theiradvertising campaigns since 1996Navy (Letthe Journey Begin), Marine Corps (The Changeis Forever), and Coast Guard (Jobs That Matter).The Joint Service Advertising program alsointroduced a new slogan, Make It Happen, in1995. The newest slogan is the Air ForceReserve slogan, Above and Beyond, that wasintroduced in 1999.
Table 5-4. Service Advertising Slogans: Years in Which Service Slogans Appeared in YATSSurvey and Service Advertising Campaigns
Years Appearing in...
Service Slogan YATS AdvertisingCampaigns
Army Be All You Can Be. 1987-1999 1980-1999Get an Edge on Life. 1990-1999 1989-1994
Navy It’s Not Just a Job. It’s an Adventure! 1987-1996 1976-1986You and the ____. Full Speed Ahead. 1990-1998 1990-1996You Are Tomorrow. You are the ___. 1990-1992 1988-1990Let the Journey Begin. 1996-1999 1996-1999
Marine Corps The Few. The Proud. 1987-1999 1987-1995We’re Looking For a Few Good Men. 1987-1991 1975-1987
1994-1997 1993The Change is Forever. 1998-1999 1998-1999
Air Force Aim High. 1987-1999 1980-1999
Coast Guard Be Part of the Action. 1989-1999 1987-1995Jobs That Matter. 1997-1999 1997-1999
Joint Service It’s a Great Place to Start. 1987-1992 1977-1988Opportunity is Waiting for You. 1989-1992 1988-1991Stand Up. Stand Out. 1990-1992 1990-1991Make It Happen. 1995-1999
Air Force Reserve It’s a Great Way to Serve. 1993-1998 1980s-1998Above and Beyond. 1999 1999
Army/Air National Guard Americans at Their Best. 1993-1998 1987-1995
Army National Guard You Can. 1997-1998
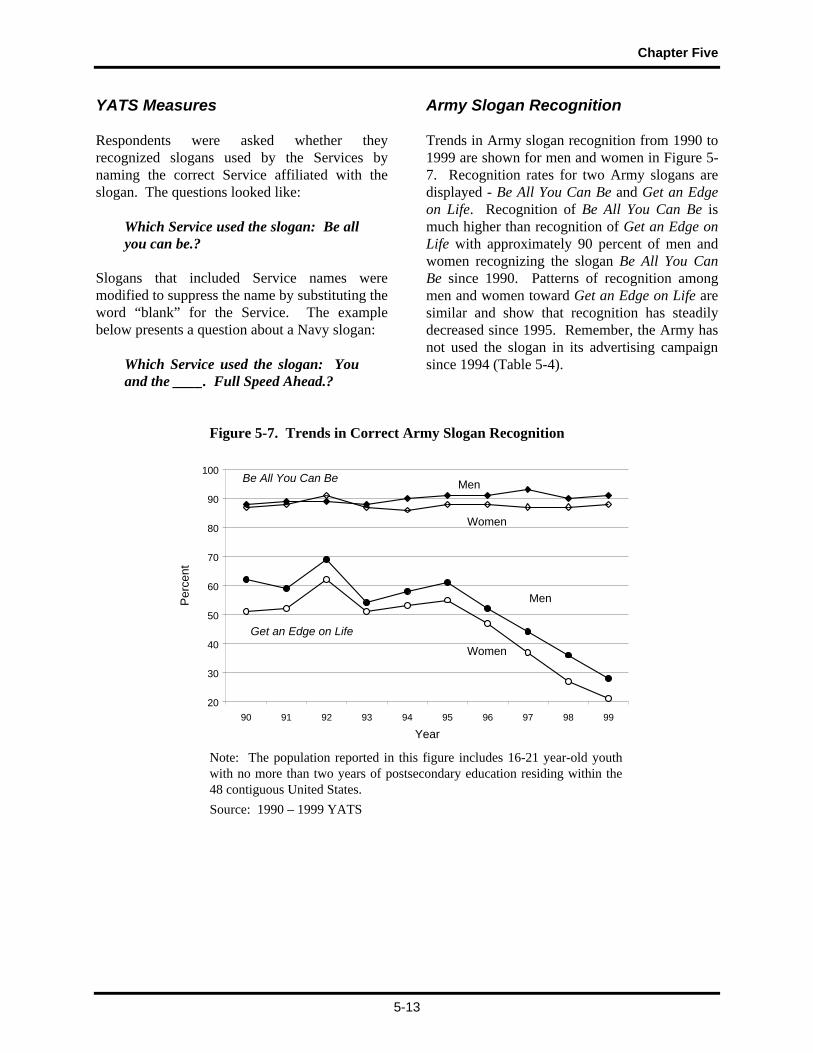
Chapter Five
5-13
YATS Measures
Respondents were asked whether theyrecognized slogans used by the Services bynaming the correct Service affiliated with theslogan. The questions looked like:
Which Service used the slogan: Be allyou can be.?
Slogans that included Service names weremodified to suppress the name by substituting theword “blank” for the Service. The examplebelow presents a question about a Navy slogan:
Which Service used the slogan: Youand the ____. Full Speed Ahead.?
Army Slogan Recognition
Trends in Army slogan recognition from 1990 to1999 are shown for men and women in Figure 5-7. Recognition rates for two Army slogans aredisplayed - Be All You Can Be and Get an Edgeon Life. Recognition of Be All You Can Be ismuch higher than recognition of Get an Edge onLife with approximately 90 percent of men andwomen recognizing the slogan Be All You CanBe since 1990. Patterns of recognition amongmen and women toward Get an Edge on Life aresimilar and show that recognition has steadilydecreased since 1995. Remember, the Army hasnot used the slogan in its advertising campaignsince 1994 (Table 5-4).
Figure 5-7. Trends in Correct Army Slogan Recognition
20
30
40
50
60
70
80
90
100
90 91 92 93 94 95 96 97 98 99
Year
Per
cent
Be All You Can Be
Get an Edge on Life
Men
Women
Men
Women
Note: The population reported in this figure includes 16-21 year-old youthwith no more than two years of postsecondary education residing within the48 contiguous United States.Source: 1990 – 1999 YATS

Military Advertising Awareness
5-14
Navy Slogan Recognition
Trends in Navy slogan recognition over the 10-year period are displayed for men and women inFigure 5-8. The figure shows recognition ratesfor three Navy slogans: Full Speed Ahead, It’sNot Just a Job, It’s an Adventure, and Let theJourney Begin. Recognition of Full SpeedAhead peaked around 1994. On the other hand,recognition of It’s Not Just a Job, It’s an
Adventure increased slightly through 1996 beforebeing replaced by the latest Navy slogan, Let theJourney Begin. Recognition of this latest Navyslogan is currently between levels displayed forFull Speed Ahead and It’s Not Just a Job, It’s anAdventure. The current trend indicates that itmay be the most recognizable Navy sloganwithin the next several years – since 1997, recallhas increased from 9 to 20 percent amongwomen and 19 to 36 percent among men.
Figure 5-8. Trends in Correct Navy Slogan Recognition
0
10
20
30
40
50
60
70
80
90
100
90 91 92 93 94 95 96 97 98 99
Year
Per
cent
Full Speed Ahead
Not Just a Job…An Adventure
Women
Men
Women
Let the Journey Begin
Men
Note: The population reported in this figure includes 16-21 year-old youthwith no more than two years of postsecondary education residing within the 48contiguous United States.Source: 1990 – 1999 YATS
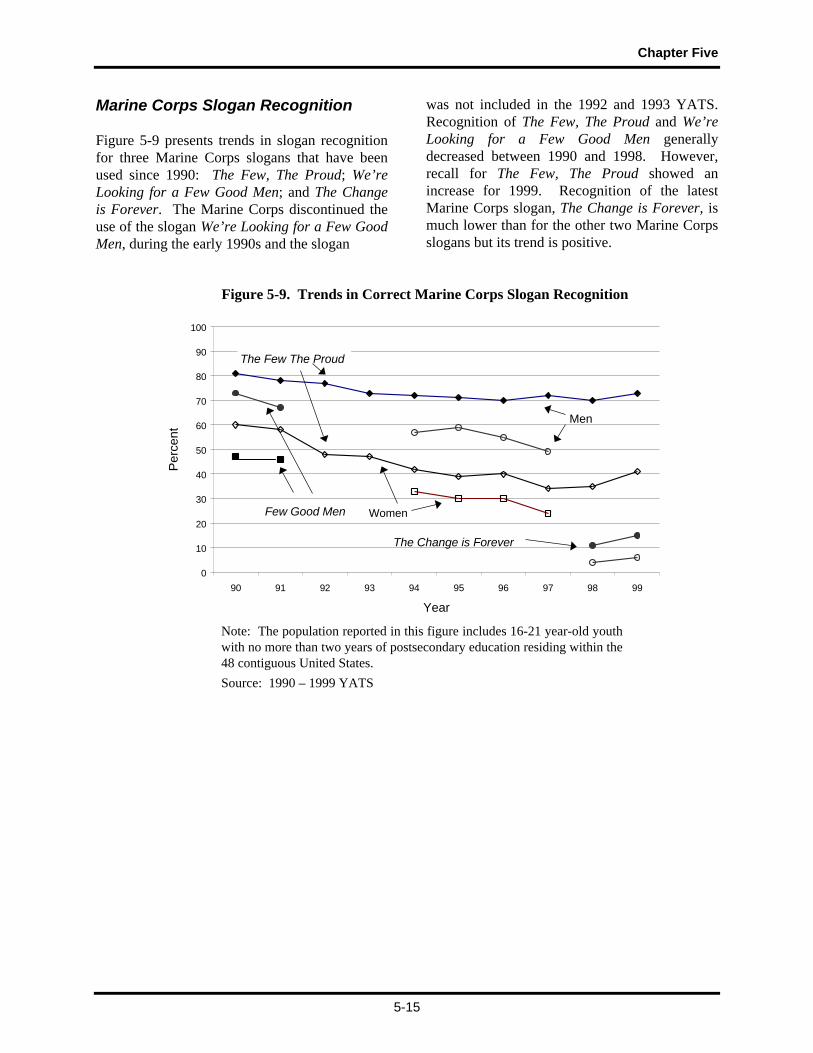
Chapter Five
5-15
Marine Corps Slogan Recognition
Figure 5-9 presents trends in slogan recognitionfor three Marine Corps slogans that have beenused since 1990: The Few, The Proud; We’reLooking for a Few Good Men; and The Changeis Forever. The Marine Corps discontinued theuse of the slogan We’re Looking for a Few GoodMen, during the early 1990s and the slogan
was not included in the 1992 and 1993 YATS.Recognition of The Few, The Proud and We’reLooking for a Few Good Men generallydecreased between 1990 and 1998. However,recall for The Few, The Proud showed anincrease for 1999. Recognition of the latestMarine Corps slogan, The Change is Forever, ismuch lower than for the other two Marine Corpsslogans but its trend is positive.
Figure 5-9. Trends in Correct Marine Corps Slogan Recognition
0
10
20
30
40
50
60
70
80
90
100
90 91 92 93 94 95 96 97 98 99
Year
Per
cent
The Few The Proud
Few Good Men
Men
Women
The Change is Forever
Note: The population reported in this figure includes 16-21 year-old youthwith no more than two years of postsecondary education residing within the48 contiguous United States.Source: 1990 – 1999 YATS
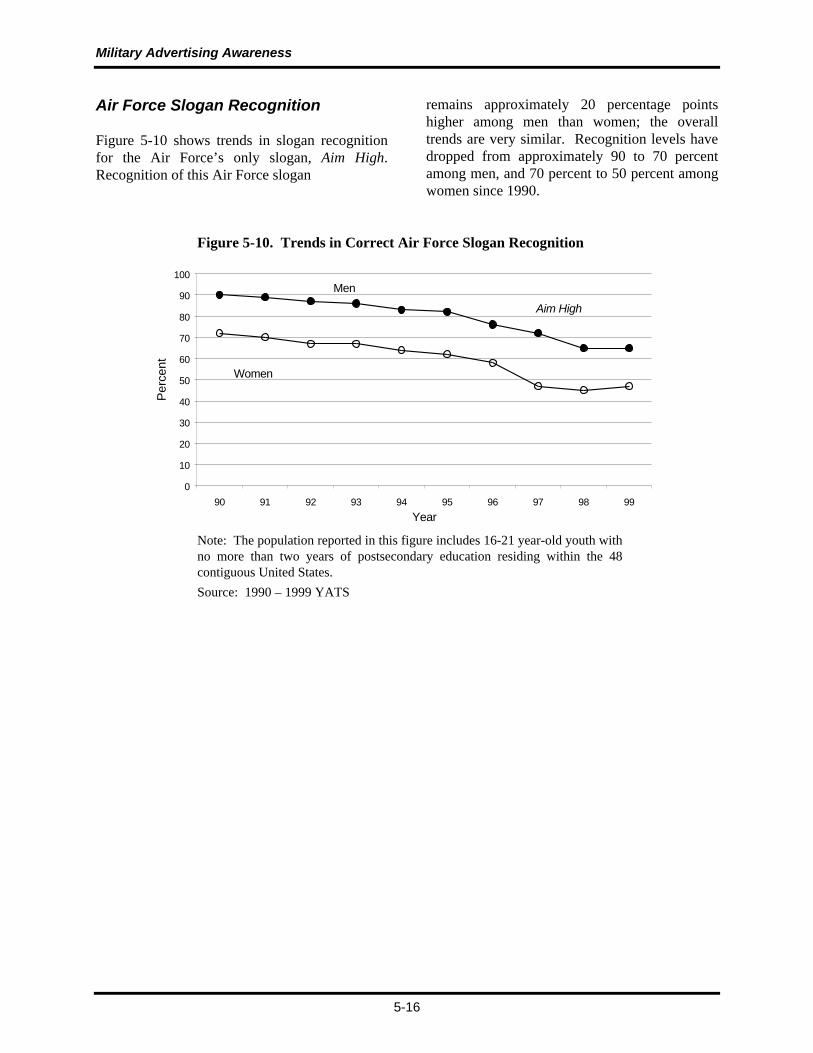
Military Advertising Awareness
5-16
Air Force Slogan Recognition
Figure 5-10 shows trends in slogan recognitionfor the Air Force’s only slogan, Aim High.Recognition of this Air Force slogan
remains approximately 20 percentage pointshigher among men than women; the overalltrends are very similar. Recognition levels havedropped from approximately 90 to 70 percentamong men, and 70 percent to 50 percent amongwomen since 1990.
Figure 5-10. Trends in Correct Air Force Slogan Recognition
0
10
20
30
40
50
60
70
80
90
100
90 91 92 93 94 95 96 97 98 99
Year
Per
cent
Aim High
Men
Women
Note: The population reported in this figure includes 16-21 year-old youth withno more than two years of postsecondary education residing within the 48contiguous United States.Source: 1990 – 1999 YATS
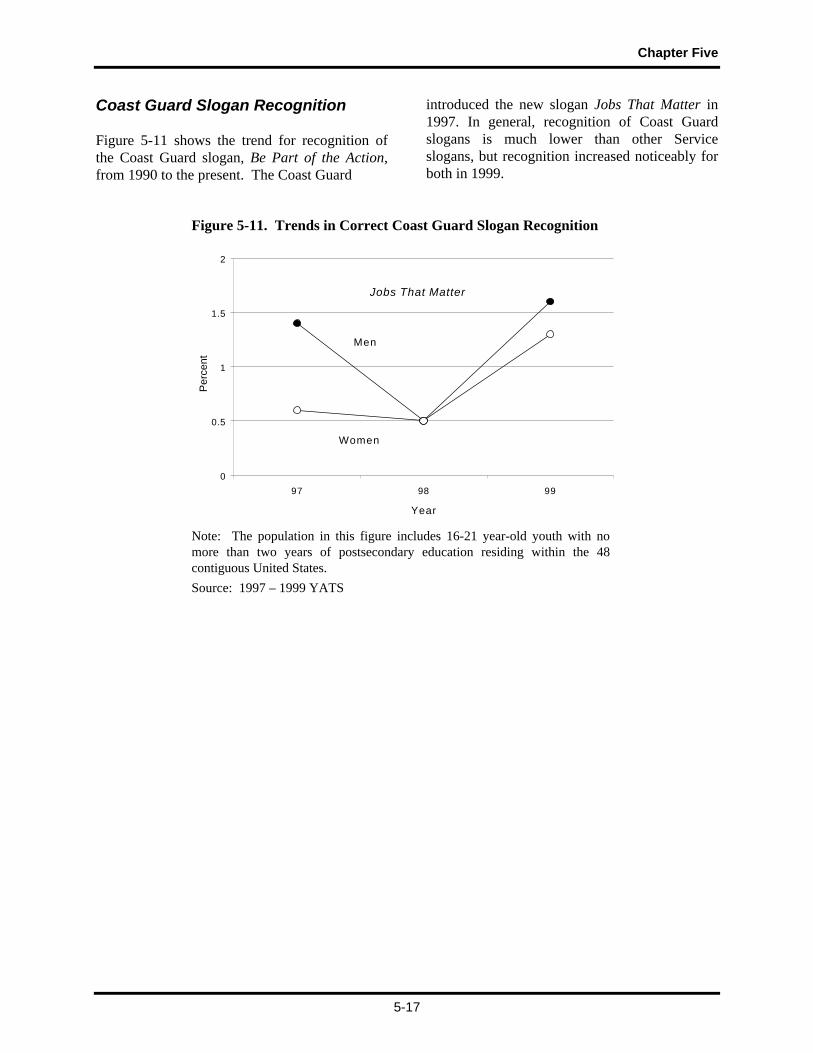
Chapter Five
5-17
Coast Guard Slogan Recognition
Figure 5-11 shows the trend for recognition ofthe Coast Guard slogan, Be Part of the Action,from 1990 to the present. The Coast Guard
introduced the new slogan Jobs That Matter in1997. In general, recognition of Coast Guardslogans is much lower than other Serviceslogans, but recognition increased noticeably forboth in 1999.
Figure 5-11. Trends in Correct Coast Guard Slogan Recognition
0
0.5
1
1.5
2
97 98 99
Year
Per
cent
Jobs That Matter
Men
Women
Note: The population in this figure includes 16-21 year-old youth with nomore than two years of postsecondary education residing within the 48contiguous United States.Source: 1997 – 1999 YATS

Military Advertising Awareness
5-18
Advertising Awareness andRecruiter Contact
YATS Measures
Since 1993, YATS respondents have been asked:
Within the past year, have you talkedto a military recruiter?
For those who had spoken to a military recruiterin the past year, the following questions wereasked:
What Service’s recruiter have youtalked to? (Any other Service’srecruiter?)
Table 5-5 displays recruiter contact rates bygeneral advertising awareness and Joint Serviceadvertising awareness. Percentages in the tablerepresent the number of youth who had talkedwith a recruiter in the previous year among thosewho did or did not recall military advertising.For example, of the young men who recalledmilitary advertising, 50 percent also had contactwith a military recruiter during the previous year.Similarly, 41 percent of the young men who didnot recall military advertising had contacted arecruiter over the previous year. Recruitercontact rates were significantly higher amongyoung men who recalled military advertisingthan among youth who did not. The differencewas even greater among young women. Thetable shows recruiter contact for Serviceadvertising as well as Joint Service advertising.
Table 5-5. Recruiter Contact by Advertising Awareness and Gender
Percent Contacting a Recruiter in the Past Year
Men Women
Any Military Advertising
Within the past year, do you recall seeing or hearingany advertising that encouraged people to enlist inone or more of the Services?
Yes 50 42No 41 27
Joint Service Advertising
Do you recall seeing or hearing any advertising for the U.S.Armed Forces in which all the Services were represented?
Yes 55 47No 47 38
Note: The population reported in this table includes 16-21 year-old youth with no more than two years of post-secondary education residing within the 48 contiguous United States.Source: 1993 – 1999 YATS
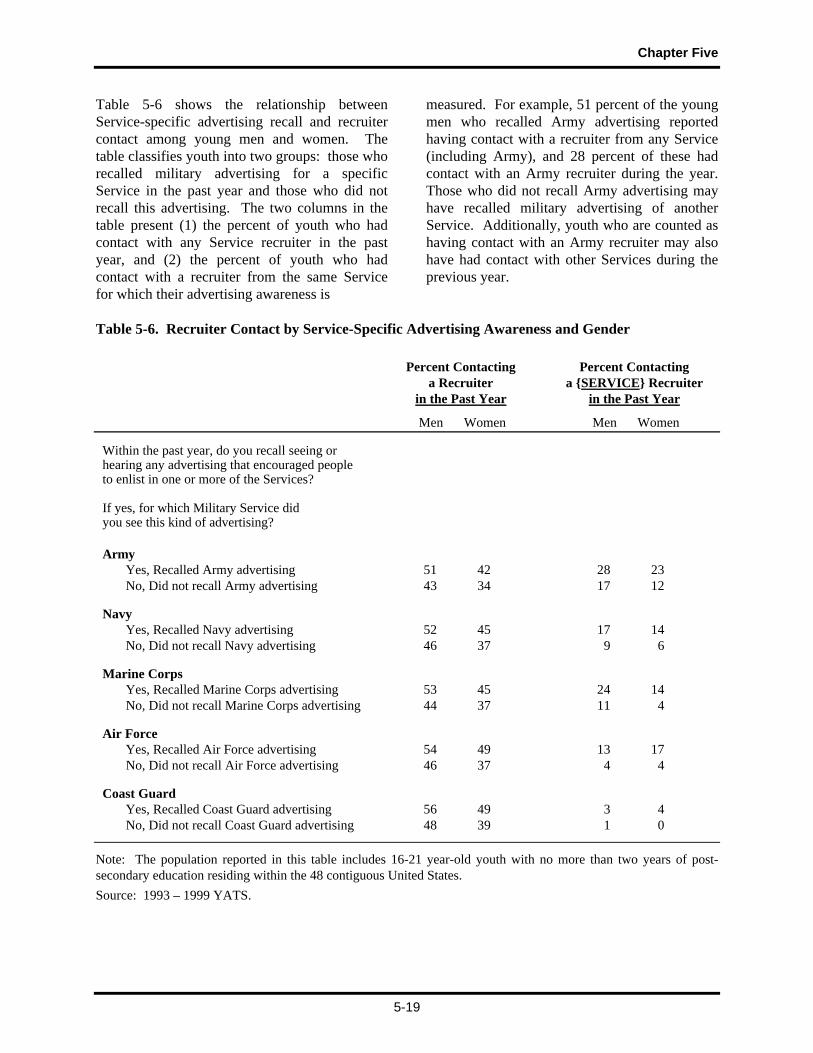
Chapter Five
5-19
Table 5-6 shows the relationship betweenService-specific advertising recall and recruitercontact among young men and women. Thetable classifies youth into two groups: those whorecalled military advertising for a specificService in the past year and those who did notrecall this advertising. The two columns in thetable present (1) the percent of youth who hadcontact with any Service recruiter in the pastyear, and (2) the percent of youth who hadcontact with a recruiter from the same Servicefor which their advertising awareness is
measured. For example, 51 percent of the youngmen who recalled Army advertising reportedhaving contact with a recruiter from any Service(including Army), and 28 percent of these hadcontact with an Army recruiter during the year.Those who did not recall Army advertising mayhave recalled military advertising of anotherService. Additionally, youth who are counted ashaving contact with an Army recruiter may alsohave had contact with other Services during theprevious year.
Table 5-6. Recruiter Contact by Service-Specific Advertising Awareness and Gender
Percent Contacting Percent Contactinga Recruiter a {SERVICE} Recruiter
in the Past Year in the Past Year
Men Women Men Women
Within the past year, do you recall seeing or hearing any advertising that encouraged people to enlist in one or more of the Services?
If yes, for which Military Service did you see this kind of advertising?
ArmyYes, Recalled Army advertising 51 42 28 23No, Did not recall Army advertising 43 34 17 12
NavyYes, Recalled Navy advertising 52 45 17 14No, Did not recall Navy advertising 46 37 9 6
Marine CorpsYes, Recalled Marine Corps advertising 53 45 24 14No, Did not recall Marine Corps advertising 44 37 11 4
Air ForceYes, Recalled Air Force advertising 54 49 13 17No, Did not recall Air Force advertising 46 37 4 4
Coast GuardYes, Recalled Coast Guard advertising 56 49 3 4No, Did not recall Coast Guard advertising 48 39 1 0
Note: The population reported in this table includes 16-21 year-old youth with no more than two years of post-secondary education residing within the 48 contiguous United States.Source: 1993 – 1999 YATS.

Military Advertising Awareness
5-20
In all cases, a significantly higher percentage ofyouth who recalled advertising for a specificService also had contact with a recruiter fromany Service compared with youth who did notrecall advertising for that specific Service. Therelationship between recalling a specificService’s advertising and contact with a recruiterfrom that Service is even stronger.
Findings substantiate that advertising awarenessand recruiter contact are related, but do not tellus which is the cause and which the effect. It ismost likely that recruiter contact and advertisingawareness affect one another. Recruiter contactheightens awareness of recruiting advertising.And advertising, by increasing knowledge andawareness of military opportunities, increases thelikelihood of recruiter contact.
Summary
The Services spend a great deal of time andmoney in developing advertising campaigns thatwill reach, persuade, and encourage youth toenlist in the military. YATS contains surveyquestions on recall of military advertising andrecognition of military slogans that may providevaluable feedback to personnel responsible forservice advertising campaigns.
Service advertising budgets are obviously a keyelement in producing effective advertisingcampaigns, and thus, advertising awarenessamong youth. In the past, the Army budget hasbeen much larger than the other Service budgets,although the Navy and Air Force have increasedtheir budgets significantly since 1997.Advertising awareness is highest for Army andMarine Corps active advertising, and recall ratesamong young men are significantly higher thanwomen. Awareness of active Service advertisingis higher than Reserve or National Guardadvertising, and twice as many youth recallArmy Reserve advertising compared to ArmyNational Guard advertising.
Advertising awareness was also correlated withcertain demographic characteristics:
• Army and Marine Corps advertisingawareness increases as age increases
• Recall of Service advertising increases aseducational attainment increases
• Recall is highest among youth who havealready earned a college degree
• Whites are generally more likely to recallactive Service advertising than Blacksor Hispanics
Trends in active Service advertising recall rateshave declined steadily for Army, Marine Corps,and Air Force advertising between 1993 and1998, however 1999 rates are more positive. Thelargest drop over the entire period occurred forAir Force advertising awareness. Overall trendsin advertising awareness are similar betweenmen and women with one exception: differencesin advertising awareness between Army andMarine Corps advertising are much smalleramong men than women.
YATS respondents were also asked if theyremembered hearing or seeing Joint Serviceadvertising−advertising which names eachService. Recall of Joint Service advertising hascontinued to drop since 1993. Men’s awarenessof Joint Service advertising was higher than thatof women between 1993 and 1996, but a largerdecline in recall among men between 1995 and1997 has recall at the same level for 1997 and1998. Recall of Joint Service advertising isactually higher among women than men for thefirst time ever in 1999.
Youth were also asked to identify slogans used inmilitary advertising campaigns during the YATSinterview. Correct recognition of Serviceslogans is higher among men than women, andthree slogans continue to be most often correctly

Chapter Five
5-21
identified by young men: Be All You Can Be(Army), Aim High (Air Force), and The Few. TheProud (Marine Corps). Be All You Can Be hasbeen recognized by approximately 9 of 10 youthsince 1990. Aim High was recognized by 90percent of men and 70 percent of women in1990, but recognition of the Air Force slogan hasdropped by 25 percentage points over the pastten years. In general, correct recognition ofMarine Corps, Air Force, and Coast Guardadvertising slogans has decreased since 1990,
while recognition of Navy slogans has increased.Recognition of the two Army slogans hasproduced mixed results. Recognition of Be AllYou Can Be has remained steady during the1990’s, but fewer youth now recognize the Armyslogan Get an Edge on Life.
Finally, recruiter contact continues to be stronglyrelated to advertising recall. Recruiter contactrates were significantly higher among youth whorecalled military advertising than those who didnot.

R-1
REFERENCES
Berkowitz, S., Achatz, M., and Perry, S. (1999). Career plans and military propensity of youngwomen: Interviews with 1997 Youth Attitude Tracking Study (YATS) respondents (DMDCNo. 2000-001). Arlington, VA: Defense Manpower Data Center.
Berkowitz, S., Perry, S., Giambo, P., and Wilson, M. (1997). Career plans and militarypropensity of young men: Interviews with 1995 Youth Attitude Tracking Study (YATS)respondents (DMDC No. 97-012). Arlington, VA: Defense Manpower Data Center.
Boyer, A. and Schmitz, E.S. (1996). Socio-demographics and military recruiting—the role ofveterans (Analysis Report 96-10). Millington, TN: United States Navy RecruitingCommand.
Current Population Survey [Electronic data file]. (1980). U.S. Bureau of the Census.
Gerald, Debra E. and Hussar, William J. (1997). Projections of educational statistics to 2008.Washington, DC: U.S. Department of Education, National Center for Educational Statistics.
Johnson, J. and Bachman, J.G. (1972). Youth in transition: Young men in military service. AnnArbor, MI: Institute for Social Research.
Lehnus, J.D. The influence of peers and elders on enlistment propensity. Presented at theInternational Military Testing Association. 1995: Toronto.
Orvis, B.R., Gahart, M.T., and Ludwig, A.K. (1992). Validity and usefulness of enlistmentintention information (R-3775-FMP) Santa Monica, CA: RAND.
Orvis, B.R., Sastry, N., and McDonald, L.L. (1996). Military recruiting outlook: Recent trendsin enlistment propensity and conversion of potential enlisted supply (MR-677-A/OSD).Santa Monica, CA: RAND.
Stone, B.M., Turner, K.L., and Wiggins, V.L. (1993). Population propensity measurementmodel: Final analysis report. Arlington, VA: Defense Manpower Data Center.
Survey of Recruit Socioeconomic Backgrounds [Electronic data file]. (1989). Office of theAssistant Secretary of Defense for Force Management Policy, Defense Manpower DataCenter, Washington, DC.
U.S. Bureau of the Census. (1996). Population projections of the United States by age, sex,race, and Hispanic origin: 1995 to 2050, Current Population Reports (P25-1130).Washington, DC: Author.
U.S. Department of Defense. (1998). Population representation in the Military Services: FiscalYear 1997. Washington, DC: Office of the Assistant Secretary of Defense, ForceManagement Policy.

R-2
U.S. Department of Education. National Center for Educational Statistics. (1999). Digest ofEducation Statistics, 1998 (NCES 1999-036). Washington, DC: Author.
Wilson, M.J., and Chu, A. (2000). The Fall 1999 YATS sample design, selection, and weightingreport (Contract No. MDA903-90-C-0236). Arlington, VA: Defense Manpower DataCenter.

Appendix A
Supplementary Data Tables for Chapter 2

A-1
Table A-1. Regional Distribution of the YATS Population(Supporting Data for Figure 2-3, p. 2-6)
Population in Millions
Race/Ethnicity Northeast North Central South West
White 3.841 6.959 7.128 4.198
Black 0.745 0.753 2.942 0.409
Hispanic 0.719 0.556 1.684 2.062
Other 0.309 0.379 0.454 0.673
Source: 1999 YATS
Table A-2. Population Trends, 18-19 Year-Olds(Supporting Data for Figure 2-4, p. 2-7)
Year
Gender 1984 1985 1986 1987 1988 1989 1990 1991 1992 1993
White 5,846 5,587 5,439 5,417 5,541 5,629 5,384 4,952 4,721 4,734
Black 1,137 1,094 1,059 1,054 1,059 1,097 1,108 1,061 1,025 1,016
Hispanic 718 721 737 765 817 870 890 874 878 898
Gender 1994 1995 1996 1997 1998 1999 2000 2001 2002 2003 2004
White 4,746 4,806 4,929 5,009 5,193 5,300 5,345 5,395 5,323 5,339 5,414
Black 1,019 1,047 1,080 1,106 1,160 1,175 1,175 1,186 1,172 1,180 1,206
Hispanic 934 966 1,007 1,046 1,093 1,150 1,183 1,211 1,230 1,253 1,298

A-2
Table A-3. Median Income, Men and Women 25 Years-Old and Over(Supporting Data for Figure 2-6, p. 2-9)
Year
GenderLess Than9th Grade
9-12 Grade ButNo Diploma
High SchoolGraduate
SomeCollege
Associate’sDegree
Bachelor’sDegree
Master’sDegree
ProfessionalDegree Doctorate
Men 19 25 31 36 38 49 62 85 76
Women 14 17 22 26 29 35 45 61 53
Note: In 1997 constant dollars. In 000’sSource: Digest of Education Statistics
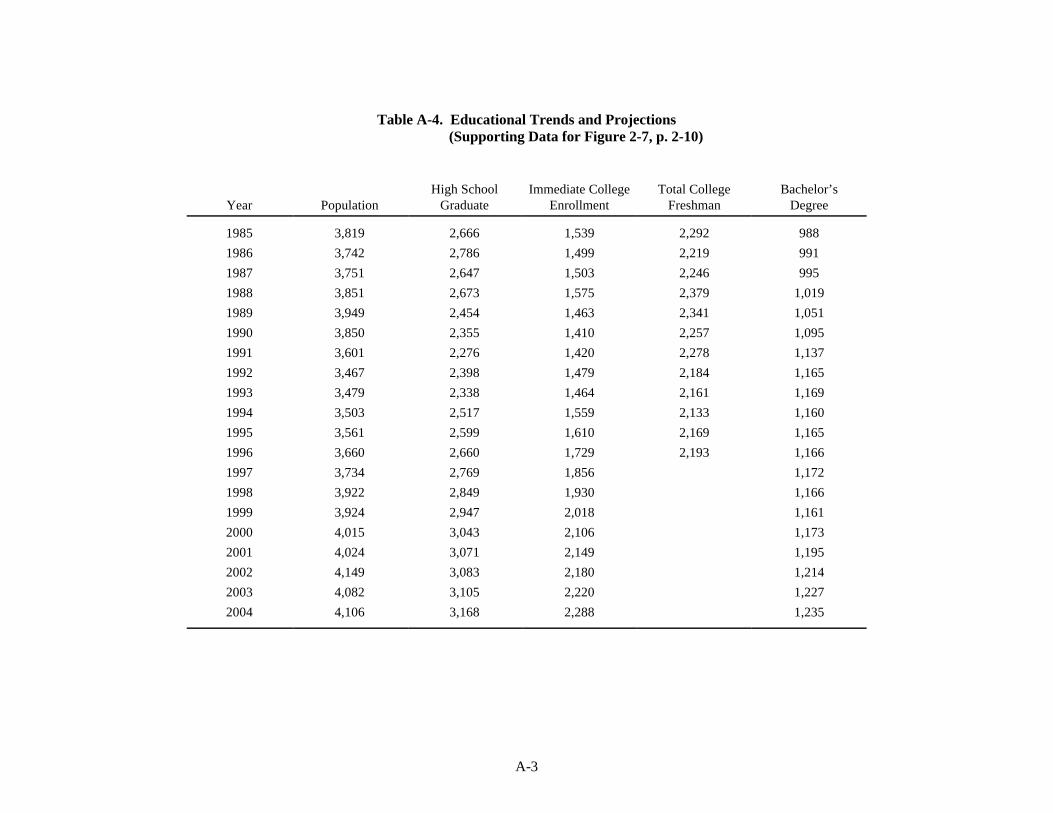
A-3
Table A-4. Educational Trends and Projections(Supporting Data for Figure 2-7, p. 2-10)
Year PopulationHigh School
GraduateImmediate College
EnrollmentTotal College
FreshmanBachelor’s
Degree
1985 3,819 2,666 1,539 2,292 9881986 3,742 2,786 1,499 2,219 9911987 3,751 2,647 1,503 2,246 9951988 3,851 2,673 1,575 2,379 1,0191989 3,949 2,454 1,463 2,341 1,0511990 3,850 2,355 1,410 2,257 1,0951991 3,601 2,276 1,420 2,278 1,1371992 3,467 2,398 1,479 2,184 1,1651993 3,479 2,338 1,464 2,161 1,1691994 3,503 2,517 1,559 2,133 1,1601995 3,561 2,599 1,610 2,169 1,1651996 3,660 2,660 1,729 2,193 1,1661997 3,734 2,769 1,856 1,1721998 3,922 2,849 1,930 1,1661999 3,924 2,947 2,018 1,1612000 4,015 3,043 2,106 1,1732001 4,024 3,071 2,149 1,1952002 4,149 3,083 2,180 1,2142003 4,082 3,105 2,220 1,2272004 4,106 3,168 2,288 1,235

A-4
Table A-5. Percent Unemployment Among 19-24 Year-Old High School Graduate Non-Students WhoDo Not Have Bachelor’s Degrees(Supporting Data for Figure 2-8, p. 2-13)
Year Men Women
1987 9 10
1988 8 9
1989 8 9
1990 10 10
1991 11 11
1992 10 10
1993 10 11
1994 9 11
1995 10 11
1996 10 11
1997 9 10
1998 7 9
1999 10 8

A-5
Table A-6. CPI Adjusted Median Weekly Earnings of19- to 24-Year-Old High School GraduateNon-Students Who Do Not Have Bachelor’sDegrees(Supporting Data for Figure 2-9, p. 2-13)
Year Men Women
1987 359 301
1988 358 289
1989 368 302
1990 349 299
1991 335 287
1992 325 279
1993 316 277
1994 330 286
1995 340 295
1996 327 291
1997 335 294
1998 350 296
1999 413 342
Appendix B
Estimating Veteran Fathers
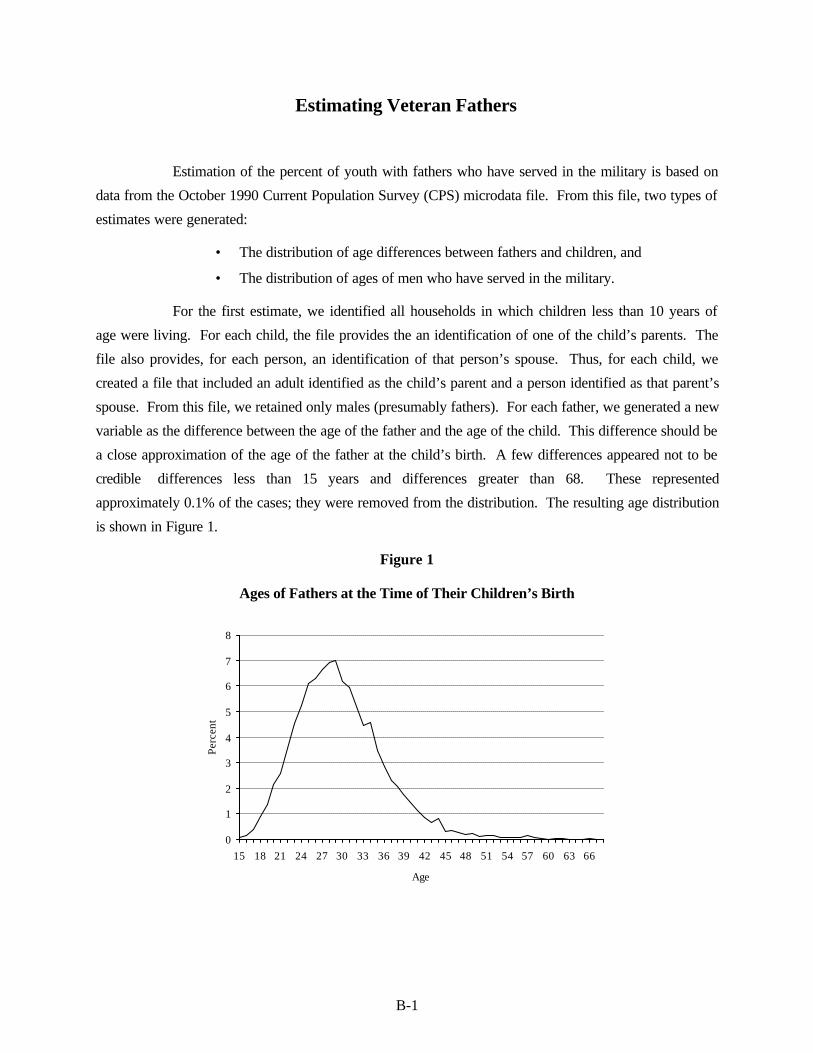
B-1
Estimating Veteran Fathers
Estimation of the percent of youth with fathers who have served in the military is based on
data from the October 1990 Current Population Survey (CPS) microdata file. From this file, two types of
estimates were generated:
• The distribution of age differences between fathers and children, and
• The distribution of ages of men who have served in the military.
For the first estimate, we identified all households in which children less than 10 years of
age were living. For each child, the file provides the an identification of one of the child’s parents. The
file also provides, for each person, an identification of that person’s spouse. Thus, for each child, we
created a file that included an adult identified as the child’s parent and a person identified as that parent’s
spouse. From this file, we retained only males (presumably fathers). For each father, we generated a new
variable as the difference between the age of the father and the age of the child. This difference should be
a close approximation of the age of the father at the child’s birth. A few differences appeared not to be
credibledifferences less than 15 years and differences greater than 68. These represented
approximately 0.1% of the cases; they were removed from the distribution. The resulting age distribution
is shown in Figure 1.
Figure 1
Ages of Fathers at the Time of Their Children’s Birth
0
1
2
3
4
5
6
7
8
15 18 21 24 27 30 33 36 39 42 45 48 51 54 57 60 63 66
Age
Perc
ent
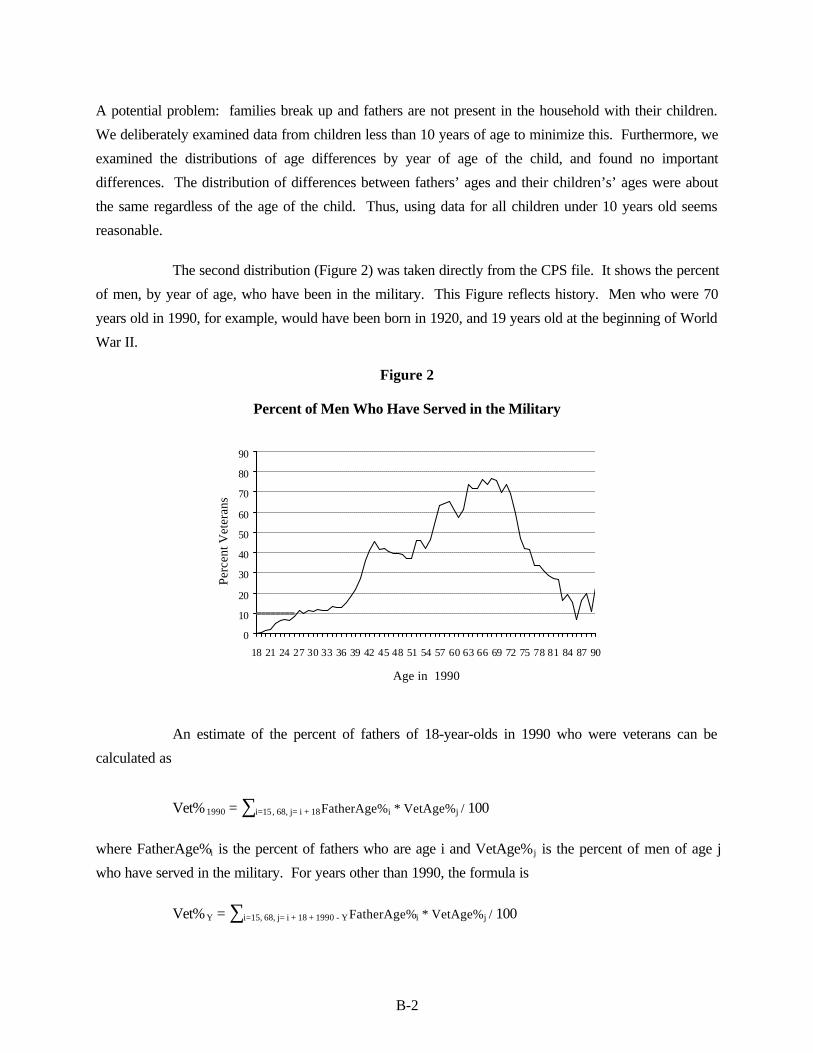
B-2
A potential problem: families break up and fathers are not present in the household with their children.
We deliberately examined data from children less than 10 years of age to minimize this. Furthermore, we
examined the distributions of age differences by year of age of the child, and found no important
differences. The distribution of differences between fathers’ ages and their children’s’ ages were about
the same regardless of the age of the child. Thus, using data for all children under 10 years old seems
reasonable.
The second distribution (Figure 2) was taken directly from the CPS file. It shows the percent
of men, by year of age, who have been in the military. This Figure reflects history. Men who were 70
years old in 1990, for example, would have been born in 1920, and 19 years old at the beginning of World
War II.
Figure 2
Percent of Men Who Have Served in the Military
0
10
20
30
40
50
60
70
80
90
18 21 24 27 30 33 36 39 42 45 48 51 54 57 60 63 66 69 72 75 78 81 84 87 90
Age in 1990
Perc
ent V
eter
ans
An estimate of the percent of fathers of 18-year-olds in 1990 who were veterans can be
calculated as
Vet% 1990 = ∑i=15, 68, j= i + 18 FatherAge%i * VetAge%j / 100
where FatherAge%i is the percent of fathers who are age i and VetAge% j is the percent of men of age j
who have served in the military. For years other than 1990, the formula is
Vet%Y = ∑i=15, 68, j= i + 18 + 1990 - Y FatherAge%i * VetAge%j / 100
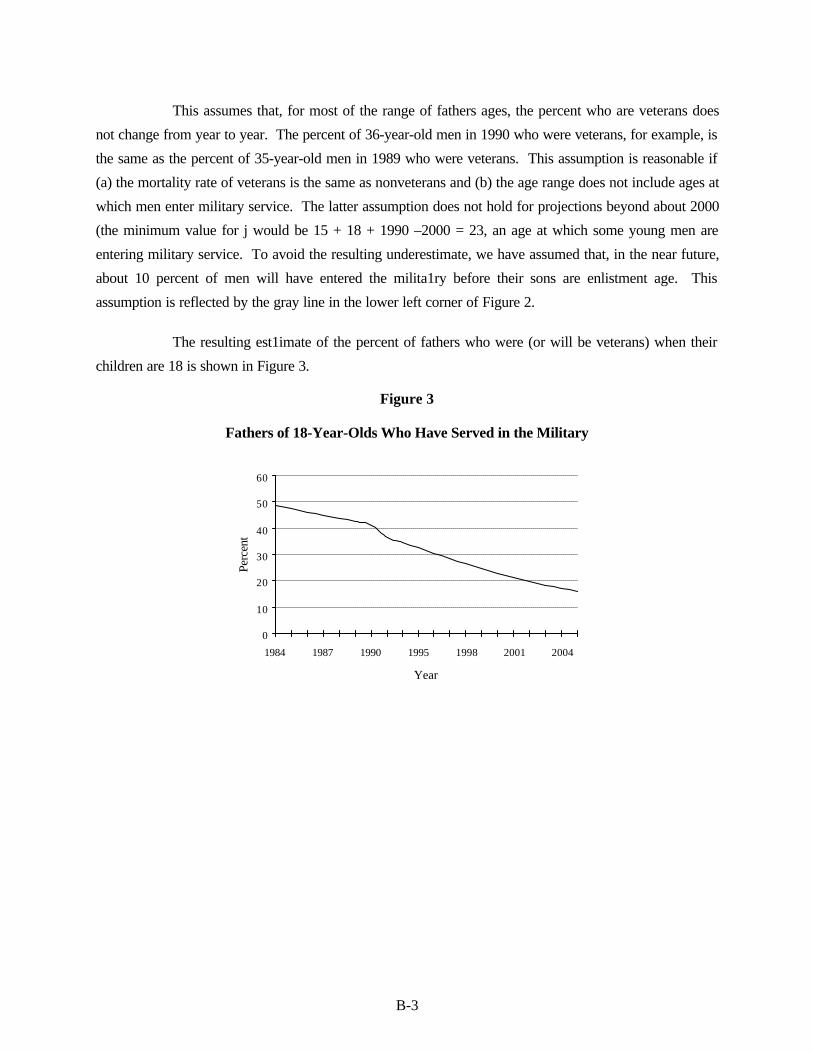
B-3
This assumes that, for most of the range of fathers ages, the percent who are veterans does
not change from year to year. The percent of 36-year-old men in 1990 who were veterans, for example, is
the same as the percent of 35-year-old men in 1989 who were veterans. This assumption is reasonable if
(a) the mortality rate of veterans is the same as nonveterans and (b) the age range does not include ages at
which men enter military service. The latter assumption does not hold for projections beyond about 2000
(the minimum value for j would be 15 + 18 + 1990 –2000 = 23, an age at which some young men are
entering military service. To avoid the resulting underestimate, we have assumed that, in the near future,
about 10 percent of men will have entered the milita1ry before their sons are enlistment age. This
assumption is reflected by the gray line in the lower left corner of Figure 2.
The resulting est1imate of the percent of fathers who were (or will be veterans) when their
children are 18 is shown in Figure 3.
Figure 3
Fathers of 18-Year-Olds Who Have Served in the Military
0
10
20
30
40
50
60
1984 1987 1990 1995 1998 2001 2004
Year
Perc
ent
Appendix C
Supplementary Data Tables for Chapter 3

C-1
Table 3-1. Propensity by Education, Gender
Men Women
Education LevelUnaided
Propensity
ActiveCompositePropensity
ReserveCompositePropensity
UnaidedPropensity
ActiveCompositePropensity
ReserveCompositePropensity
Students
H.S. Juniors 14 (0.6) 37 (0.7) 25 (0.7) 6 (0.5) 19 (0.9) 14 (0.7)H.S. Seniors 12 (0.5) 30 (0.7) 22 (0.7) 5 (0.5) 16 (0.8) 12 (0.7)Postsecondary Vo-Tech 3 (0.8) 17 (1.6) 15 (1.5) 0 (--) 7 (1.2) 7 (1.8)2-Year College 2 (0.3) 16 (1.0) 15 (1.1) 1 (0.3) 7 (0.9) 7 (1.1)4-Yr College
Freshmen 2 (0.3) 12 (0.6) 12 (0.7) 0 (--) 6 (0.8) 6 (0.7)Sophomores 1 (0.2) 10 (0.7) 9 (0.6) 0 (--) 4 (0.6) 5 (0.6)Juniors 1 (0.4) 9 (0.7) 9 (0.6) 0 (--) 5 (0.7) 4 (0.6)Seniors 2 (0.3) 8 (0.7) 6 (0.7) 0 (--) 3 (0.5) 2 (0.4)
Graduate Students 1 (0.3) 7 (1.3) 6 (1.2) 0 (--) 2 (0.6) 1 (0.5)
Non-Students
H.S. Dropouts 5 (0.5) 31 (0.9) 25 (0.9) 1 (0.2) 12 (1.2) 10 (1.0)H.S. Grads (no college) 4 (0.2) 19 (0.4) 16 (0.5) 1 (0.2) 8 (0.6) 7 (0.6)Some College (not BS) 1 (0.3) 11 (0.7) 11 (0.7) 0 (--) 6 (0.7) 6 (0.7)College Grads (BS +) 1 (0.2) 5 (0.6) 4 (0.6) 0 (--) 2 (0.7) 1 (0.3)
Source: 1993 – 1999 YATS

C-2
Table 3-2. Propensity by Employment, Gender
Men Women
Education LevelUnaided
Propensity
ActiveCompositePropensity
ReserveCompositePropensity
UnaidedPropensity
ActiveCompositePropensity
ReserveCompositePropensity
Students
Employed 7 (0.2) 21 (0.4) 16 (0.5) 2 (0.2) 9 (0.3) 7 (0.3)Unemployed, looking 13 (0.4) 37 (0.7) 28 (0.9) 5 (0.5) 23 (1.1) 18 (0.7)Unemployed, not looking 5 (0.3) 17 (0.5) 12 (0.5) 1 (0.2) 8 (0.5) 6 (0.4)
Non-Students
Employed 3 (0.2) 18 (0.4) 15 (0.4) 1 (0.1) 7 (0.4) 6 (0.4)Unemployed, looking 6 (0.6) 29 (1.2) 24 (1.5) 1 (0.4) 15 (1.5) 13 (1.3)Unemployed, not looking 5 (1.1) 20 (1.8) 15 (1.5) 0 (--) 6 (0.9) 6 (0.9)
Source: 1993 – 1999 YATS
Table 3-3. Propensity by Income Prospects in Military vs. Civilian Jobs
Men Women
Expected relative earningsin military vs. civilianemployment
UnaidedPropensity
ActiveCompositePropensity
ReserveCompositePropensity
UnaidedPropensity
ActiveCompositePropensity
ReserveCompositePropensity
More in military job 16 (0.5) 45 (0.6) 33 (0.7) 5 (0.3) 21 (0.6) 16 (0.6)Military/civilian same 7 (0.9) 22 (1.5) 17 (1.0) 1 (0.3) 10 (1.1) 8 (1.0)More in civilian job 2 (0.1) 13 (0.3) 11 (0.2) 1 (0.1) 5 (0.3) 4 (0.2)
Source: 1995 – 1999 YATS
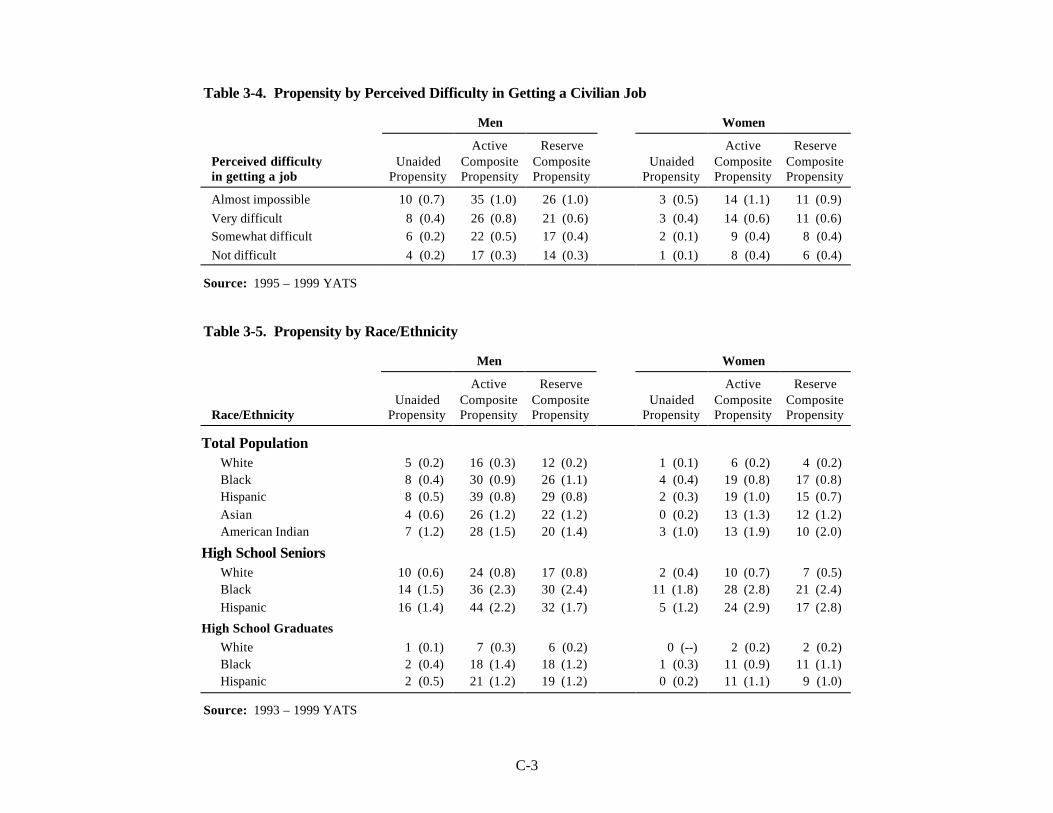
C-3
Table 3-4. Propensity by Perceived Difficulty in Getting a Civilian Job
Men Women
Perceived difficultyin getting a job
UnaidedPropensity
ActiveCompositePropensity
ReserveCompositePropensity
UnaidedPropensity
ActiveCompositePropensity
ReserveCompositePropensity
Almost impossible 10 (0.7) 35 (1.0) 26 (1.0) 3 (0.5) 14 (1.1) 11 (0.9)Very difficult 8 (0.4) 26 (0.8) 21 (0.6) 3 (0.4) 14 (0.6) 11 (0.6)Somewhat difficult 6 (0.2) 22 (0.5) 17 (0.4) 2 (0.1) 9 (0.4) 8 (0.4)Not difficult 4 (0.2) 17 (0.3) 14 (0.3) 1 (0.1) 8 (0.4) 6 (0.4)
Source: 1995 – 1999 YATS
Table 3-5. Propensity by Race/Ethnicity
Men Women
Race/EthnicityUnaided
Propensity
ActiveCompositePropensity
ReserveCompositePropensity
UnaidedPropensity
ActiveCompositePropensity
ReserveCompositePropensity
Total PopulationWhite 5 (0.2) 16 (0.3) 12 (0.2) 1 (0.1) 6 (0.2) 4 (0.2)Black 8 (0.4) 30 (0.9) 26 (1.1) 4 (0.4) 19 (0.8) 17 (0.8)Hispanic 8 (0.5) 39 (0.8) 29 (0.8) 2 (0.3) 19 (1.0) 15 (0.7)Asian 4 (0.6) 26 (1.2) 22 (1.2) 0 (0.2) 13 (1.3) 12 (1.2)American Indian 7 (1.2) 28 (1.5) 20 (1.4) 3 (1.0) 13 (1.9) 10 (2.0)
High School SeniorsWhite 10 (0.6) 24 (0.8) 17 (0.8) 2 (0.4) 10 (0.7) 7 (0.5)Black 14 (1.5) 36 (2.3) 30 (2.4) 11 (1.8) 28 (2.8) 21 (2.4)Hispanic 16 (1.4) 44 (2.2) 32 (1.7) 5 (1.2) 24 (2.9) 17 (2.8)
High School GraduatesWhite 1 (0.1) 7 (0.3) 6 (0.2) 0 (--) 2 (0.2) 2 (0.2)Black 2 (0.4) 18 (1.4) 18 (1.2) 1 (0.3) 11 (0.9) 11 (1.1)Hispanic 2 (0.5) 21 (1.2) 19 (1.2) 0 (0.2) 11 (1.1) 9 (1.0)
Source: 1993 – 1999 YATS

C-4
Table 3-6. Propensity of High School Juniors and Seniors by Mother’s Education
Men Women
Mother’s EducationUnaided
Propensity
ActiveCompositePropensity
ReserveCompositePropensity
UnaidedPropensity
ActiveCompositePropensity
ReserveCompositePropensity
Less than H.S. Grad 19 (1.1) 50 (1.8) 33 (1.8) 8 (1.1) 27 (2.4) 21 (1.6)H. S. Grad 14 (0.5) 35 (0.9) 23 (0.9) 6 (0.6) 19 (1.0) 14 (0.9)Some College 13 (1.1) 33 (1.3) 25 (1.1) 4 (0.7) 16 (1.2) 11 (1.2)College Graduate 10 (0.6) 23 (0.9) 18 (0.9) 3 (0.5) 11 (0.9) 8 (0.7)
Source: 1993 – 1999 YATS
Table 3-7. Propensity by Geographic Region
Men Women
Census RegionUnaided
Propensity
ActiveCompositePropensity
ReserveCompositePropensity
UnaidedPropensity
ActiveCompositePropensity
ReserveCompositePropensity
All Race/Ethnic GroupsNortheast 5 (0.3) 21 (0.6) 17 (0.6) 2 (0.3) 12 (0.8) 9 (0.7)North Central 5 (0.2) 17 (0.4) 13 (0.4) 2 (0.2) 8 (0.6) 7 (0.5)South 7 (0.2) 24 (0.5) 19 (0.4) 3 (0.2) 14 (0.6) 12 (0.6)West 6 (0.2) 24 (0.6) 18 (0.5) 3 (0.3) 14 (0.7) 9 (0.6)
Whites Only
Northeast 5 (0.3) 16 (0.5) 13 (0.5) 2 (0.3) 8 (0.7) 6 (0.6)North Central 5 (0.3) 14 (0.5) 11 (0.4) 1 (0.2) 6 (0.5) 5 (0.5)South 5 (0.2) 18 (0.4) 14 (0.4) 2 (0.2) 7 (0.5) 5 (0.5)West 5 (0.3) 17 (0.6) 12 (0.6) 2 (0.3) 9 (0.7) 6 (0.6)
Source: 1993 – 1999 YATS

C-5
Table C-1. Propensity by Single Year of Age for Young Men(Supporting Data for Figure 3-1, p. 3-6)
Age
Propensity 16 17 18 19 20 21 22 23 24
Composite Active 37 (0.7) 33 (0.7) 26 (0.8) 22 (0.8) 20 (0.8) 19 (0.8) 17 (1.0) 16 (0.9) 16 (1.0)
Composite Reserve 26 (0.6) 24 (0.6) 19 (0.6) 18 (0.8) 17 (0.8) 16 (0.9) 15 (0.9) 15 (1.1) 14 (1.1)
Unaided 14 (0.5) 13 (0.4) 8 (0.5) 5 (0.4) 6 (0.4) 3 (0.4) 3 (0.4) 1 (0.3) 1 (0.3)
Source: 1993 – 1999 YATS
Table C-2. Propensity by Single Year of Age for Young Women(Supporting Data for Figure 3-2, p. 3-7)
Age
Propensity 16 17 18 19 20 21 22 23 24
Composite Active 19 (0.7) 18 (0.9) 13 (0.8) 8 (0.7) 11 (0.8) 8 (0.8) 6 (0.9) 7 (0.7) 6 (0.8)
Composite Reserve 14 (0.6) 13 (0.7) 10 (0.7) 7 (0.7) 9 (0.7) 7 (0.8) 7 (0.8) 6 (0.8) 6 (0.8)
Unaided 5 (0.4) 4 (0.5) 3 (0.4) 1 (0.3) 1 (0.2) 1 (0.2) 1 (0.2) 1 (0.3) 0.4 (0.2)
Source: 1993 – 1999 YATS

C-6
Table C-3. Active Composite Propensity of Youth, by Marital Status(Supporting Data for Section: Marital Status , p. 3-14)
Men Women
Marital Status
Single 26 (0.3) 13 (0.3)Married 15 (0.9) 5 (0.6)Other 23 (2.9) 11 (1.5)
Source: 1993 – 1999 YATS
Table C-4. Composite Active Propensity of High School Students and Graduates, by Veteran Status of Father(Supporting Data for Section: Influencers with Military Experience, p. 3-14)
Men Women
Father’s Veteran Status
Veteran Not a Veteran Veteran Not a Veteran
Young High School Students 43 () 37 () 24 () 21 ()
High School Seniors 32 () 28 () 18 () 17 ()
High School Graduates 17 () 19 () 7 () 10 ()
Source: 1995 – 1999 YATS

C-7
Table C-5. Composite Active Propensity of High School Students and Graduates, by Veteran Status of Friends(Supporting Data for Section: Influencers with Military Experience, p. 3-14)
Men Women
Friend’s Veteran Status
Veteran Not a Veteran Veteran Not a Veteran
Young High School Students 42 () 37 () 25 () 19 ()
High School Seniors 32 () 28 () 18 () 16 ()
High School Graduates 17 () 24 () 8 () 9 ()
Source: 1995 – 1999 YATS
Table C-6. Coast Guard Propensity for Young Men and Young Women, 1990 – 1999(Supporting Data for Figure 3-14, p. 3-30)
Year
Propensity 1990 1991 1992 1993 1994 1995 1996 1997 1998 1999
Men 8 (0.5) 11 (0.8) 8 (0.7) 9 (0.7) 8 (0.5) 8 (0.5) 8 (0.5) 8 (0.5) 8 (0.5) 8 (0.5)
Women 3 (0.6) 3 (0.6) 2 (0.5) 3 (0.6) 4 (0.7) 4 (0.4) 3 (0.4) 4 (0.4) 4 (0.4) 4 (0.4)
Source: 1990 – 1999 YATS

Appendix D
1999 YATS Topline Tables(Supplementary Data Tables for Chapter 3)
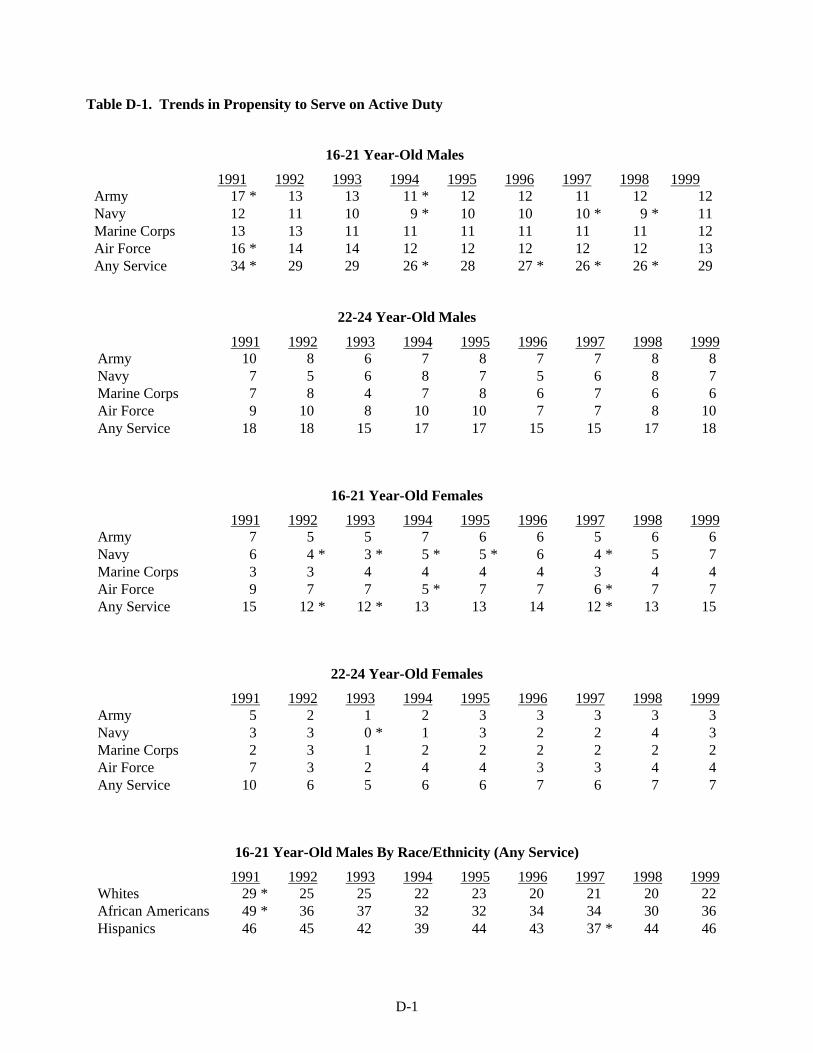
D-1
Table D-1. Trends in Propensity to Serve on Active Duty
16-21 Year-Old Males
1991 1992 1993 1994 1995 1996 1997 1998 1999Army 17 * 13 13 11 * 12 12 11 12 12Navy 12 11 10 9 * 10 10 10 * 9 * 11Marine Corps 13 13 11 11 11 11 11 11 12Air Force 16 * 14 14 12 12 12 12 12 13Any Service 34 * 29 29 26 * 28 27 * 26 * 26 * 29
22-24 Year-Old Males
1991 1992 1993 1994 1995 1996 1997 1998 1999Army 10 8 6 7 8 7 7 8 8Navy 7 5 6 8 7 5 6 8 7Marine Corps 7 8 4 7 8 6 7 6 6Air Force 9 10 8 10 10 7 7 8 10Any Service 18 18 15 17 17 15 15 17 18
16-21 Year-Old Females
1991 1992 1993 1994 1995 1996 1997 1998 1999Army 7 5 5 7 6 6 5 6 6Navy 6 4 * 3 * 5 * 5 * 6 4 * 5 7Marine Corps 3 3 4 4 4 4 3 4 4Air Force 9 7 7 5 * 7 7 6 * 7 7Any Service 15 12 * 12 * 13 13 14 12 * 13 15
22-24 Year-Old Females
1991 1992 1993 1994 1995 1996 1997 1998 1999Army 5 2 1 2 3 3 3 3 3Navy 3 3 0 * 1 3 2 2 4 3Marine Corps 2 3 1 2 2 2 2 2 2Air Force 7 3 2 4 4 3 3 4 4Any Service 10 6 5 6 6 7 6 7 7
16-21 Year-Old Males By Race/Ethnicity (Any Service)
1991 1992 1993 1994 1995 1996 1997 1998 1999Whites 29 * 25 25 22 23 20 21 20 22African Americans 49 * 36 37 32 32 34 34 30 36Hispanics 46 45 42 39 44 43 37 * 44 46

D-2
16-21 Year-Old Females By Race/Ethnicity (Any Service)
1991 1992 1993 1994 1995 1996 1997 1998 1999Whites 9 9 7 9 7 9 7 * 7 * 9African Americans 28 16 * 23 20 * 24 23 19 * 23 29Hispanics 28 22 21 25 25 25 21 26 22
* The difference between this number and the 1999 propensity is statistically significant. Propensity estimates are based on a representative sample ofAmerican youth, and results will vary slightly from what would have been obtained if all American youth were interviewed. For example, for 16-21year-olds, estimates will usually be within a percentage point of true population values and will nearly always be within two percentage points.Asterisks (*) denote propensities that are significantly different (α = 0.05) from the 1999 YATS results; that is, there is less than one chance in 20 thatpropensities could differ so much, solely as a result of random sampling.
Table D-2. Trends In Propensity To Serve In The Reserve Components
16-21 Year-Old Males
1991 1992 1993 1994 1995 1996 1997 1998 1999National Guard 12 10 10 10 9 * 10 9 * 10 11Reserves 21 * 18 17 16 16 16 17 14 * 16Composite Reserve 25 22 21 20 19 20 20 19 * 21
22-24 Year-Old Males
1991 1992 1993 1994 1995 1996 1997 1998 1999National Guard 7 9 6 7 7 8 8 10 8Reserves 9 * 14 12 11 13 11 11 13 13Composite Reserve 12 17 13 13 15 14 13 16 16
16-21 Year-Old Females
1991 1992 1993 1994 1995 1996 1997 1998 1999National Guard 5 3 5 4 5 6 4 4 5Reserves 8 8 8 8 8 9 7 * 7 * 9Composite Reserve 9 9 9 10 11 12 9 * 9 11
22-24 Year-Old Females
1991 1992 1993 1994 1995 1996 1997 1998 1999National Guard 4 5 2 2 3 2 2 4 3Reserves 9 7 7 5 7 5 5 5 5Composite Reserve 9 9 7 6 8 6 6 7 6

D-3
16-21 Year-Old Males By Race/Ethnicity (Any Reserve Component)
1991 1992 1993 1994 1995 1996 1997 1998 1999Whites 20 * 18 * 16 15 15 16 15 13 * 16African Americans 43 * 28 31 27 30 30 29 25 27Hispanics 31 32 32 32 27 31 28 32 32
16-21 Year-Old Females By Race/Ethnicity (Any Reserve Component)
1991 1992 1993 1994 1995 1996 1997 1998 1999Whites 5 6 4 * 7 5 7 5 5 7African Americans 16 * 13 * 23 16 * 22 23 17 * 15 * 22Hispanics 21 17 13 17 19 20 15 16 17

Appendix E
Supplementary Data Tables for Chapter 4
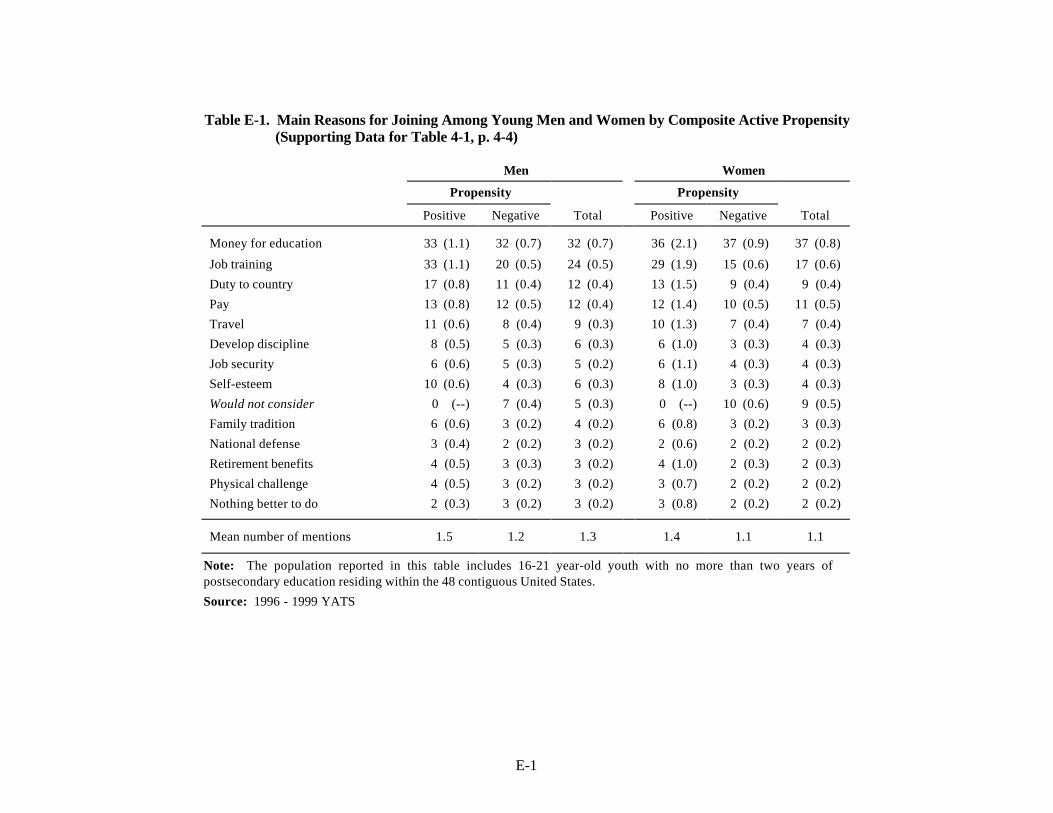
E-1
Table E-1. Main Reasons for Joining Among Young Men and Women by Composite Active Propensity(Supporting Data for Table 4-1, p. 4-4)
Men Women
Propensity Propensity
Positive Negative Total Positive Negative Total
Money for education 33 (1.1) 32 (0.7) 32 (0.7) 36 (2.1) 37 (0.9) 37 (0.8)
Job training 33 (1.1) 20 (0.5) 24 (0.5) 29 (1.9) 15 (0.6) 17 (0.6)
Duty to country 17 (0.8) 11 (0.4) 12 (0.4) 13 (1.5) 9 (0.4) 9 (0.4)
Pay 13 (0.8) 12 (0.5) 12 (0.4) 12 (1.4) 10 (0.5) 11 (0.5)
Travel 11 (0.6) 8 (0.4) 9 (0.3) 10 (1.3) 7 (0.4) 7 (0.4)
Develop discipline 8 (0.5) 5 (0.3) 6 (0.3) 6 (1.0) 3 (0.3) 4 (0.3)
Job security 6 (0.6) 5 (0.3) 5 (0.2) 6 (1.1) 4 (0.3) 4 (0.3)
Self-esteem 10 (0.6) 4 (0.3) 6 (0.3) 8 (1.0) 3 (0.3) 4 (0.3)
Would not consider 0 (--) 7 (0.4) 5 (0.3) 0 (--) 10 (0.6) 9 (0.5)
Family tradition 6 (0.6) 3 (0.2) 4 (0.2) 6 (0.8) 3 (0.2) 3 (0.3)
National defense 3 (0.4) 2 (0.2) 3 (0.2) 2 (0.6) 2 (0.2) 2 (0.2)
Retirement benefits 4 (0.5) 3 (0.3) 3 (0.2) 4 (1.0) 2 (0.3) 2 (0.3)
Physical challenge 4 (0.5) 3 (0.2) 3 (0.2) 3 (0.7) 2 (0.2) 2 (0.2)
Nothing better to do 2 (0.3) 3 (0.2) 3 (0.2) 3 (0.8) 2 (0.2) 2 (0.2)
Mean number of mentions 1.5 1.2 1.3 1.4 1.1 1.1
Note: The population reported in this table includes 16-21 year-old youth with no more than two years ofpostsecondary education residing within the 48 contiguous United States.
Source: 1996 - 1999 YATS

E-2
Table E-2. Main Reasons for Joining Among Young Men and Women by Race/Ethnicity(Supporting Data for Table 4-2, p. 4-5)
Men WomenRace/Ethnicity Race/Ethnicity
White Black Hispanic White Black Hispanic
Money for education 33 (0.8) 29 (1.4) 32 (1.8) 38 (0.8) 36 (2.0) 33 (1.9)
Job training 24 (0.6) 21 (1.4) 26 (1.1) 16 (0.7) 21 (1.8) 20 (1.7)
Duty to country 13 (0.5) 10 (1.1) 12 (1.1) 11 (0.6) 5 (0.8) 10 (1.2)
Pay 12 (0.4) 15 (1.3) 13 (1.0) 10 (0.5) 13 (1.4) 10 (1.1)
Travel 8 (0.3) 11 (1.1) 8 (0.8) 7 (0.4) 10 (1.3) 7 (0.9)
Develop discipline 6 (0.3) 5 (0.7) 6 (0.7) 4 (0.3) 5 (0.9) 3 (0.7)
Job security 5 (0.3) 5 (0.7) 6 (0.8) 4 (0.4) 6 (1.0) 3 (0.8)
Self-esteem 5 (0.3) 6 (0.9) 8 (0.9) 4 (0.4) 5 (1.0) 5 (0.9)
Would not consider 5 (0.3) 6 (0.9) 3 (0.6) 10 (0.5) 8 (1.1) 7 (1.2)
Family tradition 4 (0.2) 3 (0.6) 3 (0.5) 3 (0.3) 2 (0.5) 3 (0.8)
National defense 3 (0.2) 1 (0.4) 2 (0.6) 2 (0.2) 1 (0.5) 2 (0.5)
Retirement benefits 4 (0.3) 3 (0.5) 3 (0.6) 3 (0.3) 3 (0.7) 2 (0.7)
Physical challenge 3 (0.2) 2 (0.6) 3 (0.6) 2 (0.2) 2 (0.6) 2 (0.5)
Nothing better to do 3 (0.2) 4 (0.6) 3 (0.5) 1 (0.2) 3 (0.7) 3 (0.8)
Mean number of mentions 1.3 1.2 1.3 1.1 1.2 1.1
Note: The population reported in this table includes 16-21 year-old youth with no more than two years of postsecondaryeducation residing within the 48 contiguous United States.
Source: 1996 - 1999 YATS

E-3
Table E-3. Main Reasons for Joining Among High School Seniors and Graduates, by Gender(Supporting Data for Section: School Status, p. 4-6)
Men Women
ReasonHigh School
SenioraHigh SchoolGraduateb
High SchoolSeniorc
High SchoolGraduated
Pay 12 (0.8) 13 (1.1) 10 (0.8) 10 (1.2)
Travel 8 (0.7) 12 (1.1) 6 (0.8) 10 (1.5)
National Defense 2 (0.4) 2 (0.4) 3 (0.5) 2 (0.5)
Retirement Benefits 3 (0.5) 5 (0.6) 2 (0.5) 5 (0.9)
Job Training 23 (1.1) 27 (1.3) 18 (1.5) 17 (1.4)
Self-Esteem 5 (0.6) 5 (0.7) 5 (0.7) 3 (0.6)
Duty to Country 12 (0.8) 9 (0.8) 10 (0.9) 7 (0.9)
Money for Education 40 (1.4) 29 (1.7) 43 (1.5) 37 (2.5)
Physical Challenge 3 (0.4) 4 (0.5) 3 (0.5) 2 (0.6)
Develop Discipline 5 (0.5) 5 (0.5) 4 (0.5) 3 (0.7)
Job Security 3 (0.4) 9 (0.8) 3 (0.6) 8 (1.2)
Family Tradition 4 (0.4) 2 (0.5) 3 (0.6) 2 (0.5)
Nothing Better to Do 3 (0.4) 4 (0.6) 2 (0.6) 2 (0.8)
Would Not Consider 4 (0.5) 5 (0.7) 8 (0.8) 10 (1.5)
Note: The population reported in this table includes 16-21 year-old youth with no more than two years ofpostsecondary education residing within the 48 contiguous United States.
Source: 1996 - 1999 YATS
a Estimates are based on 1,749 interviews. c Estimates are based on 1,140 interviews.b Estimates are based on 1,122 interviews. d Estimates are based on 618 interviews.

E-4
Table E-4. Main Reasons for Joining Among Young Men and Women, by Parent Veteran Status(Supporting Data for Section: Veterans, p. 4-6)
Men Women
Reason Veterana Non-Veteranb Veteranc Non-Veterand
Pay 13 (0.9) 12 (0.5) 12 (1.0) 10 (0.5)
Travel 9 (0.7) 8 (0.3) 8 (0.9) 7 (0.4)
National Defense 3 (0.2) 3 (0.3) 2 (0.6) 2 (0.2)
Retirement Benefits 3 (0.4) 4 (0.3) 3 (0.5) 2 (0.3)
Job Training 27 (1.1) 23 (0.6) 18 (1.2) 17 (0.7)
Self-Esteem 5 (0.6) 6 (0.3) 4 (0.6) 4 (0.3)
Duty to Country 12 (1.0) 13 (0.4) 8 (0.8) 10 (0.4)
Money for Education 34 (1.1) 32 (0.8) 38 (1.6) 37 (0.8)
Physical Challenge 3 (0.4) 3 (0.2) 3 (0.4) 2 (0.2)
Develop Discipline 6 (0.5) 6 (0.3) 4 (0.6) 4 (0.3)
Job Security 6 (0.6) 5 (0.3) 4 (0.8) 4 (0.3)
Family Tradition 5 (0.5) 3 (0.2) 5 (0.6) 3 (0.2)
Nothing Better to Do 3 (0.5) 3 (0.2) 2 (0.5) 2 (0.3)
Would Not Consider 3 (0.4) 5 (0.3) 8 (1.0) 9 (0.6)
Note: The population reported in this table includes 16-21 year-old youth with no more than two years ofpostsecondary education residing within the 48 contiguous United States.
Source: 1996 - 1999 YATS
a Estimates are based on 2,000 interviews. c Estimates are based on 1,044 interviews.b Estimates are based on 6,747 interviews. d Estimates are based on 4,159 interviews.

E-5
Table E-5. Main Reasons for Joining Among Young Men and Women by Friend Veteran Status(Supporting Data for Section: Veterans, p. 4-7)
Men Women
Reason Veterana Non-Veteranb Veteranc Non-Veterand
Pay 12 (0.5) 13 (0.7) 13 (0.9) 10 (0.5)
Travel 8 (0.4) 10 (0.7) 9 (0.8) 7 (0.4)
National Defense 2 (0.3) 3 (0.2) 3 (0.5) 2 (0.2)
Retirement Benefits 5 (0.5) 3 (0.2) 2 (0.4) 3 (0.3)
Job Training 28 (0.9) 22 (0.5) 18 (1.2) 17 (0.7)
Self-Esteem 7 (0.6) 5 (0.3) 4 (0.6) 4 (0.3)
Duty to Country 13 (0.8) 12 (0.5) 9 (0.9) 9 (0.5)
Money for Education 33 (1.0) 32 (0.8) 41 (1.6) 36 (0.9)
Physical Challenge 4 (0.4) 3 (0.3) 3 (0.5) 2 (0.2)
Develop Discipline 7 (0.6) 5 (0.3) 5 (0.6) 4 (0.3)
Job Security 6 (0.5) 5 (0.3) 5 (0.8) 3 (0.3)
Family Tradition 4 (0.4) 3 (0.2) 4 (0.5) 3 (0.3)
Nothing Better to Do 3 (0.4) 3 (0.2) 2 (0.5) 2 (0.3)
Would Not Consider 4 (0.4) 5 (0.3) 7 (0.7) 9 (0.6)
Note: The population reported in this table includes 16-21 year-old youth with no more than two years ofpostsecondary education residing within the 48 contiguous United States.
Source: 1996 - 1999 YATS
a Estimates are based on 2,361 interviews. c Estimates are based on 1,231 interviews.b Estimates are based on 6,386 interviews . d Estimates are based on 3,972 interviews .

E-6
Table E-6. Trends in Common Reasons for Entering Military Service Among Young Men(Supporting Data for Figure 4-1, p. 4-8)
Reason/Year 1991 1992 1993 1994 1995 1996 1997 1998 1999
Young Malesa
Money for Education 24 (1.1) 27 (1.0) 29 (1.1) 30 (1.5) 33 (1.1) 32 (1.1) 32 (1.2) 31 (1.1) 33 (1.2)
Experience/Job Training 28 (1.3) 31 (1.0) 24 (1.2) 23 (1.4) 24 (0.9) 24 (1.0) 25 (1.1) 23 (1.2) 22 (1.1)
Duty/Obligation to Country 18 (1.0) 18 (0.8) 14 (0.8) 11 (1.0) 11 (0.7) 12 (0.7) 11 (0.7) 14 (0.8) 12 (0.8)
Pay/Money 15 (0.8) 13 (0.9) 10 (0.8) 13 (1.1) 12 (0.7) 11 (0.8) 12 (0.7) 11 (0.6) 15 (0.8)
Note: The population reported in this table includes 16-21 year-old youth with no more than two years of postsecondary education residing within the 48contiguous United States.
Source: 1991 - 1999 YATSaEstimates are based on the following number of interviews with young males:
1991: 2,122 1992: 2,298 1993: 2,141 1994: 2,790 1995: 2,413 1996: 2,223 1997: 2,101 1998: 2,292 1999: 2,131
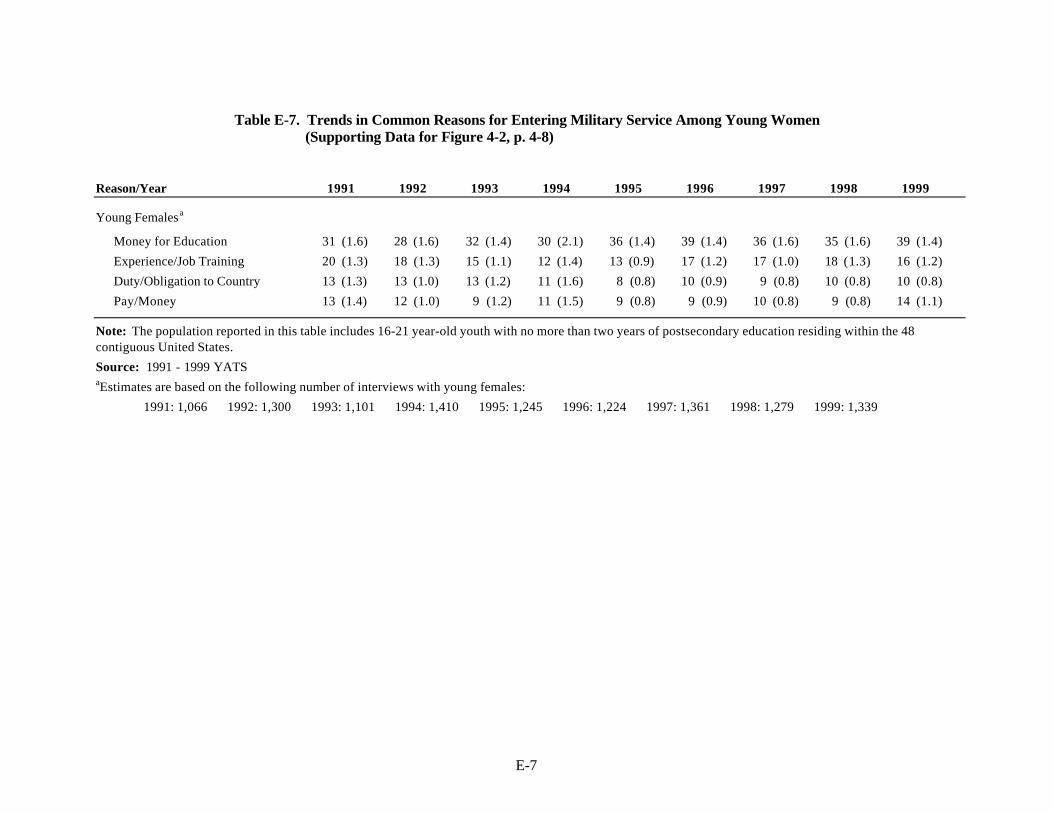
E-7
Table E-7. Trends in Common Reasons for Entering Military Service Among Young Women(Supporting Data for Figure 4-2, p. 4-8)
Reason/Year 1991 1992 1993 1994 1995 1996 1997 1998 1999
Young Femalesa
Money for Education 31 (1.6) 28 (1.6) 32 (1.4) 30 (2.1) 36 (1.4) 39 (1.4) 36 (1.6) 35 (1.6) 39 (1.4)
Experience/Job Training 20 (1.3) 18 (1.3) 15 (1.1) 12 (1.4) 13 (0.9) 17 (1.2) 17 (1.0) 18 (1.3) 16 (1.2)
Duty/Obligation to Country 13 (1.3) 13 (1.0) 13 (1.2) 11 (1.6) 8 (0.8) 10 (0.9) 9 (0.8) 10 (0.8) 10 (0.8)
Pay/Money 13 (1.4) 12 (1.0) 9 (1.2) 11 (1.5) 9 (0.8) 9 (0.9) 10 (0.8) 9 (0.8) 14 (1.1)
Note: The population reported in this table includes 16-21 year-old youth with no more than two years of postsecondary education residing within the 48contiguous United States.
Source: 1991 - 1999 YATSaEstimates are based on the following number of interviews with young females:
1991: 1,066 1992: 1,300 1993: 1,101 1994: 1,410 1995: 1,245 1996: 1,224 1997: 1,361 1998: 1,279 1999: 1,339
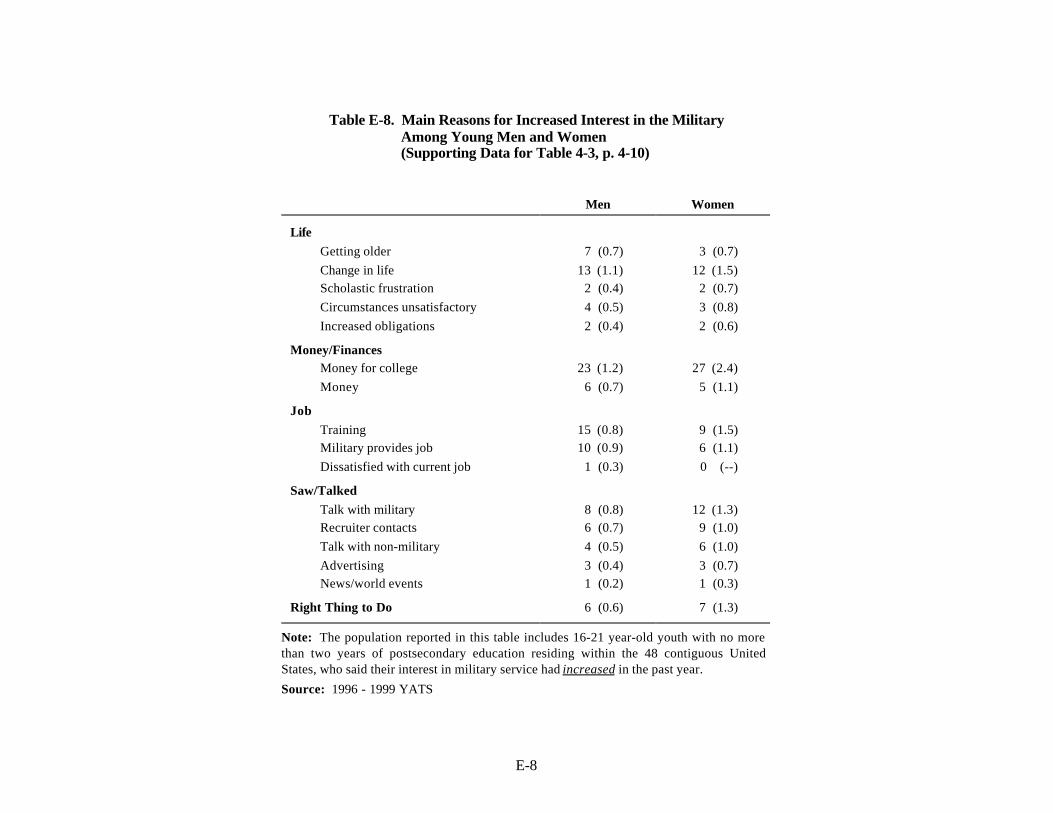
E-8
Table E-8. Main Reasons for Increased Interest in the MilitaryAmong Young Men and Women(Supporting Data for Table 4-3, p. 4-10)
Men Women
LifeGetting older 7 (0.7) 3 (0.7)Change in life 13 (1.1) 12 (1.5)Scholastic frustration 2 (0.4) 2 (0.7)Circumstances unsatisfactory 4 (0.5) 3 (0.8)Increased obligations 2 (0.4) 2 (0.6)
Money/FinancesMoney for college 23 (1.2) 27 (2.4)Money 6 (0.7) 5 (1.1)
JobTraining 15 (0.8) 9 (1.5)Military provides job 10 (0.9) 6 (1.1)Dissatisfied with current job 1 (0.3) 0 (--)
Saw/TalkedTalk with military 8 (0.8) 12 (1.3)Recruiter contacts 6 (0.7) 9 (1.0)Talk with non-military 4 (0.5) 6 (1.0)Advertising 3 (0.4) 3 (0.7)News/world events 1 (0.2) 1 (0.3)
Right Thing to Do 6 (0.6) 7 (1.3)
Note: The population reported in this table includes 16-21 year-old youth with no morethan two years of postsecondary education residing within the 48 contiguous UnitedStates, who said their interest in military service had increased in the past year.
Source: 1996 - 1999 YATS
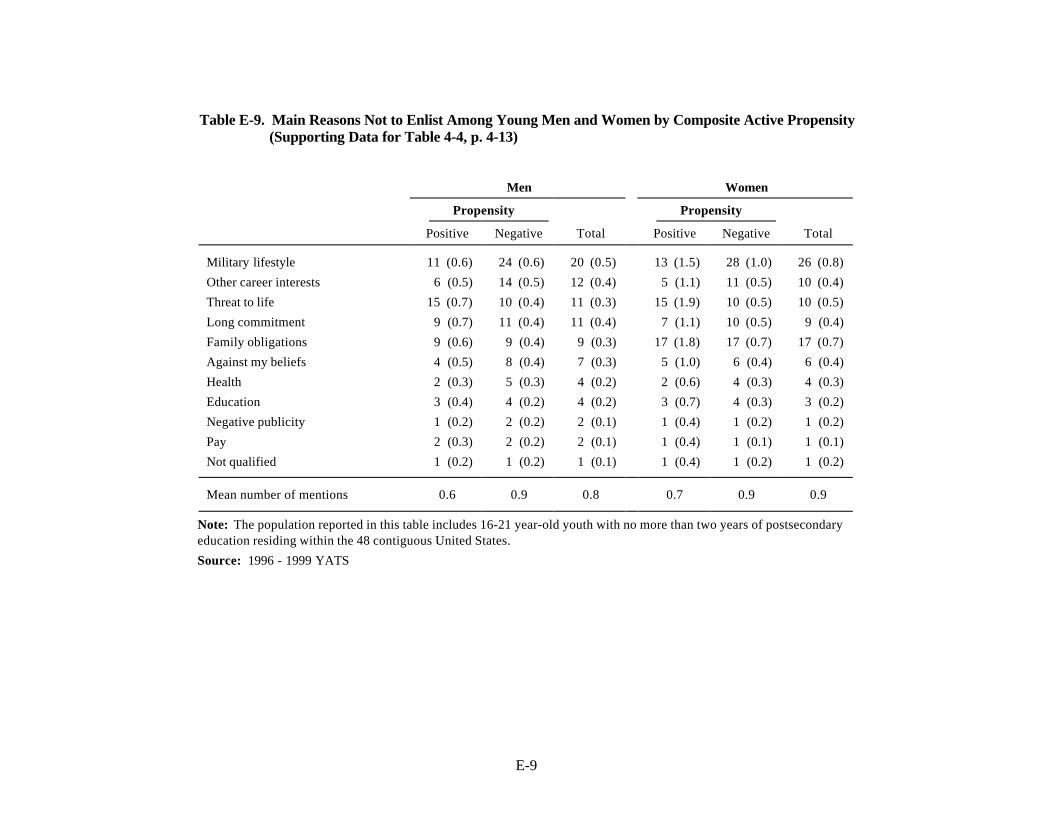
E-9
Table E-9. Main Reasons Not to Enlist Among Young Men and Women by Composite Active Propensity(Supporting Data for Table 4-4, p. 4-13)
Men Women
Propensity Propensity
Positive Negative Total Positive Negative Total
Military lifestyle 11 (0.6) 24 (0.6) 20 (0.5) 13 (1.5) 28 (1.0) 26 (0.8)
Other career interests 6 (0.5) 14 (0.5) 12 (0.4) 5 (1.1) 11 (0.5) 10 (0.4)
Threat to life 15 (0.7) 10 (0.4) 11 (0.3) 15 (1.9) 10 (0.5) 10 (0.5)
Long commitment 9 (0.7) 11 (0.4) 11 (0.4) 7 (1.1) 10 (0.5) 9 (0.4)
Family obligations 9 (0.6) 9 (0.4) 9 (0.3) 17 (1.8) 17 (0.7) 17 (0.7)
Against my beliefs 4 (0.5) 8 (0.4) 7 (0.3) 5 (1.0) 6 (0.4) 6 (0.4)
Health 2 (0.3) 5 (0.3) 4 (0.2) 2 (0.6) 4 (0.3) 4 (0.3)
Education 3 (0.4) 4 (0.2) 4 (0.2) 3 (0.7) 4 (0.3) 3 (0.2)
Negative publicity 1 (0.2) 2 (0.2) 2 (0.1) 1 (0.4) 1 (0.2) 1 (0.2)
Pay 2 (0.3) 2 (0.2) 2 (0.1) 1 (0.4) 1 (0.1) 1 (0.1)
Not qualified 1 (0.2) 1 (0.2) 1 (0.1) 1 (0.4) 1 (0.2) 1 (0.2)
Mean number of mentions 0.6 0.9 0.8 0.7 0.9 0.9
Note: The population reported in this table includes 16-21 year-old youth with no more than two years of postsecondaryeducation residing within the 48 contiguous United States.
Source: 1996 - 1999 YATS

E-10
Table E-10. Main Reasons Not to Enlist Among Young Men and Women by Race/Ethnicity(Supporting Data for Table 4-5, p. 4-14)
Men WomenRace/Ethnicity Race/Ethnicity
White Black Hispanic White Black Hispanic
Military lifestyle 22 (0.7) 21 (1.6) 15 (1.3) 26 (1.0) 26 (2.0) 24 (1.7)
Other career interests 14 (0.6) 7 (0.9) 8 (0.9) 12 (0.6) 6 (1.2) 6 (1.0)
Threat to life 10 (0.4) 17 (1.0) 11 (0.9) 9 (0.5) 15 (1.8) 11 (1.5)
Long commitment 12 (0.4) 6 (0.8) 11 (0.9) 10 (0.5) 7 (1.0) 8 (1.1)
Family obligations 8 (0.4) 6 (0.8) 14 (1.4) 16 (0.7) 12 (1.7) 21 (1.5)
Against my beliefs 6 (0.3) 9 (1.3) 6 (0.8) 6 (0.4) 7 (1.1) 5 (1.0)
Health 4 (0.3) 2 (0.6) 2 (0.6) 5 (0.4) 2 (0.6) 4 (0.7)
Education 4 (0.3) 3 (0.6) 3 (0.5) 4 (0.3) 3 (0.7) 2 (0.6)
Negative publicity 2 (0.2) 1 (0.3) 2 (0.4) 1 (0.2) 1 (0.4) 2 (0.6)
Pay 2 (0.2) 2 (0.4) 1 (0.4) 1 (0.2) 1 (0.4) 0 (--)
Not qualified 1 (0.2) 0 (--) 1 (0.3) 1 (0.2) 1 (0.5) 1 (0.3)
Mean number of mentions 0.8 0.7 0.8 0.9 0.8 0.9
Note: The population reported in this table includes 16-21 year-old youth with no more than two years ofpostsecondary education residing within the 48 contiguous United States.
Source: 1996 - 1999 YATS

E-11
Table E-11. Main Reasons for Not Joining Among High School Seniorsand Graduates, by Gender(Supporting Data for Section: School Status, p. 4-14)
Men Women
ReasonHigh School
SenioraHigh SchoolGraduateb
High SchoolSeniorc
High SchoolGraduated
Pay 2 (0.3) 2 (0.4) 1 (0.2) 1 (0.4)
Education 5 (0.5) 2 (0.4) 5 (0.8) 1 (0.3)
Family Obligations 7 (0.7) 11 (0.9) 11 (1.3) 26 (2.1)
Health 3 (0.5) 4 (0.6) 4 (0.7) 6 (1.0)
Against Beliefs 7 (0.7) 7 (0.8) 6 (0.8) 4 (0.9)
Military Lifestyle 19 (1.1) 25 (1.4) 27 (1.4) 22 (1.8)
Threat to Life 12 (0.8) 8 (0.8) 11 (1.1) 8 (1.4)
Not Qualified 0 (--) 2 (0.4) 1 (0.4) 1 (0.5)
Negative Publicity 1 (0.3) 2 (0.4) 1 (0.2) 2 (0.6)
Other Career Interests 13 (0.8) 10 (0.9) 11 (1.1) 6 (0.7)
Long Commitment 12 (0.8) 10 (1.1) 11 (1.1) 7 (1.3)
Note: The population reported in this table includes 16-21 year-old youth with no more than twoyears of postsecondary education residing within the 48 contiguous United States.
Source: 1996 - 1999 YATS
a Estimates are based on 1,677 interviews. c Estimates are based on 1,046 interviews.b Estimates are based on 1,060 interviews. d Estimates are based on 556 interviews.
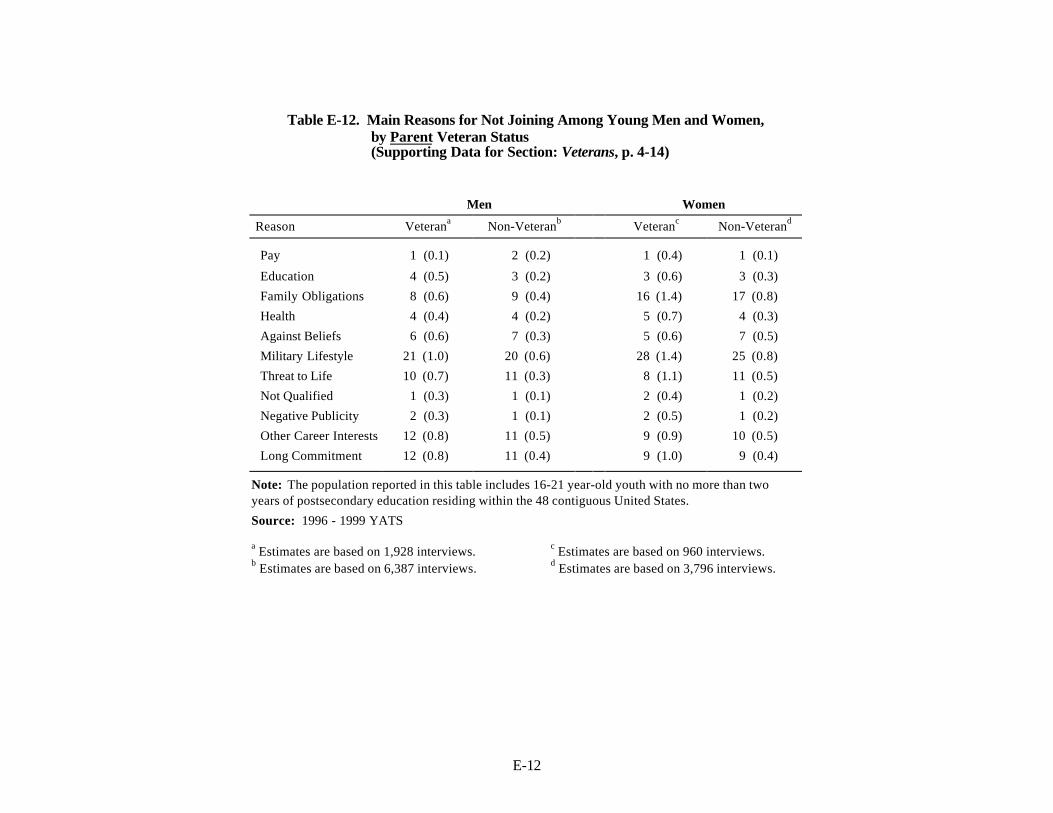
E-12
Table E-12. Main Reasons for Not Joining Among Young Men and Women,by Parent Veteran Status(Supporting Data for Section: Veterans, p. 4-14)
Men Women
Reason Veterana Non-Veteranb Veteranc Non-Veterand
Pay 1 (0.1) 2 (0.2) 1 (0.4) 1 (0.1)
Education 4 (0.5) 3 (0.2) 3 (0.6) 3 (0.3)
Family Obligations 8 (0.6) 9 (0.4) 16 (1.4) 17 (0.8)
Health 4 (0.4) 4 (0.2) 5 (0.7) 4 (0.3)
Against Beliefs 6 (0.6) 7 (0.3) 5 (0.6) 7 (0.5)
Military Lifestyle 21 (1.0) 20 (0.6) 28 (1.4) 25 (0.8)
Threat to Life 10 (0.7) 11 (0.3) 8 (1.1) 11 (0.5)
Not Qualified 1 (0.3) 1 (0.1) 2 (0.4) 1 (0.2)
Negative Publicity 2 (0.3) 1 (0.1) 2 (0.5) 1 (0.2)
Other Career Interests 12 (0.8) 11 (0.5) 9 (0.9) 10 (0.5)
Long Commitment 12 (0.8) 11 (0.4) 9 (1.0) 9 (0.4)
Note: The population reported in this table includes 16-21 year-old youth with no more than twoyears of postsecondary education residing within the 48 contiguous United States.
Source: 1996 - 1999 YATS
a Estimates are based on 1,928 interviews. c Estimates are based on 960 interviews.b Estimates are based on 6,387 interviews. d Estimates are based on 3,796 interviews.

E-13
Table E-13. Main Reasons for Not Joining Among Young Men and Women,by Friend Veteran Status(Supporting Data for Section: Veterans, p. 4-14)
Men Women
Reason Veterana Non-Veteranb Veteranc Non-Veterand
Pay 2 (0.3) 2 (0.1) 1 (0.3) 1 (0.1)
Education 3 (0.4) 4 (0.3) 4 (0.6) 3 (0.3)
Family Obligations 10 (0.6) 9 (0.4) 15 (1.2) 17 (0.8)
Health 4 (0.4) 4 (0.2) 5 (0.5) 4 (0.3)
Against Beliefs 7 (0.5) 6 (0.4) 7 (0.8) 6 (0.4)
Military Lifestyle 20 (0.9) 20 (0.6) 25 (1.5) 26 (0.9)
Threat to Life 11 (0.7) 11 (0.4) 10 (1.0) 11 (0.6)
Not Qualified 2 (0.3) 1 (0.2) 1 (0.4) 1 (0.2)
Negative Publicity 2 (0.3) 1 (0.2) 2 (0.4) 1 (0.2)
Other Career Interests 10 (0.7) 12 (0.5) 10 (0.9) 10 (0.5)
Long Commitment 12 (0.7) 10 (0.4) 10 (1.0) 9 (0.6)
Note: The population reported in this table includes 16-21 year-old youth with no more than twoyears of postsecondary education residing within the 48 contiguous United States.
Source: 1991 - 1999 YATS
a Estimates are based on 2,269 interviews. c Estimates are based on 1,151 interviews.b Estimates are based on 6,046 interviews. d Estimates are based on 3,605 interviews.

E-14
Table E-14. Main Reasons for Decreased Interest in the MilitaryAmong Young Men and Women(Supporting Data for Table 4-6, p. 4-16)
Men Women
LifeOther Career Plans 20 (0.9) 19 (0.9)Going to School 16 (0.8) 13 (0.8)Current Circumstances Preferable 7 (0.5) 8 (0.8)Employed 7 (0.4) 3 (0.5)Increased Obligation 4 (0.4) 10 (0.8)Getting Older/More Mature 2 (0.3) 1 (0.2)
Saw/TalkedTalk with Military 4 (0.3) 4 (0.5)News/World Events 2 (0.2) 2 (0.4)Recruiter Contacts 2 (0.2) 2 (0.3)Talk with Non-Military 1 (0.2) 1 (0.2)
MilitaryDislike Military 10 (0.6) 9 (0.7)Not for Youth 9 (0.5) 11 (0.7)Not Qualified 5 (0.4) 3 (0.4)Negative Experience 3 (0.5) 4 (0.5)Danger 2 (0.2) 2 (0.3)Downsizing 1 (0.2) 0 (--)Base Closings 0 (--) 0 (--)
Note: The population reported in this table includes 16-21 year-old youth with nomore than two years of postsecondary education residing within the 48 contiguousUnited States, who said their interest in military service had increased in the pastyear.
Source: 1996 - 1999 YATS


Appendix F
Supplementary Data Tables for Chapter 5

F-1
Table F-1. Service Advertising Budgets(Supporting Data for Figure 5-1, p. 5-3)
Fiscal Year ($M)
Service 1990 1991 1992 1993 1994 1995 1996 1997 1998 1999
Army 80 54 45 36 48 60 70 99 95 95
Navy 29 17 13 15 35 41 41 39 63 31
Marine Corps 19 12 12 12 12 11 15 22 22 20
Air Force 8 4 5 6 7 12 10 12 12 12
JRAP 19 15 5 5 5 24 17 4 4 4
Note: Constant FY 1999 DollarsSource: Accession Policy [OASD(FMP)]
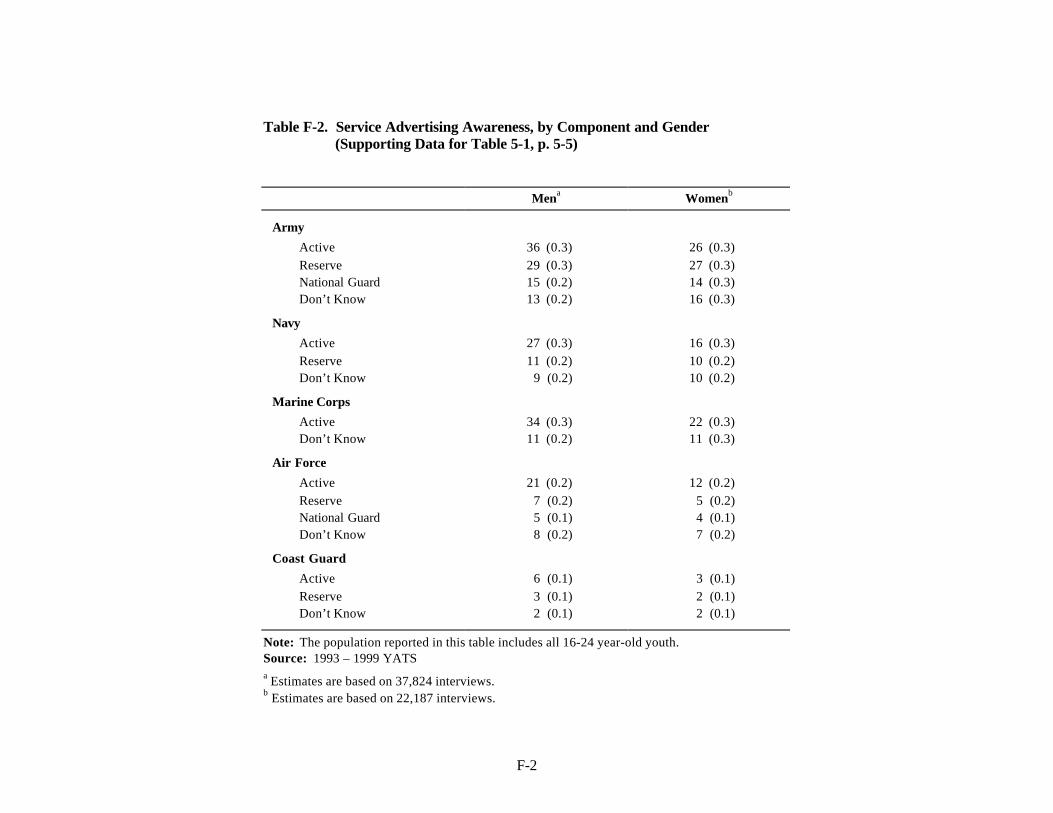
F-2
Table F-2. Service Advertising Awareness, by Component and Gender(Supporting Data for Table 5-1, p. 5-5)
Mena Womenb
Army
Active 36 (0.3) 26 (0.3)Reserve 29 (0.3) 27 (0.3)National Guard 15 (0.2) 14 (0.3)Don’t Know 13 (0.2) 16 (0.3)
Navy
Active 27 (0.3) 16 (0.3)Reserve 11 (0.2) 10 (0.2)Don’t Know 9 (0.2) 10 (0.2)
Marine Corps
Active 34 (0.3) 22 (0.3)Don’t Know 11 (0.2) 11 (0.3)
Air Force
Active 21 (0.2) 12 (0.2)Reserve 7 (0.2) 5 (0.2)National Guard 5 (0.1) 4 (0.1)Don’t Know 8 (0.2) 7 (0.2)
Coast Guard
Active 6 (0.1) 3 (0.1)Reserve 3 (0.1) 2 (0.1)Don’t Know 2 (0.1) 2 (0.1)
Note: The population reported in this table includes all 16-24 year-old youth.Source: 1993 – 1999 YATSa Estimates are based on 37,824 interviews.b Estimates are based on 22,187 interviews.

F-3
Table F-3. Active Service Advertising Awareness Among Men, by Age(Supporting Data for Figure 5-2, p. 5-6)
Age
Service 16a 17b 18c 19d 20e 21f 22g 23h 24i
Army 28 (0.7) 32 (0.6) 33 (0.8) 35 (0.8) 38 (1.0) 38 (1.0) 38 (1.0) 41 (1.0) 40 (1.0)
Navy 21 (0.6) 26 (0.6) 28 (0.9) 28 (0.7) 30 (0.9) 27 (0.8) 31 (0.8) 29 (0.9) 28 (0.8)
Marine Corps 25 (0.5) 31 (0.6) 33 (0.9) 34 (0.9) 37 (0.9) 36 (1.1) 38 (0.8) 39 (0.9) 38 (0.9)
Air Force 15 (0.5) 19 (0.6) 21 (0.6) 21 (0.7) 23 (0.8) 21 (0.7) 24 (0.8) 23 (0.8) 23 (0.9)
Coast Guard 4 (0.3) 5 (0.4) 7 (0.4) 7 (0.4) 6 (0.4) 6 (0.5) 6 (0.5) 7 (0.5) 6 (0.5)
Note: The population reported in this table includes all 16-24 year-old youth.Source: 1993 - 1999 YATS
a Estimates are based on 6,227 interviews. f Estimates are based on 3,710 interviews.b Estimates are based on 5,738 interviews. g Estimates are based on 3,388 interviews.c Estimates are based on 4,775 interviews. h Estimates are based on 3,207 interviews.d Estimates are based on 4,110 interviews. i Estimates are based on 2,735 interviews.e Estimates are based on 3,934 interviews.
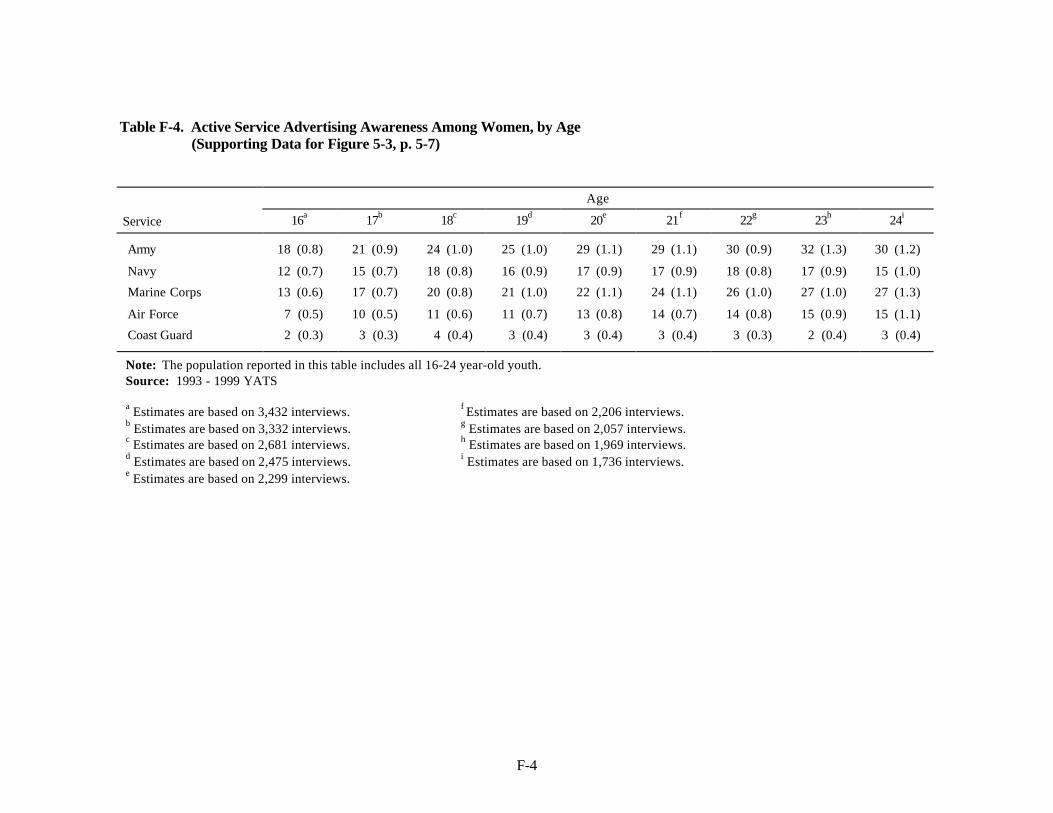
F-4
Table F-4. Active Service Advertising Awareness Among Women, by Age(Supporting Data for Figure 5-3, p. 5-7)
Age
Service 16a 17b 18c 19d 20e 21f 22g 23h 24i
Army 18 (0.8) 21 (0.9) 24 (1.0) 25 (1.0) 29 (1.1) 29 (1.1) 30 (0.9) 32 (1.3) 30 (1.2)
Navy 12 (0.7) 15 (0.7) 18 (0.8) 16 (0.9) 17 (0.9) 17 (0.9) 18 (0.8) 17 (0.9) 15 (1.0)
Marine Corps 13 (0.6) 17 (0.7) 20 (0.8) 21 (1.0) 22 (1.1) 24 (1.1) 26 (1.0) 27 (1.0) 27 (1.3)
Air Force 7 (0.5) 10 (0.5) 11 (0.6) 11 (0.7) 13 (0.8) 14 (0.7) 14 (0.8) 15 (0.9) 15 (1.1)
Coast Guard 2 (0.3) 3 (0.3) 4 (0.4) 3 (0.4) 3 (0.4) 3 (0.4) 3 (0.3) 2 (0.4) 3 (0.4)
Note: The population reported in this table includes all 16-24 year-old youth.Source: 1993 - 1999 YATS
a Estimates are based on 3,432 interviews. f Estimates are based on 2,206 interviews.b Estimates are based on 3,332 interviews. g Estimates are based on 2,057 interviews.c Estimates are based on 2,681 interviews. h Estimates are based on 1,969 interviews.d Estimates are based on 2,475 interviews. i Estimates are based on 1,736 interviews.e Estimates are based on 2,299 interviews.

F-5
Table F-5. Active Service Advertising Awareness, by Education and Gender(Supporting Data for Table 5-2, p. 5-8)
Men Women
Service
Education Army NavyMarineCorps
AirForce
CoastGuard Army Navy
MarineCorps
AirForce
CoastGuard
Students
HS Juniorsa 27 (0.6) 21 (0.5) 24 (0.5) 14 (0.5) 4 (0.3) 17 (0.8) 12 (0.7) 13 (0.6) 7 (0.5) 2 (0.3)
HS Seniorsb 32 (0.6) 27 (0.7) 32 (0.6) 19 (0.6) 6 (0.4) 23 (1.0) 17 (0.8) 18 (0.9) 10 (0.5) 4 (0.4)Postsecondaryc 43 (0.6) 34 (0.5) 42 (0.5) 26 (0.4) 8 (0.3) 32 (0.7) 19 (0.5) 26 (0.6) 14 (0.5) 3 (0.3)
Non-StudentsDropoutsd 28 (0.8) 20 (0.7) 27 (0.7) 15 (0.6) 5 (0.3) 20 (1.1) 11 (0.7) 17 (0.9) 8 (0.7) 2 (0.3)HS Gradse 36 (0.6) 26 (0.5) 34 (0.7) 20 (0.7) 6 (0.3) 27 (0.8) 14 (0.7) 20 (0.7) 12 (0.7) 3 (0.3)
Some Collegef 43 (1.1) 31 (1.0) 42 (1.0) 27 (1.1) 8 (0.7) 32 (1.4) 19 (0.9) 29 (1.3) 16 (1.0) 3 (0.5)BS+g 49 (1.1) 37 (1.3) 46 (1.2) 28 (1.0) 8 (0.8) 35 (1.3) 20 (1.1) 33 (1.4) 19 (1.2) 3 (0.4)
Note: The population reported in this table includes all 16-24 year-old youth.Source: 1993 – 1999 YATS
a Estimates are based on interviews with 7,750 men and 3,852 women.b Estimates are based on interviews with 5,214 men and 3,152 women.c Estimates are based on interviews with 10,838 men and 7,146 women.d Estimates are based on interviews with 4,167 men and 1,858 women.e Estimates are based on interviews with 5,452 men and 2,943 women.f Estimates are based on interviews with 2,293 men and 1,593 women.g Estimates are based on interviews with 1,952 men and 1,551 women.

F-6
Table F-6. Active Service Advertising Awareness, by Race/Ethnicity and Gender(Supporting Data for Table 5-3, p. 5-9)
Men Women
Service
Race/Ethnicity Army NavyMarineCorps
AirForce
CoastGuard Army Navy
MarineCorps
AirForce
CoastGuard
Whitea 40 (0.3) 31 (0.3) 38 (0.3) 24 (0.3) 7 (0.2) 28 (0.4) 18 (0.3) 24 (0.4) 14 (0.3) 3 (0.1)Blackb 29 (0.7) 20 (0.6) 26 (0.9) 14 (0.6) 4 (0.3) 26 (1.0) 14 (0.7) 17 (0.9) 9 (0.6) 2 (0.3)
Hispanicc 26 (0.8) 20 (0.6) 27 (1.0) 13 (0.5) 4 (0.4) 19 (0.8) 10 (0.7) 18 (1.0) 7 (0.6) 2 (0.3)Asiand
28 (1.2) 22 (1.2) 23 (1.0) 15 (1.2) 4 (0.5) 24 (1.6) 14 (1.6) 16 (1.5) 9 (1.4) 3 (0.8)Indiane 29 (2.2) 26 (2.1) 33 (2.3) 20 (1.7) 4 (1.0) 29 (3.3) 14 (1.8) 24 (3.4) 15 (2.6) 3 (1.3)
High School Seniors Only
Whitef37 (1.0) 30 (0.9) 34 (0.9) 21 (0.8) 6 (0.4) 24 (1.0) 17 (0.9) 19 (0.9) 10 (0.5) 4 (0.5)
Blackg 25 (2.0) 18 (2.0) 22 (2.0) 11 (1.5) 5 (1.0) 21 (2.1) 18 (1.9) 15 (2.4) 8 (1.3) 2 (0.6)
Hispanich 23 (1.8) 19 (1.8) 27 (2.2) 12 (1.4) 5 (1.1) 20 (2.9) 15 (2.1) 17 (2.7) 8 (1.8) 3 (1.1)
Note: The population reported in this table includes all 16-24 year-old youth.Source: 1993 – 1999 YATS
a Estimates are based on interviews with 26,662 men and 15,463 women.b Estimates are based on interviews with 3,818 men and 2,719 women.c Estimates are based on interviews with 4,244 men and 2,434 women.d Estimates are based on interviews with 1,472 men and 715 women.e Estimates are based on interviews with 624 men and 300 women.f Estimates are based on interviews with 2,914 men and 1,776 women.g Estimates are based on interviews with 493 men and 367 women.h Estimates are based on interviews with 493 men and 289 women.
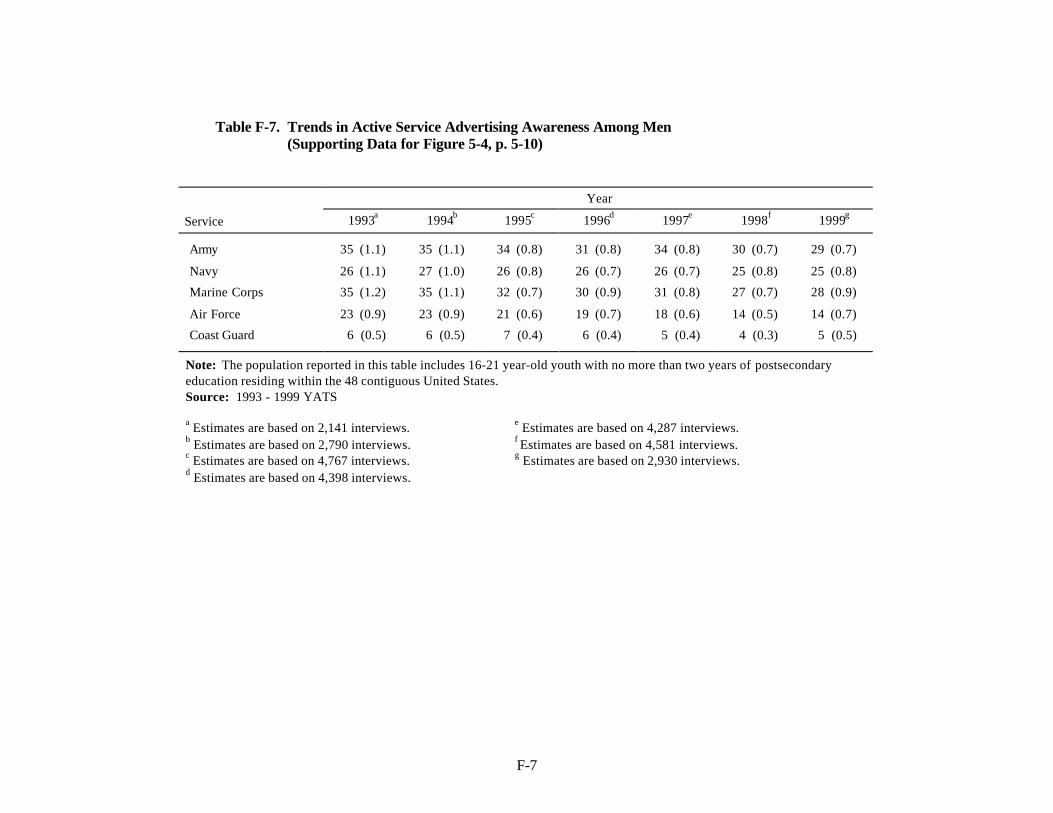
F-7
Table F-7. Trends in Active Service Advertising Awareness Among Men(Supporting Data for Figure 5-4, p. 5-10)
Year
Service 1993a 1994b 1995c 1996d 1997e 1998f 1999g
Army 35 (1.1) 35 (1.1) 34 (0.8) 31 (0.8) 34 (0.8) 30 (0.7) 29 (0.7)
Navy 26 (1.1) 27 (1.0) 26 (0.8) 26 (0.7) 26 (0.7) 25 (0.8) 25 (0.8)
Marine Corps 35 (1.2) 35 (1.1) 32 (0.7) 30 (0.9) 31 (0.8) 27 (0.7) 28 (0.9)
Air Force 23 (0.9) 23 (0.9) 21 (0.6) 19 (0.7) 18 (0.6) 14 (0.5) 14 (0.7)
Coast Guard 6 (0.5) 6 (0.5) 7 (0.4) 6 (0.4) 5 (0.4) 4 (0.3) 5 (0.5)
Note: The population reported in this table includes 16-21 year-old youth with no more than two years of postsecondaryeducation residing within the 48 contiguous United States.Source: 1993 - 1999 YATS
a Estimates are based on 2,141 interviews. e Estimates are based on 4,287 interviews.b Estimates are based on 2,790 interviews. f Estimates are based on 4,581 interviews.c Estimates are based on 4,767 interviews. g Estimates are based on 2,930 interviews.d Estimates are based on 4,398 interviews.

F-8
Table F-8. Trends in Active Service Advertising Awareness Among Women(Supporting Data for Figure 5-5, p. 5-10)
Year
Service 1993a 1994b 1995c 1996d 1997e 1998f 1999g
Army 25 (1.8) 24 (1.1) 23 (0.7) 23 (0.9) 23 (0.9) 22 (0.8) 21 (1.0)
Navy 15 (1.2) 15 (1.1) 17 (0.9) 16 (0.8) 15 (0.7) 15 (0.8) 15 (0.9)
Marine Corps 22 (1.5) 20 (1.1) 18 (0.8) 18 (0.9) 17 (0.8) 16 (0.8) 16 (0.7)
Air Force 12 (1.2) 12 (0.9) 11 (0.7) 11 (0.7) 9 (0.7) 8 (0.6) 8 (0.6)
Coast Guard 2 (0.5) 3 (0.5) 4 (0.4) 3 (0.4) 3 (0.4) 3 (0.4) 3 (0.4)
Note: The population reported in this table includes 16-21 year-old youth with no more than two years of postsecondaryeducation residing within the 48 contiguous United States.Source: 1993 - 1999 YATS
a Estimates are based on 1,101 interviews. e Estimates are based on 2,762 interviews.b Estimates are based on 1,410 interviews. f Estimates are based on 2,482 interviews.c Estimates are based on 2,409 interviews. g Estimates are based on 1,835 interviews.d Estimates are based on 2,469 interviews.
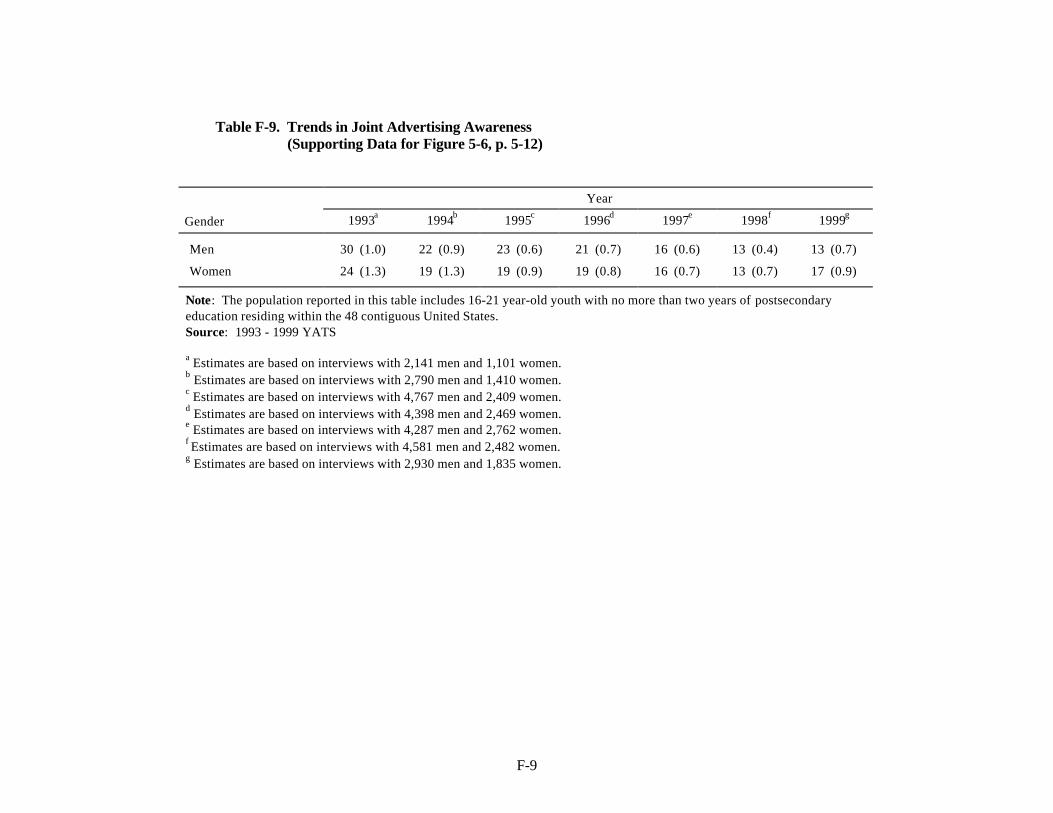
F-9
Table F-9. Trends in Joint Advertising Awareness(Supporting Data for Figure 5-6, p. 5-12)
Year
Gender 1993a 1994b 1995c 1996d 1997e 1998f 1999g
Men 30 (1.0) 22 (0.9) 23 (0.6) 21 (0.7) 16 (0.6) 13 (0.4) 13 (0.7)
Women 24 (1.3) 19 (1.3) 19 (0.9) 19 (0.8) 16 (0.7) 13 (0.7) 17 (0.9)
Note: The population reported in this table includes 16-21 year-old youth with no more than two years of postsecondaryeducation residing within the 48 contiguous United States.Source: 1993 - 1999 YATS
a Estimates are based on interviews with 2,141 men and 1,101 women.b Estimates are based on interviews with 2,790 men and 1,410 women.c Estimates are based on interviews with 4,767 men and 2,409 women.d Estimates are based on interviews with 4,398 men and 2,469 women.e Estimates are based on interviews with 4,287 men and 2,762 women.f Estimates are based on interviews with 4,581 men and 2,482 women.g Estimates are based on interviews with 2,930 men and 1,835 women.

F-10
Table F-10. Trends in Correct Army Slogan Recognition(Supporting Data for Figure 5-7, p. 5-14)
Year
Slogan/Gender 1990a 1991b 1992c 1993d 1994e 1995f 1996g 1997h 1998i 1999j
Be All You Can Be
Men 88 (0.6) 89 (1.0) 89 (0.8) 88 (0.7) 90 (0.8) 91 (0.4) 91 (0.5) 93 (0.5) 90 (0.5) 91 (0.6)
Women 87 (0.9) 88 (1.3) 91 (1.0) 87 (1.4) 86 (1.2) 88 (0.7) 88 (0.7) 87 (0.7) 87 (0.8) 88 (0.7)
Get an Edge on Life
Men 62 (0.8) 59 (1.1) 69 (1.1) 54 (1.1) 58 (1.0) 61 (0.6) 52 (0.8) 44 (0.9) 36 (0.7) 28 (0.8)
Women 51 (1.1) 52 (1.8) 62 (1.6) 51 (1.5) 53 (1.4) 55 (1.0) 47 (1.0) 37 (1.0) 27 (1.0) 21 (0.8)
Note: The population reported in this table includes 16-21 year-old youth with no more than two years of postsecondary education residing within the 48contiguous United States.Source: 1990 - 1999 YATS
a Estimates are based on interviews with 4,196 men and 2,143 women.b Estimates are based on interviews with 2,122 men and 1,066 women.c Estimates are based on interviews with 2,298 men and 1,300 women.d Estimates are based on interviews with 2,141 men and 1,101 women.e Estimates are based on interviews with 2,790 men and 1,410 women.f Estimates are based on interviews with 4,767 men and 2,409 women.g Estimates are based on interviews with 4,398 men and 2,469 women.h Estimates are based on interviews with 4,287 men and 2,762 women.i Estimates are based on interviews with 4,581 men and 2,482 women.j Estimates are based on interviews with 4,338 men and 2,657 women.

F-11
Table F-11. Trends in Correct Navy Slogan Recognition(Supporting Data for Figure 5-8, p. 5-15)
Year
Slogan/Gender 1990a 1991b 1992c 1993d 1994e 1995f 1996g 1997h 1998i 1999j
Full Speed Ahead
Men 41 (0.8) 46 (1.1) 46 (1.0) 48 (1.3) 53 (1.0) 54 (0.9) 53 (1.0) 49 (0.8) 45 (1.0) --
Women 22 (1.1) 37 (1.6) 32 (1.5) 31 (1.5) 37 (1.2) 39 (1.0) 36 (1.1) 29 (0.8) 28 (1.2) --
Not Just a Job…AnAdventure
Men 14 (0.6) 13 (0.7) 11 (0.7) 14 (1.0) 14 (0.7) 18 (0.6) 18 (0.6) -- -- --
Women 9 (0.7) 10 (1.2) 11 (1.2) 8 (0.9) 12 (1.1) 13 (0.7) 13 (0.8) -- -- --
Let the Journey Begin
Men -- -- -- -- -- -- 20 (0.6) 19 (0.7) 27 (0.7) 36 (0.8)
Women -- -- -- -- -- -- 13 (0.8) 9 (0.6) 14 (0.8) 20 (0.8)
Notes: (1) The population reported in this table includes 16-21 year-old youth with no more than two years of postsecondary education residing within the48 contiguous United States.
(2) "--" indicates that the slogan was not asked during the YATS interview.Source: 1990 - 1999 YATS
a Estimates are based on interviews with 4,196 men and 2,143 women.b Estimates are based on interviews with 2,122 men and 1,066 women.c Estimates are based on interviews with 2,298 men and 1,300 women.d Estimates are based on interviews with 2,141 men and 1,101 women.e Estimates are based on interviews with 2,790 men and 1,410 women.f Estimates are based on interviews with 4,767 men and 2,409 women.g Estimates are based on interviews with 4,398 men and 2,469 women.h Estimates are based on interviews with 4,287 men and 2,762 women.i Estimates are based on interviews with 4,581 men and 2,482 women.j Estimates are based on interviews with 4,338 men and 2,657 women.
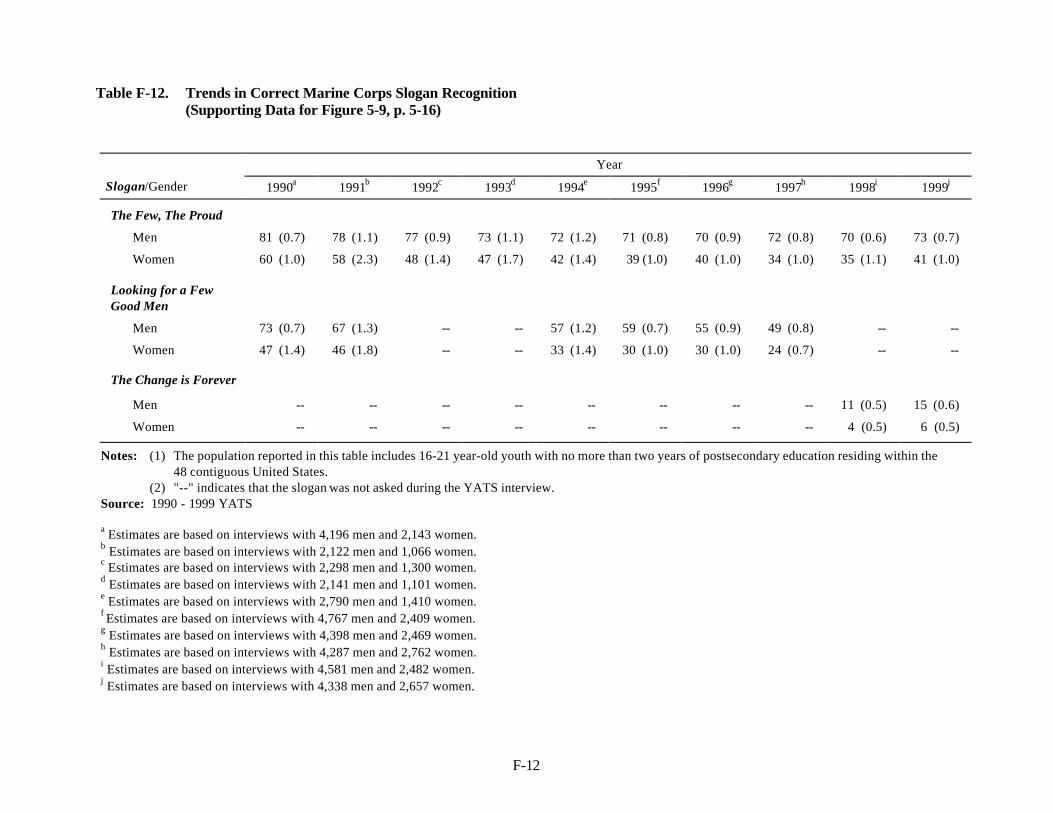
F-12
Table F-12. Trends in Correct Marine Corps Slogan Recognition(Supporting Data for Figure 5-9, p. 5-16)
Year
Slogan/Gender 1990a 1991b 1992c 1993d 1994e 1995f 1996g 1997h 1998i 1999j
The Few, The Proud
Men 81 (0.7) 78 (1.1) 77 (0.9) 73 (1.1) 72 (1.2) 71 (0.8) 70 (0.9) 72 (0.8) 70 (0.6) 73 (0.7)
Women 60 (1.0) 58 (2.3) 48 (1.4) 47 (1.7) 42 (1.4) 39 (1.0) 40 (1.0) 34 (1.0) 35 (1.1) 41 (1.0)
Looking for a FewGood Men
Men 73 (0.7) 67 (1.3) -- -- 57 (1.2) 59 (0.7) 55 (0.9) 49 (0.8) -- --
Women 47 (1.4) 46 (1.8) -- -- 33 (1.4) 30 (1.0) 30 (1.0) 24 (0.7) -- --
The Change is Forever
Men -- -- -- -- -- -- -- -- 11 (0.5) 15 (0.6)
Women -- -- -- -- -- -- -- -- 4 (0.5) 6 (0.5)
Notes: (1) The population reported in this table includes 16-21 year-old youth with no more than two years of postsecondary education residing within the48 contiguous United States.
(2) "--" indicates that the slogan was not asked during the YATS interview.Source: 1990 - 1999 YATS
a Estimates are based on interviews with 4,196 men and 2,143 women.b Estimates are based on interviews with 2,122 men and 1,066 women.c Estimates are based on interviews with 2,298 men and 1,300 women.d Estimates are based on interviews with 2,141 men and 1,101 women.e Estimates are based on interviews with 2,790 men and 1,410 women.f Estimates are based on interviews with 4,767 men and 2,409 women.g Estimates are based on interviews with 4,398 men and 2,469 women.h Estimates are based on interviews with 4,287 men and 2,762 women.i Estimates are based on interviews with 4,581 men and 2,482 women.j Estimates are based on interviews with 4,338 men and 2,657 women.

F-13
Table F-13. Trends in Correct Air Force Slogan Recognition(Supporting Data for Figure 5-10, p. 5-17)
Year
Slogan/Gender 1990a 1991b 1992c 1993d 1994e 1995f 1996g 1997h 1998i 1999j
Aim High
Men 90 (0.5) 89 (0.8) 87 (0.8) 86 (1.1) 83 (1.0) 82 (0.6) 76 (0.7) 72 (0.8) 65 (0.9) 65 (0.7)
Women 72 (1.1) 70 (1.8) 67 (1.6) 67 (1.7) 64 (1.5) 62 (1.2) 58 (1.2) 47 (1.1) 45 (1.2) 47 (1.1)
Note: The population reported in this table includes 16-21 year-old youth with no more than two years of postsecondary education residing within the 48contiguous United States.Source: 1990 - 1999 YATS
a Estimates are based on interviews with 4,196 men and 2,143 women.b Estimates are based on interviews with 2,122 men and 1,066 women.c Estimates are based on interviews with 2,298 men and 1,300 women.d Estimates are based on interviews with 2,141 men and 1,101 women.e Estimates are based on interviews with 2,790 men and 1,410 women.f Estimates are based on interviews with 4,767 men and 2,409 women.g Estimates are based on interviews with 4,398 men and 2,469 women.h Estimates are based on interviews with 4,287 men and 2,762 women.i Estimates are based on interviews with 4,581 men and 2,482 women.j Estimates are based on interviews with 4,338 men and 2,657 women.
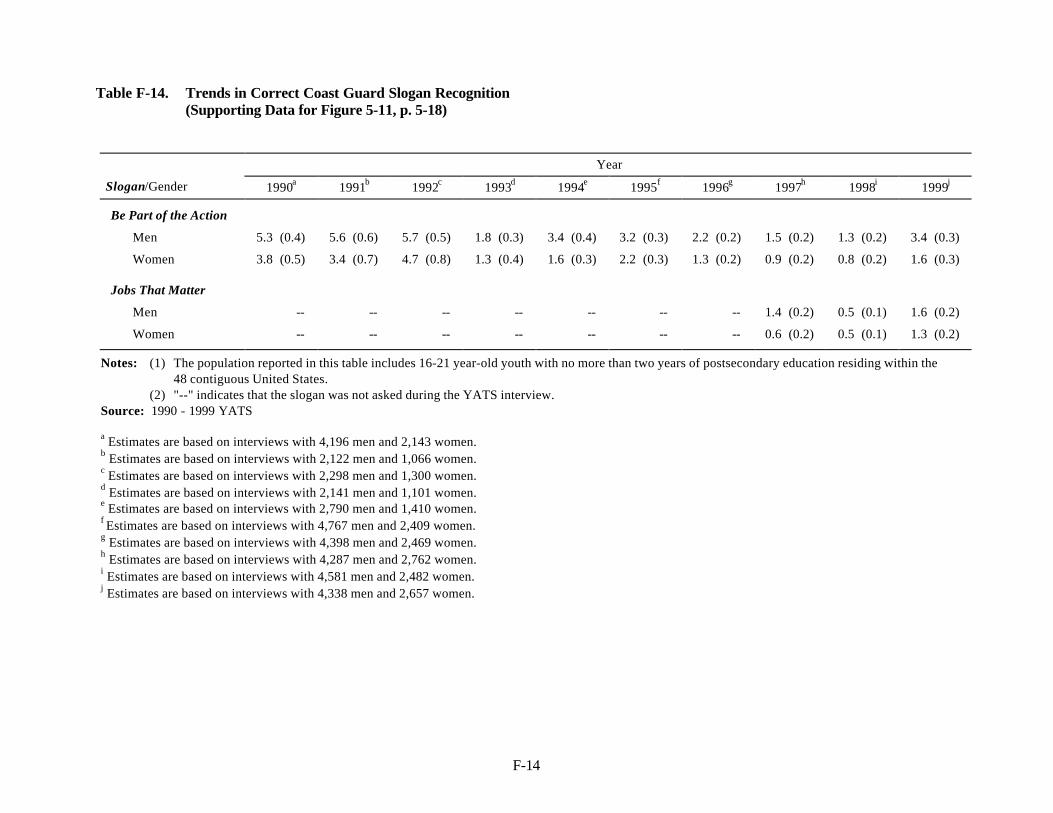
F-14
Table F-14. Trends in Correct Coast Guard Slogan Recognition(Supporting Data for Figure 5-11, p. 5-18)
Year
Slogan/Gender 1990a 1991b 1992c 1993d 1994e 1995f 1996g 1997h 1998i 1999j
Be Part of the Action
Men 5.3 (0.4) 5.6 (0.6) 5.7 (0.5) 1.8 (0.3) 3.4 (0.4) 3.2 (0.3) 2.2 (0.2) 1.5 (0.2) 1.3 (0.2) 3.4 (0.3)
Women 3.8 (0.5) 3.4 (0.7) 4.7 (0.8) 1.3 (0.4) 1.6 (0.3) 2.2 (0.3) 1.3 (0.2) 0.9 (0.2) 0.8 (0.2) 1.6 (0.3)
Jobs That Matter
Men -- -- -- -- -- -- -- 1.4 (0.2) 0.5 (0.1) 1.6 (0.2)
Women -- -- -- -- -- -- -- 0.6 (0.2) 0.5 (0.1) 1.3 (0.2)
Notes: (1) The population reported in this table includes 16-21 year-old youth with no more than two years of postsecondary education residing within the48 contiguous United States.
(2) "--" indicates that the slogan was not asked during the YATS interview.Source: 1990 - 1999 YATS
a Estimates are based on interviews with 4,196 men and 2,143 women.b Estimates are based on interviews with 2,122 men and 1,066 women.c Estimates are based on interviews with 2,298 men and 1,300 women.d Estimates are based on interviews with 2,141 men and 1,101 women.e Estimates are based on interviews with 2,790 men and 1,410 women.f Estimates are based on interviews with 4,767 men and 2,409 women.g Estimates are based on interviews with 4,398 men and 2,469 women.h Estimates are based on interviews with 4,287 men and 2,762 women.i Estimates are based on interviews with 4,581 men and 2,482 women.j Estimates are based on interviews with 4,338 men and 2,657 women.

F-15
Table F-15. Recruiter Contact by Advertising Awareness and Gender(Supporting Data for Table 5-5, p. 5-20)
Percent Contacting a Recruiter in the Past Year
Mena Womenb
Any Military Advertising
Within the past year, do you recall seeing or hearingany advertising that encouraged people to enlist inone or more of the Services?
Yes 50 (0.6) 42 (0.7)No 41 (1.5) 27 (2.0)
Joint Service Advertising
Do you recall seeing or hearing any advertising for the U.S.Armed Forces in which all the Services were represented?
Yes 55 (1.4) 47 (2.0)No 47 (0.7) 38 (0.7)
Note: The population reported in this table includes 16-21 year-old youth with no more than two years of post-secondary education residing within the 48 contiguous United States.Source: 1993 – 1999 YATSa Estimates are based on 11,868 interviews.b Estimates are based on 5,950 interviews.

F-16
Table F-16. Recruiter Contact by Service-Specific Advertising Awareness and Gender(Supporting Data for Table 5-6, p. 5-21)
Percent Contacting Percent Contactinga Recruiter a {SERVICE} Recruiter
in the Past Yeara in the Past Yeara
Men Women Men Women
Within the past year, do you recall seeing or hearing any advertising that encouraged people to enlist in one or more of the Services?
ArmyYes, Recalled Army advertising 51 (0.7) 42 (0.8) 28 (0.6) 23 (1.2)No, Did not recall Army advertising 43 (1.1) 34 (1.4) 17 (0.8) 12 (1.1)
NavyYes, Recalled Navy advertising 52 (0.8) 45 (1.2) 17 (0.5) 14 (0.7)No, Did not recall Navy advertising 46 (0.8) 37 (0.9) 9 (0.4) 6 (0.4)
Marine CorpsYes, Recalled Marine Corps advertising 53 (0.9) 45 (1.2) 24 (0.5) 14 (0.9)No, Did not recall Marine Corps advertising 44 (0.9) 37 (0.9) 11 (0.6) 4 (0.3)
Air ForceYes, Recalled Air Force advertising 54 (1.0) 49 (1.5) 13 (0.7) 17 (1.3)No, Did not recall Air Force advertising 46 (0.7) 37 (0.8) 4 (0.2) 4 (0.3)
Coast GuardYes, Recalled Coast Guard advertising 56 (1.6) 49 (2.8) 3 (0.7) 4 (1.3)No, Did not recall Coast Guard advertising 48 (0.7) 39 (0.7) 1 (0.1) 0 ( -- )
Note: The population reported in this table includes 16-21 year-old youth with no more than two years of post-secondaryeducation residing within the 48 contiguous United States.Source: 1993 – 1999 YATS.a Estimates are based on interviews with 11,868 men and 5,950 women.

REPORT DOCUMENTATION PAGE Form ApprovedOMB No. 0704-0188
Public reporting burden for this collection of information is estimated to average 1 hour per response, including the time for reviewing instructions, searching existing datasources, gathering and maintaining the data needed, and completing and reviewing the collection of information. Send comments regarding this burden estimate or any otheraspect of this collection of information, including suggestions for reducing the burden, to Washington Headquarters Services, Directorate for Information Operations and Reports,1215 Jefferson Davis Highway, Suite 1204, Arlington, VA 22202-4302, and to the Office of Management and Budget, Paperwork Reduction Project (0704-0188), Washington, DC20503.
1. AGENCY USE ONLY (Leave blank) 2. REPORT DATEJune 14, 2000
3. REPORT TYPE AND DATES COVEREDFinal
4. TITLE AND SUBTITLEYouth Attitude Tracking Study 1999: Propensity andAdvertising Report
5. FUNDING NUMBERS
C - DASW01-96-C-0041WU - Item 0020BA
6. AUTHOR (S)Michael J Wilson, James B. Greenlees, Tracey Hagerty, CynthiaV. Helba, D. Wayne Hintze, and Jerome D. Lehnus
7. PERFORMING ORGANIZATION NAMES (S) AND ADDRESS (ES)
Westat, Inc.1650 Research Blvd.Rockville, MD 20850
8. PERFORMING ORGANIZATIONREPORT NUMBER
9. SPONSORING/MONITORING AGENCY NAMES(S) AND ADDRESS(ES)Defense Manpower Data Center Attn: Dr. Jerome D. Lehnus1555 N. Wilson Blvd., Suite 701Arlington, VA 22209-2593
10. SPONSORING/MONITORING AGENCY REPORT NUMBER
11. SUPPLEMENTARY NOTES
12a. DISTRIBUTION/AVAILABILITY STATEMENT 12b. DISTRIBUTION CODE
13. ABSTRACT (Maximum 200 words)
This report presents findings from the Fall 1999 Youth Attitude Tracking Study (YATS)survey administration conducted by Westat during the Fall of 1999. Findings coverresults from questions on enlistment propensity, advertising awareness, recruitercontact, slogan recognition, media habits, and Internet usage among 16- to 24- year-oldAmerican youth. Findings are presented separately for males and females by demographicfactors such as age, race/ethnicity, school status, employment status, and region ofresidence.
Interviews were conducted with 10,054 youth between August 30 and November 21, 1999.Interviews lasted approximately 30 minutes and were administered using the computerassisted telephone interviewing (CATI) methodology. Youth who participated in thesurvey were part of a cross-sectional sample of the population which was selected by alist-assisted random digit dialing (RDD) method.
-
14. SUBJECT TERMSyouth attitudes, enlistment propensity, military advertising,
15. NUMBER OF PAGES 161
military advertising awareness, slogan recognition, media habits,Internet
16. PRICE CODE
17. SECURITY CLASSIFICATIONOF REPORT
Unclassified
18. SECURITY CLASSIFICATIONOF THIS PAGE
Unclassified
19. SECURITY CLASSIFICATIONOF ABSTRACT
Unclassified
20. LIMITATION OF ABSTRACT
SAR
NSN 7540-01-280-5500 Standard Form 298 (Rev. 2-89)Prescribed by ANSI Std 239-18
