youth smo · state-specific anti-smoking sentiment based on the data collected in september 1995...
TRANSCRIPT

ꠚꠚꠚꠚꠚꠚꠚꠚꠚꠚꠚꠚꠚꠚꠚꠚꠚꠚꠚꠚꠚꠚꠚꠚꠚꠚꠚꠚꠚꠚꠚꠚꠚꠚꠚꠚꠚꠚꠚꠚꠚꠚꠚꠚꠚꠚꠚꠚꠚꠏꠏꠏꠏꠏꠏꠏꠏꠏꠏꠏꠏꠏꠏꠏꠏꠏꠏꠏꠏꠏꠏꠏꠏꠏꠏꠏꠏꠏꠏꠏꠏꠏꠏꠏꠏꠏꠏꠏꠏꠏꠏꠏꠏꠏꠏꠏꠏꠏ
Youth Smoking, Taxes, andAnti-Smoking Sentiment
Yoon-Jeong Shinꠏꠏꠏꠏꠏꠏꠏꠏꠏꠏꠏꠏꠏꠏꠏꠏꠏꠏꠏꠏꠏꠏꠏꠏꠏꠏꠏꠏꠏꠏꠏꠏꠏꠏꠏꠏꠏꠏꠏꠏꠏꠏꠏꠏꠏꠏꠏꠏꠏꠚꠚꠚꠚꠚꠚꠚꠚꠚꠚꠚꠚꠚꠚꠚꠚꠚꠚꠚꠚꠚꠚꠚꠚꠚꠚꠚꠚꠚꠚꠚꠚꠚꠚꠚꠚꠚꠚꠚꠚꠚꠚꠚꠚꠚꠚꠚꠚꠚ
This study aims to estimate the effect of tobacco tax increases on smoking behavior and initiation among youth by using the data collected from the National Longitudinal Study of Adolescent Health (Add Health) in 1995 and 1996. In addition, the author measured state-specific anti-smoking sentiment based on the data collected in September 1995 and May 1996 through the Current Population Survey, Tobacco Use Supplement. These measures are used as additional control variables in standard cross-section models of youth smoking behavior. For an analysis of smoking initiation among youth, the author used retrospective information on the age of initial cigarette smoking among students and estimated hazard models with state fixed effects. When no control was exerted on unobservable state-specific anti-smoking sentiment, price effects were negative and significant for both the cross-sectional models and the hazard models. In the smoking participation model, the price elasticity was -0.5384 for the 1995 cross-section and -0.4225 for the 1996 cross-section, a similar level as those seen in previous cross-sectional studies on youth smoking. When the state specific anti-smoking sentiment was controlled, however, estimated price effects were positive and insignificant. Findings from this study imply that the price effects found in previous cross-sectional studies could have been overestimated because they failed to control the state specific anti-smoking sentiment which is correlated with the cigarette price of the state. Also, the findings suggest that anti-smoking sentiment is a strong influence on youth smoking behaviors. It may be possible to design prevention policies that take advantage of this effect. Keywords: youth smoking, cigarette price
___________________
筆 : 한국보건사회연구원 책임연구원 ▶ I thank Donald Kenkel and Alan Mathios for helpful comments. I
also thank Pam Baxter and Carol Murphree at CISER for the administration of data from Add Health and CPS Tobacco Use Supplements. Financial support from the Robert Wood Johnson Foundation is gratefully acknowledged.

保健社 硏究 第22卷 第2號4
1. Introduction
Most data show that the prevalence of youth smoking in the United States increased substantially during the 1990s. Data from Monitoring the Future show that from 1992 to 1999 daily smoking among 12th grade youth increased from 17 percent to 23 percent. Many public health officials look to higher cigarette prices as an effective policy tool to reverse the trend of increased youth smoking (CBO 1998, NCI 1993, GAO 1998). As one of the objectives to reduce tobacco use, Healthy People 2010 recommends increasing average federal and state tax on cigarettes from the baseline $0.63 in 1998 to $2.00 in 2010. Recently many state governments have increased taxes on cigarettes, and implemented strong anti-smoking campaigns. For example, California increased its tax on cigarettes from $0.37 to $0.87 as of January 1, 1999, and began a voter- initiated tobacco education media campaign along with other aggressive anti-tobacco efforts. A consensus has emerged that higher cigarette taxes or prices are very effective in preventing youth smoking (Lewit, Coate and Grossman, 1981; Chaloupka and Grossman, 1996; Lewit et al., 1997; CDC, 1998; Harris and Chan, 1999). While results vary depending on the data set and age groups studied, the cross-sectional studies generally show if cigarette price were increased by 10 percent youth smoking participation would decrease by 7.6 percent to 12 percent (GAO 1989). Cross-sectional studies use variation across states in cigarette taxes as a natural experiment to identify price-responsiveness. However, tax rates are not randomly set, but result from the

Youth Smoking, Taxes, and Anti-Smoking Sentiment 5
political process. Empirically, some patterns are easy to see. For example, tobacco-producing states in the southeast set very low tax rates. If anti-smoking sentiment is also lower in these states, the results of the cross-sectional studies could be biased. That is, differences in youth smoking due to differences in the level of anti-smoking sentiment in their state of residence will be incorrectly attributed to differences in tax rates. Previous cross-sectional studies have been unable to address this problem because they lack good measures of anti-smoking sentiment by state. This study re-estimates the effect of higher prices or taxes on youth current smoking, ever smoking, and onset smoking behaviors. The data are from the National Longitudinal Study of Adolescent Health (Add Health) collected in 1995 and in 1996. The data from Add Health contain not only information on students' current and ever smoking behaviors, but also information on the age when students smoked a whole cigarette for the first time, and the age when students started smoking cigarettes regularly. With the information whether students currently smoke cigarettes and ever smoked cigarettes, I construct cross-sectional models on youth current smoking and ever smoking behaviors. Also, with the retrospective information on age when students started smoking cigarettes, I construct hazard models on youth onset smoking behaviors. For the cross-sectional analysis, this study develops new measures of state specific anti-smoking sentiment, and uses these measures as additional control variables in the standard cross- sectional models of cigarette use. The measures of state specific anti-smoking sentiment are based on responses to a series of questions about smoking attitudes included in the Current Population Survey, Tobacco Use Supplement collected in September 1995, and

保健社 硏究 第22卷 第2號6
May 1996. For the hazard models of youth onset smoking behaviors, I include state fixed effects in the models. The state fixed effects model uses variation of cigarette prices within a state. The state fixed effects control for unobservable constant state specific anti-smoking sentiment. This study shows how estimated price effects on youth smoking behaviors are sensitive to controlling for the unobservable state specific anti-smoking sentiment for both of the cross-sectional models and the hazard models. The results from this study demonstrate the importance of controlling for the unobservable state specific anti-smoking sentiment when studies estimate price effects. The findings of this study suggest that previous cross-sectional studies on youth smoking yield biased price effects because the studies do not relevantly control for state specific anti-smoking sentiment. Based on the findings, this study discusses whether high cigarette prices would be effective policy to prevent youths from smoking.
2. Background
Data from the National Youth Tobacco Survey (NYTS) show that in 1999, 9.2 percent of middle school students and 28.4 percent of high school students smoked one or more cigarettes during the 30 days preceding the survey (Healton et al., 2000). During the 1990’s the prevalence of youth smoking significantly increased. From 1992 to 1999, thirty-day smoking among 12th graders increased from 27.8 percent to 34.6 percent (Monitoring the

Youth Smoking, Taxes, and Anti-Smoking Sentiment 7
Future Study, 2000). The increase in youth smoking, given the addictive nature of smoking, translates into an increase in young adult smoking. According to data from National Household Survey on Drug Abuse, between 1994 and 1998, the number of young adults aged 18~25 who smoked in the past month increased from 34.6 percent to 41.6 percent (Substance Abuse and Mental Health Service Administration, 1999). In the past, federal and state governments have increased the price of cigarettes with the goal of reducing the smoking rate. In 1997 President Clinton proposed an increase in cigarette prices of $1.50 a pack over the next decade. The main purpose of this large increase of cigarette prices is to deter youths from smoking (The Nation’s Health, 1997). In addition, settlements between the tobacco industry and state government attorneys general have a provision to increase real cigarette prices. (General Accounting Office, 1998). Much of the literature shows evidence of a relationship among tobacco-production, low taxes on cigarettes, weak tobacco control policies, and high smoking rates. The nationally representative data from the Youth Risk Behavior Surveillance System in 1997 show that youths in the Southeast tobacco region are more likely to smoke than are youths in the other states.1) The states in the Southeast tobacco region are also less likely to prevent youths from accessing tobacco products than are other states (Alciati et al., 1998).2) In addition, while California, Hawaii, and Utah recently
1) The data show that in 1997 the prevalence of thirty-day cigarette smoking of 9-12 graders was 47 percent in Kentucky, 38.6 percent in South Carolina, and 38.6 percent in Tennessee. In the other states, especially states which conduct comprehensive programs preventing and reducing tobacco use, a relatively small number of youth smoke. In 1997 the prevalence of thirty day cigarette smoking of 9-12 graders was 26.6 percent in California, 16.4 percent in Utah, 33.6 percent in Florida, and 29.2 percent in Hawaii.
2) Alciati et al. (1998) developed a rating system which evaluates the

保健社 硏究 第22卷 第2號8
increased the tax on cigarettes by a substantial degree, the states in the Southeast tobacco region have traditionally imposed very low taxes on cigarettes.3)
Of course, it is hard to identify the nature of causality. Low anti-smoking sentiments may cause high smoking rates, low taxes on cigarettes, and loose regulations on youth access to tobacco products. Or, low taxes on cigarettes and loose regulations on youth access to tobacco products may cause the high smoking rates in the tobacco producing states. These facts suggest that there are correlations among tobacco production, low taxes on cigarettes, weak tobacco control policies, and high smoking rates, but can not resolve the issue of causation. There are several pieces of evidence that people living in states in the Southeast tobacco region might have weak anti-smoking sentiments. Goldstein et al. (1997) reported that compared to legislators in Texas and Vermont, legislators in North Carolina show a lower willingness to be involved in regulations that affect tobacco use among youths, have a lower intention to enforce the law preventing youths under the age of 18 from buying cigarettes, and are more likely to think that raising cigarette taxes is unfair to
extensiveness of state laws on youth access to tobacco products. They assigned scores ranging from 1 to 21, with higher scores indicating strictness of state laws on youth access to tobacco products. The study shows that the states in the Southeast tobacco region had scores that were lower than those of other states: Kentucky had a score of 6, North Carolina had a score of 1, and South Carolina had a score of 6. The states which had a low prevalence of youth smoking, however, had relatively high scores: California had a score of 19, and Utah, Florida and Hawaii had a score of 13.
3) Kentucky has imposed a 3 cents state tax on cigarettes since 1976; North Carolina - 2 cents until 1991, and 5 cents since 1992; South Carolina - 7 cents since 1978; Tennessee - 13 cents since 1971. California increased its tax on cigarettes from 37 cents to 87 cents in January 1999, Hawaii from 80 cents to 100 cents in July 1998, and Utah from 26.5 cents to 51.5 cents in July 1997.

Youth Smoking, Taxes, and Anti-Smoking Sentiment 9
people who smoke. Also, a poll survey shows that adults aged 25 ~64 living in Raleigh, North Carolina are less likely to favor regulating youth’s access to tobacco products or to favor regulating advertising, promotion, and sales of tobacco products than are adults living in the other communities (Cummings et al., 1991).4)
3. Cross-sectional Analysis on Youth Current Smoking and ever Smoking Behaviors
Measure of State Specific Anti-smoking Sentiment
Since September 1992, the Current Population Survey (CPS), Tobacco Use Supplements have asked respondents about their opinions on policies restricting smoking in several indoor places, their opinions on the promotion and advertising of tobacco products, and rules about smoking in their homes. This study uses data collected in September 1995, and May 1996, in order to match the time when data from Add Health was collected. Among the total participations in the CPS Tobacco Use Supplements collected in September 1995, and May 1996, 70,871 and 62,602 persons over the age of 15 reported their smoking attitude in 1995 and 1996 surveys respectively. The sample size on average in a state is 1,390 for the 1995 survey and 1,227 for the 1996 survey. The sample
4) These communities include Vallejo in California, Cedar Rapids in Iowa, Fitchburg and Leominster in Massachusetts, Paterson in New Jersey, Santa Fe in New Mexico, Yonkers in New York, Utica in New York, Medford and Ashland in Oregon, and Bellingham in Washington.
保健社 硏究 第22卷 第2號10
sizes in states vary depending on the total population in the states. For example, while the sample size in California is 4,804 and 4,769 the sample size in Hawaii is 568 and 564 for 1995 and 1996 respectively. I create the following nine variables by states: percent of people who answered that smoking should not be allowed at all in restaurants (restaurant); hospitals (hospital); indoor work areas (work place); bar and cocktail lounges (bar); indoor sporting events (sport event); and indoor shopping malls (shopping mall); percent of people who answered that giving away free samples by tobacco companies should not be allowed at all (sample); percent of people who answered that advertising of tobacco products should not be allowed at all (advertise); and percent of people who answered that smoking is not permitted anywhere at home (home). I construct two different sets of the nine variables. The first set of the nine variables is based on reports of all people, including current smokers, non-smokers, and former smokers. The second set of the nine variables is based on the reports of non-smokers whose household members do not currently smoke. These measures are used to control for the level of anti-smoking sentiment, to identify the causal effect of prices on youth smoking. Prices may have both a direct impact on youth smoking and an indirect impact through anti-smoking sentiment, if low prices encourage adult smoking, and adult smokers are more favorably inclined toward smoking. Consequently, the estimated impact of the measure of anti-smoking based on the opinions of all people could partly reflect this indirect effect of prices. This is less of a concern for the measure of anti-smoking sentiment based on the opinions of non-smokers. The nine attitudinal variables are highly correlated each other. Therefore, when all of the nine variables are in the model, this

Youth Smoking, Taxes, and Anti-Smoking Sentiment 11
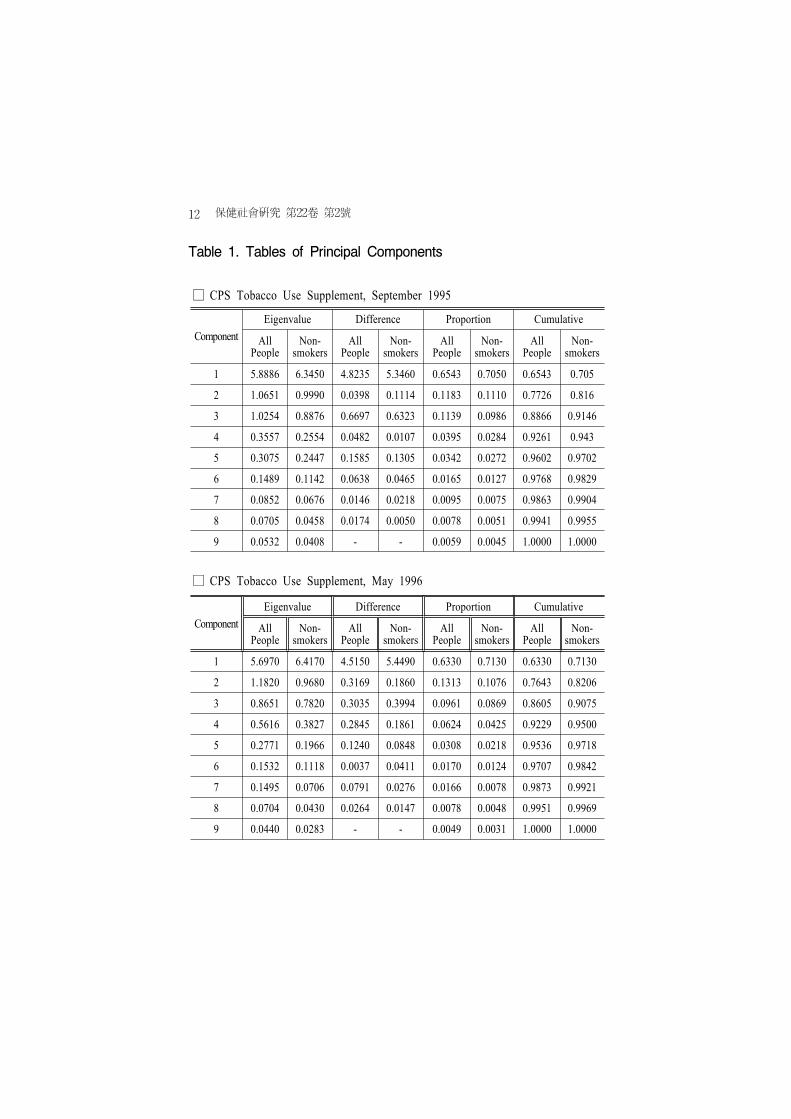
study may not be able to identify the influence of the specific attitudes on youth smoking behavior. When several variables reflect a similar concept, principal component analysis is an approach to reduce the number of variables in the model. Principal component analysis extracts from the given variables new variables which are the source of most of the variation of the given variables (Green 1997, Jolliffe 1986). The hypothesis here is that the nine variables vary by states mainly because people living in different state have different sentiment toward smoking. That is, the variation of the nine variables may come from a common source, and the common source of the variation of the nine variables would be state specific anti-smoking sentiment. Table 1 and Table 2 present results from the principal component analysis. Table 1 shows that when I use reports from all people the first component explains 70.50 percent and 71.30 percent of the variation of the nine variables in 1995 and 1996 respectively. Also, when I use reports from non-smokers whose household members do not currently smoke the first component explains 65.43 percent and 63.30 percent of the variation of the nine variables in 1995 and 1996 respectively. This implies that the first component explains most of the variation of the nine variables. Table 2 shows that coefficients on all of the nine variables are positive and their magnitudes are generally similar to each other. It suggests that the first component is positively correlated with all of the nine variables and explains generally a similar proportion of the nine variables.
保健社 硏究 第22卷 第2號12
Table 1. Tables of Principal Components
□ CPS Tobacco Use Supplement, September 1995
ComponentEigenvalue Difference Proportion Cumulative
All People
Non-smokers
All People
Non-smokers
All People
Non-smokers
All People
Non-smokers
1 5.8886 6.3450 4.8235 5.3460 0.6543 0.7050 0.6543 0.705
2 1.0651 0.9990 0.0398 0.1114 0.1183 0.1110 0.7726 0.816
3 1.0254 0.8876 0.6697 0.6323 0.1139 0.0986 0.8866 0.9146
4 0.3557 0.2554 0.0482 0.0107 0.0395 0.0284 0.9261 0.943
5 0.3075 0.2447 0.1585 0.1305 0.0342 0.0272 0.9602 0.9702
6 0.1489 0.1142 0.0638 0.0465 0.0165 0.0127 0.9768 0.9829
7 0.0852 0.0676 0.0146 0.0218 0.0095 0.0075 0.9863 0.9904
8 0.0705 0.0458 0.0174 0.0050 0.0078 0.0051 0.9941 0.9955
9 0.0532 0.0408 - - 0.0059 0.0045 1.0000 1.0000
□ CPS Tobacco Use Supplement, May 1996
ComponentEigenvalue Difference Proportion Cumulative
All People
Non-smokers
All People
Non-smokers
All People
Non-smokers
All People
Non-smokers
1 5.6970 6.4170 4.5150 5.4490 0.6330 0.7130 0.6330 0.7130
2 1.1820 0.9680 0.3169 0.1860 0.1313 0.1076 0.7643 0.8206
3 0.8651 0.7820 0.3035 0.3994 0.0961 0.0869 0.8605 0.9075
4 0.5616 0.3827 0.2845 0.1861 0.0624 0.0425 0.9229 0.9500
5 0.2771 0.1966 0.1240 0.0848 0.0308 0.0218 0.9536 0.9718
6 0.1532 0.1118 0.0037 0.0411 0.0170 0.0124 0.9707 0.9842
7 0.1495 0.0706 0.0791 0.0276 0.0166 0.0078 0.9873 0.9921
8 0.0704 0.0430 0.0264 0.0147 0.0078 0.0048 0.9951 0.9969
9 0.0440 0.0283 - - 0.0049 0.0031 1.0000 1.0000

Youth Smoking, Taxes, and Anti-Smoking Sentiment 13
Table 2. Eigen Vectors of the First Component
CPS Tobacco Use Supplement, September 1995
CPS Tobacco Use Supplement, May 1996
Variable All People Non-smokers All people Non-smokers
restaurant 0.3770 0.3832 0.3710 0.3832
hospital 0.3549 0.3529 0.3549 0.3622
work place 0.3717 0.3778 0.3770 0.3891
bar 0.1573 0.1308 0.1676 0.0876
sport event 0.3317 0.3514 0.3380 0.3670
shopping mall 0.3817 0.3897 0.3769 0.3889
home 0.2895 0.2838 0.3201 0.3098
sample 0.3557 0.3504 0.3414 0.3362
advertise 0.3209 0.3003 0.3014 0.2608
Table 3 shows estimates of the first component. The sentiment95 (all people) is the estimate of the first component based on the 1995 reports from all people, and the sentiment95 (non-smokers) is the estimate of the first component based on the 1995 reports from non-smokers. Similarly, the sentiment96 (all people) and the sentiment96 (non-smokers) are the estimates of the first component based on the 1996 reports from all people and non-smokers, respectively. The estimates of the first component seem to be reasonable measures for state specific anti-smoking sentiment. The estimates are negative for states located in the Southeast tobacco region such as Kentucky, North Carolina, Tennessee, South Carolina, and Virginia. However, the estimates are positive for states which currently conduct comprehensive anti-smoking campaigns such as California, Florida, and Minnesota. Also, the estimates are positive for Utah where most people have strong anti-smoking sentiment because of their religious reasons. The

保健社 硏究 第22卷 第2號14
correlation between the sentiment95 (all people) and the sentiment96 (all people) is 0.9338, and the correlation between the sentiment95 (non-smokers) and the sentiment96 (non-smokers) is 0.9217. These high correlations make sense because state specific anti-smoking sentiment is not likely to change dramatically over such a short time period.
Table 3. Estimates of the First Component, CPS Measures of
Anti-Smoking Sentiment

Youth Smoking, Taxes, and Anti-Smoking Sentiment 15
State Sentiment95 Sentiment96
All People Non-smokers All People Non-smokersAK 0.3096 0.3804 1.5589 0.0854AL -1.0950 -0.9610 -0.8895 -1.6275AR -1.5739 -1.6258 -0.4596 -0.2817AZ 1.3721 2.5342 2.1173 2.3547CA 4.6367 3.6321 4.9643 3.5438CO -0.5663 -0.8498 0.7753 0.6025CT 0.6730 -0.3481 0.4675 -0.3405DC 0.0373 -1.2702 0.1529 -1.6665DE -0.7787 -1.8011 -2.2646 -2.7452FL 1.3414 1.1151 1.1936 0.7399GA -0.2762 0.1865 -1.0360 -0.9266HI 2.5632 0.7475 2.2706 1.0707IA 0.2915 0.8736 1.3744 2.0182ID 2.5708 1.5438 3.5149 3.5285IL -0.2611 0.1213 -1.4275 -1.0680IN -2.6212 -1.5340 -3.1011 -0.9498KS 0.2131 0.5030 -1.0700 -0.0651KY -6.8442 -7.0959 -6.9082 -6.9858LA -0.8797 -1.4529 -0.7047 -0.0443MA 1.0233 0.0822 2.3108 0.9522MD 1.5509 0.9698 0.7937 0.7534

保健社 硏究 第22卷 第2號16
Table 3. Continued

Youth Smoking, Taxes, and Anti-Smoking Sentiment 17
State Sentiment95 Sentiment96All People Non-smokers All People Non-smokers
ME 3.9251 4.4931 4.0215 4.5305MI -1.3940 -0.9353 -1.2361 -0.3950MN 2.2931 2.4760 1.6420 1.9088MO -2.8432 -2.3624 -3.5290 -2.8572MS -1.3990 -0.9745 -0.4684 -0.7624MT -0.0139 -0.3129 0.2023 0.7254NC -6.0438 -6.5866 -5.2737 -5.7966ND 1.7181 1.8942 0.7046 1.7333NE 0.2897 0.5042 1.4755 1.1991NH 1.7385 2.5314 1.1810 2.3488NJ 0.3243 -0.6029 0.5361 -0.0159
NM 1.5667 1.6601 0.8990 0.2131NV -3.9234 -4.0962 -3.0439 -2.6153NY 0.9449 -0.2812 1.2220 0.6335OH -2.2839 -1.7023 -3.2910 -2.4743OK 0.5262 0.8771 -2.8137 -1.9294OR 2.7293 3.4298 3.3007 3.2072PA -1.2341 -1.3409 -0.8936 -0.7486RI 1.0774 0.7919 0.7602 -1.2856SC -3.1396 -1.8487 -2.2823 -2.0912SD 0.6882 0.8644 1.2362 2.0132TN -2.9457 -2.1749 -2.1178 -1.3965TX 0.7010 1.0459 1.2490 1.0885UT 6.3579 6.0361 6.4903 6.3205VA -2.3787 -1.7143 -1.9490 -1.7904VT 2.6892 2.5232 2.2216 1.0975WA 3.4843 3.1212 2.1701 2.5735WI -0.7791 -0.0957 -0.7866 -0.1793WV -4.4983 -3.6312 -3.8072 -3.4477WY 0.1362 0.6607 -1.4526 -0.7557
保健社 硏究 第22卷 第2號18
Measures of Students' Current Smoking and ever Smoking Behaviors
Add Health conducted the first interviews between April and December in 1995 for 20,745 students in grades 7 through 12. Add Health conducted the second interviews from April to August in 1996 for 14,738 students who completed the first interviews. For both of the surveys in 1995 and 1996, Add Health surveys asked whether students currently smoke, “During the past 30 days, on how many days did you smoke cigarettes?” For students who reported that they smoked cigarettes in the past 30 days of the survey, the Add Health surveys asked again, “During the past 30 days, on the days you smoked how many cigarettes did you smoke each day?” Based on these two questions, I create two measures of students' current smoking behaviors. The first measure of current smoking behavior is whether or not students smoked cigarettes during the past 30 days prior to the survey. This is a binary indicator which is one for students who smoked cigarettes in the past 30 days, and is zero otherwise. The second measure of current smoking behavior is the number of cigarettes the current smokers smoked each day for the period they smoked. In addition to the current smoking behaviors, the Add Health surveys asked if students have ever tried cigarette smoking, “Have you ever tried cigarette smoking, even just one or two puffs? (for the 1995 survey),” and “Since month of last interview, have you tried cigarette smoking even just one or two puffs? (for the 1996 survey)” Based on these two questions, I create two measures of ever smoking behaviors. The first measure is a binary indicator which is one for students who have ever tried cigarette smoking in their life time when they were administered the 1995 survey, and is
Youth Smoking, Taxes, and Anti-Smoking Sentiment 19
zero otherwise. The second measure is also a binary indicator which is one for students who have ever tried cigarette smoking in their life time when they were administered the 1996 survey, and is zero otherwise. The ever smokers in 1995 include the current smokers in 1995, and the ever smokers in 1996 include the current smokers in 1996. Measures of State Cigarette Prices, State Taxes on Cigarettes, and State Policies
The state cigarette prices and state taxes on cigarettes are from Orzechowski and Walker (1999). This study uses cigarette prices measured in November of each year, and state taxes on cigarettes during the fiscal year ending June 30. The cigarette price is an average cigarette price per package of twenty cigarettes weighted by market share, and includes state and federal excise taxes. I exclude the cigarette prices of generic brands. The reason is that most youths use brand name cigarettes rather than generic brand cigarettes (Johnston, O'Malley et al., 1999). Therefore, the cigarette prices exclusive of generic brands would be a reasonable measure of cigarette prices for a study of youth smoking behaviors. In addition to state cigarette prices, this study includes an explanatory variable which measures the cost of time and inconvenience for youths to purchase and smoke cigarettes. This variable reflects the “full price of cigarettes.” The full price of cigarettes is an ideal measure for cost of smoking because the cost of smoking includes not only monetary costs of cigarettes but also time and inconvenience costs related to purchasing and smoking cigarettes. This study uses a rating system on the extensiveness of state laws on youth access to tobacco products to measure the time and inconvenience costs of youths (Alciati et al., 1998).5)

保健社 硏究 第22卷 第2號20
The rating system is a useful measure to account for the time and inconvenience costs of youths because state regulations on youth access to tobacco products cause youths to take extra time and incur inconveniences when they purchase or smoke cigarettes. I match the variable of state cigarettes prices, state taxes on cigarettes, and the variable of the time and inconvenience costs of youths to a student in the state by using state level variables in 1995 and 1996 Contextual data sets.6)
Econometric Models for the Cross-sectional Analysis Model for the Current Smoking Behaviors
This study uses a two-part model (Duan, Manning, Morris, and Newhouse, 1983) to estimate the probability that students smoked cigarettes in the past 30 days of the surveys, and the number of cigarettes current smokers smoked in the past 30 days. The generalized tobit or sample selection models are possible alternatives to the two-part model (Duan, Manning, Morris, and Newhouse, 1983). However, in the context of cigarette demand, it is difficult to justify exclusion restrictions to identify these models. That is, it is difficult to justify the claim that some variable is a determinant of smoking participation, but should be excluded as a determinant
5) The rating system is an index which scores strictness of state regulations on youth access to tobacco products for the following nine items: minimum age, packaging, clerk intervention, photo identification, vending machines, free distribution, graduated penalties, random inspections, and statewide enforcement. If a state preempted stricter local ordinances for each category, the rating was reduced by two points. This study uses the index including the preemption penalties.
6) I obtained Contextual data sets collected in 1995 and in 1996 with special agreement. I use state level variables in the Contextual data sets, and match the variables of state cigarette prices, state taxes on cigarettes, and the time and inconvenience costs of youths to a student in the state.

Youth Smoking, Taxes, and Anti-Smoking Sentiment 21
of demand conditional upon participation. Without such an exclusion restriction, these models are identified solely through non-linearities, and may yield unreliable results. Manning, Duan, and Rogers (1987) provide Monte Carlo evidence that the two-part model performs better than the sample selection model. Given this, this study follows standard practice in health economics and adopts the two-part model. I construct two sets of the two-part model. In order to see whether price effect change when the model includes the measure of state specific anti-smoking sentiment, I do not include the measure of anti-smoking sentiment for the first set of the two-part model (equations of 1.1.1 and 1.1.2), but include the measure of anti-smoking sentiment for the second set of the two-part model (equations of 1.2.1 and 1.2.2). The first equation of the two-part model (equations of 1.1.1 and 1.2.1) is a smoking participation model. This is a probit model for a dichotomous event (equals one if student i living in state j smoked cigarettes in the past 30 days of the survey in year t, and equals zero otherwise). The second equation of the two-part model (equations of 1.1.2 and 1.2.2) is a conditional consumption of cigarettes model, which is a linear model on the number of cigarettes current smoker i living in state j smoked in the past 30 days of the survey in year t.
P (Smokingijt = 1) = Φ (a0 + a1 Pricejt + a2 Policyjt+ a3 Student Control Variablesijt + a4 Parent Control Variablesijt + a5 Urbanicityijt + a6 Regionijt) (1.1.1)
Cigarettesijt = b0 + b1 Pricejt + b2 Policyjt + b3 Student Control Variablesijt + b4 Parent Control Variablesijt + b5 Urbanicityijt + b6 Regionijt + eijt (1.1.2)

保健社 硏究 第22卷 第2號22
P (Smokingijt = 1) = Φ (c0 + c1 Pricejt + c2 Policyjt + c3 Sentimentjt + c4 Student Control Variablesijt +c5 Parent Control Variablesijt + c6 Urbanicityijt +c7 Regionijt) (1.2.1)
Cigarettesijt = d0 + d1 Pricejt + d2 Policyjt + d3 Sentimentjt + d4 Student Control Variablesijt + d5 Parent Control Variablesijt + d6 Urbanicityijt +d7 Regionijt + eijt (1.2.2)
Vectors of variables are italicized. Pricejt is the cigarette price of the state j in year t, Policyjt is the score of the rating system of state laws on youth access to tobacco products for the state j in year t, and Sentimentjt is the estimated first component (i.e. the CPS measures of anti-smoking sentiment) for the state j in year t.7)
The vector Student Control Variablesijt includes a dummy variable which equal one for male, a variable for student's age, and three dummy variables which equal one for students who are white, black, or Hispanics respectively. The vector Parent Control Variablesijt includes three dummy variables which equal one for students who lived with both parent, mother only, and father only respectively, and a variable for the number of siblings. The vector Urbanicityijt includes two dummy variables which equal one for students who lived in an urban area and a suburban area respectively. The vector Regionijt includes three dummy variables which equal one for students who lived in the west, the midwest, and the northeast respectively8).
7) In addition to state cigarette price, this study estimates the cross-sectional models with state taxes on cigarettes in replace of state cigarette prices.
8) Cigarette price and policy on smoking show systematic pattern by region and urbanicity. For example, the cigarette price is higher and policies on smoking are stricter in West rather than South. Also, the cigarette price is higher and smoking policies are stricter in urban than rural. In order to
Youth Smoking, Taxes, and Anti-Smoking Sentiment 23
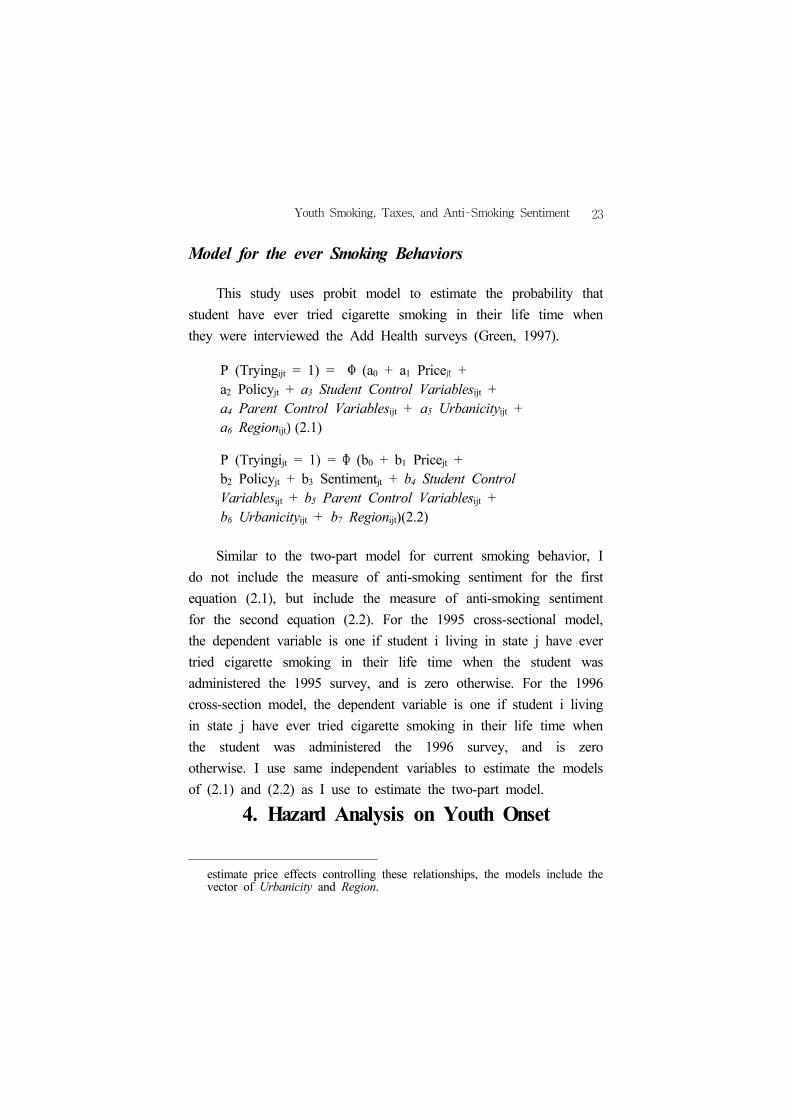
Model for the ever Smoking Behaviors
This study uses probit model to estimate the probability that student have ever tried cigarette smoking in their life time when they were interviewed the Add Health surveys (Green, 1997).
P (Tryingijt = 1) = Φ (a0 + a1 Pricejt + a2 Policyjt + a3 Student Control Variablesijt + a4 Parent Control Variablesijt + a5 Urbanicityijt + a6 Regionijt) (2.1)
P (Tryingijt = 1) = Φ (b0 + b1 Pricejt + b2 Policyjt + b3 Sentimentjt + b4 Student Control Variablesijt + b5 Parent Control Variablesijt + b6 Urbanicityijt + b7 Regionijt)(2.2)
Similar to the two-part model for current smoking behavior, I do not include the measure of anti-smoking sentiment for the first equation (2.1), but include the measure of anti-smoking sentiment for the second equation (2.2). For the 1995 cross-sectional model, the dependent variable is one if student i living in state j have ever tried cigarette smoking in their life time when the student was administered the 1995 survey, and is zero otherwise. For the 1996 cross-section model, the dependent variable is one if student i living in state j have ever tried cigarette smoking in their life time when the student was administered the 1996 survey, and is zero otherwise. I use same independent variables to estimate the models of (2.1) and (2.2) as I use to estimate the two-part model.
4. Hazard Analysis on Youth Onset
estimate price effects controlling these relationships, the models include the vector of Urbanicity and Region.

保健社 硏究 第22卷 第2號24
Smoking Behaviors
Measure of Students' Onset Smoking Behaviors
The Add Health survey in 1995 asked age when students initiated smoking cigarettes and age when students started smoking, “How old were you when you smoked a whole cigarette for the first time?” and “How old were you when you first started smoking cigarettes regularly?” Based on these questions, I measure three types of youth onset smoking behaviors: onset of smoking a whole cigarette, onset of regular smoking, and onset of regular smoking for students who experimented smoking a whole cigarette. I assume that students’ susceptibility to smoking initiation starts at 11 years olds because few people start to smoke before 11 years old.
Measure of State Cigarette Prices between 1985 and
1995
Nominal state cigarette prices between 1985 and 1995 are from Orzechowski and Walker (1999). I deflate the nominal state cigarette prices between 1985 and 1995 by the average Consumer Price Index for each year, and use real state cigarette prices (in year 1995 dollars) as a measure of state cigarette prices. Table 4 reports real state cigarette prices which I use to estimate the hazard models. The real state cigarette prices from 1985 to 1995 show substantial variation within each state.

Youth Smoking, Taxes, and Anti-Smoking Sentiment 25
Table 4. Real State Cigarette Prices in 1995 dollars between 1985 and 1995
State 1985 1986 1987 1988 1989 1990 1991 1992 1993 1994 1995AL 145.9 153 153.5 144.7 171 177.4 203.4 197.5 171.4 168.4 168.9AR 146.7 157.1 160.9 164.5 173.5 178.4 205.5 217.7 187.3 181.7 178.7AZ 151.1 157.8 152.3 161.8 160 187 200.5 220.8 179.5 183.6 220.8CA 147.9 144.5 157.5 162.8 201.3 221.4 238.4 245.2 217.2 217.2 213CO 134.7 151 155.6 168.5 183.5 177.9 190.7 205.8 176.4 175.7 178.7CT 167.8 170.6 174 182.9 210.4 204.8 229.9 241.8 229.9 222.7 218.1FL 161.2 168 175.1 180.1 184.5 212.9 222.4 228.4 193.2 190.6 192.2GA 141.8 144.5 146.5 157.7 162.6 167.9 185.5 196.7 162.7 170.7 166.1HI 166 172.7 179.5 192.1 203.4 212.2 240.1 262.2 237.8 243.4 241.6ID 141.5 148.9 163.5 172.1 173.7 179.6 191.9 193 171.2 182.3 189.8IL 153.5 161.6 166.5 171 181 187.1 213.8 222 199.9 202.1 198.8IN 132.6 139.2 146.6 153.3 160.8 166.2 185.9 191 164.8 160.9 159KY 121 125.8 126.6 133.7 142.1 149.3 161.9 177.4 150.2 149.4 151.2LA 148.9 163.8 161.5 168.4 176.2 181.3 209.8 214.2 173.7 172.6 174.9MA 162.9 167.4 176.5 191.4 187.3 199.4 209.4 215.8 213.5 227 221.2MD 132.1 139.5 146.5 154.8 161.6 172.1 188.4 228.3 195 192.5 187.6MI 150.1 154.9 163.9 171.3 176.9 177 208.6 219.3 181.4 239.8 239.8MN 164.7 167 190.1 196.5 199.5 212.2 237.3 253.2 214.9 218.8 219.3MO 144.3 150.9 153.7 153.2 158.7 165.5 185.3 190.7 161.2 165.9 168MS 150.1 161 164.5 162.1 171.9 174.6 189.9 209.5 176 168.3 172.1NC 118.5 126 128.8 138.6 143.1 156 172.2 184 154.3 159.3 155.1NE 147.3 158.1 165.4 179.5 176.2 188.2 203.3 216.3 190.2 186.6 185.8NH 141.6 141.8 152.3 162.2 167 189 196.4 212.5 175.7 181.8 180.9NJ 162.2 166.3 176.8 179.7 183.5 221.4 225.1 244.2 202.9 204.9 204.2NV 151 158.5 173.9 187.6 213.5 228.4 221.7 231.7 214.1 207 202NY 157.5 162.7 168.9 176.1 205.7 219.8 233.7 239.2 228.8 229.6 224.8OH 138.9 142.1 145.4 155.2 166.4 171.3 192 196 167.9 171 169.6OR 148.3 162.8 175.5 186.8 192.8 197.6 210.1 232.8 202.5 206.7 203.6PA 148.6 153 150.7 158.2 164.3 175 208.5 214.1 175.3 178.3 180.6RI 144.2 157.8 163 173.7 185.5 205.8 223.3 233.7 184.8 231 226.6SC 125.6 132.5 134 144.2 153.9 158.6 176.5 195.6 154.1 155.4 161.1TN 139.9 143.9 150.4 156.5 165.9 170.5 185.4 202.9 165.6 170.9 166.1TX 149.4 159.1 171.7 176.5 179.1 212.8 210.2 235.4 197.3 204.3 198.5VA 129.3 131.5 137 140.9 158.1 167.2 178 196 176.3 173.5 169.4VT 148.6 158.2 165.9 167.1 176.6 183.9 190.8 214.6 178.8 177.5 208.6WI 156.9 161.7 172.5 178.2 185.7 193 199.5 231.6 197.6 205.3 211.4WV 147.4 156.8 163.9 169 175.6 176.2 179.4 199.2 169.3 171.9 168.5
Note: Prices are cents per pack.
保健社 硏究 第22卷 第2號26
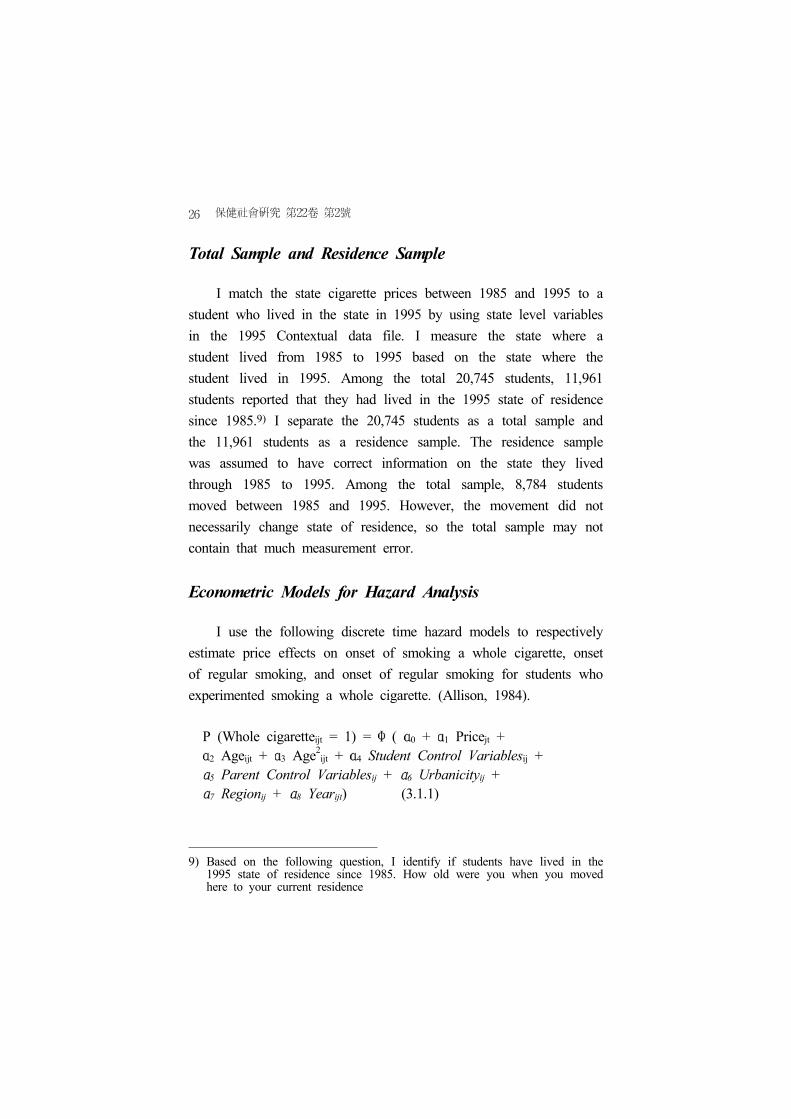
Total Sample and Residence Sample
I match the state cigarette prices between 1985 and 1995 to a student who lived in the state in 1995 by using state level variables in the 1995 Contextual data file. I measure the state where a student lived from 1985 to 1995 based on the state where the student lived in 1995. Among the total 20,745 students, 11,961 students reported that they had lived in the 1995 state of residence since 1985.9) I separate the 20,745 students as a total sample and the 11,961 students as a residence sample. The residence sample was assumed to have correct information on the state they lived through 1985 to 1995. Among the total sample, 8,784 students moved between 1985 and 1995. However, the movement did not necessarily change state of residence, so the total sample may not contain that much measurement error.
Econometric Models for Hazard Analysis
I use the following discrete time hazard models to respectively estimate price effects on onset of smoking a whole cigarette, onset of regular smoking, and onset of regular smoking for students who experimented smoking a whole cigarette. (Allison, 1984).
P (Whole cigaretteijt = 1) = Φ ( α0 + α1 Pricejt + α2 Ageijt + α3 Age2
ijt + α4 Student Control Variablesij + α5 Parent Control Variablesij + α6 Urbanicityij + α7 Regionij + α8 Yearijt) (3.1.1)
9) Based on the following question, I identify if students have lived in the 1995 state of residence since 1985. How old were you when you moved here to your current residence

Youth Smoking, Taxes, and Anti-Smoking Sentiment 27
P (Regular smokingijt = 1) = Φ ( γ0 + γ1 Pricejt + γ2 Ageijt + γ3 Age2
ijt + γ4 Student Control Variablesij + γ5 Parent Control Variablesij + γ6 Urbanicityij + γ7 Regionij + γ8 Yearijt)(3.1.2)
P (Regular smoking for experimentersijt = 1) = Φ ( μ0 + μ1 Pricejt + μ2 Ageijt + μ3 Age2
ijt + μ4 Student Control Variablesij + μ5 Parent Control Variablesij + μ6 Urbanicityij + μ7 Regionij + μ8 Yearijt)(3.1.3)
P (Whole cigaretteijt = 1) = Φ ( β0 + β1 Pricejt + β2 Ageijt + β3 Age2
ijt + β4 Student Control Variablesij + β5 Parent Control Variableij + β6 Urbanicityij + β7 Yearijt + β8 State fixed effectsj) (3.2.1)
P (Regular smokingijt = 1) = Φ ( λ0 + λ1 Pricejt + λ2 Ageijt + λ3 Age2
ijt + λ4 Student Control Variablesij + λ5 Parent Control Variablesij + λ6 Urbanicityij + λ7 Yearijt + λ8 State fixed effectsj) (3.2.2)
P (Regular smoking for experimentersijt = 1) = Φ ( π0 + π1 Pricejt + π2 Ageijt + π3 Age2
ijt + π4 Student Control Variablesij + π5 Parent Control Variablesij + π6 Urbanicityij + π7 Yearijt + π8 State fixed effectsj) (3.2.3)
I do not include state dummy variables in the first set of the hazard models (equations of 3.1.1, 3.1.2, and 3.1.3), but include the state dummy variables in the second set of the hazard models (equations of 3.2.1, 3.2.2, and 3.2.3). These differences allow the first set of the hazard models to estimate price effects with variation of cigarette prices between states, and the second set of the hazard models to estimate price effects with variation of

保健社 硏究 第22卷 第2號28
cigarette prices within a state. Therefore, the first set of the hazard models estimates price effects without control for unobservable constant state specific anti-smoking sentiment, but the second set of the hazard models estimates price effects with control for the unobservable constant state specific anti-smoking sentiment. To the extent unobserved state specific anti-smoking sentiment is fixed across states and causes bias, the second set estimates price effects that are more reliable than the first set. The left hand side of equations (3.1.1) and (3.2.1) represent the conditional probability that student i who lives in state j smokes a whole cigarette in year t, given that the student has not smoked a whole cigarette before year t. The left hand side of equations (3.1.2) and (3.2.2) represent the conditional probability that student i who lives in state j smokes cigarettes regularly in year t, given that the student has not smoked regularly before year t. The left hand side of the equations (3.1.3) and (3.2.3) represent the conditional probability that student i who lives in state j smokes cigarettes regularly in year t, given that the student has smoked a whole cigarette but has not smoked cigarettes regularly before year t. Vectors of variables are italicized. The cigarette price variable varies at the state level and by year. Age of student i and its square term vary from 1985 to 1995 as the student i grew up. The vector, Student Control Variablesij, includes four dummy variables which equal one for male, white, black, or Hispanic respectively. The vector, Parent Control Variablesij, contains three dummy variables which equal one for student who lives with both parent, mother only, and father only respectively, and a variable of number of siblings. The vector, Urbanicityij, includes two dummy variables which equal one for student who lives in an urban area and a suburban area respectively. The vector, Regionij, includes three dummy

Youth Smoking, Taxes, and Anti-Smoking Sentiment 29
variables which equal one for student who lives in the west, the midwest, and the northeast respectively. The vector, Yearijt, includes ten dummy variables which equal one for student who is in sub-sample of the year t.10) I estimate each model separately for the total sample and for the residence sample.
5. Results
Results from the Cross-sectional Analysis
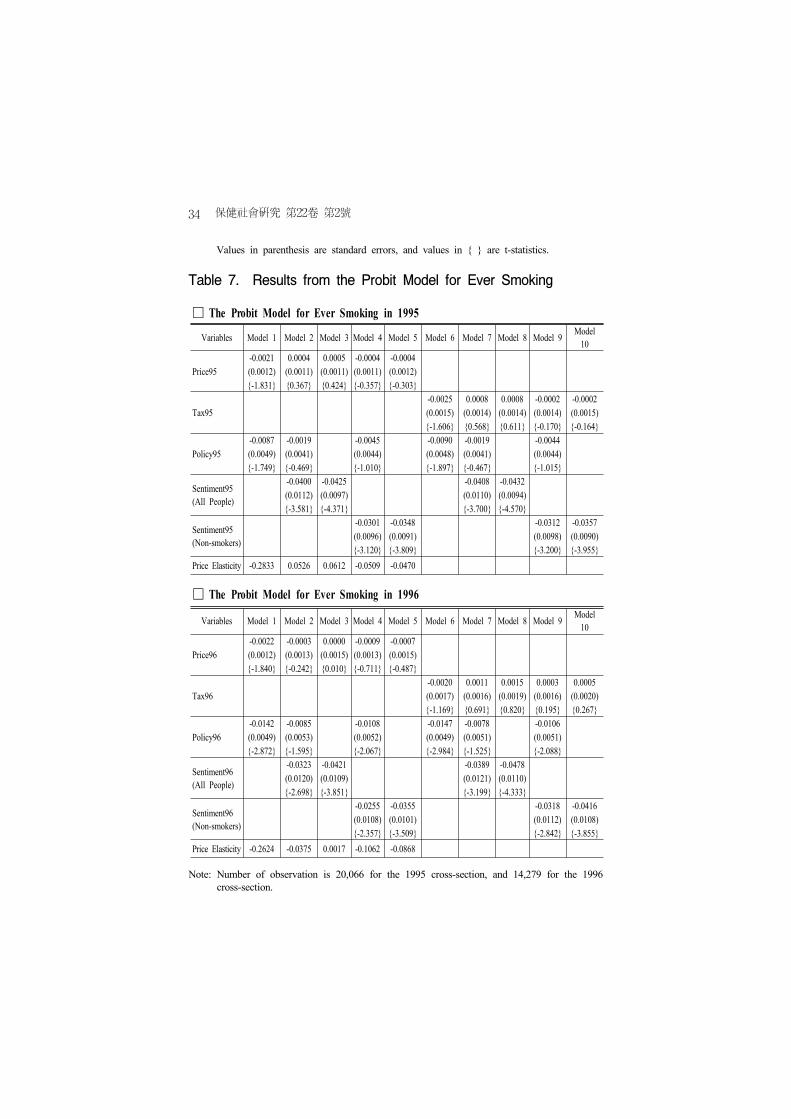
I find that when I include the measure of anti-smoking sentiment in the cross-sectional models, price (tax) effects are small or positive, and are generally insignificant (Table 5, 6 and 7; model 2, 4, 7, and 9). For either of the case that I use the measure of anti-smoking based on opinions of all people, or I use the measure of anti-smoking sentiment based on opinions of non-smokers, price (tax) effects are small or positive. The coefficients on the both of the measures of anti-smoking sentiment are negative and generally significant for all of the cross-sectional models. When I fail to control for the anti-smoking sentiment, I obtain negative and generally significant price (tax) effects (Table 5, 6, and 7; model 1 and 6). For the smoking participation model, when I do not include the measure of anti-smoking sentiment, I estimate price elasticities as of -0.5384 for the 1995 cross-section, and as of -0.4225 for the 1996 cross-section (Table 5; model 1). These price elasticities are similar to those from the previous cross-sectional studies of youth smoking (Table 8). It suggests that the previous
10) The sub-sample span from the 1985 sub-sample to the 1995 sub-sample.
保健社 硏究 第22卷 第2號30
estimates of price effects on youth smoking may reflect bias due to unobserved state specific anti-smoking sentiment. There are concerns that when studies include a variable reflecting strictness of state policies on tobacco use in their model, the studies may yield large standard error on effects of cigarette price (tax) because the variable of state policies and the variable of state cigarette price (tax) are highly correlated. In order to see if the inclusion of the variable of Policy95 (Policy96) causes the multicollinearity probrems, I estimate additional the models without the variable of Policy95 (Policy96). When I drop the variable of policy95 (policy96) from the models, standard errors on price (tax) variable do not much drop (Table 5, 6, and 7; model 2 vs. 3, 4 vs. 5, 7 vs. 8, and 9 vs. 10). It implies that the inclusion of the variable of policy95 (policy96) in the models of 2, 4, 7 and 9 does not cause multicollinearity problem for the estimation of price (tax) effects. The results from the conditional consumption of cigarettes model in 1995 show somewhat different pattern from what I find from the results of the most of the cross-sectional models (Table 6). The coefficients on the price (tax) variable do not much drop and are generally significant even I include the measure of anti-smoking sentiment in the models. In addition, the coefficients on the measures of anti-smoking sentiment are not statistically significant.

Youth Smoking, Taxes, and Anti-Smoking Sentiment 31
Table 5. Results from the Smoking Participation Model
□ The Smoking Participation Model in 1995
Variables Model 1 Model 2 Model 3 Model 4 Model 5 Model 6 Model 7 Model 8 Model 9Model
10
Price95-0.0023 -0.0003 -0.0003 -0.0008 -0.0008 (0.0008) (0.0008) (0.0008) (0.0008) (0.0008) {-2.788} {-0.378} {-0.375} {-1.050} {-0.994}
Tax95 -0.0025 0.0001 0.0001 -0.0006 -0.0006 (0.0010) (0.0010) (0.0010) (0.0009) (0.0009) {-2.508} {0.140} {0.148} {-0.617} {-0.601}
Policy95 -0.0060 -0.0003 -0.0022 -0.0064 -0.0002 -0.0021 (0.0036) (0.0030) (0.0032) (0.0035) (0.0030) (0.0031) {-1.661} {-0.109} {-0.681} {-1.828} {-0.055} {-0.671}
Sentiment95 (All People)
-0.0331 -0.0335 -0.0355 -0.0357 (0.0087) (0.0073) (0.0086) (0.0072) {-3.795} {-4.606} {-4.139} {-4.954}
Sentiment95(Non-smokers)
-0.0269 -0.0292 -0.0293 -0.0314 (0.0077) (0.0069) (0.0076) (0.0067) {-3.505} {-4.199} {-3.873} {-4.677}
PriceElasticity -0.5384 -0.0739 -0.0714 -0.1905 -0.1865
□ The Smoking Participation Model in 1996
Variables Model 1 Model 2 Model 3 Model 4 Model 5 Model 6 Model 7 Model 8 Model 9 Model 10
Price96 -0.0019 -0.0005 -0.0002 -0.0009 -0.0008 (0.0010) (0.0009) (0.0011) (0.0010) (0.0012) {-2.009) {-0.502} {-0.165} {-0.915} {-0.646}
Tax96 -0.0014 0.0012 0.0016 0.0006 0.0008 (0.0012) (0.0011) (0.0012) (0.0011) (0.0014) {-1.135} {1.113} {1.346} {0.513} {0.562}
Policy96 -0.0121 -0.0077 -0.0095 -0.0127 -0.0069 -0.0092 (0.0039) (0.0043) (0.0041) (0.0040) (0.0043) (0.0041) {-3.067} {-1.806} {-2.332} {-3.186} {-1.616} {-2.238}
Sentiment96 (All People)
-0.0247 -0.0334 -0.0326 -0.0402 (0.0091) (0.0084) (0.0088) (0.0076) {-2.724} {-3.978} {-3.702} {-5.306}
Sentiment96(Non-smokers)
-0.0197 -0.0281 -0.0270 -0.0351 (0.0092) (0.0095) (0.0089) (0.0089) {-2.151} {-2.950} {-3.050} {-3.961}
Price Elasticity -0.4225 -0.1038 -0.0383 -0.1992 -0.1679
Note: Number of observation is 19,942 for the 1995 cross-section, and 14,475 for the 1996 cross-section.

保健社 硏究 第22卷 第2號32
Values in parenthesis are standard errors, and values in { } are t-statistics.

Youth Smoking, Taxes, and Anti-Smoking Sentiment 33
Table 6. Results from the Conditional Consumption of Cigarettes
Model
□ The Conditional Consumption of Cigarettes Model in 1995
Variables Model 1 Model 2 Model 3 Model 4 Model 5 Model 6 Model 7 Model 8 Model 9 Model 10
Price95 -0.0138 -0.0094 -0.0086 -0.0116 -0.0113(0.0047) (0.0053) (0.0052) (0.0049) (0.0048){-2.970} {-1.785} {-1.662} {-2.354} {-2.360}
Tax95 -0.0149 -0.0075 -0.0069 -0.0106 -0.0107(0.0066) (0.0091) (0.0088) (0.0079) (0.0074){-2.272} {-0.823} {-0.787} {-1.331} {-1.443}
Policy95 -0.0386 -0.0248 -0.0321 -0.0412 -0.0221 -0.0305(0.0206) (0.0218) (0.0201) (0.0215) (0.0235) (0.0216){-1.876} {-1.135} {-1.599} {-1.917} {-0.940} {-1.413}
Sentiment95 (All People)
-0.0782 -0.1103 -0.1057 -0.1325(0.0778) (0.0720) (0.0824) (0.0750){-1.005) {-1.531} {-1.283} {-1.767}
Sentiment95(Non-smokers)
-0.0436 -0.0768 -0.0695 -0.0995(0.0717) (0.0715) (0.0756) (0.0734){-0.608} {-1.073} {-0.919} {-1.355}
Price Elasticity -0.4072 -0.2771 -0.2542 -0.3407 -0.3332
□ The Conditional Consumption of Cigarettes Model in 1996
Variables Model 1 Model 2 Model 3 Model 4 Model 5 Model 6 Model 7 Model 8 Model 9 Model 10
Price96 -0.0128 0.0013 0.0020 -0.0043 -0.0038(0.0079) (0.0061) (0.0059) (0.0066) (0.0066){-1.634} {0.213} {0.347} {-0.651} {-0.569}
Tax96 -0.0166 0.0021 0.0030 -0.0048 -0.0039(0.0100) (0.0089) (0.0081) (0.0092) (0.0094){-1.673} {0.235} {0.375} {-0.520} {-0.416}
Policy96-0.0648 -0.0201 -0.0420 -0.0661 -0.0200 -0.0419(0.0356) (0.0346) (0.0348) (0.0354) (0.0357) (0.0352){-1.820} {-0.580} {-1.208} {-1.868} {-0.559} {-1.192}
Sentiment96 (All People)
-0.2462 -0.2681 -0.2470 -0.2682(0.0947) (0.0857) (0.0984) (0.0853){-2.601} {-3.127} {-2.509} {-3.144}
Sentiment96(Non-smokers)
-0.1683 -0.2037 -0.1739 -0.2094(0.1144) (0.1075) (0.1181) (0.1101){-1.472} {-1.895} {-1.473} {-1.902}
Price Elasticity -0.3779 0.0384 0.0599 -0.1273 -0.1104
Note: Number of observation is 5,196 for the 1995 cross-section, and 4,632 for the 1996 cross- section.
保健社 硏究 第22卷 第2號34
Values in parenthesis are standard errors, and values in { } are t-statistics.
Table 7. Results from the Probit Model for Ever Smoking
□ The Probit Model for Ever Smoking in 1995
Variables Model 1 Model 2 Model 3 Model 4 Model 5 Model 6 Model 7 Model 8 Model 9 Model 10
Price95-0.0021 0.0004 0.0005 -0.0004 -0.0004(0.0012) (0.0011) (0.0011) (0.0011) (0.0012){-1.831} {0.367} {0.424} {-0.357} {-0.303}
Tax95-0.0025 0.0008 0.0008 -0.0002 -0.0002(0.0015) (0.0014) (0.0014) (0.0014) (0.0015){-1.606} {0.568} {0.611} {-0.170} {-0.164}
Policy95-0.0087 -0.0019 -0.0045 -0.0090 -0.0019 -0.0044(0.0049) (0.0041) (0.0044) (0.0048) (0.0041) (0.0044){-1.749} {-0.469} {-1.010} {-1.897} {-0.467} {-1.015}
Sentiment95 (All People)
-0.0400 -0.0425 -0.0408 -0.0432(0.0112) (0.0097) (0.0110) (0.0094){-3.581} {-4.371} {-3.700} {-4.570}
Sentiment95(Non-smokers)
-0.0301 -0.0348 -0.0312 -0.0357(0.0096) (0.0091) (0.0098) (0.0090){-3.120} {-3.809} {-3.200} {-3.955}
Price Elasticity -0.2833 0.0526 0.0612 -0.0509 -0.0470
□ The Probit Model for Ever Smoking in 1996
Variables Model 1 Model 2 Model 3 Model 4 Model 5 Model 6 Model 7 Model 8 Model 9 Model 10
Price96-0.0022 -0.0003 0.0000 -0.0009 -0.0007(0.0012) (0.0013) (0.0015) (0.0013) (0.0015){-1.840} {-0.242} {0.010} {-0.711} {-0.487}
Tax96-0.0020 0.0011 0.0015 0.0003 0.0005(0.0017) (0.0016) (0.0019) (0.0016) (0.0020){-1.169} {0.691} {0.820} {0.195} {0.267}
Policy96-0.0142 -0.0085 -0.0108 -0.0147 -0.0078 -0.0106(0.0049) (0.0053) (0.0052) (0.0049) (0.0051) (0.0051){-2.872} {-1.595} {-2.067} {-2.984} {-1.525} {-2.088}
Sentiment96 (All People)
-0.0323 -0.0421 -0.0389 -0.0478(0.0120) (0.0109) (0.0121) (0.0110){-2.698} {-3.851} {-3.199} {-4.333}
Sentiment96(Non-smokers)
-0.0255 -0.0355 -0.0318 -0.0416(0.0108) (0.0101) (0.0112) (0.0108){-2.357} {-3.509} {-2.842} {-3.855}
Price Elasticity -0.2624 -0.0375 0.0017 -0.1062 -0.0868
Note: Number of observation is 20,066 for the 1995 cross-section, and 14,279 for the 1996 cross-section.

Youth Smoking, Taxes, and Anti-Smoking Sentiment 35
Values in parenthesis are standard errors, and values in { } are t-statistics.

保健社 硏究 第22卷 第2號36
Table 8. The Price Responsiveness of Youth Smoking
Participation1)
Study Data Set Sample Period Age Group Price
ElasticityLewit, Coate and Grossman (1981) HES-III2) 1966~70 12~17 -1.2
Chaloupka and Grossman (1996) MTF3) 1992~94 12~18 -0.675
Chaloupka and Wechsler (1997)
Harvard College Alcohol Study 1993 18~22 -0.52 to
-0.536Evans and Farrelly (1998) NHIS4) 1987 18~24 -0.575
Evans and Huang (1998) MTF 1977~92
1985~92 17~18 -0.201-0.490
CDC (1998) NHIS1976~80,
1983, 1985, 1987~93
18~24 -0.58
Harris and Chan (1999) CPS5): Tobacco use Supplements 1992~93 15~17
18~20-0.831-0.524
Shin (2000) Add Health6)
1995 11~21-0.5384*-0.0739**-0.1905***
1996 12~23-0.4225*-0.1038**-0.1992***
Notes: 1) * price elasticity when I do not include the measure of anti-smoking sentiment; ** price elasticity when I include the measure of anti-smoking sentiment based on the reports of all people; *** price elasticity when I include the measure of anti-smoking sentiment based on the reports of non-smokers.
2) Health Examination Survey, Circle III3) Monitoring the Future Study4) National Health Interview Survey5) Current Population Survey6) National Longitudinal Study of Adolescent Health
Table 9 shows how different levels of anti-smoking sentiment affect probability of youth smoking. I estimate probability of current smoking and probability of ever smoking for 15 years old boy in 1995 with same demographic characteristics, cigarette prices and strictness of policies on youth access to tobacco products in

Youth Smoking, Taxes, and Anti-Smoking Sentiment 37
California as of 1995, but with different values on the measure of anti-smoking sentiment. The different level of anti-smoking sentiment yields substantial differences in the probability of current smoking and the probability of ever smoking for 15 years old boy. For example, boys who face the level of anti-smoking sentiment in California have probability of current smoking of 0.24, and probability of ever smoking of 0.54. However, boys who face the level of anti-smoking sentiment in Kentucky have probability of current smoking of 0.37, and probability of ever smoking of 0.72.
Table 9. Probabilities of Current Smoking and Ever Smoking for
15 Years Old Boys in 1995
CA KY FL MN NC SC TN VA
Price95 213 213 213 213 213 213 213 213
Policy95 19 19 19 19 19 19 19 19
Sentiment95(All People) 4.6367 -6.8442 1.3414 2.2931 -6.0438 -3.1396 -2.9457 -2.3787
Probability of Current Smoking(Probit Index)
0.24(-0.7124)
0.37(-0.3325)
0.27(-0.6034)
0.26(-0.6349)
0.36(-0.359)
0.32(-0.4551)
0.32(-0.4615)
0.32(-0.4803)
Probability ofever Smoking(Probit Index)
0.54(-0.1094)
0.72(-0.5681)
0.60(-0.2411)
0.58(-0.203)
0.70(-0.5361)
0.66(-0.4201)
0.66(-0.4123)
0.65(-0.3897)
Results from the Hazard Analysis
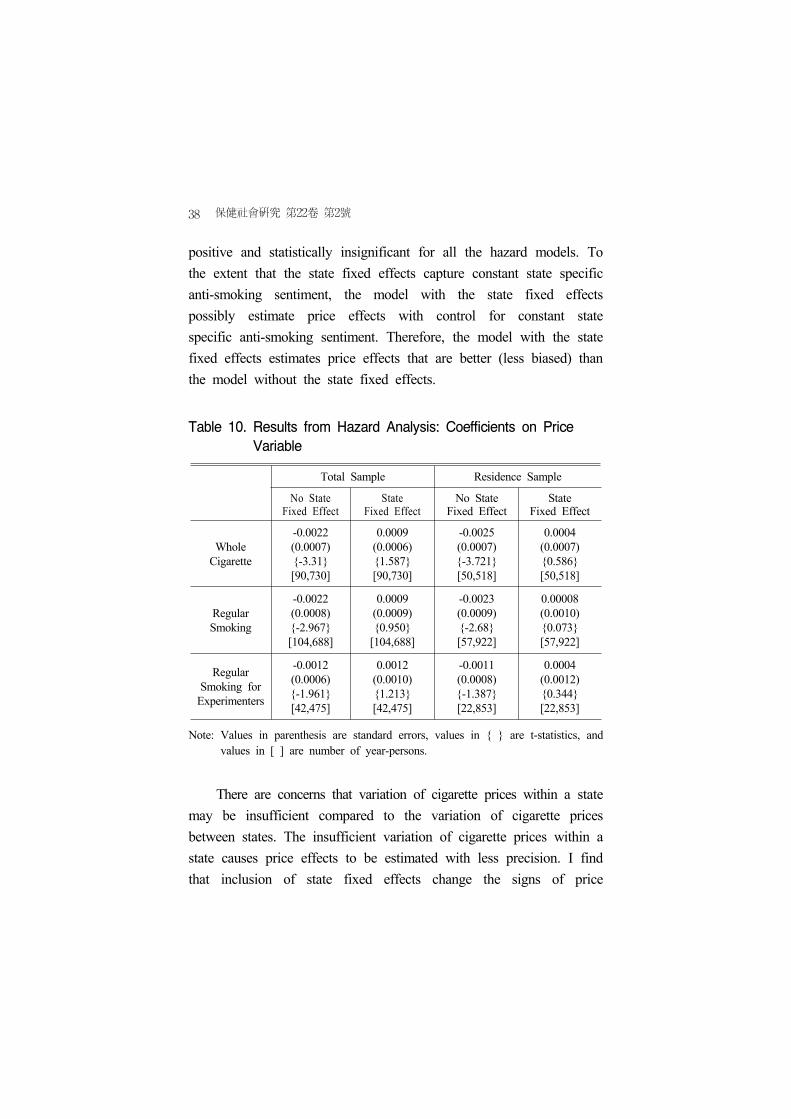
I find that estimates on price effects on youth smoking onset behaviors are sensitive to the inclusion of the state fixed effects (Table 10). Without the state fixed effects, price effects are negative and generally significant for all of the hazard models. Incorporating state fixed effects, however, causes the price effects to become
保健社 硏究 第22卷 第2號38
positive and statistically insignificant for all the hazard models. To the extent that the state fixed effects capture constant state specific anti-smoking sentiment, the model with the state fixed effects possibly estimate price effects with control for constant state specific anti-smoking sentiment. Therefore, the model with the state fixed effects estimates price effects that are better (less biased) than the model without the state fixed effects.
Table 10. Results from Hazard Analysis: Coefficients on Price
Variable
Total Sample Residence Sample
No State Fixed Effect
State Fixed Effect
No State Fixed Effect
State Fixed Effect
Whole Cigarette
-0.0022 (0.0007){-3.31}[90,730]
0.0009(0.0006){1.587}[90,730]
-0.0025(0.0007){-3.721}[50,518]
0.0004(0.0007){0.586}[50,518]
Regular Smoking
-0.0022(0.0008){-2.967}[104,688]
0.0009(0.0009){0.950}
[104,688]
-0.0023(0.0009){-2.68}[57,922]
0.00008(0.0010){0.073}[57,922]
Regular Smoking for
Experimenters
-0.0012(0.0006){-1.961}[42,475]
0.0012(0.0010){1.213}[42,475]
-0.0011(0.0008){-1.387}[22,853]
0.0004(0.0012){0.344}[22,853]
Note: Values in parenthesis are standard errors, values in { } are t-statistics, and values in [ ] are number of year-persons.
There are concerns that variation of cigarette prices within a state may be insufficient compared to the variation of cigarette prices between states. The insufficient variation of cigarette prices within a state causes price effects to be estimated with less precision. I find that inclusion of state fixed effects change the signs of price

Youth Smoking, Taxes, and Anti-Smoking Sentiment 39
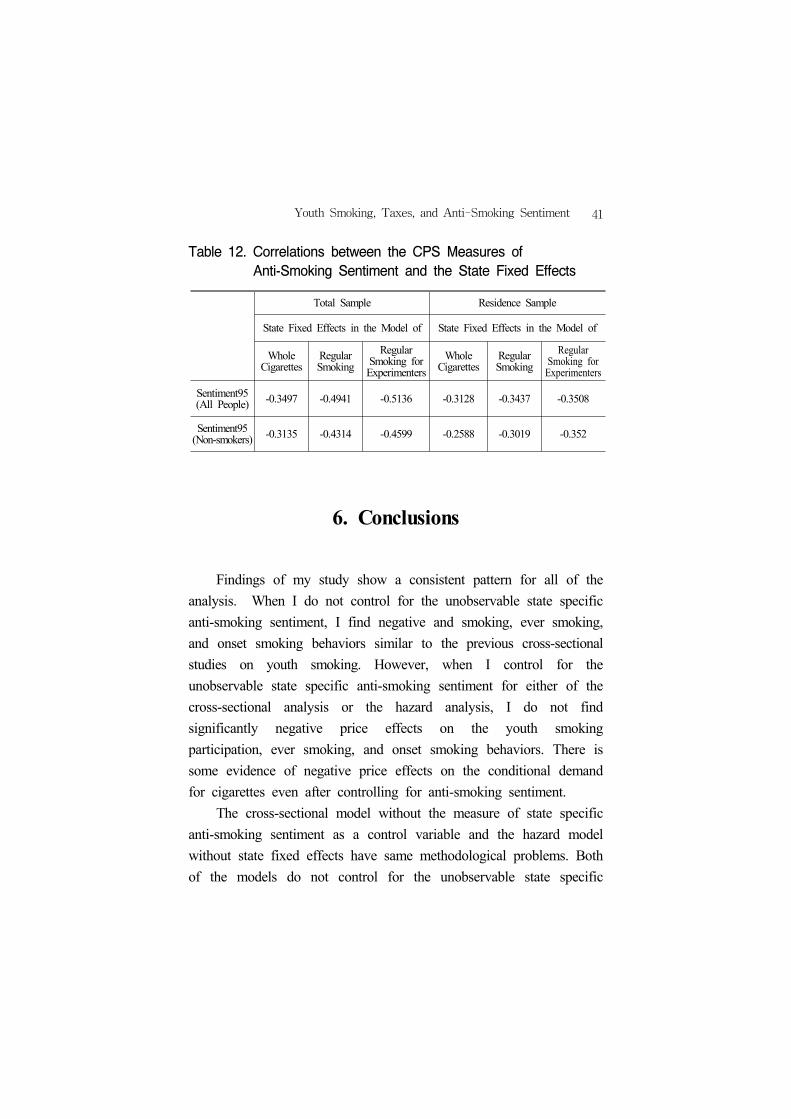
effects, but do not much affect the magnitudes of the standard errors. This suggests that this study estimates price effects with sufficient variation of cigarette prices through the model with state fixed effects compared to the model without the state fixed effects. It also implies that estimated price effects have similar precision for both of the models. While I do not find significantly negative price effects on youth smoking onset behaviors, I find that coefficients on state dummies are generally significant and have reasonable signs (Table 11). For example, coefficients on dummy variables of Kentucky, Tennessee, and Virginia, which are tobacco producing states, are positive and generally significant. But, coefficients on dummy variables of California, Florida, and Minnesota, where state government currently conducts strong anti-smoking campaigns, are significantly negative. This finding suggests that characteristics specific to a state have important roles in youth onset smoking behaviors. Table 12 shows that correlations between the CPS measures of anti-smoking sentiment and the state fixed effects are pretty strong. The strong correlations suggest that the state fixed effects well reflect state specific anti-smoking sentiment, thus the state fixed effects well capture anti-smoking sentiment specific to a state. It also implies that this study estimates price effects on youth onset smoking behaviors with relevant control for the unobservable constant state specific anti-smoking sentiment through the state fixed effects models.

保健社 硏究 第22卷 第2號40
Table 11. State Fixed Effects; Total sample
StateWhole Cigarette Regular Smoking Reg. Smoking
for ExperimentersCoefficient z-stat. Coefficient z-stat. Coefficient z-stat.
AL -0.2982 -10.621 -0.3183 -10.184 -0.2245 -8.011AR -0.0383 -2.14 0.0571 2.504 0.0840 3.254AZ 0.0323 0.714 -0.0403 -0.821 -0.1359 -3.184CA -0.2350 -6.257 -0.2781 -5.742 -0.2798 -4.912CO 0.0119 0.448 0.0214 0.781 -0.0491 -2.042CT -0.0981 -3.019 -0.2372 -4.551 -0.3498 -5.902FL -0.2639 -5.292 -0.2340 -4.576 -0.1535 -3.41GA -0.0400 -0.806 -0.0815 -2.295 -0.1372 -3.518HI -0.1341 -2.807 -0.1382 -1.949 -0.1787 -2.043ID -0.5426 -10.717 -0.5609 -14.91 -0.2430 -6.383IL -0.1166 -3.458 -0.0120 -0.327 0.0210 0.605KY 0.0446 1.534 0.0528 2.221 0.0170 0.704LA -0.0784 -4.153 -0.0438 -2.415 -0.0471 -2.446MA -0.1029 -4.067 -0.0837 -1.865 -0.0737 -1.566MD -0.1222 -3.784 -0.0669 -1.894 -0.0381 -1.048MI -0.0056 -0.229 0.0332 0.784 -0.0298 -0.66MN -0.2184 -5.429 -0.1722 -3.118 -0.1659 -2.669MO -0.1956 -8.444 -0.1068 -2.906 0.0374 2.501MS -0.0712 -2.806 -0.0638 -4.614 -0.0715 -2.944NC 0.0219 0.737 0.0532 1.833 0.0166 0.704NE -0.0663 -4.306 -0.0259 -1.017 -0.0237 -0.874NH -0.4120 -8.441 -0.1425 -3.177 -0.0303 -0.552NJ -0.1433 -5.791 -0.0507 -1.268 -0.0236 -0.521NV -0.1662 -3.168 -0.0516 -0.005 -0.0201 -0.359NY -0.0813 -1.849 -0.0003 1.833 -0.0353 -0.583OH 0.0310 0.783 0.0594 1.811 -0.0142 -0.467OR -0.0505 -2.259 -0.0974 -2.509 -0.1798 -4.241PA 0.0717 1.578 0.1131 2.364 0.0178 0.51SC -0.0836 -3.01 -0.0491 -2.424 -0.0553 -3.477TN 0.1494 3.3 0.1796 3.761 0.0748 2.519TX -0.1679 -4.173 -0.2153 -4.795 -0.2180 -5.114VA 0.7864 12.541 - - - -VT 0.0509 1.014 0.1319 3.202 0.1178 2.55WI -0.6517 -28.336 - - - -WV 0.0188 0.686 0.0256 1.127 -0.0255 -1.023
Youth Smoking, Taxes, and Anti-Smoking Sentiment 41
Table 12. Correlations between the CPS Measures of
Anti-Smoking Sentiment and the State Fixed Effects
Total Sample Residence Sample
State Fixed Effects in the Model of State Fixed Effects in the Model of
Whole Cigarettes
Regular Smoking
Regular Smoking for
ExperimentersWhole
CigarettesRegular Smoking
Regular Smoking for
Experimenters
Sentiment95 (All People) -0.3497 -0.4941 -0.5136 -0.3128 -0.3437 -0.3508
Sentiment95 (Non-smokers) -0.3135 -0.4314 -0.4599 -0.2588 -0.3019 -0.352
6. Conclusions
Findings of my study show a consistent pattern for all of the analysis. When I do not control for the unobservable state specific anti-smoking sentiment, I find negative and smoking, ever smoking, and onset smoking behaviors similar to the previous cross-sectional studies on youth smoking. However, when I control for the unobservable state specific anti-smoking sentiment for either of the cross-sectional analysis or the hazard analysis, I do not find significantly negative price effects on the youth smoking participation, ever smoking, and onset smoking behaviors. There is some evidence of negative price effects on the conditional demand for cigarettes even after controlling for anti-smoking sentiment. The cross-sectional model without the measure of state specific anti-smoking sentiment as a control variable and the hazard model without state fixed effects have same methodological problems. Both of the models do not control for the unobservable state specific

保健社 硏究 第22卷 第2號42
anti-smoking sentiment. The two methodologies which have the same methodological problems yield similar results that high cigarette prices have negative and generally significant effects on the youth smoking behaviors. This implies that without relevant control for the unobservable state specific anti-smoking sentiment studies may yield biased price effects. There are two important implications of this study. First, the previous cross-sectional studies on youth smoking may yield biased price effects because the studies do not relevantly control for the unobservable state specific anti-smoking sentiment. Second, while I do not find significantly negative price effects on the youth smoking behaviors, I find that state specific anti-smoking sentiment has significantly negative effects on the youth smoking behaviors. Thus, for prevention of youth smoking, changing the environment of youths by increasing negative sentiments toward smoking may be a better policy than high cigarette prices.
References
Alciati, Marianne H., Marcy Frosh, Sylvan B. Greeen, Ross C. Brownson, Peter H. Fisher, Robin Hobart, Adele Roman, Russell C. Sciandra, and Dana M. Shelton, “State laws on youth access to tobacco in the United States: measuring their extensiveness with a new rating system”, Tobacco Control, 7, pp.345~352, 1998.
Allison, P. D., Event History Analysis, Regression for Longitudinal Event Data, Quantitative Applications in the Social Sciences, Sage University Paper 46, 1984.
Chaloupka, Frank J. and Michael Grossman, “Price, Tobacco

Youth Smoking, Taxes, and Anti-Smoking Sentiment 43
Control Policies and Youth Smoking”, Working Paper 5740, National Bureau of Economic Research, 1996.
Chaloupka, Frank J. and Henry Wechsler, “Price, Tobacco Control Policies and Smoking Among Young Adults”, Journal of Health Economics, 16(3), pp.359~373, 1997.
Centers for Disease Control [CDC], “Responds to Increase in Cigarette Prices by Race/Ethnicity, Income, and Age Groups – United States, 1976~1993”, Morbidity and Mortality Weekly Report, 47(29), pp.605~609, 1998.
Congressional Budget Office [CBO], “The Proposed Tobacco Settlement: Issues from a Federal Perspective”, CBO Paper, 1998, April.
Cummings, K. M., R. Sciandra, T. F. Pechacek, W.R. Lynn and D. Corle, “Public Attitudes Regarding Limits on Public Smoking and Regulation of Tobacco Sales and Advertising: 10 U.S. Communities, 1989”, Morbidity and Mortality Weekly Report, 40(21), pp.344~353, 1991.
Duan, Naihua, Willard G. Manning, Carl N. Morris, and Joseph P. Newhouse, “A Comparision of Alternative Models for the Demand for Medical Care”, Journal of Business and Economic Statistics, 1(2), pp.115~126, 1983.
Evans, William N. and Matthew C. Farrelly, “The Compensating Behavior of Smokers: Taxes, Tar and Nicotine”, University of Maryland Department of Economics Working Paper, 1995.
Evans, William N. and Lynn Huang, “Cigarette Taxes and Teen Smoking: New Evidences from Panels of Repeated Cross-Sections”, University of Maryland Department of Economics Working Paper, 1998.
General Accounting Office [GAO], Tobacco: Issues Surrounding a National Tobacco Settlement, 1998.
, Teen Smoking: Higher Excise Tax Should Significantly Reduce the Number of Smokers, A Report
保健社 硏究 第22卷 第2號44
to the Honorable Michael A. Andrew, House of Representatives, GAO/HRD 89-119, Rockville, MD., 1989.
Green, William H., Econometric Analysis, 3th Edition, Prentice- Hall, Inc., 1997.
Goldstein, A.O., J. E. Cohen, B. S. Flynn, et al., “State Legislators’ Attitudes and Voting Intentions toward Tobacco Control Legislation”, American Journal of Public Health, 87(7), pp.1197~1200, 1997.
Harris, Jeffrey E. and Sandra W. Chan, “The Continuum-of Addiction: Cigarette Smoking in Relation to Price among Americans Aged 15-29”, Health Economics, 8(1), pp.81~86, 1999.
Healton, C., P. Messeri, J. Reynolds, and C. Wolfe, “Tobacco Use Among Middle and High School Students – United States, 1999”, Morbidity and Mortality Weekly Report, 49(3), pp.49 ~53, 2000.
Johnston, Lloyd D., Patrick M. O'Malley, Jerald G. Bachman, and John E. Schulenberg, “Cigarette brand preferences among adolescents”, Monitoring the Future Occasional Paper 45, Ann Arbor, MI: Institute for Social Research, 37, 1999.
Jolliffe, I. T., Principal Component Analysis, Springer-Verlag, New York, Berlin, Heidelberg, Tokyo, 1986.
Lewit, Eugene, Douglas Coate, and Michael Grossman, “The Effects of Government Regulation on Teenage Smoking,” Journal of Law and Economics, 24, pp.545~573, 1981.
Lewit, Eugene, Andrew Hyland, Nancy Kerrebrock, and K. Michael Cummings, “Price, Public Policy, and Smoking in Young People”, Tobacco Control 6 (Winter Supplement 2): S2-17~S2-24, 1997.
Manning, Willard G., Naihua Duan, and W. H. Rogers, "Monte Carlo Evidence on the Choice Between Sample Selection and Two-Part Models," Journal of Econometrics, 35, pp.59~82, 1987.

Youth Smoking, Taxes, and Anti-Smoking Sentiment 45
Monitoring the Future, a Continuing Study of American Youth; http://monitoringthefuture.org/.
National Cancer Institute, The Impact of Cigarette Excise Taxes on Smoking Among Children and Adults: Summary Report of a National Cancer Institute Expert Panel, (Bethesda, Maryland: National Cancer Institute, Division of Cancer Prevention and Control, Cancer Control Science Program), 1993.
The Nations Health, “Clinton responds”, October, 1997.
Orzechowski and Walker, The Tax Burden on Tobacco: Historical Compilation, Orzechowski and Walker, Arlington, VA., 1999.
Substance Abuse and Mental Health Service Administration, “National Household Survey on Drug Abuse Released August 18, 1999; http://www.samhsa.gov/NHSDA.htm.
U.S. Department of Health and Human Services, Preventing Tobacco Use Among Young People: A Report of the Surgeon General. Atlanta, Georgia: U.S. Department of Health and Human Services, Public Health Service, Centers for Disease Control and Prevention, National Center for Chronic Disease Prevention and Health Promotion, Office on Smoking and Health, 1994.
保健社 硏究 第22卷 第2號46
Summary ꠚꠚꠚꠚꠚꠚꠚꠚꠚꠚꠚꠚꠚꠚꠚꠚꠚꠚꠚꠚꠚꠚꠚꠚꠚꠚꠚꠚꠚꠚꠚꠚꠚꠚꠚꠚꠚꠚꠚꠚꠚꠚꠚꠚꠚꠚꠚ
청소년 흡연, 담배세, 그리고 반흡연정서
申 潤 貞
ꠚꠚꠚꠚꠚꠚꠚꠚꠚꠚꠚꠚꠚꠚꠚꠚꠚꠚꠚꠚꠚꠚꠚꠚꠚꠚꠚꠚꠚꠚꠚꠚꠚꠚꠚꠚꠚꠚꠚꠚꠚꠚꠚꠚꠚꠚꠚꠚꠚꠚꠚꠚꠚꠚꠚꠚꠚꠚꠚꠚꠚꠚ
본 연구는 담배 가격(담배세)이 청소년들의 재 흡연 행동, 흡연 경
험, 그리고 흡연 시작 행동에 미치는 향을 측정하 다. 이제까지의 연
구들은 미국내 50개 주의 담배 가격 변이를 이용하여 가격 효과를 측정
하 으며 이러한 측정에 있어서 주의 담배 가격과 상 계가 있는 주
의 특징 인 반 흡연 정서를 통제하지 않았다. 이 결과 기존의 연구들이
담배 가격 효과를 실제보다 과 추정하 다고 사려되어 본 연구에서는
주의 반 흡연 정서를 통제하고 담배 가격 효과를 측정하려고 노력하
다. 이를 해 재 흡연 행동과 흡연 경험의 cross-sectional 모델에는
주의 반 흡연 정서를 측정한 변수를 추가 시켰으며 흡연 시작 행동의
hazard model에는 state fixed effects를 포함시켰다. 청소년들의 흡연
행동은 1995년과 1996년에 수집된 데이터인 National Longitudinal
Study of Adolescent Health (Add Health)를 이용하여 분석하 으며 주
의 반 흡연 정서는 1995년과 1996년에 Current Population Survey,
Tobacco Use Supplement가 조사한 미국인들의 흡연에 한 태도 자료
를 이용하여 측정하 다. Cross-sectional 모델과 hazard 모델 모두 주
반 흡연 정서를 통제하지 않았을 경우 이제까지의 다른 연구들과 유사
하게 높은 담배 가격이 청소년 흡연을 감소시키는 효과를 갖는 것으로
나타났다. 측정된 가격 탄력도는 재 흡연 행동 유무 모델의 경우 1995
년 -0.5384와 1996년 -0.4225로 이제까지의 다른 연구들과 비슷한 수치
를 보 다. 그러나 주의 반 흡연 정서를 통제하 을 경우 측정된 가격효
과는 통계 으로 유의하지 않은 것으로 나타났다. 본 연구는 이제까지의
연구들이 주의 반 흡연 정서와 주의 담배 가격이 상호 연 되어 있음에
도 불구하고 주의 반 흡연 정서를 통제하지 않고 청소년 흡연에 한
가격 효과를 측정하 기 때문에 가격효과를 과 추정하 다고 보았다.

Youth Smoking, Taxes, and Anti-Smoking Sentiment 47
한편 주의 반 흡연 정서가 청소년 흡연 감소에 향력이 있는 것으로
측정된 바 흡연에 한 반감 분 기 조성을 통한 연 정책을 실시하는
것이 바람직할 것으로 보았다.