youthworks 2010
TRANSCRIPT

YouthWorks 2010Summer Jobs ProgramCommonwealth of Massachusetts

Commonwealth Corporation and the Executive Office of Labor and Workforce Development extend sincere appreciation to every employer and community grantee who supported the YouthWorks program in 2010. We also congratulate every young person who participated in the program, and send our best wishes for a productive future.

YouthWorks 2010—Summer Jobs Program
(FY2010 Budget, Ch. 61 of the Acts of 2009, Line Item No. 7002-0012)
Submitted to the
General Court of the Commonwealth of Massachusetts
February 2011
Submitted by
Commonwealth Corporation
on behalf of the
Executive Office of Labor and Workforce Development

Commonwealth Corporation Executive Office of Labor and Workforce Development4

Contents
overview.........................................................................................................6YouthWorks 2010—Program Summary Statistics ............................................................................... 6
Report on YouthWorks—State-funded Youth Jobs Program .......................................................... 7
Basic Features of YouthWorks ..................................................................................................................... 8
Youth.Profiles................................................................................................11Pittsfield ............................................................................................................................................................11
Boston ................................................................................................................................................................12
Malden ..............................................................................................................................................................13
Randolph ..........................................................................................................................................................14
Fall River ........................................................................................................................................................... 15
Salem ................................................................................................................................................................ 16
statistical.Profiles.........................................................................................17Statewide Profile .............................................................................................................................................17
Boston Profile ..................................................................................................................................................19
Brockton Profile (Brockton Workforce Area) .........................................................................................21
Cambridge, Chelsea, and Malden Profile (Metro North Workforce Area) ..................................23
Fall River and Taunton Profile (Bristol Workforce Area) .....................................................................25
Fitchburg, Gardner, and Leominster Profile (North Central Workforce Area) ...........................27
Framingham Profile (Metro South/West Workforce Area) ...............................................................29
Lawrence and Haverhill Profile (Lower Merrimack Valley Workforce Area) ...............................31
Lowell Profile (Greater Lowell Workforce Area) ...................................................................................33
Lynn and Salem Profile (North Shore Workforce Area) .....................................................................35
New Bedford Profile (Greater New Bedford Workforce Area) .........................................................37
Pittsfield Profile (Berkshire Workforce Area) .........................................................................................39
Quincy, Randolph, and Weymouth Profile (South Coastal Workforce Area) .............................41
Springfield, Holyoke, and Chicopee Profile (Hampden County Workforce Area) ...................43
Worcester Profile (Central Mass Workforce Area) ................................................................................45
Commonwealth Corporation Executive Office of Labor and Workforce Development6
How many young people participated in YouthWorks 2010?
4,578 youth in 25 cities across Massachusetts took part in summer employment opportunities as part of the 2010 YouthWorks program.
This number of jobs amounted to 120% of the summer goal; an increase of about 8% in the number of youth served compared with the 2009 summer program.
What was the demographic profile of YouthWorks participants?
School Status: Of all youth served during the summer, 82% were in-school; 18% of participants were not in school (8% had already graduated high school but were not enrolled in post-secondary programs; 4% were enrolled in a postsecond-ary programs; 2% were taking GED programs; and 4% had dropped out of high school).
The distribution of out-of-school youth has increased slightly compared with the percentage of out-of-school youth in recent program years—possibly reflecting increased attention on out-of-school and disconnected youth.
Of the 3,587 in-school youth participating in the summer, about 75% were ninth, tenth, or eleventh graders. Nine per-cent were enrolled in middle school, and another 16% were high school seniors.
Age, Gender, Race/Ethnicity: The majority (64%) of Youth-Works participants were in the 16–18 age range; 16% were aged 14–15 and 18% were aged 19–21. Slightly more than half of all summer participants were male (52%) and 48% were female.
African-American youth held a relatively higher percentage of YouthWorks summer jobs: 42% of all summer job pro-gram participants were African-American, more than twice the share of the African-American public school population
within the 25 YouthWorks cities (18%). Latino youth repre-sented the second largest demographic category at 35%. The share of the Latino school age population in YouthWorks cities is approximately the same.
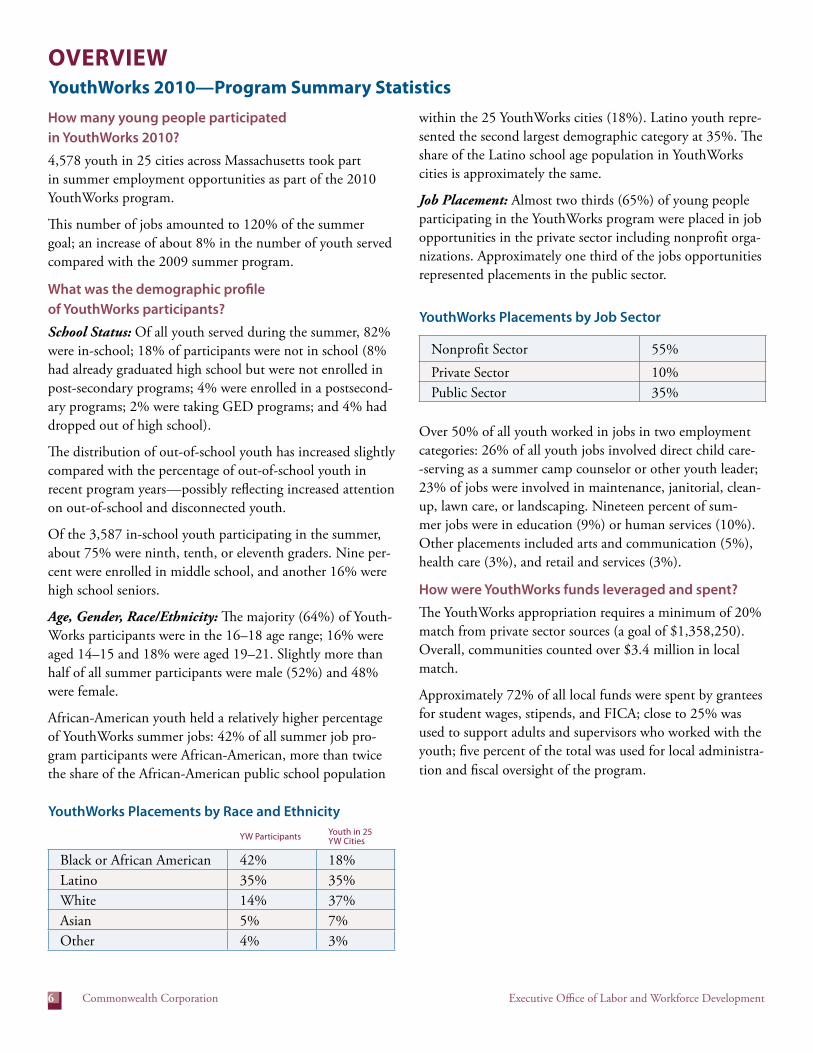
Job Placement: Almost two thirds (65%) of young people participating in the YouthWorks program were placed in job opportunities in the private sector including nonprofit orga-nizations. Approximately one third of the jobs opportunities represented placements in the public sector.
Over 50% of all youth worked in jobs in two employment categories: 26% of all youth jobs involved direct child care--serving as a summer camp counselor or other youth leader; 23% of jobs were involved in maintenance, janitorial, clean-up, lawn care, or landscaping. Nineteen percent of sum-mer jobs were in education (9%) or human services (10%). Other placements included arts and communication (5%), health care (3%), and retail and services (3%).
How were YouthWorks funds leveraged and spent?
The YouthWorks appropriation requires a minimum of 20% match from private sector sources (a goal of $1,358,250). Overall, commu nities counted over $3.4 million in local match.
Approximately 72% of all local funds were spent by grantees for student wages, stipends, and FICA; close to 25% was used to support adults and supervisors who worked with the youth; five percent of the total was used for local administra-tion and fiscal oversight of the program.
YouthWorks.2010—Program.summary.statisticsovervieW
YouthWorks Placements by Job Sector
Nonprofit Sector 55%
Private Sector 10%Public Sector 35%
YouthWorks Placements by Race and Ethnicity
YW Participants Youth in 25 YW Cities
Black or African American 42% 18%Latino 35% 35%White 14% 37%Asian 5% 7%Other 4% 3%

Commonwealth Corporation Executive Office of Labor and Workforce Development 7
Line Item No. 7002-0012 of the FY2010 budget for the Commonwealth of Massachusetts provides: For a youth-at-risk program targeted at reducing juvenile delinquency in high risk areas of the commonwealth; provided that these funds may be expended for the development and implementation of a year-round employment program for at-risk youth; provided further, that $500,000 of these funds shall be matched by private orga-nizations; provided further that these funds shall be available for expenditure through September 1, 2010 $4,000,000
Line Item No. 7002-0012 of the FY2011 budget for the Commonwealth of Massachusetts provides: For a youth-at-risk program targeted at reducing juvenile delinquency in high risk areas of the commonwealth; provided that these funds may be expended for the development and implementation of a year-round employment program for at-risk youth; provided further, that $500,000 of these funds shall be matched by private orga-nizations; provided further that these funds shall be available for expenditure through September 1, 2011 $3,700,000
Background and Context for Summer 2010:
The Commonwealth of Massachusetts awarded two rounds of grants to support the YouthWorks employ-ment program in the summer of 2010 to maintain the number work placements provided to young people in the summer of 2009. In the beginning of June 2010, el-igible workforce investment boards were awarded FY10 grant contracts representing resources appropriated in the FY10 state budget. At the end of June, the General Court finalized the FY11 budget. A YouthWorks ap-propriation was included in the FY11 budget as a line item. The Governor, working with the Executive Office of Labor and Workforce Development, decided that the FY11 appropriation should be added to the FY10 funds—with both spent to support YouthWorks pro-gram activities during the summer of 2010. Statewide, both funds together provided more than $7 million for youth employment, an increase over the amount avail-
report.on.YouthWorks—state-funded.Youth.Jobs.Program
Table One: 2010 Summer YouthWorks Program Allocations
LWIA Eligible CitiesFY10
AllocationFY11
AllocationTotal
Allocation
Berkshire Pittsfield $48,713 $45,660 $94,373Boston Boston $1,425,000 $1,335,700 $2,760,700Bristol Fall River, Taunton $172,931 $162,094 $335,025Brockton Brockton $124,914 $117,086 $242,000New Bedford New Bedford $157,969 $148,070 $306,039Hampden County Springfield, Holyoke, Chicopee $508,355 $476,498 $984,852Lower Merrimack Lawrence, Haverhill $223,036 $209,059 $432,095Metro North Cambridge, Chelsea, Malden $191,372 $179,380 $370,752Metro South/West Framingham $43,494 $40,768 $84,262
North CentralLeominster, Fitchburg, Gardner
$105,429 $98,822 $204,251
North Shore Lynn, Salem $157,969 $148,070 $306,039Lowell Lowell $172,583 $161,768 $334,351South Coastal Weymouth, Quincy, Randolph $65,067 $60,989 $126,056Worcester Worcester $353,169 $331,037 $684,206Totals: $3,750,000 $3,515,000 $7,265,000

Commonwealth Corporation Executive Office of Labor and Workforce Development8
able from state sources last year. Table One (see page 7) shows the allocations provided to eligible areas for FY10 and FY11.
Basic Features of YouthWorks
Eligibility to Apply Funds: The YouthWorks Program was limited to the 25 cities in Massachusetts demonstrating the greatest incidence of juvenile detention and adjudication, cities where low-income youth are especially in need of ensuring access to summer job opportunities. These cities are all part of “workforce investment areas” represented by a lo-cal work force investment board. Applications to design and manage local YouthWorks programs were submitted on a cooperative basis between the targeted city (ies) and the local workforce investment board where those cities are located. This partnership helped encourage local communities to coordinate the summer jobs resources with broader youth strategies. Table Two lists the 25 cities in 14 regions that were eligible to apply for YouthWorks resources.
Application Process: Communities were invited to submit an application in order to receive an available allocation based on the number of annual DYS placements in the region. Funds for the YouthWorks summer program were allocated to eligible cities using a formula that reflects the relative share of youth aged 14–21 who live below the poverty level, using data from the 2000 Census.
Eligibility of Youth to Participate: In general, participa-tion in this program is limited to youth aged 14–21 whose family income for the most recent six-month period does not exceed the annual equivalent to be eligible to receive a free or reduced lunch in the National School Lunch Program. This is equivalent to an annual income of about $29,000 for a family of four (income thresholds vary by family size). In ad-dition, priority was given to youth who demonstrate at least one ad ditional risk factor beyond family income level. For purposes of this program, such risk factors were defined as:
• A history of juvenile delinquency, or membership in a youth gang;
• Poor academic performance or a school dropout; • Homelessness; • Having aged out of foster care, or being close to aging
out of foster care; • Being the child of a single working parent; • Having disabilities or special needs; • Lack of fluency in English; or • Being a teen parent.
Program Activities: The primary component of the Youth-Works program is subsidized employment at public agencies, departments and authorities, nonprofit organizations, and private-sector settings. Participants are employed up to 25 hours per week over a six-week period during the summer. Participants could be em ployed in the summer component
Table Two: List of 2010 YouthWorks Cities and Regions
Workforce Area Cities
Berkshire Workforce Investment Area PittsfieldBoston Workforce Investment Area BostonBristol Workforce Investment Area Fall River, TauntonBrockton Workforce Investment Area BrocktonCentral Mass Workforce Investment Area WorcesterGreater Lowell Workforce Investment Area LowellGreater New Bedford Workforce Investment Area New BedfordHampden County Workforce Investment Area Chicopee, Springfield, HolyokeMerrimack Valley Workforce Investment Area Lawrence, HaverhillMetro North Workforce Investment Area Cambridge, Chelsea, MaldenMetro South/West Investment Area FraminghamNorth Central Workforce Investment Area Fitchburg, Leominster, GardnerNorth Shore Workforce Investment Area Lynn, SalemSouth Coastal Workforce Investment Area Quincy, Randolph, Weymouth

Commonwealth Corporation Executive Office of Labor and Workforce Development 9
beginning as early as June 1, 2010, and ending as late as Sep-tember 3, 2010. Hourly wages were required to be no less than the Massachusetts minimum wage of $8.00 per hour.
In addition to funding local agencies to pay wages and stipends for job, YouthWorks provides funds to conduct employer outreach and engagement and youth recruitment and supervision on the job. Local workforce areas and their partners also offer youth pre-employment training. Young people take part in job readiness activities either prior to be-ing placed in a job or while they are employed to help them acclimate to their jobs and make employability skill gains.
Program Staffing: Grant recipients were required to ensure that youth placed in job sites received adequate supervision; localities were permitted to hire and assign staff as worksite supervisors.
Supplemental Services: Grant recipients were also permit-ted to support certain services to youth in conjunction with subsi dized employment:
• Educational services, including GED classes and Eng-lish-as-a-Second Language, could be offered to any or all youth in combination with subsidized employment. The hours spent receiving such services were counted as part of the 25-hour work week.
• Employment and career counseling, and career aware-ness activities could be offered, but only as an adjunct to work and training, and could not be provided to any youth as a sole service.
Allowable Expenditures: Not less than 70% of the total funds provided under this program were required to be spent on wages and stipends paid to eligible youth. Up to 30% of the total funds provided under this program could be spent on sala ries and related personnel costs of outreach, counsel-ing, instructional and job site supervisory staff; and instruc-tional materials. Each grant recipient was permitted to retain no more than 5% of its grant funds for local management, oversight, reporting and record keeping, and monitoring.
Based on an analysis of program expenditures, 72% of all local funds were spent on youth wages, stipends, and FICA; 28% of funds were expended for local staff and administra-tive expenses combined.
Results of the 2010 YouthWorks Program
Table Three (page 10) presents summary statewide informa-tion on the distribution of funds and on summer program participation by youth. The Statewide Profile in the Appen-dix includes more specific data on the demographic back-ground and characteristics of the Youth Works population.
All participant data presented in the state and local pro-files represent information reported by local communities through Commonwealth Corporation’s YouthWorks database. Each analytical table includes all data reported for participants in the region. Not all information was reported for every youth participant.
New YouthWorks Features and Initiatives
Several initiatives were undertaken this year to improve the quality and consistency of YouthWorks programming and to improve the employability of youth placed at risk. To support the development of marketable skills that are relevant in a competitive economy, the use of a structured work-readiness curriculum and work-readiness assessment instrument were required for all workforce areas that received YouthWorks funding. The inclusion of young worker safety training was a mandated element of the work-readiness component.
In partnership with the MA Department of Youth Services and in collaboration with several youth serving organiza-tions, a curriculum guide called Empower Your Future was developed this year. The creation of a comprehensive curriculum guide on work readiness for youth represents a significant resource for the state’s youth workforce field. To support young people’s successful transition to work and career, the publication was created to take into account a variety of learning styles, to be interactive and engaging, and to reinforce employability skills to support personal and professional achievement for young people. Training work-shops on using the guide in YouthWorks programs were held in June 2010. Additional training on using the guide will be offered in the spring of 2011.
All YouthWorks participants were required to complete a work-readiness assessment. Participating cities had the choice of using a locally developed instrument or the MA Work-Based Learning Plan (WBLP). The WBLP, an assessment tool used by thousands of students in the state’s Connecting Activities program as part of the School to Career initiative, is designed to help structure goal setting, organize learning on the job, and assess work-readiness. In an effort to increase and document the impact of YouthWorks, an online version of the WBLP was piloted during the 2008 summer Youth-Works program. This year (2010), close to 75% of partici-pants used the WBLP (either the paper version or the online version); 25% of the approximately YouthWorks participants used the online version—a 100% increase in use over the pi-lot year in 2008. Pilot participants agreed that an assessment tool is critical in helping youth and employers explicitly un-derstand and document employability skills’ gain—both for

Commonwealth Corporation Executive Office of Labor and Workforce Development10
gains in ‘soft skills’ like punctuality and teamwork, as well as for gains in job-specific skills such as computer and project management skills.
To ensure that local programs are serving youth that are most in need of subsidized employment to connect with the labor market, an interagency data matching project was designed to document the percentage of youth in YouthWorks served by other social service agencies and programs. Preliminary findings indicate that a percentage of youth receives services from one of the following agencies: Department of Youth Services, Department of Children and Families, Department of Transitional Assistance, the Massachusetts Rehabilitation Commission and MassHealth.
Finally, YouthWorks is in the process of developing a web-based program management portal to serve as a front-end entry point for employers to learn about hiring and working with youth. The system’s back-end has a database able to manage a large-scale youth employment program. Youth-Works will create this statewide online data management tool to help identify and enroll eligible youth; identify, approve, and monitor worksites; match youth to an ap-propriate worksite; monitor the placement and progress of youth; and collect data for immediate reporting. The online youth employment platform has been recognized as a best practice by the United States Department of Labor.
Table Three: 2010 YouthWorks Year-Round Program Results
LWIA Eligible CitiesTotal Available Funds (FY10 &
FY11)
Targeted # of Jobss
Actual # of Youth Jobs
Youth Served as Percent of Target
Berkshire Pittsfield $94,373.24 49 52 105%Boston Boston $2,760,700.00 1,448 1,737 1,20%Bristol Fall River, Taunton $335,025.01 176 209 119%Brockton Brockton $241,999.96 127 180 142%New Bedford New Bedford $306,038.94 160 160 100%Hampden County Springfield, Holyoke, Chicopee $984,852.18 516 550 106%Lower Merrimack Lawrence, Haverhill $432,094.63 227 238 105%Metro North Cambridge, Chelsea, Malden $370,752.02 194 330 170%Metro South West Framingham $84,261.82 44 24 54%North Central Leominster, Fitchburg, Gardner $204,250.66 107 95 89%North Shore Lynn, Salem $306,038.94 160 180 112%Lowell Lowell $334,350.91 175 259 148%South Coastal Quincy, Randolph, Weymouth $126,055.69 66 74 112%Worcester Worcester $684,206.00 359 490 137%Totals: $7,265,000.00 3,810 4,578 120%

Commonwealth Corporation Executive Office of Labor and Workforce Development 11
Seventeen year-old Malik Grandson worked his first job this summer as a maintenance person at Girls, Inc. at the Gladys Allan Brigham Community Center for children. Malik wanted a summer job so that he would be occupied and not waste time. He liked the idea of working to take care of a center dedicated to children. Although he did say that when he first heard about the job opportunity, he thought he would be surrounded by girls. Malik was given keys to the building to open up early—he got to work at 6:30 every morning to get set up for work. His job was to keep things clean and well organized. He got a good reference from his supervisor, Jim Scarpetto. As Jim put it, “Malik is headed in the right direction. He’s going to go far. He’s competent and responsible. I’m proud of him. He’s taking every opportunity to get a taste of the real world. Always asking ‘what’s next?’ He’s full of initiative.”
The YouthWorks program in Pittsfield is focused on getting young people working—particularly young people who might have difficulty finding a job. The program provides youth and young adults with a jump start into work; it often turns into an unofficial mentoring program. As Heather Shogry-Williams, the Youth Director at the Berkshire County Regional Employment Board (REB) notes, “we find, in many cases, employer act like parents—they encourage youth to take the next steps in their education and help them to get jobs.”
The REB has a comprehensive summer employment pro-gram with a wide range of community partners on board to ensure that youth that need jobs the most are identified and prepared for work. For example, through its relation-ship with the Berkshire Reconnect Team Network, the REB works to identify young people who are disconnected or at risk of disconnecting from both the educational system and are un/underemployed. To support them in being successful in summer job placements, staff from the career center and local schools provides job readiness skills as part of Youth-Works. The summer starts with work orientation session where participants learn about what is expected from them on the job. On Fridays, the REB runs workshops on top-ics such as health and safety; completing applications and resume writing; dress for success and interviewing; and dem-onstrating positive work ethic. The program is using a work readiness curriculum developed with the Pittsfield chamber of commerce.
Karlee Roraback knew that her placement in the food service department at the Berkshire Medical Center was an opportunity she didn’t want to pass up. The Berkshire Medi-cal System/Medical Center is the biggest employer in the Berkshires. Karlee’s hoping to get a permanent position there someday as a medical assistant. Her supervisor Jean Morin describes her as upbeat and motivated. “Whenever there was down time, she found something that needed doing. We really needed her –summer is a crunch time here, a lot of people are on vacations. She learned a lot about customer service for patients.”
YouthWorks.2010.summer.Jobs,.ProfilesPittsfield.(berkshire)
Malik Grandson
Jean Morin and Karlee Roraback

Commonwealth Corporation Executive Office of Labor and Workforce Development12
The high point for Josh Sanchez this summer was giving a public talk on the Giant Ocean Tank (GOT)–or if you’ve been to the New England Aquarium in Boston, the exhi-bition commonly known as the Shark Tank. He had just finished an outline for his talk—part of the training re-quirements to get the GOT gallery certification—and had practiced his delivery only once. Then he was asked to go live. His proudest moment was hearing the applause of over 100 Aquarium visitors. Since then, he’s given the 15-minute talk several times more.
An internship at the New England Aquarium is one of the most coveted jobs in Boston’s large summer employment program managed by the Mayor’s Office of Jobs and Com-munity Service (JCS). The Aquarium hires 70 youth plus 10
teen counselors. The organization has a finely honed youth employment program—a result of a 15-year long partner-ship with the city of Boston. The pre-employment compo-nent is designed to give young people preparation for their Aquarium position as well as an understanding of their place in the larger picture of environmental stewardship. Interns are also exposed to the college application process.
YouthWorks participants Josh and Iva-Beth went through a week of training at the beginning of the summer; they attended a professional development day on climate change and a week of volunteer training. Every week of their six-week position, they took part in a career-skills workshop where they learned to manage money, write a resume, and practice their pitch in mock interviews. They also learned how to write a good college application, fill out the FAFSA, and participate in two college visits. If they want to continue to work at the Aquarium in the fall, the must submit their resume and interview.
Iva-Beth worked in the Aquarium gift store. Her job was to ‘meet and greet’ and make customers feel welcomed. Although this is not her first job, Iva-Beth gained some new skills. “I had to get confident to do this. I’m used to working with kids in my other summer jobs. I wanted to try some-thing new—retail. I’m not used to interacting with others. Here it’s my job to meet new people and friendly tourists. I got trained in getting good people skills and being organized. I’m most proud of opening up to other people. I would have been really, really quiet; now, I’m able to open up to people and be exposed to different personalities. This is go-ing to help me be a doctor. I’ll be working with kids; here, I learned to interact with adults.”
Josh received the Aquarium summer program’s Zooxanthel-lae Award--named for an algae that gives coral its energy and color--for being the summer intern that excelled all round. He wants to be a marine biologist, an actor, or a pilot—or figure out a way to combine all three roles.
boston
Iva-Beth Kirnon and Josh Sanchez

Commonwealth Corporation Executive Office of Labor and Workforce Development 13
The halls of the Malden WMCA are decked with eye-catch-ing murals and posters. Outside young campers play in the summer sunshine under the watchful eye of their counselors. It’s been a life- shaping experience for 19-year old Shaleaka Johnson, a YouthWorks participant from Malden working as a Y camp counselor. “This job has helped me find out what I want to do. I realize that these kids need help. Work-ing at the Y—I see that all kids have different problems. So, I’m changing my field to education and social work. Now I know what I want to be.”
The Malden YouthWorks program is run through the City of Malden with administrative oversight from the Metro North Regional Employment Board. City of Malden Director of Human Resources Christine DiPietro reported that there were 300 applications for half the number placements avail-able due to funding. “We’ve placed youth at town planning and engineering, finance, the city clerk, and at a watershed project a the Malden river. We give participants financial literacy information—how to work with their money and how to budget. They are taken on as city of Malden em-ployees, so they have to know how to act at the job site and understand ethics. We get the working papers and physical if needed.”
DiPietro underscored the importance of community collabo-ration to the success of YouthWorks participants like Shale-aka. The network of services that supported Shaleaka and her 5-month old daughter are a case in point. YouthWorks was one part of a web of support that has helped this teen live independently from her family, graduate from high school and enroll in college. Shaleaka is proud of the fact she is attending Bunker Hill Community College on a 2-year scholarship in the special education teaching program. Her YouthWorks placement was built off an internship she had at the Malden High School’s Day Care Center.
Her supervisor, Malden YMCA Youth Coordinator Frank Molis, is proud of Shaleaka’s focus on a positive future. “She has hurdled from one challenge over another over the two or so years I’ve known her—like the track athlete she was in school. I’m so proud of her. She’s hardworking and dedi-cated, going to Bunker Hill in the fall. Nothing will stop her. This program plus the community supports she’s received—
from people in the community will ensure her future success.She is already making a contribution to her community and I know that it will continue.” Shaleaka has learned a lot from Frank’s no-nonsense management style. “The thing I would tell other teens about work--be open with your boss, open up and they can help you with things like your schedule. If you’re early, you’re on time; if you’re on time, you’re late.”
malden
Shaleaka Johnson

Commonwealth Corporation Executive Office of Labor and Workforce Development14
Rindi Skiffington director of the Randolph Parent Infor-mation Center and YouthWorks worksite supervisor nails the description of the YouthWorks employer: “The role of employer in this program is to help young people learn from experiences and have success. It’s about setting an atmo-sphere and understanding the importance of the initial work experience—what you want them to get out of the job—the marketable skills to leave with. You want to have a certain level of expectation and a sense that ‘I’ll be with you’.”
The YouthWorks program in Randolph is operated by the Quincy Public Schools under the administration of the South Shore Workforce Investment Board. Edward Smith, faculty member in the QPS Career and Technical Educa-tion department, is the consummate program coordinator. Part youth counselor, part business outreach marketer, and
always the detail-oriented task master of a program run in three cities, Smith has honed the many facets of the program. He knows the value of structure and consistently communicating program expectations to youth and employ-ers in the region.
Like many of the cities targeted for YouthWorks, Randolph is in crisis. There is a high level of poverty and unemploy-ment in the area and as a result, young people placed at risk are often underserved. At the Parent Center YouthWorks participants Modestine Williams and Mary Bernard, both 17, work under the supervision of Rindi and Kathy Kulhane. Their job responsibilities include customer service for visitors registering or transferring their children in school and office tasks such as filing and archiving using scanning technology.
Both young women wanted to work for the experience and the income. Modestine is a new mother and this was her first job. She wanted to stay active this summer and not sit at home watching TV with her brothers and sisters. Mary has had a prior job at Burger King. Both have good advice to pass on to other teens on the job: Mary advises other teens to stay respectful and pass it along to others; Mod-estine suggests that teens who are dealing with customers make an effort to relate to lots of people and make them comfortable when interacting with them. In her words, “Be focused and try to get along with everyone.”
randolph
Mary Bernard and Modestine Williams

Commonwealth Corporation Executive Office of Labor and Workforce Development 15
Summer employment is crucial for young people in Fall River. They need safe places and work experience in the face of high employment and growing gang violence in the area. The Bristol Workforce Investment Board spearheads the effort to coordinate community connections that enable YouthWorks participants to gain work-readiness skills and land work placements.
Brittany Gillis, aged 17, and 18-year old Kayla Longstone worked at the Massachusetts Rehabilitation Commission (MRC) in Fall River this summer helping to put disabled people into employment while they got exposure to human service jobs. “The economy is really low—this is the only job I could get and it’s good for my resume. I tried applying for jobs, but the stores at the mall are not hiring,” remarked Brittany.
Their supervisor, Lisa Atkinson of the MRC, noted that both young women became very sensitive to the needs of the agency’s clients; each young woman learned, in her way, how to manage consumers—particularly the harder to handle. The young women also tackled several projects that needed to get done. They updated a resource list that had been backdated for two years, collected data, and did a lot of leg work. In addition, they learned PowerPoint, managed the reception work, and got good at directing calls to staff.
Jeffry Martinez was a YouthWorks participant placed at United Neighbors (UN) of Fall River, a organization dedi-cated creating a safer and more caring community for fami-lies and children. The 19-year old is a former foster youth
who had been relocated to Fall River due to gang violence in his own community. The placement at UN has benefit-ted both Jeffry and the local peace efforts led by the UN coalition. Jeffry quickly stepped up to the plate at work. He started by doing basic office tasks—stuffing envelopes and stapling fliers. As time went by, he took an active interest in helping the annual peace summit devoted to promoting peace on the streets of Fall River. He made posters for the summit and became involved in all the activities. He became very engaged in the workshops on gang violence and when he was interviewed by NBC TV, he stated that programs like the peace summit would have helped him when he was being pressured to join a gang.
This summer Jeffrey developed a brochure of social services as part of United Way Campaign and got permission to put them in court house. He is also worked on a video film of peace activities—a video that involves music and dance. He learned how to edit video by himself. The staff at UN has helped Jeffry take care of the basics of daily life and how to sign up for community college courses. They’ve helped him develop a study schedule and access tutoring services at Bris-tol Community College. Jeffry’s future plans could include doing political work. He is interested in the fact that every-one has different attitudes about their community—from the person on the street to people in power such as police. The staff at UN observed that Jeffry is a powerful reminder that the world can change—one individual at a time.
fall.river
Brittany Gillis and Kayla Longstone
Jeffry Martinez

Commonwealth Corporation Executive Office of Labor and Workforce Development16
The YouthWorks program in Salem, managed by the North Shore Workforce Investment Board (WIB), connects many young people like Vladimir Aguasvivas to their first jobs. This is an increasingly important function in today’s economy where young people are being squeezed out of the summer job market because of competition from college students and adults looking for work. As Shari Cornett, Di-rector of Youth Workforce Initiatives at the WIB, notes, “not only do young people need the work experience, they need the summer jobs to supplement family income and to buy school clothes so they can start school like other kids.”
The North Shore WIB operates a tightly run summer program designed to give young people exposure to work-ing and work-readiness skills. The North Shore youth career center and the schools participating in Connecting Activities provide workshops for eligible youth interested in working for the summer. After successful completion of the work-shops, young people are admitted to a job fair with potential summer employers looking to make the right match for their positions.
Vladimir was placed at Salem CyberSpace, a nonprofit or-ganization dedicated to bridging the digital divide through state-of-the-art technology and innovative programming. He took part in the CyberCorps program at CyberSpace where young people are taught to deliver web and graphic design services for local organizations. These students not only learn about technology but also learn how to take direction, work within a team, work on a deadline, manage conflict, provide customer service and finish a high-quality project on their own. Vladimir, an 18-year old from Salem High School, combined web design with learning English. He’s learned a lot from the design boot camp that taught him some of the basics of web design like Dream Weaver, Photoshop, CSS and HTML, in addition to successful de-sign elements, and working with a client.
According to Robin Frans Youth Manager at CyberSpace, Vladimir was a great fit because of his interest and talent in art. She explained, “You don’t need a huge background in graphic design, but you do have to be a computer enthusiast. And it’s amazing how fast our interns learn.” It was a great experience for Vladimir’s first job. In a state where close to 60% of the jobs depend on technology and computer skills, Vladimir will be in the running.
salem
Vladimir Aguasvivas at Salem CyberSpace

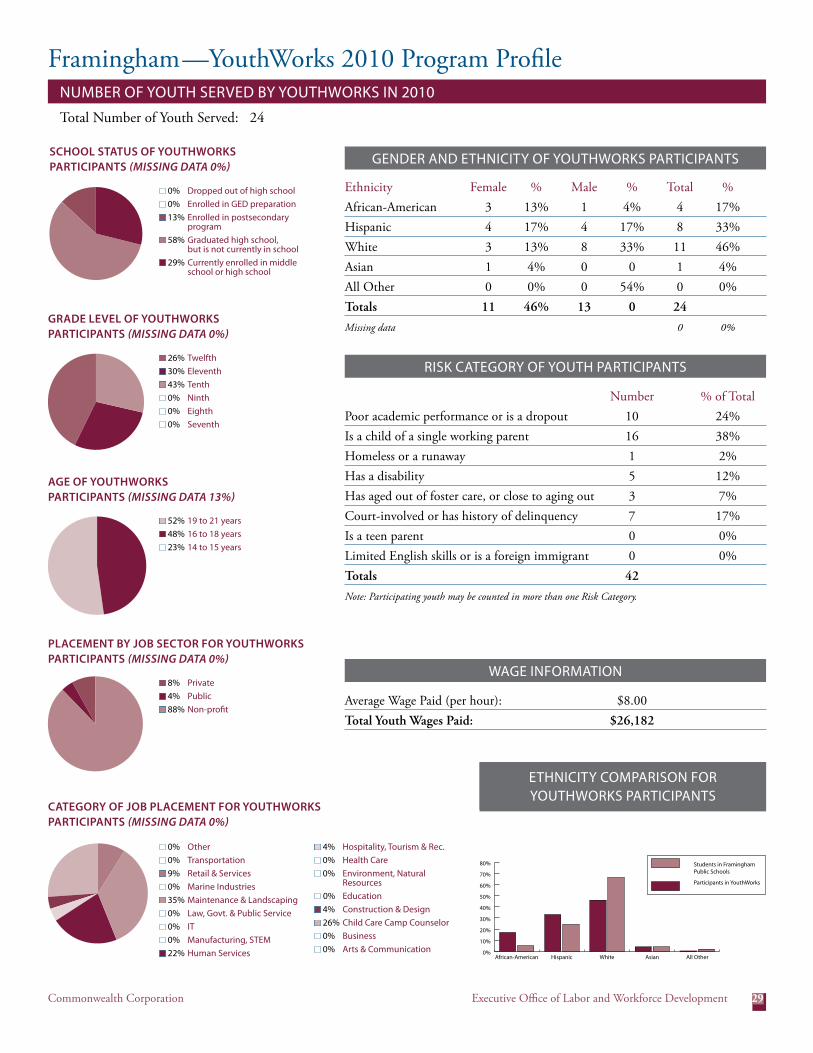
Statewide YouthWorks 2010 Program Profile NuMBeR oF YouTH SeRVed BY YouTHWoRkS iN 2010
Total Number of Youth Served: 4,578
17Commonwealth Corporation Executive Office of Labor and Workforce Development
GeNdeR ANd eTHNiCiTY oF YouTHWoRkS PARTiCiPANTS
Ethnicity Female % Male % Total %African-American 940 21% 950 21% 1890 42%Hispanic 763 17% 822 18% 1585 35%White 273 6% 340 8% 613 14%Asian 88 2% 139 3% 227 5%All Other 103 2% 107 2% 210 5%Totals 2,167 48% 2,358 52% 4,525
Missing data 53 1%
RiSk CATeGoRY oF YouTH PARTiCiPANTS
Number % of TotalPoor academic performance or is a dropout 871 17%Is a child of a single working parent 2813 54%Homeless or a runaway 76 1%Has a disability 485 9%Has aged out of foster care, or close to aging out 132 3%Court-involved or has history of delinquency 295 6%Is a teen parent 163 3%Limited English skills or is a foreign immigrant 403 8%Totals 5,238
Note: Participating youth may be counted in more than one Risk Category.
WAGe iNFoRMATioN
Average Wage Paid (per hour): $8.00Total Youth Wages Paid: $5,210,642
n 4% dropped out of high schooln 2% enrolled in Ged preparationn 4% enrolled in postsecondary
programn 7% Graduated high school,
but is not currently in schooln 82% Currently enrolled in middle
school or high school
SCHOOL STATuS OF YOuTHWORkS PARTICIPANTS (MiSSing data 5%)
Dropped out of high school
Enrolled in GED preparation
Enrolled in postsecondary program
Graduated high school, but is not currently in school
Currently enrolled in middle school or high school
n 16% Twelfthn 29% eleventhn 26% Tenthn 20% Ninthn 8% eighthn 1% Seventh
gRAdE LEvEL OF YOuTHWORkS PARTICIPANTS
n 18% 19 to 21 yearsn 64% 16 to 18 yearsn 16% 14 to 15 years
Private
Public
Non-profit%
PLACEMENT BY JOB SECTOR FOR YOuTHWORkS PARTICIPANTS (MiSSing data 1%)
n 10% Privaten 35% Publicn 55% Non-profit
AgE OF YOuTHWORkS PARTICIPANTS (MiSSing data 4%)
19 to 21 years 18%
16 to 18 years 64%
14 to 15 years 19%
CATEgORY OF JOB PLACEMENT FOR YOuTHWORkS PARTICIPANTS (MiSSing data 6%)
Arts & Communications
Business
Child Care Camp Counselor
Construction & Design
Education
Environment, Natural Resources
Health care
Hospitality, Tourism, & rec
Human Services
Manufacturing, STEM
IT
law, got&public service
maintence&landscaping
marine industries
retail&services
transportation
other
eTHNiCiTY CoMPARiSoN FoR YouTHWoRkS PARTiCiPANTS
0%
10%
20%
30%
40%
50% Students in 25 School Districts
Participants in YouthWorks
All OtherAsianWhiteHispanic African-American
n 8% othern 1% Transportationn 3% Retail & Servicesn 0% Marine industriesn 23% Maintenance & Landscapingn 4% Law, Govt. & Public Servicen 1% iT
0% Manufacturing, STeMn 10% Human Services
n 1% Hospitality, Tourism & Rec.n 3% Health Caren 3% environment, Natural
Resourcesn 9% educationn 1% Construction & designn 26% Child Care Camp Counselorn 3% Businessn 5% Arts & Communication
Commonwealth Corporation Executive Office of Labor and Workforce Development18
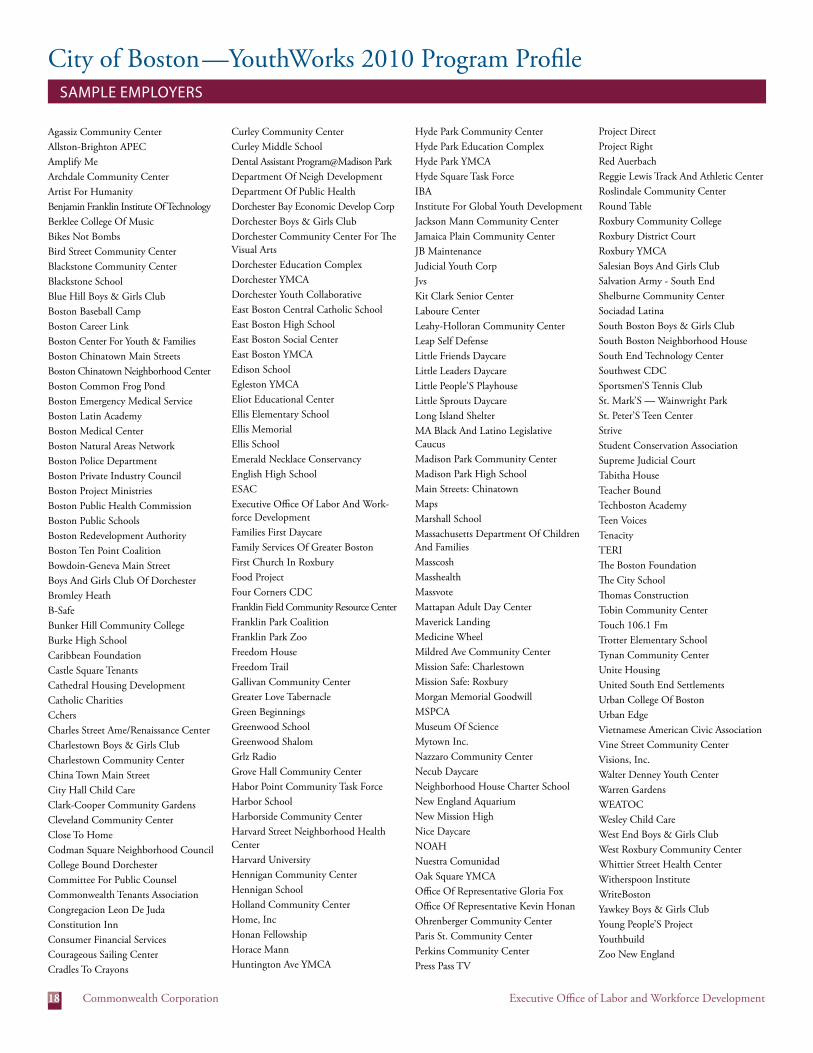
City of Boston—YouthWorks 2010 Program Profile SAMPLe eMPLoYeRS
Agassiz Community CenterAllston-Brighton APECAmplify MeArchdale Community CenterArtist For Humanity Benjamin Franklin Institute Of TechnologyBerklee College Of MusicBikes Not BombsBird Street Community CenterBlackstone Community CenterBlackstone SchoolBlue Hill Boys & Girls ClubBoston Baseball CampBoston Career LinkBoston Center For Youth & FamiliesBoston Chinatown Main StreetsBoston Chinatown Neighborhood CenterBoston Common Frog PondBoston Emergency Medical ServiceBoston Latin AcademyBoston Medical CenterBoston Natural Areas NetworkBoston Police DepartmentBoston Private Industry Council Boston Project MinistriesBoston Public Health CommissionBoston Public SchoolsBoston Redevelopment AuthorityBoston Ten Point CoalitionBowdoin-Geneva Main StreetBoys And Girls Club Of DorchesterBromley Heath B-SafeBunker Hill Community CollegeBurke High SchoolCaribbean FoundationCastle Square TenantsCathedral Housing DevelopmentCatholic CharitiesCchersCharles Street Ame/Renaissance CenterCharlestown Boys & Girls ClubCharlestown Community CenterChina Town Main StreetCity Hall Child CareClark-Cooper Community GardensCleveland Community CenterClose To HomeCodman Square Neighborhood CouncilCollege Bound DorchesterCommittee For Public CounselCommonwealth Tenants AssociationCongregacion Leon De JudaConstitution InnConsumer Financial ServicesCourageous Sailing CenterCradles To Crayons
Curley Community CenterCurley Middle SchoolDental Assistant Program@Madison Park Department Of Neigh DevelopmentDepartment Of Public HealthDorchester Bay Economic Develop CorpDorchester Boys & Girls ClubDorchester Community Center For The Visual ArtsDorchester Education ComplexDorchester YMCADorchester Youth CollaborativeEast Boston Central Catholic SchoolEast Boston High SchoolEast Boston Social CenterEast Boston YMCAEdison SchoolEgleston YMCAEliot Educational CenterEllis Elementary SchoolEllis MemorialEllis SchoolEmerald Necklace ConservancyEnglish High SchoolESACExecutive Office Of Labor And Work-force DevelopmentFamilies First DaycareFamily Services Of Greater BostonFirst Church In RoxburyFood ProjectFour Corners CDCFranklin Field Community Resource CenterFranklin Park CoalitionFranklin Park ZooFreedom HouseFreedom TrailGallivan Community CenterGreater Love TabernacleGreen BeginningsGreenwood SchoolGreenwood ShalomGrlz RadioGrove Hall Community CenterHabor Point Community Task Force Harbor SchoolHarborside Community CenterHarvard Street Neighborhood Health CenterHarvard UniversityHennigan Community CenterHennigan SchoolHolland Community Center Home, IncHonan FellowshipHorace MannHuntington Ave YMCA
Hyde Park Community Center Hyde Park Education ComplexHyde Park YMCAHyde Square Task ForceIBAInstitute For Global Youth DevelopmentJackson Mann Community CenterJamaica Plain Community CenterJB MaintenanceJudicial Youth CorpJvsKit Clark Senior CenterLaboure CenterLeahy-Holloran Community CenterLeap Self DefenseLittle Friends DaycareLittle Leaders DaycareLittle People’S PlayhouseLittle Sprouts DaycareLong Island ShelterMA Black And Latino Legislative CaucusMadison Park Community CenterMadison Park High SchoolMain Streets: ChinatownMapsMarshall SchoolMassachusetts Department Of Children And FamiliesMasscoshMasshealthMassvoteMattapan Adult Day CenterMaverick LandingMedicine WheelMildred Ave Community CenterMission Safe: CharlestownMission Safe: RoxburyMorgan Memorial GoodwillMSPCAMuseum Of ScienceMytown Inc.Nazzaro Community CenterNecub DaycareNeighborhood House Charter SchoolNew England AquariumNew Mission HighNice DaycareNOAHNuestra ComunidadOak Square YMCAOffice Of Representative Gloria FoxOffice Of Representative Kevin HonanOhrenberger Community CenterParis St. Community CenterPerkins Community CenterPress Pass TV
Project DirectProject RightRed Auerbach Reggie Lewis Track And Athletic CenterRoslindale Community CenterRound TableRoxbury Community CollegeRoxbury District CourtRoxbury YMCASalesian Boys And Girls ClubSalvation Army - South EndShelburne Community CenterSociadad LatinaSouth Boston Boys & Girls ClubSouth Boston Neighborhood HouseSouth End Technology CenterSouthwest CDCSportsmen’S Tennis ClubSt. Mark’S — Wainwright ParkSt. Peter’S Teen CenterStrive Student Conservation AssociationSupreme Judicial CourtTabitha HouseTeacher Bound Techboston AcademyTeen VoicesTenacity TERIThe Boston FoundationThe City SchoolThomas ConstructionTobin Community Center Touch 106.1 FmTrotter Elementary SchoolTynan Community CenterUnite HousingUnited South End SettlementsUrban College Of BostonUrban EdgeVietnamese American Civic AssociationVine Street Community CenterVisions, Inc. Walter Denney Youth CenterWarren GardensWEATOCWesley Child CareWest End Boys & Girls ClubWest Roxbury Community Center Whittier Street Health CenterWitherspoon InstituteWriteBostonYawkey Boys & Girls ClubYoung People’S ProjectYouthbuildZoo New England

Commonwealth Corporation Executive Office of Labor and Workforce Development 19
WAGe iNFoRMATioN
GeNdeR ANd eTHNiCiTY oF YouTHWoRkS PARTiCiPANTS
RiSk CATeGoRY oF YouTH PARTiCiPANTS
City of Boston—YouthWorks 2010 Program Profile NuMBeR oF YouTH SeRVed BY YouTHWoRkS iN 2010
Total Number of Youth Served: 1,737
Ethnicity Female % Male % Total %Black 533 31% 503 29% 1036 60%Hispanic 225 13% 204 12% 429 25%White 38 2% 43 2% 81 5%Asian 37 2% 39 2% 76 4%All Other 53 3% 49 3% 102 6%Totals 886 51% 781 49% 1,724
Missing data 13 1%
Number % of TotalPoor academic performance or is a dropout 334 17%Is a child of a single working parent 1236 62%Homeless or a runaway 23 1%Has a disability 63 3%Has aged out of foster care, or close to aging out 24 1%Court-involved or has history of delinquency 126 6%Is a teen parent 42 2%Limited English skills or is a foreign immigrant 160 8%Totals 2,008
Note: Participating youth may be counted in more than one Risk Category.
Average Wage Paid (per hour): $8.00Total Youth Wages Paid: $2,091,246
n 5% dropped out of high schooln 2% enrolled in Ged preparationn 3% enrolled in postsecondary
programn 5% Graduated high school,
but is not currently in schooln 83% Currently enrolled in middle
school or high school
SCHOOL STATuS OF YOuTHWORkS PARTICIPANTS (MiSSing data 3%)
Dropped out of high school 1%
Enrolled in GED preparation 2%
Enrolled in postsecondary program 1%
Graduated high school, but is not currently in school 2%
Currently enrolled in middle school or high school 94%
n 22% Twelfthn 31% eleventhn 29% Tenthn 16% Ninthn 2% eighth
0% Seventh
gRAdE LEvEL OF YOuTHWORkS PARTICIPANTS (MiSSing data 0%)
twelevth
eleventh
tenth
nineth
eigth
seventh
n 17% 19 to 21 yearsn 65% 16 to 18 yearsn 18% 14 to 15 years
Private 4%
Public 8%
Non-profit 88%
PLACEMENT BY JOB SECTOR FOR YOuTHWORkS PARTICIPANTS (MiSSing data 1%)
n 2% Privaten 20% Publicn 78% Non-profit
AgE OF YOuTHWORkS PARTICIPANTS (MiSSing data 4%)
19 to 21 years 11%
16 to 18 years 76%
14 to 15 years 12%
CATEgORY OF JOB PLACEMENT FOR YOuTHWORkS PARTICIPANTS (MiSSing data 0%)
Arts & Communications
Business
Child Care Camp Counselor
Construction & Design
Education
Environment, Natural Resources
Health care
Hospitality, Tourism, & rec
Human Services
Manufacturing, STEM
IT
law, got&public service
maintence&landscaping
marine industries
retail&services
transportation
other
n 11% other 0% Transportation 0% Retail & Services 0% Marine industries
n 10% Maintenance & Landscapingn 3% Law, Govt. & Public Service
0% iT 0% Manufacturing, STeM
n 16% Human Services
n 2% Hospitality, Tourism & Rec.n 4% Health Caren 5% environment, Natural
Resourcesn 13% educationn 1% Construction & designn 30% Child Care Camp Counselorn 1% Business
0% Arts & Communication
eTHNiCiTY CoMPARiSoN FoR YouTHWoRkS PARTiCiPANTS
0%
10%
20%
30%
40%
50%
60% Students in Boston Public Schools
Participants in YouthWorks
Alll OtherAsianWhiteHispanic African-American
Ethnicity Comparison for YouthWorks Participants

Commonwealth Corporation Executive Office of Labor and Workforce Development20
Brockton—YouthWorks 2010 Program Profile SAMPLe eMPLoYeRS
200 Yogs Tobaco Inc.
Apolos Imports Exports, Inc.
B D Mart
Sign Design, Inc.
Silkscreen Team Keith Bldg.
B.N. Yanow & Co., Inc.
Baker Elementary School
BAMSI
Baypointe Rehab & Skilled Center
Boys & Girls Club of Brockton; Warren Avenue Clubhouse
Brockton After Dark
Teri College Planning
TJ Maxx
Universal Food Market
Youth Build
Commonwealth Corporation Executive Office of Labor and Workforce Development 21
Brockton—YouthWorks 2010 Program Profile NuMBeR oF YouTH SeRVed BY YouTHWoRkS iN 2010
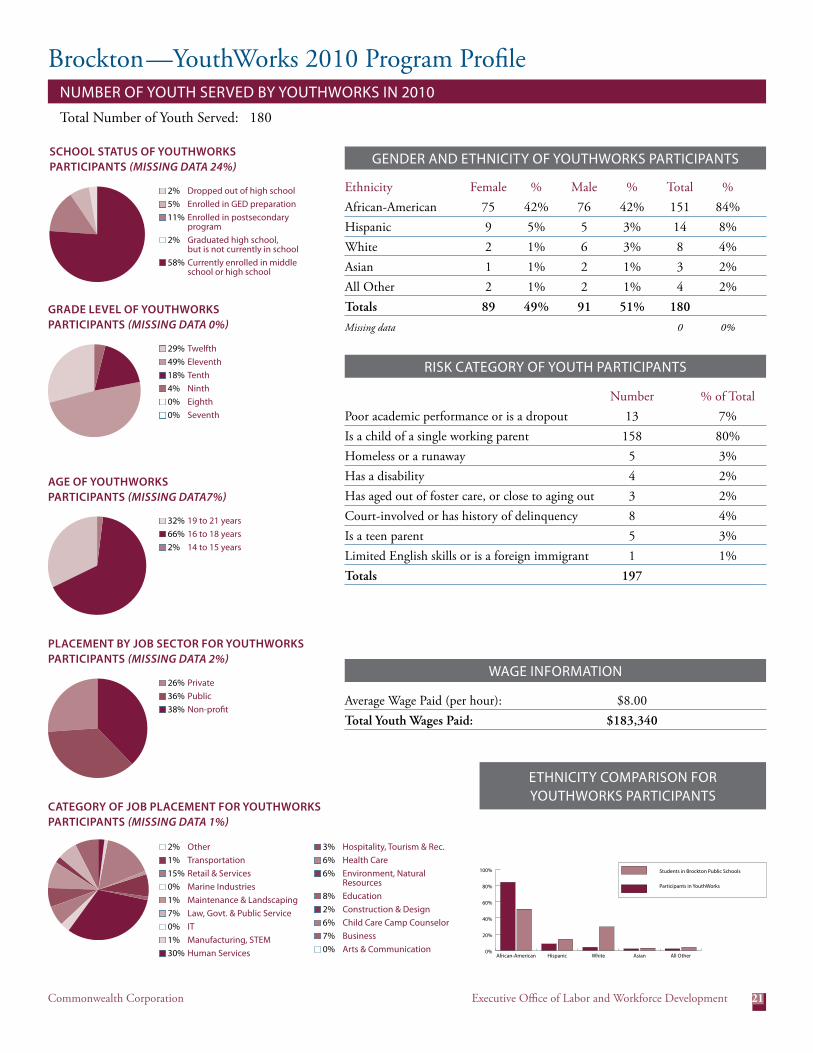
Total Number of Youth Served: 180
GeNdeR ANd eTHNiCiTY oF YouTHWoRkS PARTiCiPANTS
Ethnicity Female % Male % Total %African-American 75 42% 76 42% 151 84%Hispanic 9 5% 5 3% 14 8%White 2 1% 6 3% 8 4%Asian 1 1% 2 1% 3 2%All Other 2 1% 2 1% 4 2%Totals 89 49% 91 51% 180
Missing data 0 0%
RiSk CATeGoRY oF YouTH PARTiCiPANTS
Number % of TotalPoor academic performance or is a dropout 13 7%Is a child of a single working parent 158 80%Homeless or a runaway 5 3%Has a disability 4 2%Has aged out of foster care, or close to aging out 3 2%Court-involved or has history of delinquency 8 4%Is a teen parent 5 3%Limited English skills or is a foreign immigrant 1 1%Totals 197
WAGe iNFoRMATioN
Average Wage Paid (per hour): $8.00Total Youth Wages Paid: $183,340
SCHOOL STATuS OF YOuTHWORkS PARTICIPANTS (MiSSing data 24%)
Dropped out of high school 0%
Enrolled in GED preparation 0%
Enrolled in postsecondary program 12%
Graduated high school, but is not currently in school 0%
Currently enrolled in middle school or high school 88%
n 32% 19 to 21 yearsn 66% 16 to 18 yearsn 2% 14 to 15 years
Private 6%
Public 62%
Non-profit 33%
PLACEMENT BY JOB SECTOR FOR YOuTHWORkS PARTICIPANTS (MiSSing data 2%)
n 26% Privaten 36% Publicn 38% Non-profit
AgE OF YOuTHWORkS PARTICIPANTS (MiSSing data7%)
19 to 21 years 26%
16 to 18 years 68%
14 to 15 years 10%
CATEgORY OF JOB PLACEMENT FOR YOuTHWORkS PARTICIPANTS (MiSSing data 1%)
n 29% Twelfthn 49% eleventhn 18% Tenthn 4% Ninthn 0% eighthn 0% Seventh
gRAdE LEvEL OF YOuTHWORkS PARTICIPANTS (MiSSing data 0%)
twelevth
eleventh
tenth
nineth
eigth
seventh
n 2% dropped out of high schooln 5% enrolled in Ged preparationn 11% enrolled in postsecondary
program 2% Graduated high school,
but is not currently in schooln 58% Currently enrolled in middle
school or high school
2% othern 1% Transportationn 15% Retail & Services
0% Marine industriesn 1% Maintenance & Landscapingn 7% Law, Govt. & Public Service
0% iTn 1% Manufacturing, STeMn 30% Human Services
n 3% Hospitality, Tourism & Rec.n 6% Health Caren 6% environment, Natural
Resourcesn 8% educationn 2% Construction & designn 6% Child Care Camp Counselorn 7% Business
0% Arts & Communication
eTHNiCiTY CoMPARiSoN FoR YouTHWoRkS PARTiCiPANTS
0%
20%
40%
60%
80%
100% Students in Brockton Public Schools
Participants in YouthWorks
All OtherAsianWhiteHispanicAfrican-American
Ethnicity Comparison for YouthWorks Participants

Commonwealth Corporation Executive Office of Labor and Workforce Development22
Cambridge/Chelsea/Malden—YouthWorks 2010 Program Profile SAMPLe eMPLoYeRS
All Star Sandwich Bar
Animal Control Board Of Health
Area IV Sports Camp
BestFriendsDayCare
Blade Master
Boston Mobilization
B-Safe Camp St.Luke’s Church
Cambridge Community Center
Cambridge Economic Opportunity Co.
Cambridge Innovation Center
Cambridge Office of Workforce Development
Cambridgeport Summer Experience
CAPIC-CAMP
CAPIC-DayCare
CC Real Investments
Centro Latino
Chelsea Collaborative
Chelsea District Court
Chelsea High Summer School
Chelsea Police Dept.
ChelseaCityHall
ChelseaPublic-Technology
Choice Thru Education
City Links
Clayman & Dodge, LLC
CORNU
CPS-Custodian’sOffice
Department of Public Works
Dog Day Care
EastBostonSocial-CentralAve.
ECO
Educational Access CEA
Fitzgerald Summer Camp
Friends of Alewife Reservation
Frisoli Youth Center
Graham and Parks School
Green Jobs Program
Improv Boston
Independent Day Care
International Child Care
Jackson Manning Apartments-CHA
James Norton
JordanBoys&GirlsClub
Just-A-Start
Kennedy-Longfellow School
King Open Summer Learning Camp
King Preschool
Law Office-StevenD.Gopin
Leader Bank
Lesley University
Madelyn Garcia Real Estates
Malden High School
Malden Sr. Center
Manning Apartment
Mass DOT
Mount Auburn Hospital
Muslims for Humanity
Mystic Valley Elder Service
Mystic Valley Elder Services
New England Aquarium
O’Malley Park
Partnership for Community Schools
Pixability
Playful Paws
REACH Program
ROCA
S&S Deli
Senior Center
Strawberry Hill Camp
Summer Discovery
Sun Splash
TAGS Hardware
Terrascope Youth Radio
Tobin Kids Camp
Tri Cap Watershed project
Tri-Cap Headstart
Tri-Cap Watershed project
Upward Bound
Valente Branch Library
YMCA
YWCA

Commonwealth Corporation Executive Office of Labor and Workforce Development 23
Cambridge/Chelsea/Malden—YouthWorks 2010 Program Profile NuMBeR oF YouTH SeRVed BY YouTHWoRkS iN 2010
Total Number of Youth Served: 330
GeNdeR ANd eTHNiCiTY oF YouTHWoRkS PARTiCiPANTS
Ethnicity Female % Male % Total %African-American 47 15% 47 15% 94 29%Hispanic 58 18% 83 26% 141 44%White 30 9% 33 10% 63 20%Asian 10 3% 9 3% 19 6%All Other 1 0% 3 1% 4 1%Totals 146 45% 175 55% 321
Missing data 3 6 3%
RiSk CATeGoRY oF YouTH PARTiCiPANTS
Number % of TotalPoor academic performance or is a dropout 8 3%Is a child of a single working parent 110 45%Homeless or a runaway 2 1%Has a disability 27 11%Has aged out of foster care, or close to aging out 2 1%Court-involved or has history of delinquency 13 5%Is a teen parent 16 7%Limited English skills or is a foreign immigrant 64 26%Totals 242
Missing data 88 27% Note: Risk Category was not reported for all participants.
WAGe iNFoRMATioN
Average Wage Paid (per hour): $8.00Total Youth Wages Paid: $283,852
SCHOOL STATuS OF YOuTHWORkS PARTICIPANTS (MiSSing data 12%)
Dropped out of high school 1%
Enrolled in GED preparation 1%
Enrolled in postsecondary program 7%
Graduated high school, but is not currently in school 0%
Currently enrolled in middle school or high school 79
n 13% Twelfthn 23% eleventhn 13% Tenthn 24% Ninthn 25% eighthn 2% Seventh
gRAdE LEvEL OF YOuTHWORkS PARTICIPANTS (MiSSing data 0%)
Twelfth 12%
Eleventh 21%
Tenth 27%
Ninth 24%
Eighth 14%
Seventh 1%
n 13% 19 to 21 yearsn 57% 16 to 18 yearsn 30% 14 to 15 years
Private 9%
Public 36%
Non-profit 55%
PLACEMENT BY JOB SECTOR FOR YOuTHWORkS PARTICIPANTS (MiSSing data 4%)
n 31% Privaten 50% Publicn 30% Non-profit
AgE OF YOuTHWORkS PARTICIPANTS (MiSSing data 6%)
19 to 21 years 17%
16 to 18 years 56%
14 to 15 years 26%
CATEgORY OF JOB PLACEMENT FOR YOuTHWORkS PARTICIPANTS (MiSSing data 53%)
Arts & Communications
Business
Child Care Camp Counselor
Construction & Design
Education
Environment, Natural Resources
Health care
Hospitality, Tourism, & rec
Human Services
Manufacturing, STEM
IT
law, got&public service
maintence&landscaping
marine industries
retail&services
transportation
other
n .05% other 0% Transportation
n 4% Retail & Services 0% Marine industries
n 21% Maintenance & Landscapingn 1% Law, Govt. & Public Servicen 1% iT
0% Manufacturing, STeMn 8% Human Services
n 1% Hospitality, Tourism & Rec.n 1% Health Caren 3% environment, Natural
Resourcesn 17% educationn 3% Construction & designn 27% Child Care Camp Counselorn 7% Business
0% Arts & Communication
eTHNiCiTY CoMPARiSoN FoR YouTHWoRkS PARTiCiPANTS
0%
10%
20%
30%
40%
50% Students in Cambridge, Chelsea, and Malden Public Schools
Participants in YouthWorks
All OtherAsianWhiteHispanicAfrican-American
Ethnicity Comparison for YouthWorks Participants
n 1% dropped out of high schooln 1% enrolled in Ged preparationn 7% enrolled in postsecondary
program 0% Graduated high school,
but is not currently in schooln 79% Currently enrolled in middle
school or high school

Commonwealth Corporation Executive Office of Labor and Workforce Development24
Fall River/Taunton—YouthWorks 2010 Program Profile SAMPLe eMPLoYeRS
Battleship Cove
BMC Durfee High School
Boys & Girls Club
CD REC
Deaconness / CFC
Deaconness Community Development
Deaconness/ Charleton Hospital
Deaconness/ People Inc.
Commonwealth Corporation Executive Office of Labor and Workforce Development 25
Fall River/Taunton—YouthWorks 2010 Program Profile NuMBeR oF YouTH SeRVed BY YouTHWoRkS iN 2010
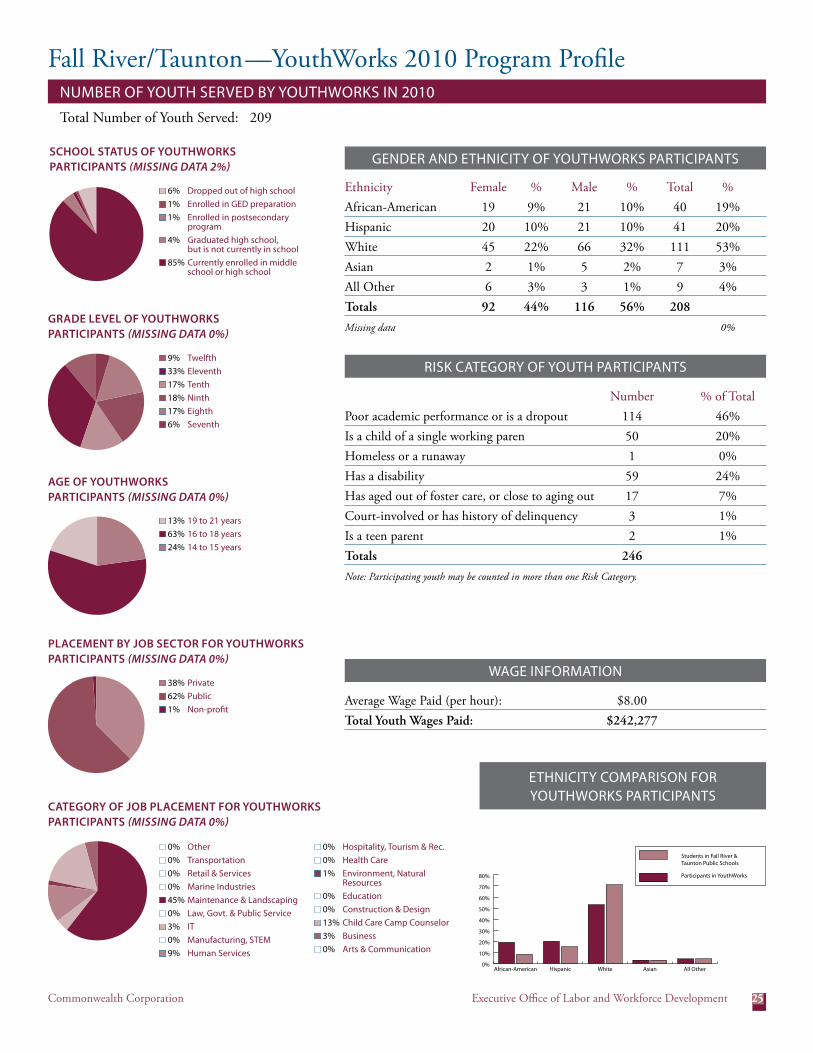
Total Number of Youth Served: 209
GeNdeR ANd eTHNiCiTY oF YouTHWoRkS PARTiCiPANTS
Ethnicity Female % Male % Total %African-American 19 9% 21 10% 40 19%Hispanic 20 10% 21 10% 41 20%White 45 22% 66 32% 111 53%Asian 2 1% 5 2% 7 3%All Other 6 3% 3 1% 9 4%Totals 92 44% 116 56% 208
Missing data 0%
RiSk CATeGoRY oF YouTH PARTiCiPANTS
Number % of TotalPoor academic performance or is a dropout 114 46%Is a child of a single working paren 50 20%Homeless or a runaway 1 0%Has a disability 59 24%Has aged out of foster care, or close to aging out 17 7%Court-involved or has history of delinquency 3 1%Is a teen parent 2 1%Totals 246
Note: Participating youth may be counted in more than one Risk Category.
WAGe iNFoRMATioN
Average Wage Paid (per hour): $8.00Total Youth Wages Paid: $242,277
n 6% dropped out of high schooln 1% enrolled in Ged preparationn 1% enrolled in postsecondary
programn 4% Graduated high school,
but is not currently in schooln 85% Currently enrolled in middle
school or high school
SCHOOL STATuS OF YOuTHWORkS PARTICIPANTS (MiSSing data 2%)
Dropped out of high school 3%
Enrolled in GED preparation 2%
Enrolled in postsecondary program 0%
Graduated high school, but is not currently in school 1%
Currently enrolled in middle school or high school 93%
n 9% Twelfthn 33% eleventhn 17% Tenthn 18% Ninthn 17% eighthn 6% Seventh
gRAdE LEvEL OF YOuTHWORkS PARTICIPANTS (MiSSing data 0%)
Twelfth 9%
Eleventh 33%
Tenth 17%
Ninth 18%
Eighth 17%
Seventh 6%
n 13% 19 to 21 yearsn 63% 16 to 18 yearsn 24% 14 to 15 years
Private 20%
Public 80%
Non-profit 0%
PLACEMENT BY JOB SECTOR FOR YOuTHWORkS PARTICIPANTS (MiSSing data 0%)
n 38% Privaten 62% Publicn 1% Non-profit
AgE OF YOuTHWORkS PARTICIPANTS (MiSSing data 0%)
19 to 21 years 13%
16 to 18 years 63%
14 to 15 years 24%
CATEgORY OF JOB PLACEMENT FOR YOuTHWORkS PARTICIPANTS (MiSSing data 0%)
arts&communication
business
child care camp counselor
construction&design
education
environment
healthcare
hospitality
human service
manufacturing
it
law, govt, public service
maintenance&landscaping
marine industry
retail&service
transportation
other
0% other 0% Transportation 0% Retail & Services 0% Marine industries
n 45% Maintenance & Landscaping 0% Law, Govt. & Public Service
n 3% iT 0% Manufacturing, STeM
n 9% Human Services
0% Hospitality, Tourism & Rec. 0% Health Care
n 1% environment, Natural Resources
0% education 0% Construction & design
n 13% Child Care Camp Counselorn 3% Business
0% Arts & Communication
eTHNiCiTY CoMPARiSoN FoR YouTHWoRkS PARTiCiPANTS
0%
10%
20%
30%
40%
50%
60%
70%
80%
Students in Fall River &Taunton Public Schools
Participants in YouthWorks
All OtherAsianWhiteHispanicAfrican-American
Ethnicity Comparison for YouthWorks Participants

Commonwealth Corporation Executive Office of Labor and Workforce Development26
Fitchburg/Gardner/Leominster—YouthWorks 2010 Program Profile SAMPLe eMPLoYeRS
Boys & Girls Club of NCMA
Exxon
FATV
Health Alliance Hospital
House of Peace & Education, Inc.
Kid Stop
Leominster Recreation Department
LUK Inc.
Lunenburg Exxon
MOC
MOC / Elderly Nutrition
MOC / Food Pantry
MOC / Spanish American Center
MOC Childcare & Headstart
Moduform
Mount Wachusett Community College
MWCC
San Juan Cleaning Services
Spanish American Center
YMCA

Commonwealth Corporation Executive Office of Labor and Workforce Development 27
Fitchburg/Gardner/Leominster—YouthWorks 2010 Program Profile NuMBeR oF YouTH SeRVed BY YouTHWoRkS iN 2010
Total Number of Youth Served: 95
GeNdeR ANd eTHNiCiTY oF YouTHWoRkS PARTiCiPANTS
Ethnicity Female % Male % Total %African-American 10 11% 9 9% 19 20%Hispanic 24 25% 21 22% 45 47%White 11 12% 10 11% 21 22%Asian 3 3% 1 1% 4 4%All Other 1 1% 5 5% 6 6%Totals 49 52% 46 48% 95
Missing data 0%
RiSk CATeGoRY oF YouTH PARTiCiPANTS
Number % of TotalPoor academic performance or is a dropout 12 11%Is a child of a single working parent 60 54%Homeless or a runaway 5 4%Has a disability 16 14%Has aged out of foster care, or close to aging out 3 3%Court-involved or has history of delinquency 5 4%Is a teen parent 2 2%Limited English skills or is a foreign immigrant 9 8%Totals 112
Note: Participating youth may be counted in more than one Risk Category.
WAGe iNFoRMATioN
Average Wage Paid (per hour): $8.00Total Youth Wages Paid: $142,975
n 1% dropped out of high schooln 1% enrolled in Ged preparationn 7% enrolled in postsecondary
program 0% Graduated high school,
but is not currently in schooln 85% Currently enrolled in middle
school or high school
SCHOOL STATuS OF YOuTHWORkS PARTICIPANTS (MiSSing data 5%)
Dropped out of high school 1%
Enrolled in GED preparation 0%
Enrolled in postsecondary program 4%
Graduated high school, but is not currently in school 14%
Currently enrolled in middle school or high school 81%
n 5% Twelfthn 32% eleventhn 32% Tenthn 10% Ninthn 19% eighthn 2% Seventh
gRAdE LEvEL OF YOuTHWORkS PARTICIPANTS (MiSSing data 0%)
Twelfth 9%
Eleventh 21%
Tenth 25%
Ninth 38%
Eighth 6%
Seventh 1%
n 23% 19 to 21 yearsn 65% 16 to 18 yearsn 23% 14 to 15 years
Private 9%
Public 53%
Non-profit 38%
PLACEMENT BY JOB SECTOR FOR YOuTHWORkS PARTICIPANTS (MiSSing data 0%)
n 12% Privaten 71% Publicn 18% Non-profit
AgE OF YOuTHWORkS PARTICIPANTS (MiSSing data 0%)
19 to 21 years 18%
16 to 18 years 57%
14 to 15 years 24%
CATEgORY OF JOB PLACEMENT FOR YOuTHWORkS PARTICIPANTS (MiSSing data 4%)
arts&communication
business
child care camp counselor
construction&design
education
environment
healthcare
hospitality
human service
manufacturing
it
law, govt, public service
maintenance&landscaping
marine industry
retail&service
transportation
other
n .03% other 0% Transportation 0% Retail & Services 0% Marine industries 0% Maintenance & Landscaping 0% Law, Govt. & Public Service 0% iT
n 2% Manufacturing, STeMn 20% Human Services
0% Hospitality, Tourism & Rec.n 3% Health Care
0% environment, Natural Resources
n 59% education 0% Construction & design
n 9% Child Care Camp Counselorn 3% Business
0% Arts & Communication
eTHNiCiTY CoMPARiSoN FoR YouTHWoRkS PARTiCiPANTS
0%
10%
20%
30%
40%
50%
60%
70%
80% Students in Fitchburg, Gardner &Leominster Public School
Participants in YouthWorks
All OtherAsianWhiteHispanicAfrican-American
Ethnicity Comparison for YouthWorks Participants

Commonwealth Corporation Executive Office of Labor and Workforce Development28
Framingham—YouthWorks 2010 Program Profile SAMPLe eMPLoYeRS
Wayside Campus
Advocates
Park & Recreation
Town of Framingham Library
Computer Lab
Kathleen Danial Nursing Home
Town Hall
Boys & Girls Club
Town of Framingham Building Operations
Commonwealth Corporation Executive Office of Labor and Workforce Development 29
Framingham—YouthWorks 2010 Program Profile NuMBeR oF YouTH SeRVed BY YouTHWoRkS iN 2010
Total Number of Youth Served: 24
GeNdeR ANd eTHNiCiTY oF YouTHWoRkS PARTiCiPANTS
Ethnicity Female % Male % Total %African-American 3 13% 1 4% 4 17%Hispanic 4 17% 4 17% 8 33%White 3 13% 8 33% 11 46%Asian 1 4% 0 0 1 4%All Other 0 0% 0 54% 0 0%Totals 11 46% 13 0 24
Missing data 0 0%
RiSk CATeGoRY oF YouTH PARTiCiPANTS
Number % of TotalPoor academic performance or is a dropout 10 24%Is a child of a single working parent 16 38%Homeless or a runaway 1 2%Has a disability 5 12%Has aged out of foster care, or close to aging out 3 7%Court-involved or has history of delinquency 7 17%Is a teen parent 0 0%Limited English skills or is a foreign immigrant 0 0%Totals 42
Note: Participating youth may be counted in more than one Risk Category.
WAGe iNFoRMATioN
Average Wage Paid (per hour): $8.00Total Youth Wages Paid: $26,182
0% dropped out of high school 0% enrolled in Ged preparation
n 13% enrolled in postsecondary program
n 58% Graduated high school, but is not currently in school
n 29% Currently enrolled in middle school or high school
SCHOOL STATuS OF YOuTHWORkS PARTICIPANTS (MiSSing data 0%)
Dropped out of high school 8%
Enrolled in GED preparation 0%
Enrolled in postsecondary program 10%
Graduated high school, but is not currently in school 23%
Currently enrolled in middle school or high school 59%
n 26% Twelfthn 30% eleventhn 43% Tenth
0% Ninth 0% eighth 0% Seventh
gRAdE LEvEL OF YOuTHWORkS PARTICIPANTS (MiSSing data 0%)
Twelfth 26%
Eleventh 30%
Tenth 43%
Ninth 0%
Eighth 0%
Seventh 0%
n 52% 19 to 21 yearsn 48% 16 to 18 years
23% 14 to 15 years
Private 23%
Public 13%
Non-profit 64%
PLACEMENT BY JOB SECTOR FOR YOuTHWORkS PARTICIPANTS (MiSSing data 0%)
n 8% Privaten 4% Publicn 88% Non-profit
AgE OF YOuTHWORkS PARTICIPANTS (MiSSing data 13%)
19 to 21 years 39%
16 to 18 years 61%
14 to 15 years 0%
CATEgORY OF JOB PLACEMENT FOR YOuTHWORkS PARTICIPANTS (MiSSing data 0%)
arts&communication
business
child care camp counselor
construction&design
education
environment
healthcare
hospitality
human service
manufacturing
ot
law, govt, public service
maintenance&landscaping
marine industry
retail&service
transportation
other
0% other 0% Transportation
n 9% Retail & Services 0% Marine industries
n 35% Maintenance & Landscaping 0% Law, Govt. & Public Service 0% iT 0% Manufacturing, STeM
n 22% Human Services
n 4% Hospitality, Tourism & Rec. 0% Health Care 0% environment, Natural
Resources 0% education
n 4% Construction & designn 26% Child Care Camp Counselor
0% Business 0% Arts & Communication
eTHNiCiTY CoMPARiSoN FoR YouTHWoRkS PARTiCiPANTS
0%
10%
20%
30%
40%
50%
60%
70%
80% Students in FraminghamPublic Schools
Participants in YouthWorks
All OtherAsianWhiteHispanicAfrican-American
Ethnicity Comparison for YouthWorks Participants

Commonwealth Corporation Executive Office of Labor and Workforce Development30
Lawrence/Haverhill—YouthWorks 2010 Program Profile SAMPLe eMPLoYeRS
AB Consentio School
Methuen Arlington Neighborhood
Methuen Housing Authority
Apple Wiper
Moody School
Assessor’s Office
Bellevue Cemetary
Boys & Girls Club
MVCSC
Napa
Neighbors in Need
New Balance Athletic
Penacook Place
Presidential Gardens
RB Kimball Insurance
Riverside Park
Catholic Charaties
Rumbo
Ruth’s House
Sal’s Pizza
City Comptroller
City Hall (DPW)
Salvatore’s
Silvermane
Srybny Farms
City Hall Personal Dept
City of Hall Elections
City of Haverhill Water Dept
Communites Together
Community Action
Community Day Care
St Mary’s Cemetary
Community Group
St Vincent DePaul
Elections Division
Electronics Division
Emmaus
Encore Staffing
The ARC of GHN
The Community Group
Essex Art Center
Food for the World
Frame My TV
The Little Deli
GLCAC
GLTS
Green Vision
Water Dept
Greated Lawrence Technical High School
Hadley West Apartments
Haverhill Boys & Girls Club
WIC Community Action
Haverhill High School
Haverhill Highway Park Dept
YWCA-Lawrence
Haverhill Wastewater Treatment
Heritage Place
Highway Dept
Kazmiera Marina
Lambert Roofing
Lawrence City Hall -Elections
Lawrence Department of Public Works
Lawrence Recreation Dept
Lawrence Water Dept
Leo & Sons Auto
Lawrence High School
Lawrence High School Cell Phone Project
Little Deli
Little Sprouts
Methuen Arlington Center
Abe Bashara Boathouse
Building Commission
Cardinal Shoe
City Attorney
City Clerk Office
Merrimack Valley Chamber of Commerce

Commonwealth Corporation Executive Office of Labor and Workforce Development 31
Lawrence/Haverhill—YouthWorks 2010 Program Profile NuMBeR oF YouTH SeRVed BY YouTHWoRkS iN 2010
Total Number of Youth Served: 238
GeNdeR ANd eTHNiCiTY oF YouTHWoRkS PARTiCiPANTS
Ethnicity Female % Male % Total %African-American 1 0% 4 2% 5 2%Hispanic 98 42% 85 36% 183 78%White 15 6% 26 11% 41 17%Asian 2 1% 3 1% 5 2%All Other 1 0% 1 0% 2 1%Totals 117 50% 119 50% 236
Missing data 2 2% 2 2%
RiSk CATeGoRY oF YouTH PARTiCiPANTS
Number % of TotalPoor academic performance or is a dropout 71 19%Is a child of a single working parent 1 46 39%Homeless or a runaway 6 2%Has a disability 73 20%Has aged out of foster care, or close to aging out 7 2%Court-involved or has history of delinquency 19 5%Is a teen parent 20 5%Limited English skills or is a foreign immigrant 31 8%Totals 373 Note: Participating youth may be counted in more than one Risk Category.
WAGe iNFoRMATioN
Average Wage Paid (per hour): $8.00Total Youth Wages Paid: $279,212
n 2% dropped out of high school 0% enrolled in Ged preparation
n 4% enrolled in postsecondary program
n 10% Graduated high school, but is not currently in school
n 82% Currently enrolled in middle school or high school
SCHOOL STATuS OF YOuTHWORkS PARTICIPANTS (MiSSing data 2%)
Dropped out of high school 1%
Enrolled in GED preparation 0%
Enrolled in postsecondary program 2%
Graduated high school, but is not currently in school 3%
Currently enrolled in middle school or high school 94%
n 23% Twelfthn 24% eleventhn 26% Tenthn 18% Ninethn 8% eighthn 2% Seventh
gRAdE LEvEL OF YOuTHWORkS PARTICIPANTS (MiSSing data 0%)
Twelfth 17%
Eleventh 23%
Tenth 30%
Ninth 24%
Eighth 4%
Seventh 1%
n 18% 19 to 21 yearsn 64% 16 to 18 yearsn 18% 14 to 15 years
Private 11%
Public 40%
Non-profit 10%
PLACEMENT BY JOB SECTOR FOR YOuTHWORkS PARTICIPANTS (MiSSing data 0%)
n 22% Privaten 44% Publicn 34% Non-profit
AgE OF YOuTHWORkS PARTICIPANTS (MiSSing data 2%)
19 to 21 years 15%
14 to 15 years%
16 to 18 years 15%
CATEgORY OF JOB PLACEMENT FOR YOuTHWORkS PARTICIPANTS (MiSSing data 2%)
Arts & Communications
Business
Child Care Camp Counselor
Construction & Design
Education
Environment, Natural Resources
Health care
Hospitality, Tourism, & rec
Human Services
Manufacturing, STEM
IT
law, got&public service
maintence&landscaping
marine industries
retail&services
transportation
other
n 2% other 0% Transportation
n 7% Retail & Services 0% Marine industries
n 37% Maintenance & Landscaping 0% Law, Govt. & Public Service 0% iT
n 2% Manufacturing, STeM 0% Human Services
0% Hospitality, Tourism & Rec.n 1% Health Care
0% environment, Natural Resources
n 2% education 0% Construction & design
n 27% Child Care Camp Counselorn 22% Business
0% Arts & Communication
eTHNiCiTY CoMPARiSoN FoR YouTHWoRkS PARTiCiPANTS
0%
10%
20%
30%
40%
50%
60%
70%
80% Students in Haverhill &Lawrence Public Schools
Participants in YouthWorks
All OtherAsianWhiteHispanicAfrican-American
Ethnicity Comparison for YouthWorks Participants
Commonwealth Corporation Executive Office of Labor and Workforce Development32
City of Lowell—YouthWorks 2010 Program Profile SAMPLe eMPLoYeRS
Acre Family Childcare
Westford Academy
YWCA of Lowell
Caleb Foundation
Career Center of Lowell
Chelmsford Elder Services
City of Lowell Health Department
Christ Jubilee Programs
City of Lowell Recycling
Community Teamwork
Community Teamwork Inc
Dracut Access TV
Dracut Vet Memorial Park
Edison Cemetary
Employment Placement
Greater Lowell Technical High School
Home Away from Home
International Institute
Light of Cambodian Children’s Camp
Little Sprouts
Lowell Adult Education Center
Lowell City Hall
Lowell City Parks Department
Lowell Community Health Center
Lowell Housing Authority
Lowell Humane Society
Lowell National Historic Park
Lowell National Historical Parks
Lowell Senior Center
Lowell Telecommunicatoins
Mass Rehab Commission
Merrimack Valley Food Bank
Middlesex Community College
Middlesex Registry of Deeds
Missionary Sisters
New England Quilt Museum
National Senior Network
New North Canal Apartments
Saint Anne’s Episcopal Church
St. John The Evangelist Parish
St. Patrick’s Parish
Town of Chelmsford
Town of Tewksbury
Tyngsboro Housing AUthority
Tyngsboro Public School
United Teen Equality Center (UTEC)
West End Gym
Boys & Girls Club of Lowell
Children and Family Services
City of Lowell
City of Lowell Parks Department

Commonwealth Corporation Executive Office of Labor and Workforce Development 33
City of Lowell—YouthWorks 2010 Program Profile NuMBeR oF YouTH SeRVed BY YouTHWoRkS iN 2010
Total Number of Youth Served: 259
GeNdeR ANd eTHNiCiTY oF YouTHWoRkS PARTiCiPANTS
Ethnicity Female % Male % Total %African-American 19 7% 14 5% 33 13%Hispanic 63 24% 76 29% 139 54%White 27 10% 20 8% 47 18%Asian 12 5% 21 8% 33 13%All Other 4 2% 2 1% 6 2%Totals 125 48% 133 52% 258
Missing data 18 12%
RiSk CATeGoRY oF YouTH PARTiCiPANTS
Number % of TotalPoor academic performance or is a dropout 26 10%Is a child of a single working parent 171 63%Homeless or a runaway 0 0%Has a disability 41 15%Has aged out of foster care, or close to aging out 5 2%Court-involved or has history of delinquency 3 1%Is a teen parent 7 3%Limited English skills or is a foreign immigrant 19 7%Totals 272
Note: Participating youth may be counted in more than one Risk Category.
WAGe iNFoRMATioN
Average Wage Paid (per hour): $8.00Total Youth Wages Paid: $255,262
n 2% dropped out of high school 0% enrolled in Ged preparation
n 2% enrolled in postsecondary program
n 6% Graduated high school, but is not currently in school
n 90% Currently enrolled in middle school or high school
SCHOOL STATuS OF YOuTHWORkS PARTICIPANTS (MiSSing data 0%)
Dropped out of high school 1%
Enrolled in GED preparation 0%
Enrolled in postsecondary program 6%
Graduated high school, but is not currently in school 2%
Currently enrolled in middle school or high school 90%
n 13% Twelfthn 28% eleventhn 28% Tenthn 23% Ninethn 7% eighthn 1% Seventh
gRAdE LEvEL OF YOuTHWORkS PARTICIPANTS (MiSSing data 0%)
Twelfth 13%
Eleventh 28%
Tenth 28%
Ninth 23%
Eighth 7%
Seventh 1%
n 11% 19 to 21 yearsn 60% 16 to 18 yearsn 30% 14 to 15 years
Private 6%
Public 42%
Non-profit 52%
PLACEMENT BY JOB SECTOR FOR YOuTHWORkS PARTICIPANTS (MiSSing data 1%)
n 1% Privaten 59% Publicn 40% Non-profit
AgE OF YOuTHWORkS PARTICIPANTS (MiSSing data 2%)
19 to 21 years 17%
16-18 years 66%
14 to 15 years 16%
CATEgORY OF JOB PLACEMENT FOR YOuTHWORkS PARTICIPANTS (MiSSing data 1%)
arts&communication
business
child care camp counselor
construction&design
education
environment
healthcare
hospitality
human service
manufacturing
it
law, govt, public service
maintenance&landscaping
marine industry
retail&service
transportation
other
n 5% othern 8% Transportation
0% Retail & Services 0% Marine industries
n 36% Maintenance & Landscapingn 2% Law, Govt. & Public Servicen 1% iT
0% Manufacturing, STeMn 6% Human Services
n 2% Hospitality, Tourism & Rec.n 1% Health Caren 4% environment, Natural
Resourcesn 3% education
0% Construction & designn 20% Child Care Camp Counselorn 7% Businessn 5% Arts & Communication
eTHNiCiTY CoMPARiSoN FoR YouTHWoRkS PARTiCiPANTS
0%
10%
20%
30%
40%
50%
60% Students in Lowell Public Schools
Participants in YouthWorks
All OtherAsianWhiteHispanicAfrican-American
Ethnicity Comparison for YouthWorks Participants

Commonwealth Corporation Executive Office of Labor and Workforce Development34
Lynn/Salem—YouthWorks 2010 Program Profile SAMPLe eMPLoYeRS
Boys & Girls Club of Lynn
Boys & Girls Club of Greater Salem
Bridgewell
CAEP
City Of Lynn
City of Salem
City of Salem School Department
Greater Lynn YMCA
HAWC
La Vida
Lynn Economic Opportunity
Lynn Housing Authority
Salem Cyberspace
Salem Harbor CDC
Salem Maritime
Salem YMCA

Commonwealth Corporation Executive Office of Labor and Workforce Development 35
Lynn/Salem—YouthWorks 2010 Program Profile NuMBeR oF YouTH SeRVed BY YouTHWoRkS iN 2010
Total Number of Youth Served: 180
GeNdeR ANd eTHNiCiTY oF YouTHWoRkS PARTiCiPANTS
Ethnicity Female % Male % Total %African-American 7 4% 25 14% 32 18%Hispanic 27 15% 50 28% 77 44%White 9 5% 35 20% 44 25%Asian 5 3% 6 3% 11 6%All Other 5 3% 7 4% 12 7%Totals 53 30% 123 70% 176
Missing data 4 2%
RiSk CATeGoRY oF YouTH PARTiCiPANTS
Number % of TotalPoor academic performance or is a dropout 54 23%Is a child of a single working parent 108 45%Homeless or a runaway 3 1%Has a disability 36 15%Has aged out of foster care, or close to aging out 3 1%Court-involved or has history of delinquency 3 1%Is a teen parent 1 0%Limited English skills or is a foreign immigrant 30 13%Totals 238
Note: Participating youth may be counted in more than one Risk Category.
WAGe iNFoRMATioN
Average Wage Paid (per hour): $8.00Total Youth Wages Paid: $201,664
n 4% dropped out of high schooln 4% enrolled in Ged preparationn 7% enrolled in postsecondary
program 0% Graduated high school,
but is not currently in schooln 83% Currently enrolled in middle
school or high school
SCHOOL STATuS OF YOuTHWORkS PARTICIPANTS (MiSSing data 0%)
Dropped out of high school 3%
0Enrolled in GED preparation 2%
Enrolled in postsecondary program 25%
Graduated high school, but is not currently in school 7%
Currently enrolled in middle school or high school 94%
n 9% Twelfthn 27% eleventhn 27% Tenthn 25% Ninthn 9% eighthn 3% Seventh
gRAdE LEvEL OF YOuTHWORkS PARTICIPANTS (MiSSing data 0%)
twelveth 51
eleventh 26
tenth 14
nineth 9
eigth 0
seventh 0
n 20% 19 to 21 yearsn 71% 16 to 18 yearsn 9% 14 to 15 years
Private 4%
Public 8%
Non-profit 88%
PLACEMENT BY JOB SECTOR FOR YOuTHWORkS PARTICIPANTS (MiSSing data 0%)
0% Privaten 59% Publicn 41% Non-profit
AgE OF YOuTHWORkS PARTICIPANTS (MiSSing data 5%)
19 to 21 years 28%
16 to 18 years 72%
14 to 15 years 1%
CATEgORY OF JOB PLACEMENT FOR YOuTHWORkS PARTICIPANTS (MiSSing data 9%)
arts&communication
business
child care camp counselor
construction&design
education
environment
healthcare
hospitality
human service
manufacturing
it
law, govt, public service
maintenance&landscaping
marine industry
retail&service
transportation
other
0%
10%
20%
30%
40%
50% Students in Lynn Public Schools
Participants in YouthWorks
All OtherAsianWhiteHispanicAfrican-American
Ethnicity Comparison for YouthWorks Participants
n 7% other 0% Transportation 0% Retail & Services 0% Marine industries
n 25% Maintenance & Landscapingn 41% Law, Govt. & Public Servicen 4% iT
0% Manufacturing, STeMn 6% Human Services
0% Hospitality, Tourism & Rec. 0% Health Care 0% environment, Natural
Resourcesn 12% educationn 1% Construction & designn 10% Child Care Camp Counselor
0% Business 0% Arts & Communication
eTHNiCiTY CoMPARiSoN FoR YouTHWoRkS PARTiCiPANTS

Commonwealth Corporation Executive Office of Labor and Workforce Development36
City of New Bedford—YouthWorks 2010 Program Profile SAMPLe eMPLoYeRS
Brick by Brick
Buttonwood Park Zoo
Camp Kennedy
Dennison Community Center
G.E.M.S.
Greater New Bedford Boys & Girls Club
Greater New Bedford Career Center
Lower Deck
NFTE
Ocean Explorium
Ocean Explorium Program
PAACA
Project Success
Stone by Stone
Table 8
TJ Maxx
Venillia Gardens
West End Day Care
Whaling City

Commonwealth Corporation Executive Office of Labor and Workforce Development 37
City of New Bedford—YouthWorks 2010 Program Profile NuMBeR oF YouTH SeRVed BY YouTHWoRkS iN 2010
Total Number of Youth Served: 160
GeNdeR ANd eTHNiCiTY oF YouTHWoRkS PARTiCiPANTS
Ethnicity Female % Male % Total %African-American 17 11% 11 7% 28 18%Hispanic 26 17% 34 22% 60 38%White 15 10% 22 14% 37 24%Asian 1 1% 1 1% 2 1%All Other 14 9% 16 10% 30 19%Totals 73 46% 84 54% 157
Missing data 3 3%
RiSk CATeGoRY oF YouTH PARTiCiPANTS
Number % of TotalPoor academic performance or is a dropout 64 27%Is a child of a single working parent 86 36%Homeless or a runaway 0 0%Has a disability 39 17%Has aged out of foster care, or close to aging out 10 4%Court-involved or has history of delinquency 15 6%Is a teen parent 3 1%Limited English skills or is a foreign immigrant 19 8%Totals 180
Note: Participating youth may be counted in more than one Risk Category.
WAGe iNFoRMATioN
Average Wage Paid (per hour): $8.00Total Youth Wages Paid: $214,527
SCHOOL STATuS OF YOuTHWORkS PARTICIPANTS (MiSSing data 5%)
Dropped out of high school 6%
0Enrolled in GED preparation 8%
Enrolled in postsecondary program 5%
HS Grad but not in post sec 5%
Enrolled in Middle or High 75%
n 20% Twelfthn 26% eleventhn 19% Tenthn 21% Ninthn 10% eighthn 4% Seventh
gRAdE LEvEL OF YOuTHWORkS PARTICIPANTS (MiSSing data 0%)
twelveth 15
eleventh 37
tenth 26
nineth 22
eigth 0
seventh 0
n 18% 19 to 21 yearsn 64% 16 to 18 yearsn 19% 14 to 15 years
Private 7%
Public 70%
Non-profit 23%
PLACEMENT BY JOB SECTOR FOR YOuTHWORkS PARTICIPANTS (MiSSing data 0%)
n 21% Privaten 4% Publicn 76% Non-profit
AgE OF YOuTHWORkS PARTICIPANTS (MiSSing data 6%)
19 to 21 years 18%
16 to 18 years 73%
14 to 15 years 9%
CATEgORY OF JOB PLACEMENT FOR YOuTHWORkS PARTICIPANTS (MiSSing data 8%)
Arts & Communications
Business
Child Care Camp Counselor
Construction & Design
Education
Environment, Natural Resources
Health care
Hospitality, Tourism, & rec
Human Services
Manufacturing, STEM
IT
law, got&public service
maintence&landscaping
marine industries
retail&services
transportation
other
n 3% dropped out of high schooln 3% enrolled in Ged preparationn 1% enrolled in postsecondary
program 0% Graduated high school,
but is not currently in schooln 88% Currently enrolled in middle
school or high school
n 9% other 0% Transportation
n 5% Retail & Servicesn 6% Marine industriesn 30% Maintenance & Landscaping
0% Law, Govt. & Public Service 0% iT 0% Manufacturing, STeM 0% Human Services
0% Hospitality, Tourism & Rec. 0% Health Care
n 22% environment, Natural Resources
n 7% education 0% Construction & design
n 16% Child Care Camp Counselor 0% Business 0% Arts & Communication
eTHNiCiTY CoMPARiSoN FoR YouTHWoRkS PARTiCiPANTS
0%
10%
20%
30%
40%
50%
60% Students in New Bedford Public Schools
Participants in YouthWorks
All OtherAsianWhiteHispanicAfrican-American
Ethnicity Comparison for YouthWorks Participants

Commonwealth Corporation Executive Office of Labor and Workforce Development38
City of Pittsfield—YouthWorks 2010 Program Profile SAMPLe eMPLoYeRS ANd JoB TiTLeS FoR YouTHWoRkS PARTiCiPANTS
B & G Restaurant Supply, Co.
Berkshire Community Action Council
Berkshire Community College
Berkshire Health Systems - Berkshire Medical Center
Berkshire Works Career Center
Catholic Youth Center - Camp St. Michael
Christian Center
City of Pittsfield - Building Maintenance Department
City of Pittsfield - Finance Department

Commonwealth Corporation Executive Office of Labor and Workforce Development 39
City of Pittsfield—YouthWorks 2010 Program Profile NuMBeR oF YouTH SeRVed BY YouTHWoRkS iN 2010
Total Number of Youth Served: 52
GeNdeR ANd eTHNiCiTY oF YouTHWoRkS PARTiCiPANTS
Ethnicity Female % Male % Total %African-American 5 10% 15 29% 20 38%Hispanic 3 6% 2 4% 5 10%White 15 29% 11 21% 26 50%Asian 0 0% 0 0% 0 0%All Other 1 2% 0 0% 1 2%Totals 24 46% 228 54% 52
Missing data 0 0%
RiSk CATeGoRY oF YouTH PARTiCiPANTS
Number % of TotalPoor academic performance or is a dropout 2 3%Is a child of a single working paren 16 27%Homeless or a runaway 1 2%Has a disability 20 33%Has aged out of foster care, or close to aging out 5 8%Court-involved or has history of delinquency 7 12%Is a teen parent 8 13%Limited English skills or is a foreign immigrant 1 2%Totals 60
Note: Participating youth may be counted in more than one Risk Category.
WAGe iNFoRMATioN
Average Wage Paid (per hour): $8.00Total Youth Wages Paid: $58,581
SCHOOL STATuS OF YOuTHWORkS PARTICIPANTS (MiSSing data 0%)
Dropped out of high school 4%
0Enrolled in GED preparation 36%
Enrolled in postsecondary program 4%
HS Grad but not in post sec 15%
Enrolled in Middle or High 43%
n 17% Twelfthn 44% eleventhn 39% Tenth
0% Ninth 0% eighth 0% Seventh
gRAdE LEvEL OF YOuTHWORkS PARTICIPANTS (MiSSing data 0%)
twelveth 40
eleventh 35
tenth 20
nineth 5
eigth 0
seventh 0
n 25% 19 to 21 yearsn 46% 16 to 18 yearsn 29% 14 to 15 years
Private 36%
Public 34%
Non-profit 30%
PLACEMENT BY JOB SECTOR FOR YOuTHWORkS PARTICIPANTS (MiSSing data 0%)
n 38% Privaten 31% Publicn 31% Non-profit
AgE OF YOuTHWORkS PARTICIPANTS (MiSSing data 0%)
19 to 21 years 32%
16 to 18 years 57%
14 to 15 years 11%
CATEgORY OF JOB PLACEMENT FOR YOuTHWORkS PARTICIPANTS (MiSSing data 0%)
Arts & Communications
Business
Child Care Camp Counselor
Construction & Design
Education
Environment, Natural Resources
Health care
Hospitality, Tourism, & rec
Human Services
Manufacturing, STEM
IT
law, got&public service
maintence&landscaping
marine industries
retail&services
transportation
other
n 29% dropped out of high schooln 25% enrolled in Ged preparationn 4% enrolled in postsecondary
programn 8% Graduated high school,
but is not currently in schooln35% Currently enrolled in middle
school or high school
0% other 0% Transportation
n 15% Retail & Services 0% Marine industries 0% Maintenance & Landscaping
n 33% Law, Govt. & Public Servicen 2% iTn 2% Manufacturing, STeMn 17% Human Services
0% Hospitality, Tourism & Rec.n 2% Health Care
0% environment, Natural Resources
n 2% education 0% Construction & design
n 10% Child Care Camp Counselorn 12% Business
0% Arts & Communication
eTHNiCiTY CoMPARiSoN FoR YouTHWoRkS PARTiCiPANTS
0%
10%
20%
30%
40%
50%
60%
70%
80% Students in Pitts�eld Public Schools
Participants in YouthWorks
All OtherAsianWhiteHispanicAfrican-American
Ethnicity Comparison for YouthWorks Participants
Commonwealth Corporation Executive Office of Labor and Workforce Development40
Quincy/Randolph/Weymouth—YouthWorks 2010 Program Profile SAMPLe eMPLoYeRS
Adams Inn
Clifford Marshall Elementary School
DITMS / N.A.G.E
Merrymount School
North Quincy High School
Point Webster Middle School
Quincy Career Center
Quincy Department of Public Works
Quincy Housing Authority
Quincy Parks Department
Quirk Nissan
Randolph High School
Randolph Parent Information Center/Randolph High School
Randolph Recreation Department
Randolph Town Hall - Board of Health
Randolph Town Highway
Snug Harbor School
Sterling Middle School
Weymouth Department of Public Works
Weymouth School Administration
Weymouth Town Hall
Weymouth Tufts Library
YMCA

Commonwealth Corporation Executive Office of Labor and Workforce Development 41
Quincy/Randolph/Weymouth—YouthWorks 2010 Program Profile NuMBeR oF YouTH SeRVed BY YouTHWoRkS iN 2010
Total Number of Youth Served: 74
GeNdeR ANd eTHNiCiTY oF YouTHWoRkS PARTiCiPANTS
Ethnicity Female % Male % Total %African-American 9 13% 16 22% 25 35%Hispanic 1 1% 1 1% 2 3%White 11 15% 19 26% 30 42%Asian 2 3% 10 14% 12 17%All Other 1 1% 2 3% 3 4%Totals 24 33% 48 67% 72
Missing data 0 2 4% 2 4%
RiSk CATeGoRY oF YouTH PARTiCiPANTS
Number % of TotalPoor academic performance or is a dropout 3 4%Is a child of a single working parent 49 64%Homeless or a runaway 0 0%Has a disability 18 23%Has aged out of foster care, or close to aging out 0 0%Court-involved or has history of delinquency 1 1%Is a teen parent 4 5%Limited English skills or is a foreign immigrant 2 3%Totals 77
Note: Participating youth may be counted in more than one Risk Category.
WAGe iNFoRMATioN
Average Wage Paid (per hour): $8.00Total Youth Wages Paid: $97,589
SCHOOL STATuS OF YOuTHWORkS PARTICIPANTS (MiSSing data 0%)
Dropped out of high school
0Enrolled in GED preparation 36%
Enrolled in postsecondary program
HS Grad but not in post sec
Enrolled in Middle or High
n 21% Twelfthn 39% eleventhn 28% Tenthn 12% Ninth
0% eighth 0% Seventh
gRAdE LEvEL OF YOuTHWORkS PARTICIPANTS (MiSSing data 0%)
twelveth 25
eleventh 39
tenth 16
nineth 13
eigth 4
seventh 3
n 15% 19 to 21 yearsn 70% 16 to 18 yearsn 15% 14 to 15 years
Private 20%
Public 80%
Non-profit 0%
PLACEMENT BY JOB SECTOR FOR YOuTHWORkS PARTICIPANTS (MiSSing data 0%)
n 3% Privaten 95% Publicn 3% Non-Profit
AgE OF YOuTHWORkS PARTICIPANTS (MiSSing data 0%)
19 to 21 years 24%
16 to 18 years 63%
14 to 15 years 13%
CATEgORY OF JOB PLACEMENT FOR YOuTHWORkS PARTICIPANTS (MiSSing data 0%)
arts&communication
business
child care camp counselor
construction&design
education
environment
healthcare
hospitality
human service
manufacturing
it
law, govt, public service
maintenance&landscaping
marine industry
retail&service
transportation
other
n .16% othern 1% Transportation
0% Retail & Services 0% Marine industries
n 62% Maintenance & Landscapingn 3% Law, Govt. & Public Service
0% iT 0% Manufacturing, STeM
n 1% Human Services
n 1% Hospitality, Tourism & Rec. 0% Health Care 0% environment, Natural
Resourcesn 11% education
0% Construction & designn 4% Child Care Camp Counselor
0% Business 0% Arts & Communication
eTHNiCiTY CoMPARiSoN FoR YouTHWoRkS PARTiCiPANTS
0%
10%
20%
30%
40%
50%
60%
70%
80% Students in Quincy, Randolph &Weymouth Public Schools
Participants in YouthWorks
All OtherAsianWhiteHispanicAfrican-American
Ethnicity Comparison for YouthWorks Participants
n 0% dropped out of high schooln 0% enrolled in Ged preparationn 7% enrolled in postsecondary
program 16% Graduated high school,
but is not currently in schooln 77% Currently enrolled in middle
school or high school

Commonwealth Corporation Executive Office of Labor and Workforce Development42
Springfield/Holyoke/Chicopee—YouthWorks 2010 Program Profile SAMPLe eMPLoYeRS
AJ Wright
Fruit Fair
Aramark
Arize for Social Justice
FuFu’s Beauty Supply
Gardening the Community
Gilette Resturant
Hill Homes Corp.
Holy Name
Bassett Company
Board of Health
Holyoke Children’s Museum
Holyoke Community College Step
Atlas
Cabot Manor Daycare
Holyoke Geriatric Authority
Holyoke Geriatric Authority
Holyoke High School
Cabot Manor Maintenance Supervisor
Camp Weber
Carew St. Boy’s and Girls Club
Cassie’s Kiddie Corner
Chester and chester
Holyoke Providence Ministries Inc. St Jude Furniture Store
Chicopee City Library
Holyoke Public School
Chicopee Comprehensive High School
Chicopee Housing Authority
Chicopee Parks and Recreation
Chicopee Village Townhomes
Children’s Museum
Chuck’s Auto Service
City Hall
Creative Mind Agency
Holyoke Salvation Army
Homecity Housing
Homer Street School
Crickets Corner Daycare
Intercity Youth Inc.
Jarvis Height Community
Dean Technical High School
Department of Public Works
Devine Designs
Distinctive Marketing
Dream Studios
Dunbar Community Center
El Tabonuco Restaurant
Elms College
Employment Placement Hamp-den
Families First
Family Center — Girls Club
First Tee
Friendly’s Corporation
Big Mama’s Restuarant
Boys and Girls Club
Broadway Business
Kate’s Kitchen/Providence Ministries
Latino Chamber of Commerce
Map Office/Engineering
Marcia’s Lil Rascals Daycare
Martin Luther King Jr enter
Martin Luther King Jr.Community Center
Mason Square Veteran’s Out-reach Program
Mass Rehab
Mayor’s Office
MCDI, Inc.
McDonald’s
Mercy Hospital
MLK
Montenia’s Cuisine
Mount Carmel Daycare
NEARI School
Neri School
New Creation Daycare
Nuestra Raices
Office of Housing
P.E. Bowe
Springfield Parks Department
Patrick E. Bowe School
Peck Middle School
Providence Ministries
Representative Ben Swan’s Of-fice
Salvation Army
Sargeant West Properties
Social Security Administration
Southend Community Center
Springfield Boys and Girls Club
Springfield City Library
Springfield District Courthouse
Springfield Housing Authority
Springfield Partners
Square One
Stone Soul Inc.
T.O.L.D.
The Center After School Program
Tom Crochiere Construction
Victory Temple Church
Virtue Salon
War Memorial
Water And Sewer
Western New England College
Wisteriahurst
WNEC
Y.S.E.T
YMCA of Greater Springfield

Commonwealth Corporation Executive Office of Labor and Workforce Development 43
Springfield/Holyoke/Chicopee—YouthWorks 2010 Program Profile NuMBeR oF YouTH SeRVed BY YouTHWoRkS iN 2010
Total Number of Youth Served: 550
GeNdeR ANd eTHNiCiTY oF YouTHWoRkS PARTiCiPANTS
Ethnicity Female % Male % Total %African-American 130 24% 132 25% 262 49%Hispanic 105 20% 123 23% 228 43%White 13 2% 19 4% 32 6%Asian 0 0% 0 0% 0 0%All Other 6 1% 7 1% 13 2%Totals 254 47% 281 53% 535
Missing data 12 5% 3 1% 15 3%
RiSk CATeGoRY oF YouTH PARTiCiPANTS
Number % of TotalPoor academic performance or is a dropout 102 15%Is a child of a single working parent 381 56%Homeless or a runaway 7 1%Has a disability 52 8%Has aged out of foster care, or close to aging out 24 3%Court-involved or has history of delinquency 76 11%Is a teen parent 29 4%Limited English skills or is a foreign immigrant 15 2%Totals 686
Note: Participating youth may be counted in more than one Risk Category.
WAGe iNFoRMATioN
Average Wage Paid (per hour): $8.30Total Youth Wages Paid: $703,396
SCHOOL STATuS OF YOuTHWORkS PARTICIPANTS (MiSSing data 9%)
Dropped out of high school 4%
0Enrolled in GED preparation 2%
Enrolled in postsecondary program 7%
HS Grad but not in post sec 6%
Enrolled in Middle or High 81%
n 11% Twelfthn 22% eleventhn 26% Tenthn 28% Ninthn 11% eighthn 2% Seventh
gRAdE LEvEL OF YOuTHWORkS PARTICIPANTS (MiSSing data 0%)
twelveth 12
eleventh 19
tenth 26
nineth 32
eigth 10
seventh 2
n 18% 19 to 21 yearsn 59% 16 to 18 yearsn 18% 14 to 15 years
Private 22%
Public 27%
Non-profit 50%
PLACEMENT BY JOB SECTOR FOR YOuTHWORkS PARTICIPANTS (MiSSing data 3%)
n 16% Privaten 53% Publicn 31% Non-profit
AgE OF YOuTHWORkS PARTICIPANTS (MiSSing data 4%)
19 to 21 years 18%
16 to 18 years 56%
14 to 15 years 26%
CATEgORY OF JOB PLACEMENT FOR YOuTHWORkS PARTICIPANTS (MiSSing data 3%)
n 4% dropped out of high schooln 3% enrolled in Ged preparationn 8% enrolled in postsecondary
programn 4% Graduated high school,
but is not currently in schooln 72% Currently enrolled in middle
school or high school
n 8% other 0% Transportation
n 11% Retail & Services 0% Marine industries
n 30% Maintenance & Landscapingn 6% Law, Govt. & Public Service
0% iT 0% Manufacturing, STeM
n 2% Human Services
0% Hospitality, Tourism & Rec.n 2% Health Caren 1% environment, Natural
Resourcesn 2% educationn 2% Construction & designn 34% Child Care Camp Counselorn 1% Business
0% Arts & Communication
eTHNiCiTY CoMPARiSoN FoR YouTHWoRkS PARTiCiPANTS
0%
10%
20%
30%
40%
50%
60% Students in Chicopee, Holyoke &Spring�eld Public Schools
Participants in YouthWorks
All OtherAsianWhiteHispanicAfrican-American
Ethnicity Comparison for YouthWorks Participants
Commonwealth Corporation Executive Office of Labor and Workforce Development44
City of Worcester—YouthWorks 2010 Program Profile SAMPLe eMPLoYeRS
Autumn Woods
Boys and Girls Club
City of Worcester
Clark University
Central Massachusetts Center for Healthy Communities
DA’s Office
Friendly House
College of the Holy Cross
Lincoln Village
Lutheran Services
Mass Audubon
Mekong Market
Oak Hill
Pernet
Probate Court
PSNC
Rainbow Day Care
St. Agnes
St. Bernards
South Worcester Neighborhood Center
Temple Emmanuel
Worcester Community Connections Coalition
Willis Center
Worcester Parks
Worcester Roots
Youth Center
Youthgrow
Youthnet
YWCA
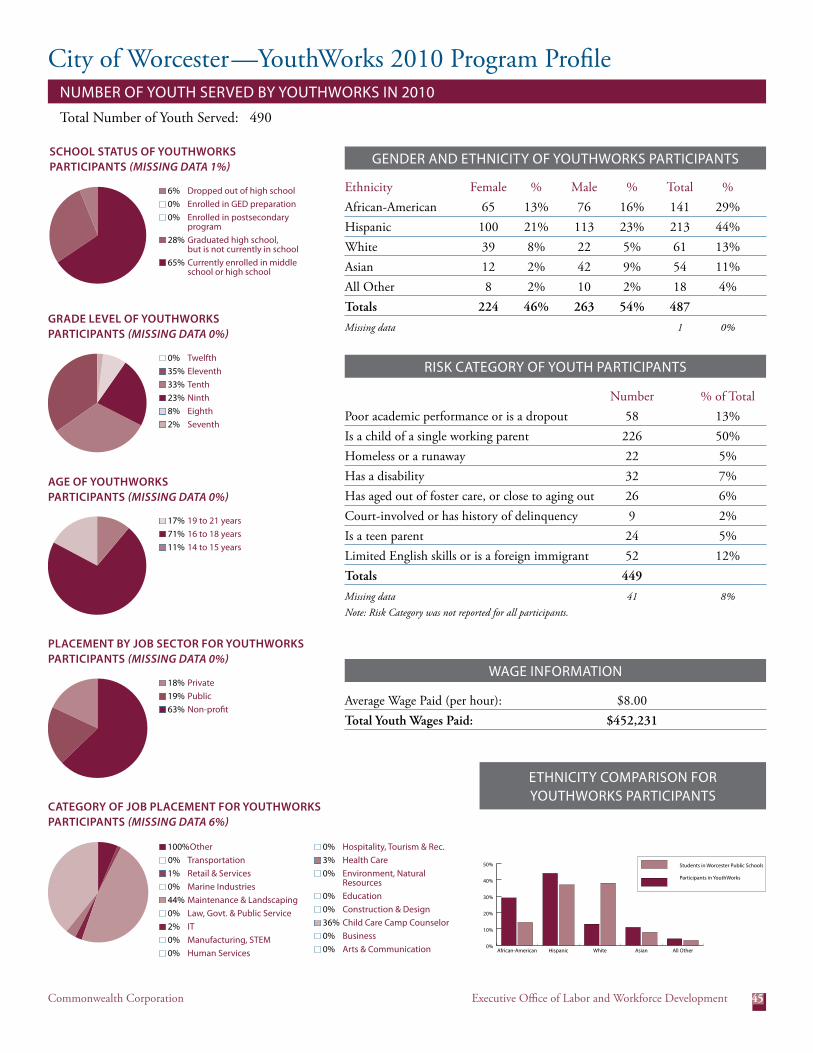
Commonwealth Corporation Executive Office of Labor and Workforce Development 45
City of Worcester—YouthWorks 2010 Program Profile NuMBeR oF YouTH SeRVed BY YouTHWoRkS iN 2010
Total Number of Youth Served: 490
GeNdeR ANd eTHNiCiTY oF YouTHWoRkS PARTiCiPANTS
Ethnicity Female % Male % Total %African-American 65 13% 76 16% 141 29%Hispanic 100 21% 113 23% 213 44%White 39 8% 22 5% 61 13%Asian 12 2% 42 9% 54 11%All Other 8 2% 10 2% 18 4%Totals 224 46% 263 54% 487
Missing data 1 0%
RiSk CATeGoRY oF YouTH PARTiCiPANTS
Number % of TotalPoor academic performance or is a dropout 58 13%Is a child of a single working parent 226 50%Homeless or a runaway 22 5%Has a disability 32 7%Has aged out of foster care, or close to aging out 26 6%Court-involved or has history of delinquency 9 2%Is a teen parent 24 5%Limited English skills or is a foreign immigrant 52 12%Totals 449
Missing data 41 8% Note: Risk Category was not reported for all participants.
WAGe iNFoRMATioN
Average Wage Paid (per hour): $8.00Total Youth Wages Paid: $452,231
SCHOOL STATuS OF YOuTHWORkS PARTICIPANTS (MiSSing data 1%)
Dropped out of high school 3%
0Enrolled in GED preparation 0%
Enrolled in postsecondary program 0%
HS Grad but not in post sec 29%
Enrolled in Middle or High 68%
0% Twelfthn 35% eleventhn 33% Tenthn 23% Ninthn 8% eighthn 2% Seventh
gRAdE LEvEL OF YOuTHWORkS PARTICIPANTS (MiSSing data 0%)
twelveth 37
eleventh 22
tenth 33
nineth 3
eigth 15
seventh 0
n 17% 19 to 21 yearsn 71% 16 to 18 yearsn 11% 14 to 15 years
AgE OF YOuTHWORkS PARTICIPANTS (MiSSing data 0%)
19 to 21 years 18%
16 to 18 years 54%
14 to 15 years 29%
CATEgORY OF JOB PLACEMENT FOR YOuTHWORkS PARTICIPANTS (MiSSing data 6%)
Arts & Communications
Business
Child Care Camp Counselor
Construction & Design
Education
Environment, Natural Resources
Health care
Hospitality, Tourism, & rec
Human Services
Manufacturing, STEM
IT
law, got&public service
maintence&landscaping
marine industries
retail&services
transportation
other
Private 22%
Public 27%
Non-profit 50%
PLACEMENT BY JOB SECTOR FOR YOuTHWORkS PARTICIPANTS (MiSSing data 0%)
n 18% Privaten 19% Publicn 63% Non-profit
n 100%other 0% Transportation
n 1% Retail & Services 0% Marine industries
n 44% Maintenance & Landscaping 0% Law, Govt. & Public Service
n 2% iT 0% Manufacturing, STeM 0% Human Services
0% Hospitality, Tourism & Rec.n 3% Health Care
0% environment, Natural Resources
0% education 0% Construction & design
n 36% Child Care Camp Counselor 0% Business 0% Arts & Communication
eTHNiCiTY CoMPARiSoN FoR YouTHWoRkS PARTiCiPANTS
0%
10%
20%
30%
40%
50% Students in Worcester Public Schools
Participants in YouthWorks
All OtherAsianWhiteHispanicAfrican-American
Ethnicity Comparison for YouthWorks Participants
n 6% dropped out of high school 0% enrolled in Ged preparation 0% enrolled in postsecondary
programn 28% Graduated high school,
but is not currently in schooln 65% Currently enrolled in middle
school or high school

Commonwealth Corporation Executive Office of Labor and Workforce Development46

We gratefully acknowledge the following YouthWorks team members:
Dawn Wakelin and John Niles (Commonwealth Corporation); and Jennifer James (Massachusetts Executive Office of Labor and Workforce Development).
Deval L. Patrick—Governor • Timothy P. Murray—Lt. GovernorJoanne F. Goldstein—Secretary, Labor & Workforce Development • Nancy L. Snyder—President/CEO
The Schrafft Center, 529 Main Street, Suite 1M8, Boston, MA 02129617–727–8158
www.commcorp.org
Massachusetts Executive Office of Labor and Workforce Development
CommonwealthCorporation