zinc launch_20120816
TRANSCRIPT
MACKIE RESEARCH SERVICE INDEPENDENT THOUGHT GROWTHM A C K I E R E S E A R C H SERVICE INDEPENDENTTHOUGHT GROWTH
M A C K I E R E S E A R C H SERVICE I N D E P E N D E N T
www.mackieresearch.com
16 August 2012 This report has been created by Analysts that are employed by Mackie Research Capital Corporation, a Canadian Investment Dealer. For further disclosures, please see the last pages of this report.
ZincTop Names to the Supply Shor t fa l l Ahead
INITIATING COVERAGE
TREVALI MINING CORP. (TV – TSX) BUY | 12-Month Target: $2.00
Burgeoning Zinc Producer in Established Camps
CANADIAN ZINC CORP. (CZN – TSX) SPECULATIVE BUY | 12-Month Target: $1.00
Poised for Production at Prairie Creek
CHIEFTAIN METALS INC. (CFB – TSX) SPECULATIVE BUY | 12-Month Target: $5.50
On the Road to Production
FORAN MINING CORP. (FOM – TSXV) SPECULATIVE BUY | 12-Month Target: $1.20 Growing Polymetallic Project in Saskatchewan
RATHDOWNEY RESOURCES LTD. (RTH – TSXV)
SPECULATIVE BUY | 12-Month Target: $1.25 Adding New Life to an Old Zinc District
MINING, BASE METALS
Matt O’Keefe
Analyst 416.860.8636
Brandon Throop Associate
416.860.7618 [email protected]

Mackie Research Capital Corporation
www.mackieresearch.com Zinc: Top Names to Supply Shortfall Ahead 1
M I N I N G , B A S E M E T A L S
ZINC: TOP NAMES TO SUPPLY SHORTFALL AHEAD
EXECUTIVE SUMMARY The ongoing euro crisis and weak short-term outlook for western economies continue to weigh on equity markets and commodities. However, for the longer-term investor, there are some excellent bargains to be had. Among base metals, zinc is staging for its day in the sun due to very strong fundamentals, growing demand, and stagnating supply. Central to this thesis is the significant amount of supply coming offline within the next two years, creating a shortfall that should become quite material by 2014. In this report, we initiate coverage of five zinc-levered explorers/developers that show excellent value in the base metals space and offer a number of near-term catalysts that should drive their stock prices up in 2012/2013. As a basket, this collection of top names offers good potential for near-term production, attractive valuation, take-over potential, and re-ratings as they move past exploration, development, and production milestones.
Trevali Mining Corp. (TV-TSX) is a burgeoning zinc producer ramping up operations at its Halfmile mine in New Brunswick and on track to build out its Santander mine in Peru. This is one of the few “independent” zinc producers, and although Xstrata and Glencore have significant interests in Trevali’s projects, we see this as the next “go-to” name for zinc, once fully in production. We forecast Trevali to produce 221.8 Mlbs of zinc, 54.9 Mlbs of lead, 850,000 ounces of silver, and 4.6 Mlbs of copper at peak production on a consolidated basis. We rate Trevali a BUY with a 12-month target price of C$2.00/share.
Canadian Zinc Corp. (CZN-TSX) is a brownfields zinc company reviving the built but never operated Prairie Creek zinc-lead-silver mine in the NWT, Canada. Although the project has struggled through rigorous environmental and permitting review for several years, the dedicated team’s hard work should finally come to fruition with its final permits awarded by early 2013. Near-term catalysts, including a more complete feasibility study expected later in 2012, and receipt of final permits in H1/13, should aid in de-risking the project. Once in production, the high-grade Prairie Creek mine will be a significant zinc and silver producer. We rate Canadian Zinc a SPECULATIVE BUY with a 12-month target price of C$1.00/share.
Chieftain Metals Inc. (CFB-TSX) is developing its Tulsequah Chief project in northern B.C. Although this will be a zinc producer, it is technically a polymetallic producer with about equal contributions from zinc, copper, and gold. Tulsequah Chief stands out for its high grades and high expected margins. It is well supported and has several key catalysts in the next 12 months, including an updated feasibility study and approval for a rerouted access road. We rate Chieftain a SPECULATIVE BUY with a 12-month target price of C$5.50/share.
Foran Mining Corp. (FOM-TSXV) is an exploration and development company with a focus on developing its 100%-owned McIlvenna Bay property in east-central Saskatchewan. The deposit hosts a high-grade resource that remains open and continues to grow with subsequent programs. A resource update by the end of 2012 and the completion of a PEA on McIlvenna Bay in the first half of 2013 are near-term catalysts that should see the stock move through our target. We rate Foran Mining a SPECULATIVE BUY with a 12-month target price of C$1.20/share.
Rathdowney Resources Ltd. (RTH-TSXV) is the earliest stage of this group, building out a classic Mississippi Valley deposit within the zinc orefields of southern Poland. Its Olza project is strategically located close to the operating Pomorzany mill and mine, which is near depletion and in search of new ore or a new owner. Rathdowney’s project stands out for its ease of access, established mine infrastructure, and proximity to markets. As part of the Hunter Dickinson Inc. group of companies, Rathdowney has strong marketing, financial and legal resources to draw upon. We rate Rathdowney a SPECULATIVE BUY with a 12-month target price of C$1.25/share.
Mackie Research Capital Corporation
2 Zinc: Top Names to Supply Shortfall Ahead www.mackieresearch.com
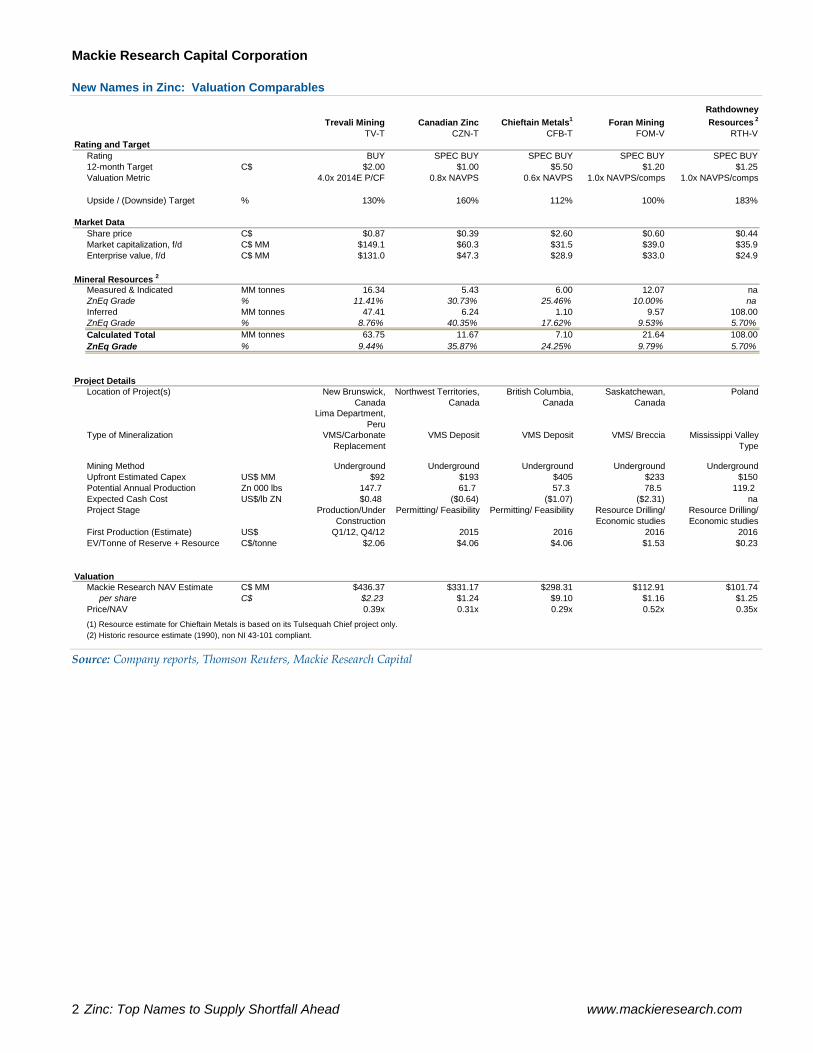
New Names in Zinc: Valuation Comparables
Trevali Mining Canadian Zinc Chieftain Metals1 Foran MiningRathdowney Resources 2
TV-T CZN-T CFB-T FOM-V RTH-VRating and Target
Rating BUY SPEC BUY SPEC BUY SPEC BUY SPEC BUY12-month Target C$ $2.00 $1.00 $5.50 $1.20 $1.25Valuation Metric 4.0x 2014E P/CF 0.8x NAVPS 0.6x NAVPS 1.0x NAVPS/comps 1.0x NAVPS/comps
Upside / (Downside) Target % 130% 160% 112% 100% 183%
Market DataShare price C$ $0.87 $0.39 $2.60 $0.60 $0.44Market capitalization, f/d C$ MM $149.1 $60.3 $31.5 $39.0 $35.9Enterprise value, f/d C$ MM $131.0 $47.3 $28.9 $33.0 $24.9
Mineral Resources 2Measured & Indicated MM tonnes 16.34 5.43 6.00 12.07 naZnEq Grade % 11.41% 30.73% 25.46% 10.00% naInferred MM tonnes 47.41 6.24 1.10 9.57 108.00ZnEq Grade % 8.76% 40.35% 17.62% 9.53% 5.70%Calculated Total MM tonnes 63.75 11.67 7.10 21.64 108.00ZnEq Grade % 9.44% 35.87% 24.25% 9.79% 5.70%
Project DetailsLocation of Project(s) New Brunswick,
CanadaNorthwest Territories,
CanadaBritish Columbia,
CanadaSaskatchewan,
CanadaPoland
Lima Department, Peru
Type of Mineralization VMS/Carbonate Replacement
VMS Deposit VMS Deposit VMS/ Breccia Mississippi Valley Type
Mining Method Underground Underground Underground Underground UndergroundUpfront Estimated Capex US$ MM $92 $193 $405 $233 $150Potential Annual Production Zn 000 lbs 147.7 61.7 57.3 78.5 119.2 Expected Cash Cost US$/lb ZN $0.48 ($0.64) ($1.07) ($2.31) naProject Stage Production/Under
ConstructionPermitting/ Feasibility Permitting/ Feasibility Resource Drilling/
Economic studiesResource Drilling/ Economic studies
First Production (Estimate) US$ Q1/12, Q4/12 2015 2016 2016 2016EV/Tonne of Reserve + Resource C$/tonne $2.06 $4.06 $4.06 $1.53 $0.23
ValuationMackie Research NAV Estimate C$ MM $436.37 $331.17 $298.31 $112.91 $101.74 per share C$ $2.23 $1.24 $9.10 $1.16 $1.25Price/NAV 0.39x 0.31x 0.29x 0.52x 0.35x(1) Resource estimate for Chieftain Metals is based on its Tulsequah Chief project only.(2) Historic resource estimate (1990), non NI 43-101 compliant.
Source: Company reports, Thomson Reuters, Mackie Research Capital
Mackie Research Capital Corporation
www.mackieresearch.com Zinc: Top Names to Supply Shortfall Ahead 3
M I N I N G , B A S E M E T A L S
ZINC: TOP NAMES TO SUPPLY SHORTFALL AHEAD
TABLE OF CONTENTS EXECUTIVE SUMMARY.......................................................................................................................................................................1 THE ZINC MARKET ..............................................................................................................................................................................6
Zinc – Inflection Point Ahead .............................................................................................................................................................6 Don’t Forget Lead.................................................................................................................................................................................9 Zinc & Lead Pricing............................................................................................................................................................................10 Investment Strategy............................................................................................................................................................................12 Initiating Coverage .............................................................................................................................................................................14
TREVALI MINING CORP...................................................................................................................................................................17 Introduction ............................................................................................................................................................................................18
Company Profile.................................................................................................................................................................................18 Consolidated Production Profile.........................................................................................................................................................19 Large Global Resource..........................................................................................................................................................................20 New Brunswick Complex.....................................................................................................................................................................21
Regional Geology – A Classic Camp................................................................................................................................................21 Resource Estimates .............................................................................................................................................................................22 Halfmile & Stratmat – A Great Start ................................................................................................................................................23 Caribou Mill & Mine Acquisition.....................................................................................................................................................24 Adding Tonnage to the Portfolio......................................................................................................................................................25 New Brunswick Development Plan .................................................................................................................................................25 Project Assumptions...........................................................................................................................................................................26
Santander Mine – Peru..........................................................................................................................................................................27 Location & Infrastructure ..................................................................................................................................................................27 History .................................................................................................................................................................................................27 New Deal With Glencore...................................................................................................................................................................28 Sizeable Upgrade in Inferred Resource ...........................................................................................................................................28 Geology ................................................................................................................................................................................................28 Underground Mine plan....................................................................................................................................................................29 Tingo Hydroelectric Plant, Peru .......................................................................................................................................................30 Project Progress & Timeline ..............................................................................................................................................................30
Other Assets............................................................................................................................................................................................31 Huampar Silver Mine, Peru ..............................................................................................................................................................31 Ruttan Copper Mine, Manitoba........................................................................................................................................................31
Valuation.................................................................................................................................................................................................32 Catalysts...................................................................................................................................................................................................32 Risks.........................................................................................................................................................................................................33 Conclusion ..............................................................................................................................................................................................33 Management Team ................................................................................................................................................................................34 CANADIAN ZINC CORP....................................................................................................................................................................37 Company Background ..........................................................................................................................................................................38
Company Profile.................................................................................................................................................................................38 Prairie Creek Mine ................................................................................................................................................................................39
Established Infrastructure .................................................................................................................................................................39 History & Progress .............................................................................................................................................................................39 Government & First Nations Agreements in Place ........................................................................................................................40 Prairie Creek Geology ........................................................................................................................................................................41
Mackie Research Capital Corporation
4 Zinc: Top Names to Supply Shortfall Ahead www.mackieresearch.com
High-Grade Deposit ...........................................................................................................................................................................42 Resource Potential ..............................................................................................................................................................................43 Mine Plan – Mostly Logistics ............................................................................................................................................................44 Water & Waste Management ............................................................................................................................................................46 Project Timeline ..................................................................................................................................................................................46 Permitting ............................................................................................................................................................................................47 Project Assumptions Summary ........................................................................................................................................................47
Other Assets............................................................................................................................................................................................48 Vatukoula Gold Mines .......................................................................................................................................................................48 South Tally Pond (Paragon Minerals Acquisition) ........................................................................................................................49
Valuation.................................................................................................................................................................................................49 Financing Assumptions .....................................................................................................................................................................49 Sensitivity Analysis ............................................................................................................................................................................50
Catalysts...................................................................................................................................................................................................51 Risks.........................................................................................................................................................................................................51 Conclusion ..............................................................................................................................................................................................51 Management Team ................................................................................................................................................................................53 CHIEFTAIN METALS INC..................................................................................................................................................................55 Introduction ............................................................................................................................................................................................56 Tulsequah Project ..................................................................................................................................................................................57
Location: A Sensitive area .................................................................................................................................................................57 Infrastructure: A Brownfields Project ..............................................................................................................................................57 New Access Road: Key to Success....................................................................................................................................................58 History .................................................................................................................................................................................................59 Environmental: Fixing a Leaky Legacy ...........................................................................................................................................59 Resource: High-Grade Polymetallic .................................................................................................................................................59 Exploration Upside.............................................................................................................................................................................60 Feasibility Study Around the Corner...............................................................................................................................................61 Operation .............................................................................................................................................................................................61 Project Timeline ..................................................................................................................................................................................62 Project Financing Options .................................................................................................................................................................63 Conceptual Model ..............................................................................................................................................................................63
Valuation.................................................................................................................................................................................................64 Sensitivity Analysis ............................................................................................................................................................................65
Catalysts...................................................................................................................................................................................................66 Risks.........................................................................................................................................................................................................67 Conclusion ..............................................................................................................................................................................................67 Management Team ................................................................................................................................................................................68 FORAN MINING CORP. .....................................................................................................................................................................69 Introduction ............................................................................................................................................................................................70 McIlvenna Bay Project ..........................................................................................................................................................................71
Location & History .............................................................................................................................................................................71 Geology – World-Class VMS Camp.................................................................................................................................................71 McIlvenna Bay Deposit ......................................................................................................................................................................72 Resource & Metallurgy ......................................................................................................................................................................74 Resource Upside .................................................................................................................................................................................74 Conceptual Model – PEA Soon On the Way...................................................................................................................................75 Sensitivity Analysis ............................................................................................................................................................................76
Other Projects .........................................................................................................................................................................................77 Valuation.................................................................................................................................................................................................77 Catalysts...................................................................................................................................................................................................78
Mackie Research Capital Corporation
www.mackieresearch.com Zinc: Top Names to Supply Shortfall Ahead 5
Risks.........................................................................................................................................................................................................78 Conclusion ..............................................................................................................................................................................................79 Management Team & Board ................................................................................................................................................................80 RATHDOWNEY RESOURCES LTD. ................................................................................................................................................83 Introduction ............................................................................................................................................................................................84 Olza Zinc Project - Poland....................................................................................................................................................................85
Location And Infrastructure..............................................................................................................................................................85 Community Relations ........................................................................................................................................................................85 History .................................................................................................................................................................................................86 Geology – Classic Mississippi Valley Type.....................................................................................................................................86 Resources – Historic Work Points to Size Potential .......................................................................................................................86 Pomorzany – A Mill & Mine Due to Close......................................................................................................................................88 Conceptual Model ..............................................................................................................................................................................89 Sensitivity Analysis ............................................................................................................................................................................90
Other Projects- Ireland..........................................................................................................................................................................90 Location And Infrastructure..............................................................................................................................................................90 Geology ................................................................................................................................................................................................91 Current Plan & Budget.......................................................................................................................................................................91
Valuation.................................................................................................................................................................................................92 Catalysts...................................................................................................................................................................................................92 Risks.........................................................................................................................................................................................................93 Conclusion ..............................................................................................................................................................................................93 Management, Technical Team & Board.............................................................................................................................................94 MINING INDUSTRY RISKS ..............................................................................................................................................................96
Commodity Price Risk .......................................................................................................................................................................96 Technical Risk .....................................................................................................................................................................................96 Cost Escalation Risk ...........................................................................................................................................................................96 Financing Risk.....................................................................................................................................................................................96 Regulatory Risk...................................................................................................................................................................................96 Political Risk ........................................................................................................................................................................................96 Exploration Risk..................................................................................................................................................................................96
IMPORTANT DISCLOSURES ...........................................................................................................................................................97 ANALYST CERTIFICATION..............................................................................................................................................................97 Note: All financial figures in this report are in Canadian dollars, unless stated otherwise. Report pricing date: 14-AUG-12
Mackie Research Capital Corporation
6 Zinc: Top Names to Supply Shortfall Ahead www.mackieresearch.com
THE ZINC MARKET
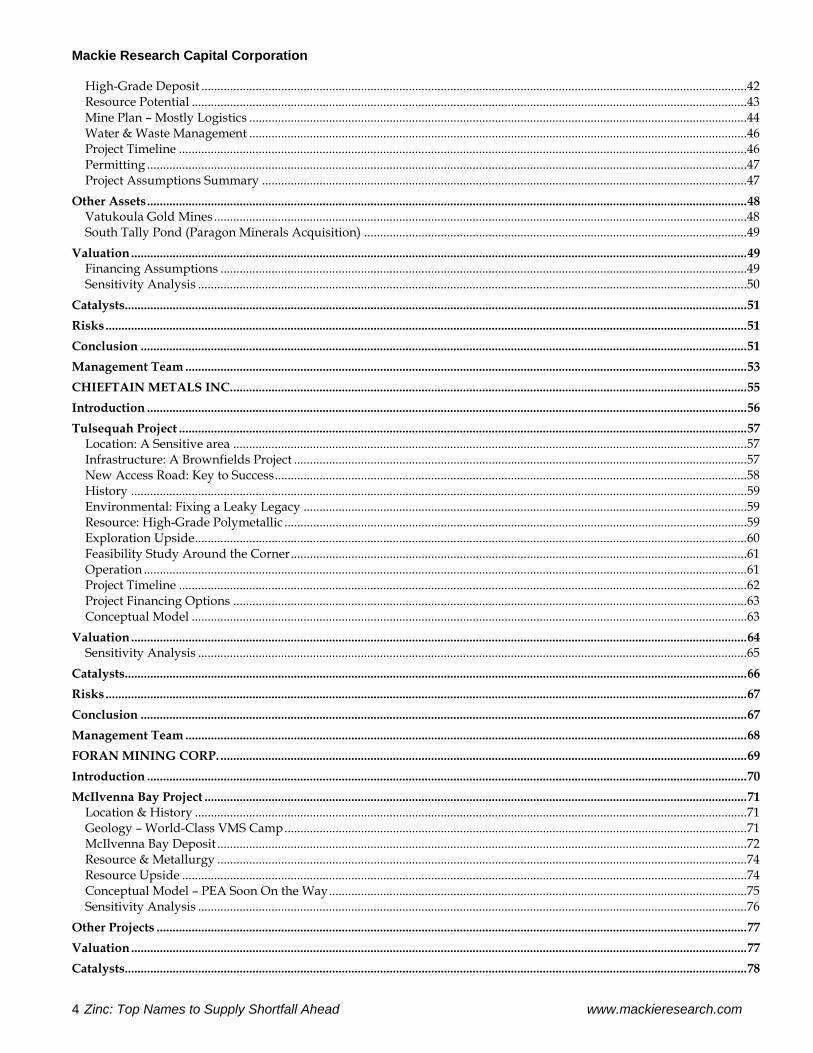
ZINC – INFLECTION POINT AHEAD Zinc remains one of the chief base metals along with copper and lead that drive burgeoning economic growth. Of the approximately 13 million tonnes produced annually, in general, 50% is used for galvanizing to protect steel from corrosion as used in automobiles and construction steel (rebar, framing, etc.). Approximately 17% goes into the production of zinc base alloys, mainly to supply the diecasting industry, and 17% to produce brass and bronze. Significant amounts are also utilized in rolled zinc applications including roofing, gutters, and down-pipes, while the remainder is consumed in compounds such as zinc oxide and zinc sulphate which are used in the chemical and fertilizer industry and for food and medical applications (Figure 1).
Figure 1: Main End Uses of Zinc
Main End Uses of Zinc
Galvanizing50%
Diecasting17%
Misc.4%Chemicals
6%Rolled Zinc6%
Brass & Bronze17%
Source: International Zinc Association
Demand is closely linked to economic growth, with China standing out as the world’s largest consumer of the metal at about 5.5 million tonnes annually, comprising 38% of global demand, with the rest of Asia bringing the total up to about 64%. The next largest consumer is the United States at 975,000 tonnes or about 8%, while Europe as a whole consumes almost 2.5 million tonnes or 20%. Consumption forecasts see a modest 3.75% growth rate for 2012, driven almost entirely by Asia in the face of stalled growth or contraction in North America and Europe.
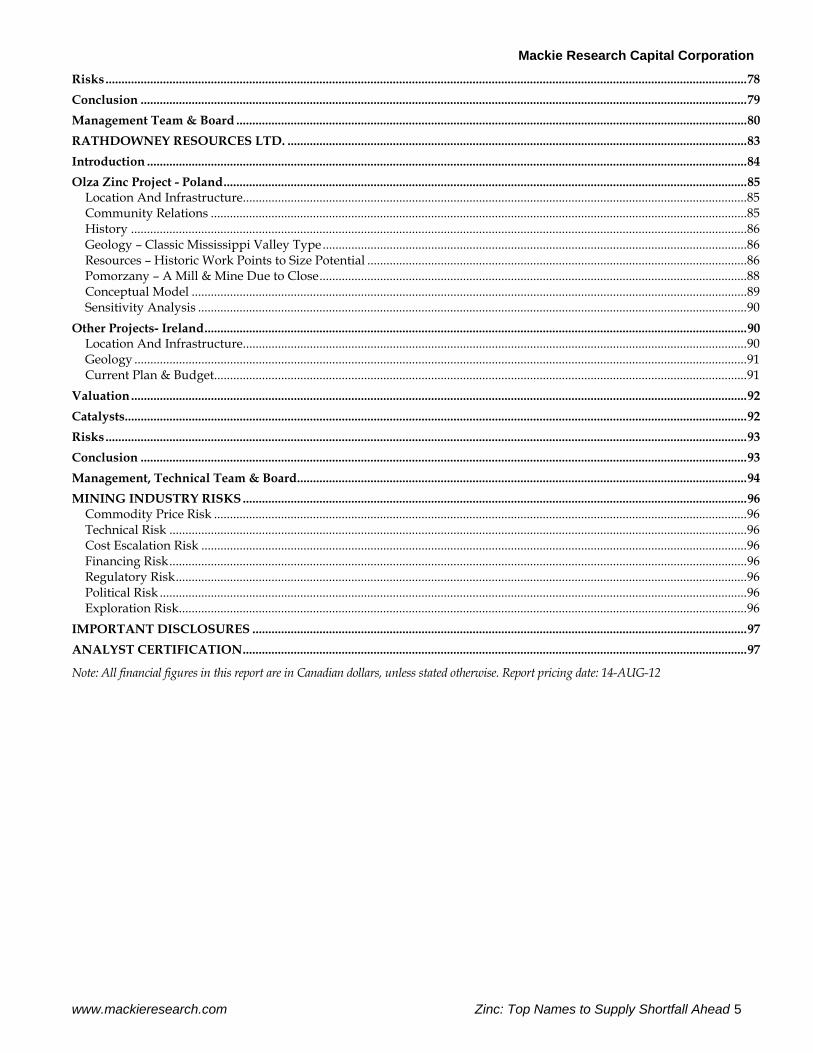
Macro data coming out of China points to slowing growth (at least in the near term), but investors should keep in mind that this growth is off of a much larger base than even just three or four years ago (Figure 2). And we maintain that the urbanization and structural changes in China and India are secular, occurring over decades, not quarters. The momentum of the last 10 years of growth doesn’t stop on a dime, and demand for mid-cycle commodities, principally base metals, should continue to be strong.
Mackie Research Capital Corporation
www.mackieresearch.com Zinc: Top Names to Supply Shortfall Ahead 7
Figure 2: Demand from China Slowing, But Off a Higher Base & Commodity Intensity
0
25
50
75
100
0 5 10 15 20 25 30 35 40 45 50
Early cycle commodities e.g. steel, iron oreMid-cycle commodities e.g. copper, lead, zincLate cycle commodities e.g. platinum, nickel
~$8k/capita~$4k/capita ~$48k/capita
-
2,000
4,000
6,000
8,000
10,000
2000 2001 2002 2003 2004 2005 2006 2007 2008 2009 2010 2011 2012 2013
US$
, bill
ions
GDP per capita (Nominal, 2011 US$)
5 to 7 Years ago:10-13% growth = $250 to $350 mbillion GDP growth
Present Day:7-8% growth = $550 Bn GDP growth GDP would have to slow to <3.5% to mirror historical absolute growth
Source: IMF, Xstrata, Mackie Research Capital
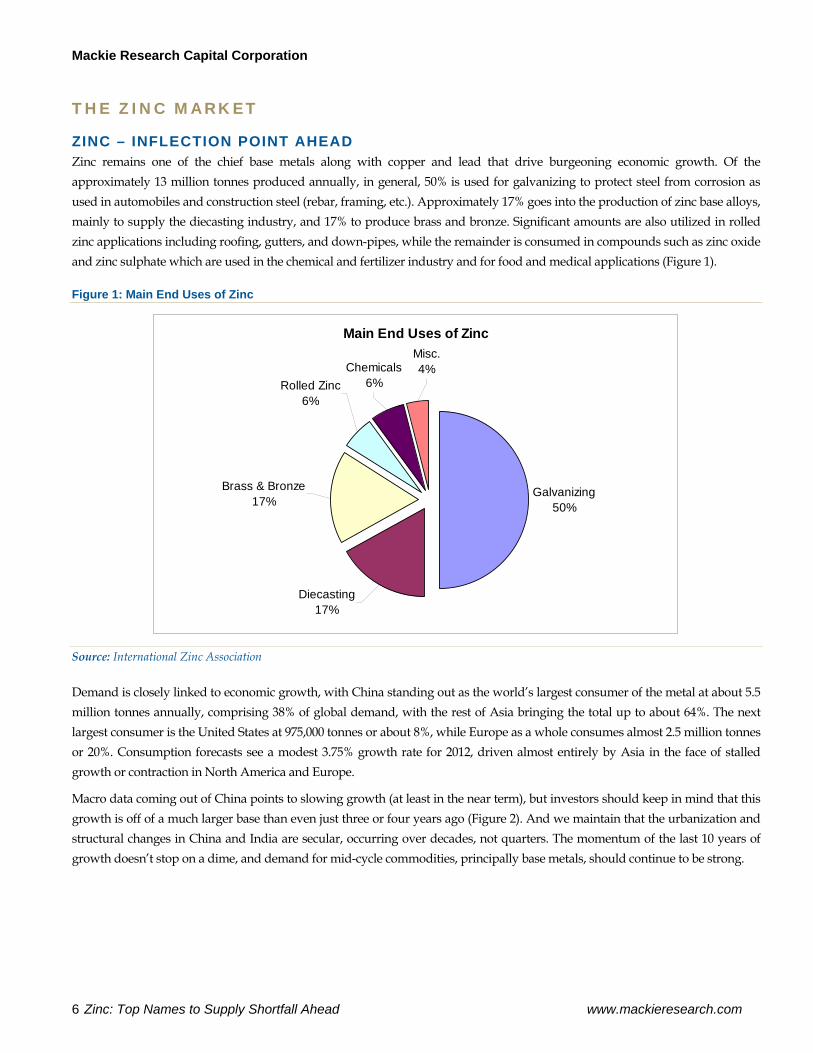
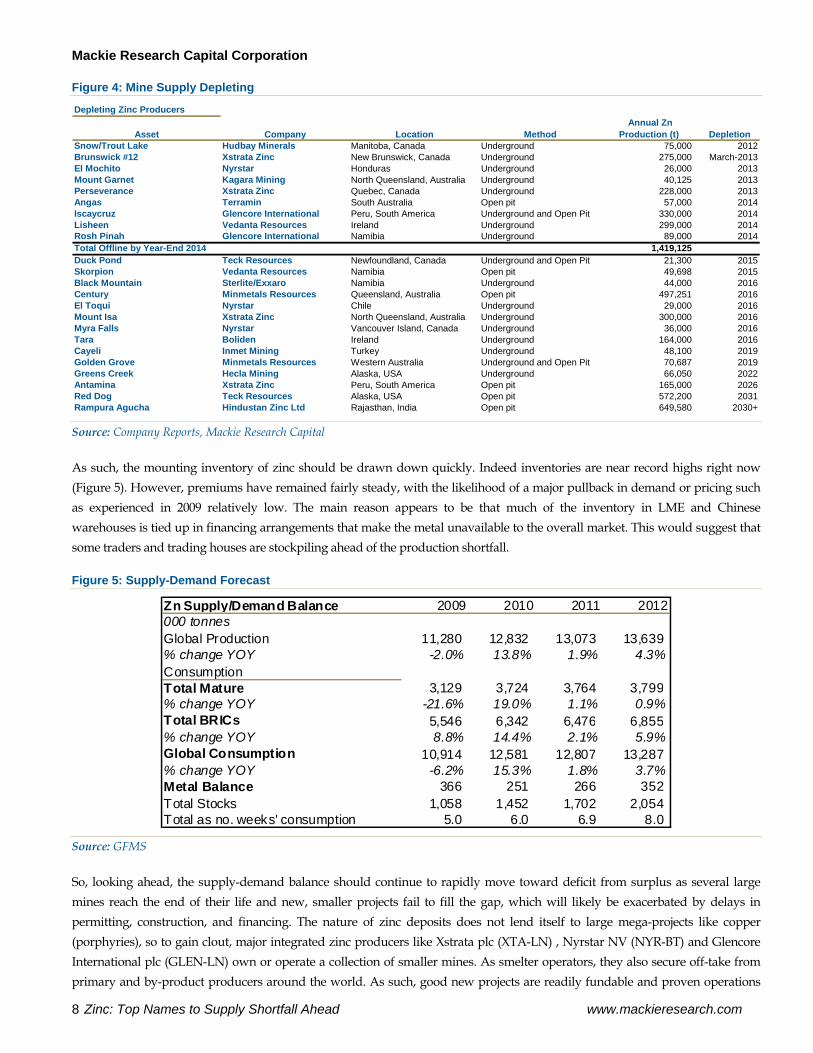
The delay in an economic turnaround has contributed to rising zinc inventories, which are currently at multi-year highs (Figure 3), but the outlook for zinc prices remains positive, citing a drastic tightening of supply from 2013. As shown in Figure 4, a significant amount of supply, approximately 12%-14%, is expected to come off the market in 2013 and 2014, which should lead to a supply-demand imbalance.
Figure 3: 20-Year Zinc Price and Inventory Moves
Zinc Price and Inventories
$0.00
$0.50
$1.00
$1.50
$2.00
$2.50
Aug
-92
May
-93
Mar
-94
Dec
-94
Sep
-95
Jun-
96
Mar
-97
Jan-
98
Oct
-98
Jul-9
9
Apr
-00
Jan-
01
Nov
-01
Aug
-02
May
-03
Feb-
04
Nov
-04
Sep
-05
Jun-
06
Mar
-07
Dec
-07
Sep
-08
Jul-0
9
Apr
-10
Jan-
11
Oct
-11
Jul-1
2
Pric
e ($
/lb)
0
200
400
600
800
1,000
1,200
1,400
Inve
ntor
ies
('000
tonn
es)
Tonnes ('000) Price
Source: Bloomberg, Mackie Research Capital
Mackie Research Capital Corporation
8 Zinc: Top Names to Supply Shortfall Ahead www.mackieresearch.com
Figure 4: Mine Supply Depleting
Depleting Zinc Producers
Snow/Trout Lake Hudbay Minerals Manitoba, Canada Underground 75,000 2012Brunswick #12 Xstrata Zinc New Brunswick, Canada Underground 275,000 March-2013El Mochito Nyrstar Honduras Underground 26,000 2013Mount Garnet Kagara Mining North Queensland, Australia Underground 40,125 2013Perseverance Xstrata Zinc Quebec, Canada Underground 228,000 2013Angas Terramin South Australia Open pit 57,000 2014Iscaycruz Glencore International Peru, South America Underground and Open Pit 330,000 2014Lisheen Vedanta Resources Ireland Underground 299,000 2014Rosh Pinah Glencore International Namibia Underground 89,000 2014Total Offline by Year-End 2014 1,419,125 Duck Pond Teck Resources Newfoundland, Canada Underground and Open Pit 21,300 2015Skorpion Vedanta Resources Namibia Open pit 49,698 2015Black Mountain Sterlite/Exxaro Namibia Underground 44,000 2016Century Minmetals Resources Queensland, Australia Open pit 497,251 2016El Toqui Nyrstar Chile Underground 29,000 2016Mount Isa Xstrata Zinc North Queensland, Australia Underground 300,000 2016Myra Falls Nyrstar Vancouver Island, Canada Underground 36,000 2016Tara Boliden Ireland Underground 164,000 2016Cayeli Inmet Mining Turkey Underground 48,100 2019Golden Grove Minmetals Resources Western Australia Underground and Open Pit 70,687 2019Greens Creek Hecla Mining Alaska, USA Underground 66,050 2022Antamina Xstrata Zinc Peru, South America Open pit 165,000 2026Red Dog Teck Resources Alaska, USA Open pit 572,200 2031Rampura Agucha Hindustan Zinc Ltd Rajasthan, India Open pit 649,580 2030+
Annual Zn Production (t) Depletion MethodAsset Company Location
Source: Company Reports, Mackie Research Capital
As such, the mounting inventory of zinc should be drawn down quickly. Indeed inventories are near record highs right now (Figure 5). However, premiums have remained fairly steady, with the likelihood of a major pullback in demand or pricing such as experienced in 2009 relatively low. The main reason appears to be that much of the inventory in LME and Chinese warehouses is tied up in financing arrangements that make the metal unavailable to the overall market. This would suggest that some traders and trading houses are stockpiling ahead of the production shortfall.
Figure 5: Supply-Demand Forecast
Zn Supply/Demand Balance 2009 2010 2011 2012000 tonnesGlobal Production 11,280 12,832 13,073 13,639 % change YOY -2.0% 13.8% 1.9% 4.3%ConsumptionTotal Mature 3,129 3,724 3,764 3,799 % change YOY -21.6% 19.0% 1.1% 0.9%Total BRICs 5,546 6,342 6,476 6,855 % change YOY 8.8% 14.4% 2.1% 5.9%Global Consumption 10,914 12,581 12,807 13,287 % change YOY -6.2% 15.3% 1.8% 3.7%Metal Balance 366 251 266 352 Total Stocks 1,058 1,452 1,702 2,054 Total as no. weeks' consumption 5.0 6.0 6.9 8.0
Source: GFMS
So, looking ahead, the supply-demand balance should continue to rapidly move toward deficit from surplus as several large mines reach the end of their life and new, smaller projects fail to fill the gap, which will likely be exacerbated by delays in permitting, construction, and financing. The nature of zinc deposits does not lend itself to large mega-projects like copper (porphyries), so to gain clout, major integrated zinc producers like Xstrata plc (XTA-LN) , Nyrstar NV (NYR-BT) and Glencore International plc (GLEN-LN) own or operate a collection of smaller mines. As smelter operators, they also secure off-take from primary and by-product producers around the world. As such, good new projects are readily fundable and proven operations
Mackie Research Capital Corporation
www.mackieresearch.com Zinc: Top Names to Supply Shortfall Ahead 9
do not last long before being acquired. In the last five years, we have seen several zinc-levered producers be acquired, including Breakwater Resources and Farallon Mining (both acquired by Nyrstar), as well as development projects like Hackett River in Nunavut (discussed further below). Given that the pipeline of projects remains insufficient to meet demand, we would expect to see continued M&A activity driven by cash-rich producers once significantly de-risked.
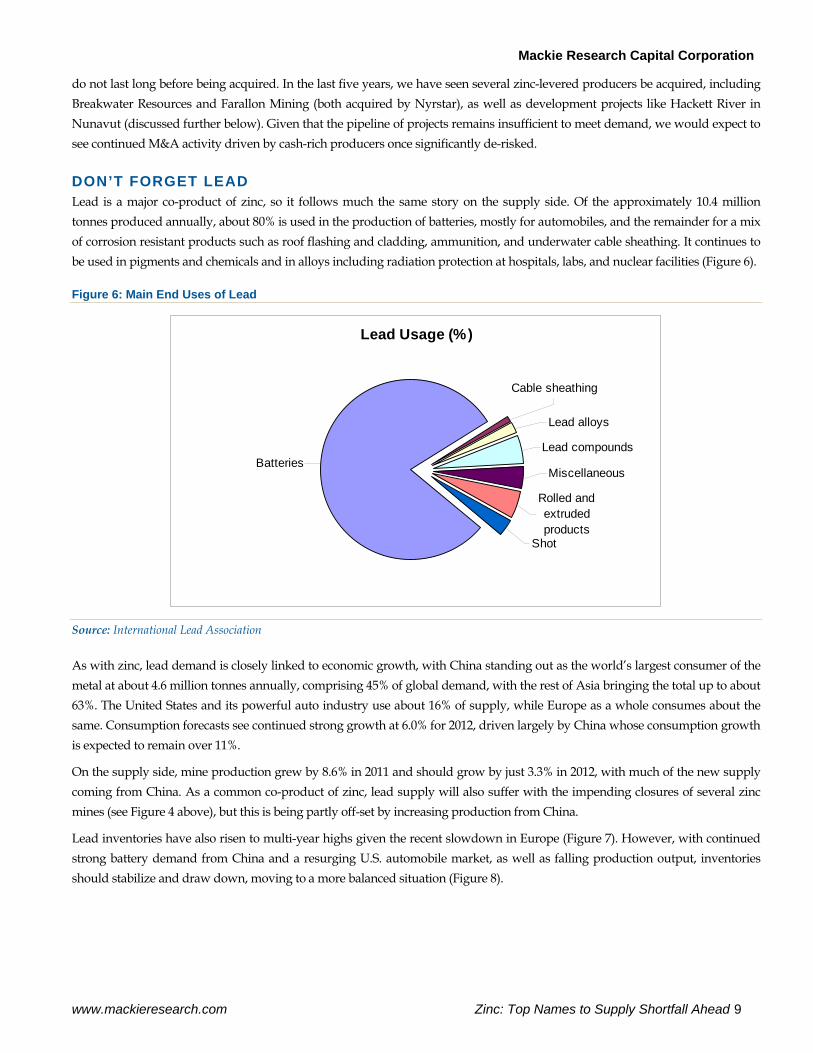
DON’T FORGET LEAD Lead is a major co-product of zinc, so it follows much the same story on the supply side. Of the approximately 10.4 million tonnes produced annually, about 80% is used in the production of batteries, mostly for automobiles, and the remainder for a mix of corrosion resistant products such as roof flashing and cladding, ammunition, and underwater cable sheathing. It continues to be used in pigments and chemicals and in alloys including radiation protection at hospitals, labs, and nuclear facilities (Figure 6).
Figure 6: Main End Uses of Lead
Lead Usage (%)
Rolled and extruded products
Batteries
Lead alloys
Cable sheathing
Lead compounds
Miscellaneous
Shot
Source: International Lead Association
As with zinc, lead demand is closely linked to economic growth, with China standing out as the world’s largest consumer of the metal at about 4.6 million tonnes annually, comprising 45% of global demand, with the rest of Asia bringing the total up to about 63%. The United States and its powerful auto industry use about 16% of supply, while Europe as a whole consumes about the same. Consumption forecasts see continued strong growth at 6.0% for 2012, driven largely by China whose consumption growth is expected to remain over 11%.
On the supply side, mine production grew by 8.6% in 2011 and should grow by just 3.3% in 2012, with much of the new supply coming from China. As a common co-product of zinc, lead supply will also suffer with the impending closures of several zinc mines (see Figure 4 above), but this is being partly off-set by increasing production from China.
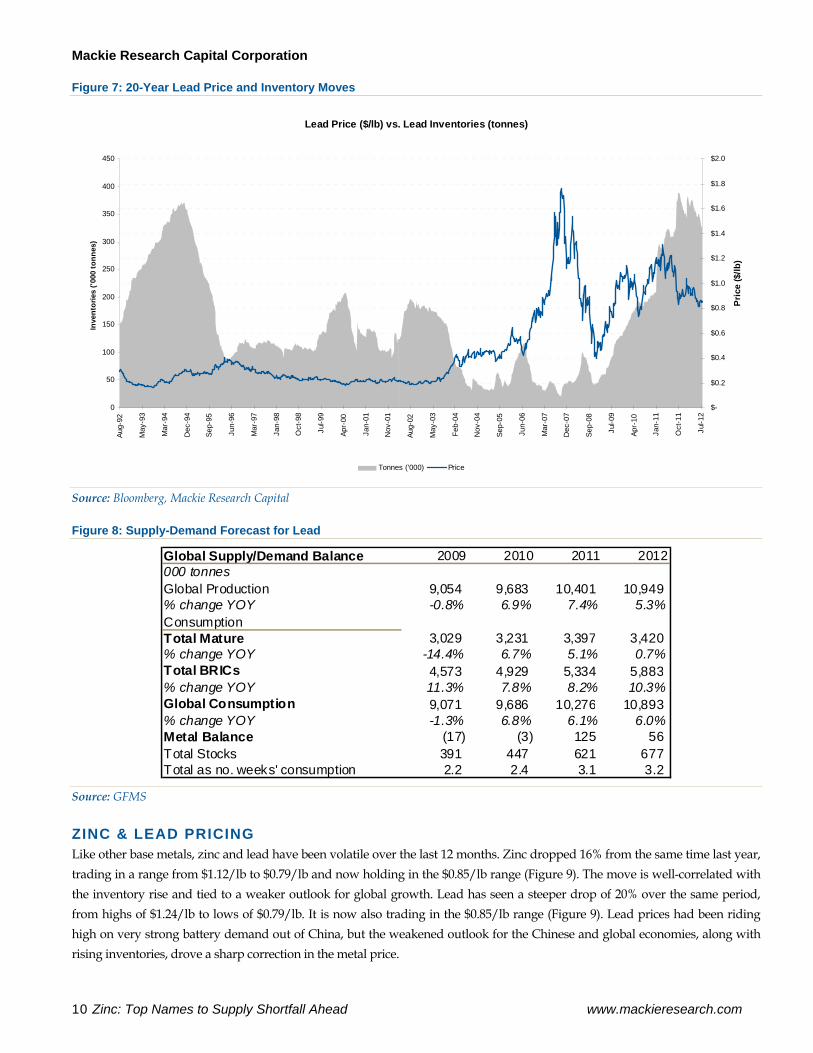
Lead inventories have also risen to multi-year highs given the recent slowdown in Europe (Figure 7). However, with continued strong battery demand from China and a resurging U.S. automobile market, as well as falling production output, inventories should stabilize and draw down, moving to a more balanced situation (Figure 8).
Mackie Research Capital Corporation
10 Zinc: Top Names to Supply Shortfall Ahead www.mackieresearch.com
Figure 7: 20-Year Lead Price and Inventory Moves
Lead Price ($/lb) vs. Lead Inventories (tonnes)
$-
$0.2
$0.4
$0.6
$0.8
$1.0
$1.2
$1.4
$1.6
$1.8
$2.0
Aug-
92
May
-93
Mar
-94
Dec
-94
Sep-
95
Jun-
96
Mar
-97
Jan-
98
Oct
-98
Jul-9
9
Apr-
00
Jan-
01
Nov
-01
Aug-
02
May
-03
Feb-
04
Nov
-04
Sep-
05
Jun-
06
Mar
-07
Dec
-07
Sep-
08
Jul-0
9
Apr-
10
Jan-
11
Oct
-11
Jul-1
2
Pric
e ($
/lb)
0
50
100
150
200
250
300
350
400
450
Inve
ntor
ies
('000
tonn
es)
Tonnes ('000) Price
Source: Bloomberg, Mackie Research Capital
Figure 8: Supply-Demand Forecast for Lead
Global Supply/Demand Balance 2009 2010 2011 2012000 tonnesGlobal Production 9,054 9,683 10,401 10,949 % change YOY -0.8% 6.9% 7.4% 5.3%ConsumptionTotal Mature 3,029 3,231 3,397 3,420 % change YOY -14.4% 6.7% 5.1% 0.7%Total BRICs 4,573 4,929 5,334 5,883 % change YOY 11.3% 7.8% 8.2% 10.3%Global Consumption 9,071 9,686 10,276 10,893 % change YOY -1.3% 6.8% 6.1% 6.0%Metal Balance (17) (3) 125 56 Total Stocks 391 447 621 677 Total as no. weeks' consumption 2.2 2.4 3.1 3.2
Source: GFMS
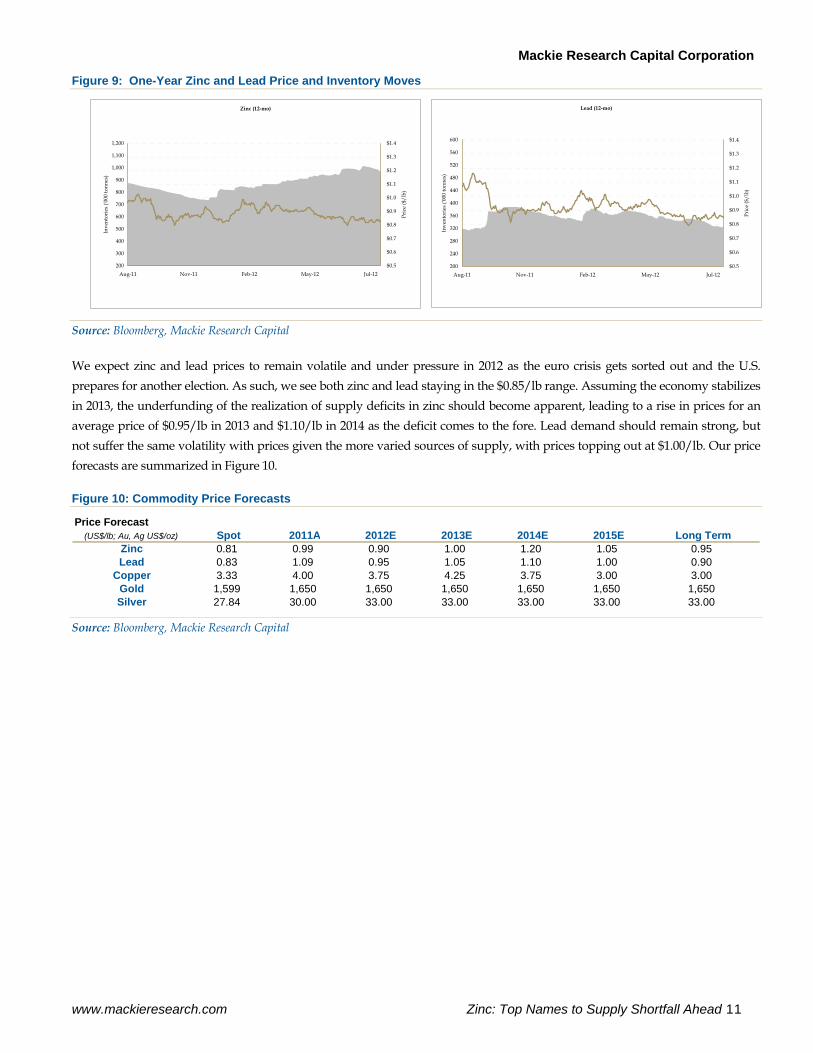
ZINC & LEAD PRICING Like other base metals, zinc and lead have been volatile over the last 12 months. Zinc dropped 16% from the same time last year, trading in a range from $1.12/lb to $0.79/lb and now holding in the $0.85/lb range (Figure 9). The move is well-correlated with the inventory rise and tied to a weaker outlook for global growth. Lead has seen a steeper drop of 20% over the same period, from highs of $1.24/lb to lows of $0.79/lb. It is now also trading in the $0.85/lb range (Figure 9). Lead prices had been riding high on very strong battery demand out of China, but the weakened outlook for the Chinese and global economies, along with rising inventories, drove a sharp correction in the metal price.
Mackie Research Capital Corporation
www.mackieresearch.com Zinc: Top Names to Supply Shortfall Ahead 11
Figure 9: One-Year Zinc and Lead Price and Inventory Moves
Zinc (12-mo)
$0.5
$0.6
$0.7
$0.8
$0.9
$1.0
$1.1
$1.2
$1.3
$1.4
Aug-11 Nov-11 Feb-12 May-12 Jul-12
Pric
e ($
/lb)
200
300
400
500
600
700
800
900
1,000
1,100
1,200
Inve
ntor
ies (
'000
tonn
es)
Lead (12-mo)
$0.5
$0.6
$0.7
$0.8
$0.9
$1.0
$1.1
$1.2
$1.3
$1.4
Aug-11 Nov-11 Feb-12 May-12 Jul-12
Pric
e ($
/lb)
200
240
280
320
360
400
440
480
520
560
600
Inve
ntor
ies (
'000
tonn
es)
Source: Bloomberg, Mackie Research Capital
We expect zinc and lead prices to remain volatile and under pressure in 2012 as the euro crisis gets sorted out and the U.S. prepares for another election. As such, we see both zinc and lead staying in the $0.85/lb range. Assuming the economy stabilizes in 2013, the underfunding of the realization of supply deficits in zinc should become apparent, leading to a rise in prices for an average price of $0.95/lb in 2013 and $1.10/lb in 2014 as the deficit comes to the fore. Lead demand should remain strong, but not suffer the same volatility with prices given the more varied sources of supply, with prices topping out at $1.00/lb. Our price forecasts are summarized in Figure 10.
Figure 10: Commodity Price Forecasts
Price Forecast(US$/lb; Au, Ag US$/oz) Spot 2011A 2012E 2013E 2014E 2015E Long Term
Zinc 0.81 0.99 0.90 1.00 1.20 1.05 0.95Lead 0.83 1.09 0.95 1.05 1.10 1.00 0.90
Copper 3.33 4.00 3.75 4.25 3.75 3.00 3.00Gold 1,599 1,650 1,650 1,650 1,650 1,650 1,650Silver 27.84 30.00 33.00 33.00 33.00 33.00 33.00
Source: Bloomberg, Mackie Research Capital
Mackie Research Capital Corporation
12 Zinc: Top Names to Supply Shortfall Ahead www.mackieresearch.com
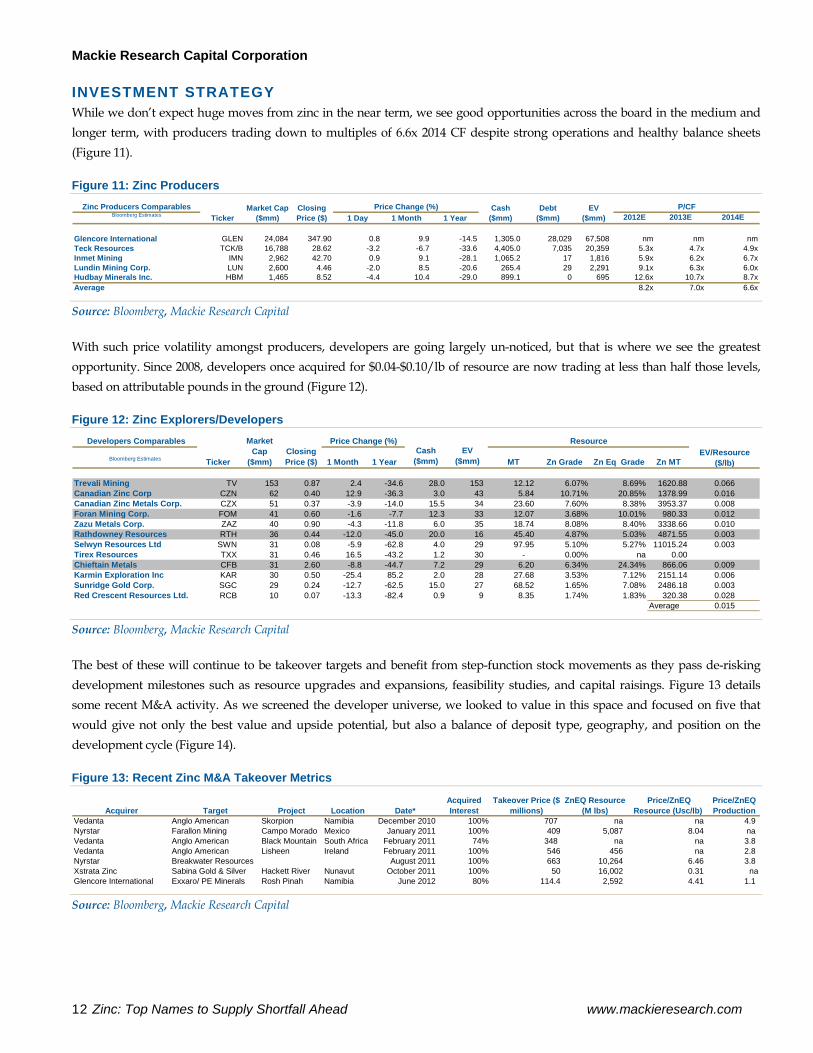
INVESTMENT STRATEGY While we don’t expect huge moves from zinc in the near term, we see good opportunities across the board in the medium and longer term, with producers trading down to multiples of 6.6x 2014 CF despite strong operations and healthy balance sheets (Figure 11).
Figure 11: Zinc Producers Zinc Producers Comparables
Bloomberg Estimates 1 Day 1 Month 1 Year 2012E 2013E 2014E
Glencore International GLEN 24,084 347.90 0.8 9.9 -14.5 1,305.0 28,029 67,508 nm nm nmTeck Resources TCK/B 16,788 28.62 -3.2 -6.7 -33.6 4,405.0 7,035 20,359 5.3x 4.7x 4.9xInmet Mining IMN 2,962 42.70 0.9 9.1 -28.1 1,065.2 17 1,816 5.9x 6.2x 6.7xLundin Mining Corp. LUN 2,600 4.46 -2.0 8.5 -20.6 265.4 29 2,291 9.1x 6.3x 6.0xHudbay Minerals Inc. HBM 1,465 8.52 -4.4 10.4 -29.0 899.1 0 695 12.6x 10.7x 8.7xAverage 8.2x 7.0x 6.6x
P/CFTicker
Market Cap ($mm)
Closing Price ($)
Price Change (%) Cash ($mm)
Debt ($mm)
EV ($mm)
Source: Bloomberg, Mackie Research Capital
With such price volatility amongst producers, developers are going largely un-noticed, but that is where we see the greatest opportunity. Since 2008, developers once acquired for $0.04-$0.10/lb of resource are now trading at less than half those levels, based on attributable pounds in the ground (Figure 12).
Figure 12: Zinc Explorers/Developers Developers Comparables
Bloomberg Estimates 1 Month 1 YearCash
($mm)EV
($mm) MT Zn Grade Zn Eq Grade Zn MTEV/Resource
($/lb)
Trevali Mining TV 153 0.87 2.4 -34.6 28.0 153 12.12 6.07% 8.69% 1620.88 0.066Canadian Zinc Corp CZN 62 0.40 12.9 -36.3 3.0 43 5.84 10.71% 20.85% 1378.99 0.016Canadian Zinc Metals Corp. CZX 51 0.37 -3.9 -14.0 15.5 34 23.60 7.60% 8.38% 3953.37 0.008Foran Mining Corp. FOM 41 0.60 -1.6 -7.7 12.3 33 12.07 3.68% 10.01% 980.33 0.012Zazu Metals Corp. ZAZ 40 0.90 -4.3 -11.8 6.0 35 18.74 8.08% 8.40% 3338.66 0.010Rathdowney Resources RTH 36 0.44 -12.0 -45.0 20.0 16 45.40 4.87% 5.03% 4871.55 0.003Selwyn Resources Ltd SWN 31 0.08 -5.9 -62.8 4.0 29 97.95 5.10% 5.27% 11015.24 0.003Tirex Resources TXX 31 0.46 16.5 -43.2 1.2 30 - 0.00% na 0.00Chieftain Metals CFB 31 2.60 -8.8 -44.7 7.2 29 6.20 6.34% 24.34% 866.06 0.009Karmin Exploration Inc KAR 30 0.50 -25.4 85.2 2.0 28 27.68 3.53% 7.12% 2151.14 0.006Sunridge Gold Corp. SGC 29 0.24 -12.7 -62.5 15.0 27 68.52 1.65% 7.08% 2486.18 0.003Red Crescent Resources Ltd. RCB 10 0.07 -13.3 -82.4 0.9 9 8.35 1.74% 1.83% 320.38 0.028
Average 0.015
Price Change (%) Resource
Ticker
Market Cap
($mm)Closing Price ($)
Source: Bloomberg, Mackie Research Capital
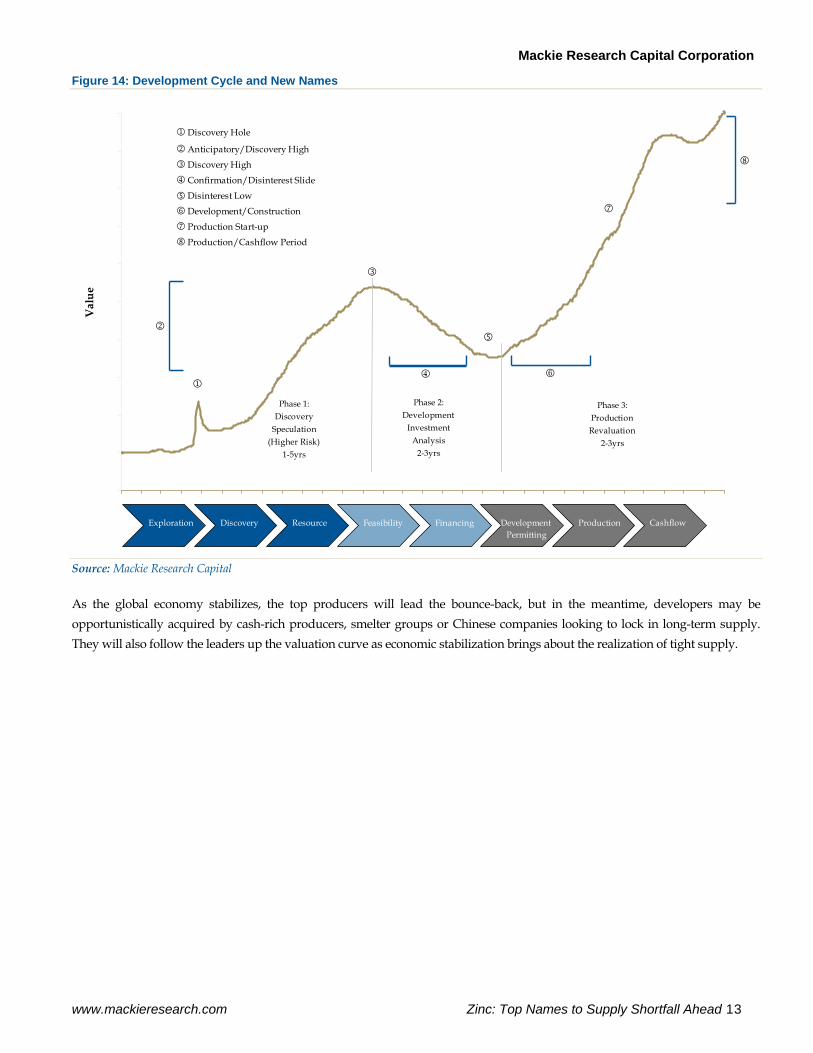
The best of these will continue to be takeover targets and benefit from step-function stock movements as they pass de-risking development milestones such as resource upgrades and expansions, feasibility studies, and capital raisings. Figure 13 details some recent M&A activity. As we screened the developer universe, we looked to value in this space and focused on five that would give not only the best value and upside potential, but also a balance of deposit type, geography, and position on the development cycle (Figure 14).
Figure 13: Recent Zinc M&A Takeover Metrics
Vedanta Anglo American Skorpion Namibia December 2010 100% 707 na na 4.9 Nyrstar Farallon Mining Campo Morado Mexico January 2011 100% 409 5,087 8.04 naVedanta Anglo American Black Mountain South Africa February 2011 74% 348 na na 3.8 Vedanta Anglo American Lisheen Ireland February 2011 100% 546 456 na 2.8 Nyrstar Breakwater Resources August 2011 100% 663 10,264 6.46 3.8 Xstrata Zinc Sabina Gold & Silver Hackett River Nunavut October 2011 100% 50 16,002 0.31 naGlencore International Exxaro/ PE Minerals Rosh Pinah Namibia June 2012 80% 114.4 2,592 4.41 1.1
Price/ZnEQ ProductionAcquirer ProjectTarget Date*
Acquired InterestLocation
Takeover Price ($ millions)
Price/ZnEQ Resource (Usc/lb)
ZnEQ Resource (M lbs)
Source: Bloomberg, Mackie Research Capital
Mackie Research Capital Corporation
www.mackieresearch.com Zinc: Top Names to Supply Shortfall Ahead 13
Figure 14: Development Cycle and New Names
0
1
2
3
4
5
6
7
8
9
10
Val
ue
Phase 1:Discovery
Speculation (Higher Risk)
1-5yrs
Phase 2:Development
Investment Analysis
2-3yrs
Phase 3:ProductionRevaluation
2-3yrs
1
2
3
4
7
8
1 Discovery Hole
2 Anticipatory/Discovery High
3 Discovery High
4 Confirmation/Disinterest Slide Disinterest Low
6 Development/Construction
7 Production Start-up
8 Production/Cashflow Period
6
Exploration Discovery Resource Feasibility Financing Development Permitting
Production Cashflow
Source: Mackie Research Capital
As the global economy stabilizes, the top producers will lead the bounce-back, but in the meantime, developers may be opportunistically acquired by cash-rich producers, smelter groups or Chinese companies looking to lock in long-term supply. They will also follow the leaders up the valuation curve as economic stabilization brings about the realization of tight supply.
Mackie Research Capital Corporation
14 Zinc: Top Names to Supply Shortfall Ahead www.mackieresearch.com
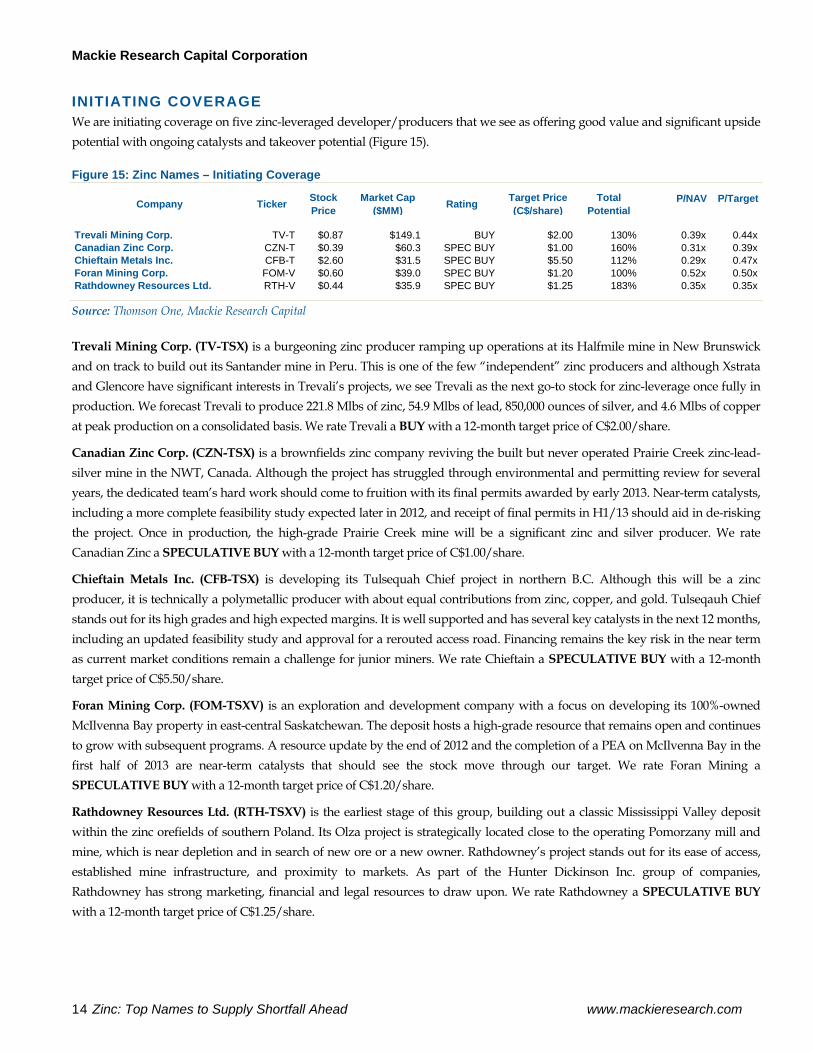
INITIATING COVERAGE We are initiating coverage on five zinc-leveraged developer/producers that we see as offering good value and significant upside potential with ongoing catalysts and takeover potential (Figure 15).
Figure 15: Zinc Names – Initiating Coverage
Company Ticker Stock Price
Market Cap ($MM) Rating Target Price
(C$/share)Total
Potential P/NAV P/Target
Trevali Mining Corp. TV-T $0.87 $149.1 BUY $2.00 130% 0.39x 0.44xCanadian Zinc Corp. CZN-T $0.39 $60.3 SPEC BUY $1.00 160% 0.31x 0.39xChieftain Metals Inc. CFB-T $2.60 $31.5 SPEC BUY $5.50 112% 0.29x 0.47xForan Mining Corp. FOM-V $0.60 $39.0 SPEC BUY $1.20 100% 0.52x 0.50xRathdowney Resources Ltd. RTH-V $0.44 $35.9 SPEC BUY $1.25 183% 0.35x 0.35x Source: Thomson One, Mackie Research Capital
Trevali Mining Corp. (TV-TSX) is a burgeoning zinc producer ramping up operations at its Halfmile mine in New Brunswick and on track to build out its Santander mine in Peru. This is one of the few “independent” zinc producers and although Xstrata and Glencore have significant interests in Trevali’s projects, we see Trevali as the next go-to stock for zinc-leverage once fully in production. We forecast Trevali to produce 221.8 Mlbs of zinc, 54.9 Mlbs of lead, 850,000 ounces of silver, and 4.6 Mlbs of copper at peak production on a consolidated basis. We rate Trevali a BUY with a 12-month target price of C$2.00/share.
Canadian Zinc Corp. (CZN-TSX) is a brownfields zinc company reviving the built but never operated Prairie Creek zinc-lead-silver mine in the NWT, Canada. Although the project has struggled through environmental and permitting review for several years, the dedicated team’s hard work should come to fruition with its final permits awarded by early 2013. Near-term catalysts, including a more complete feasibility study expected later in 2012, and receipt of final permits in H1/13 should aid in de-risking the project. Once in production, the high-grade Prairie Creek mine will be a significant zinc and silver producer. We rate Canadian Zinc a SPECULATIVE BUY with a 12-month target price of C$1.00/share.
Chieftain Metals Inc. (CFB-TSX) is developing its Tulsequah Chief project in northern B.C. Although this will be a zinc producer, it is technically a polymetallic producer with about equal contributions from zinc, copper, and gold. Tulseqauh Chief stands out for its high grades and high expected margins. It is well supported and has several key catalysts in the next 12 months, including an updated feasibility study and approval for a rerouted access road. Financing remains the key risk in the near term as current market conditions remain a challenge for junior miners. We rate Chieftain a SPECULATIVE BUY with a 12-month target price of C$5.50/share.
Foran Mining Corp. (FOM-TSXV) is an exploration and development company with a focus on developing its 100%-owned McIlvenna Bay property in east-central Saskatchewan. The deposit hosts a high-grade resource that remains open and continues to grow with subsequent programs. A resource update by the end of 2012 and the completion of a PEA on McIlvenna Bay in the first half of 2013 are near-term catalysts that should see the stock move through our target. We rate Foran Mining a SPECULATIVE BUY with a 12-month target price of C$1.20/share.
Rathdowney Resources Ltd. (RTH-TSXV) is the earliest stage of this group, building out a classic Mississippi Valley deposit within the zinc orefields of southern Poland. Its Olza project is strategically located close to the operating Pomorzany mill and mine, which is near depletion and in search of new ore or a new owner. Rathdowney’s project stands out for its ease of access, established mine infrastructure, and proximity to markets. As part of the Hunter Dickinson Inc. group of companies, Rathdowney has strong marketing, financial and legal resources to draw upon. We rate Rathdowney a SPECULATIVE BUY with a 12-month target price of C$1.25/share.
Mackie Research Capital Corporation
www.mackieresearch.com Zinc: Top Names to Supply Shortfall Ahead 15
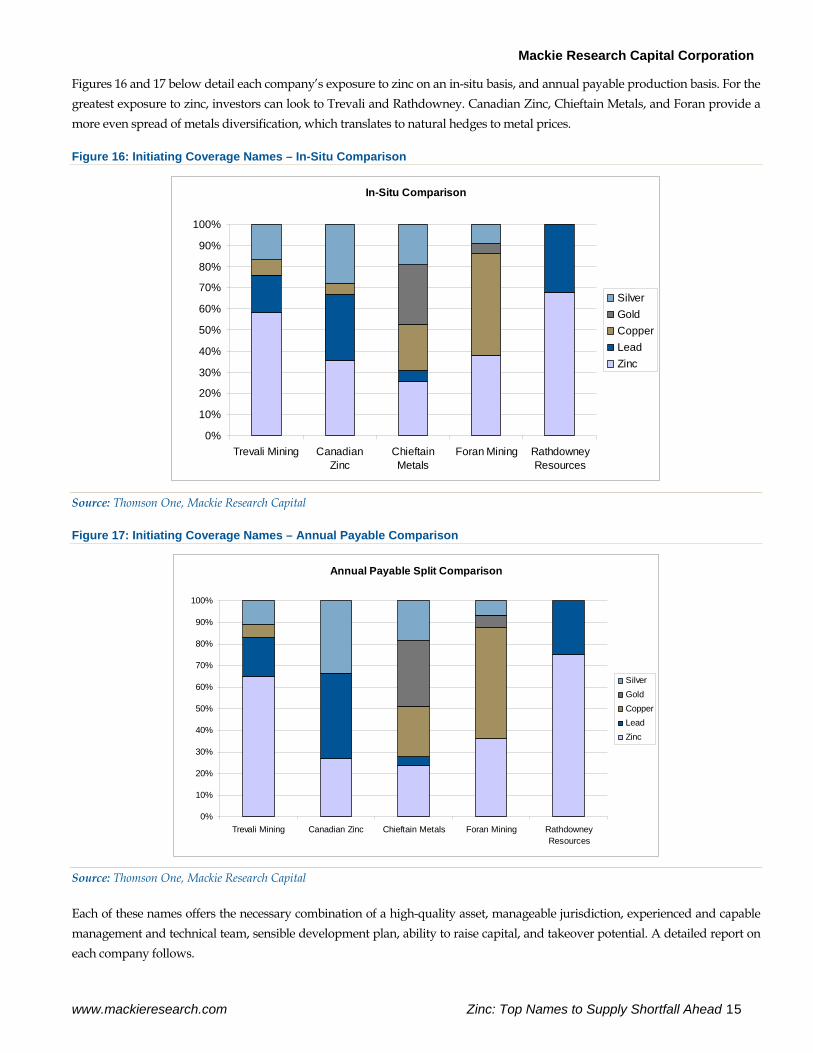
Figures 16 and 17 below detail each company’s exposure to zinc on an in-situ basis, and annual payable production basis. For the greatest exposure to zinc, investors can look to Trevali and Rathdowney. Canadian Zinc, Chieftain Metals, and Foran provide a more even spread of metals diversification, which translates to natural hedges to metal prices.
Figure 16: Initiating Coverage Names – In-Situ Comparison
In-Situ Comparison
0%
10%
20%
30%
40%
50%
60%
70%
80%
90%
100%
Trevali Mining CanadianZinc
ChieftainMetals
Foran Mining RathdowneyResources
SilverGoldCopperLeadZinc
Source: Thomson One, Mackie Research Capital
Figure 17: Initiating Coverage Names – Annual Payable Comparison
Annual Payable Split Comparison
0%
10%
20%
30%
40%
50%
60%
70%
80%
90%
100%
Trevali Mining Canadian Zinc Chieftain Metals Foran Mining RathdowneyResources
SilverGoldCopperLeadZinc
Source: Thomson One, Mackie Research Capital
Each of these names offers the necessary combination of a high-quality asset, manageable jurisdiction, experienced and capable management and technical team, sensible development plan, ability to raise capital, and takeover potential. A detailed report on each company follows.

Mackie Research Capital Corporation
16 Zinc: Top Names to Supply Shortfall Ahead www.mackieresearch.com
This page left intentionally blank.
Mackie Research Capital Corporation
www.mackieresearch.com Zinc: Top Names to Supply Shortfall Ahead 17
I N V E S T M E N T H I G H L I G H T S
TREVALI MINING CORP. Burgeoning Zinc Producer in Established Mining Camps
TV - TSX $0.87TARGET: $2.00PROJ. RETURN: 130%
VALUATION: 4.0x P/CFShare DataBasic Shares O/S (mm) 175.4Fully Diluted (mm) 205.7Market Cap ($mm) 152.6Enterprise Value ($mm) 134.8Cash ($mm) 21.6Debt ($mm) 3.8Dividend ($) 0.00Yield (%) 0.0%Next Reporting Date November
$0.00
$0.50
$1.00
$1.50
$2.00
Aug-11 Nov-11 Feb-12 May-12 Aug-12
Short-term Technical Target $0.80, next support. TV is weak long-term but is testing resistance at its 50DMA.
Forecast FYE Dec 31 2011A 2012E 2013EProduction 000 Zn lbs - 20,818 76,624 Cash Costs US$/lb $0.00 $0.75 $0.52EPS $/sh n/a $0.01 $0.18P/EPS multiple n/a n/a 4.9xCFPS $/sh n/a $0.03 $0.21P/CFPS multiple n/a 29.3x 4.2x
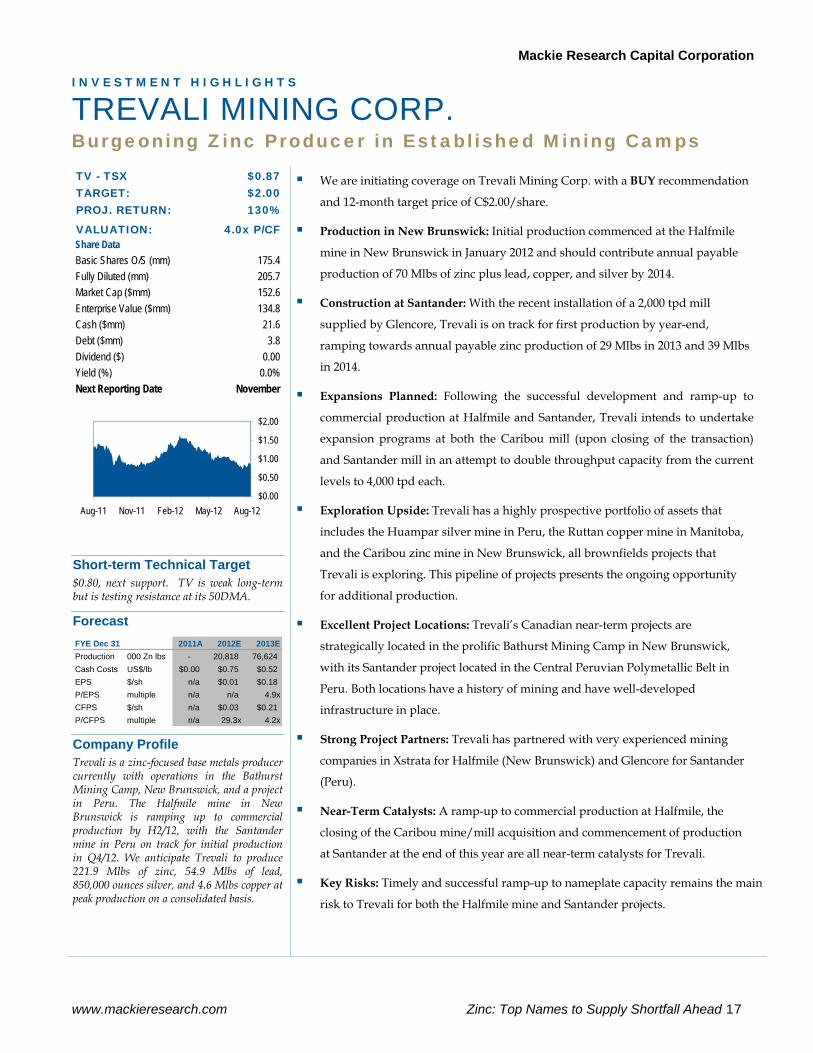
Company Profile Trevali is a zinc-focused base metals producer currently with operations in the Bathurst Mining Camp, New Brunswick, and a project in Peru. The Halfmile mine in New Brunswick is ramping up to commercial production by H2/12, with the Santander mine in Peru on track for initial production in Q4/12. We anticipate Trevali to produce 221.9 Mlbs of zinc, 54.9 Mlbs of lead, 850,000 ounces silver, and 4.6 Mlbs copper at peak production on a consolidated basis.
We are initiating coverage on Trevali Mining Corp. with a BUY recommendation
and 12-month target price of C$2.00/share.
Production in New Brunswick: Initial production commenced at the Halfmile
mine in New Brunswick in January 2012 and should contribute annual payable
production of 70 Mlbs of zinc plus lead, copper, and silver by 2014.
Construction at Santander: With the recent installation of a 2,000 tpd mill
supplied by Glencore, Trevali is on track for first production by year-end,
ramping towards annual payable zinc production of 29 Mlbs in 2013 and 39 Mlbs
in 2014.
Expansions Planned: Following the successful development and ramp-up to
commercial production at Halfmile and Santander, Trevali intends to undertake
expansion programs at both the Caribou mill (upon closing of the transaction)
and Santander mill in an attempt to double throughput capacity from the current
levels to 4,000 tpd each.
Exploration Upside: Trevali has a highly prospective portfolio of assets that
includes the Huampar silver mine in Peru, the Ruttan copper mine in Manitoba,
and the Caribou zinc mine in New Brunswick, all brownfields projects that
Trevali is exploring. This pipeline of projects presents the ongoing opportunity
for additional production.
Excellent Project Locations: Trevali’s Canadian near-term projects are
strategically located in the prolific Bathurst Mining Camp in New Brunswick,
with its Santander project located in the Central Peruvian Polymetallic Belt in
Peru. Both locations have a history of mining and have well-developed
infrastructure in place.
Strong Project Partners: Trevali has partnered with very experienced mining
companies in Xstrata for Halfmile (New Brunswick) and Glencore for Santander
(Peru).
Near-Term Catalysts: A ramp-up to commercial production at Halfmile, the
closing of the Caribou mine/mill acquisition and commencement of production
at Santander at the end of this year are all near-term catalysts for Trevali.
Key Risks: Timely and successful ramp-up to nameplate capacity remains the main
risk to Trevali for both the Halfmile mine and Santander projects.
Mackie Research Capital Corporation
18 Zinc: Top Names to Supply Shortfall Ahead www.mackieresearch.com
INTRODUCTION
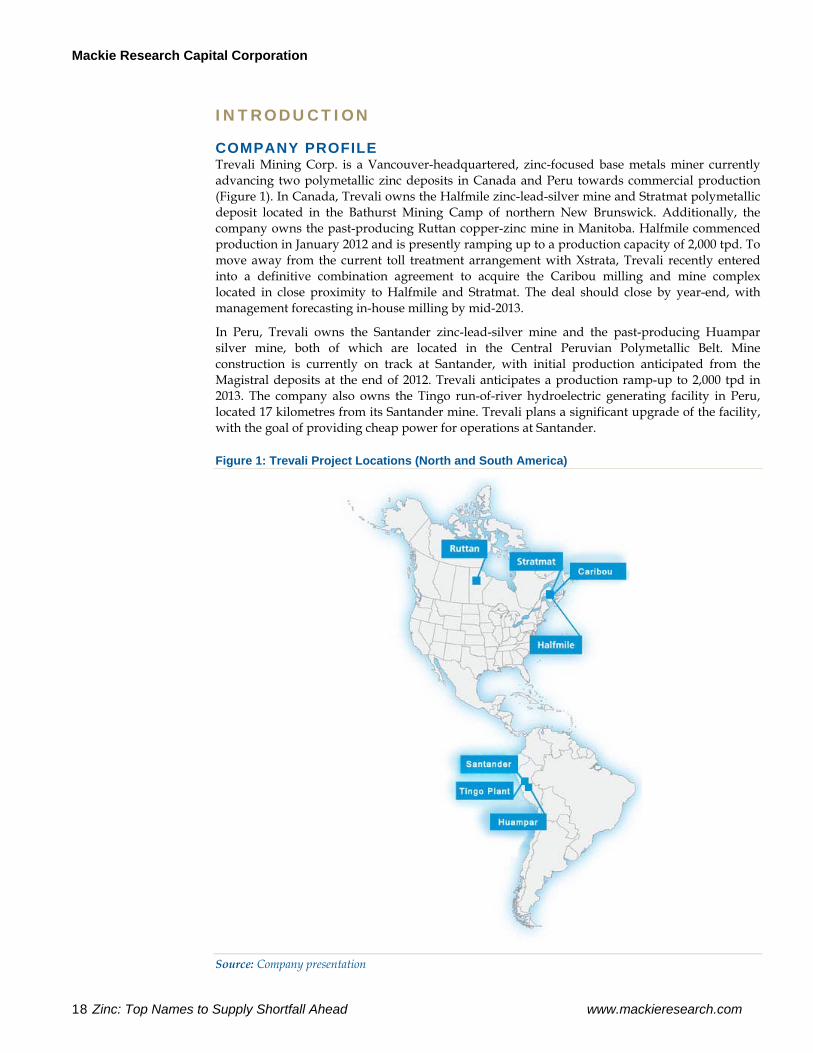
COMPANY PROFILE Trevali Mining Corp. is a Vancouver-headquartered, zinc-focused base metals miner currently advancing two polymetallic zinc deposits in Canada and Peru towards commercial production (Figure 1). In Canada, Trevali owns the Halfmile zinc-lead-silver mine and Stratmat polymetallic deposit located in the Bathurst Mining Camp of northern New Brunswick. Additionally, the company owns the past-producing Ruttan copper-zinc mine in Manitoba. Halfmile commenced production in January 2012 and is presently ramping up to a production capacity of 2,000 tpd. To move away from the current toll treatment arrangement with Xstrata, Trevali recently entered into a definitive combination agreement to acquire the Caribou milling and mine complex located in close proximity to Halfmile and Stratmat. The deal should close by year-end, with management forecasting in-house milling by mid-2013.
In Peru, Trevali owns the Santander zinc-lead-silver mine and the past-producing Huampar silver mine, both of which are located in the Central Peruvian Polymetallic Belt. Mine construction is currently on track at Santander, with initial production anticipated from the Magistral deposits at the end of 2012. Trevali anticipates a production ramp-up to 2,000 tpd in 2013. The company also owns the Tingo run-of-river hydroelectric generating facility in Peru, located 17 kilometres from its Santander mine. Trevali plans a significant upgrade of the facility, with the goal of providing cheap power for operations at Santander.
Figure 1: Trevali Project Locations (North and South America)
Source: Company presentation
Mackie Research Capital Corporation
www.mackieresearch.com Zinc: Top Names to Supply Shortfall Ahead 19
Trevali currently has 175 million basic and 206 million fully diluted shares outstanding, with management and insiders owning about 7.0% of the total shares outstanding. Glencore International is the largest shareholder of Trevali with an interest of 7.8%. The company recently closed a $15.4 million bought deal financing, leading to a healthy current cash position of $21.6 million in the treasury with a very modest $3.8 million in debt. Additionally, the Trevali recently announced it will enter into a $10 million bridge-loan credit facility with Sprott Resource Lending Partnership. The loan will tie them over until a senior, corporate-level debt facility supporting the re-start of the Caribou mill is complete.
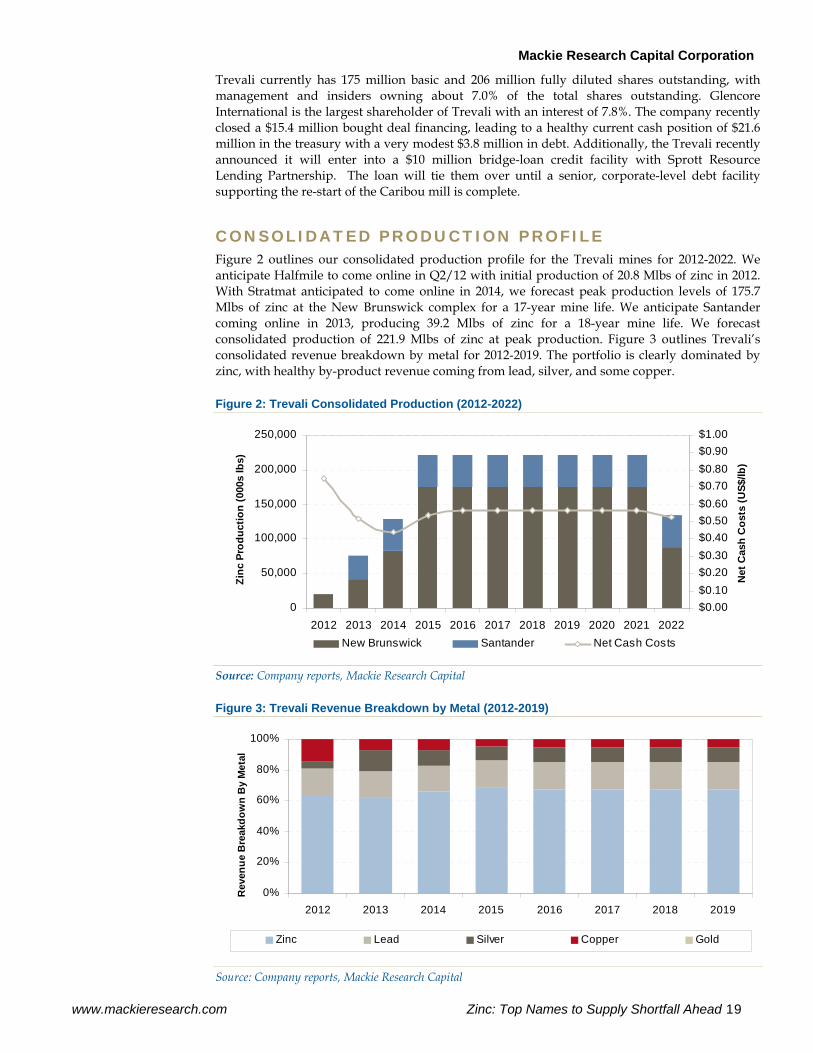
CONSOLIDATED PRODUCTION PROFILE Figure 2 outlines our consolidated production profile for the Trevali mines for 2012-2022. We anticipate Halfmile to come online in Q2/12 with initial production of 20.8 Mlbs of zinc in 2012. With Stratmat anticipated to come online in 2014, we forecast peak production levels of 175.7 Mlbs of zinc at the New Brunswick complex for a 17-year mine life. We anticipate Santander coming online in 2013, producing 39.2 Mlbs of zinc for a 18-year mine life. We forecast consolidated production of 221.9 Mlbs of zinc at peak production. Figure 3 outlines Trevali’s consolidated revenue breakdown by metal for 2012-2019. The portfolio is clearly dominated by zinc, with healthy by-product revenue coming from lead, silver, and some copper.
Figure 2: Trevali Consolidated Production (2012-2022)
0
50,000
100,000
150,000
200,000
250,000
2012 2013 2014 2015 2016 2017 2018 2019 2020 2021 2022
Zinc
Pro
duct
ion
(000
s lb
s)
$0.00$0.10$0.20$0.30$0.40$0.50$0.60$0.70$0.80$0.90$1.00
Net
Cas
h C
osts
(US$
/lb)
New Brunswick Santander Net Cash Costs
Source: Company reports, Mackie Research Capital
Figure 3: Trevali Revenue Breakdown by Metal (2012-2019)
0%
20%
40%
60%
80%
100%
2012 2013 2014 2015 2016 2017 2018 2019
Rev
enue
Bre
akdo
wn
By
Met
al
Zinc Lead Silver Copper Gold
Source: Company reports, Mackie Research Capital
Mackie Research Capital Corporation
20 Zinc: Top Names to Supply Shortfall Ahead www.mackieresearch.com
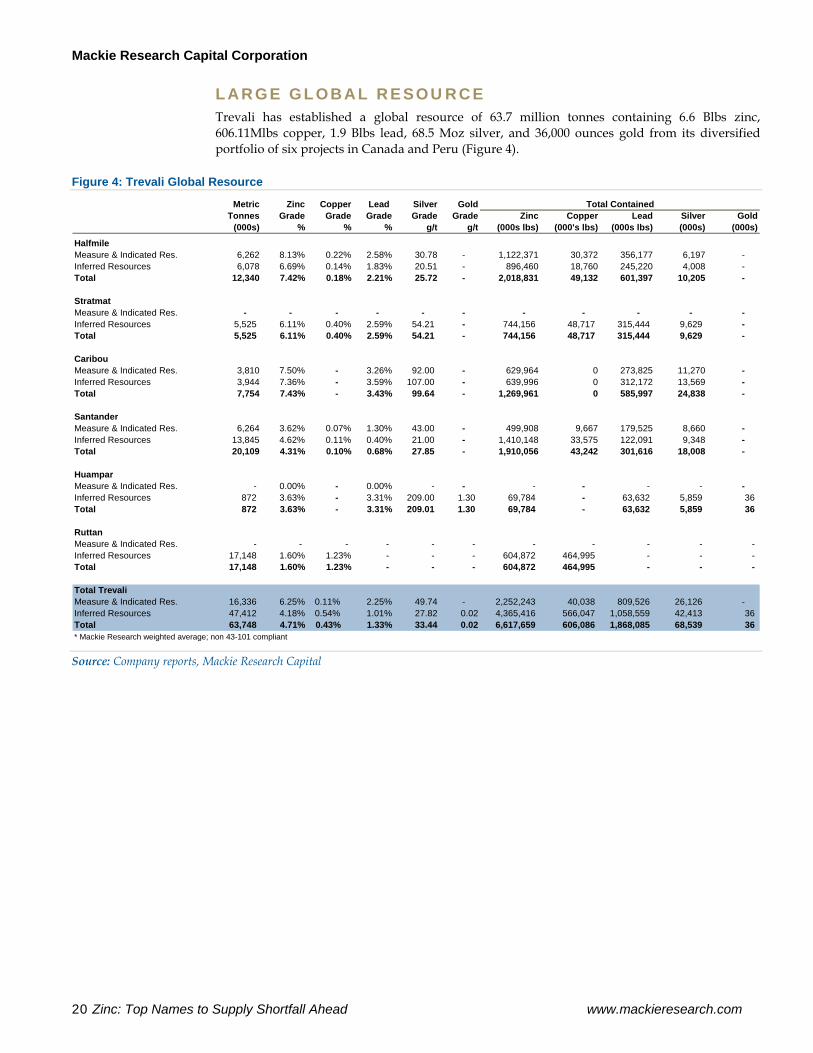
LARGE GLOBAL RESOURCE Trevali has established a global resource of 63.7 million tonnes containing 6.6 Blbs zinc, 606.11Mlbs copper, 1.9 Blbs lead, 68.5 Moz silver, and 36,000 ounces gold from its diversified portfolio of six projects in Canada and Peru (Figure 4).
Figure 4: Trevali Global Resource
Metric Zinc Copper Lead Silver GoldTonnes Grade Grade Grade Grade Grade Zinc Copper Lead Silver Gold
(000s) % % % g/t g/t (000s lbs) (000's lbs) (000s lbs) (000s) (000s)
HalfmileMeasure & Indicated Res. 6,262 8.13% 0.22% 2.58% 30.78 - 1,122,371 30,372 356,177 6,197 - Inferred Resources 6,078 6.69% 0.14% 1.83% 20.51 - 896,460 18,760 245,220 4,008 - Total 12,340 7.42% 0.18% 2.21% 25.72 - 2,018,831 49,132 601,397 10,205 -
StratmatMeasure & Indicated Res. - - - - - - - - - - - Inferred Resources 5,525 6.11% 0.40% 2.59% 54.21 - 744,156 48,717 315,444 9,629 - Total 5,525 6.11% 0.40% 2.59% 54.21 - 744,156 48,717 315,444 9,629 -
CaribouMeasure & Indicated Res. 3,810 7.50% - 3.26% 92.00 - 629,964 0 273,825 11,270 - Inferred Resources 3,944 7.36% - 3.59% 107.00 - 639,996 0 312,172 13,569 - Total 7,754 7.43% - 3.43% 99.64 - 1,269,961 0 585,997 24,838 -
SantanderMeasure & Indicated Res. 6,264 3.62% 0.07% 1.30% 43.00 - 499,908 9,667 179,525 8,660 - Inferred Resources 13,845 4.62% 0.11% 0.40% 21.00 - 1,410,148 33,575 122,091 9,348 - Total 20,109 4.31% 0.10% 0.68% 27.85 - 1,910,056 43,242 301,616 18,008 -
HuamparMeasure & Indicated Res. - 0.00% - 0.00% - - - - - - - Inferred Resources 872 3.63% - 3.31% 209.00 1.30 69,784 - 63,632 5,859 36 Total 872 3.63% - 3.31% 209.01 1.30 69,784 - 63,632 5,859 36
RuttanMeasure & Indicated Res. - - - - - - - - - - - Inferred Resources 17,148 1.60% 1.23% - - - 604,872 464,995 - - - Total 17,148 1.60% 1.23% - - - 604,872 464,995 - - -
Total TrevaliMeasure & Indicated Res. 16,336 6.25% 0.11% 2.25% 49.74 - 2,252,243 40,038 809,526 26,126 - Inferred Resources 47,412 4.18% 0.54% 1.01% 27.82 0.02 4,365,416 566,047 1,058,559 42,413 36 Total 63,748 4.71% 0.43% 1.33% 33.44 0.02 6,617,659 606,086 1,868,085 68,539 36 * Mackie Research weighted average; non 43-101 compliant
Total Contained
Source: Company reports, Mackie Research Capital
Mackie Research Capital Corporation
www.mackieresearch.com Zinc: Top Names to Supply Shortfall Ahead 21
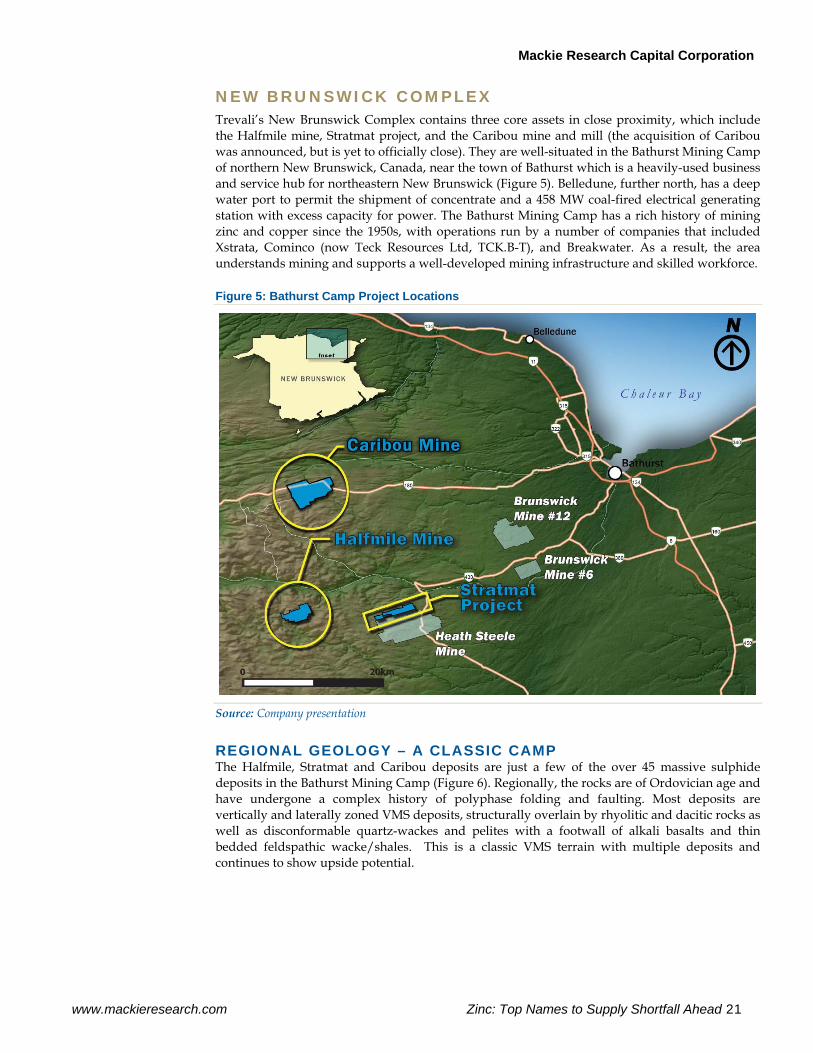
NEW BRUNSWICK COMPLEX Trevali’s New Brunswick Complex contains three core assets in close proximity, which include the Halfmile mine, Stratmat project, and the Caribou mine and mill (the acquisition of Caribou was announced, but is yet to officially close). They are well-situated in the Bathurst Mining Camp of northern New Brunswick, Canada, near the town of Bathurst which is a heavily-used business and service hub for northeastern New Brunswick (Figure 5). Belledune, further north, has a deep water port to permit the shipment of concentrate and a 458 MW coal-fired electrical generating station with excess capacity for power. The Bathurst Mining Camp has a rich history of mining zinc and copper since the 1950s, with operations run by a number of companies that included Xstrata, Cominco (now Teck Resources Ltd, TCK.B-T), and Breakwater. As a result, the area understands mining and supports a well-developed mining infrastructure and skilled workforce.
Figure 5: Bathurst Camp Project Locations
Source: Company presentation
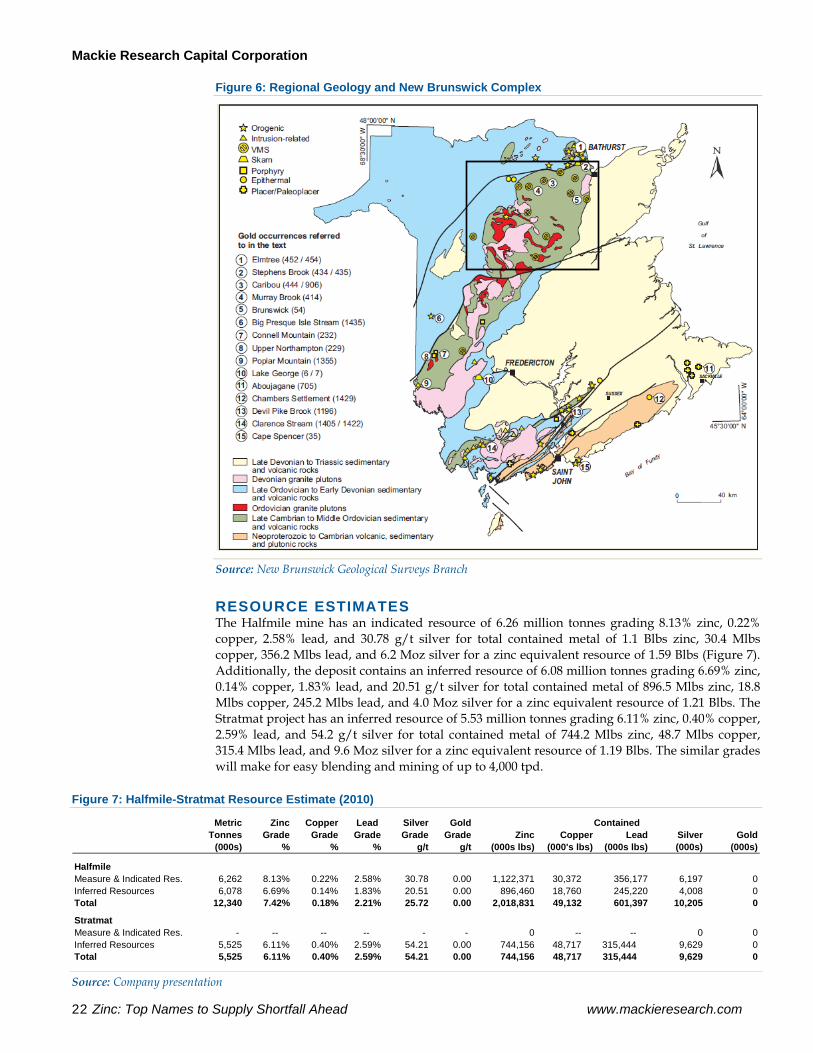
REGIONAL GEOLOGY – A CLASSIC CAMP The Halfmile, Stratmat and Caribou deposits are just a few of the over 45 massive sulphide deposits in the Bathurst Mining Camp (Figure 6). Regionally, the rocks are of Ordovician age and have undergone a complex history of polyphase folding and faulting. Most deposits are vertically and laterally zoned VMS deposits, structurally overlain by rhyolitic and dacitic rocks as well as disconformable quartz-wackes and pelites with a footwall of alkali basalts and thin bedded feldspathic wacke/shales. This is a classic VMS terrain with multiple deposits and continues to show upside potential.
Mackie Research Capital Corporation
22 Zinc: Top Names to Supply Shortfall Ahead www.mackieresearch.com
Figure 6: Regional Geology and New Brunswick Complex
Source: New Brunswick Geological Surveys Branch
RESOURCE ESTIMATES The Halfmile mine has an indicated resource of 6.26 million tonnes grading 8.13% zinc, 0.22% copper, 2.58% lead, and 30.78 g/t silver for total contained metal of 1.1 Blbs zinc, 30.4 Mlbs copper, 356.2 Mlbs lead, and 6.2 Moz silver for a zinc equivalent resource of 1.59 Blbs (Figure 7). Additionally, the deposit contains an inferred resource of 6.08 million tonnes grading 6.69% zinc, 0.14% copper, 1.83% lead, and 20.51 g/t silver for total contained metal of 896.5 Mlbs zinc, 18.8 Mlbs copper, 245.2 Mlbs lead, and 4.0 Moz silver for a zinc equivalent resource of 1.21 Blbs. The Stratmat project has an inferred resource of 5.53 million tonnes grading 6.11% zinc, 0.40% copper, 2.59% lead, and 54.2 g/t silver for total contained metal of 744.2 Mlbs zinc, 48.7 Mlbs copper, 315.4 Mlbs lead, and 9.6 Moz silver for a zinc equivalent resource of 1.19 Blbs. The similar grades will make for easy blending and mining of up to 4,000 tpd.
Figure 7: Halfmile-Stratmat Resource Estimate (2010)
Metric Zinc Copper Lead Silver GoldTonnes Grade Grade Grade Grade Grade Zinc Copper Lead Silver Gold
(000s) % % % g/t g/t (000s lbs) (000's lbs) (000s lbs) (000s) (000s)
HalfmileMeasure & Indicated Res. 6,262 8.13% 0.22% 2.58% 30.78 0.00 1,122,371 30,372 356,177 6,197 0Inferred Resources 6,078 6.69% 0.14% 1.83% 20.51 0.00 896,460 18,760 245,220 4,008 0Total 12,340 7.42% 0.18% 2.21% 25.72 0.00 2,018,831 49,132 601,397 10,205 0
StratmatMeasure & Indicated Res. - -- -- -- - - 0 -- -- 0 0Inferred Resources 5,525 6.11% 0.40% 2.59% 54.21 0.00 744,156 48,717 315,444 9,629 0Total 5,525 6.11% 0.40% 2.59% 54.21 0.00 744,156 48,717 315,444 9,629 0
Contained
Source: Company presentation
Mackie Research Capital Corporation
www.mackieresearch.com Zinc: Top Names to Supply Shortfall Ahead 23
HALFMILE & STRATMAT – A GREAT START Trevali’s New Brunswick properties were heavily explored by Xstrata Zinc and its predecessor companies at intervals since the 1960s. In particular, extensive exploration activity occurred during the 1980s and 1990s when the Heath Steele and Stratmat mines were in production. In 2008, Kria Resources (now Trevali) entered into an agreement with Xstrata Zinc whereby Kria had the right to gain 100% ownership of the Stratmat and Halfmile projects by:
Paying US$18,000,000 (completed)
Issuing units worth a total of C$7,000,000 (completed).
Xstrata maintains the first right and option to purchase all or any portion of the concentrate off-take, as well as a 2% Net Smelter Return (NSR) royalty. In 2010, Kria produced a Preliminary Economic Assessment (PEA) on the Halfmile-Stratmat properties, as well as various resource estimates between 2008 and 2011. In April 2011, Trevali completed a friendly business combination with Kria whereby Trevali acquired all of the issued and outstanding shares of Kria in a stock swap at a rate of 0.2 Trevali shares for every Kria share, providing an acquisition value of $44 million. Upon completion, Trevali was provided with 100% ownership of the Halfmile-Stratmat deposits.
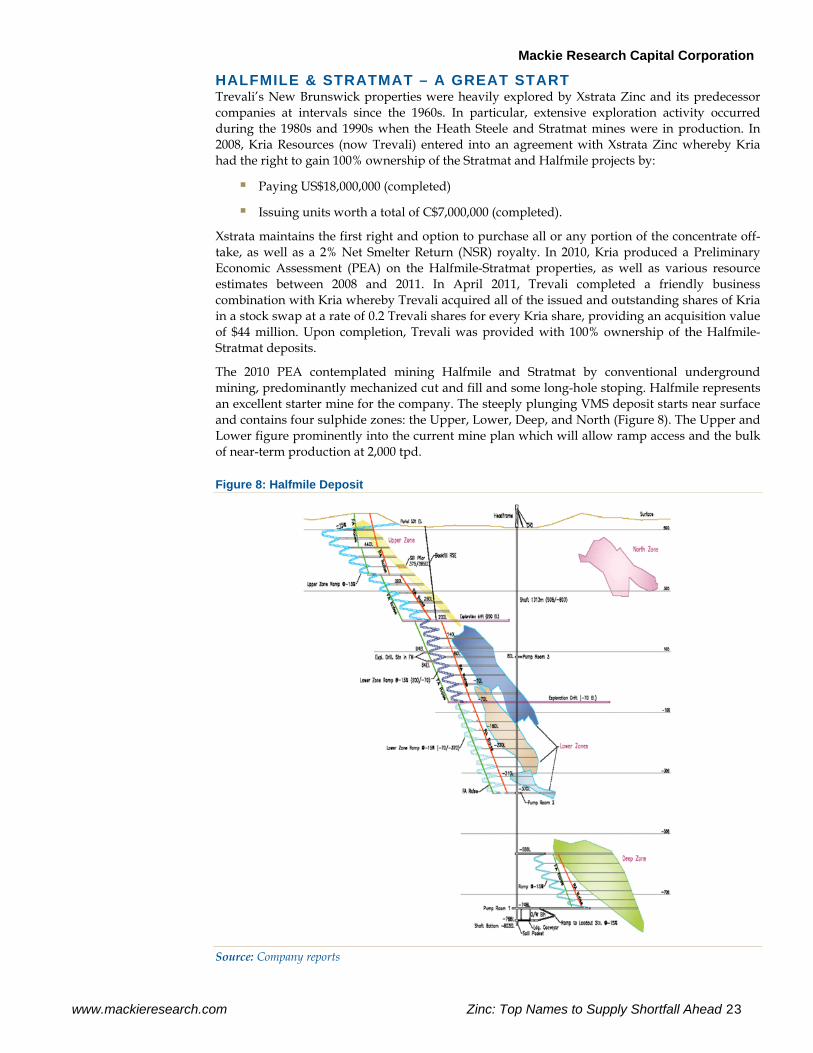
The 2010 PEA contemplated mining Halfmile and Stratmat by conventional underground mining, predominantly mechanized cut and fill and some long-hole stoping. Halfmile represents an excellent starter mine for the company. The steeply plunging VMS deposit starts near surface and contains four sulphide zones: the Upper, Lower, Deep, and North (Figure 8). The Upper and Lower figure prominently into the current mine plan which will allow ramp access and the bulk of near-term production at 2,000 tpd.
Figure 8: Halfmile Deposit
Source: Company reports
Mackie Research Capital Corporation
24 Zinc: Top Names to Supply Shortfall Ahead www.mackieresearch.com
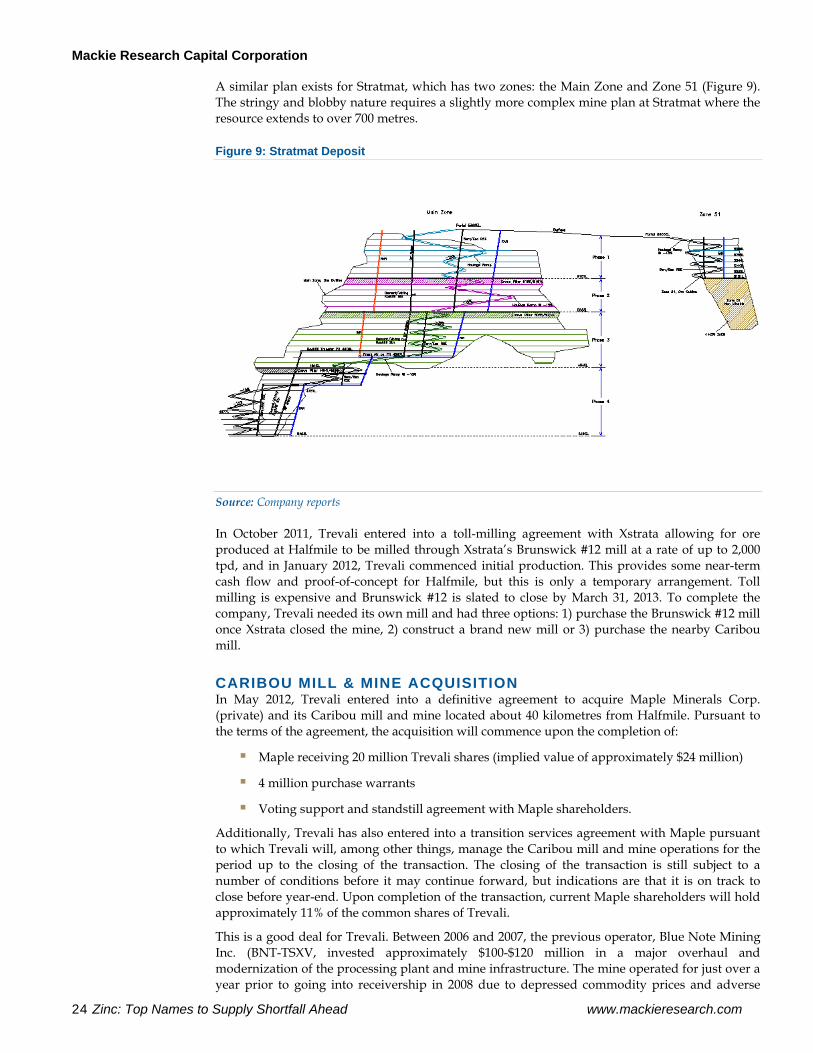
A similar plan exists for Stratmat, which has two zones: the Main Zone and Zone 51 (Figure 9). The stringy and blobby nature requires a slightly more complex mine plan at Stratmat where the resource extends to over 700 metres.
Figure 9: Stratmat Deposit
Source: Company reports
In October 2011, Trevali entered into a toll-milling agreement with Xstrata allowing for ore produced at Halfmile to be milled through Xstrata’s Brunswick #12 mill at a rate of up to 2,000 tpd, and in January 2012, Trevali commenced initial production. This provides some near-term cash flow and proof-of-concept for Halfmile, but this is only a temporary arrangement. Toll milling is expensive and Brunswick #12 is slated to close by March 31, 2013. To complete the company, Trevali needed its own mill and had three options: 1) purchase the Brunswick #12 mill once Xstrata closed the mine, 2) construct a brand new mill or 3) purchase the nearby Caribou mill.
CARIBOU MILL & MINE ACQUISITION In May 2012, Trevali entered into a definitive agreement to acquire Maple Minerals Corp. (private) and its Caribou mill and mine located about 40 kilometres from Halfmile. Pursuant to the terms of the agreement, the acquisition will commence upon the completion of:
Maple receiving 20 million Trevali shares (implied value of approximately $24 million)
4 million purchase warrants
Voting support and standstill agreement with Maple shareholders.
Additionally, Trevali has also entered into a transition services agreement with Maple pursuant to which Trevali will, among other things, manage the Caribou mill and mine operations for the period up to the closing of the transaction. The closing of the transaction is still subject to a number of conditions before it may continue forward, but indications are that it is on track to close before year-end. Upon completion of the transaction, current Maple shareholders will hold approximately 11% of the common shares of Trevali.
This is a good deal for Trevali. Between 2006 and 2007, the previous operator, Blue Note Mining Inc. (BNT-TSXV, invested approximately $100-$120 million in a major overhaul and modernization of the processing plant and mine infrastructure. The mine operated for just over a year prior to going into receivership in 2008 due to depressed commodity prices and adverse
Mackie Research Capital Corporation
www.mackieresearch.com Zinc: Top Names to Supply Shortfall Ahead 25
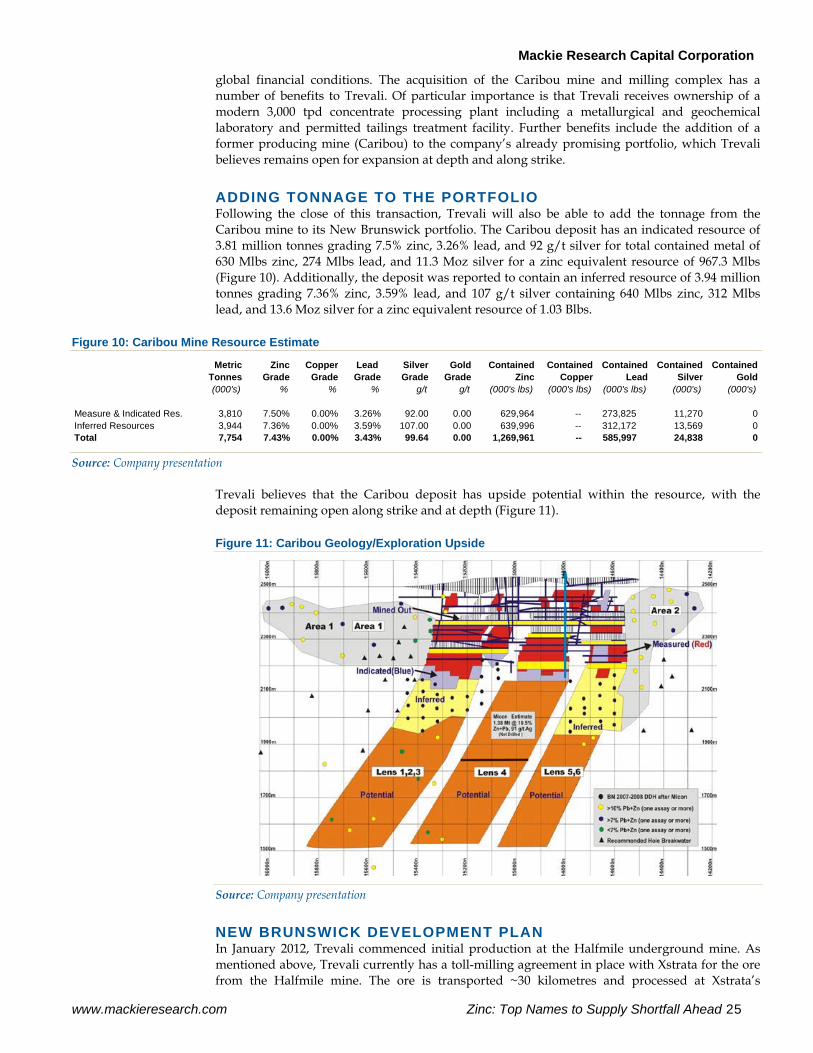
global financial conditions. The acquisition of the Caribou mine and milling complex has a number of benefits to Trevali. Of particular importance is that Trevali receives ownership of a modern 3,000 tpd concentrate processing plant including a metallurgical and geochemical laboratory and permitted tailings treatment facility. Further benefits include the addition of a former producing mine (Caribou) to the company’s already promising portfolio, which Trevali believes remains open for expansion at depth and along strike.
ADDING TONNAGE TO THE PORTFOLIO Following the close of this transaction, Trevali will also be able to add the tonnage from the Caribou mine to its New Brunswick portfolio. The Caribou deposit has an indicated resource of 3.81 million tonnes grading 7.5% zinc, 3.26% lead, and 92 g/t silver for total contained metal of 630 Mlbs zinc, 274 Mlbs lead, and 11.3 Moz silver for a zinc equivalent resource of 967.3 Mlbs (Figure 10). Additionally, the deposit was reported to contain an inferred resource of 3.94 million tonnes grading 7.36% zinc, 3.59% lead, and 107 g/t silver containing 640 Mlbs zinc, 312 Mlbs lead, and 13.6 Moz silver for a zinc equivalent resource of 1.03 Blbs.
Figure 10: Caribou Mine Resource Estimate
Metric Zinc Copper Lead Silver Gold Contained Contained Contained Contained ContainedTonnes Grade Grade Grade Grade Grade Zinc Copper Lead Silver Gold(000's) % % % g/t g/t (000's lbs) (000's lbs) (000's lbs) (000's) (000's)
Measure & Indicated Res. 3,810 7.50% 0.00% 3.26% 92.00 0.00 629,964 -- 273,825 11,270 0Inferred Resources 3,944 7.36% 0.00% 3.59% 107.00 0.00 639,996 -- 312,172 13,569 0Total 7,754 7.43% 0.00% 3.43% 99.64 0.00 1,269,961 -- 585,997 24,838 0 Source: Company presentation
Trevali believes that the Caribou deposit has upside potential within the resource, with the deposit remaining open along strike and at depth (Figure 11).
Figure 11: Caribou Geology/Exploration Upside
Source: Company presentation
NEW BRUNSWICK DEVELOPMENT PLAN In January 2012, Trevali commenced initial production at the Halfmile underground mine. As mentioned above, Trevali currently has a toll-milling agreement in place with Xstrata for the ore from the Halfmile mine. The ore is transported ~30 kilometres and processed at Xstrata’s
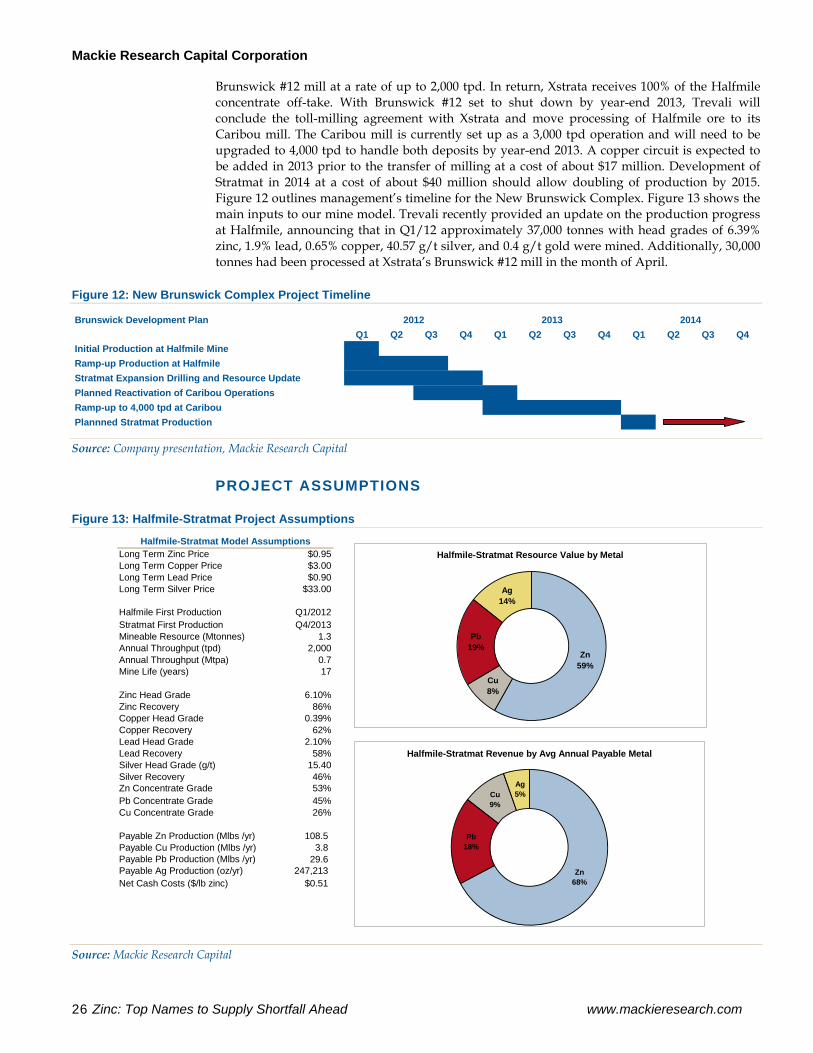
Mackie Research Capital Corporation
26 Zinc: Top Names to Supply Shortfall Ahead www.mackieresearch.com
Brunswick #12 mill at a rate of up to 2,000 tpd. In return, Xstrata receives 100% of the Halfmile concentrate off-take. With Brunswick #12 set to shut down by year-end 2013, Trevali will conclude the toll-milling agreement with Xstrata and move processing of Halfmile ore to its Caribou mill. The Caribou mill is currently set up as a 3,000 tpd operation and will need to be upgraded to 4,000 tpd to handle both deposits by year-end 2013. A copper circuit is expected to be added in 2013 prior to the transfer of milling at a cost of about $17 million. Development of Stratmat in 2014 at a cost of about $40 million should allow doubling of production by 2015. Figure 12 outlines management’s timeline for the New Brunswick Complex. Figure 13 shows the main inputs to our mine model. Trevali recently provided an update on the production progress at Halfmile, announcing that in Q1/12 approximately 37,000 tonnes with head grades of 6.39% zinc, 1.9% lead, 0.65% copper, 40.57 g/t silver, and 0.4 g/t gold were mined. Additionally, 30,000 tonnes had been processed at Xstrata’s Brunswick #12 mill in the month of April.
Figure 12: New Brunswick Complex Project Timeline
Brunswick Development PlanQ1 Q2 Q3 Q4 Q1 Q2 Q3 Q4 Q1 Q2 Q3 Q4
Initial Production at Halfmile MineRamp-up Production at HalfmileStratmat Expansion Drilling and Resource UpdatePlanned Reactivation of Caribou OperationsRamp-up to 4,000 tpd at CaribouPlannned Stratmat Production
2012 2013 2014
Source: Company presentation, Mackie Research Capital
PROJECT ASSUMPTIONS
Figure 13: Halfmile-Stratmat Project Assumptions
Long Term Zinc Price $0.95Long Term Copper Price $3.00Long Term Lead Price $0.90Long Term Silver Price $33.00
Halfmile First Production Q1/2012Stratmat First Production Q4/2013Mineable Resource (Mtonnes) 1.3Annual Throughput (tpd) 2,000Annual Throughput (Mtpa) 0.7Mine Life (years) 17
Zinc Head Grade 6.10%Zinc Recovery 86%Copper Head Grade 0.39%Copper Recovery 62%Lead Head Grade 2.10%Lead Recovery 58%Silver Head Grade (g/t) 15.40Silver Recovery 46%Zn Concentrate Grade 53%Pb Concentrate Grade 45%Cu Concentrate Grade 26%
Payable Zn Production (Mlbs /yr) 108.5 Payable Cu Production (Mlbs /yr) 3.8 Payable Pb Production (Mlbs /yr) 29.6 Payable Ag Production (oz/yr) 247,213 Net Cash Costs ($/lb zinc) $0.51
Halfmile-Stratmat Model AssumptionsHalfmile-Stratmat Resource Value by Metal
Zn59%
Cu8%
Pb19%
Ag14%
Halfmile-Stratmat Revenue by Avg Annual Payable Metal
Zn68%
Pb18%
Cu9%
Ag5%
Source: Mackie Research Capital
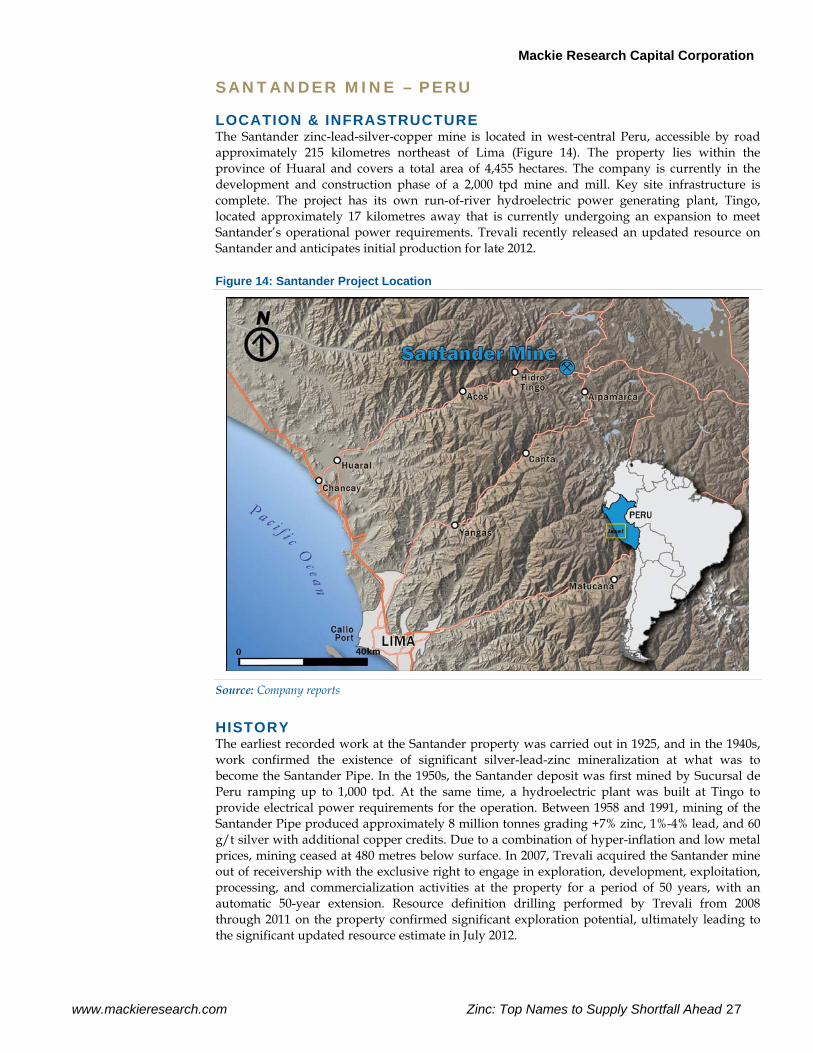
Mackie Research Capital Corporation
www.mackieresearch.com Zinc: Top Names to Supply Shortfall Ahead 27
SANTANDER MINE – PERU
LOCATION & INFRASTRUCTURE The Santander zinc-lead-silver-copper mine is located in west-central Peru, accessible by road approximately 215 kilometres northeast of Lima (Figure 14). The property lies within the province of Huaral and covers a total area of 4,455 hectares. The company is currently in the development and construction phase of a 2,000 tpd mine and mill. Key site infrastructure is complete. The project has its own run-of-river hydroelectric power generating plant, Tingo, located approximately 17 kilometres away that is currently undergoing an expansion to meet Santander’s operational power requirements. Trevali recently released an updated resource on Santander and anticipates initial production for late 2012.
Figure 14: Santander Project Location
Source: Company reports
HISTORY The earliest recorded work at the Santander property was carried out in 1925, and in the 1940s, work confirmed the existence of significant silver-lead-zinc mineralization at what was to become the Santander Pipe. In the 1950s, the Santander deposit was first mined by Sucursal de Peru ramping up to 1,000 tpd. At the same time, a hydroelectric plant was built at Tingo to provide electrical power requirements for the operation. Between 1958 and 1991, mining of the Santander Pipe produced approximately 8 million tonnes grading +7% zinc, 1%-4% lead, and 60 g/t silver with additional copper credits. Due to a combination of hyper-inflation and low metal prices, mining ceased at 480 metres below surface. In 2007, Trevali acquired the Santander mine out of receivership with the exclusive right to engage in exploration, development, exploitation, processing, and commercialization activities at the property for a period of 50 years, with an automatic 50-year extension. Resource definition drilling performed by Trevali from 2008 through 2011 on the property confirmed significant exploration potential, ultimately leading to the significant updated resource estimate in July 2012.
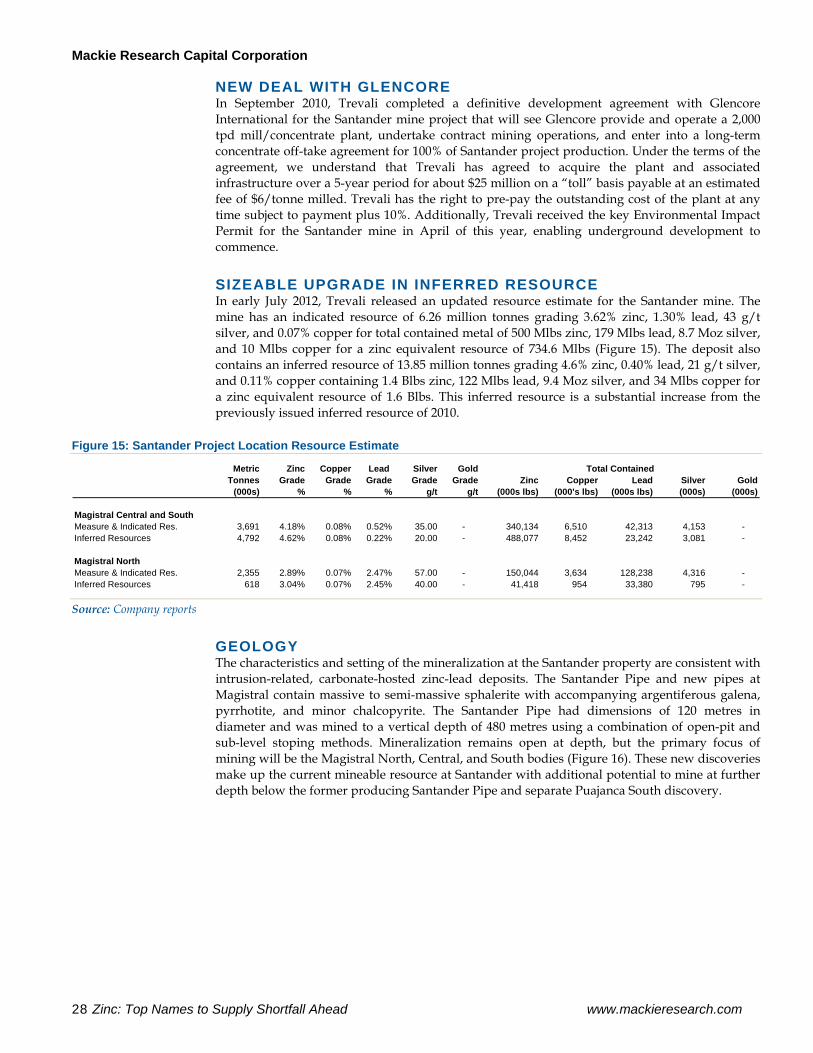
Mackie Research Capital Corporation
28 Zinc: Top Names to Supply Shortfall Ahead www.mackieresearch.com
NEW DEAL WITH GLENCORE In September 2010, Trevali completed a definitive development agreement with Glencore International for the Santander mine project that will see Glencore provide and operate a 2,000 tpd mill/concentrate plant, undertake contract mining operations, and enter into a long-term concentrate off-take agreement for 100% of Santander project production. Under the terms of the agreement, we understand that Trevali has agreed to acquire the plant and associated infrastructure over a 5-year period for about $25 million on a “toll” basis payable at an estimated fee of $6/tonne milled. Trevali has the right to pre-pay the outstanding cost of the plant at any time subject to payment plus 10%. Additionally, Trevali received the key Environmental Impact Permit for the Santander mine in April of this year, enabling underground development to commence.
SIZEABLE UPGRADE IN INFERRED RESOURCE In early July 2012, Trevali released an updated resource estimate for the Santander mine. The mine has an indicated resource of 6.26 million tonnes grading 3.62% zinc, 1.30% lead, 43 g/t silver, and 0.07% copper for total contained metal of 500 Mlbs zinc, 179 Mlbs lead, 8.7 Moz silver, and 10 Mlbs copper for a zinc equivalent resource of 734.6 Mlbs (Figure 15). The deposit also contains an inferred resource of 13.85 million tonnes grading 4.6% zinc, 0.40% lead, 21 g/t silver, and 0.11% copper containing 1.4 Blbs zinc, 122 Mlbs lead, 9.4 Moz silver, and 34 Mlbs copper for a zinc equivalent resource of 1.6 Blbs. This inferred resource is a substantial increase from the previously issued inferred resource of 2010.
Figure 15: Santander Project Location Resource Estimate
Metric Zinc Copper Lead Silver GoldTonnes Grade Grade Grade Grade Grade Zinc Copper Lead Silver Gold
(000s) % % % g/t g/t (000s lbs) (000's lbs) (000s lbs) (000s) (000s)
Magistral Central and SouthMeasure & Indicated Res. 3,691 4.18% 0.08% 0.52% 35.00 - 340,134 6,510 42,313 4,153 - Inferred Resources 4,792 4.62% 0.08% 0.22% 20.00 - 488,077 8,452 23,242 3,081 -
Magistral NorthMeasure & Indicated Res. 2,355 2.89% 0.07% 2.47% 57.00 - 150,044 3,634 128,238 4,316 - Inferred Resources 618 3.04% 0.07% 2.45% 40.00 - 41,418 954 33,380 795 -
Total Contained
Source: Company reports
GEOLOGY The characteristics and setting of the mineralization at the Santander property are consistent with intrusion-related, carbonate-hosted zinc-lead deposits. The Santander Pipe and new pipes at Magistral contain massive to semi-massive sphalerite with accompanying argentiferous galena, pyrrhotite, and minor chalcopyrite. The Santander Pipe had dimensions of 120 metres in diameter and was mined to a vertical depth of 480 metres using a combination of open-pit and sub-level stoping methods. Mineralization remains open at depth, but the primary focus of mining will be the Magistral North, Central, and South bodies (Figure 16). These new discoveries make up the current mineable resource at Santander with additional potential to mine at further depth below the former producing Santander Pipe and separate Puajanca South discovery.
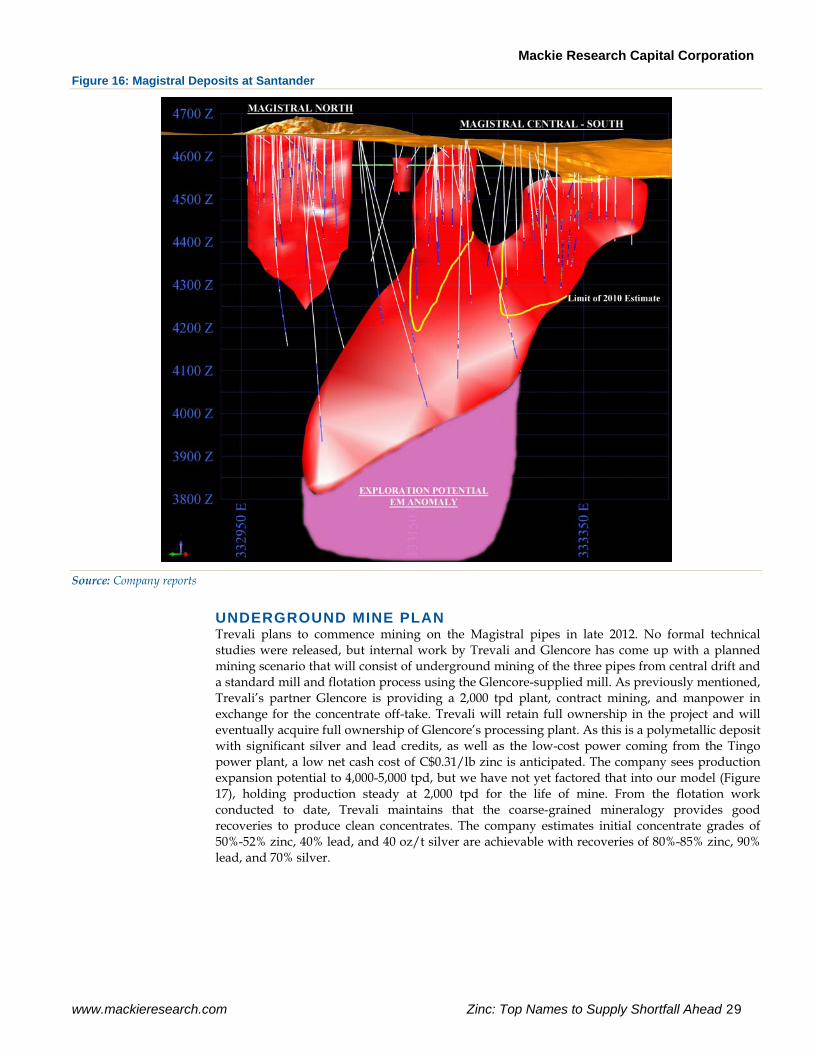
Mackie Research Capital Corporation
www.mackieresearch.com Zinc: Top Names to Supply Shortfall Ahead 29
Figure 16: Magistral Deposits at Santander
Source: Company reports
UNDERGROUND MINE PLAN Trevali plans to commence mining on the Magistral pipes in late 2012. No formal technical studies were released, but internal work by Trevali and Glencore has come up with a planned mining scenario that will consist of underground mining of the three pipes from central drift and a standard mill and flotation process using the Glencore-supplied mill. As previously mentioned, Trevali’s partner Glencore is providing a 2,000 tpd plant, contract mining, and manpower in exchange for the concentrate off-take. Trevali will retain full ownership in the project and will eventually acquire full ownership of Glencore’s processing plant. As this is a polymetallic deposit with significant silver and lead credits, as well as the low-cost power coming from the Tingo power plant, a low net cash cost of C$0.31/lb zinc is anticipated. The company sees production expansion potential to 4,000-5,000 tpd, but we have not yet factored that into our model (Figure 17), holding production steady at 2,000 tpd for the life of mine. From the flotation work conducted to date, Trevali maintains that the coarse-grained mineralogy provides good recoveries to produce clean concentrates. The company estimates initial concentrate grades of 50%-52% zinc, 40% lead, and 40 oz/t silver are achievable with recoveries of 80%-85% zinc, 90% lead, and 70% silver.
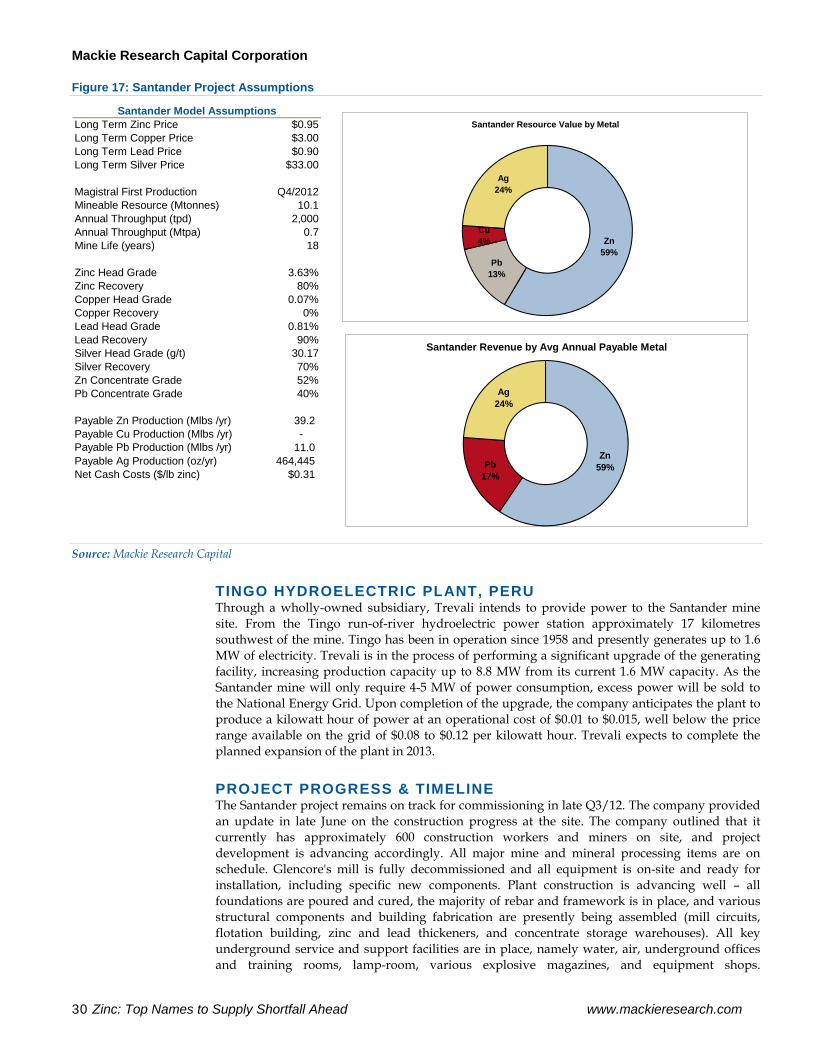
Mackie Research Capital Corporation
30 Zinc: Top Names to Supply Shortfall Ahead www.mackieresearch.com
Figure 17: Santander Project Assumptions
Long Term Zinc Price $0.95Long Term Copper Price $3.00Long Term Lead Price $0.90Long Term Silver Price $33.00
Magistral First Production Q4/2012Mineable Resource (Mtonnes) 10.1Annual Throughput (tpd) 2,000Annual Throughput (Mtpa) 0.7Mine Life (years) 18
Zinc Head Grade 3.63%Zinc Recovery 80%Copper Head Grade 0.07%Copper Recovery 0%Lead Head Grade 0.81%Lead Recovery 90%Silver Head Grade (g/t) 30.17Silver Recovery 70%Zn Concentrate Grade 52%Pb Concentrate Grade 40%
Payable Zn Production (Mlbs /yr) 39.2 Payable Cu Production (Mlbs /yr) - Payable Pb Production (Mlbs /yr) 11.0 Payable Ag Production (oz/yr) 464,445 Net Cash Costs ($/lb zinc) $0.31
Santander Model AssumptionsSantander Resource Value by Metal
Zn59%
Pb13%
Cu4%
Ag24%
Santander Revenue by Avg Annual Payable Metal
Zn59%Pb
17%
Ag24%
Source: Mackie Research Capital
TINGO HYDROELECTRIC PLANT, PERU Through a wholly-owned subsidiary, Trevali intends to provide power to the Santander mine site. From the Tingo run-of-river hydroelectric power station approximately 17 kilometres southwest of the mine. Tingo has been in operation since 1958 and presently generates up to 1.6 MW of electricity. Trevali is in the process of performing a significant upgrade of the generating facility, increasing production capacity up to 8.8 MW from its current 1.6 MW capacity. As the Santander mine will only require 4-5 MW of power consumption, excess power will be sold to the National Energy Grid. Upon completion of the upgrade, the company anticipates the plant to produce a kilowatt hour of power at an operational cost of $0.01 to $0.015, well below the price range available on the grid of $0.08 to $0.12 per kilowatt hour. Trevali expects to complete the planned expansion of the plant in 2013.
PROJECT PROGRESS & TIMELINE The Santander project remains on track for commissioning in late Q3/12. The company provided an update in late June on the construction progress at the site. The company outlined that it currently has approximately 600 construction workers and miners on site, and project development is advancing accordingly. All major mine and mineral processing items are on schedule. Glencore's mill is fully decommissioned and all equipment is on-site and ready for installation, including specific new components. Plant construction is advancing well – all foundations are poured and cured, the majority of rebar and framework is in place, and various structural components and building fabrication are presently being assembled (mill circuits, flotation building, zinc and lead thickeners, and concentrate storage warehouses). All key underground service and support facilities are in place, namely water, air, underground offices and training rooms, lamp-room, various explosive magazines, and equipment shops.
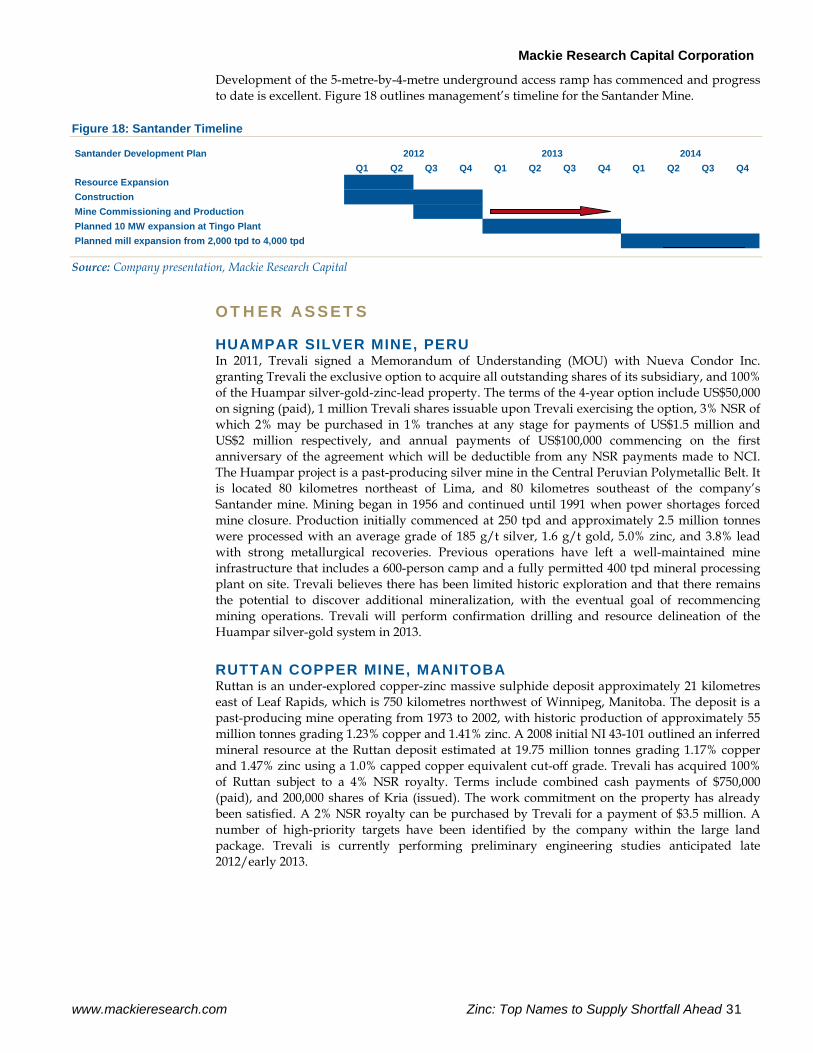
Mackie Research Capital Corporation
www.mackieresearch.com Zinc: Top Names to Supply Shortfall Ahead 31
Development of the 5-metre-by-4-metre underground access ramp has commenced and progress to date is excellent. Figure 18 outlines management’s timeline for the Santander Mine.
Figure 18: Santander Timeline
Santander Development PlanQ1 Q2 Q3 Q4 Q1 Q2 Q3 Q4 Q1 Q2 Q3 Q4
Resource ExpansionConstruction Mine Commissioning and ProductionPlanned 10 MW expansion at Tingo PlantPlanned mill expansion from 2,000 tpd to 4,000 tpd
2012 2013 2014
Source: Company presentation, Mackie Research Capital
OTHER ASSETS
HUAMPAR SILVER MINE, PERU In 2011, Trevali signed a Memorandum of Understanding (MOU) with Nueva Condor Inc. granting Trevali the exclusive option to acquire all outstanding shares of its subsidiary, and 100% of the Huampar silver-gold-zinc-lead property. The terms of the 4-year option include US$50,000 on signing (paid), 1 million Trevali shares issuable upon Trevali exercising the option, 3% NSR of which 2% may be purchased in 1% tranches at any stage for payments of US$1.5 million and US$2 million respectively, and annual payments of US$100,000 commencing on the first anniversary of the agreement which will be deductible from any NSR payments made to NCI. The Huampar project is a past-producing silver mine in the Central Peruvian Polymetallic Belt. It is located 80 kilometres northeast of Lima, and 80 kilometres southeast of the company’s Santander mine. Mining began in 1956 and continued until 1991 when power shortages forced mine closure. Production initially commenced at 250 tpd and approximately 2.5 million tonnes were processed with an average grade of 185 g/t silver, 1.6 g/t gold, 5.0% zinc, and 3.8% lead with strong metallurgical recoveries. Previous operations have left a well-maintained mine infrastructure that includes a 600-person camp and a fully permitted 400 tpd mineral processing plant on site. Trevali believes there has been limited historic exploration and that there remains the potential to discover additional mineralization, with the eventual goal of recommencing mining operations. Trevali will perform confirmation drilling and resource delineation of the Huampar silver-gold system in 2013.
RUTTAN COPPER MINE, MANITOBA Ruttan is an under-explored copper-zinc massive sulphide deposit approximately 21 kilometres east of Leaf Rapids, which is 750 kilometres northwest of Winnipeg, Manitoba. The deposit is a past-producing mine operating from 1973 to 2002, with historic production of approximately 55 million tonnes grading 1.23% copper and 1.41% zinc. A 2008 initial NI 43-101 outlined an inferred mineral resource at the Ruttan deposit estimated at 19.75 million tonnes grading 1.17% copper and 1.47% zinc using a 1.0% capped copper equivalent cut-off grade. Trevali has acquired 100% of Ruttan subject to a 4% NSR royalty. Terms include combined cash payments of $750,000 (paid), and 200,000 shares of Kria (issued). The work commitment on the property has already been satisfied. A 2% NSR royalty can be purchased by Trevali for a payment of $3.5 million. A number of high-priority targets have been identified by the company within the large land package. Trevali is currently performing preliminary engineering studies anticipated late 2012/early 2013.
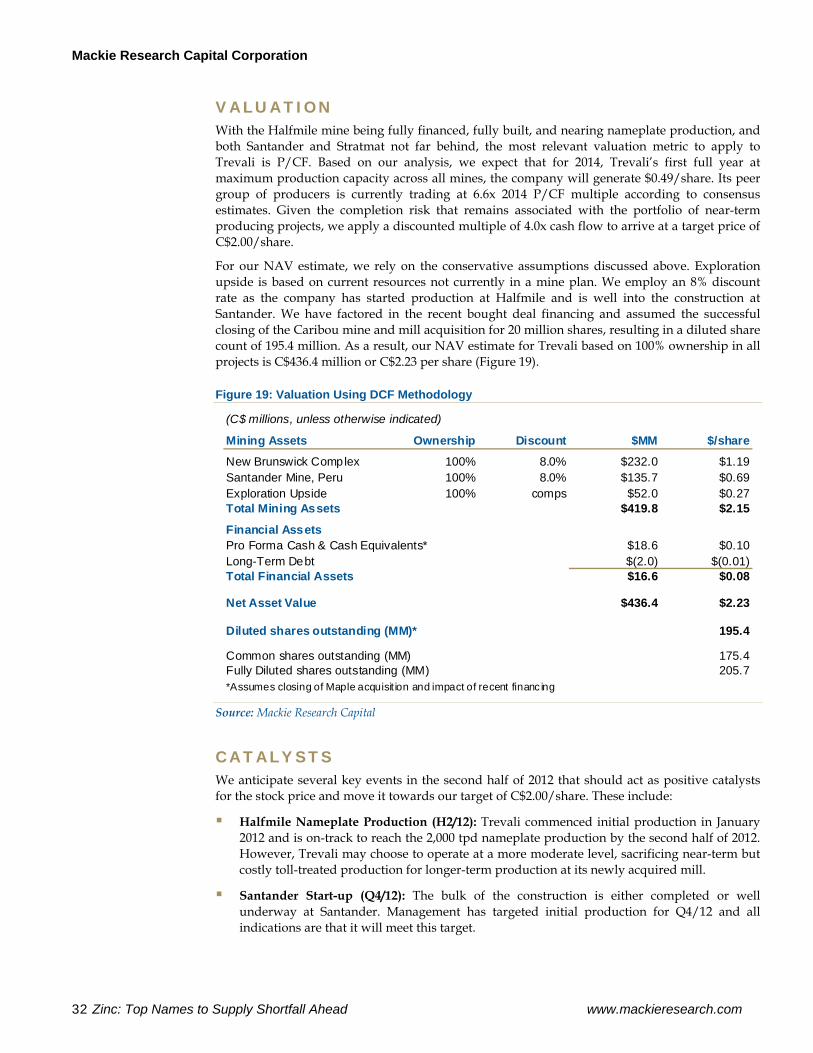
Mackie Research Capital Corporation
32 Zinc: Top Names to Supply Shortfall Ahead www.mackieresearch.com
VALUATION With the Halfmile mine being fully financed, fully built, and nearing nameplate production, and both Santander and Stratmat not far behind, the most relevant valuation metric to apply to Trevali is P/CF. Based on our analysis, we expect that for 2014, Trevali’s first full year at maximum production capacity across all mines, the company will generate $0.49/share. Its peer group of producers is currently trading at 6.6x 2014 P/CF multiple according to consensus estimates. Given the completion risk that remains associated with the portfolio of near-term producing projects, we apply a discounted multiple of 4.0x cash flow to arrive at a target price of C$2.00/share.
For our NAV estimate, we rely on the conservative assumptions discussed above. Exploration upside is based on current resources not currently in a mine plan. We employ an 8% discount rate as the company has started production at Halfmile and is well into the construction at Santander. We have factored in the recent bought deal financing and assumed the successful closing of the Caribou mine and mill acquisition for 20 million shares, resulting in a diluted share count of 195.4 million. As a result, our NAV estimate for Trevali based on 100% ownership in all projects is C$436.4 million or C$2.23 per share (Figure 19).
Figure 19: Valuation Using DCF Methodology
(C$ millions, unless otherwise indicated)
Mining Assets Ownership Discount $MM $/share
New Brunswick Complex 100% 8.0% $232.0 $1.19Santander Mine, Peru 100% 8.0% $135.7 $0.69Exploration Upside 100% comps $52.0 $0.27Total Mining Assets $419.8 $2.15
Financial AssetsPro Forma Cash & Cash Equivalents* $18.6 $0.10Long-Term Debt $(2.0) $(0.01)Total Financial Assets $16.6 $0.08
Net Asset Value $436.4 $2.23
Diluted shares outstanding (MM)* 195.4
Common shares outstanding (MM) 175.4Fully Diluted shares outstanding (MM) 205.7*Assumes closing of Maple acquisit ion and impact of recent financ ing
Source: Mackie Research Capital
CATALYSTS We anticipate several key events in the second half of 2012 that should act as positive catalysts for the stock price and move it towards our target of C$2.00/share. These include:
Halfmile Nameplate Production (H2/12): Trevali commenced initial production in January 2012 and is on-track to reach the 2,000 tpd nameplate production by the second half of 2012. However, Trevali may choose to operate at a more moderate level, sacrificing near-term but costly toll-treated production for longer-term production at its newly acquired mill.
Santander Start-up (Q4/12): The bulk of the construction is either completed or well underway at Santander. Management has targeted initial production for Q4/12 and all indications are that it will meet this target.
Mackie Research Capital Corporation
www.mackieresearch.com Zinc: Top Names to Supply Shortfall Ahead 33
Stratmat expansion drilling and start-up (2012-2014): Additional drilling is planned in attempts to continue growing the Stratmat resource. Initial production is slated for late 2013/early 2014.
Exploration Success: Trevali is performing ongoing exploration programs at Stratmat and Santander that should yield additional results throughout the year.
RISKS Trevali is subject to the same general risks as outlined in the back of this report and, as a developer/producer, is most exposed to cost escalation and commodity-price risk, but of particular note with respect to Trevali, we would highlight:
Development Risk: Trevali has yet to close the Caribou mill acquisition and has yet to complete mine construction at Santander. A delay in either of these properties would adversely impact our estimates. Thus far, Trevali has taken the appropriate steps to ensure completion of both properties in a timely and efficient manner.
Operational Risk: Trevali’s Halfmile mine is in a prolific mining district where continuous mining has been well proven, so operation risk is low. However, while ramp-up currently remains on-track, the company remains exposed to operating risks, given that full production has not yet been achieved and the mill acquisition has not yet closed.
Exploration Risk: Multiple exploration programs are underway at both Stratmat and Santander. While we have continued to see positive results from the company, there is no guarantee the success will be maintained going forward.
Political Risk: The magnitude and risk of policies changes with regard to permitting, taxes, royalties, and government interests vary from country to country. New Brunswick is a mining-friendly and low-risk jurisdiction. Although Peru is also generally a mining-friendly jurisdiction, it continues to experience sporadic social unrest, but not, to our knowledge, in the vicinity of Santander. The World Bank ranks Peru 41st in the world for ease of doing business, which is on par with Chile (39th) and better than Mexico (53rd). Canada and the U.S. rank 4th and 13th, respectively.
CONCLUSION Trevali offers a compelling opportunity for investors in the resource space looking for a growing producer with leverage to zinc. Indeed, Trevali is one of the few pure-play (burgeoning) producers in this space. We are initiating coverage of Trevali Mining Corp. with a BUY recommendation and a 12-month target price of C$2.00/share based on a 4.0x 2014 P/CF multiple. As Trevali brings both the New Brunswick and Santander mines to full production, we would expect to see increases in the cash flow multiple and stock price. Additional upside comes from resource and mine expansions from its ample exploration and resource portfolio.
Mackie Research Capital Corporation
34 Zinc: Top Names to Supply Shortfall Ahead www.mackieresearch.com
MANAGEMENT TEAM Dr. Mark Cruise, President, CEO & Director: A base metal deposit specialist with 18 years of project experience from grass-roots exploration through resource definition to permitting and production in Europe and the Americas on behalf of Pasminco Exploration, Anglo American, and various TSX-listed Juniors. He completed his Ph.D. on the Irish zinc-lead orefield and was a member of Anglo American's Lisheen Zinc-Lead Mine feasibility/technical team in Ireland that developed the 4,500 tpd Lisheen Mine.
Dr. Anthony Holler, Chairman & Director: Dr. Holler brings his expertise in the mergers and acquisitions field to Trevali. Dr. Holler founded and was the Chief Executive Officer of ID Biomedical Corp., where he oversaw product development from research and development through to commercialization. He eventually sold the company to GlaxoSmithKline in 2005 for approximately $1.7 billion. Similarly, during his tenure as Chairman and Director at Corriente Resources Inc., he oversaw the development of that company's copper/gold property through bankable feasibility, ultimately selling the company in 2010 for $679 million.
Anna Ladd, Chief Financial Officer: A Certified Management Accountant, Ms. Ladd received a Bachelor of Commerce degree from the University of British Columbia in 1991 and a Masters of Arts in Economics from Queen's University in 1993. Anna has over 15 years of experience in financing and financial controls in relation to the mining industry from mine controller up to and including responsibility for multiple large-scale open pit and underground base and precious metal production units. Anna has served as Vice President Finance and Chief Financial Officer for a number of TSX-listed junior mining and development companies in addition to several mid-size to senior gold and base metal producers including Kinross Gold Corporation's Fort Knox and Vale Inco's Thompson and Sudbury base metal operations.
Paul Keller, Vice President of Operations: Mr. Keller brings extensive mine operations experience in Canada with 27 years of experience, most recently as Manager of Technical Services for a major Canadian mining contractor where he led a team of engineers and designers on various mining contracts for major mining companies. Mr. Keller began his career with Rio Algom Limited and has also worked in various management roles with Barrick Gold's Hemlo mine in operations, engineering, and maintenance. Mr. Keller holds a Bachelor of Engineering/Mining from Laurentian University and is a Professional Engineer.
Dayle Rusk, Vice President of Exploration: Ms. Rusk has over 30 years of base and precious metal production and exploration experience in underground and open-pit mines. Dayle was previously Chief of Technical Services for Imperial Metals where she was responsible for all aspects of engineering and production geology including short and long-range planning, mine design, resource-reserve calculations, and subsequent production-reconciliation studies. She has also held roles as Senior Production Geologist at Goldcorp's Red Lake mine and Anglo American's Hudson Bay Mining and Smelting - Flin Flon production unit and most recently with Kria Resources.
Daniel Marinov, Chief Geologist - Peru: Mr. Marinov has over 21 years of international experience in exploration and underground mining, and has held senior management roles with Rio Tinto and Anglo American. Recently Daniel was project manager at Anglo's Michiquillay porphyry copper-gold-molybdenum deposit in Peru. Daniel holds a Master of Science degree in mineral exploration from the University of Mining and Geology of Sofia, Bulgaria.
Steve Stakiw, Manager - Corporate Communications: Mr. Stakiw is a geologist with over 20 years of mineral exploration industry, and research & finance market experience. Steve recently held a senior management role with a leading mining research and investment publication.
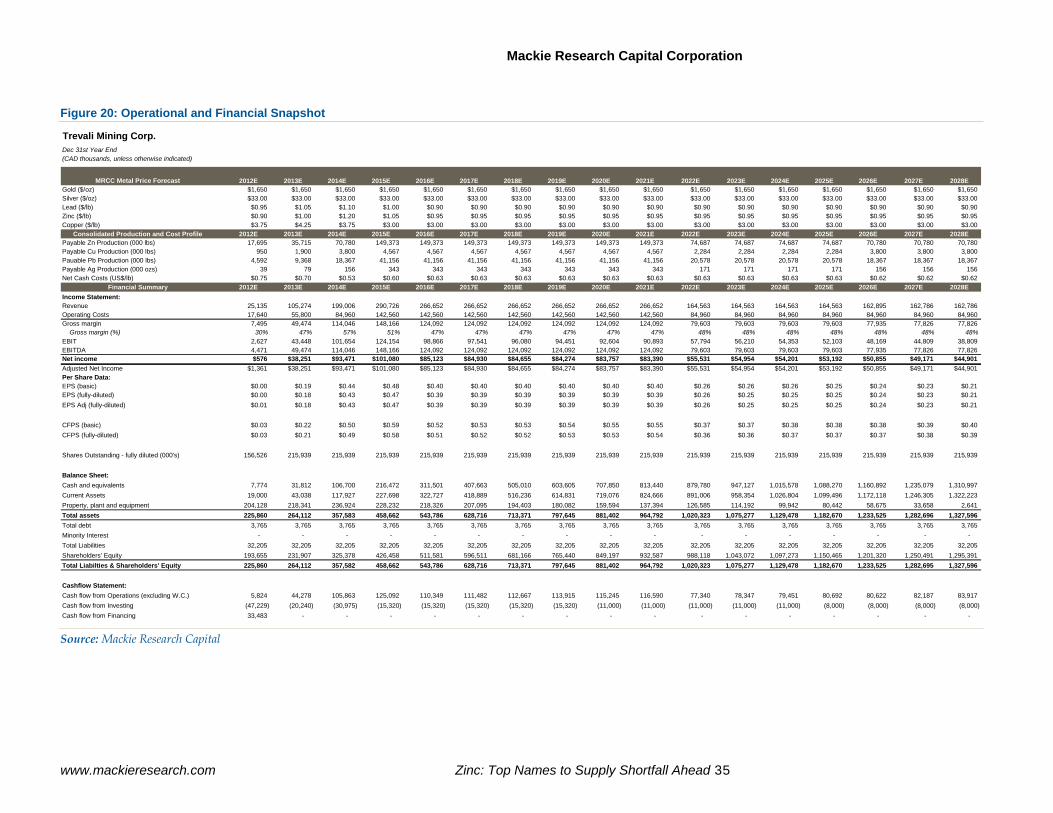
Mackie Research Capital Corporation
www.mackieresearch.com Zinc: Top Names to Supply Shortfall Ahead 35
Figure 20: Operational and Financial Snapshot
Trevali Mining Corp.Dec 31st Year End(CAD thousands, unless otherwise indicated)
MRCC Metal Price Forecast 2012E 2013E 2014E 2015E 2016E 2017E 2018E 2019E 2020E 2021E 2022E 2023E 2024E 2025E 2026E 2027E 2028EGold ($/oz) $1,650 $1,650 $1,650 $1,650 $1,650 $1,650 $1,650 $1,650 $1,650 $1,650 $1,650 $1,650 $1,650 $1,650 $1,650 $1,650 $1,650Silver ($/oz) $33.00 $33.00 $33.00 $33.00 $33.00 $33.00 $33.00 $33.00 $33.00 $33.00 $33.00 $33.00 $33.00 $33.00 $33.00 $33.00 $33.00Lead ($/lb) $0.95 $1.05 $1.10 $1.00 $0.90 $0.90 $0.90 $0.90 $0.90 $0.90 $0.90 $0.90 $0.90 $0.90 $0.90 $0.90 $0.90Zinc ($/lb) $0.90 $1.00 $1.20 $1.05 $0.95 $0.95 $0.95 $0.95 $0.95 $0.95 $0.95 $0.95 $0.95 $0.95 $0.95 $0.95 $0.95Copper ($/lb) $3.75 $4.25 $3.75 $3.00 $3.00 $3.00 $3.00 $3.00 $3.00 $3.00 $3.00 $3.00 $3.00 $3.00 $3.00 $3.00 $3.00
Consolidated Production and Cost Profile 2012E 2013E 2014E 2015E 2016E 2017E 2018E 2019E 2020E 2021E 2022E 2023E 2024E 2025E 2026E 2027E 2028EPayable Zn Production (000 lbs) 17,695 35,715 70,780 149,373 149,373 149,373 149,373 149,373 149,373 149,373 74,687 74,687 74,687 74,687 70,780 70,780 70,780 Payable Cu Production (000 lbs) 950 1,900 3,800 4,567 4,567 4,567 4,567 4,567 4,567 4,567 2,284 2,284 2,284 2,284 3,800 3,800 3,800 Pauable Pb Production (000 lbs) 4,592 9,368 18,367 41,156 41,156 41,156 41,156 41,156 41,156 41,156 20,578 20,578 20,578 20,578 18,367 18,367 18,367 Payable Ag Production (000 ozs) 39 79 156 343 343 343 343 343 343 343 171 171 171 171 156 156 156 Net Cash Costs (US$/lb) $0.75 $0.70 $0.53 $0.60 $0.63 $0.63 $0.63 $0.63 $0.63 $0.63 $0.63 $0.63 $0.63 $0.63 $0.62 $0.62 $0.62
Financial Summary 2012E 2013E 2014E 2015E 2016E 2017E 2018E 2019E 2020E 2021E 2022E 2023E 2024E 2025E 2026E 2027E 2028EIncome Statement:Revenue 25,135 105,274 199,006 290,726 266,652 266,652 266,652 266,652 266,652 266,652 164,563 164,563 164,563 164,563 162,895 162,786 162,786 Operating Costs 17,640 55,800 84,960 142,560 142,560 142,560 142,560 142,560 142,560 142,560 84,960 84,960 84,960 84,960 84,960 84,960 84,960 Gross margin 7,495 49,474 114,046 148,166 124,092 124,092 124,092 124,092 124,092 124,092 79,603 79,603 79,603 79,603 77,935 77,826 77,826 Gross margin (%) 30% 47% 57% 51% 47% 47% 47% 47% 47% 47% 48% 48% 48% 48% 48% 48% 48%EBIT 2,627 43,448 101,654 124,154 98,866 97,541 96,080 94,451 92,604 90,893 57,794 56,210 54,353 52,103 48,169 44,809 38,809 EBITDA 4,471 49,474 114,046 148,166 124,092 124,092 124,092 124,092 124,092 124,092 79,603 79,603 79,603 79,603 77,935 77,826 77,826 Net income $576 $38,251 $93,471 $101,080 $85,123 $84,930 $84,655 $84,274 $83,757 $83,390 $55,531 $54,954 $54,201 $53,192 $50,855 $49,171 $44,901Adjusted Net Income $1,361 $38,251 $93,471 $101,080 $85,123 $84,930 $84,655 $84,274 $83,757 $83,390 $55,531 $54,954 $54,201 $53,192 $50,855 $49,171 $44,901Per Share Data:EPS (basic) $0.00 $0.19 $0.44 $0.48 $0.40 $0.40 $0.40 $0.40 $0.40 $0.40 $0.26 $0.26 $0.26 $0.25 $0.24 $0.23 $0.21EPS (fully-diluted) $0.00 $0.18 $0.43 $0.47 $0.39 $0.39 $0.39 $0.39 $0.39 $0.39 $0.26 $0.25 $0.25 $0.25 $0.24 $0.23 $0.21EPS Adj (fully-diluted) $0.01 $0.18 $0.43 $0.47 $0.39 $0.39 $0.39 $0.39 $0.39 $0.39 $0.26 $0.25 $0.25 $0.25 $0.24 $0.23 $0.21
CFPS (basic) $0.03 $0.22 $0.50 $0.59 $0.52 $0.53 $0.53 $0.54 $0.55 $0.55 $0.37 $0.37 $0.38 $0.38 $0.38 $0.39 $0.40CFPS (fully-diluted) $0.03 $0.21 $0.49 $0.58 $0.51 $0.52 $0.52 $0.53 $0.53 $0.54 $0.36 $0.36 $0.37 $0.37 $0.37 $0.38 $0.39
Shares Outstanding - fully diluted (000's) 156,526 215,939 215,939 215,939 215,939 215,939 215,939 215,939 215,939 215,939 215,939 215,939 215,939 215,939 215,939 215,939 215,939
Balance Sheet:Cash and equivalents 7,774 31,812 106,700 216,472 311,501 407,663 505,010 603,605 707,850 813,440 879,780 947,127 1,015,578 1,088,270 1,160,892 1,235,079 1,310,997 Current Assets 19,000 43,038 117,927 227,698 322,727 418,889 516,236 614,831 719,076 824,666 891,006 958,354 1,026,804 1,099,496 1,172,118 1,246,305 1,322,223 Property, plant and equipment 204,128 218,341 236,924 228,232 218,326 207,095 194,403 180,082 159,594 137,394 126,585 114,192 99,942 80,442 58,675 33,658 2,641 Total assets 225,860 264,112 357,583 458,662 543,786 628,716 713,371 797,645 881,402 964,792 1,020,323 1,075,277 1,129,478 1,182,670 1,233,525 1,282,696 1,327,596 Total debt 3,765 3,765 3,765 3,765 3,765 3,765 3,765 3,765 3,765 3,765 3,765 3,765 3,765 3,765 3,765 3,765 3,765 Minority Interest - - - - - - - - - - - - - - - - - Total Liabilities 32,205 32,205 32,205 32,205 32,205 32,205 32,205 32,205 32,205 32,205 32,205 32,205 32,205 32,205 32,205 32,205 32,205 Shareholders' Equity 193,655 231,907 325,378 426,458 511,581 596,511 681,166 765,440 849,197 932,587 988,118 1,043,072 1,097,273 1,150,465 1,201,320 1,250,491 1,295,391 Total Liabilties & Shareholders' Equity 225,860 264,112 357,582 458,662 543,786 628,716 713,371 797,645 881,402 964,792 1,020,323 1,075,277 1,129,478 1,182,670 1,233,525 1,282,695 1,327,596
Cashflow Statement: Cash flow from Operations (excluding W.C.) 5,824 44,278 105,863 125,092 110,349 111,482 112,667 113,915 115,245 116,590 77,340 78,347 79,451 80,692 80,622 82,187 83,917 Cash flow from Investing (47,229) (20,240) (30,975) (15,320) (15,320) (15,320) (15,320) (15,320) (11,000) (11,000) (11,000) (11,000) (11,000) (8,000) (8,000) (8,000) (8,000) Cash flow from Financing 33,483 - - - - - - - - - - - - - - - - Source: Mackie Research Capital

.
www.mackieresearch.com Zinc: Top Names to Supply Shortfall Ahead 36
This page left intentionally blank.
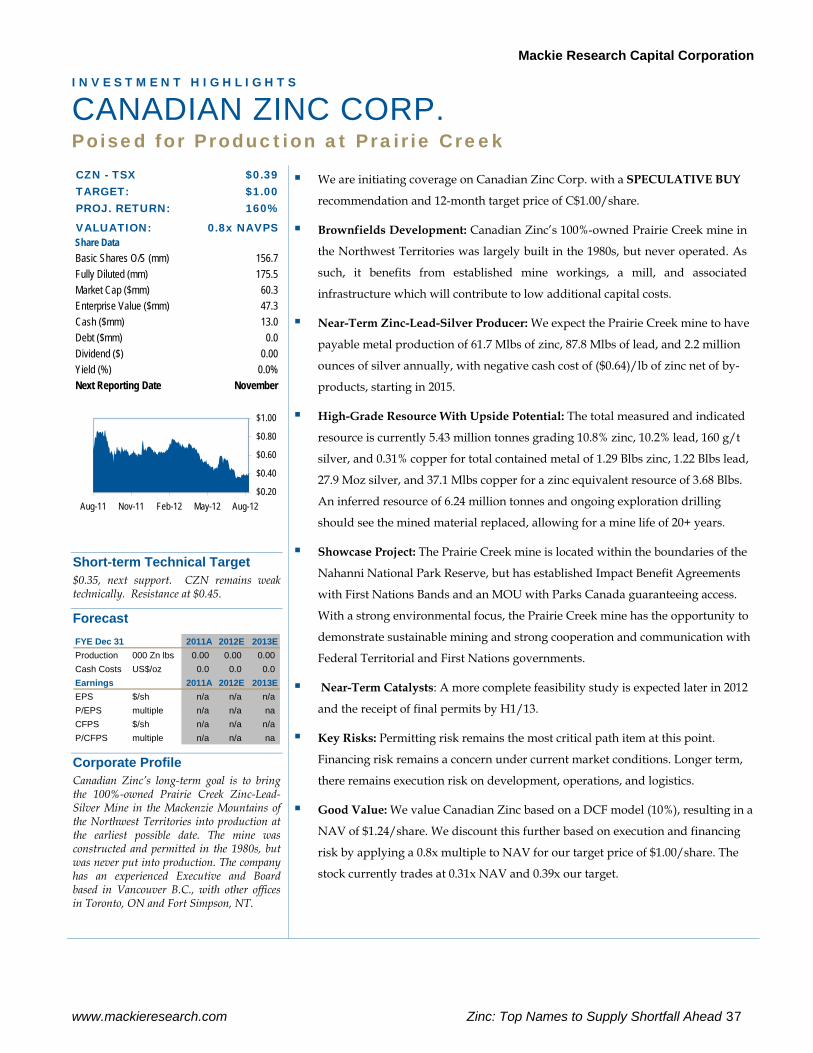
Mackie Research Capital Corporation
www.mackieresearch.com Zinc: Top Names to Supply Shortfall Ahead 37
I N V E S T M E N T H I G H L I G H T S
CANADIAN ZINC CORP. Poised for Production at Prairie Creek
CZN - TSX $0.39TARGET: $1.00PROJ. RETURN: 160%
VALUATION: 0.8x NAVPSShare DataBasic Shares O/S (mm) 156.7Fully Diluted (mm) 175.5Market Cap ($mm) 60.3Enterprise Value ($mm) 47.3Cash ($mm) 13.0Debt ($mm) 0.0Dividend ($) 0.00Yield (%) 0.0%Next Reporting Date November
$0.20
$0.40
$0.60
$0.80
$1.00
Aug-11 Nov-11 Feb-12 May-12 Aug-12
Short-term Technical Target $0.35, next support. CZN remains weak technically. Resistance at $0.45.
Forecast FYE Dec 31 2011A 2012E 2013EProduction 000 Zn lbs 0.00 0.00 0.00Cash Costs US$/oz 0.0 0.0 0.0Earnings 2011A 2012E 2013EEPS $/sh n/a n/a n/aP/EPS multiple n/a n/a naCFPS $/sh n/a n/a n/aP/CFPS multiple n/a n/a na
Corporate Profile Canadian Zinc’s long-term goal is to bring the 100%-owned Prairie Creek Zinc-Lead-Silver Mine in the Mackenzie Mountains of the Northwest Territories into production at the earliest possible date. The mine was constructed and permitted in the 1980s, but was never put into production. The company has an experienced Executive and Board based in Vancouver B.C., with other offices in Toronto, ON and Fort Simpson, NT.
We are initiating coverage on Canadian Zinc Corp. with a SPECULATIVE BUY
recommendation and 12-month target price of C$1.00/share.
Brownfields Development: Canadian Zinc’s 100%-owned Prairie Creek mine in
the Northwest Territories was largely built in the 1980s, but never operated. As
such, it benefits from established mine workings, a mill, and associated
infrastructure which will contribute to low additional capital costs.
Near-Term Zinc-Lead-Silver Producer: We expect the Prairie Creek mine to have
payable metal production of 61.7 Mlbs of zinc, 87.8 Mlbs of lead, and 2.2 million
ounces of silver annually, with negative cash cost of ($0.64)/lb of zinc net of by-
products, starting in 2015.
High-Grade Resource With Upside Potential: The total measured and indicated
resource is currently 5.43 million tonnes grading 10.8% zinc, 10.2% lead, 160 g/t
silver, and 0.31% copper for total contained metal of 1.29 Blbs zinc, 1.22 Blbs lead,
27.9 Moz silver, and 37.1 Mlbs copper for a zinc equivalent resource of 3.68 Blbs.
An inferred resource of 6.24 million tonnes and ongoing exploration drilling
should see the mined material replaced, allowing for a mine life of 20+ years.
Showcase Project: The Prairie Creek mine is located within the boundaries of the
Nahanni National Park Reserve, but has established Impact Benefit Agreements
with First Nations Bands and an MOU with Parks Canada guaranteeing access.
With a strong environmental focus, the Prairie Creek mine has the opportunity to
demonstrate sustainable mining and strong cooperation and communication with
Federal Territorial and First Nations governments.
Near-Term Catalysts: A more complete feasibility study is expected later in 2012
and the receipt of final permits by H1/13.
Key Risks: Permitting risk remains the most critical path item at this point.
Financing risk remains a concern under current market conditions. Longer term,
there remains execution risk on development, operations, and logistics.
Good Value: We value Canadian Zinc based on a DCF model (10%), resulting in a
NAV of $1.24/share. We discount this further based on execution and financing
risk by applying a 0.8x multiple to NAV for our target price of $1.00/share. The
stock currently trades at 0.31x NAV and 0.39x our target.
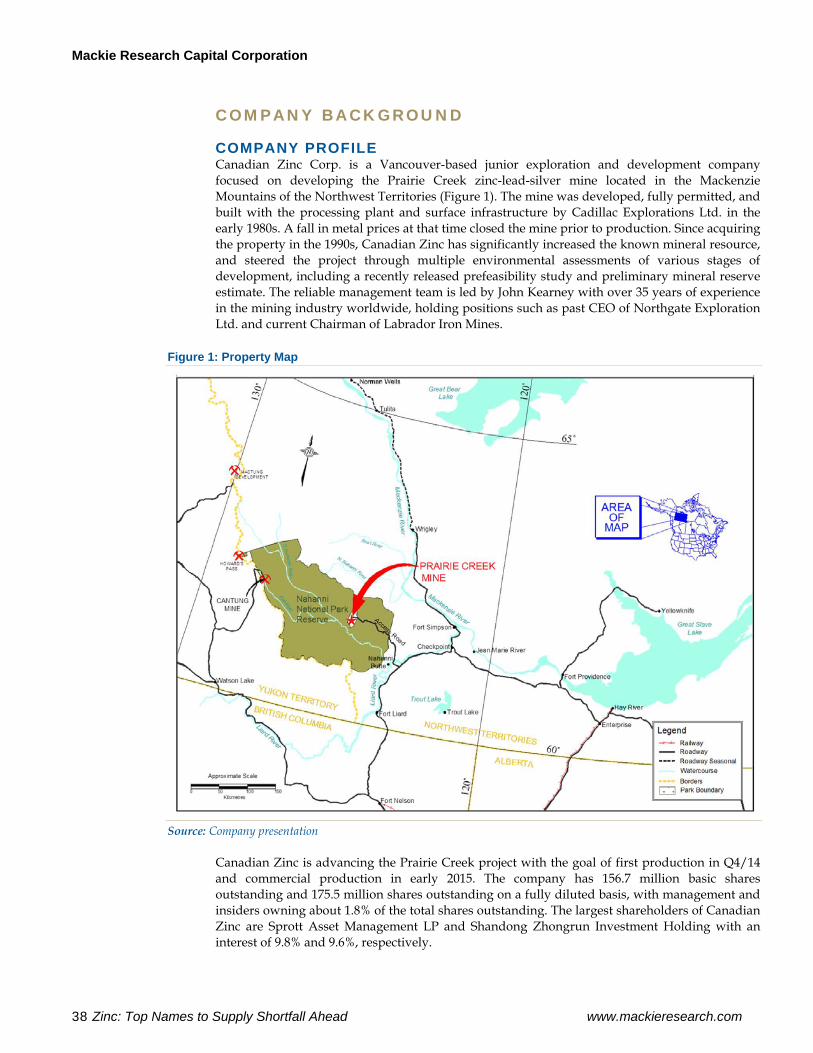
Mackie Research Capital Corporation
38 Zinc: Top Names to Supply Shortfall Ahead www.mackieresearch.com
COMPANY BACKGROUND
COMPANY PROFILE Canadian Zinc Corp. is a Vancouver-based junior exploration and development company focused on developing the Prairie Creek zinc-lead-silver mine located in the Mackenzie Mountains of the Northwest Territories (Figure 1). The mine was developed, fully permitted, and built with the processing plant and surface infrastructure by Cadillac Explorations Ltd. in the early 1980s. A fall in metal prices at that time closed the mine prior to production. Since acquiring the property in the 1990s, Canadian Zinc has significantly increased the known mineral resource, and steered the project through multiple environmental assessments of various stages of development, including a recently released prefeasibility study and preliminary mineral reserve estimate. The reliable management team is led by John Kearney with over 35 years of experience in the mining industry worldwide, holding positions such as past CEO of Northgate Exploration Ltd. and current Chairman of Labrador Iron Mines.
Figure 1: Property Map
Source: Company presentation
Canadian Zinc is advancing the Prairie Creek project with the goal of first production in Q4/14 and commercial production in early 2015. The company has 156.7 million basic shares outstanding and 175.5 million shares outstanding on a fully diluted basis, with management and insiders owning about 1.8% of the total shares outstanding. The largest shareholders of Canadian Zinc are Sprott Asset Management LP and Shandong Zhongrun Investment Holding with an interest of 9.8% and 9.6%, respectively.
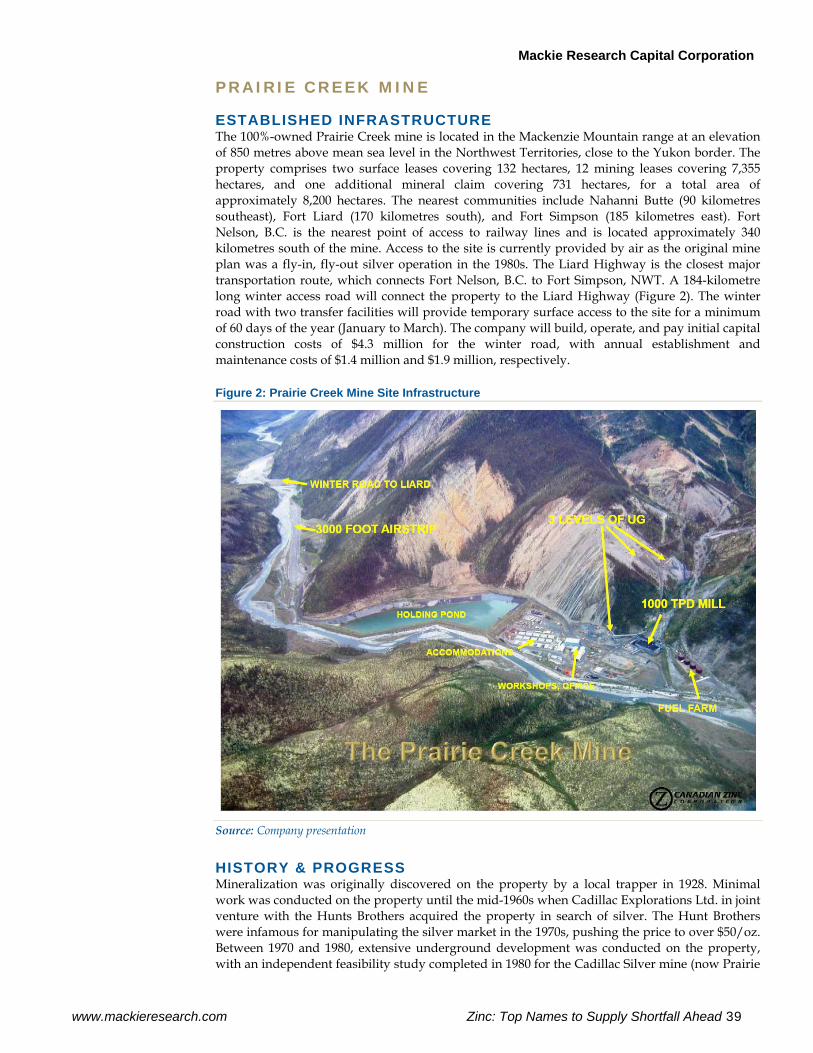
Mackie Research Capital Corporation
www.mackieresearch.com Zinc: Top Names to Supply Shortfall Ahead 39
PRAIRIE CREEK MINE
ESTABLISHED INFRASTRUCTURE The 100%-owned Prairie Creek mine is located in the Mackenzie Mountain range at an elevation of 850 metres above mean sea level in the Northwest Territories, close to the Yukon border. The property comprises two surface leases covering 132 hectares, 12 mining leases covering 7,355 hectares, and one additional mineral claim covering 731 hectares, for a total area of approximately 8,200 hectares. The nearest communities include Nahanni Butte (90 kilometres southeast), Fort Liard (170 kilometres south), and Fort Simpson (185 kilometres east). Fort Nelson, B.C. is the nearest point of access to railway lines and is located approximately 340 kilometres south of the mine. Access to the site is currently provided by air as the original mine plan was a fly-in, fly-out silver operation in the 1980s. The Liard Highway is the closest major transportation route, which connects Fort Nelson, B.C. to Fort Simpson, NWT. A 184-kilometre long winter access road will connect the property to the Liard Highway (Figure 2). The winter road with two transfer facilities will provide temporary surface access to the site for a minimum of 60 days of the year (January to March). The company will build, operate, and pay initial capital construction costs of $4.3 million for the winter road, with annual establishment and maintenance costs of $1.4 million and $1.9 million, respectively.
Figure 2: Prairie Creek Mine Site Infrastructure
Source: Company presentation
HISTORY & PROGRESS Mineralization was originally discovered on the property by a local trapper in 1928. Minimal work was conducted on the property until the mid-1960s when Cadillac Explorations Ltd. in joint venture with the Hunts Brothers acquired the property in search of silver. The Hunt Brothers were infamous for manipulating the silver market in the 1970s, pushing the price to over $50/oz. Between 1970 and 1980, extensive underground development was conducted on the property, with an independent feasibility study completed in 1980 for the Cadillac Silver mine (now Prairie
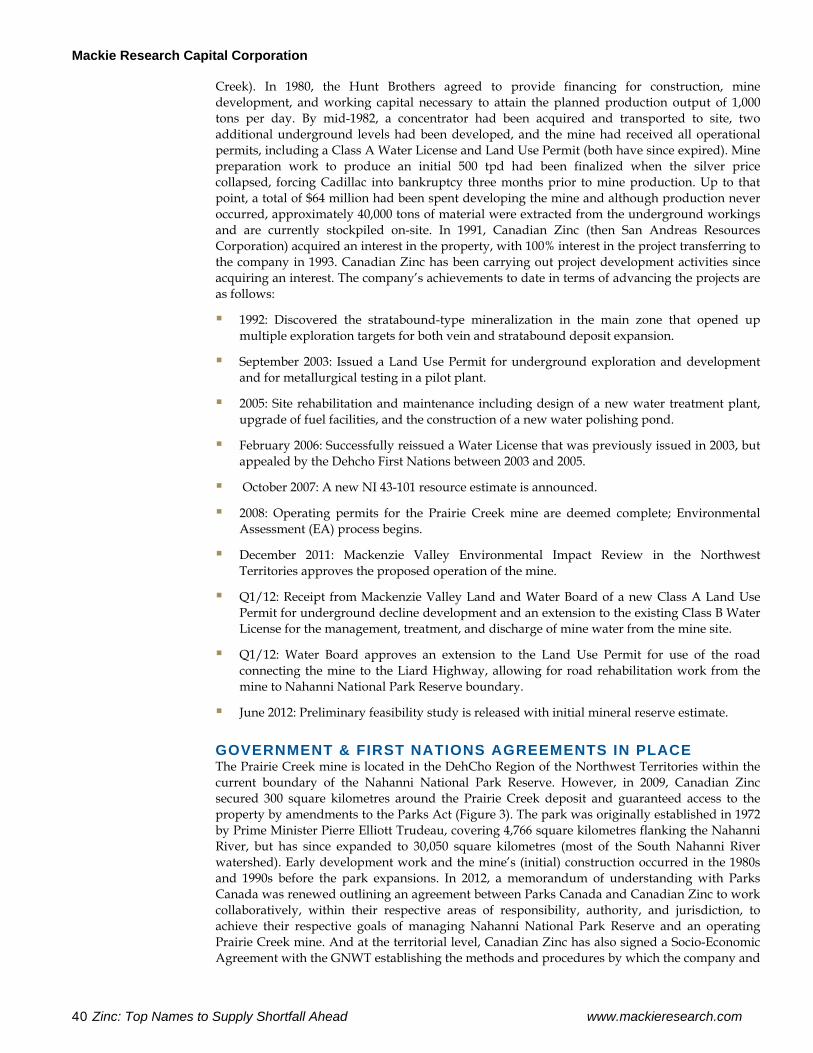
Mackie Research Capital Corporation
40 Zinc: Top Names to Supply Shortfall Ahead www.mackieresearch.com
Creek). In 1980, the Hunt Brothers agreed to provide financing for construction, mine development, and working capital necessary to attain the planned production output of 1,000 tons per day. By mid-1982, a concentrator had been acquired and transported to site, two additional underground levels had been developed, and the mine had received all operational permits, including a Class A Water License and Land Use Permit (both have since expired). Mine preparation work to produce an initial 500 tpd had been finalized when the silver price collapsed, forcing Cadillac into bankruptcy three months prior to mine production. Up to that point, a total of $64 million had been spent developing the mine and although production never occurred, approximately 40,000 tons of material were extracted from the underground workings and are currently stockpiled on-site. In 1991, Canadian Zinc (then San Andreas Resources Corporation) acquired an interest in the property, with 100% interest in the project transferring to the company in 1993. Canadian Zinc has been carrying out project development activities since acquiring an interest. The company’s achievements to date in terms of advancing the projects are as follows:
1992: Discovered the stratabound-type mineralization in the main zone that opened up multiple exploration targets for both vein and stratabound deposit expansion.
September 2003: Issued a Land Use Permit for underground exploration and development and for metallurgical testing in a pilot plant.
2005: Site rehabilitation and maintenance including design of a new water treatment plant, upgrade of fuel facilities, and the construction of a new water polishing pond.
February 2006: Successfully reissued a Water License that was previously issued in 2003, but appealed by the Dehcho First Nations between 2003 and 2005.
October 2007: A new NI 43-101 resource estimate is announced.
2008: Operating permits for the Prairie Creek mine are deemed complete; Environmental Assessment (EA) process begins.
December 2011: Mackenzie Valley Environmental Impact Review in the Northwest Territories approves the proposed operation of the mine.
Q1/12: Receipt from Mackenzie Valley Land and Water Board of a new Class A Land Use Permit for underground decline development and an extension to the existing Class B Water License for the management, treatment, and discharge of mine water from the mine site.
Q1/12: Water Board approves an extension to the Land Use Permit for use of the road connecting the mine to the Liard Highway, allowing for road rehabilitation work from the mine to Nahanni National Park Reserve boundary.
June 2012: Preliminary feasibility study is released with initial mineral reserve estimate.
GOVERNMENT & FIRST NATIONS AGREEMENTS IN PLACE The Prairie Creek mine is located in the DehCho Region of the Northwest Territories within the current boundary of the Nahanni National Park Reserve. However, in 2009, Canadian Zinc secured 300 square kilometres around the Prairie Creek deposit and guaranteed access to the property by amendments to the Parks Act (Figure 3). The park was originally established in 1972 by Prime Minister Pierre Elliott Trudeau, covering 4,766 square kilometres flanking the Nahanni River, but has since expanded to 30,050 square kilometres (most of the South Nahanni River watershed). Early development work and the mine’s (initial) construction occurred in the 1980s and 1990s before the park expansions. In 2012, a memorandum of understanding with Parks Canada was renewed outlining an agreement between Parks Canada and Canadian Zinc to work collaboratively, within their respective areas of responsibility, authority, and jurisdiction, to achieve their respective goals of managing Nahanni National Park Reserve and an operating Prairie Creek mine. And at the territorial level, Canadian Zinc has also signed a Socio-Economic Agreement with the GNWT establishing the methods and procedures by which the company and
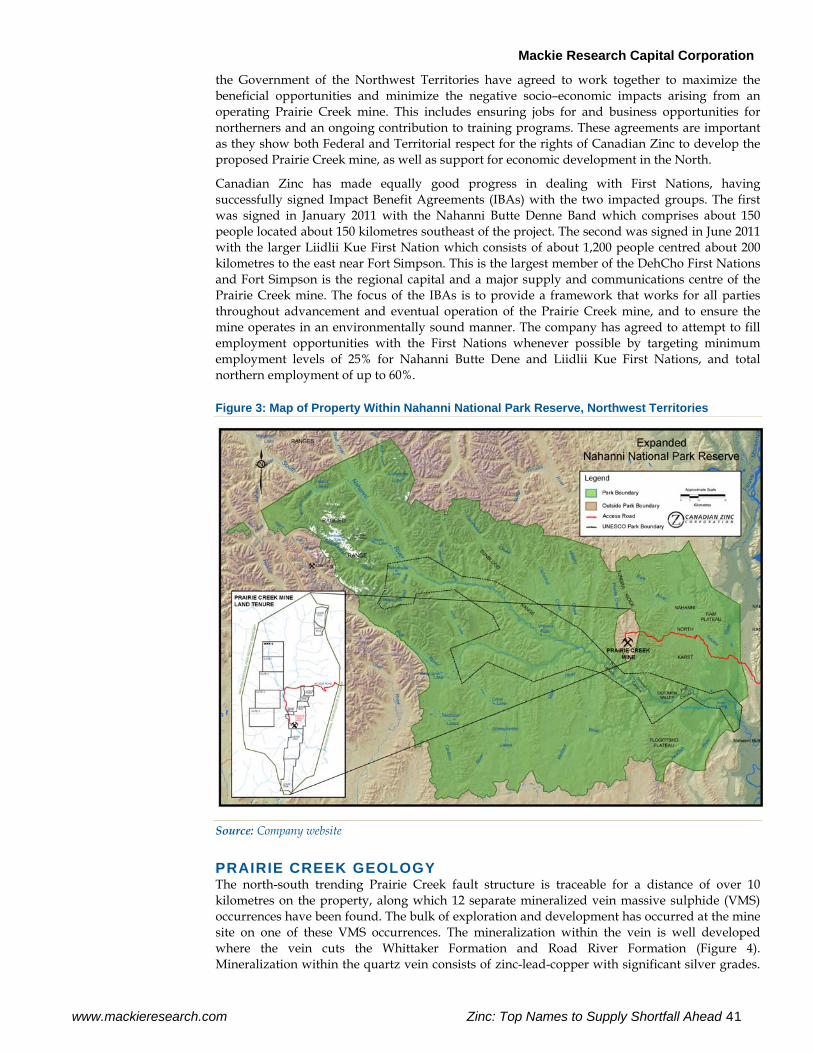
Mackie Research Capital Corporation
www.mackieresearch.com Zinc: Top Names to Supply Shortfall Ahead 41
the Government of the Northwest Territories have agreed to work together to maximize the beneficial opportunities and minimize the negative socio–economic impacts arising from an operating Prairie Creek mine. This includes ensuring jobs for and business opportunities for northerners and an ongoing contribution to training programs. These agreements are important as they show both Federal and Territorial respect for the rights of Canadian Zinc to develop the proposed Prairie Creek mine, as well as support for economic development in the North.
Canadian Zinc has made equally good progress in dealing with First Nations, having successfully signed Impact Benefit Agreements (IBAs) with the two impacted groups. The first was signed in January 2011 with the Nahanni Butte Denne Band which comprises about 150 people located about 150 kilometres southeast of the project. The second was signed in June 2011 with the larger Liidlii Kue First Nation which consists of about 1,200 people centred about 200 kilometres to the east near Fort Simpson. This is the largest member of the DehCho First Nations and Fort Simpson is the regional capital and a major supply and communications centre of the Prairie Creek mine. The focus of the IBAs is to provide a framework that works for all parties throughout advancement and eventual operation of the Prairie Creek mine, and to ensure the mine operates in an environmentally sound manner. The company has agreed to attempt to fill employment opportunities with the First Nations whenever possible by targeting minimum employment levels of 25% for Nahanni Butte Dene and Liidlii Kue First Nations, and total northern employment of up to 60%.
Figure 3: Map of Property Within Nahanni National Park Reserve, Northwest Territories
Source: Company website
PRAIRIE CREEK GEOLOGY The north-south trending Prairie Creek fault structure is traceable for a distance of over 10 kilometres on the property, along which 12 separate mineralized vein massive sulphide (VMS) occurrences have been found. The bulk of exploration and development has occurred at the mine site on one of these VMS occurrences. The mineralization within the vein is well developed where the vein cuts the Whittaker Formation and Road River Formation (Figure 4). Mineralization within the quartz vein consists of zinc-lead-copper with significant silver grades.
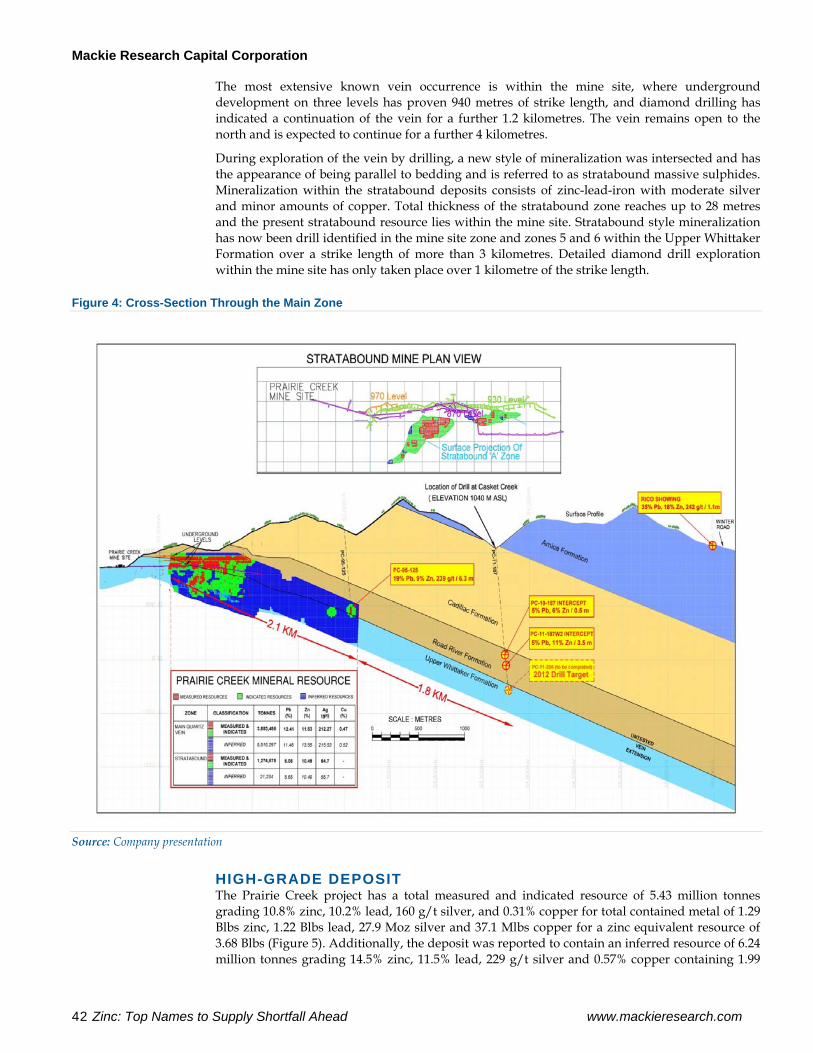
Mackie Research Capital Corporation
42 Zinc: Top Names to Supply Shortfall Ahead www.mackieresearch.com
The most extensive known vein occurrence is within the mine site, where underground development on three levels has proven 940 metres of strike length, and diamond drilling has indicated a continuation of the vein for a further 1.2 kilometres. The vein remains open to the north and is expected to continue for a further 4 kilometres.
During exploration of the vein by drilling, a new style of mineralization was intersected and has the appearance of being parallel to bedding and is referred to as stratabound massive sulphides. Mineralization within the stratabound deposits consists of zinc-lead-iron with moderate silver and minor amounts of copper. Total thickness of the stratabound zone reaches up to 28 metres and the present stratabound resource lies within the mine site. Stratabound style mineralization has now been drill identified in the mine site zone and zones 5 and 6 within the Upper Whittaker Formation over a strike length of more than 3 kilometres. Detailed diamond drill exploration within the mine site has only taken place over 1 kilometre of the strike length.
Figure 4: Cross-Section Through the Main Zone
Source: Company presentation
HIGH-GRADE DEPOSIT The Prairie Creek project has a total measured and indicated resource of 5.43 million tonnes grading 10.8% zinc, 10.2% lead, 160 g/t silver, and 0.31% copper for total contained metal of 1.29 Blbs zinc, 1.22 Blbs lead, 27.9 Moz silver and 37.1 Mlbs copper for a zinc equivalent resource of 3.68 Blbs (Figure 5). Additionally, the deposit was reported to contain an inferred resource of 6.24 million tonnes grading 14.5% zinc, 11.5% lead, 229 g/t silver and 0.57% copper containing 1.99
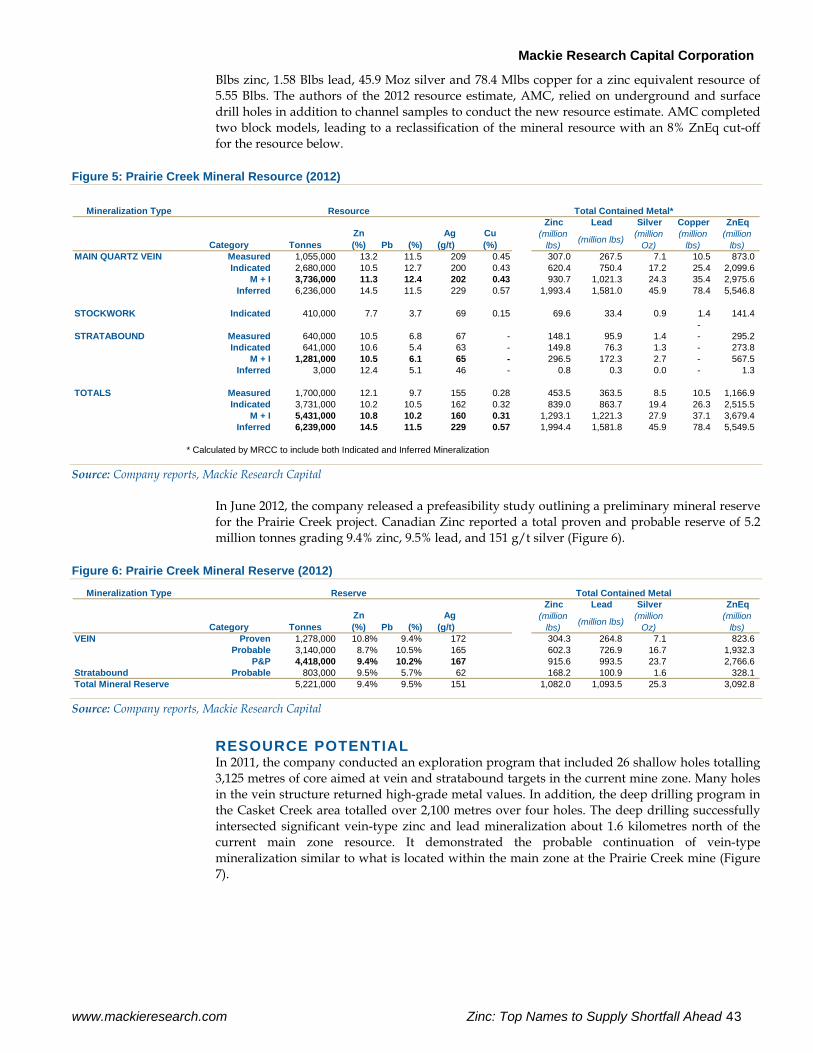
Mackie Research Capital Corporation
www.mackieresearch.com Zinc: Top Names to Supply Shortfall Ahead 43
Blbs zinc, 1.58 Blbs lead, 45.9 Moz silver and 78.4 Mlbs copper for a zinc equivalent resource of 5.55 Blbs. The authors of the 2012 resource estimate, AMC, relied on underground and surface drill holes in addition to channel samples to conduct the new resource estimate. AMC completed two block models, leading to a reclassification of the mineral resource with an 8% ZnEq cut-off for the resource below.
Figure 5: Prairie Creek Mineral Resource (2012)
Mineralization TypeZinc Lead Silver Copper ZnEq
Category TonnesZn (%) Pb (%)
Ag (g/t)
Cu (%)
(million lbs) (million lbs) (million
Oz)(million
lbs)(million
lbs)MAIN QUARTZ VEIN Measured 1,055,000 13.2 11.5 209 0.45 307.0 267.5 7.1 10.5 873.0
Indicated 2,680,000 10.5 12.7 200 0.43 620.4 750.4 17.2 25.4 2,099.6 M + I 3,736,000 11.3 12.4 202 0.43 930.7 1,021.3 24.3 35.4 2,975.6
Inferred 6,236,000 14.5 11.5 229 0.57 1,993.4 1,581.0 45.9 78.4 5,546.8
STOCKWORK Indicated 410,000 7.7 3.7 69 0.15 69.6 33.4 0.9 1.4 141.4 -
STRATABOUND Measured 640,000 10.5 6.8 67 - 148.1 95.9 1.4 - 295.2 Indicated 641,000 10.6 5.4 63 - 149.8 76.3 1.3 - 273.8
M + I 1,281,000 10.5 6.1 65 - 296.5 172.3 2.7 - 567.5 Inferred 3,000 12.4 5.1 46 - 0.8 0.3 0.0 - 1.3
TOTALS Measured 1,700,000 12.1 9.7 155 0.28 453.5 363.5 8.5 10.5 1,166.9 Indicated 3,731,000 10.2 10.5 162 0.32 839.0 863.7 19.4 26.3 2,515.5
M + I 5,431,000 10.8 10.2 160 0.31 1,293.1 1,221.3 27.9 37.1 3,679.4 Inferred 6,239,000 14.5 11.5 229 0.57 1,994.4 1,581.8 45.9 78.4 5,549.5
* Calculated by MRCC to include both Indicated and Inferred Mineralization
Resource Total Contained Metal*
Source: Company reports, Mackie Research Capital
In June 2012, the company released a prefeasibility study outlining a preliminary mineral reserve for the Prairie Creek project. Canadian Zinc reported a total proven and probable reserve of 5.2 million tonnes grading 9.4% zinc, 9.5% lead, and 151 g/t silver (Figure 6).
Figure 6: Prairie Creek Mineral Reserve (2012)
Mineralization TypeZinc Lead Silver ZnEq
Category TonnesZn (%) Pb (%)
Ag (g/t)
(million lbs) (million lbs) (million
Oz)(million
lbs)VEIN Proven 1,278,000 10.8% 9.4% 172 304.3 264.8 7.1 823.6
Probable 3,140,000 8.7% 10.5% 165 602.3 726.9 16.7 1,932.3 P&P 4,418,000 9.4% 10.2% 167 915.6 993.5 23.7 2,766.6
Stratabound Probable 803,000 9.5% 5.7% 62 168.2 100.9 1.6 328.1 Total Mineral Reserve 5,221,000 9.4% 9.5% 151 1,082.0 1,093.5 25.3 3,092.8
Reserve Total Contained Metal
Source: Company reports, Mackie Research Capital
RESOURCE POTENTIAL In 2011, the company conducted an exploration program that included 26 shallow holes totalling 3,125 metres of core aimed at vein and stratabound targets in the current mine zone. Many holes in the vein structure returned high-grade metal values. In addition, the deep drilling program in the Casket Creek area totalled over 2,100 metres over four holes. The deep drilling successfully intersected significant vein-type zinc and lead mineralization about 1.6 kilometres north of the current main zone resource. It demonstrated the probable continuation of vein-type mineralization similar to what is located within the main zone at the Prairie Creek mine (Figure 7).
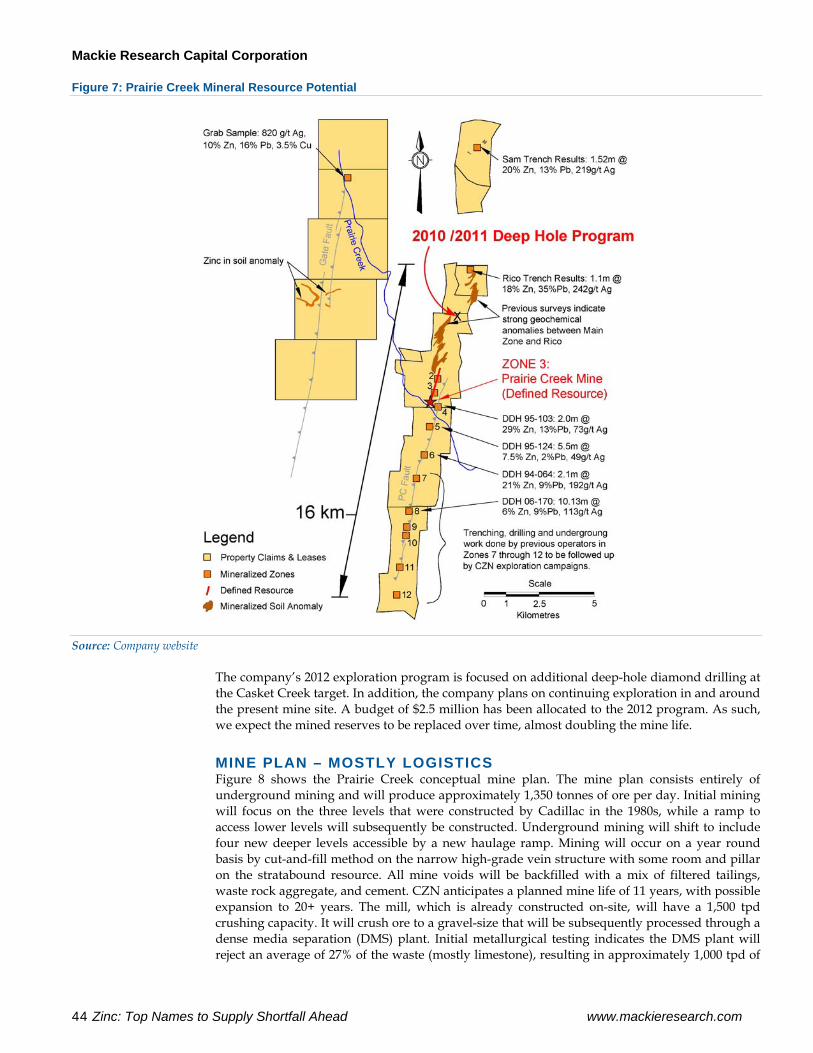
Mackie Research Capital Corporation
44 Zinc: Top Names to Supply Shortfall Ahead www.mackieresearch.com
Figure 7: Prairie Creek Mineral Resource Potential
Source: Company website
The company’s 2012 exploration program is focused on additional deep-hole diamond drilling at the Casket Creek target. In addition, the company plans on continuing exploration in and around the present mine site. A budget of $2.5 million has been allocated to the 2012 program. As such, we expect the mined reserves to be replaced over time, almost doubling the mine life.
MINE PLAN – MOSTLY LOGISTICS Figure 8 shows the Prairie Creek conceptual mine plan. The mine plan consists entirely of underground mining and will produce approximately 1,350 tonnes of ore per day. Initial mining will focus on the three levels that were constructed by Cadillac in the 1980s, while a ramp to access lower levels will subsequently be constructed. Underground mining will shift to include four new deeper levels accessible by a new haulage ramp. Mining will occur on a year round basis by cut-and-fill method on the narrow high-grade vein structure with some room and pillar on the stratabound resource. All mine voids will be backfilled with a mix of filtered tailings, waste rock aggregate, and cement. CZN anticipates a planned mine life of 11 years, with possible expansion to 20+ years. The mill, which is already constructed on-site, will have a 1,500 tpd crushing capacity. It will crush ore to a gravel-size that will be subsequently processed through a dense media separation (DMS) plant. Initial metallurgical testing indicates the DMS plant will reject an average of 27% of the waste (mostly limestone), resulting in approximately 1,000 tpd of
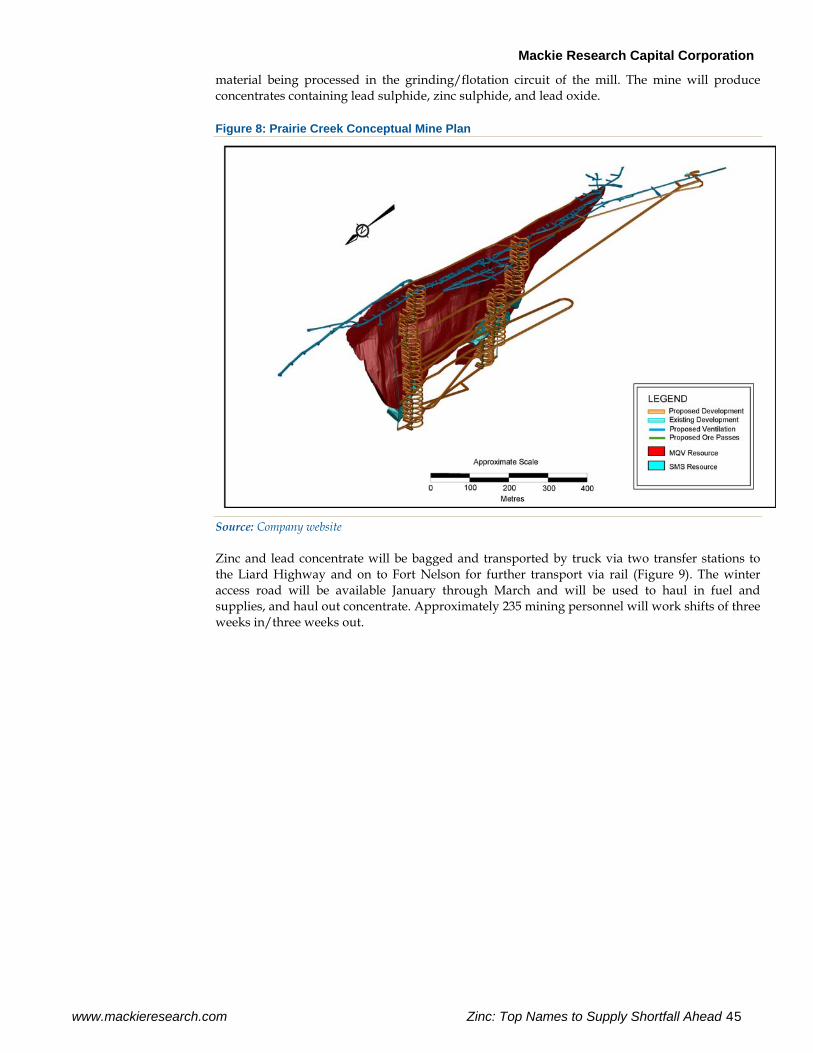
Mackie Research Capital Corporation
www.mackieresearch.com Zinc: Top Names to Supply Shortfall Ahead 45
material being processed in the grinding/flotation circuit of the mill. The mine will produce concentrates containing lead sulphide, zinc sulphide, and lead oxide.
Figure 8: Prairie Creek Conceptual Mine Plan
Source: Company website
Zinc and lead concentrate will be bagged and transported by truck via two transfer stations to the Liard Highway and on to Fort Nelson for further transport via rail (Figure 9). The winter access road will be available January through March and will be used to haul in fuel and supplies, and haul out concentrate. Approximately 235 mining personnel will work shifts of three weeks in/three weeks out.
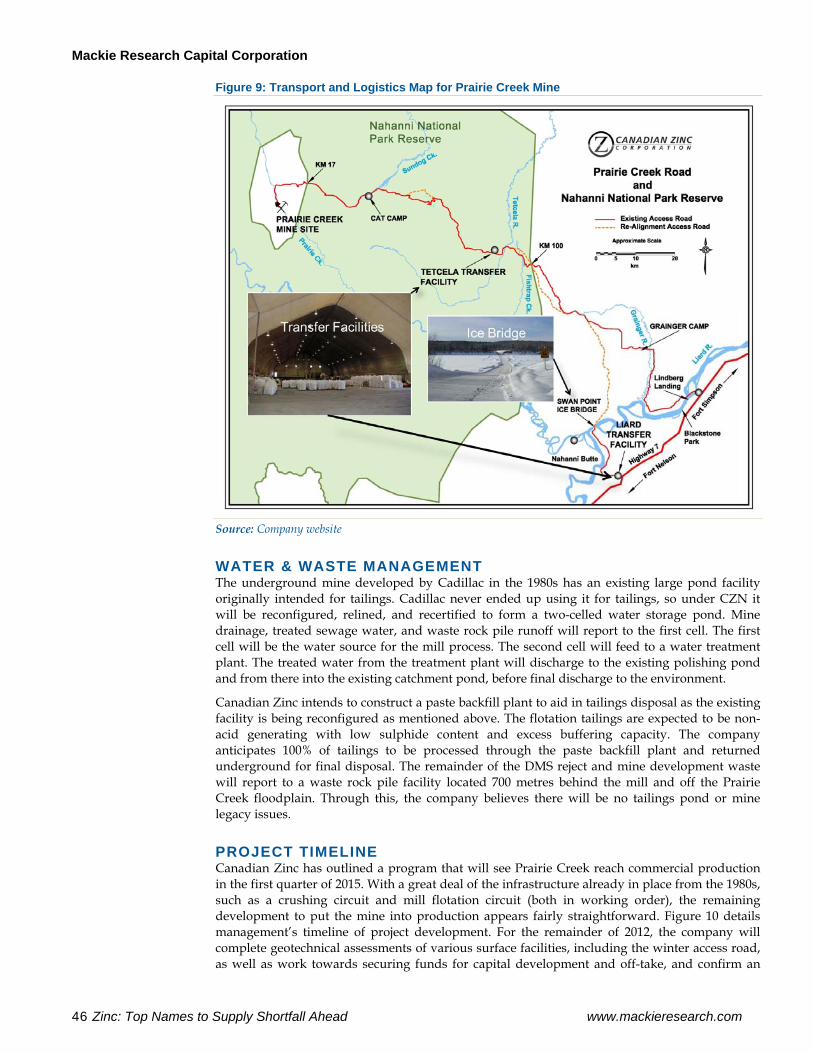
Mackie Research Capital Corporation
46 Zinc: Top Names to Supply Shortfall Ahead www.mackieresearch.com
Figure 9: Transport and Logistics Map for Prairie Creek Mine
Source: Company website
WATER & WASTE MANAGEMENT The underground mine developed by Cadillac in the 1980s has an existing large pond facility originally intended for tailings. Cadillac never ended up using it for tailings, so under CZN it will be reconfigured, relined, and recertified to form a two-celled water storage pond. Mine drainage, treated sewage water, and waste rock pile runoff will report to the first cell. The first cell will be the water source for the mill process. The second cell will feed to a water treatment plant. The treated water from the treatment plant will discharge to the existing polishing pond and from there into the existing catchment pond, before final discharge to the environment.
Canadian Zinc intends to construct a paste backfill plant to aid in tailings disposal as the existing facility is being reconfigured as mentioned above. The flotation tailings are expected to be non-acid generating with low sulphide content and excess buffering capacity. The company anticipates 100% of tailings to be processed through the paste backfill plant and returned underground for final disposal. The remainder of the DMS reject and mine development waste will report to a waste rock pile facility located 700 metres behind the mill and off the Prairie Creek floodplain. Through this, the company believes there will be no tailings pond or mine legacy issues.
PROJECT TIMELINE Canadian Zinc has outlined a program that will see Prairie Creek reach commercial production in the first quarter of 2015. With a great deal of the infrastructure already in place from the 1980s, such as a crushing circuit and mill flotation circuit (both in working order), the remaining development to put the mine into production appears fairly straightforward. Figure 10 details management’s timeline of project development. For the remainder of 2012, the company will complete geotechnical assessments of various surface facilities, including the winter access road, as well as work towards securing funds for capital development and off-take, and confirm an
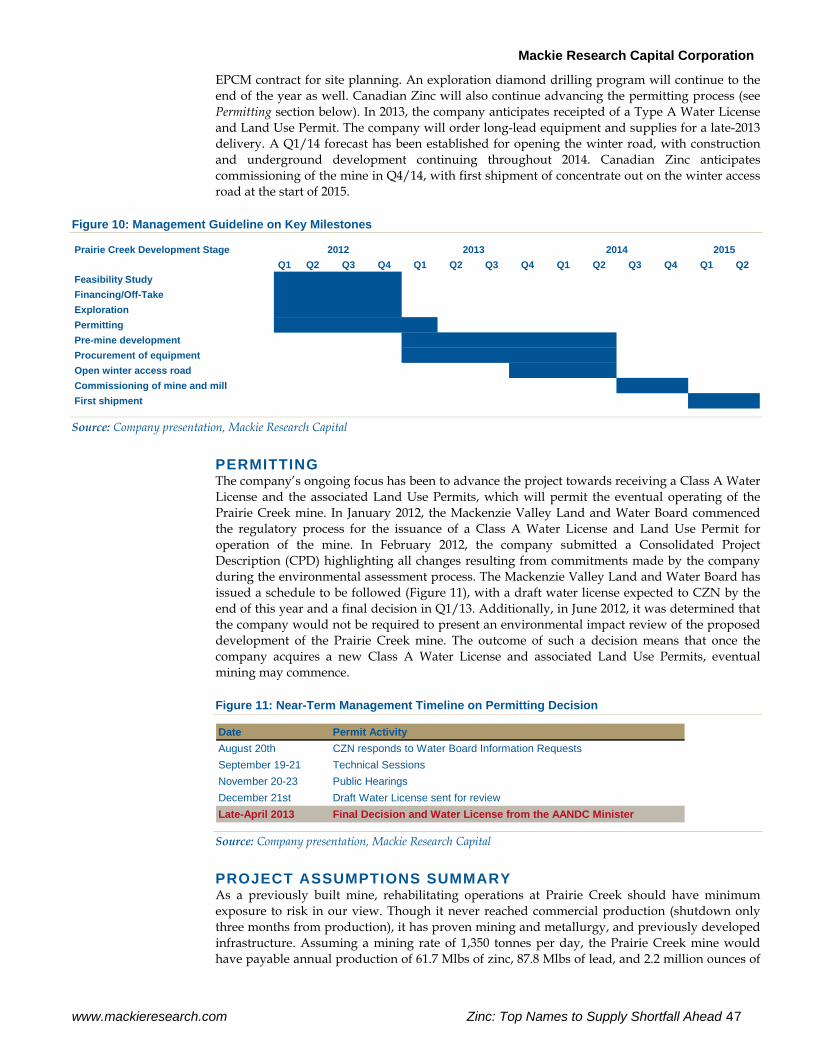
Mackie Research Capital Corporation
www.mackieresearch.com Zinc: Top Names to Supply Shortfall Ahead 47
EPCM contract for site planning. An exploration diamond drilling program will continue to the end of the year as well. Canadian Zinc will also continue advancing the permitting process (see Permitting section below). In 2013, the company anticipates receipted of a Type A Water License and Land Use Permit. The company will order long-lead equipment and supplies for a late-2013 delivery. A Q1/14 forecast has been established for opening the winter road, with construction and underground development continuing throughout 2014. Canadian Zinc anticipates commissioning of the mine in Q4/14, with first shipment of concentrate out on the winter access road at the start of 2015.
Figure 10: Management Guideline on Key Milestones
Prairie Creek Development StageQ1 Q2 Q3 Q4 Q1 Q2 Q3 Q4 Q1 Q2 Q3 Q4 Q1 Q2
Feasibility StudyFinancing/Off-TakeExploration PermittingPre-mine developmentProcurement of equipmentOpen winter access roadCommissioning of mine and millFirst shipment
2012 2013 2014 2015
Source: Company presentation, Mackie Research Capital
PERMITTING The company’s ongoing focus has been to advance the project towards receiving a Class A Water License and the associated Land Use Permits, which will permit the eventual operating of the Prairie Creek mine. In January 2012, the Mackenzie Valley Land and Water Board commenced the regulatory process for the issuance of a Class A Water License and Land Use Permit for operation of the mine. In February 2012, the company submitted a Consolidated Project Description (CPD) highlighting all changes resulting from commitments made by the company during the environmental assessment process. The Mackenzie Valley Land and Water Board has issued a schedule to be followed (Figure 11), with a draft water license expected to CZN by the end of this year and a final decision in Q1/13. Additionally, in June 2012, it was determined that the company would not be required to present an environmental impact review of the proposed development of the Prairie Creek mine. The outcome of such a decision means that once the company acquires a new Class A Water License and associated Land Use Permits, eventual mining may commence.
Figure 11: Near-Term Management Timeline on Permitting Decision
Date Permit ActivityAugust 20th CZN responds to Water Board Information RequestsSeptember 19-21 Technical SessionsNovember 20-23 Public HearingsDecember 21st Draft Water License sent for reviewLate-April 2013 Final Decision and Water License from the AANDC Minister Source: Company presentation, Mackie Research Capital
PROJECT ASSUMPTIONS SUMMARY As a previously built mine, rehabilitating operations at Prairie Creek should have minimum exposure to risk in our view. Though it never reached commercial production (shutdown only three months from production), it has proven mining and metallurgy, and previously developed infrastructure. Assuming a mining rate of 1,350 tonnes per day, the Prairie Creek mine would have payable annual production of 61.7 Mlbs of zinc, 87.8 Mlbs of lead, and 2.2 million ounces of
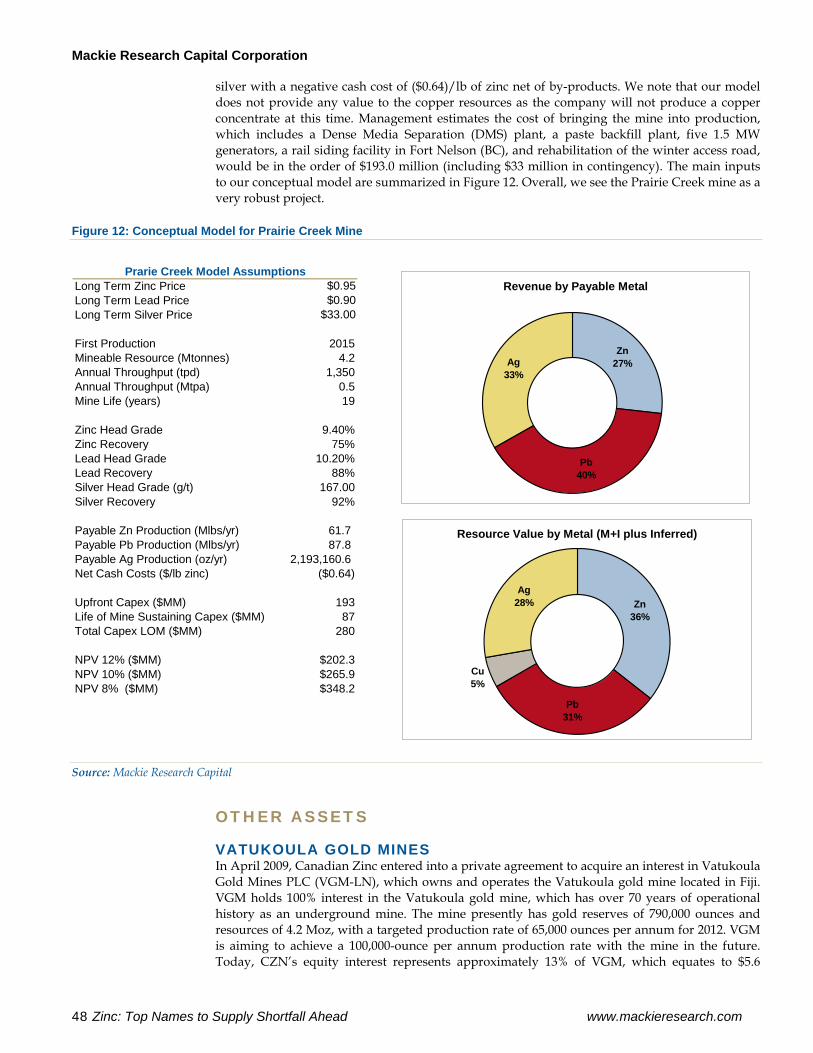
Mackie Research Capital Corporation
48 Zinc: Top Names to Supply Shortfall Ahead www.mackieresearch.com
silver with a negative cash cost of ($0.64)/lb of zinc net of by-products. We note that our model does not provide any value to the copper resources as the company will not produce a copper concentrate at this time. Management estimates the cost of bringing the mine into production, which includes a Dense Media Separation (DMS) plant, a paste backfill plant, five 1.5 MW generators, a rail siding facility in Fort Nelson (BC), and rehabilitation of the winter access road, would be in the order of $193.0 million (including $33 million in contingency). The main inputs to our conceptual model are summarized in Figure 12. Overall, we see the Prairie Creek mine as a very robust project.
Figure 12: Conceptual Model for Prairie Creek Mine
Long Term Zinc Price $0.95 Long Term Lead Price $0.90 Long Term Silver Price $33.00
First Production 2015Mineable Resource (Mtonnes) 4.2Annual Throughput (tpd) 1,350Annual Throughput (Mtpa) 0.5Mine Life (years) 19
Zinc Head Grade 9.40%Zinc Recovery 75%Lead Head Grade 10.20%Lead Recovery 88%Silver Head Grade (g/t) 167.00Silver Recovery 92%
Payable Zn Production (Mlbs/yr) 61.7 Payable Pb Production (Mlbs/yr) 87.8 Payable Ag Production (oz/yr) 2,193,160.6 Net Cash Costs ($/lb zinc) ($0.64)
Upfront Capex ($MM) 193Life of Mine Sustaining Capex ($MM) 87Total Capex LOM ($MM) 280
NPV 12% ($MM) $202.3NPV 10% ($MM) $265.9NPV 8% ($MM) $348.2
Prarie Creek Model AssumptionsRevenue by Payable Metal
Zn27%
Pb40%
Ag33%
Resource Value by Metal (M+I plus Inferred)
Zn36%
Pb31%
Ag28%
Cu5%
Source: Mackie Research Capital
OTHER ASSETS
VATUKOULA GOLD MINES In April 2009, Canadian Zinc entered into a private agreement to acquire an interest in Vatukoula Gold Mines PLC (VGM-LN), which owns and operates the Vatukoula gold mine located in Fiji. VGM holds 100% interest in the Vatukoula gold mine, which has over 70 years of operational history as an underground mine. The mine presently has gold reserves of 790,000 ounces and resources of 4.2 Moz, with a targeted production rate of 65,000 ounces per annum for 2012. VGM is aiming to achieve a 100,000-ounce per annum production rate with the mine in the future. Today, CZN’s equity interest represents approximately 13% of VGM, which equates to $5.6
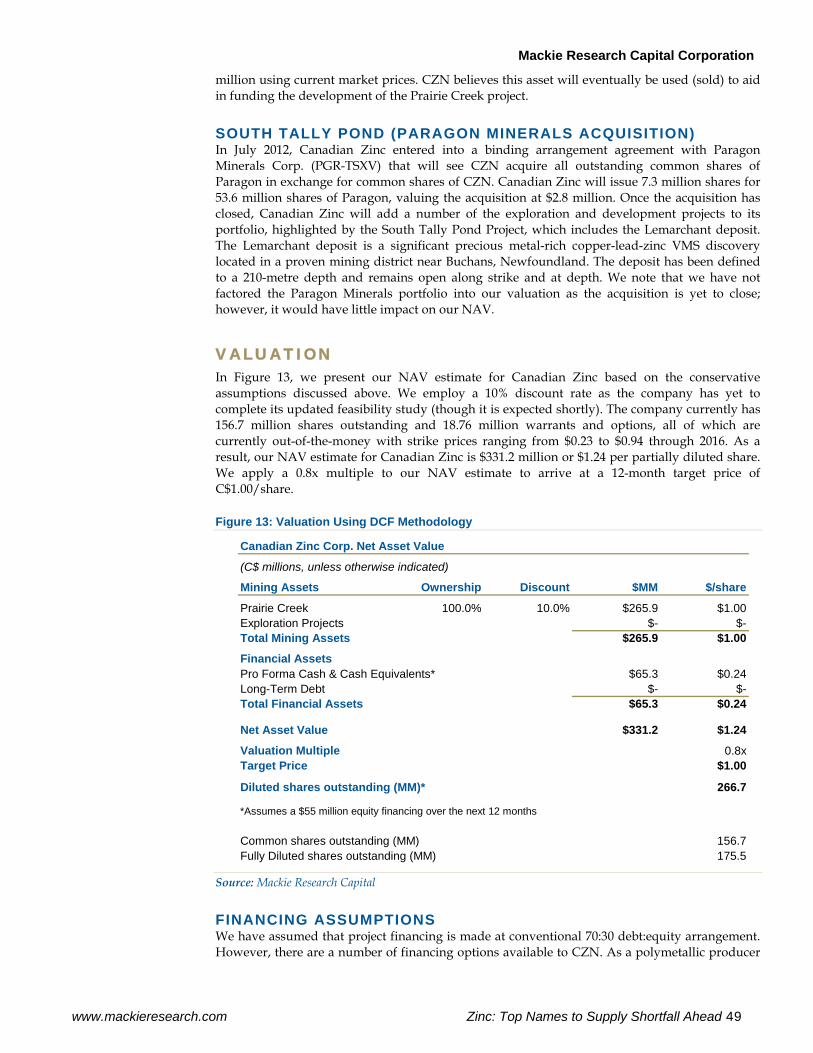
Mackie Research Capital Corporation
www.mackieresearch.com Zinc: Top Names to Supply Shortfall Ahead 49
million using current market prices. CZN believes this asset will eventually be used (sold) to aid in funding the development of the Prairie Creek project.
SOUTH TALLY POND (PARAGON MINERALS ACQUISITION) In July 2012, Canadian Zinc entered into a binding arrangement agreement with Paragon Minerals Corp. (PGR-TSXV) that will see CZN acquire all outstanding common shares of Paragon in exchange for common shares of CZN. Canadian Zinc will issue 7.3 million shares for 53.6 million shares of Paragon, valuing the acquisition at $2.8 million. Once the acquisition has closed, Canadian Zinc will add a number of the exploration and development projects to its portfolio, highlighted by the South Tally Pond Project, which includes the Lemarchant deposit. The Lemarchant deposit is a significant precious metal-rich copper-lead-zinc VMS discovery located in a proven mining district near Buchans, Newfoundland. The deposit has been defined to a 210-metre depth and remains open along strike and at depth. We note that we have not factored the Paragon Minerals portfolio into our valuation as the acquisition is yet to close; however, it would have little impact on our NAV.
VALUATION In Figure 13, we present our NAV estimate for Canadian Zinc based on the conservative assumptions discussed above. We employ a 10% discount rate as the company has yet to complete its updated feasibility study (though it is expected shortly). The company currently has 156.7 million shares outstanding and 18.76 million warrants and options, all of which are currently out-of-the-money with strike prices ranging from $0.23 to $0.94 through 2016. As a result, our NAV estimate for Canadian Zinc is $331.2 million or $1.24 per partially diluted share. We apply a 0.8x multiple to our NAV estimate to arrive at a 12-month target price of C$1.00/share.
Figure 13: Valuation Using DCF Methodology
Canadian Zinc Corp. Net Asset Value
(C$ millions, unless otherwise indicated)
Mining Assets Ownership Discount $MM $/share
Prairie Creek 100.0% 10.0% $265.9 $1.00Exploration Projects $- $-Total Mining Assets $265.9 $1.00
Financial AssetsPro Forma Cash & Cash Equivalents* $65.3 $0.24Long-Term Debt $- $-Total Financial Assets $65.3 $0.24
Net Asset Value $331.2 $1.24
Valuation Multiple 0.8xTarget Price $1.00
Diluted shares outstanding (MM)* 266.7
*Assumes a $55 million equity financing over the next 12 months
Common shares outstanding (MM) 156.7Fully Diluted shares outstanding (MM) 175.5
Source: Mackie Research Capital
FINANCING ASSUMPTIONS We have assumed that project financing is made at conventional 70:30 debt:equity arrangement. However, there are a number of financing options available to CZN. As a polymetallic producer
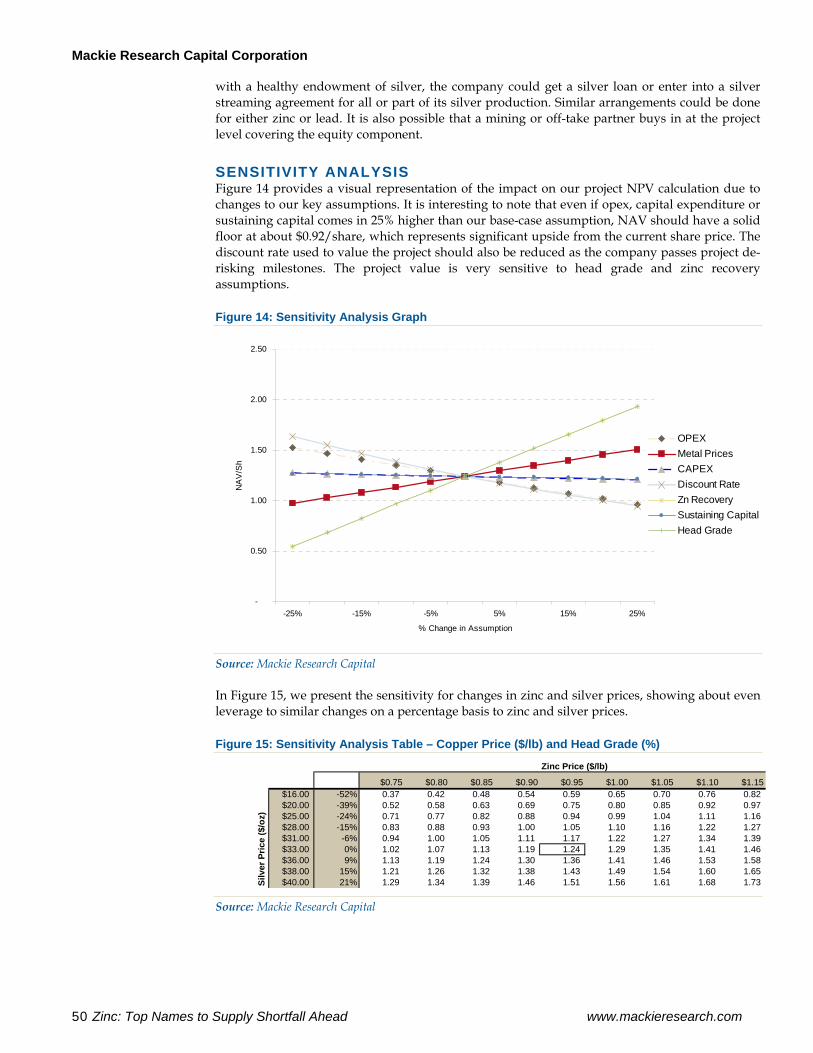
Mackie Research Capital Corporation
50 Zinc: Top Names to Supply Shortfall Ahead www.mackieresearch.com
with a healthy endowment of silver, the company could get a silver loan or enter into a silver streaming agreement for all or part of its silver production. Similar arrangements could be done for either zinc or lead. It is also possible that a mining or off-take partner buys in at the project level covering the equity component.
SENSITIVITY ANALYSIS Figure 14 provides a visual representation of the impact on our project NPV calculation due to changes to our key assumptions. It is interesting to note that even if opex, capital expenditure or sustaining capital comes in 25% higher than our base-case assumption, NAV should have a solid floor at about $0.92/share, which represents significant upside from the current share price. The discount rate used to value the project should also be reduced as the company passes project de-risking milestones. The project value is very sensitive to head grade and zinc recovery assumptions.
Figure 14: Sensitivity Analysis Graph
-
0.50
1.00
1.50
2.00
2.50
-25% -15% -5% 5% 15% 25%
% Change in Assumption
NA
V/S
h
OPEXMetal PricesCAPEXDiscount RateZn RecoverySustaining CapitalHead Grade
Source: Mackie Research Capital
In Figure 15, we present the sensitivity for changes in zinc and silver prices, showing about even leverage to similar changes on a percentage basis to zinc and silver prices.
Figure 15: Sensitivity Analysis Table – Copper Price ($/lb) and Head Grade (%)
Zinc Price ($/lb)
$0.75 $0.80 $0.85 $0.90 $0.95 $1.00 $1.05 $1.10 $1.15$16.00 -52% 0.37 0.42 0.48 0.54 0.59 0.65 0.70 0.76 0.82 $20.00 -39% 0.52 0.58 0.63 0.69 0.75 0.80 0.85 0.92 0.97 $25.00 -24% 0.71 0.77 0.82 0.88 0.94 0.99 1.04 1.11 1.16 $28.00 -15% 0.83 0.88 0.93 1.00 1.05 1.10 1.16 1.22 1.27 $31.00 -6% 0.94 1.00 1.05 1.11 1.17 1.22 1.27 1.34 1.39 $33.00 0% 1.02 1.07 1.13 1.19 1.24 1.29 1.35 1.41 1.46 $36.00 9% 1.13 1.19 1.24 1.30 1.36 1.41 1.46 1.53 1.58 $38.00 15% 1.21 1.26 1.32 1.38 1.43 1.49 1.54 1.60 1.65 $40.00 21% 1.29 1.34 1.39 1.46 1.51 1.56 1.61 1.68 1.73 Si
lver
Pric
e ($
/oz)
Source: Mackie Research Capital
Mackie Research Capital Corporation
www.mackieresearch.com Zinc: Top Names to Supply Shortfall Ahead 51
CATALYSTS We anticipate several key events in the second half of 2012 that should act as positive catalysts for the stock price and move it towards our NAV of C$1.24/share. These include:
Full Feasibility Study (Q4/12): Canadian Zinc is anticipated to complete a full feasibility study that will incorporate additional material, such as further site investigation and geo-technical drilling, water storage ponds, and road construction sites. The study will be incorporated with updated permitting parameters and is expected later in 2012.
Receipt of Final Permits (H1/13): The Mackenzie Valley Land and Water Board is scheduled to issue the draft Class A Water License and associated Land Use Permits in Q4/12, with the final version being granted in April 2013.
Exploration Success: With several targets identified on the Prairie Creek property, we see good potential to add resources to the current mine plan over the course of 2012 and into 2013.
Financing (2012-2013): With an additional $160 million needed for initial expenditures to bring the mine online, we anticipate the company to do a significant raise of approximately $160 million following the release of the feasibility study and receipt of the remaining permits in early 2013.
RISKS Canadian Zinc is subject to the same general risks as outlined in the back of this report and, as a developer, is most exposed to cost escalation risk, but of particular note with respect to CZN, we would highlight:
Permitting Risk: As a project located in the Northwest Territories, and in near proximity to a National Reserve and various First Nations group, the Prairie Creek project is subject to fairly strict permitting and environmental regulations. However, since Canadian Zinc has already signed IBAs with First Nations and an MOU with Parks Canada guaranteeing access, it is largely de-risked. Receiving its Class A water license remains the main outstanding permitting issue and this should be granted in the next six months.
Financing Risk: Canadian Zinc currently has $13.0 million in cash and cash equivalents, which is sufficient to complete the upcoming feasibility study. With the permitting process ongoing, and an approximately $160 million capital spend coming, Canadian Zinc will require additional funding from capital markets. Current market uncertainty increases the risk of being able to adequately raise the required funds and the cost of such a raise.
Geographic Risk: A key challenge for Canadian Zinc is the geographic location of the Prairie Creek mine. The company located in the far north must contend with a harsh winter climate and a shipping window of only three months by a yet-to-be constructed winter road connecting the property to the highway. This will require high working capital and puts the company at liquidity risk should environmental factors restrict transport during the three months of road access.
Commodity Price Risk: The primary metal exposures for Canadian Zinc are zinc, lead, and silver. The variety of metals and potential to hedge pricing on a portion of some of these metals can limit the risk in a production scenario.
CONCLUSION Canadian Zinc offers an opportunity to invest in a high-grade, zinc-levered polymetallic development story. The company is following an aggressive 2012 program that should see continued refurbishment on the mine site as well as the receipt of its final key permits. The main hurdle at present is the weakness in the equity markets as the company should need to raise

Mackie Research Capital Corporation
52 Zinc: Top Names to Supply Shortfall Ahead www.mackieresearch.com
about ~$160 million in the near future. As such, we apply a 0.8x multiple to our NAV estimate to arrive at a 12-month target price of C$1.00/share. Even heavily discounted, the stock offers excellent value at current levels trading at 0.31x our NAV and 0.39x our target, with significant potential upside as it passes upcoming permitting, technical, and financing milestones. We are initiating coverage of Canadian Zinc Corp. with a BUY recommendation and a 12-month target price of C$1.00/share.
Mackie Research Capital Corporation
www.mackieresearch.com Zinc: Top Names to Supply Shortfall Ahead 53
MANAGEMENT TEAM John F. Kearney, President, CEO & Director: Mr. Kearney has over 35 years of experience in the mining industry worldwide. With degrees in law, economics, and business administration, he has a strong background in corporate development, finance, and managing public companies, primarily in the mining field. He was previously President and Chief Executive of Northgate Exploration Limited, Campbell Resources Inc., and Sonora Gold Corp. He is currently Chairman of Labrador Iron Mines Holdings Limited, Anglesey Mining plc, and Conquest Resources Limited, Xtierra Inc., as well as Director of Avnel Gold Mining Ltd. and Minco plc. He is also a director of the Mining Association of Canada, and of the NWT and Nunavut Chamber of Mines. A Director of Canadian Zinc since 2001, Mr. Kearney was appointed President in June 2003 and since that time has led the company in the redevelopment of the Prairie Creek mine, including raising over $40 million.
Alan Taylor, VP Exploration and Chief Operating Officer: Mr. Taylor has over 25 years of experience in the mineral exploration industry and is a qualified P.Geo. with a Master’s degree in Geology. He previously worked with Cominco, Imperial Metals Corporation, the Geological Survey of Canada, the Ontario Geological Survey, along with numerous other junior companies throughout the world. He is a member of the Geological Association of Canada, the Canadian Institute of Mining and Metallurgy and BC & NWT Chamber of Mines. Mr. Taylor was formerly president of San Andreas Resources (Canadian Zinc’s predecessor company) and has been involved with the Prairie Creek mine and property for over 15 years. During his involvement on the property, the mineral resource base quadrupled as a result of exploration.
Trevor Cunningham, Chief Financial Officer: Mr. Cunningham is a Certified Management Accountant of British Columbia and has previously been employed in various financial positions by a number of mineral resource companies.
Brian Atkins, Director: Mr. Atkins received a Bachelor of Commerce degree from the University of British Columbia and subsequently qualified as a Chartered Accountant with the British Columbia Institute of Chartered Accountants (BCICA). Mr. Atkins has actively participated within the BCICA organization on the Bylaws Committee, President Nominating Committee, and Arbitration Committee. He is knowledgeable and experienced with financial reporting requirements of public companies and currently is a Director of the North Shore Credit Union and a former member of the Independent Review Committee of Inhance Investment Management Inc. Mr. Atkins is a former partner with KPMG Chartered Accountants.
John A. MacPherson, Director: Mr. MacPherson is the original visionary and founding chairman of Canadian Zinc Corporation. He has been active in public markets, corporate finance, and corporate development for over 30 years. During this time, he has led the strategic development of several successful ventures, primarily in the fields of mining and oil and gas.
David Nickerson, Director: Mr. Nickerson has spent much of his life as a Member of the Legislative Assembly of the Northwest Territories, where he served as Minister of Health and Social Services, and as a Member of Parliament for nearly 10 years. He served as Chairman of the Northwest Territories Water Board, a federal body charged with the administration of water rights and environmental protection in the NWT, and also as a member of the Development Appeal Board for the City of Yellowknife. A Professional Engineer, Mr. Nickerson holds a Bachelor’s Degree in Mining Engineering and a Master’s Degree in Mineral Exploration.

Mackie Research Capital Corporation
54 Zinc: Top Names to Supply Shortfall Ahead www.mackieresearch.com
This page left intentionally blank.
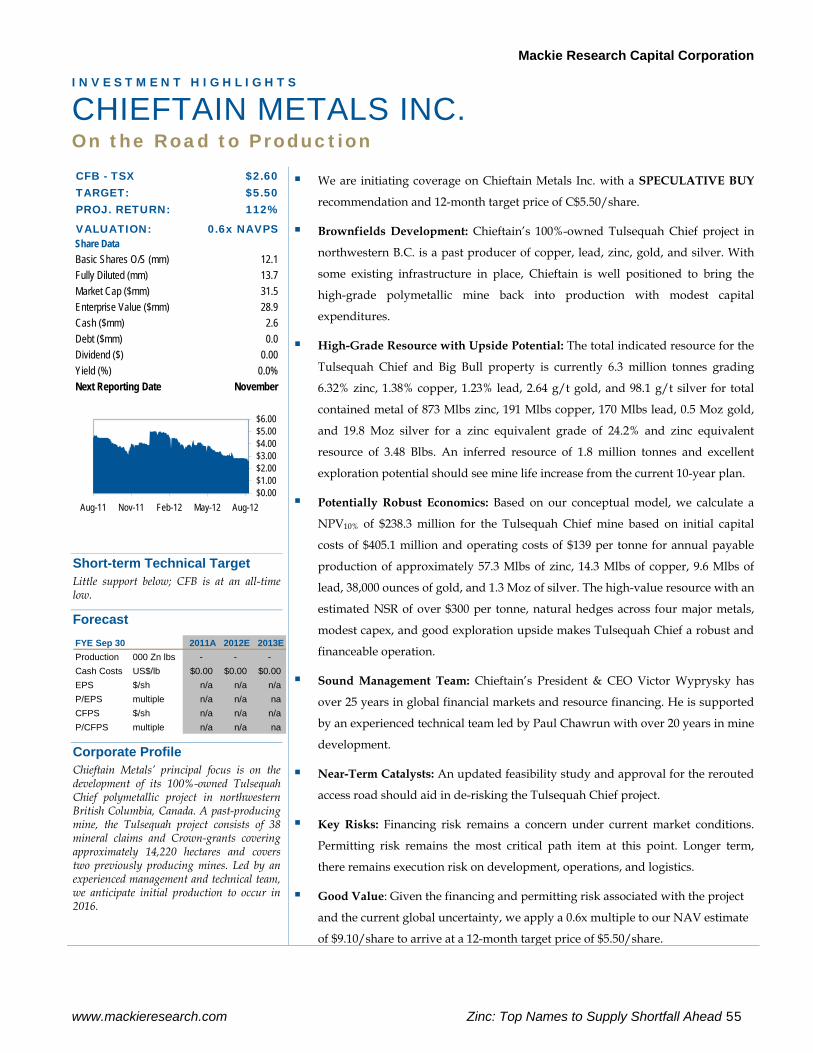
Mackie Research Capital Corporation
www.mackieresearch.com Zinc: Top Names to Supply Shortfall Ahead 55
I N V E S T M E N T H I G H L I G H T S
CHIEFTAIN METALS INC. On the Road to Production
CFB - TSX $2.60TARGET: $5.50PROJ. RETURN: 112%
VALUATION: 0.6x NAVPSShare DataBasic Shares O/S (mm) 12.1Fully Diluted (mm) 13.7Market Cap ($mm) 31.5Enterprise Value ($mm) 28.9Cash ($mm) 2.6Debt ($mm) 0.0Dividend ($) 0.00Yield (%) 0.0%Next Reporting Date November
$0.00$1.00$2.00$3.00$4.00$5.00$6.00
Aug-11 Nov-11 Feb-12 May-12 Aug-12
Short-term Technical Target Little support below; CFB is at an all-time low.
Forecast FYE Sep 30 2011A 2012E 2013EProduction 000 Zn lbs - - - Cash Costs US$/lb $0.00 $0.00 $0.00EPS $/sh n/a n/a n/aP/EPS multiple n/a n/a naCFPS $/sh n/a n/a n/aP/CFPS multiple n/a n/a na
Corporate Profile Chieftain Metals’ principal focus is on the development of its 100%-owned Tulsequah Chief polymetallic project in northwestern British Columbia, Canada. A past-producing mine, the Tulsequah project consists of 38 mineral claims and Crown-grants covering approximately 14,220 hectares and covers two previously producing mines. Led by an experienced management and technical team, we anticipate initial production to occur in 2016.
We are initiating coverage on Chieftain Metals Inc. with a SPECULATIVE BUY
recommendation and 12-month target price of C$5.50/share.
Brownfields Development: Chieftain’s 100%-owned Tulsequah Chief project in
northwestern B.C. is a past producer of copper, lead, zinc, gold, and silver. With
some existing infrastructure in place, Chieftain is well positioned to bring the
high-grade polymetallic mine back into production with modest capital
expenditures.
High-Grade Resource with Upside Potential: The total indicated resource for the
Tulsequah Chief and Big Bull property is currently 6.3 million tonnes grading
6.32% zinc, 1.38% copper, 1.23% lead, 2.64 g/t gold, and 98.1 g/t silver for total
contained metal of 873 Mlbs zinc, 191 Mlbs copper, 170 Mlbs lead, 0.5 Moz gold,
and 19.8 Moz silver for a zinc equivalent grade of 24.2% and zinc equivalent
resource of 3.48 Blbs. An inferred resource of 1.8 million tonnes and excellent
exploration potential should see mine life increase from the current 10-year plan.
Potentially Robust Economics: Based on our conceptual model, we calculate a
NPV10% of $238.3 million for the Tulsequah Chief mine based on initial capital
costs of $405.1 million and operating costs of $139 per tonne for annual payable
production of approximately 57.3 Mlbs of zinc, 14.3 Mlbs of copper, 9.6 Mlbs of
lead, 38,000 ounces of gold, and 1.3 Moz of silver. The high-value resource with an
estimated NSR of over $300 per tonne, natural hedges across four major metals,
modest capex, and good exploration upside makes Tulsequah Chief a robust and
financeable operation.
Sound Management Team: Chieftain’s President & CEO Victor Wyprysky has
over 25 years in global financial markets and resource financing. He is supported
by an experienced technical team led by Paul Chawrun with over 20 years in mine
development.
Near-Term Catalysts: An updated feasibility study and approval for the rerouted
access road should aid in de-risking the Tulsequah Chief project.
Key Risks: Financing risk remains a concern under current market conditions.
Permitting risk remains the most critical path item at this point. Longer term,
there remains execution risk on development, operations, and logistics.
Good Value: Given the financing and permitting risk associated with the project
and the current global uncertainty, we apply a 0.6x multiple to our NAV estimate
of $9.10/share to arrive at a 12-month target price of $5.50/share.
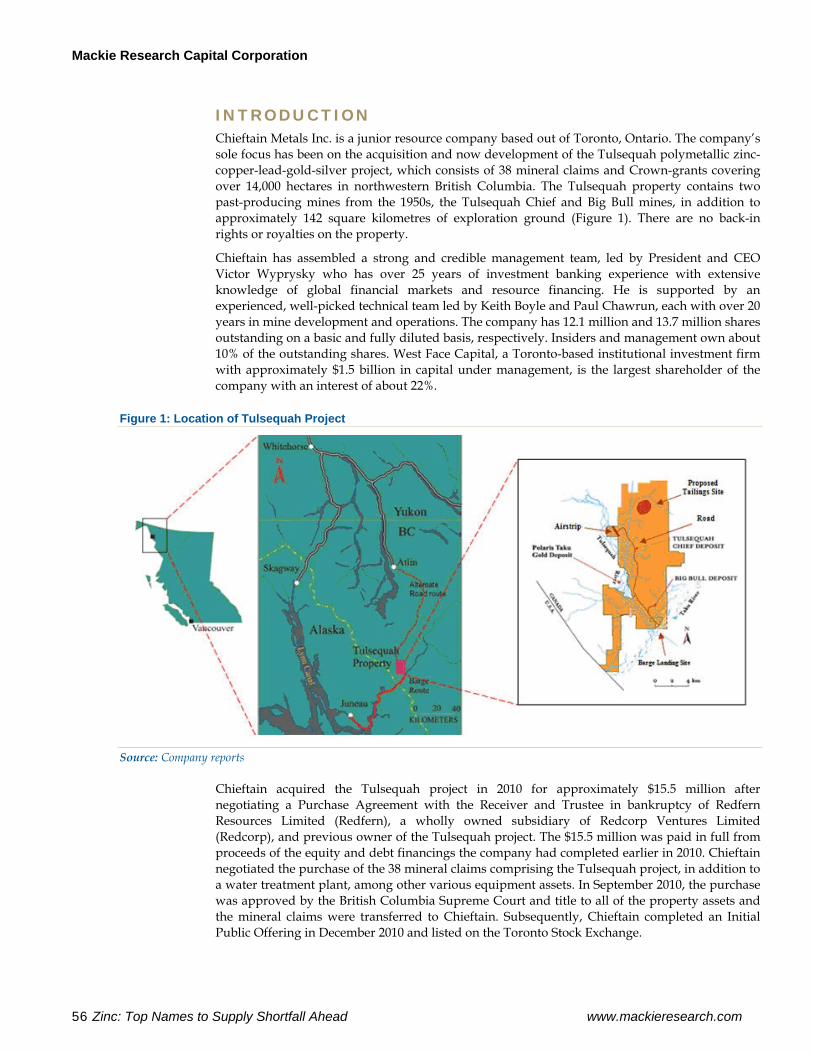
Mackie Research Capital Corporation
56 Zinc: Top Names to Supply Shortfall Ahead www.mackieresearch.com
INTRODUCTION Chieftain Metals Inc. is a junior resource company based out of Toronto, Ontario. The company’s sole focus has been on the acquisition and now development of the Tulsequah polymetallic zinc-copper-lead-gold-silver project, which consists of 38 mineral claims and Crown-grants covering over 14,000 hectares in northwestern British Columbia. The Tulsequah property contains two past-producing mines from the 1950s, the Tulsequah Chief and Big Bull mines, in addition to approximately 142 square kilometres of exploration ground (Figure 1). There are no back-in rights or royalties on the property.
Chieftain has assembled a strong and credible management team, led by President and CEO Victor Wyprysky who has over 25 years of investment banking experience with extensive knowledge of global financial markets and resource financing. He is supported by an experienced, well-picked technical team led by Keith Boyle and Paul Chawrun, each with over 20 years in mine development and operations. The company has 12.1 million and 13.7 million shares outstanding on a basic and fully diluted basis, respectively. Insiders and management own about 10% of the outstanding shares. West Face Capital, a Toronto-based institutional investment firm with approximately $1.5 billion in capital under management, is the largest shareholder of the company with an interest of about 22%.
Figure 1: Location of Tulsequah Project
Source: Company reports
Chieftain acquired the Tulsequah project in 2010 for approximately $15.5 million after negotiating a Purchase Agreement with the Receiver and Trustee in bankruptcy of Redfern Resources Limited (Redfern), a wholly owned subsidiary of Redcorp Ventures Limited (Redcorp), and previous owner of the Tulsequah project. The $15.5 million was paid in full from proceeds of the equity and debt financings the company had completed earlier in 2010. Chieftain negotiated the purchase of the 38 mineral claims comprising the Tulsequah project, in addition to a water treatment plant, among other various equipment assets. In September 2010, the purchase was approved by the British Columbia Supreme Court and title to all of the property assets and the mineral claims were transferred to Chieftain. Subsequently, Chieftain completed an Initial Public Offering in December 2010 and listed on the Toronto Stock Exchange.
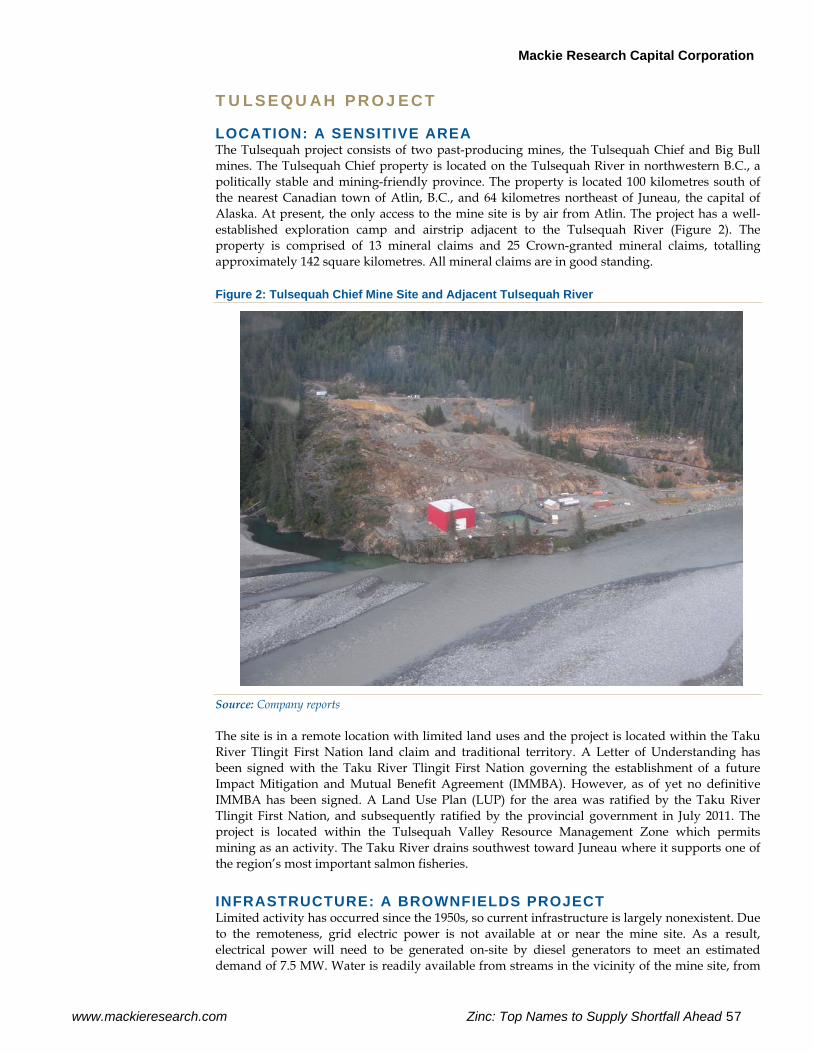
Mackie Research Capital Corporation
www.mackieresearch.com Zinc: Top Names to Supply Shortfall Ahead 57
TULSEQUAH PROJECT
LOCATION: A SENSITIVE AREA The Tulsequah project consists of two past-producing mines, the Tulsequah Chief and Big Bull mines. The Tulsequah Chief property is located on the Tulsequah River in northwestern B.C., a politically stable and mining-friendly province. The property is located 100 kilometres south of the nearest Canadian town of Atlin, B.C., and 64 kilometres northeast of Juneau, the capital of Alaska. At present, the only access to the mine site is by air from Atlin. The project has a well-established exploration camp and airstrip adjacent to the Tulsequah River (Figure 2). The property is comprised of 13 mineral claims and 25 Crown-granted mineral claims, totalling approximately 142 square kilometres. All mineral claims are in good standing.
Figure 2: Tulsequah Chief Mine Site and Adjacent Tulsequah River
Source: Company reports
The site is in a remote location with limited land uses and the project is located within the Taku River Tlingit First Nation land claim and traditional territory. A Letter of Understanding has been signed with the Taku River Tlingit First Nation governing the establishment of a future Impact Mitigation and Mutual Benefit Agreement (IMMBA). However, as of yet no definitive IMMBA has been signed. A Land Use Plan (LUP) for the area was ratified by the Taku River Tlingit First Nation, and subsequently ratified by the provincial government in July 2011. The project is located within the Tulsequah Valley Resource Management Zone which permits mining as an activity. The Taku River drains southwest toward Juneau where it supports one of the region’s most important salmon fisheries.
INFRASTRUCTURE: A BROWNFIELDS PROJECT Limited activity has occurred since the 1950s, so current infrastructure is largely nonexistent. Due to the remoteness, grid electric power is not available at or near the mine site. As a result, electrical power will need to be generated on-site by diesel generators to meet an estimated demand of 7.5 MW. Water is readily available from streams in the vicinity of the mine site, from
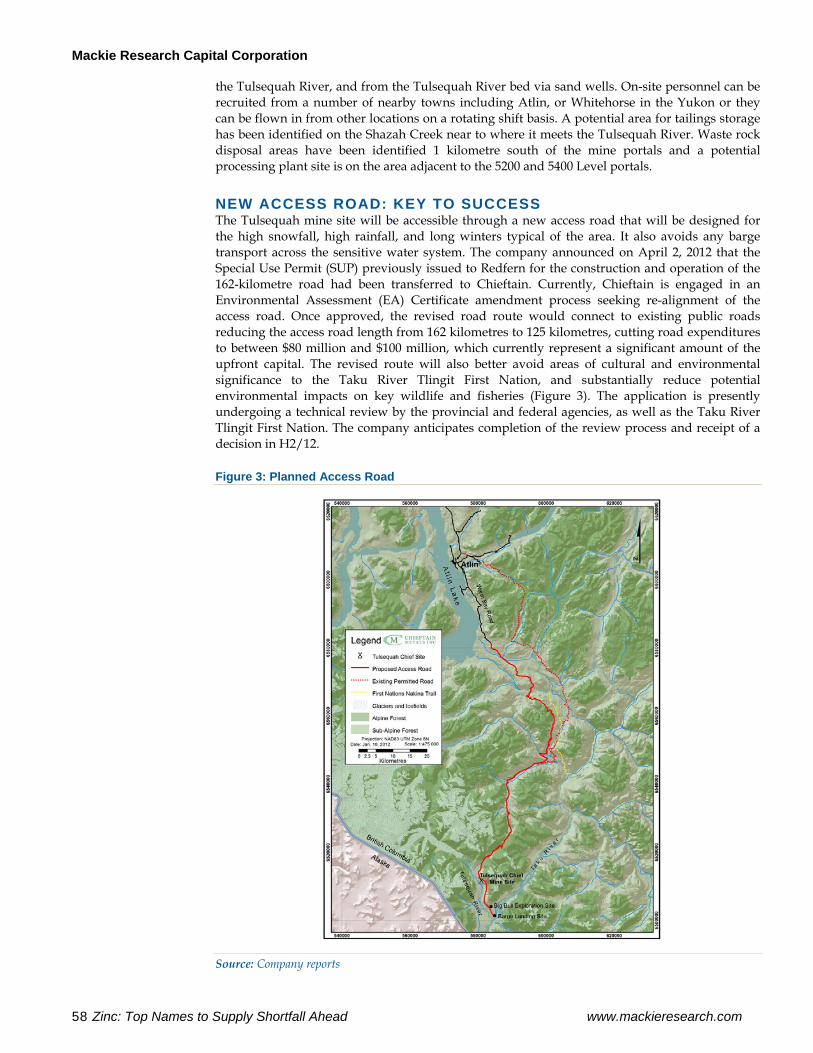
Mackie Research Capital Corporation
58 Zinc: Top Names to Supply Shortfall Ahead www.mackieresearch.com
the Tulsequah River, and from the Tulsequah River bed via sand wells. On-site personnel can be recruited from a number of nearby towns including Atlin, or Whitehorse in the Yukon or they can be flown in from other locations on a rotating shift basis. A potential area for tailings storage has been identified on the Shazah Creek near to where it meets the Tulsequah River. Waste rock disposal areas have been identified 1 kilometre south of the mine portals and a potential processing plant site is on the area adjacent to the 5200 and 5400 Level portals.
NEW ACCESS ROAD: KEY TO SUCCESS The Tulsequah mine site will be accessible through a new access road that will be designed for the high snowfall, high rainfall, and long winters typical of the area. It also avoids any barge transport across the sensitive water system. The company announced on April 2, 2012 that the Special Use Permit (SUP) previously issued to Redfern for the construction and operation of the 162-kilometre road had been transferred to Chieftain. Currently, Chieftain is engaged in an Environmental Assessment (EA) Certificate amendment process seeking re-alignment of the access road. Once approved, the revised road route would connect to existing public roads reducing the access road length from 162 kilometres to 125 kilometres, cutting road expenditures to between $80 million and $100 million, which currently represent a significant amount of the upfront capital. The revised route will also better avoid areas of cultural and environmental significance to the Taku River Tlingit First Nation, and substantially reduce potential environmental impacts on key wildlife and fisheries (Figure 3). The application is presently undergoing a technical review by the provincial and federal agencies, as well as the Taku River Tlingit First Nation. The company anticipates completion of the review process and receipt of a decision in H2/12.
Figure 3: Planned Access Road
Source: Company reports
Mackie Research Capital Corporation
www.mackieresearch.com Zinc: Top Names to Supply Shortfall Ahead 59
HISTORY The Tulsequah Chief and Big Bull mines were operated by Cominco Ltd. from 1951 to 1957 when low metal prices forced suspension of mining activities at both mines. The two mines produced approximately 520,000 tonnes from the Tulsequah Chief mine and 325,000 tonnes from the Big Bull deposit. Average grade of the ore was 1.59% copper, 1.54% lead, 7.0% zinc, 3.84 g/t gold, and 126.5 g/t silver. The mines produced 13,395 tonnes of copper, 10,377 tonnes of lead, 49,814 tonnes of zinc, 95,340 ounces of gold, and 3.3 Moz of silver. Cominco never reopened either mine. In 1981, Redfern commenced a reconnaissance exploration program as part of a joint venture with Cominco and eventually acquired Cominco’s stake, becoming sole owner. Redfern produced a pre-feasibility study in 1993, and, following long permitting delays and litigation with the Taku River Tlingit First Nation, a feasibility study in 2007. Following the feasibility study, Redfern undertook mine and development programs at the property. This work was suspended and eventually indefinitely shutdown by Redcorp as a result of the 2008 credit crisis, followed by Redcorp's filing for bankruptcy in March 2009. Attempts to restructure Redcorp's debt or obtain a project partner were unsuccessful and in late May 2009, the Court appointed a Receiver over the assets of Redcorp and Redfern, with Chieftain eventually negotiating a Purchase Agreement in early 2010 for the mineral claims and lots comprising the Tulsequah project. Chieftain acquired the project for $15.5 million and went public with a $17.5 million IPO in December 2010. It has since spent about $40 million on the project.
ENVIRONMENTAL: FIXING A LEAKY LEGACY Following the improper closure of the old Tulsequah Chief mine operated by Cominco from 1951 to 1957, the issue of acid mine water draining into the Tulsequah River arose. The old mine was not backfilled properly prior to shut down and, as it was located above the water table, water would run downhill over the exposed mine walls before reaching the Tulsequah River. Chieftain completed a short-term solution by acquiring and transporting an Interim Water Treatment Plant (IWTP) to the site at a cost of $5 million. The plant has been operating since December 2011 with initial test results showing a reduction of greater than 98% of the metals load in the water when compared with untreated mine water. A positive, but this is not a permanent solution. The most reasonable long-term solution for the acid mine water problem is actually the development of the proposed mine. The underground mine manages the problem since it is below the water table creating a natural backfill of water, eliminating much of the oxidization of the exposed ore and providing a sustainable means of treating affected water. Chieftain expects this would best resolve the legacy issue that has caused some political tension between members of the B.C. and Alaska government. It seems to be working. Approval of the Environmental Assessment Certificate reinforced this notion by stating that the proposed operation would indeed be effective in managing acid rock drainage.
In June 2012, Chieftain reported that the plant was operating below designed levels of efficiency, and at a higher-than-anticipated operating cost. The company alerted authorities that it planned to suspend operations at the plant while it reviews options to improve efficiency. Management believes that it will operate at full efficiency when project financing is secured and mining operations are underway.
RESOURCE: HIGH-GRADE POLYMETALLIC The Tulsequah Chief deposit is a high-grade volcanogenic massive sulphide deposit (Figure 4). It consists of 12 distinct semi-massive to massive sulphide lenses, termed G1, G2, and G3 and H1 to H9, developed within the basal stratigraphy of a rhyolite-rich sequence of volcanic flows and fragmental units. Mineralization in all lenses is massive to semi-massive sulphide consisting primarily of pyrite, chalcopyrite, sphalerite, and galena. These lenses appear to occur at four distinct stratigraphic levels and range in size from 25,000 tonnes to just under 2 million tonnes. True thicknesses range from 1.5 metres to approximately 10 metres for the G lenses, and 1.5 metres to approximately 40 metres for the H lenses.
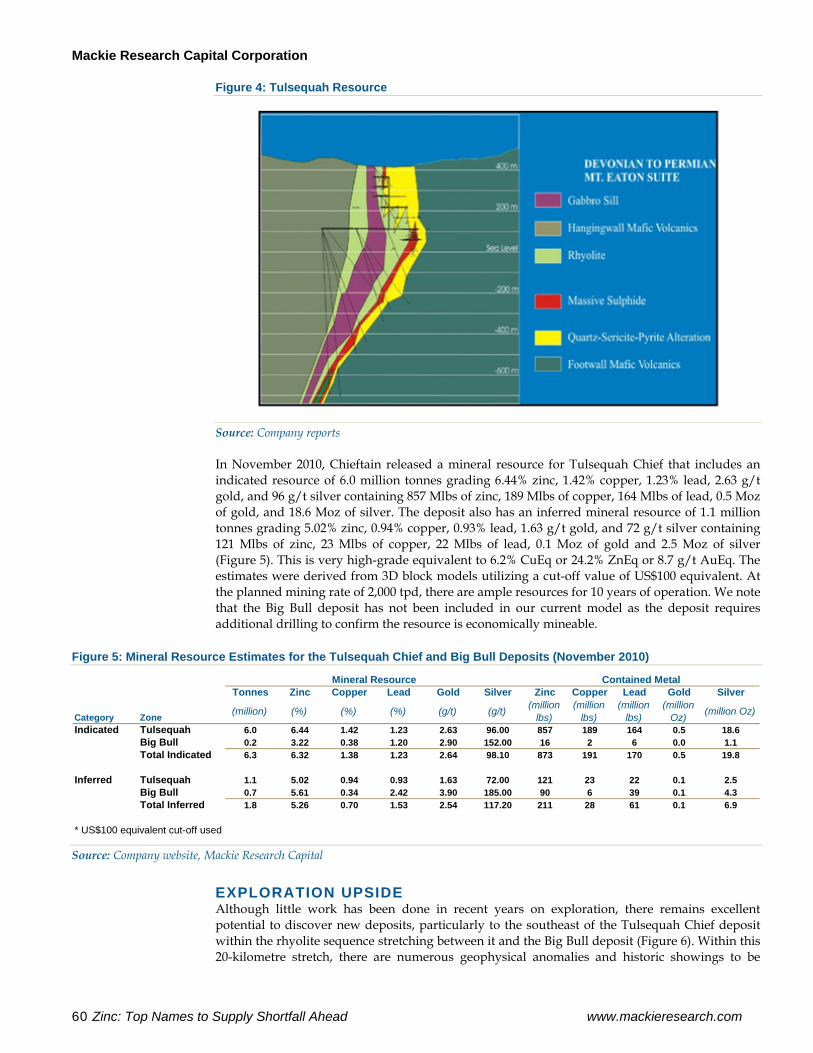
Mackie Research Capital Corporation
60 Zinc: Top Names to Supply Shortfall Ahead www.mackieresearch.com
Figure 4: Tulsequah Resource
Source: Company reports
In November 2010, Chieftain released a mineral resource for Tulsequah Chief that includes an indicated resource of 6.0 million tonnes grading 6.44% zinc, 1.42% copper, 1.23% lead, 2.63 g/t gold, and 96 g/t silver containing 857 Mlbs of zinc, 189 Mlbs of copper, 164 Mlbs of lead, 0.5 Moz of gold, and 18.6 Moz of silver. The deposit also has an inferred mineral resource of 1.1 million tonnes grading 5.02% zinc, 0.94% copper, 0.93% lead, 1.63 g/t gold, and 72 g/t silver containing 121 Mlbs of zinc, 23 Mlbs of copper, 22 Mlbs of lead, 0.1 Moz of gold and 2.5 Moz of silver (Figure 5). This is very high-grade equivalent to 6.2% CuEq or 24.2% ZnEq or 8.7 g/t AuEq. The estimates were derived from 3D block models utilizing a cut-off value of US$100 equivalent. At the planned mining rate of 2,000 tpd, there are ample resources for 10 years of operation. We note that the Big Bull deposit has not been included in our current model as the deposit requires additional drilling to confirm the resource is economically mineable.
Figure 5: Mineral Resource Estimates for the Tulsequah Chief and Big Bull Deposits (November 2010)
Tonnes Zinc Copper Lead Gold Silver Zinc Copper Lead Gold Silver
Category Zone (million) (%) (%) (%) (g/t) (g/t) (million lbs)
(million lbs)
(million lbs)
(million Oz) (million Oz)
Indicated Tulsequah 6.0 6.44 1.42 1.23 2.63 96.00 857 189 164 0.5 18.6Big Bull 0.2 3.22 0.38 1.20 2.90 152.00 16 2 6 0.0 1.1Total Indicated 6.3 6.32 1.38 1.23 2.64 98.10 873 191 170 0.5 19.8
Inferred Tulsequah 1.1 5.02 0.94 0.93 1.63 72.00 121 23 22 0.1 2.5Big Bull 0.7 5.61 0.34 2.42 3.90 185.00 90 6 39 0.1 4.3Total Inferred 1.8 5.26 0.70 1.53 2.54 117.20 211 28 61 0.1 6.9
* US$100 equivalent cut-off used
Mineral Resource Contained Metal
Source: Company website, Mackie Research Capital
EXPLORATION UPSIDE Although little work has been done in recent years on exploration, there remains excellent potential to discover new deposits, particularly to the southeast of the Tulsequah Chief deposit within the rhyolite sequence stretching between it and the Big Bull deposit (Figure 6). Within this 20-kilometre stretch, there are numerous geophysical anomalies and historic showings to be
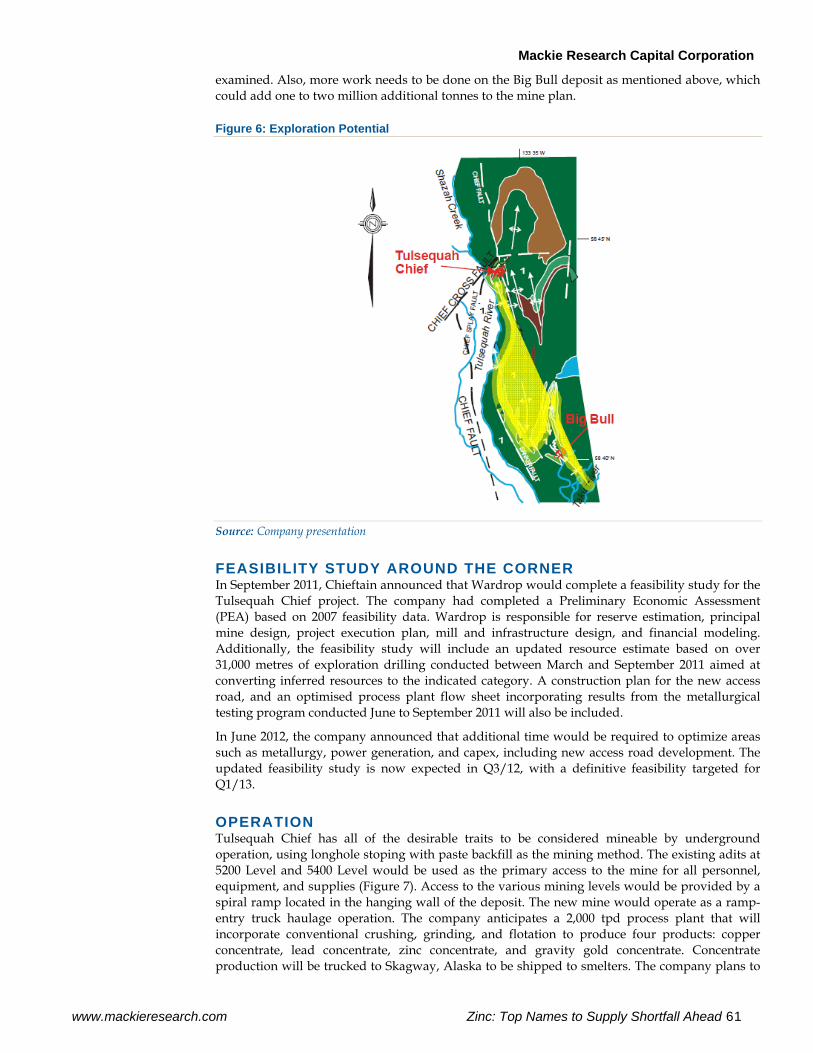
Mackie Research Capital Corporation
www.mackieresearch.com Zinc: Top Names to Supply Shortfall Ahead 61
examined. Also, more work needs to be done on the Big Bull deposit as mentioned above, which could add one to two million additional tonnes to the mine plan.
Figure 6: Exploration Potential
Source: Company presentation
FEASIBILITY STUDY AROUND THE CORNER In September 2011, Chieftain announced that Wardrop would complete a feasibility study for the Tulsequah Chief project. The company had completed a Preliminary Economic Assessment (PEA) based on 2007 feasibility data. Wardrop is responsible for reserve estimation, principal mine design, project execution plan, mill and infrastructure design, and financial modeling. Additionally, the feasibility study will include an updated resource estimate based on over 31,000 metres of exploration drilling conducted between March and September 2011 aimed at converting inferred resources to the indicated category. A construction plan for the new access road, and an optimised process plant flow sheet incorporating results from the metallurgical testing program conducted June to September 2011 will also be included.
In June 2012, the company announced that additional time would be required to optimize areas such as metallurgy, power generation, and capex, including new access road development. The updated feasibility study is now expected in Q3/12, with a definitive feasibility targeted for Q1/13.
OPERATION Tulsequah Chief has all of the desirable traits to be considered mineable by underground operation, using longhole stoping with paste backfill as the mining method. The existing adits at 5200 Level and 5400 Level would be used as the primary access to the mine for all personnel, equipment, and supplies (Figure 7). Access to the various mining levels would be provided by a spiral ramp located in the hanging wall of the deposit. The new mine would operate as a ramp-entry truck haulage operation. The company anticipates a 2,000 tpd process plant that will incorporate conventional crushing, grinding, and flotation to produce four products: copper concentrate, lead concentrate, zinc concentrate, and gravity gold concentrate. Concentrate production will be trucked to Skagway, Alaska to be shipped to smelters. The company plans to

Mackie Research Capital Corporation
62 Zinc: Top Names to Supply Shortfall Ahead www.mackieresearch.com
perform minor improvements on an existing terminal facility in Skagway to handle the concentrate production. In the November 2011 PEA, Chieftain reported total capital costs of approximately $365 million, which included a 15% contingency. However, we have revised our capital costs estimates to account for inflationary trends currently experienced in the industry. Our revised total capital cost estimate (including sustaining capex) is approximately $486 million.
Figure 7: Underground Mine – South View
Source: Company presentation
PROJECT TIMELINE Figure 8 details management’s timeline of project development at the Tulsequah Chief site. In early 2012, Chieftain announced that the Special Use Permit (SUP), previously issued to Redfern, had been transferred to Chieftain. Transfer of the SUP signalled receipt of the final major permit for the Tulsequah project. In Q3/12, an updated feasibility study is expected, as well as the delivery of the Environmental Assessment Certificate seeking the re-alignment of the access road. We expect construction of the access road to commence in the spring of 2013, once a definitive feasibility study has been released. Additionally, we anticipate an equity raise to occur within the next 12 months.
Figure 8: Tulsequah Project Timeline
Tulsequah Chief Development StageQ3 Q4 Q1 Q2 Q3 Q4 Q1 Q2 Q3 Q4 Q1 Q2 Q3 Q4 Q1 Q2
Updated FeasibilityPermit UpdatesSecuring FinancingDefinitive Feasibility StudyRoad ConstructionSite EarthworksMill & Site ConstructionUnderground DevelopmentTailingsCommissioning & Production
20162012 2013 2014 2015
Source: Company presentation, Mackie Research Capital
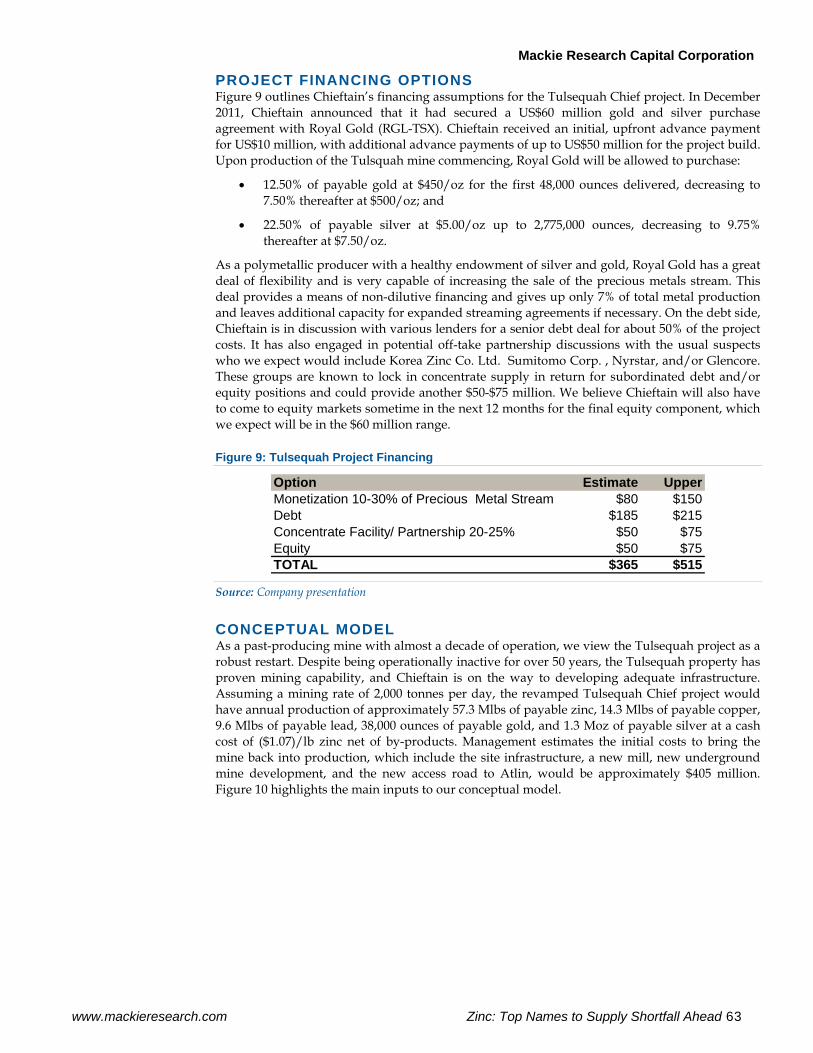
Mackie Research Capital Corporation
www.mackieresearch.com Zinc: Top Names to Supply Shortfall Ahead 63
PROJECT FINANCING OPTIONS Figure 9 outlines Chieftain’s financing assumptions for the Tulsequah Chief project. In December 2011, Chieftain announced that it had secured a US$60 million gold and silver purchase agreement with Royal Gold (RGL-TSX). Chieftain received an initial, upfront advance payment for US$10 million, with additional advance payments of up to US$50 million for the project build. Upon production of the Tulsquah mine commencing, Royal Gold will be allowed to purchase:
• 12.50% of payable gold at $450/oz for the first 48,000 ounces delivered, decreasing to 7.50% thereafter at $500/oz; and
• 22.50% of payable silver at $5.00/oz up to 2,775,000 ounces, decreasing to 9.75% thereafter at $7.50/oz.
As a polymetallic producer with a healthy endowment of silver and gold, Royal Gold has a great deal of flexibility and is very capable of increasing the sale of the precious metals stream. This deal provides a means of non-dilutive financing and gives up only 7% of total metal production and leaves additional capacity for expanded streaming agreements if necessary. On the debt side, Chieftain is in discussion with various lenders for a senior debt deal for about 50% of the project costs. It has also engaged in potential off-take partnership discussions with the usual suspects who we expect would include Korea Zinc Co. Ltd. Sumitomo Corp. , Nyrstar, and/or Glencore. These groups are known to lock in concentrate supply in return for subordinated debt and/or equity positions and could provide another $50-$75 million. We believe Chieftain will also have to come to equity markets sometime in the next 12 months for the final equity component, which we expect will be in the $60 million range.
Figure 9: Tulsequah Project Financing
Option Estimate UpperMonetization 10-30% of Precious Metal Stream $80 $150Debt $185 $215Concentrate Facility/ Partnership 20-25% $50 $75Equity $50 $75TOTAL $365 $515
Source: Company presentation
CONCEPTUAL MODEL As a past-producing mine with almost a decade of operation, we view the Tulsequah project as a robust restart. Despite being operationally inactive for over 50 years, the Tulsequah property has proven mining capability, and Chieftain is on the way to developing adequate infrastructure. Assuming a mining rate of 2,000 tonnes per day, the revamped Tulsequah Chief project would have annual production of approximately 57.3 Mlbs of payable zinc, 14.3 Mlbs of payable copper, 9.6 Mlbs of payable lead, 38,000 ounces of payable gold, and 1.3 Moz of payable silver at a cash cost of ($1.07)/lb zinc net of by-products. Management estimates the initial costs to bring the mine back into production, which include the site infrastructure, a new mill, new underground mine development, and the new access road to Atlin, would be approximately $405 million. Figure 10 highlights the main inputs to our conceptual model.
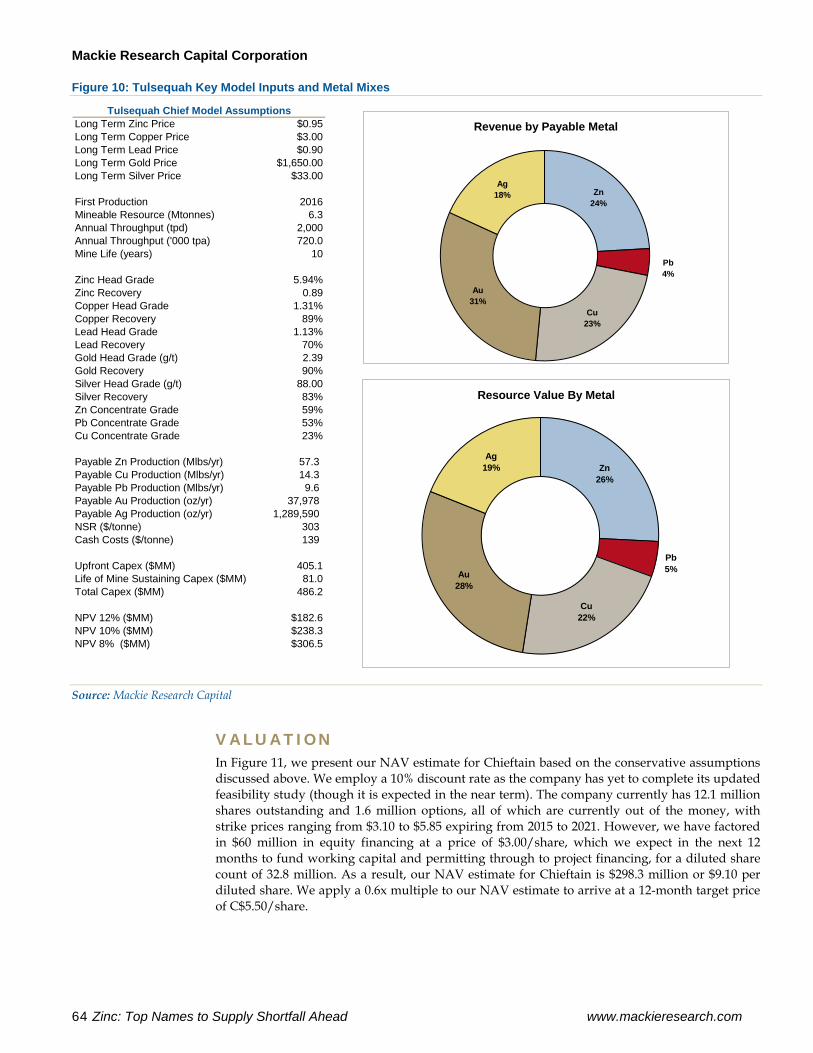
Mackie Research Capital Corporation
64 Zinc: Top Names to Supply Shortfall Ahead www.mackieresearch.com
Figure 10: Tulsequah Key Model Inputs and Metal Mixes
Long Term Zinc Price $0.95Long Term Copper Price $3.00Long Term Lead Price $0.90Long Term Gold Price $1,650.00Long Term Silver Price $33.00
First Production 2016Mineable Resource (Mtonnes) 6.3Annual Throughput (tpd) 2,000Annual Throughput ('000 tpa) 720.0Mine Life (years) 10
Zinc Head Grade 5.94%Zinc Recovery 0.89Copper Head Grade 1.31%Copper Recovery 89%Lead Head Grade 1.13%Lead Recovery 70%Gold Head Grade (g/t) 2.39Gold Recovery 90%Silver Head Grade (g/t) 88.00Silver Recovery 83%Zn Concentrate Grade 59%Pb Concentrate Grade 53%Cu Concentrate Grade 23%
Payable Zn Production (Mlbs/yr) 57.3 Payable Cu Production (Mlbs/yr) 14.3 Payable Pb Production (Mlbs/yr) 9.6 Payable Au Production (oz/yr) 37,978 Payable Ag Production (oz/yr) 1,289,590 NSR ($/tonne) 303 Cash Costs ($/tonne) 139
Upfront Capex ($MM) 405.1Life of Mine Sustaining Capex ($MM) 81.0Total Capex ($MM) 486.2
NPV 12% ($MM) $182.6NPV 10% ($MM) $238.3NPV 8% ($MM) $306.5
Tulsequah Chief Model AssumptionsRevenue by Payable Metal
Zn24%
Cu23%
Au31%
Ag18%
Pb4%
Resource Value By Metal
Zn26%
Cu22%
Au28%
Ag19%
Pb5%
Source: Mackie Research Capital
VALUATION In Figure 11, we present our NAV estimate for Chieftain based on the conservative assumptions discussed above. We employ a 10% discount rate as the company has yet to complete its updated feasibility study (though it is expected in the near term). The company currently has 12.1 million shares outstanding and 1.6 million options, all of which are currently out of the money, with strike prices ranging from $3.10 to $5.85 expiring from 2015 to 2021. However, we have factored in $60 million in equity financing at a price of $3.00/share, which we expect in the next 12 months to fund working capital and permitting through to project financing, for a diluted share count of 32.8 million. As a result, our NAV estimate for Chieftain is $298.3 million or $9.10 per diluted share. We apply a 0.6x multiple to our NAV estimate to arrive at a 12-month target price of C$5.50/share.
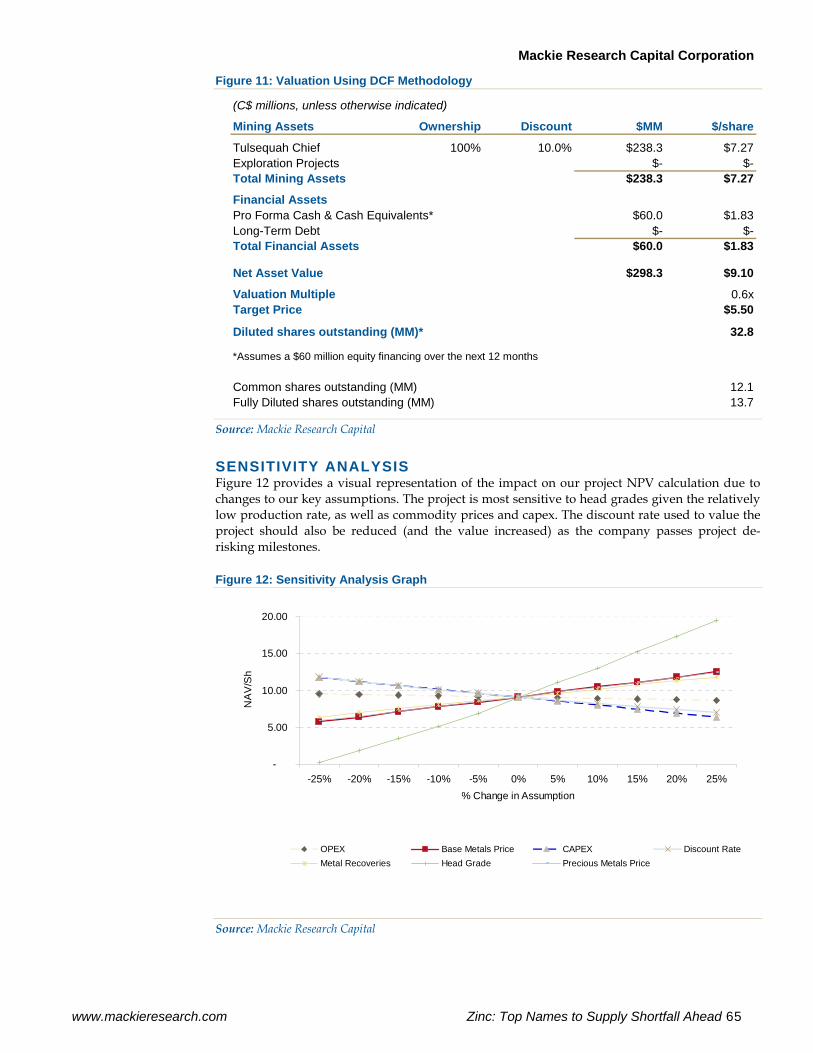
Mackie Research Capital Corporation
www.mackieresearch.com Zinc: Top Names to Supply Shortfall Ahead 65
Figure 11: Valuation Using DCF Methodology
(C$ millions, unless otherwise indicated)
Mining Assets Ownership Discount $MM $/share
Tulsequah Chief 100% 10.0% $238.3 $7.27Exploration Projects $- $-Total Mining Assets $238.3 $7.27
Financial AssetsPro Forma Cash & Cash Equivalents* $60.0 $1.83Long-Term Debt $- $-Total Financial Assets $60.0 $1.83
Net Asset Value $298.3 $9.10
Valuation Multiple 0.6xTarget Price $5.50
Diluted shares outstanding (MM)* 32.8
*Assumes a $60 million equity financing over the next 12 months
Common shares outstanding (MM) 12.1Fully Diluted shares outstanding (MM) 13.7
Source: Mackie Research Capital
SENSITIVITY ANALYSIS Figure 12 provides a visual representation of the impact on our project NPV calculation due to changes to our key assumptions. The project is most sensitive to head grades given the relatively low production rate, as well as commodity prices and capex. The discount rate used to value the project should also be reduced (and the value increased) as the company passes project de-risking milestones.
Figure 12: Sensitivity Analysis Graph
-
5.00
10.00
15.00
20.00
-25% -20% -15% -10% -5% 0% 5% 10% 15% 20% 25%% Change in Assumption
NA
V/S
h
OPEX Base Metals Price CAPEX Discount RateMetal Recoveries Head Grade Precious Metals Price
Source: Mackie Research Capital
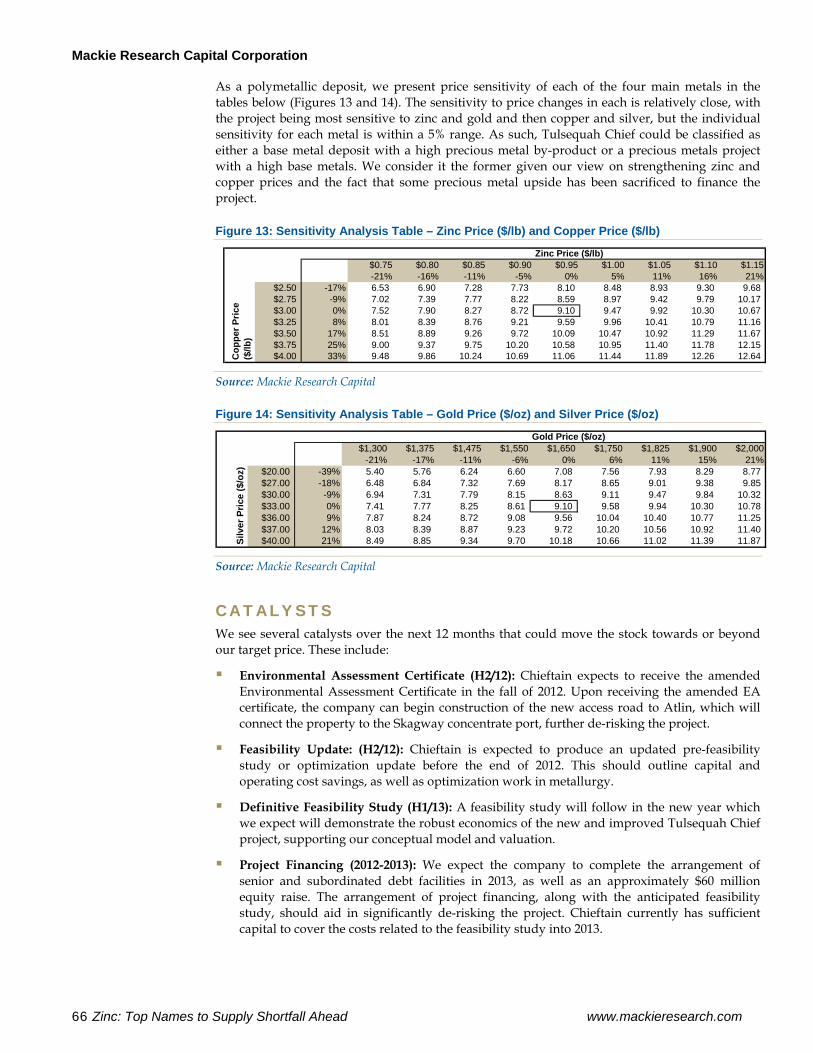
Mackie Research Capital Corporation
66 Zinc: Top Names to Supply Shortfall Ahead www.mackieresearch.com
As a polymetallic deposit, we present price sensitivity of each of the four main metals in the tables below (Figures 13 and 14). The sensitivity to price changes in each is relatively close, with the project being most sensitive to zinc and gold and then copper and silver, but the individual sensitivity for each metal is within a 5% range. As such, Tulsequah Chief could be classified as either a base metal deposit with a high precious metal by-product or a precious metals project with a high base metals. We consider it the former given our view on strengthening zinc and copper prices and the fact that some precious metal upside has been sacrificed to finance the project.
Figure 13: Sensitivity Analysis Table – Zinc Price ($/lb) and Copper Price ($/lb)
Zinc Price ($/lb)$0.75 $0.80 $0.85 $0.90 $0.95 $1.00 $1.05 $1.10 $1.15
9.10 -21% -16% -11% -5% 0% 5% 11% 16% 21%$2.50 -17% 6.53 6.90 7.28 7.73 8.10 8.48 8.93 9.30 9.68 $2.75 -9% 7.02 7.39 7.77 8.22 8.59 8.97 9.42 9.79 10.17 $3.00 0% 7.52 7.90 8.27 8.72 9.10 9.47 9.92 10.30 10.67 $3.25 8% 8.01 8.39 8.76 9.21 9.59 9.96 10.41 10.79 11.16 $3.50 17% 8.51 8.89 9.26 9.72 10.09 10.47 10.92 11.29 11.67 $3.75 25% 9.00 9.37 9.75 10.20 10.58 10.95 11.40 11.78 12.15 $4.00 33% 9.48 9.86 10.24 10.69 11.06 11.44 11.89 12.26 12.64 C
oppe
r Pric
e ($
/lb)
Source: Mackie Research Capital
Figure 14: Sensitivity Analysis Table – Gold Price ($/oz) and Silver Price ($/oz)
Gold Price ($/oz)$1,300 $1,375 $1,475 $1,550 $1,650 $1,750 $1,825 $1,900 $2,000
9.10 -21% -17% -11% -6% 0% 6% 11% 15% 21%$20.00 -39% 5.40 5.76 6.24 6.60 7.08 7.56 7.93 8.29 8.77 $27.00 -18% 6.48 6.84 7.32 7.69 8.17 8.65 9.01 9.38 9.85 $30.00 -9% 6.94 7.31 7.79 8.15 8.63 9.11 9.47 9.84 10.32 $33.00 0% 7.41 7.77 8.25 8.61 9.10 9.58 9.94 10.30 10.78 $36.00 9% 7.87 8.24 8.72 9.08 9.56 10.04 10.40 10.77 11.25 $37.00 12% 8.03 8.39 8.87 9.23 9.72 10.20 10.56 10.92 11.40 $40.00 21% 8.49 8.85 9.34 9.70 10.18 10.66 11.02 11.39 11.87 Si
lver
Pric
e ($
/oz)
Source: Mackie Research Capital
CATALYSTS We see several catalysts over the next 12 months that could move the stock towards or beyond our target price. These include:
Environmental Assessment Certificate (H2/12): Chieftain expects to receive the amended Environmental Assessment Certificate in the fall of 2012. Upon receiving the amended EA certificate, the company can begin construction of the new access road to Atlin, which will connect the property to the Skagway concentrate port, further de-risking the project.
Feasibility Update: (H2/12): Chieftain is expected to produce an updated pre-feasibility study or optimization update before the end of 2012. This should outline capital and operating cost savings, as well as optimization work in metallurgy.
Definitive Feasibility Study (H1/13): A feasibility study will follow in the new year which we expect will demonstrate the robust economics of the new and improved Tulsequah Chief project, supporting our conceptual model and valuation.
Project Financing (2012-2013): We expect the company to complete the arrangement of senior and subordinated debt facilities in 2013, as well as an approximately $60 million equity raise. The arrangement of project financing, along with the anticipated feasibility study, should aid in significantly de-risking the project. Chieftain currently has sufficient capital to cover the costs related to the feasibility study into 2013.
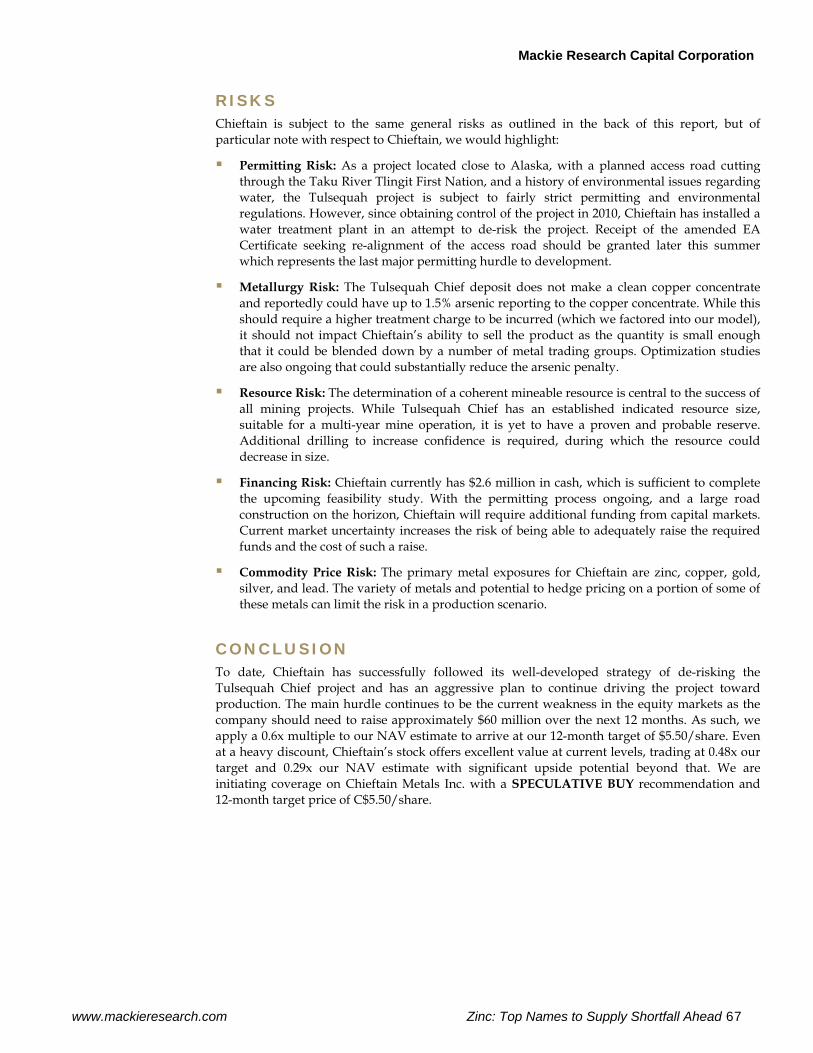
Mackie Research Capital Corporation
www.mackieresearch.com Zinc: Top Names to Supply Shortfall Ahead 67
RISKS Chieftain is subject to the same general risks as outlined in the back of this report, but of particular note with respect to Chieftain, we would highlight:
Permitting Risk: As a project located close to Alaska, with a planned access road cutting through the Taku River Tlingit First Nation, and a history of environmental issues regarding water, the Tulsequah project is subject to fairly strict permitting and environmental regulations. However, since obtaining control of the project in 2010, Chieftain has installed a water treatment plant in an attempt to de-risk the project. Receipt of the amended EA Certificate seeking re-alignment of the access road should be granted later this summer which represents the last major permitting hurdle to development.
Metallurgy Risk: The Tulsequah Chief deposit does not make a clean copper concentrate and reportedly could have up to 1.5% arsenic reporting to the copper concentrate. While this should require a higher treatment charge to be incurred (which we factored into our model), it should not impact Chieftain’s ability to sell the product as the quantity is small enough that it could be blended down by a number of metal trading groups. Optimization studies are also ongoing that could substantially reduce the arsenic penalty.
Resource Risk: The determination of a coherent mineable resource is central to the success of all mining projects. While Tulsequah Chief has an established indicated resource size, suitable for a multi-year mine operation, it is yet to have a proven and probable reserve. Additional drilling to increase confidence is required, during which the resource could decrease in size.
Financing Risk: Chieftain currently has $2.6 million in cash, which is sufficient to complete the upcoming feasibility study. With the permitting process ongoing, and a large road construction on the horizon, Chieftain will require additional funding from capital markets. Current market uncertainty increases the risk of being able to adequately raise the required funds and the cost of such a raise.
Commodity Price Risk: The primary metal exposures for Chieftain are zinc, copper, gold, silver, and lead. The variety of metals and potential to hedge pricing on a portion of some of these metals can limit the risk in a production scenario.
CONCLUSION To date, Chieftain has successfully followed its well-developed strategy of de-risking the Tulsequah Chief project and has an aggressive plan to continue driving the project toward production. The main hurdle continues to be the current weakness in the equity markets as the company should need to raise approximately $60 million over the next 12 months. As such, we apply a 0.6x multiple to our NAV estimate to arrive at our 12-month target of $5.50/share. Even at a heavy discount, Chieftain’s stock offers excellent value at current levels, trading at 0.48x our target and 0.29x our NAV estimate with significant upside potential beyond that. We are initiating coverage on Chieftain Metals Inc. with a SPECULATIVE BUY recommendation and 12-month target price of C$5.50/share.
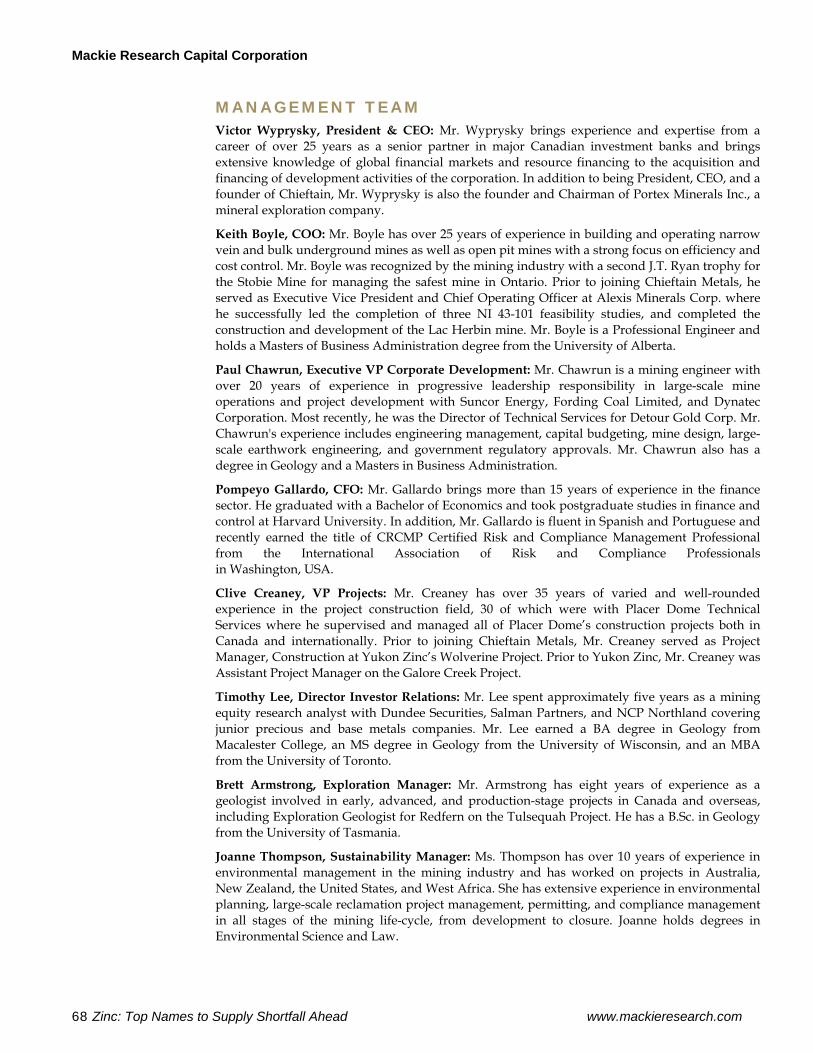
Mackie Research Capital Corporation
68 Zinc: Top Names to Supply Shortfall Ahead www.mackieresearch.com
MANAGEMENT TEAM Victor Wyprysky, President & CEO: Mr. Wyprysky brings experience and expertise from a career of over 25 years as a senior partner in major Canadian investment banks and brings extensive knowledge of global financial markets and resource financing to the acquisition and financing of development activities of the corporation. In addition to being President, CEO, and a founder of Chieftain, Mr. Wyprysky is also the founder and Chairman of Portex Minerals Inc., a mineral exploration company.
Keith Boyle, COO: Mr. Boyle has over 25 years of experience in building and operating narrow vein and bulk underground mines as well as open pit mines with a strong focus on efficiency and cost control. Mr. Boyle was recognized by the mining industry with a second J.T. Ryan trophy for the Stobie Mine for managing the safest mine in Ontario. Prior to joining Chieftain Metals, he served as Executive Vice President and Chief Operating Officer at Alexis Minerals Corp. where he successfully led the completion of three NI 43-101 feasibility studies, and completed the construction and development of the Lac Herbin mine. Mr. Boyle is a Professional Engineer and holds a Masters of Business Administration degree from the University of Alberta. Paul Chawrun, Executive VP Corporate Development: Mr. Chawrun is a mining engineer with over 20 years of experience in progressive leadership responsibility in large-scale mine operations and project development with Suncor Energy, Fording Coal Limited, and Dynatec Corporation. Most recently, he was the Director of Technical Services for Detour Gold Corp. Mr. Chawrun's experience includes engineering management, capital budgeting, mine design, large-scale earthwork engineering, and government regulatory approvals. Mr. Chawrun also has a degree in Geology and a Masters in Business Administration. Pompeyo Gallardo, CFO: Mr. Gallardo brings more than 15 years of experience in the finance sector. He graduated with a Bachelor of Economics and took postgraduate studies in finance and control at Harvard University. In addition, Mr. Gallardo is fluent in Spanish and Portuguese and recently earned the title of CRCMP Certified Risk and Compliance Management Professional from the International Association of Risk and Compliance Professionals in Washington, USA.
Clive Creaney, VP Projects: Mr. Creaney has over 35 years of varied and well-rounded experience in the project construction field, 30 of which were with Placer Dome Technical Services where he supervised and managed all of Placer Dome’s construction projects both in Canada and internationally. Prior to joining Chieftain Metals, Mr. Creaney served as Project Manager, Construction at Yukon Zinc’s Wolverine Project. Prior to Yukon Zinc, Mr. Creaney was Assistant Project Manager on the Galore Creek Project.
Timothy Lee, Director Investor Relations: Mr. Lee spent approximately five years as a mining equity research analyst with Dundee Securities, Salman Partners, and NCP Northland covering junior precious and base metals companies. Mr. Lee earned a BA degree in Geology from Macalester College, an MS degree in Geology from the University of Wisconsin, and an MBA from the University of Toronto.
Brett Armstrong, Exploration Manager: Mr. Armstrong has eight years of experience as a geologist involved in early, advanced, and production-stage projects in Canada and overseas, including Exploration Geologist for Redfern on the Tulsequah Project. He has a B.Sc. in Geology from the University of Tasmania.
Joanne Thompson, Sustainability Manager: Ms. Thompson has over 10 years of experience in environmental management in the mining industry and has worked on projects in Australia, New Zealand, the United States, and West Africa. She has extensive experience in environmental planning, large-scale reclamation project management, permitting, and compliance management in all stages of the mining life-cycle, from development to closure. Joanne holds degrees in Environmental Science and Law.
Mackie Research Capital Corporation
www.mackieresearch.com Zinc: Top Names to Supply Shortfall Ahead 69
I N V E S T M E N T H I G H L I G H T S
FORAN MINING CORP. Growing Polymetallic Project in Saskatchewan FOM - TSX $0.60TARGET: $1.20PROJ. RETURN: 100%
VALUATION: 1.0x NAVPSShare DataBasic Shares O/S (mm) 65.1Fully Diluted (mm) 75.1Market Cap ($mm) 39.0Enterprise Value ($mm) 33.0Cash ($mm) 6.0Debt ($mm) 0.0Dividend ($) 0.00Yield (%) 0.0%Next Reporting Date November
$0.20
$0.40
$0.60
$0.80
$1.00
Aug-11 Nov-11 Feb-12 May-12 Aug-12
Short-term Technical Target $0.60 support. FOM is trading sideways above support.
Forecast FYE Sep 30 2011A 2012E 2013EProduction 000 Zn lbs 0.00 0.00 0.00Cash Costs US$/oz 0.0 0.0 0.0Earnings 2011A 2012E 2013EEPS $/sh n/a n/a n/aP/EPS multiple n/a n/a naCFPS $/sh n/a n/a n/aP/CFPS multiple n/a n/a na
Company Profile Foran Mining is a diversified exploration and development company with projects in central Canada's Flin Flon mining belt. The company's flagship McIlvenna Bay project is located in east-central Saskatchewan, 60 kilometres west of Flin Flon, Manitoba. The McIlvenna Bay deposit continues to grow, hosting a high-grade 21.6 million tonne Zn-Cu-Ag-Au resource containing 1.8 Blbs of zinc, 534 Mlbs of copper, 13.4 Moz of silver, and minor gold, and remains open. Additional exploration upside comes from a portfolio of seven earlier-stage properties in the region.
We are initiating coverage on Foran Mining Corp. with a SPECULATIVE BUY
recommendation and 12-month target price of C$1.20/share.
Large Deposit in Proven District: The company’s focus is the 100%-owned
McIlvenna Bay property, located 60 kilometres west of Flin Flon in east-central
Saskatchewan, with a growing resource of 21.6 million tonnes containing 1.8 Blbs
of zinc, 534 Mlbs of copper, 13.4 Moz of silver, and minor gold. The deposit
remains open and should continue to grow with subsequent programs.
Top Jurisdiction: The McIlvenna Bay project and most of Foran’s exploration
portfolio are located in the mine-friendly province of Saskatchewan, within an
established mining district that boasts direct access to good infrastructure
including roads, services, and power.
Proven Management Team: Foran has assembled an experienced management
and technical team with a successful track record, led by President, CEO, and
director Patrick Soares, who sold Brett Resources to Osisko Mining Corp. in mid-
2010.
Near-Term Catalysts to Add Value: Several catalysts that should move the stock
price through our target price over the next 12 months include a resource update
by the end of 2012, the completion of a PEA on McIlvenna Bay in the first half of
2013, and its progression to feasibility with the commitment to and financing of
an exploration ramp in the second half of 2013.
Good Value: Our conceptual model shows good potential for McIlvenna Bay to
produce a positive PEA. On a comparable basis, Foran trades below its peer
group, especially when factoring in an anticipated 10%-20% resource increase.
Based on a resource valuation of $0.015/lb ZnEq, we value Foran at $1.20 per
share, with visibility on $2.00 per share as the stock moves through its
development milestones over the next 24 months. The stock offers good value,
now trading at 0.55x NAV and target.
Risk: Overall, Foran and its McIlvenna Bay project stand out for being relatively
low risk given the high-quality jurisdiction, strong investment base, large and
growing resource, and experienced management team. The main risk is technical
in determining the proper mining method and associated economics for
developing a mine at McIlvenna Bay.
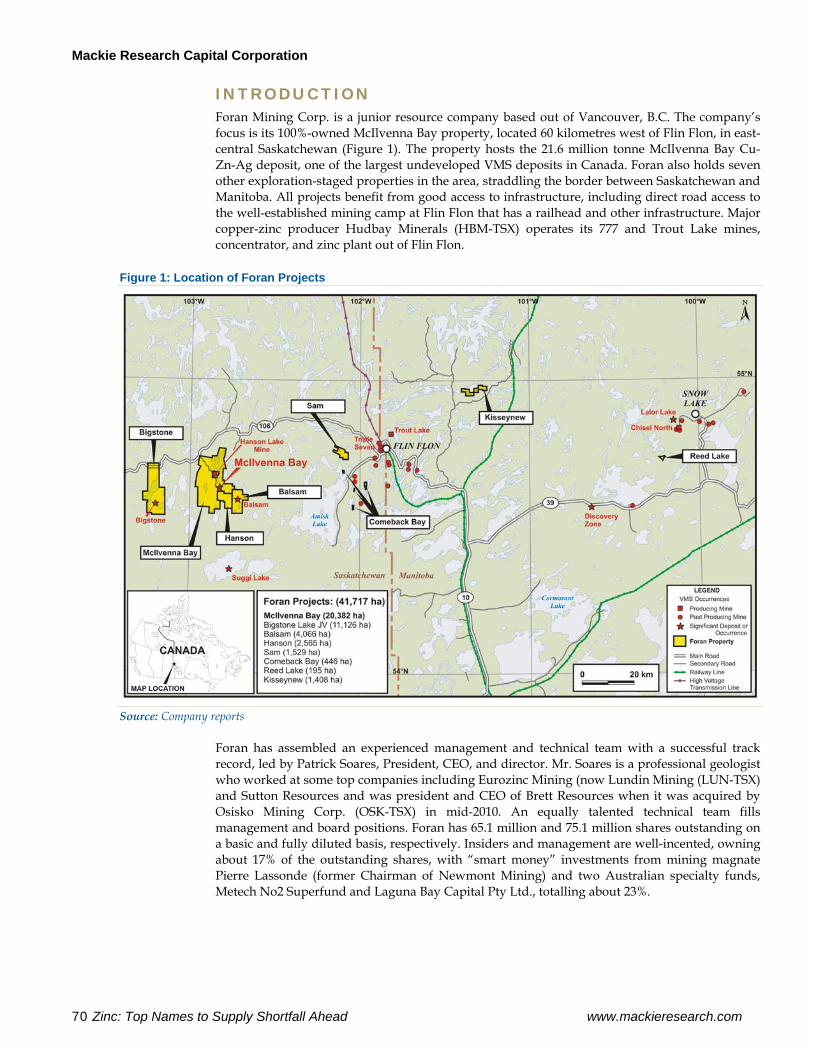
Mackie Research Capital Corporation
70 Zinc: Top Names to Supply Shortfall Ahead www.mackieresearch.com
INTRODUCTION Foran Mining Corp. is a junior resource company based out of Vancouver, B.C. The company’s focus is its 100%-owned McIlvenna Bay property, located 60 kilometres west of Flin Flon, in east-central Saskatchewan (Figure 1). The property hosts the 21.6 million tonne McIlvenna Bay Cu-Zn-Ag deposit, one of the largest undeveloped VMS deposits in Canada. Foran also holds seven other exploration-staged properties in the area, straddling the border between Saskatchewan and Manitoba. All projects benefit from good access to infrastructure, including direct road access to the well-established mining camp at Flin Flon that has a railhead and other infrastructure. Major copper-zinc producer Hudbay Minerals (HBM-TSX) operates its 777 and Trout Lake mines, concentrator, and zinc plant out of Flin Flon.
Figure 1: Location of Foran Projects
Source: Company reports
Foran has assembled an experienced management and technical team with a successful track record, led by Patrick Soares, President, CEO, and director. Mr. Soares is a professional geologist who worked at some top companies including Eurozinc Mining (now Lundin Mining (LUN-TSX) and Sutton Resources and was president and CEO of Brett Resources when it was acquired by Osisko Mining Corp. (OSK-TSX) in mid-2010. An equally talented technical team fills management and board positions. Foran has 65.1 million and 75.1 million shares outstanding on a basic and fully diluted basis, respectively. Insiders and management are well-incented, owning about 17% of the outstanding shares, with “smart money” investments from mining magnate Pierre Lassonde (former Chairman of Newmont Mining) and two Australian specialty funds, Metech No2 Superfund and Laguna Bay Capital Pty Ltd., totalling about 23%.
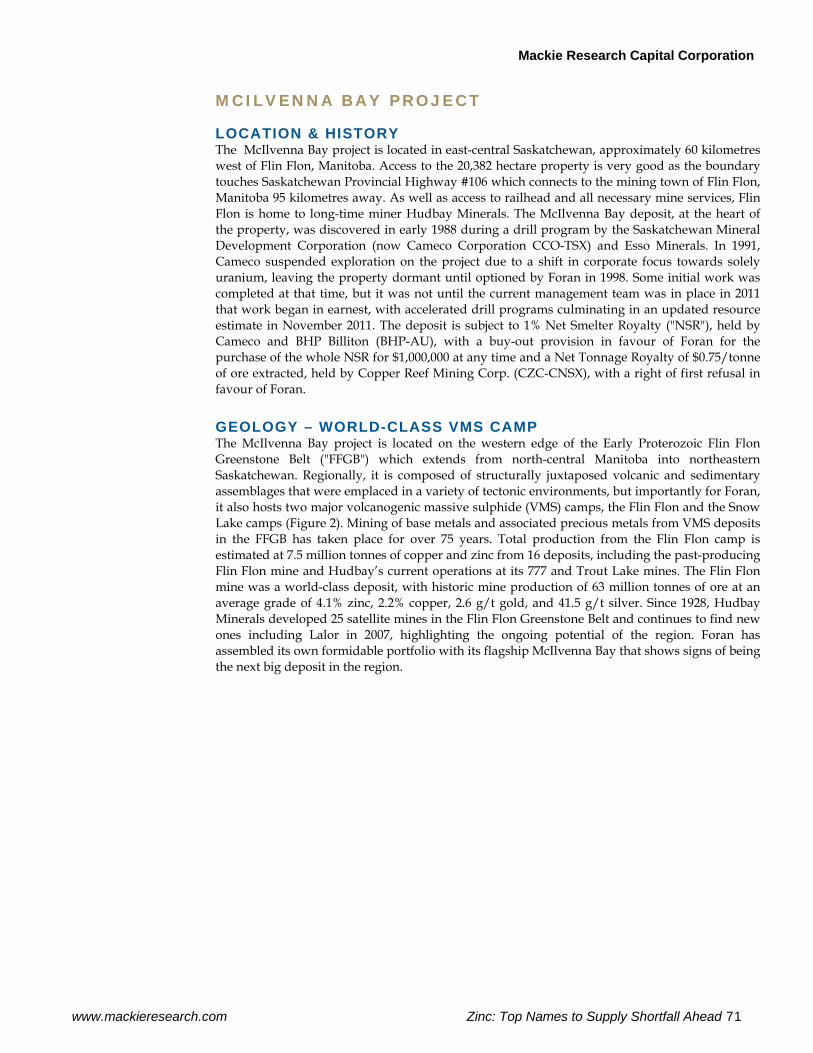
Mackie Research Capital Corporation
www.mackieresearch.com Zinc: Top Names to Supply Shortfall Ahead 71
MCILVENNA BAY PROJECT
LOCATION & HISTORY The McIlvenna Bay project is located in east-central Saskatchewan, approximately 60 kilometres west of Flin Flon, Manitoba. Access to the 20,382 hectare property is very good as the boundary touches Saskatchewan Provincial Highway #106 which connects to the mining town of Flin Flon, Manitoba 95 kilometres away. As well as access to railhead and all necessary mine services, Flin Flon is home to long-time miner Hudbay Minerals. The McIlvenna Bay deposit, at the heart of the property, was discovered in early 1988 during a drill program by the Saskatchewan Mineral Development Corporation (now Cameco Corporation CCO-TSX) and Esso Minerals. In 1991, Cameco suspended exploration on the project due to a shift in corporate focus towards solely uranium, leaving the property dormant until optioned by Foran in 1998. Some initial work was completed at that time, but it was not until the current management team was in place in 2011 that work began in earnest, with accelerated drill programs culminating in an updated resource estimate in November 2011. The deposit is subject to 1% Net Smelter Royalty ("NSR"), held by Cameco and BHP Billiton (BHP-AU), with a buy-out provision in favour of Foran for the purchase of the whole NSR for $1,000,000 at any time and a Net Tonnage Royalty of $0.75/tonne of ore extracted, held by Copper Reef Mining Corp. (CZC-CNSX), with a right of first refusal in favour of Foran.
GEOLOGY – WORLD-CLASS VMS CAMP The McIlvenna Bay project is located on the western edge of the Early Proterozoic Flin Flon Greenstone Belt ("FFGB") which extends from north-central Manitoba into northeastern Saskatchewan. Regionally, it is composed of structurally juxtaposed volcanic and sedimentary assemblages that were emplaced in a variety of tectonic environments, but importantly for Foran, it also hosts two major volcanogenic massive sulphide (VMS) camps, the Flin Flon and the Snow Lake camps (Figure 2). Mining of base metals and associated precious metals from VMS deposits in the FFGB has taken place for over 75 years. Total production from the Flin Flon camp is estimated at 7.5 million tonnes of copper and zinc from 16 deposits, including the past-producing Flin Flon mine and Hudbay’s current operations at its 777 and Trout Lake mines. The Flin Flon mine was a world-class deposit, with historic mine production of 63 million tonnes of ore at an average grade of 4.1% zinc, 2.2% copper, 2.6 g/t gold, and 41.5 g/t silver. Since 1928, Hudbay Minerals developed 25 satellite mines in the Flin Flon Greenstone Belt and continues to find new ones including Lalor in 2007, highlighting the ongoing potential of the region. Foran has assembled its own formidable portfolio with its flagship McIlvenna Bay that shows signs of being the next big deposit in the region.
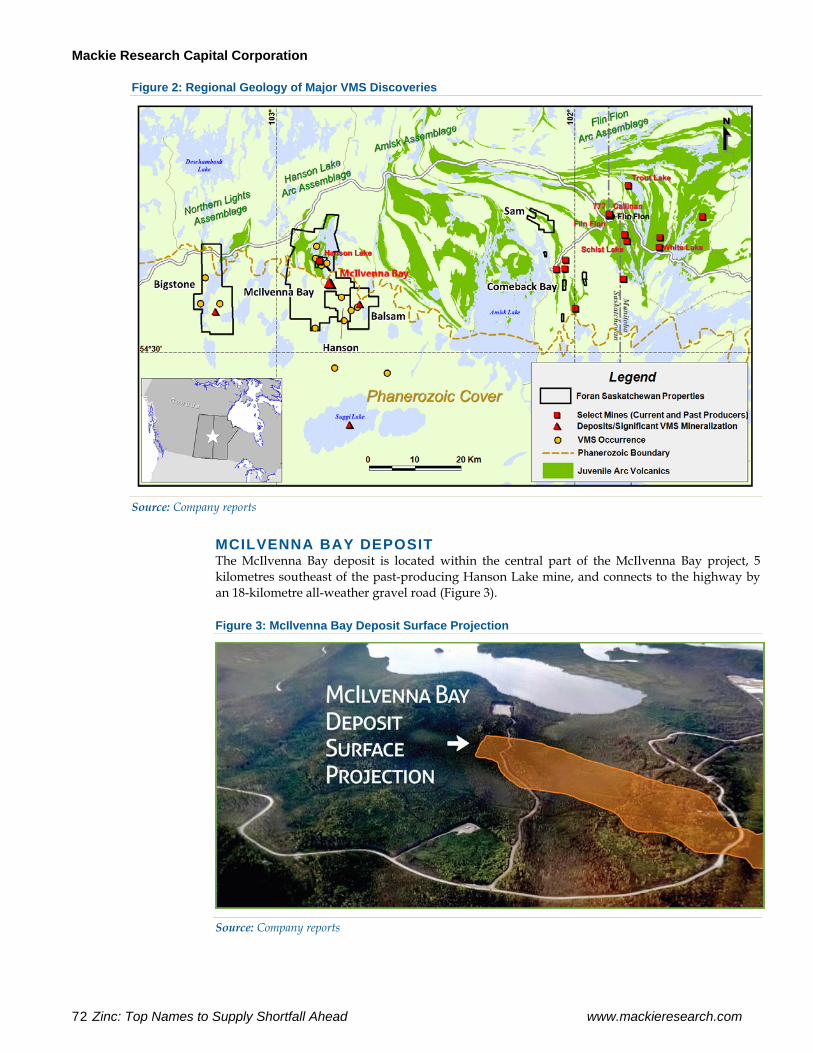
Mackie Research Capital Corporation
72 Zinc: Top Names to Supply Shortfall Ahead www.mackieresearch.com
Figure 2: Regional Geology of Major VMS Discoveries
Source: Company reports
MCILVENNA BAY DEPOSIT The McIlvenna Bay deposit is located within the central part of the McIlvenna Bay project, 5 kilometres southeast of the past-producing Hanson Lake mine, and connects to the highway by an 18-kilometre all-weather gravel road (Figure 3).
Figure 3: McIlvenna Bay Deposit Surface Projection
Source: Company reports
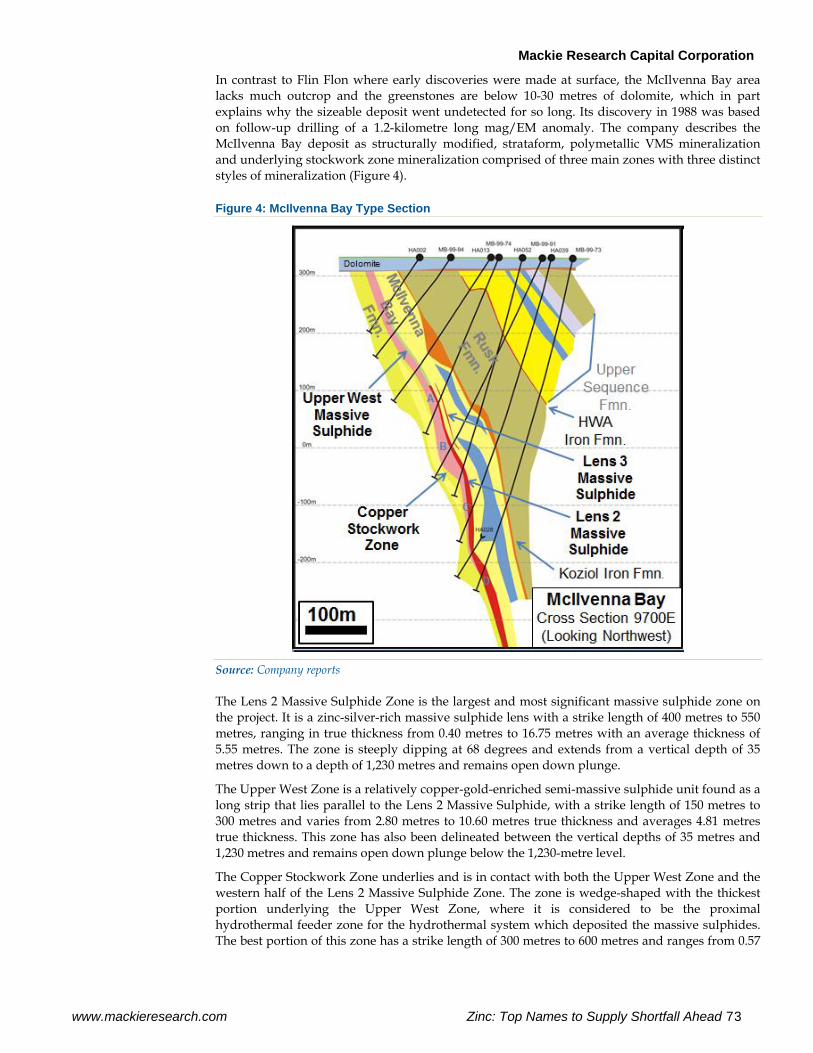
Mackie Research Capital Corporation
www.mackieresearch.com Zinc: Top Names to Supply Shortfall Ahead 73
In contrast to Flin Flon where early discoveries were made at surface, the McIlvenna Bay area lacks much outcrop and the greenstones are below 10-30 metres of dolomite, which in part explains why the sizeable deposit went undetected for so long. Its discovery in 1988 was based on follow-up drilling of a 1.2-kilometre long mag/EM anomaly. The company describes the McIlvenna Bay deposit as structurally modified, strataform, polymetallic VMS mineralization and underlying stockwork zone mineralization comprised of three main zones with three distinct styles of mineralization (Figure 4).
Figure 4: McIlvenna Bay Type Section
Source: Company reports
The Lens 2 Massive Sulphide Zone is the largest and most significant massive sulphide zone on the project. It is a zinc-silver-rich massive sulphide lens with a strike length of 400 metres to 550 metres, ranging in true thickness from 0.40 metres to 16.75 metres with an average thickness of 5.55 metres. The zone is steeply dipping at 68 degrees and extends from a vertical depth of 35 metres down to a depth of 1,230 metres and remains open down plunge.
The Upper West Zone is a relatively copper-gold-enriched semi-massive sulphide unit found as a long strip that lies parallel to the Lens 2 Massive Sulphide, with a strike length of 150 metres to 300 metres and varies from 2.80 metres to 10.60 metres true thickness and averages 4.81 metres true thickness. This zone has also been delineated between the vertical depths of 35 metres and 1,230 metres and remains open down plunge below the 1,230-metre level.
The Copper Stockwork Zone underlies and is in contact with both the Upper West Zone and the western half of the Lens 2 Massive Sulphide Zone. The zone is wedge-shaped with the thickest portion underlying the Upper West Zone, where it is considered to be the proximal hydrothermal feeder zone for the hydrothermal system which deposited the massive sulphides. The best portion of this zone has a strike length of 300 metres to 600 metres and ranges from 0.57
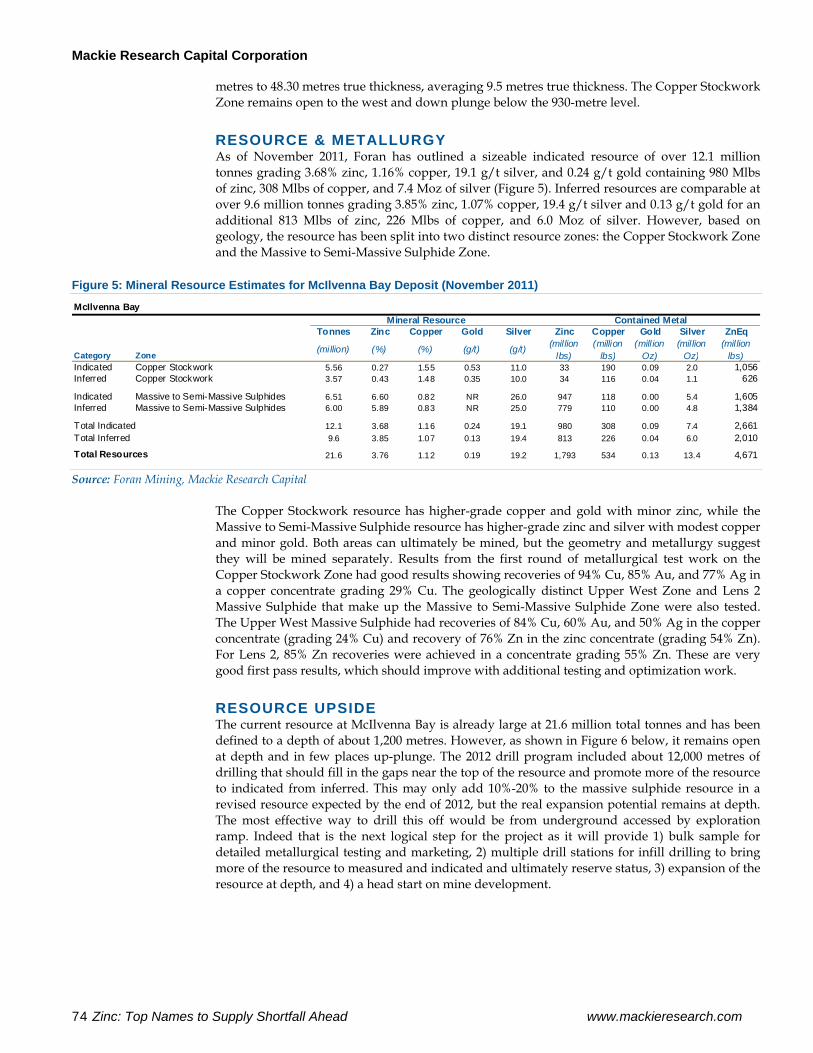
Mackie Research Capital Corporation
74 Zinc: Top Names to Supply Shortfall Ahead www.mackieresearch.com
metres to 48.30 metres true thickness, averaging 9.5 metres true thickness. The Copper Stockwork Zone remains open to the west and down plunge below the 930-metre level.
RESOURCE & METALLURGY As of November 2011, Foran has outlined a sizeable indicated resource of over 12.1 million tonnes grading 3.68% zinc, 1.16% copper, 19.1 g/t silver, and 0.24 g/t gold containing 980 Mlbs of zinc, 308 Mlbs of copper, and 7.4 Moz of silver (Figure 5). Inferred resources are comparable at over 9.6 million tonnes grading 3.85% zinc, 1.07% copper, 19.4 g/t silver and 0.13 g/t gold for an additional 813 Mlbs of zinc, 226 Mlbs of copper, and 6.0 Moz of silver. However, based on geology, the resource has been split into two distinct resource zones: the Copper Stockwork Zone and the Massive to Semi-Massive Sulphide Zone.
Figure 5: Mineral Resource Estimates for McIlvenna Bay Deposit (November 2011)
McIlvenna Bay
Tonnes Zinc Copper Gold Silver Zinc Copper Gold Silver ZnEq
Category Zone(million) (%) (%) (g/t) (g/t) (million
lbs)(million
lbs)(mill ion
Oz)(million
Oz)(mil lion
lbs)Indicated Copper Stockwork 5.56 0.27 1.55 0.53 11.0 33 190 0.09 2.0 1,056Inferred Copper Stockwork 3.57 0.43 1.48 0.35 10.0 34 116 0.04 1.1 626
Indicated Massive to Semi-Massive Sulphides 6.51 6.60 0.82 NR 26.0 947 118 0.00 5.4 1,605Inferred Massive to Semi-Massive Sulphides 6.00 5.89 0.83 NR 25.0 779 110 0.00 4.8 1,384
Total Indicated 12.1 3.68 1.16 0.24 19.1 980 308 0.09 7.4 2,661Total Inferred 9.6 3.85 1.07 0.13 19.4 813 226 0.04 6.0 2,010
Total Resources 21.6 3.76 1.12 0.19 19.2 1,793 534 0.13 13.4 4,671
Mineral Resource Contained Metal
Source: Foran Mining, Mackie Research Capital
The Copper Stockwork resource has higher-grade copper and gold with minor zinc, while the Massive to Semi-Massive Sulphide resource has higher-grade zinc and silver with modest copper and minor gold. Both areas can ultimately be mined, but the geometry and metallurgy suggest they will be mined separately. Results from the first round of metallurgical test work on the Copper Stockwork Zone had good results showing recoveries of 94% Cu, 85% Au, and 77% Ag in a copper concentrate grading 29% Cu. The geologically distinct Upper West Zone and Lens 2 Massive Sulphide that make up the Massive to Semi-Massive Sulphide Zone were also tested. The Upper West Massive Sulphide had recoveries of 84% Cu, 60% Au, and 50% Ag in the copper concentrate (grading 24% Cu) and recovery of 76% Zn in the zinc concentrate (grading 54% Zn). For Lens 2, 85% Zn recoveries were achieved in a concentrate grading 55% Zn. These are very good first pass results, which should improve with additional testing and optimization work.
RESOURCE UPSIDE The current resource at McIlvenna Bay is already large at 21.6 million total tonnes and has been defined to a depth of about 1,200 metres. However, as shown in Figure 6 below, it remains open at depth and in few places up-plunge. The 2012 drill program included about 12,000 metres of drilling that should fill in the gaps near the top of the resource and promote more of the resource to indicated from inferred. This may only add 10%-20% to the massive sulphide resource in a revised resource expected by the end of 2012, but the real expansion potential remains at depth. The most effective way to drill this off would be from underground accessed by exploration ramp. Indeed that is the next logical step for the project as it will provide 1) bulk sample for detailed metallurgical testing and marketing, 2) multiple drill stations for infill drilling to bring more of the resource to measured and indicated and ultimately reserve status, 3) expansion of the resource at depth, and 4) a head start on mine development.
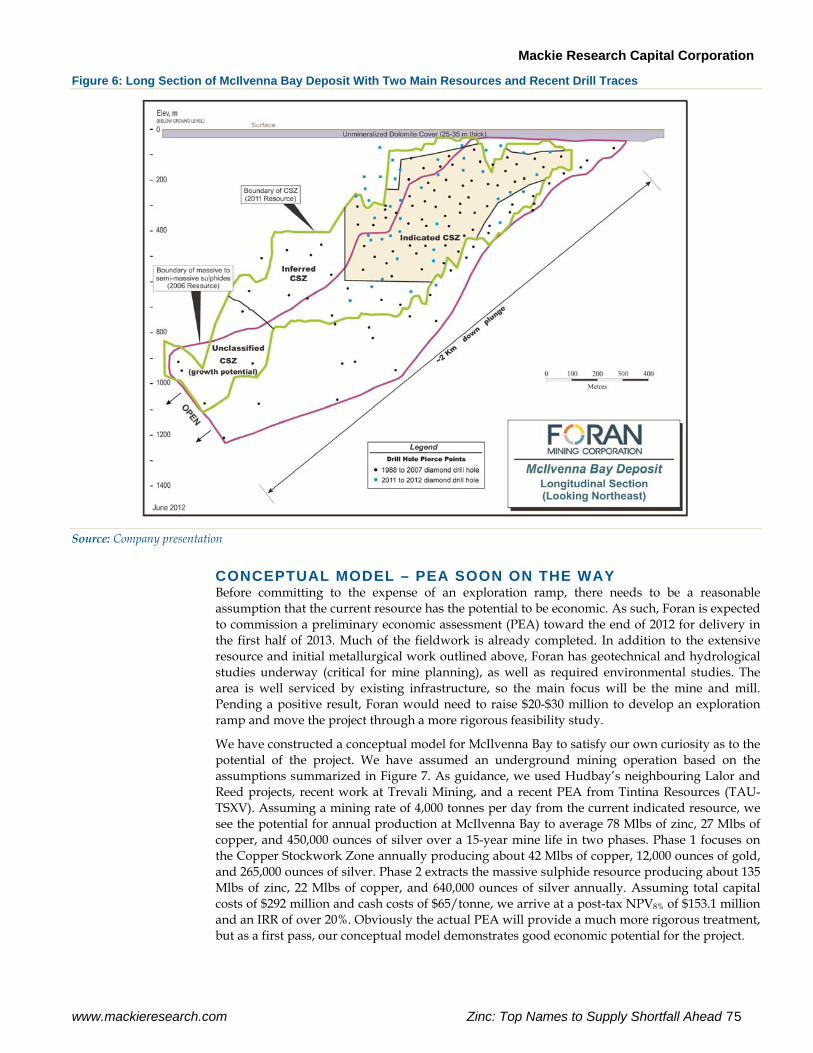
Mackie Research Capital Corporation
www.mackieresearch.com Zinc: Top Names to Supply Shortfall Ahead 75
Figure 6: Long Section of McIlvenna Bay Deposit With Two Main Resources and Recent Drill Traces
Source: Company presentation
CONCEPTUAL MODEL – PEA SOON ON THE WAY Before committing to the expense of an exploration ramp, there needs to be a reasonable assumption that the current resource has the potential to be economic. As such, Foran is expected to commission a preliminary economic assessment (PEA) toward the end of 2012 for delivery in the first half of 2013. Much of the fieldwork is already completed. In addition to the extensive resource and initial metallurgical work outlined above, Foran has geotechnical and hydrological studies underway (critical for mine planning), as well as required environmental studies. The area is well serviced by existing infrastructure, so the main focus will be the mine and mill. Pending a positive result, Foran would need to raise $20-$30 million to develop an exploration ramp and move the project through a more rigorous feasibility study.
We have constructed a conceptual model for McIlvenna Bay to satisfy our own curiosity as to the potential of the project. We have assumed an underground mining operation based on the assumptions summarized in Figure 7. As guidance, we used Hudbay’s neighbouring Lalor and Reed projects, recent work at Trevali Mining, and a recent PEA from Tintina Resources (TAU-TSXV). Assuming a mining rate of 4,000 tonnes per day from the current indicated resource, we see the potential for annual production at McIlvenna Bay to average 78 Mlbs of zinc, 27 Mlbs of copper, and 450,000 ounces of silver over a 15-year mine life in two phases. Phase 1 focuses on the Copper Stockwork Zone annually producing about 42 Mlbs of copper, 12,000 ounces of gold, and 265,000 ounces of silver. Phase 2 extracts the massive sulphide resource producing about 135 Mlbs of zinc, 22 Mlbs of copper, and 640,000 ounces of silver annually. Assuming total capital costs of $292 million and cash costs of $65/tonne, we arrive at a post-tax NPV8% of $153.1 million and an IRR of over 20%. Obviously the actual PEA will provide a much more rigorous treatment, but as a first pass, our conceptual model demonstrates good economic potential for the project.
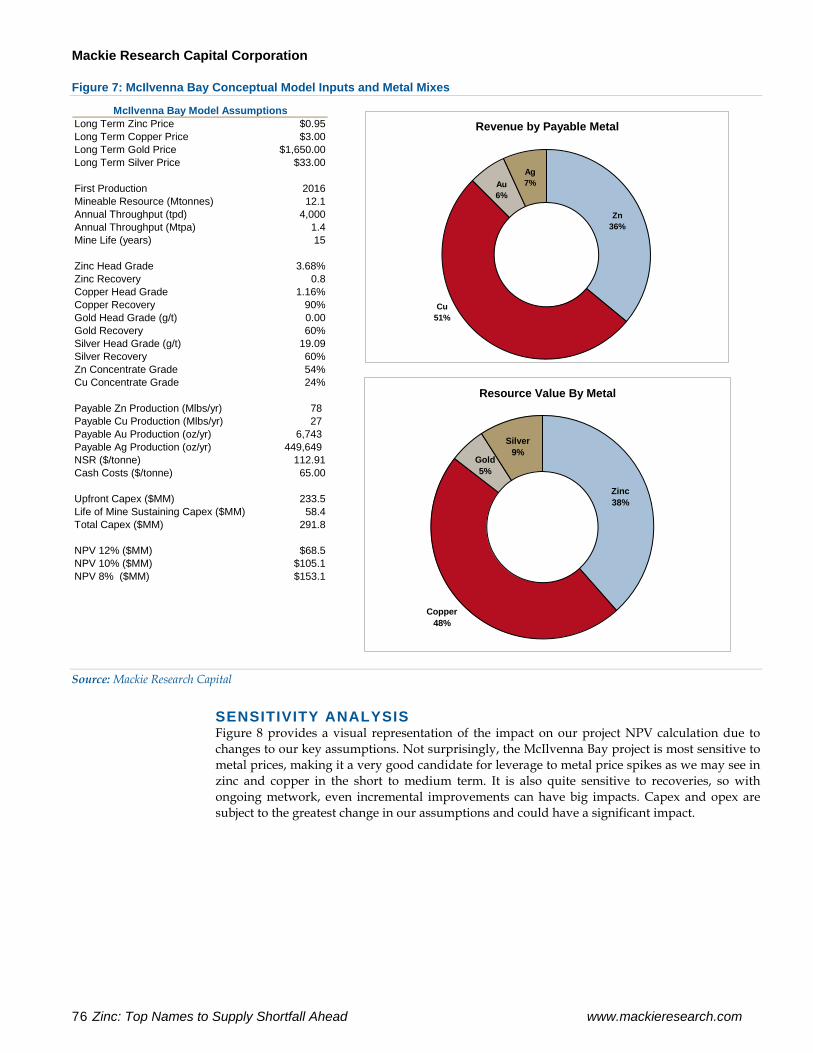
Mackie Research Capital Corporation
76 Zinc: Top Names to Supply Shortfall Ahead www.mackieresearch.com
Figure 7: McIlvenna Bay Conceptual Model Inputs and Metal Mixes
Long Term Zinc Price $0.95Long Term Copper Price $3.00Long Term Gold Price $1,650.00Long Term Silver Price $33.00
First Production 2016Mineable Resource (Mtonnes) 12.1Annual Throughput (tpd) 4,000Annual Throughput (Mtpa) 1.4Mine Life (years) 15
Zinc Head Grade 3.68%Zinc Recovery 0.8Copper Head Grade 1.16%Copper Recovery 90%Gold Head Grade (g/t) 0.00Gold Recovery 60%Silver Head Grade (g/t) 19.09Silver Recovery 60%Zn Concentrate Grade 54%Cu Concentrate Grade 24%
Payable Zn Production (Mlbs/yr) 78 Payable Cu Production (Mlbs/yr) 27 Payable Au Production (oz/yr) 6,743 Payable Ag Production (oz/yr) 449,649 NSR ($/tonne) 112.91Cash Costs ($/tonne) 65.00
Upfront Capex ($MM) 233.5Life of Mine Sustaining Capex ($MM) 58.4Total Capex ($MM) 291.8
NPV 12% ($MM) $68.5NPV 10% ($MM) $105.1NPV 8% ($MM) $153.1
McIlvenna Bay Model AssumptionsRevenue by Payable Metal
Zn36%
Au6%
Ag7%
Cu51%
Resource Value By Metal
Zinc38%
Silver9%
Gold5%
Copper48%
Source: Mackie Research Capital
SENSITIVITY ANALYSIS Figure 8 provides a visual representation of the impact on our project NPV calculation due to changes to our key assumptions. Not surprisingly, the McIlvenna Bay project is most sensitive to metal prices, making it a very good candidate for leverage to metal price spikes as we may see in zinc and copper in the short to medium term. It is also quite sensitive to recoveries, so with ongoing metwork, even incremental improvements can have big impacts. Capex and opex are subject to the greatest change in our assumptions and could have a significant impact.
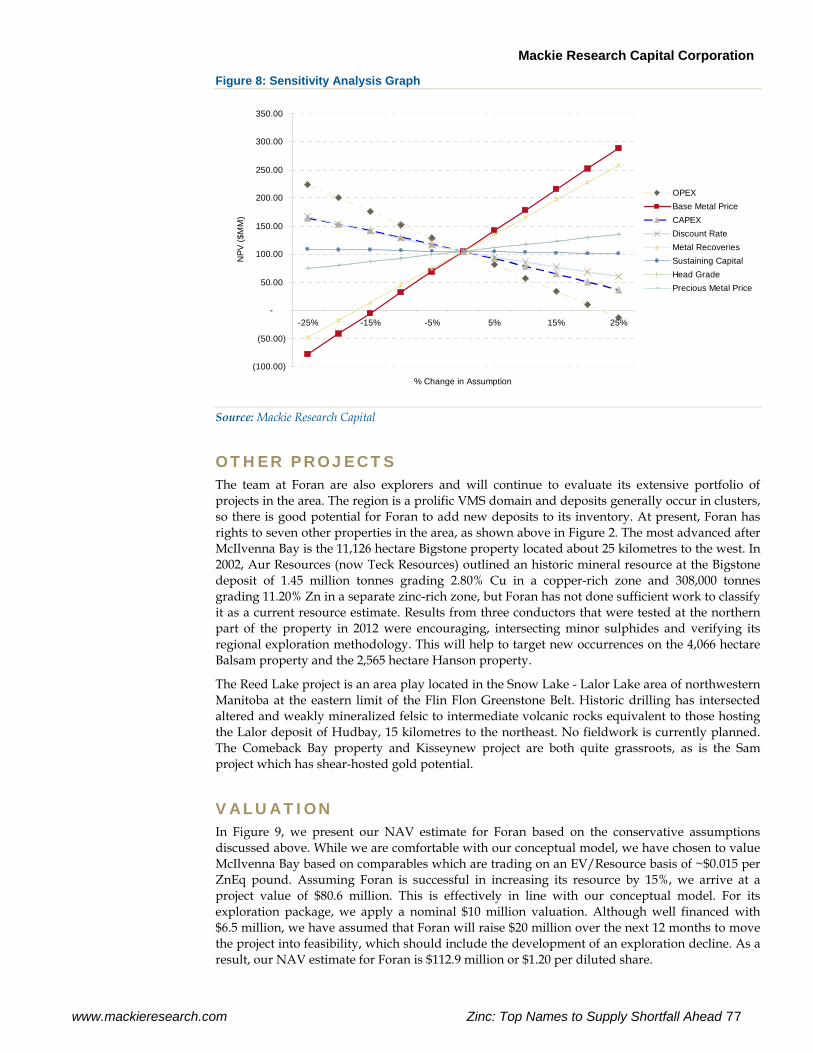
Mackie Research Capital Corporation
www.mackieresearch.com Zinc: Top Names to Supply Shortfall Ahead 77
Figure 8: Sensitivity Analysis Graph
(100.00)
(50.00)
-
50.00
100.00
150.00
200.00
250.00
300.00
350.00
-25% -15% -5% 5% 15% 25%
% Change in Assumption
NPV
($M
M)
OPEXBase Metal PriceCAPEXDiscount RateMetal RecoveriesSustaining CapitalHead GradePrecious Metal Price
Source: Mackie Research Capital
OTHER PROJECTS The team at Foran are also explorers and will continue to evaluate its extensive portfolio of projects in the area. The region is a prolific VMS domain and deposits generally occur in clusters, so there is good potential for Foran to add new deposits to its inventory. At present, Foran has rights to seven other properties in the area, as shown above in Figure 2. The most advanced after McIlvenna Bay is the 11,126 hectare Bigstone property located about 25 kilometres to the west. In 2002, Aur Resources (now Teck Resources) outlined an historic mineral resource at the Bigstone deposit of 1.45 million tonnes grading 2.80% Cu in a copper-rich zone and 308,000 tonnes grading 11.20% Zn in a separate zinc-rich zone, but Foran has not done sufficient work to classify it as a current resource estimate. Results from three conductors that were tested at the northern part of the property in 2012 were encouraging, intersecting minor sulphides and verifying its regional exploration methodology. This will help to target new occurrences on the 4,066 hectare Balsam property and the 2,565 hectare Hanson property.
The Reed Lake project is an area play located in the Snow Lake - Lalor Lake area of northwestern Manitoba at the eastern limit of the Flin Flon Greenstone Belt. Historic drilling has intersected altered and weakly mineralized felsic to intermediate volcanic rocks equivalent to those hosting the Lalor deposit of Hudbay, 15 kilometres to the northeast. No fieldwork is currently planned. The Comeback Bay property and Kisseynew project are both quite grassroots, as is the Sam project which has shear-hosted gold potential.
VALUATION In Figure 9, we present our NAV estimate for Foran based on the conservative assumptions discussed above. While we are comfortable with our conceptual model, we have chosen to value McIlvenna Bay based on comparables which are trading on an EV/Resource basis of ~$0.015 per ZnEq pound. Assuming Foran is successful in increasing its resource by 15%, we arrive at a project value of $80.6 million. This is effectively in line with our conceptual model. For its exploration package, we apply a nominal $10 million valuation. Although well financed with $6.5 million, we have assumed that Foran will raise $20 million over the next 12 months to move the project into feasibility, which should include the development of an exploration decline. As a result, our NAV estimate for Foran is $112.9 million or $1.20 per diluted share.
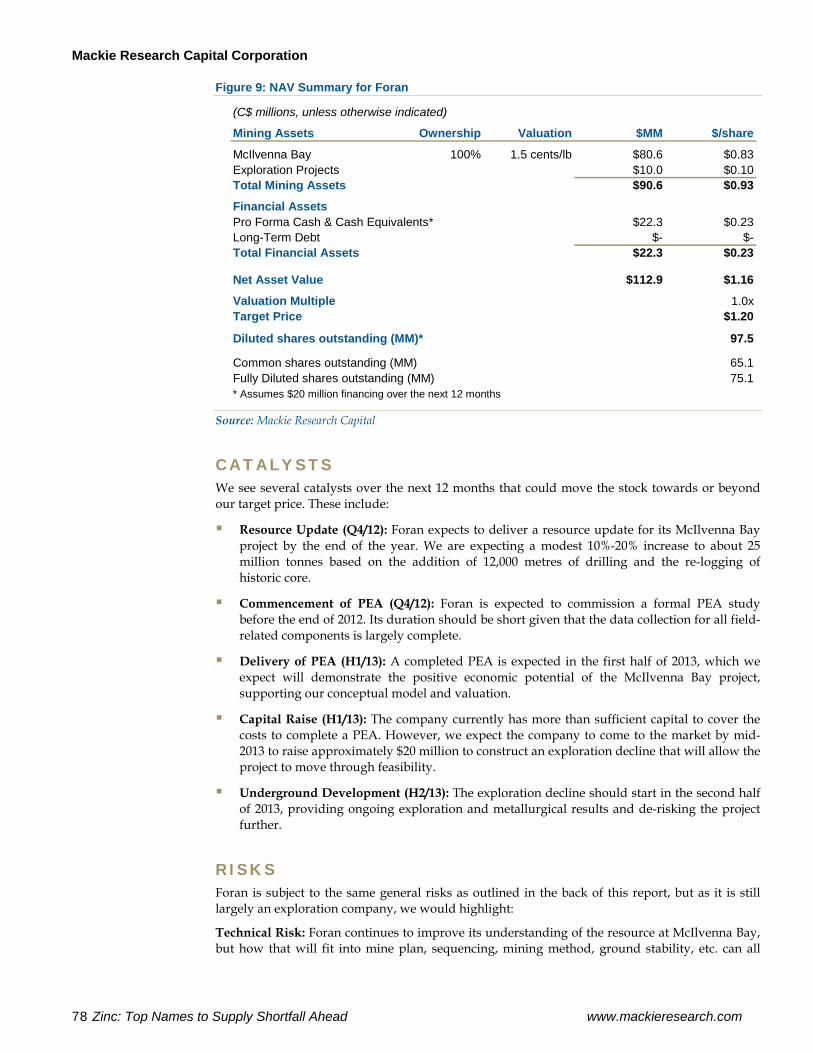
Mackie Research Capital Corporation
78 Zinc: Top Names to Supply Shortfall Ahead www.mackieresearch.com
Figure 9: NAV Summary for Foran
(C$ millions, unless otherwise indicated)
Mining Assets Ownership Valuation $MM $/share
McIlvenna Bay 100% 1.5 cents/lb $80.6 $0.83Exploration Projects $10.0 $0.10Total Mining Assets $90.6 $0.93
Financial AssetsPro Forma Cash & Cash Equivalents* $22.3 $0.23Long-Term Debt $- $-Total Financial Assets $22.3 $0.23
Net Asset Value $112.9 $1.16
Valuation Multiple 1.0xTarget Price $1.20
Diluted shares outstanding (MM)* 97.5
Common shares outstanding (MM) 65.1Fully Diluted shares outstanding (MM) 75.1* Assumes $20 million financing over the next 12 months
Source: Mackie Research Capital
CATALYSTS We see several catalysts over the next 12 months that could move the stock towards or beyond our target price. These include:
Resource Update (Q4/12): Foran expects to deliver a resource update for its McIlvenna Bay project by the end of the year. We are expecting a modest 10%-20% increase to about 25 million tonnes based on the addition of 12,000 metres of drilling and the re-logging of historic core.
Commencement of PEA (Q4/12): Foran is expected to commission a formal PEA study before the end of 2012. Its duration should be short given that the data collection for all field-related components is largely complete.
Delivery of PEA (H1/13): A completed PEA is expected in the first half of 2013, which we expect will demonstrate the positive economic potential of the McIlvenna Bay project, supporting our conceptual model and valuation.
Capital Raise (H1/13): The company currently has more than sufficient capital to cover the costs to complete a PEA. However, we expect the company to come to the market by mid-2013 to raise approximately $20 million to construct an exploration decline that will allow the project to move through feasibility.
Underground Development (H2/13): The exploration decline should start in the second half of 2013, providing ongoing exploration and metallurgical results and de-risking the project further.
RISKS Foran is subject to the same general risks as outlined in the back of this report, but as it is still largely an exploration company, we would highlight:
Technical Risk: Foran continues to improve its understanding of the resource at McIlvenna Bay, but how that will fit into mine plan, sequencing, mining method, ground stability, etc. can all
Mackie Research Capital Corporation
www.mackieresearch.com Zinc: Top Names to Supply Shortfall Ahead 79
have significant impacts on economics. The PEA will go a long way to addressing this and will be a major de-risking event.
Geographic Risk: Overall, we would characterize geographic and jurisdictional risk for Foran as low. Saskatchewan is a mine-friendly province and Foran’s project benefits from being in an established mining district with infrastructure including roads, services, and power.
Financing Risk: Foran currently has ~$6.0 million in cash, which is sufficient to carry it through a PEA. As Foran moves towards feasibility, the company will need to raise about $20 million. Although current market uncertainty increases the risk of being able to adequately raise the required funds, the existing strong shareholder base, low-risk jurisdiction, and polymetallic nature of the deposit should open additional avenues for financing.
CONCLUSION Foran Mining is an advanced explorer/developer advancing a large polymetallic VMS deposit in an established mining district. Its strong management team has a successful track record of developing projects and is advancing its flagship McIlvenna Bay project in the same way. It has outlined a clear path to growing and de-risking the project over the next 24 months that should continue to add value. As with most names in this space, the main hurdle continues to be the current weakness in the equity markets, but Foran’s strong shareholder base, high-quality assets located in a low-risk jurisdiction, and polymetallic nature of its main deposit should open multiple avenues for project financing. On a comparable basis, we value Foran at $1.20 per share, which is consistent with our back-of-the-envelope conceptual model. At current levels, the stock offers value trading at 0.55x our NAV and target. We see additional upside towards $2.00 per share as the project moves through feasibility and further potential is realized from its exploration properties. We are initiating coverage on Foran Mining Corp. with a SPECULATIVE BUY recommendation and 12-month target price of C$1.20/share.
Mackie Research Capital Corporation
80 Zinc: Top Names to Supply Shortfall Ahead www.mackieresearch.com
MANAGEMENT TEAM & BOARD Patrick Soares, President, CEO & Director: Mr. Soares began his professional career in 1983 as an exploration and mine geologist and subsequently held corporate positions with Sutton Resources Ltd. (acquired by Barrick Gold in 1999), EuroZinc Mining Corp. (now part of Lundin Mining Corporation), and Aurizon Mines Ltd. Mr. Soares currently sits on the Board of SnipGold Corp. and Lupaka Gold Corp. He served as the President and CEO of Brett Resources Inc. which was acquired by Osisko Mining Corp. in May 2010. Mr. Soares holds a B.Sc. (Hons.) from the University of British Columbia and is a Professional Geoscientist with APEGBC.
Tim Thiessen, CFO: Mr. Thiessen has 13 years of international experience in public accounting and the mining industry and was previously CFO of Aurcana Corp. and VP of Finance for Endeavour Financial Ltd. Mr. Thiessen is a graduate of the University of Manitoba and is a member of the Canadian Institute of Chartered Accountants.
Dr. Fiona Childe, VP, Corporate Development: Dr. Childe has over 15 years of experience in the mining sector and has held senior management positions with several private and TSX-listed mining and development companies. Dr. Childe is a graduate of McGill University and the Mineral Deposit Research Unit at the University of British Columbia. She is a Professional Geoscientist with the APGO and has published technical papers on VMS deposits worldwide.
Roger March, VP Project Exploration: Mr. March has almost 20 years of progressive exploration and project management experience. In his prior role, he was Senior Project Geologist at Cumberland Resources where he was part of the team responsible for the completion of prefeasibility and feasibility level studies for the Meadowbank Gold Project. Mr. March is a Professional Geoscientist with the PEGNL and holds a B.Sc. (Hons.) from Memorial University.
Dave Fleming, VP Exploration: Mr. Fleming has over 30 years of experience in mineral exploration throughout North America and has worked with several major mining companies, including Cyprus Canada, Kennecott Canada, and Billiton Metals. He was also part of the exploration and development team for the Meadowbank Gold Deposit with Cumberland Resources Ltd. (acquired by Agnico-Eagle Mines Ltd. in 2007). Mr. Fleming is a Professional Geoscientist with the APEGBC and holds a B.Sc. from the University of British Columbia.
Darren Morcombe, Chairman of the Board: Mr. Morcombe has more than 20 years of professional experience in a variety of natural resource roles in Australia, United States, and Switzerland, including over 10 years in senior roles with Normandy Mining and Newmont Mining Corp. in the areas of financing, treasury, and mergers and acquisitions.
Sharon Dowdall, Director: Ms. Dowdall joined the Board of Directors in 2011 and has over 30 years of experience in the legal field including Chief Legal Officer and Corporate Secretary of Franco-Nevada Corp. and as an Officer of Newmont Capital from 2002 to 2007.
Maurice Tagami, Director: Mr. Tagami joined the Board of Directors in 2011 and has over 30 years of experience in mining development and operations. Mr. Tagami holds a degree in Metallurgical Engineering from the University of British Columbia and is a Professional Engineer. He is VP Mining Operations at Silver Wheaton Corp. and previously served on the Board of Directors of Brett Resources Inc. (acquired by Osisko Mining Corp. in 2010).
Bradley Summach, Director: Mr. Summach joined the Board of Directors in 2005 and previously held the position of President of Foran from November 2008 to November 2010 and Vice President of Corporate Relations of Foran until mid-2006. Mr. Summach is the Chief Financial Officer of BBS Aircraft Inc. and President of Summach Ventures. Mr. Summach holds a Bachelor of Science in Mechanical Engineering from the University of Saskatchewan.
David M. Petroff, Director: Mr. Petroff joined the Board of Directors in 2012 and has over 30 years of experience in the mining and investment industry, including the role of President, CEO, and Director of zinc producer Breakwater Resources Ltd. from early 2009 until its acquisition by

Mackie Research Capital Corporation
www.mackieresearch.com Zinc: Top Names to Supply Shortfall Ahead 81
Nyrstar NV in mid-2011. Mr. Petroff holds a B.Math from the University of Waterloo and an MBA from the Schulich School of Business.

Mackie Research Capital Corporation
82 Zinc: Top Names to Supply Shortfall Ahead www.mackieresearch.com
This page left intentionally blank.
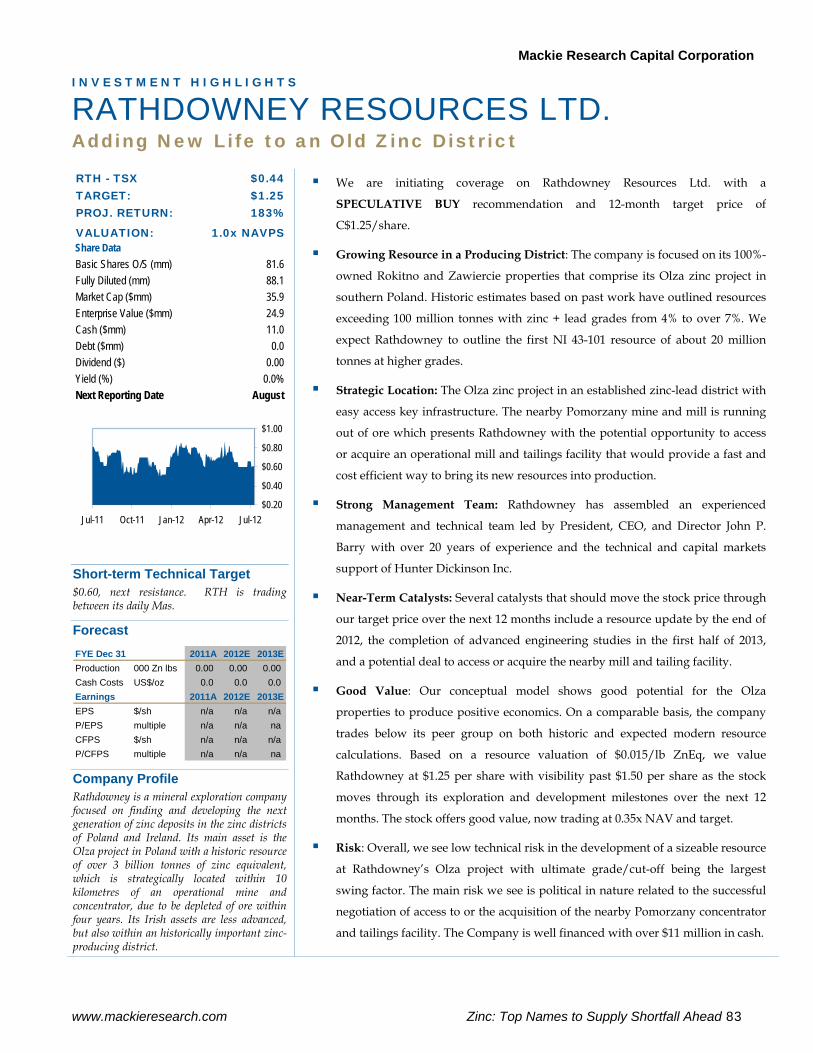
Mackie Research Capital Corporation
www.mackieresearch.com Zinc: Top Names to Supply Shortfall Ahead 83
I N V E S T M E N T H I G H L I G H T S
RATHDOWNEY RESOURCES LTD. Adding New Life to an Old Zinc District
RTH - TSX $0.44TARGET: $1.25PROJ. RETURN: 183%
VALUATION: 1.0x NAVPSShare DataBasic Shares O/S (mm) 81.6Fully Diluted (mm) 88.1Market Cap ($mm) 35.9Enterprise Value ($mm) 24.9Cash ($mm) 11.0Debt ($mm) 0.0Dividend ($) 0.00Yield (%) 0.0%Next Reporting Date August
$0.20
$0.40
$0.60
$0.80
$1.00
Jul-11 Oct-11 Jan-12 Apr-12 Jul-12
Short-term Technical Target $0.60, next resistance. RTH is trading between its daily Mas.
Forecast FYE Dec 31 2011A 2012E 2013EProduction 000 Zn lbs 0.00 0.00 0.00Cash Costs US$/oz 0.0 0.0 0.0Earnings 2011A 2012E 2013EEPS $/sh n/a n/a n/aP/EPS multiple n/a n/a naCFPS $/sh n/a n/a n/aP/CFPS multiple n/a n/a na
Company Profile Rathdowney is a mineral exploration company focused on finding and developing the next generation of zinc deposits in the zinc districts of Poland and Ireland. Its main asset is the Olza project in Poland with a historic resource of over 3 billion tonnes of zinc equivalent, which is strategically located within 10 kilometres of an operational mine and concentrator, due to be depleted of ore within four years. Its Irish assets are less advanced, but also within an historically important zinc-producing district.
We are initiating coverage on Rathdowney Resources Ltd. with a
SPECULATIVE BUY recommendation and 12-month target price of
C$1.25/share.
Growing Resource in a Producing District: The company is focused on its 100%-
owned Rokitno and Zawiercie properties that comprise its Olza zinc project in
southern Poland. Historic estimates based on past work have outlined resources
exceeding 100 million tonnes with zinc + lead grades from 4% to over 7%. We
expect Rathdowney to outline the first NI 43-101 resource of about 20 million
tonnes at higher grades.
Strategic Location: The Olza zinc project in an established zinc-lead district with
easy access key infrastructure. The nearby Pomorzany mine and mill is running
out of ore which presents Rathdowney with the potential opportunity to access
or acquire an operational mill and tailings facility that would provide a fast and
cost efficient way to bring its new resources into production.
Strong Management Team: Rathdowney has assembled an experienced
management and technical team led by President, CEO, and Director John P.
Barry with over 20 years of experience and the technical and capital markets
support of Hunter Dickinson Inc.
Near-Term Catalysts: Several catalysts that should move the stock price through
our target price over the next 12 months include a resource update by the end of
2012, the completion of advanced engineering studies in the first half of 2013,
and a potential deal to access or acquire the nearby mill and tailing facility.
Good Value: Our conceptual model shows good potential for the Olza
properties to produce positive economics. On a comparable basis, the company
trades below its peer group on both historic and expected modern resource
calculations. Based on a resource valuation of $0.015/lb ZnEq, we value
Rathdowney at $1.25 per share with visibility past $1.50 per share as the stock
moves through its exploration and development milestones over the next 12
months. The stock offers good value, now trading at 0.35x NAV and target.
Risk: Overall, we see low technical risk in the development of a sizeable resource
at Rathdowney’s Olza project with ultimate grade/cut-off being the largest
swing factor. The main risk we see is political in nature related to the successful
negotiation of access to or the acquisition of the nearby Pomorzany concentrator
and tailings facility. The Company is well financed with over $11 million in cash.
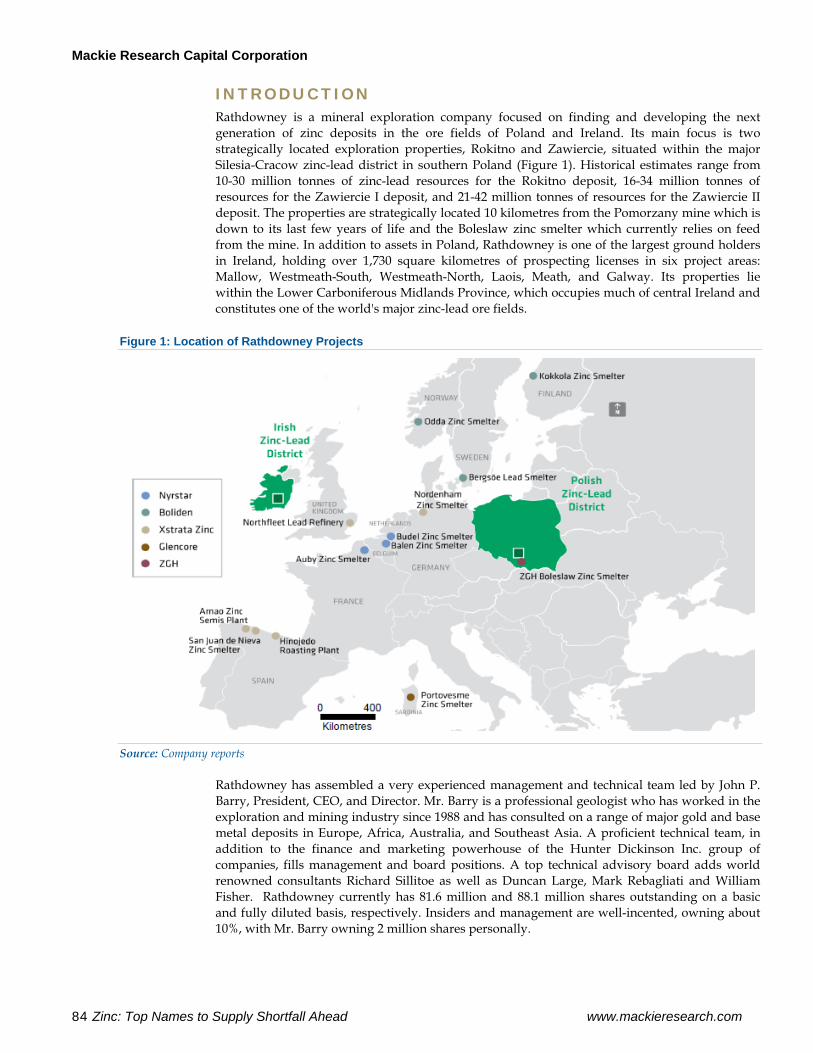
Mackie Research Capital Corporation
84 Zinc: Top Names to Supply Shortfall Ahead www.mackieresearch.com
INTRODUCTION Rathdowney is a mineral exploration company focused on finding and developing the next generation of zinc deposits in the ore fields of Poland and Ireland. Its main focus is two strategically located exploration properties, Rokitno and Zawiercie, situated within the major Silesia-Cracow zinc-lead district in southern Poland (Figure 1). Historical estimates range from 10-30 million tonnes of zinc-lead resources for the Rokitno deposit, 16-34 million tonnes of resources for the Zawiercie I deposit, and 21-42 million tonnes of resources for the Zawiercie II deposit. The properties are strategically located 10 kilometres from the Pomorzany mine which is down to its last few years of life and the Boleslaw zinc smelter which currently relies on feed from the mine. In addition to assets in Poland, Rathdowney is one of the largest ground holders in Ireland, holding over 1,730 square kilometres of prospecting licenses in six project areas: Mallow, Westmeath-South, Westmeath-North, Laois, Meath, and Galway. Its properties lie within the Lower Carboniferous Midlands Province, which occupies much of central Ireland and constitutes one of the world's major zinc-lead ore fields.
Figure 1: Location of Rathdowney Projects
Source: Company reports
Rathdowney has assembled a very experienced management and technical team led by John P. Barry, President, CEO, and Director. Mr. Barry is a professional geologist who has worked in the exploration and mining industry since 1988 and has consulted on a range of major gold and base metal deposits in Europe, Africa, Australia, and Southeast Asia. A proficient technical team, in addition to the finance and marketing powerhouse of the Hunter Dickinson Inc. group of companies, fills management and board positions. A top technical advisory board adds world renowned consultants Richard Sillitoe as well as Duncan Large, Mark Rebagliati and William Fisher. Rathdowney currently has 81.6 million and 88.1 million shares outstanding on a basic and fully diluted basis, respectively. Insiders and management are well-incented, owning about 10%, with Mr. Barry owning 2 million shares personally.
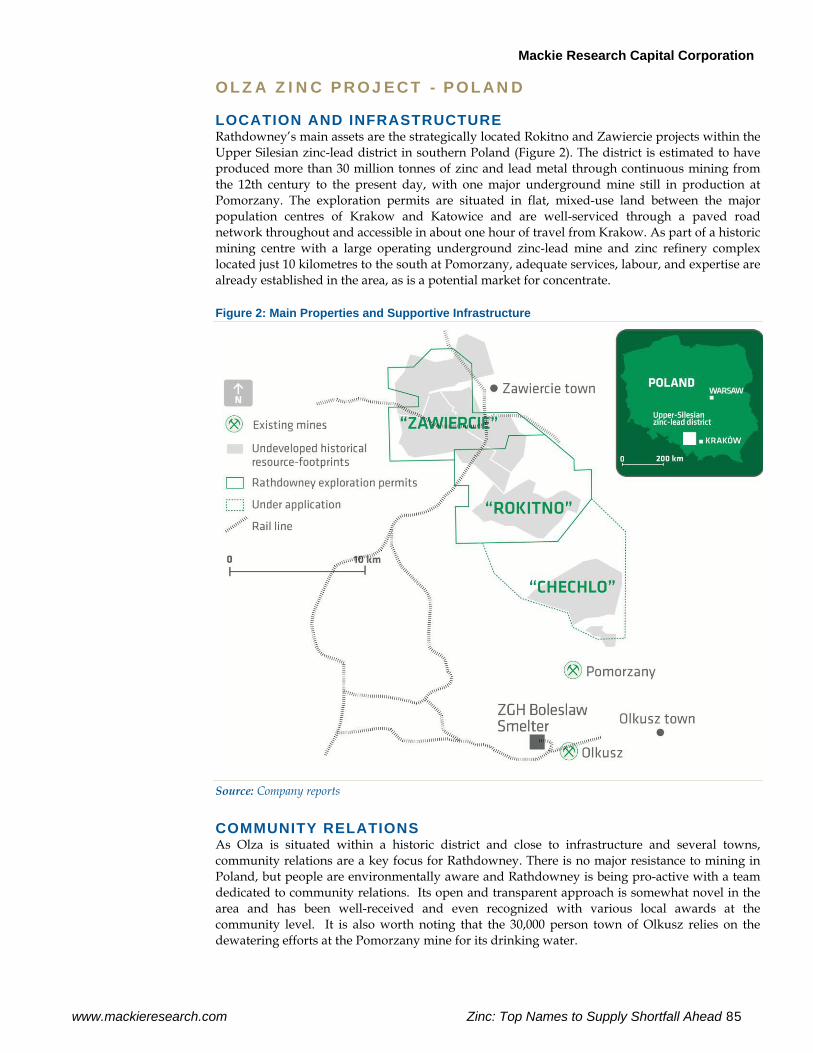
Mackie Research Capital Corporation
www.mackieresearch.com Zinc: Top Names to Supply Shortfall Ahead 85
OLZA ZINC PROJECT - POLAND
LOCATION AND INFRASTRUCTURE Rathdowney’s main assets are the strategically located Rokitno and Zawiercie projects within the Upper Silesian zinc-lead district in southern Poland (Figure 2). The district is estimated to have produced more than 30 million tonnes of zinc and lead metal through continuous mining from the 12th century to the present day, with one major underground mine still in production at Pomorzany. The exploration permits are situated in flat, mixed-use land between the major population centres of Krakow and Katowice and are well-serviced through a paved road network throughout and accessible in about one hour of travel from Krakow. As part of a historic mining centre with a large operating underground zinc-lead mine and zinc refinery complex located just 10 kilometres to the south at Pomorzany, adequate services, labour, and expertise are already established in the area, as is a potential market for concentrate.
Figure 2: Main Properties and Supportive Infrastructure
Source: Company reports
COMMUNITY RELATIONS As Olza is situated within a historic district and close to infrastructure and several towns, community relations are a key focus for Rathdowney. There is no major resistance to mining in Poland, but people are environmentally aware and Rathdowney is being pro-active with a team dedicated to community relations. Its open and transparent approach is somewhat novel in the area and has been well-received and even recognized with various local awards at the community level. It is also worth noting that the 30,000 person town of Olkusz relies on the dewatering efforts at the Pomorzany mine for its drinking water.
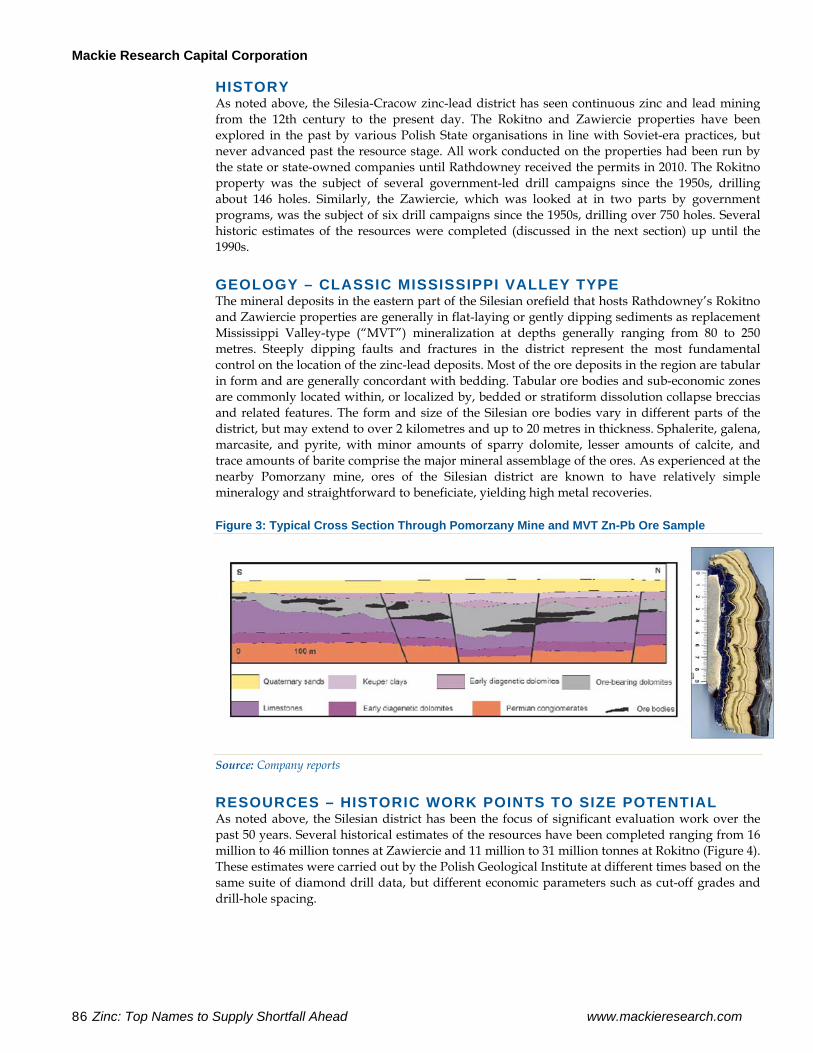
Mackie Research Capital Corporation
86 Zinc: Top Names to Supply Shortfall Ahead www.mackieresearch.com
HISTORY As noted above, the Silesia-Cracow zinc-lead district has seen continuous zinc and lead mining from the 12th century to the present day. The Rokitno and Zawiercie properties have been explored in the past by various Polish State organisations in line with Soviet-era practices, but never advanced past the resource stage. All work conducted on the properties had been run by the state or state-owned companies until Rathdowney received the permits in 2010. The Rokitno property was the subject of several government-led drill campaigns since the 1950s, drilling about 146 holes. Similarly, the Zawiercie, which was looked at in two parts by government programs, was the subject of six drill campaigns since the 1950s, drilling over 750 holes. Several historic estimates of the resources were completed (discussed in the next section) up until the 1990s.
GEOLOGY – CLASSIC MISSISSIPPI VALLEY TYPE The mineral deposits in the eastern part of the Silesian orefield that hosts Rathdowney’s Rokitno and Zawiercie properties are generally in flat-laying or gently dipping sediments as replacement Mississippi Valley-type (“MVT”) mineralization at depths generally ranging from 80 to 250 metres. Steeply dipping faults and fractures in the district represent the most fundamental control on the location of the zinc-lead deposits. Most of the ore deposits in the region are tabular in form and are generally concordant with bedding. Tabular ore bodies and sub-economic zones are commonly located within, or localized by, bedded or stratiform dissolution collapse breccias and related features. The form and size of the Silesian ore bodies vary in different parts of the district, but may extend to over 2 kilometres and up to 20 metres in thickness. Sphalerite, galena, marcasite, and pyrite, with minor amounts of sparry dolomite, lesser amounts of calcite, and trace amounts of barite comprise the major mineral assemblage of the ores. As experienced at the nearby Pomorzany mine, ores of the Silesian district are known to have relatively simple mineralogy and straightforward to beneficiate, yielding high metal recoveries.
Figure 3: Typical Cross Section Through Pomorzany Mine and MVT Zn-Pb Ore Sample
Source: Company reports
RESOURCES – HISTORIC WORK POINTS TO SIZE POTENTIAL As noted above, the Silesian district has been the focus of significant evaluation work over the past 50 years. Several historical estimates of the resources have been completed ranging from 16 million to 46 million tonnes at Zawiercie and 11 million to 31 million tonnes at Rokitno (Figure 4). These estimates were carried out by the Polish Geological Institute at different times based on the same suite of diamond drill data, but different economic parameters such as cut-off grades and drill-hole spacing.
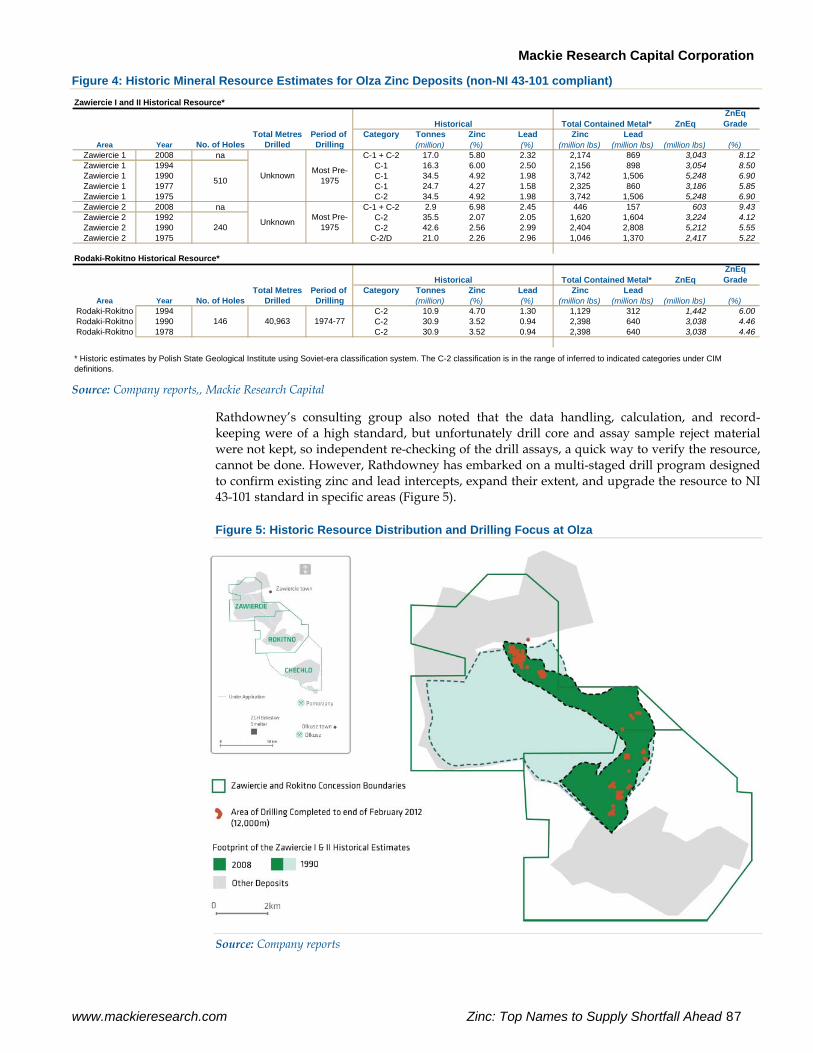
Mackie Research Capital Corporation
www.mackieresearch.com Zinc: Top Names to Supply Shortfall Ahead 87
Figure 4: Historic Mineral Resource Estimates for Olza Zinc Deposits (non-NI 43-101 compliant) Zawiercie I and II Historical Resource*
ZnEqZnEq Grade
Total Metres Period of Category Tonnes Zinc Lead Zinc LeadArea Year No. of Holes Drilled Drilling (million) (%) (%) (million lbs) (million lbs) (million lbs) (%)
Zawiercie 1 2008 na C-1 + C-2 17.0 5.80 2.32 2,174 869 3,043 8.12 Zawiercie 1 1994 C-1 16.3 6.00 2.50 2,156 898 3,054 8.50 Zawiercie 1 1990 C-1 34.5 4.92 1.98 3,742 1,506 5,248 6.90 Zawiercie 1 1977 C-1 24.7 4.27 1.58 2,325 860 3,186 5.85 Zawiercie 1 1975 C-2 34.5 4.92 1.98 3,742 1,506 5,248 6.90 Zawiercie 2 2008 na C-1 + C-2 2.9 6.98 2.45 446 157 603 9.43 Zawiercie 2 1992 C-2 35.5 2.07 2.05 1,620 1,604 3,224 4.12 Zawiercie 2 1990 C-2 42.6 2.56 2.99 2,404 2,808 5,212 5.55 Zawiercie 2 1975 C-2/D 21.0 2.26 2.96 1,046 1,370 2,417 5.22
Rodaki-Rokitno Historical Resource*
ZnEqZnEq Grade
Total Metres Period of Category Tonnes Zinc Lead Zinc LeadArea Year No. of Holes Drilled Drilling (million) (%) (%) (million lbs) (million lbs) (million lbs) (%)
Rodaki-Rokitno 1994 C-2 10.9 4.70 1.30 1,129 312 1,442 6.00 Rodaki-Rokitno 1990 C-2 30.9 3.52 0.94 2,398 640 3,038 4.46 Rodaki-Rokitno 1978 C-2 30.9 3.52 0.94 2,398 640 3,038 4.46
* Historic estimates by Polish State Geological Institute using Soviet-era classification system. The C-2 classification is in the range of inferred to indicated categories under CIM definitions.
Total Contained Metal*
1974-77146 40,963
Historical
Total Contained Metal*
Unknown
Unknown
Historical
Most Pre-1975
Most Pre-1975
240
510
Source: Company reports,, Mackie Research Capital
Rathdowney’s consulting group also noted that the data handling, calculation, and record-keeping were of a high standard, but unfortunately drill core and assay sample reject material were not kept, so independent re-checking of the drill assays, a quick way to verify the resource, cannot be done. However, Rathdowney has embarked on a multi-staged drill program designed to confirm existing zinc and lead intercepts, expand their extent, and upgrade the resource to NI 43-101 standard in specific areas (Figure 5).
Figure 5: Historic Resource Distribution and Drilling Focus at Olza
Source: Company reports
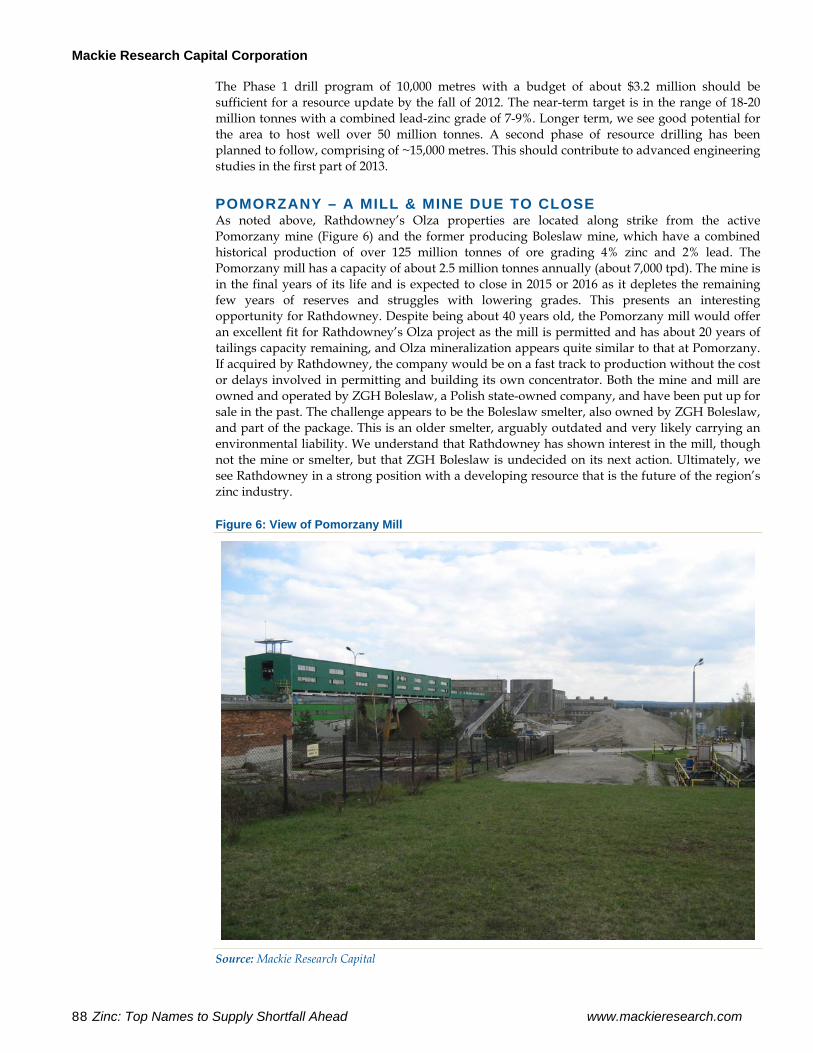
Mackie Research Capital Corporation
88 Zinc: Top Names to Supply Shortfall Ahead www.mackieresearch.com
The Phase 1 drill program of 10,000 metres with a budget of about $3.2 million should be sufficient for a resource update by the fall of 2012. The near-term target is in the range of 18-20 million tonnes with a combined lead-zinc grade of 7-9%. Longer term, we see good potential for the area to host well over 50 million tonnes. A second phase of resource drilling has been planned to follow, comprising of ~15,000 metres. This should contribute to advanced engineering studies in the first part of 2013.
POMORZANY – A MILL & MINE DUE TO CLOSE As noted above, Rathdowney’s Olza properties are located along strike from the active Pomorzany mine (Figure 6) and the former producing Boleslaw mine, which have a combined historical production of over 125 million tonnes of ore grading 4% zinc and 2% lead. The Pomorzany mill has a capacity of about 2.5 million tonnes annually (about 7,000 tpd). The mine is in the final years of its life and is expected to close in 2015 or 2016 as it depletes the remaining few years of reserves and struggles with lowering grades. This presents an interesting opportunity for Rathdowney. Despite being about 40 years old, the Pomorzany mill would offer an excellent fit for Rathdowney’s Olza project as the mill is permitted and has about 20 years of tailings capacity remaining, and Olza mineralization appears quite similar to that at Pomorzany. If acquired by Rathdowney, the company would be on a fast track to production without the cost or delays involved in permitting and building its own concentrator. Both the mine and mill are owned and operated by ZGH Boleslaw, a Polish state-owned company, and have been put up for sale in the past. The challenge appears to be the Boleslaw smelter, also owned by ZGH Boleslaw, and part of the package. This is an older smelter, arguably outdated and very likely carrying an environmental liability. We understand that Rathdowney has shown interest in the mill, though not the mine or smelter, but that ZGH Boleslaw is undecided on its next action. Ultimately, we see Rathdowney in a strong position with a developing resource that is the future of the region’s zinc industry.
Figure 6: View of Pomorzany Mill
Source: Mackie Research Capital
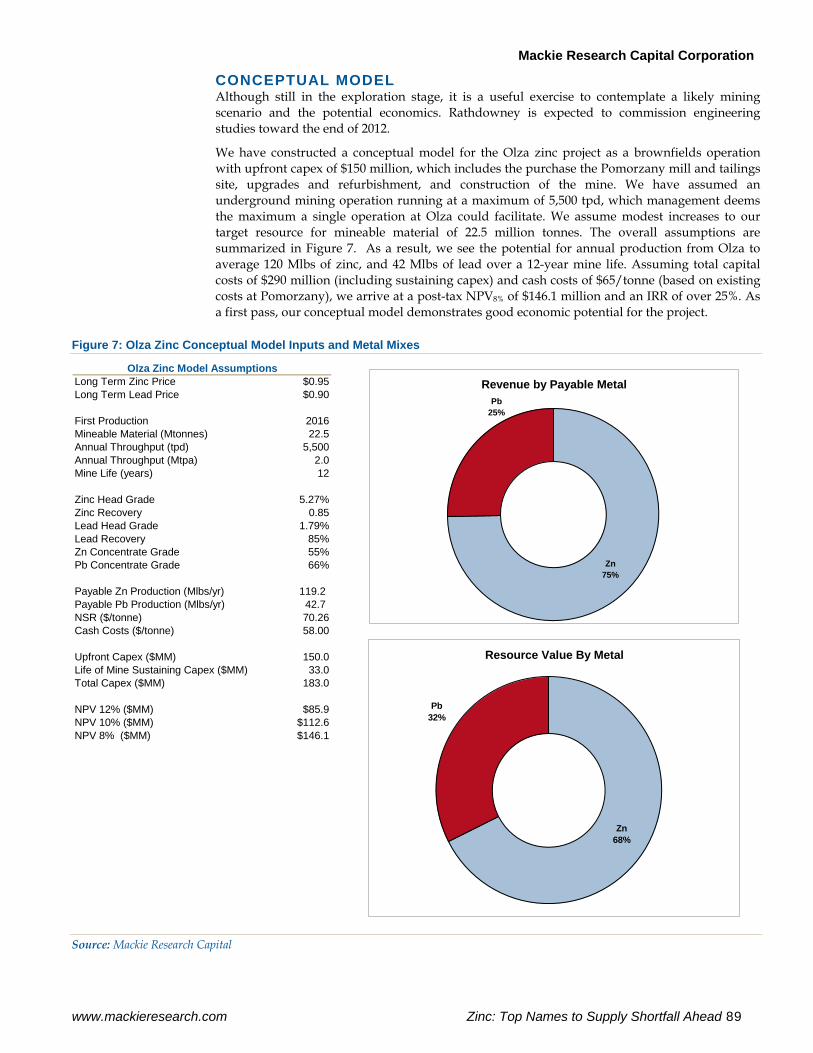
Mackie Research Capital Corporation
www.mackieresearch.com Zinc: Top Names to Supply Shortfall Ahead 89
CONCEPTUAL MODEL Although still in the exploration stage, it is a useful exercise to contemplate a likely mining scenario and the potential economics. Rathdowney is expected to commission engineering studies toward the end of 2012.
We have constructed a conceptual model for the Olza zinc project as a brownfields operation with upfront capex of $150 million, which includes the purchase the Pomorzany mill and tailings site, upgrades and refurbishment, and construction of the mine. We have assumed an underground mining operation running at a maximum of 5,500 tpd, which management deems the maximum a single operation at Olza could facilitate. We assume modest increases to our target resource for mineable material of 22.5 million tonnes. The overall assumptions are summarized in Figure 7. As a result, we see the potential for annual production from Olza to average 120 Mlbs of zinc, and 42 Mlbs of lead over a 12-year mine life. Assuming total capital costs of $290 million (including sustaining capex) and cash costs of $65/tonne (based on existing costs at Pomorzany), we arrive at a post-tax NPV8% of $146.1 million and an IRR of over 25%. As a first pass, our conceptual model demonstrates good economic potential for the project.
Figure 7: Olza Zinc Conceptual Model Inputs and Metal Mixes
Long Term Zinc Price $0.95Long Term Lead Price $0.90
First Production 2016Mineable Material (Mtonnes) 22.5Annual Throughput (tpd) 5,500Annual Throughput (Mtpa) 2.0Mine Life (years) 12
Zinc Head Grade 5.27%Zinc Recovery 0.85Lead Head Grade 1.79%Lead Recovery 85%Zn Concentrate Grade 55%Pb Concentrate Grade 66%
Payable Zn Production (Mlbs/yr) 119.2 Payable Pb Production (Mlbs/yr) 42.7 NSR ($/tonne) 70.26Cash Costs ($/tonne) 58.00
Upfront Capex ($MM) 150.0Life of Mine Sustaining Capex ($MM) 33.0Total Capex ($MM) 183.0
NPV 12% ($MM) $85.9NPV 10% ($MM) $112.6NPV 8% ($MM) $146.1
Olza Zinc Model AssumptionsRevenue by Payable Metal
Zn75%
Pb25%
Resource Value By Metal
Zn68%
Pb32%
Source: Mackie Research Capital
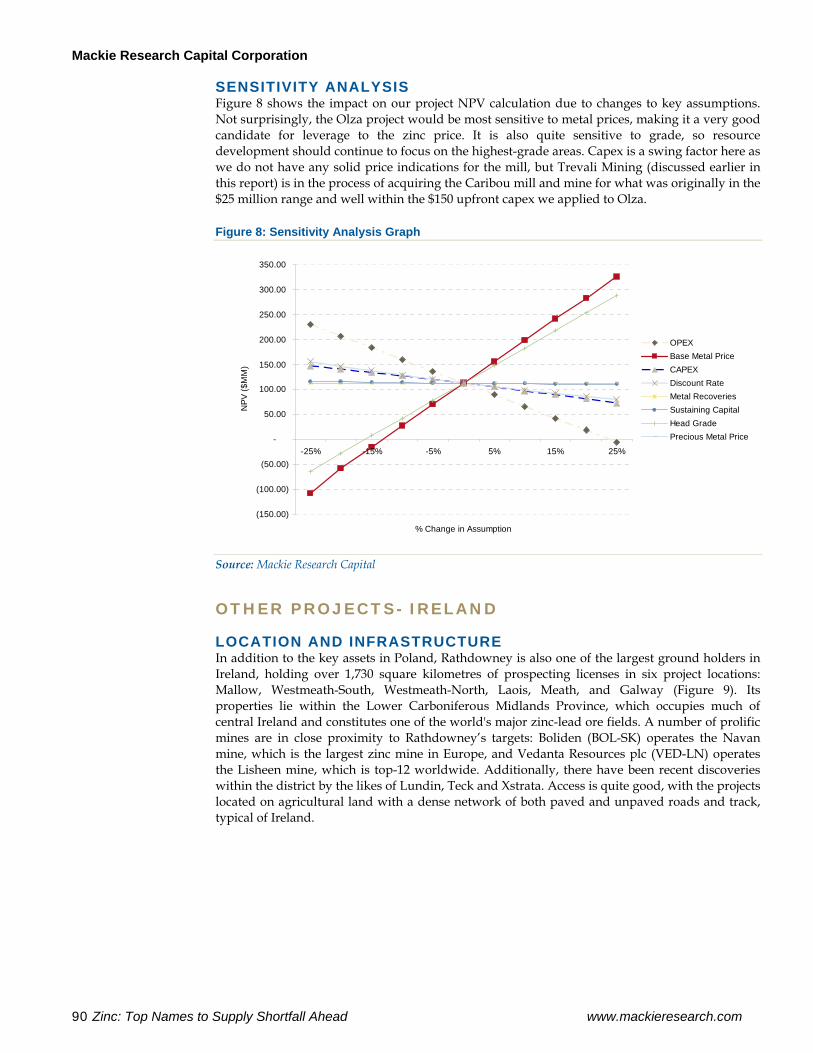
Mackie Research Capital Corporation
90 Zinc: Top Names to Supply Shortfall Ahead www.mackieresearch.com
SENSITIVITY ANALYSIS Figure 8 shows the impact on our project NPV calculation due to changes to key assumptions. Not surprisingly, the Olza project would be most sensitive to metal prices, making it a very good candidate for leverage to the zinc price. It is also quite sensitive to grade, so resource development should continue to focus on the highest-grade areas. Capex is a swing factor here as we do not have any solid price indications for the mill, but Trevali Mining (discussed earlier in this report) is in the process of acquiring the Caribou mill and mine for what was originally in the $25 million range and well within the $150 upfront capex we applied to Olza.
Figure 8: Sensitivity Analysis Graph
(150.00)
(100.00)
(50.00)
-
50.00
100.00
150.00
200.00
250.00
300.00
350.00
-25% -15% -5% 5% 15% 25%
% Change in Assumption
NPV
($M
M)
OPEXBase Metal PriceCAPEXDiscount RateMetal RecoveriesSustaining CapitalHead GradePrecious Metal Price
Source: Mackie Research Capital
OTHER PROJECTS- IRELAND
LOCATION AND INFRASTRUCTURE In addition to the key assets in Poland, Rathdowney is also one of the largest ground holders in Ireland, holding over 1,730 square kilometres of prospecting licenses in six project locations: Mallow, Westmeath-South, Westmeath-North, Laois, Meath, and Galway (Figure 9). Its properties lie within the Lower Carboniferous Midlands Province, which occupies much of central Ireland and constitutes one of the world's major zinc-lead ore fields. A number of prolific mines are in close proximity to Rathdowney’s targets: Boliden (BOL-SK) operates the Navan mine, which is the largest zinc mine in Europe, and Vedanta Resources plc (VED-LN) operates the Lisheen mine, which is top-12 worldwide. Additionally, there have been recent discoveries within the district by the likes of Lundin, Teck and Xstrata. Access is quite good, with the projects located on agricultural land with a dense network of both paved and unpaved roads and track, typical of Ireland.
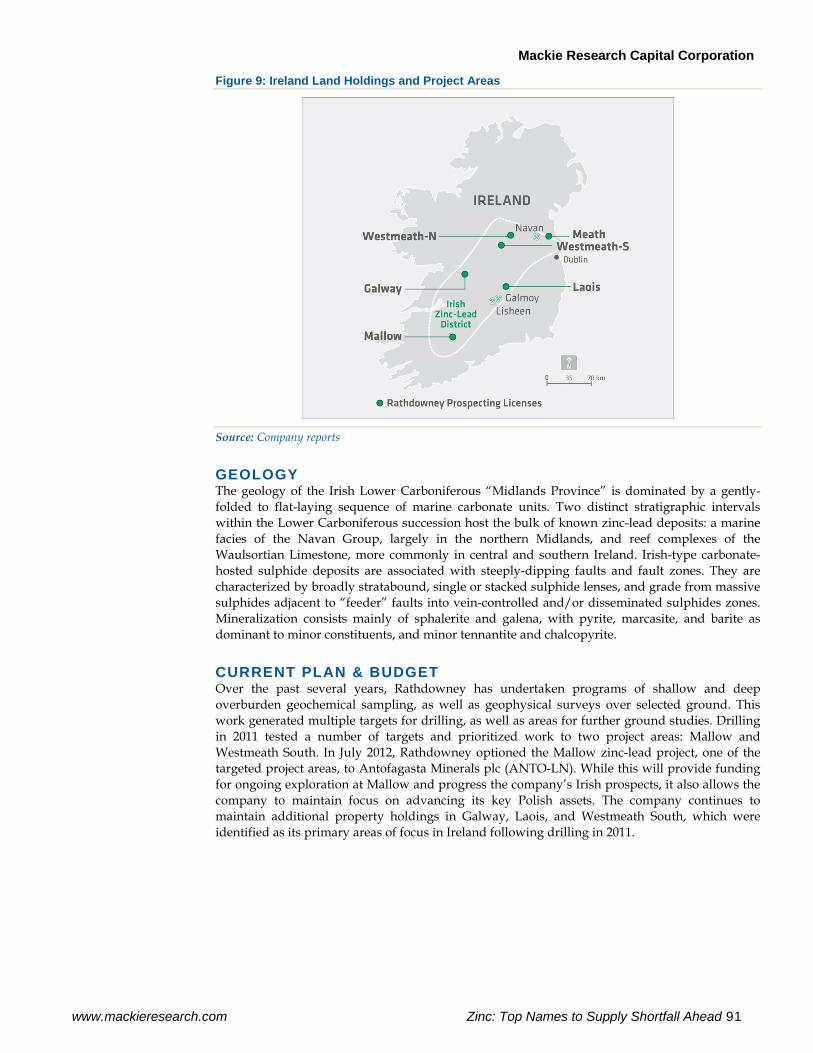
Mackie Research Capital Corporation
www.mackieresearch.com Zinc: Top Names to Supply Shortfall Ahead 91
Figure 9: Ireland Land Holdings and Project Areas
Source: Company reports
GEOLOGY The geology of the Irish Lower Carboniferous “Midlands Province” is dominated by a gently-folded to flat-laying sequence of marine carbonate units. Two distinct stratigraphic intervals within the Lower Carboniferous succession host the bulk of known zinc-lead deposits: a marine facies of the Navan Group, largely in the northern Midlands, and reef complexes of the Waulsortian Limestone, more commonly in central and southern Ireland. Irish-type carbonate-hosted sulphide deposits are associated with steeply-dipping faults and fault zones. They are characterized by broadly stratabound, single or stacked sulphide lenses, and grade from massive sulphides adjacent to “feeder” faults into vein-controlled and/or disseminated sulphides zones. Mineralization consists mainly of sphalerite and galena, with pyrite, marcasite, and barite as dominant to minor constituents, and minor tennantite and chalcopyrite.
CURRENT PLAN & BUDGET Over the past several years, Rathdowney has undertaken programs of shallow and deep overburden geochemical sampling, as well as geophysical surveys over selected ground. This work generated multiple targets for drilling, as well as areas for further ground studies. Drilling in 2011 tested a number of targets and prioritized work to two project areas: Mallow and Westmeath South. In July 2012, Rathdowney optioned the Mallow zinc-lead project, one of the targeted project areas, to Antofagasta Minerals plc (ANTO-LN). While this will provide funding for ongoing exploration at Mallow and progress the company’s Irish prospects, it also allows the company to maintain focus on advancing its key Polish assets. The company continues to maintain additional property holdings in Galway, Laois, and Westmeath South, which were identified as its primary areas of focus in Ireland following drilling in 2011.
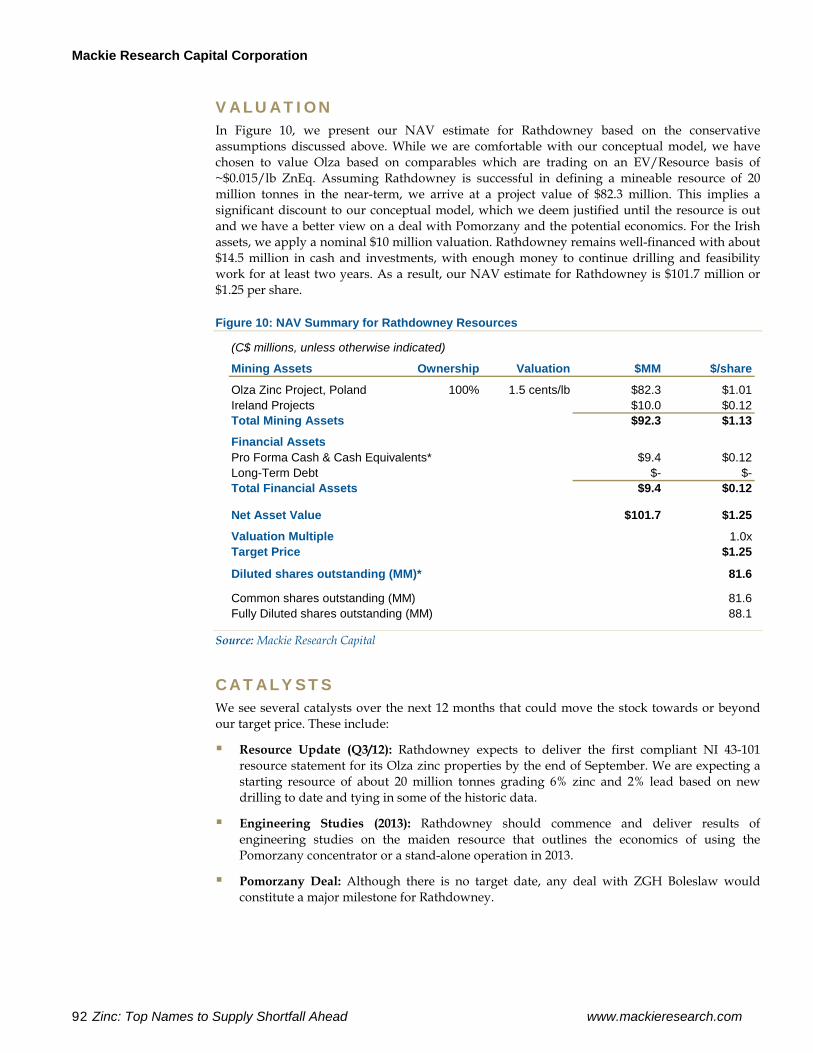
Mackie Research Capital Corporation
92 Zinc: Top Names to Supply Shortfall Ahead www.mackieresearch.com
VALUATION In Figure 10, we present our NAV estimate for Rathdowney based on the conservative assumptions discussed above. While we are comfortable with our conceptual model, we have chosen to value Olza based on comparables which are trading on an EV/Resource basis of ~$0.015/lb ZnEq. Assuming Rathdowney is successful in defining a mineable resource of 20 million tonnes in the near-term, we arrive at a project value of $82.3 million. This implies a significant discount to our conceptual model, which we deem justified until the resource is out and we have a better view on a deal with Pomorzany and the potential economics. For the Irish assets, we apply a nominal $10 million valuation. Rathdowney remains well-financed with about $14.5 million in cash and investments, with enough money to continue drilling and feasibility work for at least two years. As a result, our NAV estimate for Rathdowney is $101.7 million or $1.25 per share.
Figure 10: NAV Summary for Rathdowney Resources
(C$ millions, unless otherwise indicated)
Mining Assets Ownership Valuation $MM $/share
Olza Zinc Project, Poland 100% 1.5 cents/lb $82.3 $1.01Ireland Projects $10.0 $0.12Total Mining Assets $92.3 $1.13
Financial AssetsPro Forma Cash & Cash Equivalents* $9.4 $0.12Long-Term Debt $- $-Total Financial Assets $9.4 $0.12
Net Asset Value $101.7 $1.25
Valuation Multiple 1.0xTarget Price $1.25
Diluted shares outstanding (MM)* 81.6
Common shares outstanding (MM) 81.6Fully Diluted shares outstanding (MM) 88.1
Source: Mackie Research Capital
CATALYSTS We see several catalysts over the next 12 months that could move the stock towards or beyond our target price. These include:
Resource Update (Q3/12): Rathdowney expects to deliver the first compliant NI 43-101 resource statement for its Olza zinc properties by the end of September. We are expecting a starting resource of about 20 million tonnes grading 6% zinc and 2% lead based on new drilling to date and tying in some of the historic data.
Engineering Studies (2013): Rathdowney should commence and deliver results of engineering studies on the maiden resource that outlines the economics of using the Pomorzany concentrator or a stand-alone operation in 2013.
Pomorzany Deal: Although there is no target date, any deal with ZGH Boleslaw would constitute a major milestone for Rathdowney.
Mackie Research Capital Corporation
www.mackieresearch.com Zinc: Top Names to Supply Shortfall Ahead 93
RISKS Rathdowney is subject to the same general risks as outlined in the back of this report, but as it is still largely an exploration company, we would highlight:
Resource Risk: The large historic resources outlined on the Olza properties suggest that Rathdowney will be successful in outlining a NI 43-101 resource in excess of 20 million tonnes. However, grade variation and continuity are the biggest hurdles in bringing the resource up to modern standards. The current drill program is well-designed to accomplish this.
Political Risk: Poland is generally a good country to do business in and with the Olza project located in a current mining jurisdiction, permitting development risk should be low. The World Bank ranks Poland 62nd in the world for ease of doing business compared to Canada and the USA that rank 4th and 13th respectively. However, a key component to the company’s success in our view is the acquisition of or an agreement to use the Pomorzany mill. Since Pomorzany is currently owned by the state, sale to a foreign entity could become politically charged, particularly if connected with job losses or an associated closing of the smelter.
Financing Risk: Rathdowney is currently well financed with about $14.5 million in cash and equivalents, providing more than sufficient cash to carry it through first order engineering studies. Indeed it is among the best-funded junior mining companies, which we credit in part to its association with Hunter Dickinson Inc. group of companies. As such, Rathdowney sits in the enviable position of being cashed up and well-connected to traditional and non-traditional markets for future financing.
CONCLUSION Rathdowney is an advanced explorer/developer focused on bringing its Olza zinc properties in southern Poland to resource status in the short term and production in the medium and longer term. The experienced management team, with the strong financial and technical backing by Hunter Dickinson Inc., is well on its way to achieving the short-term goal of a resource update by the end of 2012. The strategic location in an established zinc-lead district provides easy access and key infrastructure and the opportunity to acquire an operational mill and tailings site that could provide a fast and efficient way to bring new resources at Olza into production with significantly lower capex than going with a greenfields operation. On a comparable basis, we value Rathdowney at $1.25 per share, which is a considerable discount to our back-of-the-envelope conceptual model that relies on: 1) a successful resource update, and 2) a deal with the Pomorzany mill. Still, at current levels, the stock offers good value, trading at 0.35x our comps-based NAV and target. We see additional upside past $1.50 per share as the project moves through feasibility and expands the resource further, and as the company makes a deal for the Pomorzany smelter. We are initiating coverage on Rathdowney Resources Ltd. with a SPECULATIVE BUY recommendation and 12-month target price of C$1.25/share.
Mackie Research Capital Corporation
94 Zinc: Top Names to Supply Shortfall Ahead www.mackieresearch.com
MANAGEMENT, TECHNICAL TEAM & BOARD John P. Barry, President, Chief Executive Officer and Director: Mr. Barry is an economic geologist who holds a Master's degree in Geology from Pennsylvania State University and a Master's degree in Business Administration from the Edinburgh School of Business, Heriot-Watt University, Scotland. He has worked in the exploration and mining industry since 1988 and has consulted to the industry as an associate of the CSA Group in Ireland and Australia and Chlumsky Armbrust & Meyer in Denver on a range of major gold and base metal deposits in Europe, Africa, Australia, and Southeast Asia
Paul S. Mann, Chief Financial Officer: Mr. Mann is a Chartered Accountant, and also holds a B.Sc. in Mechanical Engineering from the University of British Columbia. Mr. Mann has served as Corporate Controller for many of the Hunter Dickinson affiliated companies since 2001 and is currently Executive Vice President, Finance and Reporting for Hunter Dickinson Inc., where he oversees accounting, taxation, regulatory, and public reporting for the group.
Michael Mlynarczyk, Chief Geologist: Michael holds a Ph.D. in economic geology from McGill University, Canada and is a registered P.Geo. and Eur.Geol. with over 14 years of international experience in a variety of geological terrains.
David Furlong, General Manager Projects: David Furlong is a certified geologist with an honours degree in exploration and mining geology, and over 10 years of international experience.
Jeremy James, Senior Geologist: Mr. James holds an honours degree in mining geology and has over 25 years of global exploration experience.
David J. Copeland, Chairman and Director: Mr. Copeland is a professional engineer and mining executive with over 30 years of experience in a variety of capacities in mine exploration, discovery, and development. He has extensive industry experience and is a director of several public companies. As Director of Project Development at HDI, he directs and co-ordinates advanced technical programs of companies for which HDI provides services.
Scott D. Cousens, Director: Mr. Cousens provides management and financial services to a number of publicly traded companies associated with HDI. His focus for the past 20 years has been the development of relationships within the international investment community.
Michael H. Nolan, Director: Mr. Nolan is a CA and has worked in the junior resource sector, in various capacities, for 17 years.
Robert Schafer, Director: Mr. Schafer is a Certified Professional Geologist with advanced degrees in geology and mineral economics who has worked internationally with major and junior mining companies including Kinross Gold, BHP World Minerals, and Billiton. Mr. Schafer is also Executive Vice President, Corporate Development for Hunter Dickinson Inc.
Rene G. Carrier, Director: Mr. Carrier is a past President of Euro-American Capital Corporation, a private company which specializes in restructuring, administration, and raising venture capital funds for junior mining companies.
Barry Coughlan, Director: Mr. Coughlan is a self-employed businessman and financier who has been involved in the financing of publicly traded companies for over 25 years. His principal occupation is President and Director of TBC Ventures Ltd., a private investment company.
Lena Brommeland, Director: Ms. Brommeland has a B.Sc. in geology and more than 20 years of experience in mineral project evaluation and on-site management of large-scale mineral projects, including the Pebble and Niblack projects, both located in Alaska, and the Prosperity project in B.C. Ms. Brommeland is Executive Vice President of Project Services with HDI.
Stephen Hodgson, Director: Mr. Hodgson is a Professional Engineer with over 30 years of experience in mine operations, mine development, and project engineering. Mr. Hodgson has broad knowledge of zinc mines and projects in previously held positions, including six years at

Mackie Research Capital Corporation
www.mackieresearch.com Zinc: Top Names to Supply Shortfall Ahead 95
Pine Point in northern Canada which hosts a Mississippi Valley Type deposit, ranking as one of the largest of its type in the world. Mr. Hodgson is also Executive Vice President of Engineering with HDI.
Mackie Research Capital Corporation
96 Zinc: Top Names to Supply Shortfall Ahead www.mackieresearch.com
MINING INDUSTRY RISKS All mining companies are subject to varying degrees to the following risks:
COMMODITY PRICE RISK Our commodity price assumptions are based on detailed research and viewed to be reasonable based on current information. However, the timing and magnitude of commodity price fluctuations are always a significant risk and can strongly affect the value of mining companies focused on a specific commodity. The primary metal exposure for the names in this report is copper, although the variety of by-product metals and potential to hedge pricing on a portion of some of these metals can limit the risk.
TECHNICAL RISK Resource calculations and beneficiation design comprise the bulk of technical risk associated with all mining projects. Ore reserve and resource risk is a technical risk that is derived from the subjective nature of geological interpretation. The beneficiation process relies on a series of tests that may or may not reflect real-word conditions or perform as expected based on design or scalability.
COST ESCALATION RISK Both capital and operating expenses may be affected by changes in input prices (fuel, steel, chemicals, etc.) for development names as well as relative currency fluctuations for all mining names.
FINANCING RISK Exploration and development companies generally have low or no cash flow and must rely largely on capital markets for financing. However, there can be no guarantee that funding will be available when required. In addition, equity or project dilution may be taken to fund the equity portion of the capital costs if the project is to be developed.
REGULATORY RISK The mining industry is highly regulated, and as such, changes in the scope of environmental practices can have a significant impact on the cost and viability of mining operations.
POLITICAL RISK The magnitude and risk of policy changes with regards to permitting, taxes, royalties, and government interests vary from country to country. Each jurisdiction is discussed separately, but generally, developing countries are seen as being more risky because of the potential for a change in political power to lead to extreme changes in policy. In certain jurisdiction, powerful environmental lobbies can also make mining or exploration difficult.
EXPLORATION RISK In some cases, the market may build in expectations for exploration success before the actual exploration work has taken place or results released. In the event that results do not meet with the market’s expectations, the company’s stock may be negatively affected.
Mackie Research Capital Corporation
www.mackieresearch.com Zinc: Top Names to Supply Shortfall Ahead 97
IMPORTANT DISCLOSURES Company Name Ticker Disclosure
Trevali Mining Corp. TV-TSX N/A
Canadian Zinc Corp. CZN-TSX N/A
Chieftain Metals Inc. CFB-TSX N/A
Foran Mining Corp. FOM-TSXV N/A
Rathdowney Resources Ltd. RTH-TSXV 1
1. In May 2012, Matt O’Keefe visited Rathdowney’s Olza project site in Poland. All travel expenses for the trip were paid by Mackie Research Capital Corporation.
ANALYST CERTIFICATION I, Matt O’Keefe, certify the views expressed in this report were formed by my review of relevant company data and industry investigation, and accurately reflect my opinion about the investment merits of the securities mentioned in the report. I also certify that my compensation is not related to specific recommendations or views expressed in this report.
Mackie Research Capital Corporation publishes research and investment recommendations for the use of its clients. Information regarding our categories of recommendations, quarterly summaries of the percentage of our recommendations which fall into each category and our policies regarding the release of our research reports is available at www.mackieresearch.com or may be requested by contacting the analyst.
Mackie Research Capital Corporation
98 Zinc: Top Names to Supply Shortfall Ahead www.mackieresearch.com
INSTITUTIONAL EQUITY DEPARTMENT RESEARCH
TORONTO Barry Allan .................................................416.860.7612 ..................... Vice Chair, Mining Group & Director Matthew O’Keefe ........................................416.860.8636 ..................................... Managing Director, Mining Brandon Throop, Associate .......................416.860.7618
Ryan Hanley ................................................416.860.8337 ..................................................................... Mining Jaret Anderson, CFA ...................................416.860.6784 ..........................................Agriculture & Fertilizers
Jeremy Dason, Associate ...........................416.860.6325
Matthew Gowing, CFA ...............................416.860.8675 ................................. Strategic Metals & Clean Tech Raveel Afzaal ...............................................416.860.7666 ............................................. Industrial Technology
Chris Buncic, MBA, CFA ............................416.860.7650 ............................................Technical/Quantitative
Caroline Peng ..............................................416.860.7795 .................................................................. Associate
CALGARY Bill Newman, CFA ......................................403.750.1297 ......................................... Oil & Gas - International
Shea O'Callaghan CFA, Associate .......... 403.750.7406 TRADING
TORONTO Mike Morrison ............................. 416.860.7751
Carrie Phillips.............................. 416.860.7665 Terry Sugrue ................................ 416.860.7747
Michael Tintinaglia, MFin, CFA .. 416.860.8681
Asha Khosla ................................. 416.860.7655 Evan Trott .................................... 416.860.7774 MONTREAL Pierre Gendron ............................ 514.399.1522
SALES
TORONTO Kristine Sonnenberg ................... 416.860.7635 Wayne Hansen ............................. 416.860.7750
Drew Basek .................................. 416.860.7753
Keefer Pitfield.............................. 416.860.6849 Danielle McMonagle, Assistant ...... 416.860.8635
................................................. 1.800.661.7426
MONTREAL Elizabeth Johnston ........................514.399.1524