© 2013 shanxiang qi
TRANSCRIPT

© 2013 Shanxiang Qi

TECHNIQUES TO DETECT AND AVERT ADVANCED SOFTWARE CONCURRENCYBUGS
BY
SHANXIANG QI
DISSERTATION
Submitted in partial fulfillment of the requirementsfor the degree of Doctor of Philosophy in Computer Science
in the Graduate College of theUniversity of Illinois at Urbana-Champaign, 2013
Urbana, Illinois
Doctoral Committee:
Professor Josep Torrellas, ChairAssociate Professor Darko MarinovAssociate Professor Sam KingAssistant Professor Shan Lu, University of Wisconsin-Madison

Abstract
Multicore machines have become pervasive and, as a result, parallel programming has received
renewed interest. Unfortunately, writing correct parallel programs is notoriously hard. One chal-
lenging problem is how to ship correct programs. Dynamic analysis tools are very useful to find
errors in parallel programs by automatically analyzing the runtime information. They often capture
errors from well-tested programs.
However, existing dynamic analysis tools suffer from two problems: high false positive rate
and high overhead. High false positive rate means lots of errors reported by the dynamic analysis
tool may be benign or non-existent. For example, lots of data races detected by a race detection
tool could be relatively benign data races. Also, many dynamic software analyses cause orders-of-
magnitude slowdowns, which users cannot tolerate at runtime.
This dissertation contains three parts. The first two parts propose two different schemes to
reduce the false positives and overhead of race detecting tools. These two schemes can detect
and tolerate two different types of harmful races with low overhead: asymmetric data races and
IF-condition data races.
An asymmetric data race occurs when at least one of the racing threads is inside a critical
section. Our proposal to detect and tolerate asymmetric data races is called Pacman. It exploits
cache coherence hardware to temporarily protect the variables that a thread accesses in a critical
section from other threads’s requests.
An IF-condition data race is one where a memory location accessed by a thread (T1) in the
control expression of an IF statement suffers a race while T1 is executing the THEN or ELSE
clauses. T1 may or may not access again the location in the THEN or ELSE clauses. Our second
ii
proposal presents two techniques to handle IF-condition races dynamically. They rely on simple
code transformations and, in one case, on additional hardware help.
The third part proposes a general hardware framework to provide fine-grained memory moni-
toring with low overhead. This mechanism can be used to reduce the overhead of many dynamic
software analyses.
Overall, this dissertation aims at designing novel schemes to reduce the false positive rate and
overhead of dynamic software analyses in order to make parallel programs more robust.
iii

To my loving parents.
iv

Table of Contents
Chapter 1 Introduction . . . . . . . . . . . . . . . . . . . . . . . . . . . . . . . . . . . 11.1 Data Race Detection . . . . . . . . . . . . . . . . . . . . . . . . . . . . . . . . . 11.2 Other Dynamic Analysis . . . . . . . . . . . . . . . . . . . . . . . . . . . . . . . 41.3 Proposed Approaches . . . . . . . . . . . . . . . . . . . . . . . . . . . . . . . . . 4
Chapter 2 Tolerating Asymmetric Data Races with Unintrusive Hardware . . . . . . 62.1 Introduction . . . . . . . . . . . . . . . . . . . . . . . . . . . . . . . . . . . . . . 62.2 Asymmetric Races: Common & Harmful . . . . . . . . . . . . . . . . . . . . . . 8
2.2.1 Our Goal . . . . . . . . . . . . . . . . . . . . . . . . . . . . . . . . . . . 92.3 Pacman: Tolerating Asymmetric Races . . . . . . . . . . . . . . . . . . . . . . . . 10
2.3.1 Overview of the Idea . . . . . . . . . . . . . . . . . . . . . . . . . . . . . 102.3.2 Pacman’s Basic Operation . . . . . . . . . . . . . . . . . . . . . . . . . . 112.3.3 Cache Effects . . . . . . . . . . . . . . . . . . . . . . . . . . . . . . . . . 132.3.4 Multiple Stalls and Deadlock . . . . . . . . . . . . . . . . . . . . . . . . . 17
2.4 Discussion . . . . . . . . . . . . . . . . . . . . . . . . . . . . . . . . . . . . . . . 202.5 Implementation Issues . . . . . . . . . . . . . . . . . . . . . . . . . . . . . . . . 21
2.5.1 Pacman Module . . . . . . . . . . . . . . . . . . . . . . . . . . . . . . . 212.5.2 Virtualization: Thread Pre-emption and Migration during Critical Section
Execution . . . . . . . . . . . . . . . . . . . . . . . . . . . . . . . . . . . 232.5.3 Extensions for Multithreaded Processors . . . . . . . . . . . . . . . . . . . 252.5.4 Extensions for a Distributed SigTable . . . . . . . . . . . . . . . . . . . . 25
2.6 Conclusions . . . . . . . . . . . . . . . . . . . . . . . . . . . . . . . . . . . . . . 26
Chapter 3 Falcon: Dynamically Detecting and Tolerating IF-Condition Data Races . . 273.1 Introduction . . . . . . . . . . . . . . . . . . . . . . . . . . . . . . . . . . . . . . 273.2 Background on Race Detection . . . . . . . . . . . . . . . . . . . . . . . . . . . . 303.3 IF-Condition Races & Their Frequency . . . . . . . . . . . . . . . . . . . . . . . 313.4 SW-IF: Detecting IF-Condition Data Races . . . . . . . . . . . . . . . . . . . . . 33
3.4.1 Main Idea . . . . . . . . . . . . . . . . . . . . . . . . . . . . . . . . . . . 333.4.2 Algorithm . . . . . . . . . . . . . . . . . . . . . . . . . . . . . . . . . . . 343.4.3 Limitations . . . . . . . . . . . . . . . . . . . . . . . . . . . . . . . . . . 37
3.5 HW-IF: Detecting & Preventing IF-Condition Data Races . . . . . . . . . . . . . . 383.5.1 Main Idea . . . . . . . . . . . . . . . . . . . . . . . . . . . . . . . . . . . 383.5.2 Operation of HW-IF . . . . . . . . . . . . . . . . . . . . . . . . . . . . . 39
v

3.5.3 Discussion . . . . . . . . . . . . . . . . . . . . . . . . . . . . . . . . . . 413.5.4 HW-IF Implementation Issues . . . . . . . . . . . . . . . . . . . . . . . . 42
3.6 Potential: Detect Existing IF-Condition Bugs . . . . . . . . . . . . . . . . . . . . 443.7 Conclusions . . . . . . . . . . . . . . . . . . . . . . . . . . . . . . . . . . . . . . 46
Chapter 4 Touchstone: Architecture for Concurrent Multi-level Program Analysis . . 484.1 Introduction . . . . . . . . . . . . . . . . . . . . . . . . . . . . . . . . . . . . . . 484.2 Background . . . . . . . . . . . . . . . . . . . . . . . . . . . . . . . . . . . . . . 50
4.2.1 Bloom Filter . . . . . . . . . . . . . . . . . . . . . . . . . . . . . . . . . 504.2.2 Range Cache . . . . . . . . . . . . . . . . . . . . . . . . . . . . . . . . . 51
4.3 Touchstone Architecture . . . . . . . . . . . . . . . . . . . . . . . . . . . . . . . 514.3.1 Basic Idea . . . . . . . . . . . . . . . . . . . . . . . . . . . . . . . . . . . 514.3.2 ISA Support . . . . . . . . . . . . . . . . . . . . . . . . . . . . . . . . . 524.3.3 Touchstone Structures . . . . . . . . . . . . . . . . . . . . . . . . . . . . 554.3.4 Detailed Operation . . . . . . . . . . . . . . . . . . . . . . . . . . . . . . 584.3.5 Limitations . . . . . . . . . . . . . . . . . . . . . . . . . . . . . . . . . . 63
4.4 Usage Model . . . . . . . . . . . . . . . . . . . . . . . . . . . . . . . . . . . . . 644.4.1 Taint Analysis . . . . . . . . . . . . . . . . . . . . . . . . . . . . . . . . 644.4.2 Asymmetric Data Races . . . . . . . . . . . . . . . . . . . . . . . . . . . 654.4.3 Other Applications . . . . . . . . . . . . . . . . . . . . . . . . . . . . . . 66
4.5 Implementation Issues . . . . . . . . . . . . . . . . . . . . . . . . . . . . . . . . 664.5.1 Unmarking Entries . . . . . . . . . . . . . . . . . . . . . . . . . . . . . . 664.5.2 Virtualization / Context Switch . . . . . . . . . . . . . . . . . . . . . . . . 67
4.6 Related Work . . . . . . . . . . . . . . . . . . . . . . . . . . . . . . . . . . . . . 684.6.1 Memory Protection Schemes . . . . . . . . . . . . . . . . . . . . . . . . . 684.6.2 Concurrency Bug Detection Schemes . . . . . . . . . . . . . . . . . . . . 69
4.7 Conclusion . . . . . . . . . . . . . . . . . . . . . . . . . . . . . . . . . . . . . . 70
Chapter 5 Evaluation . . . . . . . . . . . . . . . . . . . . . . . . . . . . . . . . . . . . 715.1 Pacman . . . . . . . . . . . . . . . . . . . . . . . . . . . . . . . . . . . . . . . . 71
5.1.1 Characterization of the Critical Sections . . . . . . . . . . . . . . . . . . . 735.1.2 Overheads of Pacman . . . . . . . . . . . . . . . . . . . . . . . . . . . . . 745.1.3 Unreported Asymmetric Data Race Bugs . . . . . . . . . . . . . . . . . . 76
5.2 Falcon . . . . . . . . . . . . . . . . . . . . . . . . . . . . . . . . . . . . . . . . . 775.2.1 Experimental Setup . . . . . . . . . . . . . . . . . . . . . . . . . . . . . . 775.2.2 IF Statement Characterization . . . . . . . . . . . . . . . . . . . . . . . . 795.2.3 Performance Overhead . . . . . . . . . . . . . . . . . . . . . . . . . . . . 815.2.4 Detecting New IF-condition Data Race Bugs . . . . . . . . . . . . . . . . 835.2.5 Sensitivity of SW-IF to Delays . . . . . . . . . . . . . . . . . . . . . . . . 85
5.3 Touchstone . . . . . . . . . . . . . . . . . . . . . . . . . . . . . . . . . . . . . . 855.3.1 Evaluation Setup . . . . . . . . . . . . . . . . . . . . . . . . . . . . . . . 855.3.2 Experimental Results . . . . . . . . . . . . . . . . . . . . . . . . . . . . . 875.3.3 False Positives . . . . . . . . . . . . . . . . . . . . . . . . . . . . . . . . 895.3.4 Size of Security Cache and Security Memory . . . . . . . . . . . . . . . . 89
vi

Chapter 6 Conclusion . . . . . . . . . . . . . . . . . . . . . . . . . . . . . . . . . . . . 93
References . . . . . . . . . . . . . . . . . . . . . . . . . . . . . . . . . . . . . . . . . . . 94
vii

Chapter 1
Introduction
Multi-processor systems, which at one point were limited to the domain of large data centers and
supercomputing centers, are now pervasive. With the advent of chip multi-processors (CMPs),
now they are everywhere from cell phones to embedded systems. This change has been as abrupt
as it is wide-spread and programmers are still struggling to adjust to the new reality of having to
learn parallel programming in order to take advantage of the increased performance. However,
unlike sequential programming, parallel programming has its own unique set of problems, also
known as concurrency bugs [27]. Concurrency bugs can cause a whole host of problems including
crashes, the generation of incorrect results, and security vulnerabilities. Hence, in recent years,
lots of specialized hardware schemes have been proposed to help programmers detect and avoid
concurrency bugs [33, 34, 44, 46, 78].
Dynamic analysis tools can be used to detect software errors by monitoring the runtime state
of a program and observing the situations that may only arise during actual execution [18].
1.1 Data Race Detection
Data race is one of the most common types among various types of concurrency bugs. A data race
happens when two threads access the same variable without any intervening synchronization and
at least one of the accesses is a write. Figure 1.1 shows an example of data race. Here, two threads
update the same shared variable count without any synchronization operations. And therefore, an
incorrect situation could happen: T2 first reads count to num, increments it by 1. But before T2
stores the result back to count, thread T1 reads the original value of count and updates count. As
1

a result, the value of count is only increased by 1, not by 2. This is a Data Race which causes a
concurrency bug.
Thread 1 Thread 2
num= count
num = count num++
num++
count = num
count = num
Figure 1.1: An example of a data race.
Data race debugging can be very hard and, therefore, the topic has received much attention(e.g.,
[9, 24, 31, 36, 38, 39, 41, 44, 45, 52, 55, 60, 68, 74, 78]). At the same time, industry also develops
several commercial software tools for race detection (e.g., [24, 60]). Thanks to this, the state of
the art in data race debugging has made giant strides in the last decade. However, most race tools
lack specificity for the important data races. According to previous works [36, 16], some data
races are more harmful than others. It is important to focus first on the most harmful data races —
those that can cause the program to crash or to generate incorrect results.
In order to better understand the characteristics of harmful races, we do a comprehensive study
of bugs that have been reported for well-known codes and fixed by developers. According to our
study, asymmetric data races and If-condition races are two of the main types of harmful data
races.
T1 T2Lockif (point != NULL){ point−>x = X1; point−>y = X2;}Unlock
point = NULL;
Figure 1.2: Example of an asymmetric data race.
Figure 1.2 shows an example of an asymmetric data race. In this example, the programmer tries
2

to use Lock and Unlock to make the critical section atomic. But unfortunately, the programmer
forgets to put T2’s access in the critical section. As a result, the program will crash due to the
NULL-point access in T1. As shown in the example, an asymmetric data race happens when at
least one of the racing threads is inside a critical section.
The high frequency of asymmetric data races is confirmed by Microsoft researchers in [?] ,
who claim that they frequently encounter them in software development. They provide two intu-
itive sources of asymmetric data races. One source is code developed by good software developers
that has to share memory state with less-tested code developed outside of the house e.g., various
device drivers. A second source is legacy. Specifically, a library may have been written assuming
a single-threaded environment, but later the requirements change to multithreading. This requires
that all the threads acquire a lock before accessing shared state. Unfortunately, some corner cases
are missed.
if (var1) {
to var1access
(optional)
}
var1 =if (var1){
var2=
}
var1 =
var2 =
(a) (b)
T1 T2 T1 T2
Figure 1.3: An example of IF-condition data race
An example of IF-condition data race is shown in Figure 1.3. An IF-condition data race is one
where a memory location accessed by a thread (T1) in the control expression of an IF statement
suffers a race while T1 is executing the THEN or ELSE clauses. T1 may or may not access again
the location in the THEN or ELSE clauses. It is easy to see that an IF-condition data race is not
intentionally inserted by the programmer, since the data race could break the assumption which
the programmer made.
3

1.2 Other Dynamic Analysis
Besides race detection analysis, different dynamic analyses are designed for memory leak, buffer
overflow, etc. For example, dynamic dataflow analyses mark shadow values with the memory
addresses, propagate them with the execution of the program, and check their status. Lots of
widely used tools such as Valgrind’s Memcheck tool use dataflow analyses to do the memory
check and dynamic heap bounds check.
One common problem for these dynamic analyses especially for the software analyses is per-
formance overhead. For instance, Valgrind’s Memcheck tool has 20X overhead and the overhead
for taint analysis could be up to 150X.
The high overheads of these dynamic analyses make the tools hard to use by programmers in
practice. It would be useful to design a scheme to accelerate these dynamic software analyses.
1.3 Proposed Approaches
We propose two approaches to detect and prevent asymmetric data races and IF-condition data
races. Besides, we also propose a approach to design a hardware framework which can accelerate
multiple dynamic software analyses.
Pacman [46] is proposed to detect and prevent asymmetric data races with minor hardware
support. It exploits cache coherence hardware to temporarily protect the variables that a thread
accesses in a critical section from other threads’ requests. To reduce the hardware cost, it uses
hardware address signatures [8]. Unlike the previous, software-based schemes, Pacman induces
negligible slowdown, needs no compiler or (in the baseline design) OS support, and requires no
application source code changes.
Our second proposal, Falcon is a combination of two schemes: SW-IF and HW-IF. SW-IF is
a purely software approach to detect the IF-Condition races. HW-IF is trying to not only detect
but also prevent the IF-Condition races. It uses additional hardware to achieve low performance
overhead.
4

The third proposal, TouchStone, is a new hardware framework to speed up multiple dynamic
software analyses. Unlike previous approaches, our scheme uses a novel hardware - pooled bloom
filters to provide fast fine-grained memory protection which is used by several dynamic analyses.
In general, our goals are to improve correctness and make parallel programming easier.
5

Chapter 2
Tolerating Asymmetric Data Races withUnintrusive Hardware
2.1 Introduction
Data races are arguably the most common type of concurrency bug. They occur when two threads
access the same variable without any intervening synchronization and at least one of the accesses
is a write. Debugging data races can be notoriously hard and, as a result, there is much research
in this area (e.g., [14, 35, 36, 55]). In practice, it is easy to get bogged down uncovering the large
majority of the races that are relatively harmless [15, 36] (so-called benign races) at the expense
of the harmful ones that cause program crashes, machine hangs, or incorrect program results.
One class of data race that is both common and likely harmful is the Asymmetric data race.
It occurs when at least one of the racing threads is inside a synchronization-protected critical
section [50]. In this case, while a thread (call it safe) is accessing shared variables inside a critical
section, a second thread (call it unsafe) races in, corrupting the state or reading inconsistent state.
For example, Figure 2.1 shows a case where thread T1 is the safe thread. These races are common
in bug reports, and can often appear in well-tested codes that interact with third-party or legacy
routines [50]. They are likely harmful because the data being corrupted is critical data already
protected by synchronization. Interestingly, these races have received little attention [49, 50].
T1 T2Lockif (point != NULL){ point−>x = X1; point−>y = X2;}Unlock
point = NULL;
Figure 2.1: Example of an asymmetric data race.
6

Application Source Description Outcome
Apache1.1 Beta Bug number 1507 AppenderAttachableImpl object should be Exceptionprotected by synchronization in AsyncAppender.getAllAppenders
MySQL6.0 Bug number 48930 lock state is updated by two different threads holding different mutexes System hangsMozilla-JS Bug number 622691 The write to cx→runtime→defaultCompartmentIsLocked Incorrect result
is not consistently protected by the lockMozilla-XPConnect Bug number 557586 One thread sets gLock to null before another thread drops the lock Segmentation faultMozilla-Video/Audio Bug number 639721 mInfo is written by nsBuiltinDecoderReader without Incorrect result
its lock while mInfo is read from HaveNextFrameData with a lockPbzip2-0.9.4 Paper [71, 76] main() frees fifo→mut without protection Segmentation faultWindows Kernel Case study 2 in slides of [15] Two threads access the same structure with different mutexes Incorrect resultWindows Kernel Case study 3 in slides of [15] parentFdoExt→idleState is not protected by a lock Incorrect resultWindows Kernel Real data race example in [15] gReferenceCount is updated without protection Incorrect resultTrie benchmark An example in [49] The prefix match function reads the leaf field of the root object Incorrect result
without acquiring a lock on the trie
Table 2.1: Real examples of harmful asymmetric data races.
The conventional approach to cope with data races is to detect and remove them through ex-
tensive in-house testing. A complementary approach is to tolerate the remaining races during
production runs. This approach includes techniques that prevent the race from manifesting or that
modify the interleaving in a way that minimizes the chances of it (e.g., [47, 66, 73]). This approach
is attractive because, even after extensive in-house testing, races have been shown to remain in the
code after deployment. Moreover, even for harmful bugs, it takes a long time between the detection
of the bug in the field and the release of a fix by the manufacturer [71]. In the meantime, tolerating
the race would be beneficial.
Asymmetric data races are good candidates for race-tolerance. Indeed, the structure of the race
already suggests a way to minimize the potential harm of the race: prevent the unsafe thread from
corrupting the state or reading inconsistent state while the safe one is in the critical section. This
technique is attractive because, unlike many race-tolerance techniques, it requires no correct-run
training. Moreover, for those asymmetric races caused by third party or legacy code interfering
with well-tested code, race-tolerance may be the only option, as the unsafe thread code may be
unavailable.
There are only two proposals that specifically target asymmetric data races: ToleRace [50] and
ISOLATOR [49]. They both use race tolerance and are software-based. When the safe thread
enters a critical section, the software makes a copy of the data in the critical section and redirects
the safe thread’s accesses to the copy. In addition, it may also protect the accesses to the page
that contains the original data. Unfortunately, these approaches slow down execution and require
7

significant compiler, operating system (OS), or application changes.
To address these issues, this chapter proposes the first scheme to tolerate asymmetric data
races in production runs with negligible execution overhead. The scheme, called Pacman, exploits
cache coherence hardware to temporarily protect the variables that a thread accesses in a critical
section from other threads’ requests. Unlike prior schemes for asymmetric races, Pacman induces
negligible slowdown, needs no support from the compiler or (in the baseline design) from the OS,
and requires no application source code changes — although small changes are needed in some
libraries. Pacman’s hardware is largely unintrusive, since it is concentrated in a module in the
global network, rather than in the cores. Finally, Pacman embodies a primitive that can be applied
to other software development and debugging uses.
We evaluate Pacman for the SPLASH-2, PARSEC, Sphinx3, and Apache codes. We show that
it has negligible execution overhead. Moreover, we uncover two unreported asymmetric races.
2.2 Asymmetric Races: Common & Harmful
The focus of this chapter is a common and likely harmful type of data race called Asymmetric.
This is a data race where at least one of the racing threads is inside a synchronization-protected
critical section [49, 50]. In addition, we are interested in efficiently tolerating them in production
runs.
Harmful asymmetric data races are common in the real world. To assess their frequency, we
examined over 50 harmful data race bugs from bug libraries of open source software and from
Microsoft reports. We define harmful as being a bug that the user wants fixed — as opposed to the
many data races explicitly created by the programmer for performance. Of the over 50 harmful
races, we found 10 that are asymmetric. They are shown and described in Table 2.1.
The high frequency of asymmetric data races is confirmed by Microsoft researchers in [49, 50],
who claim that they frequently encounter them in software development. They provide two intu-
itive sources of asymmetric data races. One source is code developed by good software developers
8

that has to share memory state with less-tested code developed outside of the house — e.g., various
device drivers. A second source is legacy. Specifically, a library may have been written assuming
a single-threaded environment, but later the requirements change to multithreading. This requires
that all the threads acquire a lock before accessing shared state. Unfortunately, some corner cases
are missed.
Asymmetric data races are likely harmful. Indeed, all of the ones shown in Table 2.1 that
come from bug libraries have been confirmed as bugs in the libraries, and fixed in future releases
of the software. In addition, the fact that the programmer protected one thread’s accesses to the
racy variables in a critical section suggests that these are important variables. The atomicity of the
critical section accesses, as intended by the programmer, is broken through accesses from other
threads; this is likely to be harmful.
2.2.1 Our Goal
Our goal is to tolerate asymmetric data races in production runs without needing training tests.
This approach is complementary to conventional in-house data-race debugging. It is motivated by
four facts. First, even after extensive testing, date race bugs appear in released code. Second, it
often takes years between the time when a bug is detected in the field and when a fix is available
from the vendor [71]. Third, for the fraction of asymmetric races caused by third party or (per-
haps) legacy code, fixing the bug may not be a feasible option because the source code may be
unavailable. Finally, the structure of these races already suggests a way to minimize their potential
harm: prevent the unsafe thread from corrupting the state or reading inconsistent state while the
safe one is in the critical section.
9

2.3 Pacman: Tolerating Asymmetric Races
2.3.1 Overview of the Idea
We want to prevent unsafe threads from corrupting the state or reading inconsistent state while the
safe thread is in the critical section. We must ensure that an access A from an unsafe thread that
conflicts with an access inside the critical section is ordered in the same way with respect to all of
the accesses in the critical section. As shown in Figure 2.2(a), the first write by T2 can proceed,
but the second one has to be prevented until after the unlock. Similarly, the first read by T2 in
Figure 2.2(b) can proceed, but the second one has to wait until after the unlock.
T1
Lock
Unlock (b)
a=
T2
= a;
a= = a;
T1
Lock
= a;
= a;Unlock
a=
T2
a=
(a)
OK
NOT OK OK
NOTOK
Figure 2.2: General approach to handle asymmetric data races.
Network
Processor+CacheProcessor+Cache
ControllerMembership
Hash encode
Accumulate
PID
Lock_acquire?
Multicore
Signature=Hash(Lock_address);
if (No entry for thread){
NestingLevel=1;}else NestingLevel++;
ActionEvent
Successful lockacquire
Load/store byowner thread
Signature += Hash(address);
Load/store byother thread
if (address Signature) ∈
NestingLevel−−;Lock release if (NestingLevel == 0)
Deallocate entry;
Allocate entry;PID = processor ID;
Nack address;
(a) (b)
Stall_indexNestingLevelSignature
SigTable
Figure 2.3: SigTable organization (a) and operation (b).
The idea behind Pacman is to leverage the hardware cache coherence protocol in a multiproces-
10

sor to temporarily protect the variables that a thread is accessing in a critical section. The hardware
performs two concurrent actions. One is to record the addresses of (a subset of) the variables that
the safe thread is accessing while executing a critical section. In fact, to a large extent, we only
need those addresses that can be observed by the cache coherence protocol, as we will see. The
second action is to reject any requests from the unsafe threads that conflict with these variables,
until the safe thread leaves the critical section.
For efficiency, Pacman does not record the addresses in a table. Instead, it uses a Bloom
filter [5] to encode them into a hardware address signature. Moreover, to make the hardware as
unintrusive as possible, the signature is stored in a module called SigTable that is connected to the
on-chip network and sees all coherence transactions. Physically, the SigTable is associated with
the bus controller in a bus-based multiprocessor, or is distributed across the different directory
modules in a directory-based multiprocessor. Since multiple processors may be executing critical
sections concurrently, the SigTable stores as many signatures as critical sections are in progress.
The application code is unmodified. However, Pacman assumes that the critical section entry
and exit points of safe threads are marked in the code with synchronization macros or libraries.
Inside these macros or libraries, Pacman makes sure that there is a network access, implemented
as part of the synchronization operation as we will see. As a result, the SigTable always knows
when a processor enters and exits a monitored critical section.
In this section, we describe Pacman’s basic operation and the two key aspects that affect the
ability to tolerate data races: caches and stalls.
2.3.2 Pacman’s Basic Operation
The SigTable is a hardware table that stores the addresses accessed by each in-progress critical sec-
tion, and prevents accesses by other processors to these addresses. In this discussion, we describe a
centralized SigTable, as it would be used in a bus-based system; later, in Section 2.5.4, we outline
a distributed one to be used in a directory-based system. Figure 2.3(a) shows the SigTable, which
has one entry (a row) for each in-progress critical section. In each entry, the two main fields are
11

PID and Signature. PID is the ID of the processor currently executing the critical section that owns
the entry. In Section 2.5, we virtualize the SigTable. The Signature field contains (in an encoded
form) the addresses of the lines accessed by the thread in the critical section so far and observed
by the SigTable. A controller at the SigTable input takes the addresses of protocol transactions,
hash-encodes them with a hardware Bloom filter [5], and may accumulate them into signatures
and/or check them for membership in signatures [8].
The SigTable operates as follows. When a lock acquire successfully grabs a lock, the SigTable
allocates a new entry for the critical section, sets PID to the requesting processor ID and, after
clearing Signature, it inserts the hashed physical address of the lock in it. After this, at every load
and store issued by the thread that is not intercepted by the cache, the SigTable hash-encodes the
address of the line accessed and accumulates it in Signature. During this time, network accesses
by other threads are hashed and checked for membership in Signature. If there is a match, the
request is Nacked (negative-acknowledged) to the requester, which will retry. Finally, when the
thread releases the lock, the SigTable deallocates the entry.
Pacman flattens nested critical sections, accumulating all the addresses accessed in the nest in
the Signature. To support this feature, SigTable entries have a NestingLevel field. On a successful
lock acquire, if the processor does not own a SigTable entry yet, the SigTable proceeds as above
and sets NestingLevel to 1; otherwise it increments NestingLevel. On a lock release, the SigTable
decrements NestingLevel and, if it is zero, deallocates the entry. Figure 2.3(b) lists the overall
SigTable operation.
With this approach, Pacman isolates the critical section from unsafe threads. Note that Pacman
needs no compiler support, no OS support, and no source code changes. Moreover, it has negligible
execution overhead for the safe thread.
Nacks are often used in cache coherence protocols, to avoid having to buffer messages that
cannot be processed immediately [20]. While they can cause traffic hot spots in pathological
cases, the probability of an asymmetric race is low enough that there is no need to provide any
contention management mechanism.
12

Finally, while Pacman has a transactional memory (TM) [21] flavor, it needs none of TM’s key
mechanisms such as speculation, rollback, timestamp support or contention management.
2.3.3 Cache Effects
Since the SigTable is placed in the network, it does not see the accesses intercepted by the caches.
To capture the required information to guarantee the atomicity of the critical sections, it relies only
on the transactions induced by the cache coherence protocol — plus some small extensions that
we will explain. We now show why this is the case. In the following discussion, we assume a basic
MESI cache coherence protocol. Other protocols may require slightly different considerations.
Figure 2.4 shows two simple patterns. In Figure 2.4(a), thread T1 writes to line x and misses
in the cache. SigTable records the address. Any subsequent read or write to x by T2 requires a
coherence transaction, which is observed and Nacked by the SigTable. In Figure 2.4(b), T1 reads
x and misses in the cache. SigTable records the address. If T2 reads x, there may or may not be a
coherence transaction. If there is, the access will be Nacked; otherwise, it will not. Either situation
is fine because two reads do not conflict. However, if T2 writes x, there is a coherence transaction
that will be Nacked by the SigTable.
wr x Missrd x Miss
T1
(a)
Acquire
Release
rd x / wr x
rd x / wr x
T2
Nack
Done
T1 T2
Acquire
(b)
Release
rd x
wr x Nack
wr x Done
Figure 2.4: Examples to help understand Pacman’s operation.
The more involved cases involve three issues: cache state before entering the critical section,
cache displacements during the critical section, and synchronization operations. We consider each
in turn.
13

Cache State Prior to Entering the Critical Section
Before the safe thread enters the critical section, some of the lines in its cache may be in a state
that enables the processor to access them silently during the critical section. There are two cases:
when x was Dirty (or Exclusive) in T1’s cache in Figures 2.4(a) and (b), and when x was Shared in
T1’s cache in Figure 2.4(b). In these cases, SigTable will not observe T1’s access to x.
None of the two cases prevents SigTable from ensuring the atomicity of the critical section.
Consider the case when x was Dirty (or Exclusive) in T1. When T2 attempts to access the line
and misses, the coherence protocol forces T1 to write back the line. When the SigTable sees that a
processor with a SigTable entry writes back a line, it assumes that the processor had accessed the
line. Consequently, while allowing the line to be written to memory, it inserts the line’s address
in the entry’s Signature and Nacks the requesting (unsafe) processor — hence ensuring critical
section atomicity. No functional change to the caches or coherence protocol is needed. If T1 had
not accessed the data in the critical section, Pacman acts conservatively but not incorrectly.
Consider now the case when x is Shared in T1. When T2 attempts to write the line, the hard-
ware issues a coherence transaction that invalidates T1’s copy. For this case, Pacman requires a
simple hardware extension. Specifically, it requires that T1’s cache informs, in its response to the
invalidation, that indeed, it has invalidated a line. When the SigTable sees that a processor with a
SigTable entry has invalidated a line, it assumes that the processor had accessed the line. Conse-
quently, it inserts the line’s address in the Signature for the entry and Nacks the requesting (unsafe)
processor. Again, if T1 had not read the line in the critical section, Pacman acts conservatively but
correctly.1
Supporting this change is simple. In a directory-based protocol, when a cache invalidates a
line, it must set a bit in the invalidation acknowledgment returned to the directory. In a snoopy-
based protocol, the cache must set a bit in the bus that is visible to the SigTable. This hardware
change and all the other processor/cache modifications required by Pacman will be summarized in
1In all of these cases, a Nacked write has already invalidated the line from all the caches. This can hurt performanceslightly if caches have to re-access the data. However, this occurs only once.
14

Section 2.3.3.
Cache Displacements During the Critical Section
Consider the case when, as a processor executes a critical section, its cache displaces a line that
was in the cache before the processor entered the critical section. Such line is not in the Signature,
but must be conservatively put there as the processor may have accessed it silently during the
critical section.
There are two cases, namely that the displaced line is Dirty or not. If it is, the case is easy: as
the line is automatically written back to memory, the SigTable sees that the source processor owns
an existing SigTable entry and inserts the address in the Signature.
If the line is not Dirty, the coherence protocol would not trigger a line writeback. Therefore,
we propose to modify the cache controller to send a notification to the network when the cache
displaces a clean line inside a (monitored) critical section. The notification carries the address of
the line. When the SigTable sees such a notification from a processor that owns a SigTable entry,
it conservatively accumulates the address in the Signature. The extra traffic created is small, since
critical sections are typically short. Overall, this extension is like the Replacement Hint transaction
sometimes used in directory protocols [11], except that it only needs to occur while the processor
is inside a critical section.
This is the most significant hardware modification required by Pacman, as summarized in Sec-
tion 2.3.3. However, it can be implemented easily. Specifically, the controller for the last level of
private cache has a counter register called Mode. When Mode is not zero, the cache is in Notifi-
cation mode, and it sends a notification message at every displacement of a non-Dirty line. Every
successful lock acquire operation for a monitored critical section increments the Mode register,
while every release for it decrements it. This ensures that, in nested critical sections, the cache re-
mains in Notification mode throughout the outermost critical section. Increments and decrements
can be supported with a write to a register in the cache controller. Such writes can be performed
inside acquire and release macros or libraries, such as those of M4 [29] or OpenMP [12].
15

Synchronization Operations
The SigTable must see all of the successful acquires and all of the releases. This is because they
may allocate/deallocate a SigTable entry and update the Signature and NestingLevel fields. The
coherence protocol ensures that the SigTable sees these synchronization operations except in the
cases when they hit a cache line in state Dirty or Exclusive. So, we must ensure that, in these cases,
a notification access is also issued to the network that the SigTable sees.
To accomplish it, we propose to augment the implementation of the acquire and release instruc-
tions. If a successful acquire or a release operation proceeds without needing a network access,
the hardware issues a notification message to the network. An alternative design would involve
not changing the acquire or release instructions and adding an explicit uncached write inside the
synchronization macros or libraries. While this design is simpler, it would add more overhead to
the synchronization operation. Still, overheads may be tolerable, especially if one is willing to
identify the potentially problematic critical sections and only monitor those.
Unsuccessful acquires do not need to be observed by the SigTable.
Pacman is compatible with modern processors that speculatively read past an acquire before
the acquire completes. The SigTable may be unallocated and, therefore, unable to capture the
loaded address. The effect is the same as if the load had hit in the cache (Section 2.3.3).
Summary of Cache Hierarchy Modifications
Table 2.2 summarizes the functional modifications that Pacman requires in the cache hierarchy and
coherence protocol. We believe that these modifications are modest. All of the other modifications
are unintrusive because they are part of the SigTable module.
When a cache invalidates a clean line, it sets a bit that is visibleto SigTable.In Notification mode, the last-level private cache sends a notificationmessage when it displaces a clean line.A successful acquire or a release that are fully intercepted by the cacheissue a notification message to the network.
Table 2.2: Pacman functional modifications in the cache hierarchy and coherence protocol.
16

2.3.4 Multiple Stalls and Deadlock
Pacman temporarily stalls unsafe threads by Nacking their conflicting requests. We now consider
the case when multiple threads are Nacked and show how deadlock can occur and is handled.
Multiple Thread Stalls
It is possible that two (or more) threads send Nacks to each other and end up all stalling. This
situation can occur due to three reasons: some race bugs where all of the threads synchronize,
false sharing and false positives. Figure 2.5 shows two examples of the first case. In Figure 2.5(a),
two threads T0 and T1 acquire two different locks L0 and L1, respectively. Inside the critical
sections, both threads access the same two variables g0 and g1 in different order. The timing is
so unfortunate that each thread accesses one variable and then receives a Nack on attempting to
access the second variable. We have formed a cross-thread stall cycle and no thread can make
progress.
(a)
T0 T1
Acquire L0 Acquire L1
g0= g1=
g0=g1=
Nacked
Acquire L0 Acquire L1
T1T0
g0=
(b)
Acquire L1g0=
Nacked
Figure 2.5: Examples of data race bugs where all the threads synchronize and lead to deadlock.
In Figure 2.5(b), the two threads T0 and T1 acquire two different locks L0 and L1, respectively,
and then access the same variable g0. T0 succeeds and T1 gets Nacked. Then, the thread that
succeeds (T0) attempts to acquire the lock of the other, stalled thread (T1). We have a cross-thread
stall cycle as before, except that one of the two dependences in the cycle is for a lock variable.
The second source of cross-thread cycles leading to deadlock is pathological cases of false
sharing of lines. For example, it occurs in a pattern similar to Figure 2.5(b) except that T1, rather
than accessing variable g0, accesses a variable that shares a line with g0. Recall that the SigTable
17

is in the network and can only see line addresses.
The third source of cross-thread cycles leading to deadlock is pathological cases of false-
positive dependences between threads, due aliasing in the signatures or due to the cache state
prior to entering the critical section (Sections 2.3.3 and 2.3.3). However, since critical sections
tend to be small, false positives are typically not very significant.
Making Forward Progress in Pacman
Pacman uses hardware to detect a deadlock cycle as soon as the memory access that closes the cy-
cle occurs. This approach is much faster than the software-based timeout approach of ISOLATOR.
Moreover, at that point, Pacman’s hardware breaks the cycle by allowing one the stalled threads to
perform one memory access. Such access enables forward progress.
To support the algorithm, we add two fields to each row of the SigTable (Figure 2.3(a)). First,
Stall index tells if the thread that owns the entry is being Nacked. Specifically, Stall index stores
the index of the SigTable entry that sends Nacks to the owner thread. If the owner thread is not
being Nacked, this field is null. Second, when Stall index is not null, the Lock acquire? bit is set
if the owner thread is being Nacked while trying to acquire a lock. This bit will detect the case of
Thread T0 in Figure 2.5(b).
When an access by processor Pi is Nacked by entry j of the SigTable, the SigTable hardware
checks if Pi also has an entry in the SigTable. If so, it sets that entry’s Stall index to j and,
if appropriate, sets the Lock acquire? bit. Then, the SigTable hardware follows the Stall index
pointer by checking entry j in the SigTable and reading its own Stall index. If, by following the
Stall index pointers in this way, the hardware ends up in entry i, it has detected a cycle. At that
point, the hardware needs to decide which thread among those in the cycle is allowed to perform
one access without being Nacked. A simple approach is to pick one of the threads that holds
locks requested by other threads (such as T1 in Figure 2.5(b)). Such threads are detected from the
Lock acquire? bit of other entries, and they need to make progress to break the cycle. If there is
no such thread, the hardware picks one thread at random. The next time that the SigTable sees a
18

request from the picked thread, it does not Nack it.
Breaking the Atomicity of Critical Sections
With the algorithm described, Pacman immediately finds and breaks any deadlock — unless it was
already present in the original application. However, by letting one stalled thread complete one
access, it can conceivably break the atomicity of a critical section. To understand the problem, we
consider each of the three sources of deadlock listed in Section 2.3.4.
In the first case (some race bugs where all of the threads synchronize), Pacman can potentially
break the atomicity of one of the critical sections. While Pacman could be designed to break
only the atomicity of unsafe threads, such an approach would not work for all the race bugs. An
example is when T1 in Figure 2.5(b) is the unsafe thread. Overall, given the very low probability
of breaking atomicity in this way, we do not attempt to avoid it.
In the third case (false positives), letting one thread proceed does not break the atomicity of
any critical section.
In the second case (false sharing), atomicity can potentially be broken unless special care is
taken. To see why, consider Figure 2.6, which is slightly modified over Figure 2.5(a). In this
example, variables g0 and g0’ share the same cache line, while g1 and g1’ share another line.
Because of false sharing, threads T0 and T1 deadlock. By breaking the deadlock through letting
T1 read g0’, Pacman is allowing the line to go to T1’s cache. Right after the critical section, T1
could attempt to silently access g0 from its cache, which could break T0’s atomicity.
T0 T1
Acquire L0 Acquire L1
g0=
g1=
g1’=
=g0’
Nacked Release L1
=g0
Figure 2.6: Atomicity could be broken due to false sharing.
To prevent this case from occurring, we could augment Pacman so that, when the SigTable lets
19

one access break a deadlock, it marks it as non-cacheable. The requesting processor would be
allowed to use (read or write) the word, but its cache would not be allowed to keep the line. As
a result, accesses to other words would miss in the cache. This extension would avoid breaking
atomicity when false sharing occurs between words. However, a more elaborate solution would be
needed when false sharing occurs between bytes of the same word. Given the very low probability
of breaking atomicity due to false sharing, Pacman does not include this support.
2.4 Discussion
Pacman’s unique goal makes it very different from hardware-based race detectors [31, 34, 44, 45,
78]. In these schemes, the goal is to characterize and debug races. Moreover, false positives are
highly undesirable. Hence, these schemes tend to use more expensive hardware, such as per-word
access information, epoch IDs in coherence messages, and even rollback. Pacman’s goal is to
tolerate asymmetric races in production runs. Since we are not debugging, it is fine to have some
false positives (e.g., due to aliasing in signatures) if they are handled fast. A false positive in
Pacman simply slows down a thread a little bit. The result is cheaper, less intrusive hardware.
Still, Pacman could be used as a detection tool for asymmetric races. Indeed, the number of false
positives we found is very low (as we show in the evaluation) and the number of false negatives is
likely negligible.
Pacman provides a powerful primitive: dynamically and selectively prevent accesses to a set of
addresses by certain processors. It can be used in security and performance/correctness debugging.
For example, it can enforce atomic regions and detect atomicity violations, or provide watchpoint
capability.
Pacman is fastest when critical sections are small, which is the norm in many codes. However,
we believe that it is also very useful for beginner programmers, who tend to write long critical
sections. The long critical sections will be protected and the program will run safely, although
slower.
20

It is possible that a malicious thread could attempt to use Pacman to deny access to other
threads, by remaining inside a critical section and filling up a signature. This problem can be
detected with a watchdog timer, or by counting the number of Nacks triggered by a critical section.
Pacman has a few limitations. One is that it needs to be able to identify (monitored) critical
section entry and exit points. To do so, we have assumed synchronization macros or libraries, but
certain types of code are not written in this way. Second, the fact that all of the successful acquires
and releases need to access the SigTable can slow down codes where the same thread repeatedly
executes the same, short critical section. We have not seen this case but it is possible.
A final limitation is that Pacman is not designed for some unusual types of critical sections.
They include million-instruction critical sections. They also include patterns where a thread spins
on a flag inside a critical section, waiting for a racy thread to set the flag (Figure 2.7). We feel that
this pattern is bad programming style. In any case, for these types of critical sections, the compiler
or programmer can disable Pacman or use plain synchronization. Alternatively, Pacman can have
a watchdog timer or a Nack-counting mechanism that detects the problem and allows the write(s).
T0
Acquire L0
Release L0
while (flag==0){}
T1
flag=1;
...
Figure 2.7: Unusual pattern that Pacman does not handle.
2.5 Implementation Issues
2.5.1 Pacman Module
The Pacman module is a hardware module connected to the on-chip network (Figure 2.8(a)). It
comprises the SigTable and its controller. The controller is composed of two simple hash blocks
(H-Blocks) and the Cycle Detection & Breakup module. The latter chases the Stall index links as
21

described in Section 2.3.4 to detect and break deadlocks.
PID_in PID≠
PID_in PID≠
PID_in=PID
PID_in=PID
...
Address
h1 h2 hk
Hash function
Parallel Bloom filter
∈? ∪
∈? ∪
PID (N bits)
Signature (1K bits)
Network (e.g. bus) H−Block 1
NestingLevel (5 bits)
Signature_in
(b) SigTable and H−Block 1
Nack 1
SigTable
Stall_index (N bits)Lock_acquire? (1 bit)
T/F
Sig
Sig_in Sig∩
∈
Sig_in
(c) Sig_in Sig
Sig_in
Sig
∪(d) Sig_in Sig
SigTable
Nack 2 Nack 1
CycleDetection& Breakup
H−B
lock
1
H−B
lock
2
Controller
Network (e.g. bus)Write−back/inval
Nack
RequestPacman Module
(a) Pacman Module
Figure 2.8: Implementation of the Pacman module.
Figure 2.8(b) shows H-Block1 and the SigTable. H-Block1 takes the address of an incoming
request transaction and encodes it into a signature using a parallel Bloom filter [5] (Signaturein
in Figure 2.8(b)). The signature is then tested for membership in valid SigTable entries from
other processors (∈ in Figure 2.8(b)). This operation involves a bit-wise AND operation to get
the intersection and then a check for zero [8] (Figure 2.8(c)). If any membership test is positive,
the Nack1 signal is raised. Otherwise, if the requesting processor owns a SigTable entry (or a new
one needs to be allocated), the signature is bit-wise ORed with the correct SigTable entry (∪ in
Figure 2.8(b) and expanded in Figure 2.8(d)). Overall, H-Block1’s operations can be performed in
2-3 cycles and are hidden under the first half of the bus transaction.
In the second half of the bus transaction, when the caches have finished snooping, the bus
22

may receive a write back or invalidation response (Section 2.3.3). H-Block2 (not shown in detail)
checks if the processor ID that writes back or is invalidated has a SigTable entry. If so, it bit-wise
ORs the hashed address with the correct signature and raises Nack2. H-Block2’s operation takes
1-2 cycles. If Nack1 or Nack2 is raised and the Cycle Detection and Breakup module does not
prevent it, a Nack signal is returned on the bus.
All of the operations of the Pacman module except for cycle detection are simple enough to be
overlapped with the bus transaction. In a directory protocol, they overlap with directory module
accesses. The cycle detection may take over 10 cycles, which is acceptable since it is done in the
background.
Figure 2.8(b) also shows the sizes of the SigTable’s fields. The size of PID and Stall index
depend on how many threads we may need to monitor at a time. For Signature, we found that,
with 1,024 bits, false positives are typically less than 1%. For NestingLevel, we allocate 5 bits,
which is enough for our programs.
Finally, the Pacman module is enabled and disabled by the Pacman on and Pacman off com-
mands, respectively. They can be implemented as writes to memory-mapped registers. These
commands can be used to exclude the program regions that are serial or otherwise uninteresting.
2.5.2 Virtualization: Thread Pre-emption and Migration during Critical
Section Execution
While executing a critical section, a thread can be pre-empted and even migrated to another pro-
cessor. In an advanced design that requires OS support, we would like that (i) while a thread is
pre-empted in a critical section, we keep protecting its critical section, and (ii) when it resumes
in a potentially different processor, we keep accumulating its accesses in the same signature. To
support this, when the OS pre-empts a thread from processor i, it checks the SigTable for an entry
with PID equal to i. If it finds one, it changes its PID field. Specifically, if the thread will not run
anywhere, it sets the PID field to a special code (e.g., OUT); if it will run on processor j, it sets the
23

PID field to j.
With this algorithm, if a thread gets pre-empted and is not running, it still has its critical section
protected from asymmetric races. Indeed, its SigTable entry is still valid and coherence messages
are checked against its signature. The checks may result in sending Nacks. Then, when the thread
is scheduled on a different processor, its accesses are still accumulated into the same old signature.
This approach is efficient, since there is no copying or saving/restoring of SigTable entries.
Moreover, the hardware is kept simple, since it always does the same thing: accumulate accesses
from processor i into the SigTable entry tagged with PID i. Stall index does not get stale, since it
contains a table index.
If the program has more threads than processors, there may be several SigTable entries with a
PID equal to OUT. In addition, at a given time, the SigTable entries may belong to threads from
several different programs. Pacman works correctly because it uses physical addresses.
There is an issue with the cache state left behind by a thread that migrates while executing
a critical section. Recall from Section 2.3.3 that the thread may have entered the critical section
with cache state that it later accessed while in the critical section without notifying the SigTable.
We showed that Pacman (conservatively) captures this information at cache displacements or at
writebacks/invalidations triggered by other processors. However, if we now migrate the thread, we
cannot capture such events.
To keep the design simple, we accept this limitation. This means that Pacman misses the few
cases listed in Sections 2.3.3 and 2.3.3 for threads that migrate while in a critical section. A more
aggressive approach would be to write back to memory all the dirty cache lines at the time the
thread migrates while in a critical section. The addresses of these writebacks would be put in
the signature. A more drastic approach would be not to allow migration during critical section
execution. Overall, since critical sections are typically small, migration during their execution is
rare and does not justify additional actions. Like all data-race handling techniques, Pacman is a
best-effort approach.
24

2.5.3 Extensions for Multithreaded Processors
Multithreaded processors have multiple hardware contexts and run multiple threads at a time. It
is possible that different threads executing on different contexts of the same processor concur-
rently execute different critical sections. In this environment, Pacman requires an extension where
the messages sent by processors to the SigTable include both the processor ID and the hardware
context ID within the processor. Similarly, SigTable entries have both a PID and a ContextID field.
The cache-state issues of Sections 2.3.3 and 2.3.3 are handled conservatively. If multiple con-
texts in a processor are concurrently executing critical sections, any writeback, invalidation, or
displacement that needs to insert an address in a signature, does insert it in all the SigTable entries
owned by that processor.
Since the SigTable is connected to the network, it can only observe data sharing across proces-
sors, not across contexts in a processor. Consequently, for Pacman to tolerate races as advertised,
a program can only use one context per processor — although multiple programs can use the mul-
tiple contexts of a processor. To allow a program to use multiple contexts in a processor, bigger
changes would be needed, such as stalling all the other threads in the processor when one thread is
executing a critical section.
2.5.4 Extensions for a Distributed SigTable
The discussion so far assumed a centralized SigTable, which is reasonable for a snoopy protocol.
To use Pacman in a system with a directory-based protocol, we need to distribute the SigTable
across the different directory modules. Since such a design is outside our scope, we only outline
it.
Like the directory, the SigTable naturally lends itself to a distributed environment, with parti-
tions based on address ranges. Consequently, each directory module has an associated SigTable
module, which is in charge of the range of physical addresses assigned to the local directory mod-
ule. When a thread enters a critical section, the hardware allocates an entry for the processor in
25

all the SigTable modules; when it exits it, all the entries are deallocated. When a thread misses on
an address, the request naturally reaches the home directory of that address. There, the address is
checked against the entries in the local SigTable module using the usual algorithm. The SigTable
modules in the other directory modules are not checked.
2.6 Conclusions
This chapter proposed Pacman, the first scheme designed to tolerate asymmetric data races in pro-
duction runs with negligible execution overhead. Pacman leverages cache coherence hardware
to temporarily protect the variables that a thread accesses in a critical section. Unlike the previ-
ous, software-based schemes, Pacman induces negligible slowdown, needs no compiler or (in the
baseline design) OS support, and requires no application source code changes — although small
changes are needed in some libraries. Moreover, its hardware is unintrusive since it is concentrated
in a module in the network, rather than in the cores. We evaluated Pacman for SPLASH-2, PAR-
SEC, Sphinx3, and Apache and showed that it has negligible overhead. Moreover, we uncovered
two unreported asymmetric data races.
Pacman provides a hardware primitive for dynamically and selectively preventing accesses by
certain processors to a set of addresses. This primitive can have several uses in performance and
correctness debugging.
26

Chapter 3
Falcon: Dynamically Detecting andTolerating IF-Condition Data Races
3.1 Introduction
Data races are one of the most common concurrency bugs. A data race occurs when two threads
access the same memory location without any intervening synchronization and at least one of the
accesses is a write. Data race debugging can be very hard and, therefore, the topic has received
much attention (e.g., [9, 14, 35, 36, 43, 52, 55, 75]). Thanks to this, the state of the art in data race
debugging has made giant strides in the last decade. Unfortunately, commercial race-detection
tools (e.g., [24, 60]) still suffer from several limitations. Two of the most vexing ones are the lack
of specificity and the high runtime overhead.
The first issue refers to the lack of focus on the key data races. If we run a commercial race-
detection tool on a large software system, we typically obtain a long list of data races. While it can
be argued that all data races are undesirable, for productivity reasons, it is imperative to focus the
program developer’s attention on those races that truly cause program malfunctioning — at least
first.
The high runtime overhead — often 100x or more — burdens the program developer, who
needs to run the race detector multiple times during development. The overhead results from the
tool’s desire to provide a complete analysis. Recently, there have been proposals for race detectors
that use program sampling (e.g., [6, 30]) or hardware support (e.g., [34, 78]). These are promising
approaches, although they come with shortcomings in race detection ability or hardware cost.
One approach that should guide the evolution of race detectors is examining the types of bugs
reported in the bug databases of popular software systems [27]. By studying what are the races
27

reported, one can develop race debugging methods that are both specific (i.e., target the types of
reported races) and fast.
In this work, we have analyzed the data races reported in the bug databases of popular software
systems. We find that a type of data race that we call IF-condition race occurs fairly often. An
IF-condition data race is one where a memory location accessed by a thread (T1) in the control
expression of an IF statement suffers a race while T1 is executing the THEN or ELSE clauses. T1
may or may not access again the location in the THEN or ELSE clauses. Figure 3.1(a) shows an
example.
if (var1) {
to var1access
(optional)
}
var1 =if (var1){
var2=
}
var1 =
var2 =
(a) (b)
T1 T2 T1 T2
Figure 3.1: Structure of an IF-condition data race (a), where the arrow heads show the order of theaccesses. Chart (b) shows examples of IF-related data races, to be discussed later.
The insight behind focusing on IF-condition races is that statements in the THEN or ELSE
clauses are control dependent on the IF control expression. Hence, the program is likely to mal-
function if the value of the expression does not hold until the completion of the IF statement. In
other words, it is likely that the programmer implictly assumed that there is atomicity between the
accesses in the control expression and the accesses in the THEN or ELSE clauses. A data race on
locations accessed in the control expression breaks such atomicity.
If one considers the control expression to be the ”Check” and the THEN or ELSE clauses to
be the ”Action” of an IF statement, IF-condition races share a similar pattern with what are called
TOCTTOU (time of check to time of use) [64, 69] races. The difference is that while TOCTTOU
races apply to conditions in the file system between competing processes, IF-condition races apply
to multi-threaded programs.
IF-condition race detection allows for an extremely efficient and lightweight implementation.
28

Since IF-condition races are associated with a particular program structure, they are easy to spot
and check with a fast and specific test. Importantly, there is no need for profiling or training runs
to be able to find the targets for the checks — simple compiler analysis of the code structure is
typically enough.
In this chapter, in addition to proposing IF-condition races as a cost-effective target for future
race detectors, we present two techniques to handle them. One technique is entirely software-
based and detects the races during the code testing phase (SW-IF). The other relies on additional
hardware and is able both to detect and to prevent the races during production runs (HW-IF). Both
techniques rely on simple code transformations by the compiler and need no profiling.
Our techniques use the compiler to identify IF statements with control expressions that contain
accesses to shared locations. Then, in SW-IF, the compiler inserts code to check that the value of
the expression has not been changed by a racing thread. The check is performed in the THEN and
ELSE clauses, either before the first write to one of these locations or, if there is no such write, at
the end of the clauses. In HW-IF, the compiler inserts code to “watch” the shared locations that
participate in an IF’s control expression. During the IF’s execution, the local processor can access
the watched locations, but any remote processor that attempts to do it gets a failed memory access
signal and has to retry. This simple mechanism effectively prevents other threads from breaking
the atomicity of the IF-condition with respect to the rest of the IF statement.
We evaluate SW-IF and HW-IF using a variety of applications. We show that these techniques
are effective at finding new data race bugs with a low false positive rate and run with low overhead.
Specifically, HW-IF finds 5 new (unreported) IF-condition race bugs in the Cherokee web server
and the Pbzip2 application; SW-IF finds 3 of them. In addition, 8-threaded executions of the
SPLASH-2 applications show that, on average, SW-IF adds 2% execution overhead, while HW-IF
adds less than 1%.
The contributions of this work include: (1) identifying a new type of common, important data
race type called IF-condition, (2) proposing two new techniques to detect and prevent these bugs,
and (3) showing that these techniques find several new bugs with a low false positive rate and very
29

little execution overhead.
3.2 Background on Race Detection
There has been substantial research on the topic of data race detection (e.g., [24, 9, 13, 14, 31,
35, 36, 38, 43, 44, 45, 52, 55, 60, 68, 74, 78]), which includes the proposal for software tools for
race detection (e.g., [24, 52, 55, 60, 74]) and the proposal for special hardware structures in the
machine (e.g., [13, 31, 34, 44, 45, 78]).
In general, there are two approaches to find data races, namely lockset algorithms, such as
in Eraser [55], and happened-before algorithms, such as in Thread Checker [24]. The lockset
approach is based on the idea that all accesses to a given shared variable should be protected by
a common set of locks. This approach tracks the set of locks held while accessing each variable.
It reports a violation when the currently-held set of locks (lockset) at two different accesses to the
same variable have a null intersection.
The happened-before approach relies on identifying concurrent epochs. An epoch is a thread’s
execution between two consecutive synchronization operations. Each thread uses a vector clock to
order its epochs relative to the other threads’ epochs. In addition, each variable has a timestamp that
records at which epoch it was last accessed. When a thread accesses the variable, it compares the
variable’s timestamp to its own clock, to determine the relationship between the two corresponding
epochs: either one happened before the other, or the two overlap. In the latter case, we have a race.
In this work, rather than taking and extending these algorithms, we use an approach similar to
Lu et al.’s [27]. Specifically, we focus on understanding the data race patterns reported in the bug
databases of popular software systems. Then, we propose race-handling algorithms that are both
specific for important types of races and fast.
30

Application # Reported Bug ID # IF-Related # IF-Condition LanguageData Races Data Races Data Races
Apache 26 25520,21287,45605, 49986-1, 49986-2, 49985, 21 20 C, C++, Java47158, 48790, 1507,31018, 45608, 44178,254653, 49972, 40681, 40167, 728, 41659,37458, 36594, 37529, 40170, 46211, 44402,46215, 50731
MySQL 13 644, 791, 2011, 3596, 12848, 52356, 19938, 12 8 C, C++24721, 48930, 42101, 59464, 56324, 45058
Mozilla 11 622691, 341323, 13377, 225525, 342577, 52111, 9 8 C, C++224911, 325521, 270689, 73761, 124923
Redhat (glibc) 2 2644,11449 0 0 CJava SDK 1 6633229 1 1 JavaPbzip2 1 Data race from [73] 1 1 C++
Total 54 —- 44 38 —
Table 3.1: Data races studied. They are obtained from the bug databases of popular softwaresystems.
44 81%
10 19%
IF-related
Not IF-related
(a)
6 14%
38 86%
Other IF-relatedraces
IF-conditionraces
(b)
32 84%
6 16%
Single var
Multiple vars(DCL)
(c)
Figure 3.2: Classification of: reported data races (a), IF-related data races (b), and IF-condition data races(c).
3.3 IF-Condition Races & Their Frequency
We mined the bug report databases of Apache, MySQL, Mozilla, the glibc library of Redhat, JAVA
SDK, and Pbzip2, and found 54 reported data race bugs. They are listed in Table 3.1. To obtain
these bugs, we went over the entire bug databases of the applications and collected those that
met the following conditions: 1) programmers used the words “race condition” in the description
of the bug and 2) it was relatively easy to pinpoint the race in the source code according to the
description. Based on an analysis of the data, we define two types of data races:
• IF-Related Data Race: Race where at least one of the accesses in the race happened inside an
IF statement — regardless of where the access happened inside the statement or when the race
happened. Figure 3.1(b) illustrates two such races.
• IF-Condition Data Race: Race where a memory location accessed by a thread (T1) in the control
31

expression of an IF statement suffers a race while T1 is executing the THEN or the ELSE clauses.
T1 may or may not access again the location inside the THEN or ELSE clauses. Figure 3.1(a)
shows an example. IF-condition races are a subset of IF-related races.
As shown in Table 3.1, we find that, of all the reported data races, 44 (or 81%) are IF-related
data races. In addition, Table 3.1 also shows that, out of these 44 IF-related data races, 38 (or
86%) are IF-condition data races. Moreover, in an attempt to characterize these IF-condition data
races further, we examine whether they involve a single or multiple racing variables — of which at
least one is accessed in the IF’s control expression. We find that 32 out of these 38 bugs (or 84%)
have a single racing variable. There are 6 bugs that involve 2 racing variables. These bugs are all
double-checked lock (DCL) [56] races. Figures 3.2(a)-(c) show the overall data.
Overall, the data shows that IF-condition data race detection covers a wide range of data race
bugs — 70% of the race bugs in the selected applications. Our techniques, both SW-IF and HW-IF,
target all IF-condition data races, regardless of the number of variables involved. Consequently,
they can have a large impact when applied.
As a side note, the careful reader might notice that an IF-condition race can be signaled even
when shared locations in the IF-condition are not technically involved in a data race. This can
happen when the control expression of an IF is protected by a lock L which does not extend to
the end of the entire IF statement. The IF-condition race occurs when another thread modifies the
control expression (while acquiring L) when the THEN or ELSE clause of the IF statement is still
executing. While this is technically not a data race, this still compromises the atomicity of the
IF-condition with respect to the IF statement, and hence is classified as an IF-condition race and
is fully detectable by our scheme. However, we did not find any examples of this scenario during
analysis of the bug databases.
32

3.4 SW-IF: Detecting IF-Condition Data Races
3.4.1 Main Idea
The idea is to use the compiler to identify IF control expressions that can potentially be a source of
data races, and check that their values do not change inside the IF statements due to writes by other
threads. This is done by inserting checks at the end of their respective THEN and ELSE clauses.
Sometimes, however, the compiler is forced to insert the check earlier, before the THEN or ELSE
ends, because local writes can modify the value of the control expression. We call the locations in
the program where the compiler inserts these checks Confirmation points.
More formally, for a given IF statement, call E the control expression, E(SL) the set of po-
tentially shared locations accessed in E, and E(L) the set of all locations accessed in E. The IF
statement containing E is considered for race detection only if E(SL) is not empty. If so, the
compiler sequentially searches each of the THEN and ELSE clauses for any statement that might
potentially perform a write to E(L). If it finds any, a Confirmation point is placed before the first
such write. If the compiler cannot find a candidate write, a Confirmation point is placed at the end
of the THEN or ELSE clause. There is at most one Confirmation point in each of the THEN and
ELSE clauses. This is so to reduce overhead.
At a Confirmation point, the compiler inserts code that recomputes E. If the result of recom-
puting E is different than the one attained when E was first executed in the IF’s control expression,
then a race bug is declared. Figure 3.3(a) shows the high-level idea.
Like DataCollider [15], this approach is a best-effort one. Even in the presence of a data race
bug, this scheme may miss it because of timing reasons (the external processor’s racing access
has not yet occurred when E is recomputed at the Confirmation point) or because although some
variables in E changed value, expression E returns the same value. In the following, we present
the algorithm, and then discuss the limitations.
33

3.4.2 Algorithm
We use the Cetus source-to-source compiler [26] to analyze and transform the code. The struc-
ture of our transformation algorithm, called SW-IF, is shown in Figure 3.3(b). The algorithm is
performed in two steps: “Add Check” and “Add Delay”. “Add Check” identifies the Confirmation
points and inserts the checks. This is the only step used if we want to run SW-IF with minimal
overhead. “Add Delay” is a pass that is useful if we want to force different program interleavings
and we can tolerate more overhead. It considers the Confirmation points selected by “Add Check”
and decides if it introduces delays at those points to force different interleavings.
Adding Checks.
In the first step, the compiler needs to identify all the IF statements that will be augmented with
Confirmation points. We call this set the Monitor set. Such a set starts with all the IF statements
that have control expressions that potentially access shared locations. Cetus is able to tell when
accesses reference provably private locations. IF statements where E contains only accesses to
provably private locations are not part of the Monitor set.
SW-IF removes from the Monitor set those IF statements where E includes writes. SW-IF does
not support writes because, otherwise, when it recomputes E at a Confirmation point, it would
have side effects. The only exception to this rule is when E only contains the ++ or - - operator,
and Cetus can prove that there is no aliasing. In this case, the IF statement is kept in the Monitor
list, and E will be recomputed at the Confirmation point without the ++ or - - operation.
SW-IF also removes from the Monitor set those IF statements where E contains a function call.
SW-IF does this to avoid unwanted side effects at Confirmation points, or the need to perform
expensive interprocedural analysis to analyze function side effects. The exception are C standard
functions that do not write variables, such as string compare (strcmp and strncmp) and absolute
(abs). In general, neither writes nor procedure calls are common in control expressions.
For each IF statement in the Monitor set, SW-IF finds the Confirmation points of the THEN
34

I: if (E) {S1} else {S2}
Yes
No
Exit
Add
Che
ckA
dd D
elay
Yes No
YesNo
Yes No
(b)
(a)
Locate Confirmation point in S1 and in S2
Add check E before Confirmation point in S1 andadd check !E before Confirmation point in S2
Is I inside a loop?
Is I inside a critical section?
Does I’s call stack contain a recursive call?
Add delay before the check
E(SL) == Null
for each I, get E(SL)
E(SL) != Null
if(var==0){
if(!(var==0))printf("bug found\n");
}
Check expressionpointConfirmation
var =1;
Does E contain func call or write
operation beyond the exceptions?
Figure 3.3: High-level structure of the SW-IF algorithm.
35

for(i=0; i<MAX; i++){
}}
Do not add delay here.
if (var==0){
if (!(var==0)) ...
(a)
Lock (l)
if (var==0){
Do not add delay here.
if (!(var==0)) ...
Unlock (l)
(b)
foo (n){ bar(){
if (var==0){
Do not add delay here.if (!(var==0)) ...
(c)
}}
bar();
foo(n−1);
}}
Figure 3.4: Three types of IF statements where SW-IF does not insert delays.
and ELSE clauses. Then, it inserts there the recomputation of E and !E, respectively. Finding the
Confirmation point boils down to finding the first potential write to E within the THEN or ELSE
clause and for this, we rely on the alias analysis provided by Cetus. We make an exception for
function call statements however. Limitations of Cetus in analyzing the side effects of function
calls causes the placement of Confirmation points to be too conservative if placed before every call
that might potentially modify E. Hence, we insert a Confirmation point before only the function
calls that have a high probability of modifying E, that is, functions with arguments that contain
addresses of or references to variables in E. Also, if the IF statement includes a loop and the loop
contains a potential write to E, SW-IF places the Confirmation point before the loop. If no potential
writes are found, the Confirmation is inserted at the end of the THEN or ELSE clause.
Adding Delays.
In a development scenario, we may want to precede each Confirmation point check with a small
sleeping delay, so that we can potentially force a different interleaving and uncover a bug. Con-
sequently, in the “Add Delay” step, SW-IF selects the IF statements within the Monitor set that
can additionally be instrumented with delays. We call the resulting set the Delay&Monitor set. To
obtain the Delay&Monitor set, SW-IF removes three types of IF statements from the Monitor set
(Figure 3.4). Adding delays in these IF statements could potentially add too much overhead.
The first two types of IF statements to remove are those inside loops or critical sections. We
use Cetus’ intermediate representation tree to check interprocedurally if there are loops or critical
sections enclosing the IF statement. The third type of IF statements to remove are those whose call
stack contains a recursive function. This case is identified using the strongly-connected component
36

analysis in Cetus.
3.4.3 Limitations
SW-IF is attractive because, while being an entirely software-only solution, the impact on execu-
tion speed is almost negligible, allowing it to be used extensively with many input sets and test
cases. In fact, it can be left on during the entire testing phase with the programmer barely noticing
any slowdown in the debugging cycle. However, it may suffer from false negatives (i.e., miss a
data race) and, in some unusual cases, false positives (i.e., incorrectly declare a data race).
There are three scenarios where SW-IF can suffer false negatives. One is when races cause one
or more locations in E to change values but the overall value of E remains the same. SW-IF chooses
to check the value of the whole E rather than of each shared variable in E because it assumes that
the programmer only relies on E being invariant — although SW-IF may be missing a race. The
second scenario is when a potential modification of E forces SW-IF to place the Confirmation
point early, and the race happens after that point. The final scenario is when unsupported writes or
function calls in E prevent SW-IF from inserting a Confirmation point and a race happens. False
negatives caused SW-IF to miss some real data race bugs in the applications we tested.
The false positives occur when the thread executing the IF statement updates locations in E
before the place in the code where SW-IF put the Confirmation check. In this case, the check
will incorrectly declare a data race. As mentioned in Section 3.4.2, these cases can occur due to
function side effects on function calls that Cetus chose not to insert Confirmation points. Figure 3.5
shows such an example where F modifies *p as a side effect, and the check in the end subsequently
signals a data race. However, we found this scenario to be very rare. In fact, in our experiments
with real applications, SW-IF did not experience any false positives.
The top part of Table 3.2 summarizes the sources of false negatives and false positives for
SW-IF.
SW-IF is also limited in that it can only detect, not prevent, IF-condition data races. By the
time it detects the race at the Confirmation point, the race has already happened. At most, SW-IF
37

If (*p ==q){
Confirmation Point
}
F(); // *p is written in F
Figure 3.5: Example of false positive in SW-IF.
Mode False Negatives False Positives(Failure to Signal a Data Race) (Incorrectly Signal a Data Race)
SW-IF
Occasional:• Races in E that do not change overall value of E• Potential writes to E that force Confirmation point early andrace happens later• Unsupported writes or functions in E that prevent insertionof Confirmation point and race happens
Rare:• Before the Confirmation point,the local thread modifies the valueof E without the compiler being ableto analyze it.
HW-IF
Rare:• Inability to watch the side effects of functions called in E andrace happens there• Simplified support for monitoring nested IFs• Race under special conditions: breaking a deadlock and pre-empting a thread
Harmless:• Due to simplified AWT hardware:− “False sharing” data races− Read-read conflicts
Table 3.2: False positives and false negatives in SW-IF and HW-IF.
can raise an exception or print an error message.
To address the limitations of SW-IF, we now propose HW-IF, which augments it with some
hardware support.
3.5 HW-IF: Detecting & Preventing IF-Condition Data Races
3.5.1 Main Idea
In HW-IF, the compiler searches for IF statements that can cause data races as before. But this time,
instead of Confirmation points, the compiler inserts, right before the IF statement, code to “watch”
all the shared locations that are accessed in the control expression. The hardware envisioned has
a functionality that goes beyond that of the current watchpoints provided by x86 processors [23].
Specifically, we envision that the local processor can still access the watched locations. However,
any remote processor that attempts to access them will get a failed memory access signal that
38
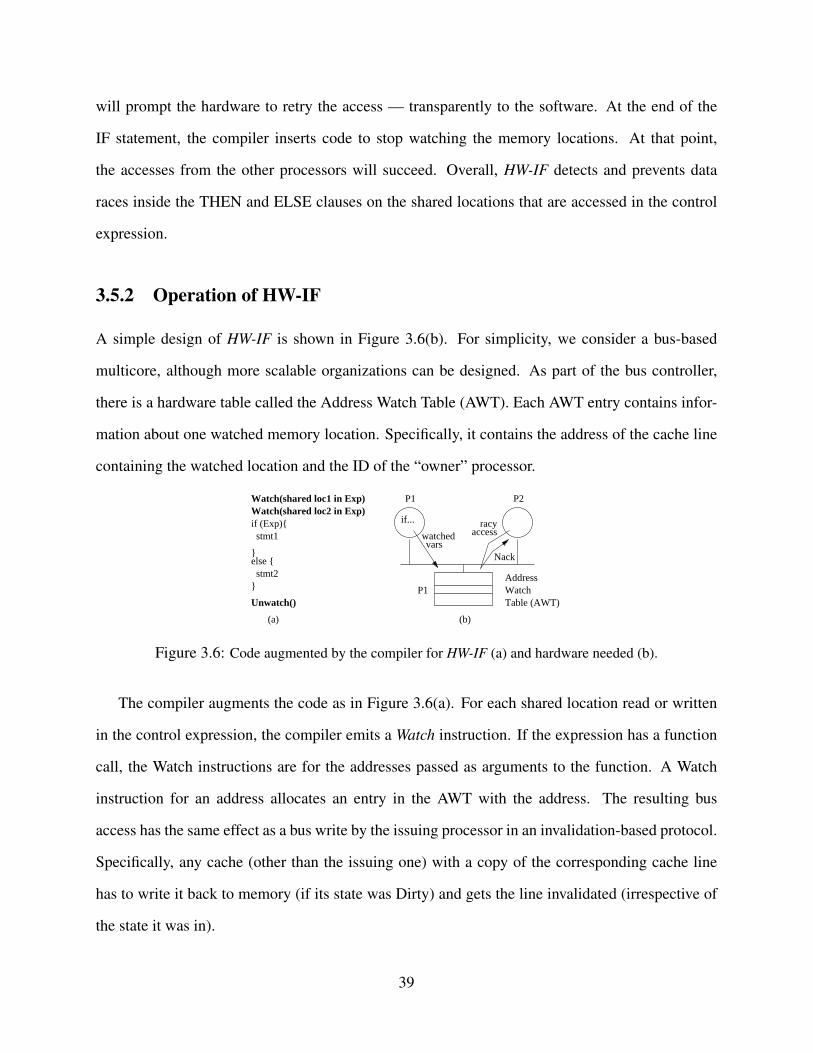
will prompt the hardware to retry the access — transparently to the software. At the end of the
IF statement, the compiler inserts code to stop watching the memory locations. At that point,
the accesses from the other processors will succeed. Overall, HW-IF detects and prevents data
races inside the THEN and ELSE clauses on the shared locations that are accessed in the control
expression.
3.5.2 Operation of HW-IF
A simple design of HW-IF is shown in Figure 3.6(b). For simplicity, we consider a bus-based
multicore, although more scalable organizations can be designed. As part of the bus controller,
there is a hardware table called the Address Watch Table (AWT). Each AWT entry contains infor-
mation about one watched memory location. Specifically, it contains the address of the cache line
containing the watched location and the ID of the “owner” processor.
if...
(b)
watchedvars
accessracy
P1 P2
P1Address
Table (AWT)
Nack
Watch
stmt1
}else { stmt2}
Unwatch()
if (Exp){
(a)
Watch(shared loc2 in Exp)Watch(shared loc1 in Exp)
Figure 3.6: Code augmented by the compiler for HW-IF (a) and hardware needed (b).
The compiler augments the code as in Figure 3.6(a). For each shared location read or written
in the control expression, the compiler emits a Watch instruction. If the expression has a function
call, the Watch instructions are for the addresses passed as arguments to the function. A Watch
instruction for an address allocates an entry in the AWT with the address. The resulting bus
access has the same effect as a bus write by the issuing processor in an invalidation-based protocol.
Specifically, any cache (other than the issuing one) with a copy of the corresponding cache line
has to write it back to memory (if its state was Dirty) and gets the line invalidated (irrespective of
the state it was in).
39

In practice, this operation does not add much execution overhead. The reason is that the control
expressions in the majority of IF statements access few shared locations. For our applications, a
control expression accesses on average 1.6 shared locations.
From then on, during the execution of the IF statement, when a processor other than the owner
tries to reference a location being watched, it misses in its cache and issues a bus access. As shown
in Figure 3.6(b), the AWT observes the access. If the requested address matches an address in one
of AWT’s entries and the requester is not the owner of the entry, the AWT returns a failed-access
transaction (called negative-acknowledge or Nack). A Nack prompts the requesting processor’s
hardware to automatically retry the access, transparently to the software. This will continue until
the owner processor removes the address from the AWT. The owner processor can always access
the watched locations, either from its cache or from memory. Its bus access is not Nacked by the
AWT.
At the end of the IF statement, the owner processor issues an Unwatch instruction, which
clears all the AWT entries that it owns. A subsequent access from any processor to the previously-
watched locations now succeeds.
For simplicity, nested IF statements are flattened out, which means that the watched locations
of all the nesting levels have equal status, and the first Unwatch clears all the entries of the owner
processor. As a result, the remaining parts of the outer IF nest lose the ability to watch their
addresses.
Overall, the proposed HW-IF design emphasizes hardware simplicity. We can improve its
efficiency at the expense of more complicated hardware. For example, we can improve IF nesting
support by including hardware counters in the AWT that are incremented and decremented at
each monitored IF entry and exit. Similarly, we can eliminate the continuous Nack and retry
with hardware support. However, our evaluation shows that this HW-IF design is already highly
effective.
40

3.5.3 Discussion
HW-IF is attractive because it has an overhead low enough to be used on-the-fly, and can both
detect and prevent data races. This means that HW-IF can prevent bugs from manifesting in a
production environment. In addition, HW-IF suffers very few false negatives (i.e., failures to signal
data races) and the false positives that it may have (i.e., incorrect signaling of data races) are usually
harmless.
HW-IF has very few false negatives because it has none of those present in SW-IF: (i) since it
constantly monitors all accesses to shared locations in E, it detects data races even if E does not
change value; (ii) it monitors IF statements from beginning to end, and so has no false negatives
due to premature Confirmations; and (iii) it monitors IF statements even when E includes write
operations and function calls, since E is not re-evaluated at any Confirmation point. The only
false negatives occur due to the inability to watch the side effects of functions called in E, and the
non-ideal behavior of nested-IF monitoring.
False positives can still happen, but they typically cause nothing but a slight delay in a cache
line access. There are two sources of false positives, which result from our choice of a simple
design for the AWT. The first source is the fact that the AWT deals with cache line addresses, and
false sharing can cause it to signal a data race even when there is none. This issue can be avoided
by designing an AWT that works at word or byte granularity. The second source of false positives
is read-read conflicts on addresses accessed in E, which induce Nacks from the AWT. This issue
can be avoided by building the AWT with two types of entries: one watching data that the owner
processor will write, and one for data it will only read. This AWT would not Nack reads by other
processors to the latter type. Overall, since false positives are inexpensive, we tolerate these cases.
The bottom part of Table 3.2 summarizes the sources of false negatives and false positives for
HW-IF.
41
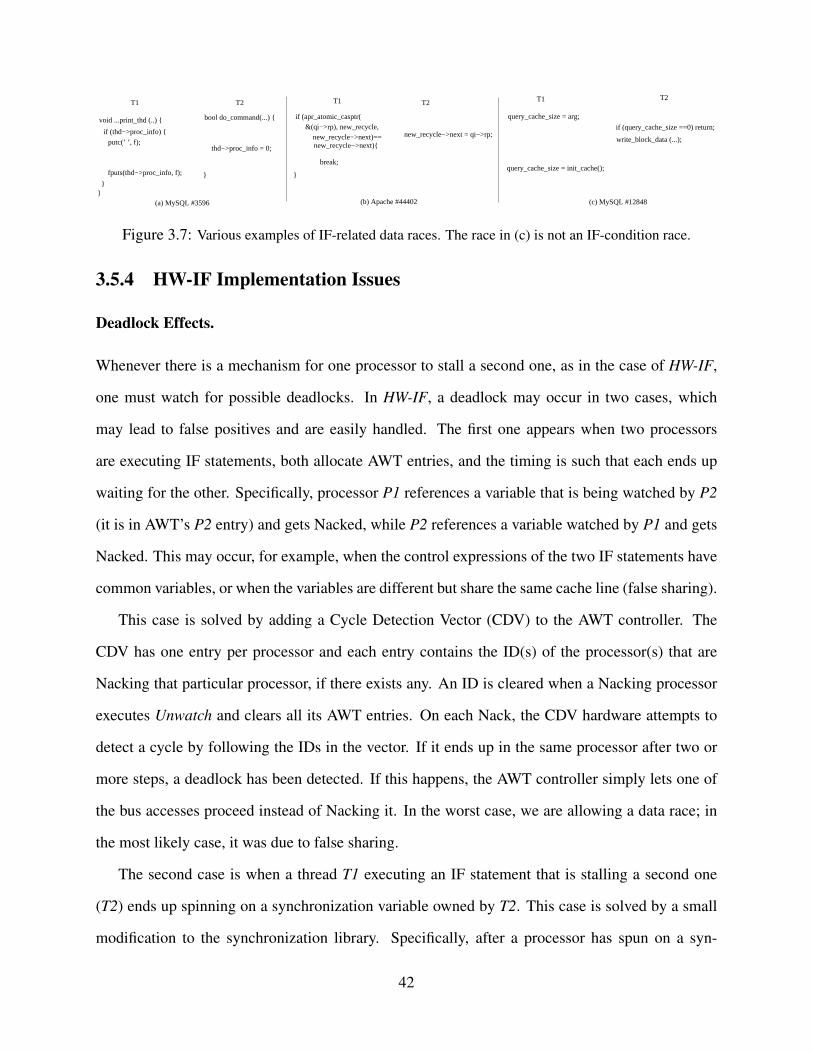
}
bool do_command(...) {
T1 T2T1 T2
if (thd−>proc_info) {
putc(’ ’, f);
fputs(thd−>proc_info, f);
}
void ...print_thd (..) {
thd−>proc_info = 0;
}
(a) MySQL #3596
if (apr_atomic_casptr(
new_recycle−>next)==new_recycle−>next){
&(qi−>rp), new_recycle,
break;
new_recycle−>next = qi−>rp;
(b) Apache #44402
}
query_cache_size = arg;
T1
(c) MySQL #12848
T2
write_block_data (...);
if (query_cache_size ==0) return;
query_cache_size = init_cache();
Figure 3.7: Various examples of IF-related data races. The race in (c) is not an IF-condition race.
3.5.4 HW-IF Implementation Issues
Deadlock Effects.
Whenever there is a mechanism for one processor to stall a second one, as in the case of HW-IF,
one must watch for possible deadlocks. In HW-IF, a deadlock may occur in two cases, which
may lead to false positives and are easily handled. The first one appears when two processors
are executing IF statements, both allocate AWT entries, and the timing is such that each ends up
waiting for the other. Specifically, processor P1 references a variable that is being watched by P2
(it is in AWT’s P2 entry) and gets Nacked, while P2 references a variable watched by P1 and gets
Nacked. This may occur, for example, when the control expressions of the two IF statements have
common variables, or when the variables are different but share the same cache line (false sharing).
This case is solved by adding a Cycle Detection Vector (CDV) to the AWT controller. The
CDV has one entry per processor and each entry contains the ID(s) of the processor(s) that are
Nacking that particular processor, if there exists any. An ID is cleared when a Nacking processor
executes Unwatch and clears all its AWT entries. On each Nack, the CDV hardware attempts to
detect a cycle by following the IDs in the vector. If it ends up in the same processor after two or
more steps, a deadlock has been detected. If this happens, the AWT controller simply lets one of
the bus accesses proceed instead of Nacking it. In the worst case, we are allowing a data race; in
the most likely case, it was due to false sharing.
The second case is when a thread T1 executing an IF statement that is stalling a second one
(T2) ends up spinning on a synchronization variable owned by T2. This case is solved by a small
modification to the synchronization library. Specifically, after a processor has spun on a syn-
42

chronization variable for a long time, the library simply clears the processor’s AWT entries by
executing Unwatch. If the spinning was due to the scenario described, HW-IF will break the dead-
lock by allowing a (potential) data race. Custom user synchronizations can be instrumented in a
similar fashion, after identifying them using methods proposed by Tian et al. [61]
Other Effects.
There are other issues related to the practical implementation of the HW-IF hardware. The first
one has to do with thread preemption and context switching. When a thread executing an IF
statement with an entry in the AWT is preempted from its processor, the OS clears the processor’s
AWT entries using Unwatch. This avoids the possibility of long spins by other threads. While
more advanced solutions are possible that rely on associating process IDs to AWT entries, they are
unlikely to be cost-effective.
The second issue is support for multithreaded processors. Multithreaded processors have mul-
tiple hardware contexts and run multiple threads at a time. It is possible that different threads
executing on different contexts of the same processor concurrently execute different IF statements.
For multithreaded environments, HW-IF can use an approach similar to the one described by Pac-
man [46]. The approach requires an extension where the messages sent by processors to the AWT
include both the processor ID and the hardware context ID within the processor. Similarly, AWT
entries would have both a PID and a ContextID field. However, since the AWT is connected to the
network, it can only observe data sharing across processors — not across contexts in a processor.
Consequently, for HW-IF to tolerate races, a parallel program can only use one context per proces-
sor — although multiple programs can use multiple contexts of a processor. To allow a program
to use multiple contexts from a processor, bigger changes would be needed, such as stalling all the
other threads in the processor when one thread is executing an IF statement.
A final issue has to do with the scalability of the AWT. We have assumed a centralized AWT,
which is reasonable for a snoopy protocol. However, in a directory-based protocol, we need to
distribute the AWT across different directory modules. Fortunately, like the directory, the AWT
43

can be easily designed for a distributed environment, which is partitioned based on address ranges.
Hence, each directory module has an associated AWT module, which is in charge of the range of
physical addresses corresponding to that directory module.
3.6 Potential: Detect Existing IF-Condition Bugs
We take the 38 IF-condition data race bugs from Table 3.1 and characterize whether they can
potentially be detected with SW-IF and/or detected and prevented with HW-IF. Our approach is to
manually inspect the source code of these bugs and, from it, decide whether they can be handled
by our schemes. The result over all the applications is shown in Figure 3.8 as a pie chart.
SW-IF HW-IF
47%
Figure 3.8: Percentage of existing IF-condition data races that can potentially be detected by SW-IF andHW-IF.
From Figure 3.8, we estimate that SW-IF could detect 47% of these reported data races given
the appropriate interleaving. On the other hand, HW-IF could detect and prevent all of them. From
this, we can see that HW-IF is potentially very effective, and about twice as effective as SW-IF.
To understand how we reached these conclusions, Figure 3.7 shows examples of three IF-
related data race bugs from Table 3.1. Figure 3.7(a) is a typical IF-condition data race that can be
detected by SW-IF. It is Bug #3596 from MySQL. In the bug, thread T1 tests thd->proc info and
then uses it. Meanwhile, T2 sets thd->proc info to 0.
Figure 3.7(b) shows an IF-condition data race that cannot be detected by SW-IF but can be
handled by HW-IF. It is Bug #44402 from Apache. There is an IF statement in T1 and a write
statement in T2. The control expression in the IF contains a call to apr atomic casptr, which is
internally an atomic compare-and-swap between &(qi->rp) and new recyle, pending comparison
44

of &(qi->rp) with new recycle->next. If successful, apr atomic casptr returns the old value of
&(qi->rp). Between the return of apr atomic casptr and the comparison with new recycle->next,
T2 intervenes and pollutes new recycle->next, causing the bug. Detecting the bug in SW-IF is
problematic because recomputing the control expression before leaving the THEN clause can cause
side-effects due to the compare-and-swap. However, HW-IF can easily have the hardware watch
all the shared locations accessed in the control expression and prevent the bug.
Finally, Figure 3.7(c) shows an IF-related race that is not an IF-condition race. Hence, it
cannot be handled with either scheme. It is Bug #12848 from MySQL. It is an IF-related data race
because the race occurs on a variable (query cache size) that is accessed in the control expression
of an IF statement. The bug occurs when the two assignments in T1 are interleaved by a call
to write block data from T2 as in the figure. The write block data function tries to write to the
cache initialized by init cache(). By the time T2 checks the value of query cache size, T1 has
already initialized its value and therefore the return is not executed. However, the cache itself
has not yet been initialized when T2 tries to write to it with write block data. Neither preventing
query cache size from changing for the duration of the IF (as in HW-IF) nor checking that it has
not changed before exiting the IF (as in SW-IF) helps.
Table 3.3 repeats the data in Figure 3.8 breaking them down on a per-application basis. We see
that HW-IF could detect and prevent all the IF-condition races. SW-IF could detect a fraction of
the races in Apache, MySQL and Mozilla.
# IF-condition # Detected # DetectedApplication Data by SW-IF and Prevented
Races by HW-IFApache 20 7 20MySQL 8 6 8Mozilla 8 5 8Redhat (glibc) 0 0 0Java SDK 1 0 1Pbzip2 1 0 1Total 38 18 38
Table 3.3: Bugs potentially handled on a per-application basis.
One reason why it is important to support HW-IF is the prevalence of a class of data race bugs
45

called double-checked locking (DCL) [56]. In Figure 3.2(c), we showed that 16% of all reported
IF-condition data race bugs were DCL bugs. Figure 3.9 shows a simplified form of the bug from
Apache (Bug #47158). In the example, Thread T1 updates x and (as part of Object()) x.m inside
its IF statement. Using HW-IF to place x inside the AWT prevents T2 from interleaving with T1
during the initialization process and, therefore, avoids this bug. SW-IF is unable to detect this bug.
}
if (x !=NULL) {
y= x.m
T2T1
if (x == NULL){ synchronized (this) { if (x == NULL){ x = new Object();
} }
// initializes x.l, x.m, etc
Figure 3.9: Example of a double-checked lock (DCL) bug.
3.7 Conclusions
This work analyzed data races reported in bug databases and found that many can be classified
as what we call IF-condition data races. Focusing on IF-condition data races is advantageous in
that they have a very low false positive rate due to the implicit atomicity implied by IF statements.
Also, their obvious structure allows the implementation of a very efficient data race detector. This
chapter introduced how such a detector could be built purely in software (SW-IF) or with the help
of some hardware (HW-IF). HW-IF can be used to not only detect races but also to prevent them
from happening at runtime.
We evaluated SW-IF and HW-IF using a variety of applications. We showed that these new
techniques are effective at finding new data race bugs and run with low overhead. Specifically,
HW-IF found 5 new (unreported) IF-condition data race bugs in the Cherokee web server and the
Pbzip2 application; SW-IF found 3 of them. In addition, 8-threaded executions of the SPLASH-2
applications showed that, on average, SW-IF added 2% execution overhead, while HW-IF added
less than 1%. These minuscule overheads point to the use of both SW-IF and HW-IF as lightweight
46

race detectors. SW-IF can speed-up the process of code development and testing, while HW-IF can
be used to avoid races on production runs.
47
Chapter 4
Touchstone: Architecture for ConcurrentMulti-level Program Analysis
4.1 Introduction
Multicore systems are now pervasive from cell phones to datacenters. To take advantage of their
potential, many programmers now have to program in parallel. In addition, with the increased plat-
form connectivity, programming has become more complex, with different software components
interacting in subtle and potentially unsecure manners.
Both of these trends call for better tools for program analysis. For example, we need effective
tools to identify concurrency bugs such as data races or atomicity violations, to trace security
threads through taint analysis, and to pinpoint performance bottlenecks caused by synchronization
or load-imbalance. Ideally, these tools should have an overhead low enough to allow them to be
used on the fly, without distorting the parallel program’s interleaving.
Light-weight microarchitectural support in the multicore is key to enable such set of analysis
tools. Current commercial processors provide only minimal hardware support, largely limited to
performance counters, watchpoints, and branch buffers [3, 25]. There are, however, a number of
proposals in the literature that illustrate what is possible [4, 19, 42, 57, 59, 67, 70, 77] — from
fine-grain memory protection, to flexible watchpoints, light-weight taint analysis, and record &
deterministic replay.
Many of these proposed microarchitectures for program analysis have low overhead and are
flexible. This helps their chance of being adopted in the near future. However, one limitation of
most of these schemes is that they have a single use. They have largely been engineered for one
usage.
48
To maximize the chance of adoption, a key capability that we would like to provide is the
ability to perform multiple analyses on a running application concurrently. For example, for a
given dynamic parallel execution (and, therefore, a given multi-thread interleaving), we may want
to run a data race detector and a taint analyzer. As another example, we may want to run multiple
levels of taint analysis concurrently, to better assess the degree of security risk. In addition, unlike
a previous proposal that can provide a similar capability with watchpoints [19], we would like to
tightly integrate our microarchitecture into the coherence hardware of a multicore. This is key to
making the microarchitectural design both low overhead and implementation-realistic.
In this chapter, we propose such a microarchitecture, which we call Touchstone. Touchstone is
a light-weight architecture for monitoring memory accesses in multithreaded programs. Its main
characteristics are that (i) it can monitor accesses for several uses at the same time, and (ii) it
leverages the multicores hardware cache coherence to keep its metadata coherent across threads
with negligible overhead. We call the idea of performing multiple runtime analyses at the same
time concurrent multi-level analysis.
Touchstone provides multi-level support for starting to monitor a location, stopping to monitor
a location, and checking if a reference accesses a monitored location. Touchstone’s metadata
is kept on a per-processor Security Cache (SC) in the cache hierarchy that is kept coherent in
hardware. To store the monitored addresses compactly, Touchstone introduces the Pooled Bloom
Filter (PBF). The PBF is a bloom-filter-based hardware structure that dynamically adapts to the
number of elements inserted, expanding its size on the fly. This capability is needed for new types
of uses, where we do not know in advance the rough number of addresses to be inserted in the
filter.
To show Touchstone’s versatility, we evaluate it with three concurrent uses, namely taint anal-
ysis based on data flow, taint analysis based on data and control flow, and asymmetric data-race
detection. We run the SPLASH-2 codes with 8 threads on a simulated multicore. The results show
that Touchstone adds minimal overhead. The execution overhead is, on average, only 3.6%. The
storage overhead is at most 7KB in the per-processor SC plus a 17KB overflow area in main mem-
49

ory. If, instead, we used conventional bloom filters, the corresponding storage overhead would be
12KB in the per-processor SC and a 24KB overflow memory.
4.2 Background
In this section, we describe two structures that have been used in the past in the context of microar-
chitectures for program analysis.
4.2.1 Bloom Filter
The Bloom Filter is a space-efficient probabilistic data structure that is used to store a set of ele-
ments and test membership of an element on demand [5]. A bloom filter is organized as an array
of bits with multiple hash functions that translate the value of an input to positions in the bit ar-
ray. Initially, all bits in the bloom filter are set to 0, indicating that the bloom filter is empty. The
insertion of an element consists of setting to 1 the positions pointed to by the results of the hash
functions. A membership test consists of checking whether the bits pointed to by the hashes of
an input are all set to 1, in which case a hit is declared. By construction, false negatives on mem-
bership tests never occur — that is, checks on already-inserted elements always result in a hit.
However, false positives can still occur due to the properties of hash functions. Key to the space
efficiency of bloom filters is the fact that this false positive rate can be kept at a manageable level
if the set of stored elements is not too large compared to the size of the bit array, regardless of the
range of values an element can take.
In recent years, several proposals have used bloom filters to design efficient hardware schemes
to store sets of memory locations accessed by a processor. This is done in order to check conflicts
with memory accesses in other processors for the purposes of implementing transactions [8, 32,
72], or to analyze memory aliasing behavior for the purposes of optimizations [65]. In all cases,
bloom filters can be used because one can make reasonable assumptions about the size of the set
of stored memory addresses. Such assumptions enable one to size the bloom filter at design time.
50
4.2.2 Range Cache
The Range cache (RC) is another space-efficient hardware structure that can store large sets of
contiguous memory locations [62]. The RC has a list of ranges, where each range consists of a
start and an end address. Ranges are automatically merged or split as need arises. The RC has been
used to support watchpoints [19]. An RC is a nice complement to a bloom filter, since the latter
is good at storing non-contiguous discrete addresses efficiently, while the RC is good at storing
contiguous addresses.
4.3 Touchstone Architecture
4.3.1 Basic Idea
Touchstone is a light-weight architecture for monitoring memory accesses in multithreaded pro-
grams. Its main characteristics are that (i) it can monitor accesses for several uses at the same time
and that (ii) it leverages a multicore’s hardware cache coherence to keep the metadata for a given
use coherent across the multiple threads with negligible overhead.
Touchstone is ideal for performing multiple runtime analyses on a program at the same time.
We call this idea concurrent multi-level analysis. Such analyses can be related to concurrency
debugging (such as data race or atomicity violation detection), security (such as taint analysis)
or other areas. Thanks to some simple hardware support, Touchstone performs the analyses with
negligible performance overhead.
Touchstone provides support for starting to monitor a location, stopping to monitor a location,
and checking if a read or write accesses a monitored location. Monitoring and unmonitoring a
location is called Marking and Unmarking the location. Marking and unmarking can apply to a
location or to a range of locations while checking is done only on single locations whenever the
program performs a memory access.
Marking is performed using special instructions which store the marked address in an efficient
51

and compact representation in hardware structures. On other hand, unmarking is performed en-
tirely in software without involving any special hardware. The details and rationale for this design
will become clear later.
Checking happens much more frequently compared to marking and unmarking since a check
has to happen on every program memory access. Hence, Touchstone automatically performs the
check on the location in the background for every load or store without the need to invoke addi-
tional check instructions. If the location is marked, then Touchstone automatically invokes a trap
handler, which will execute code provided by the user that is specific to a particular use. If the
location is not marked, then no special action is taken.
The metadata for Touchstone is kept on a per-processor table called Security Cache (SC) in the
cache hierarchy of each processor. Thanks to leveraging a multicore’s hardware cache coherence
protocol, Touchstone is very useful for analysis of multithreaded programs. For example, one
thread may mark an address and then, when a second thread accesses the location, the coherence
protocol will supply the information that the location is marked, and the second thread will trap.
In the rest of this section, we describe Touchstone’s ISA support, its hardware structures, its
detailed operation, and the limitations.
4.3.2 ISA Support
Table 4.1 shows the ISA extensions needed to enable Touchstone. The Touchstone hardware struc-
tures are labeled with two IDs: Program ID (PID) and Security Level (SL). PID is a per-application
ID, while SL is a particular use of Touchstone among the several uses that are being supported si-
multaneously for the given application. For example it can correspond to one of the taint analyses
in progress. As can be seen in Table 4.1, there are instructions for a thread to set the PID to a
value (set pid) or read it (get pid). There are instructions to add a new concurrent use (i.e., a new
SL) to Touchstone (add entry), to remove it (remove entry), and to check if such an SL exists
(is entry valid).
There are two instructions to mark addresses: mark range adds a range of addresses to the SC
52

Instruction Descriptionset pid pid Sets the internal PID register to pid.get pid Gets the value of the internal PID register.add entry level Adds an entry in the SC for PID and the given security level.remove entry level Removes the entry in the SC with PID and the given security level.
is entry valid levelChecks whether an entry with the given security level exists in theSC. It is used by the OS to check for entry displacements on contextswitches.
mark range begin, end, levelAdds the range of addresses specified by begin and end to the SC forthe given PID at the entry given by level.
mark addr addr, level Adds the address addr to the SC for the given PID at the entrygiven by level.
set trap handler addr, level Sets the trap handler for PID and security level to addr.
add clearance level bitmapAdds clearance for the security level given by level bitmap. All futurememory accesses need not perform checks against the entry with PIDand level bitmap.
remove clearance level bitmapRemoves clearance for the security level given by level bitmap. Allfuture memory accesses now need to perform checks against the entrywith PID and level bitmap.
Table 4.1: Extensions to the ISA to enable Touchstone.
for a given PID at the entry given by an SL; mark addr adds one address to the SC for a given
PID at the entry given by an SL. As mentioned previously, there are no instructions to perform
unmarking. This is because unmarking is done entirely in software, as we will see later.
There are no instructions to check whether a given address is in the SC. This is because the
checking happens automatically for all memory accesses, in the background, while the access is
being serviced. If the address is found in the SC, a trap is raised when the instruction attempts to
retire. The trap results in an invocation of a software handler. As shown in Table 4.1, the software
handler is set up by the set trap handler instruction.
The ISA provides a pair of instructions (add clearance and remove clearance) to quickly en-
able and disable checks against certain SLs. For example, if a program wishes to disable data
race detection for a certain phase of execution (maybe because the phase is single-threaded), all
it needs to do is execute add clearance for the SL assigned to data race detection. Security clear-
ances are recorded in the SC and are passed to add clearance and remove clearance in the form
of a bitmap with one bit per SL. To provide 32 security levels, a single 32-bit security clearance
register suffices.
53

P
$ Security
Cache(SC)
Main Memory
Unmarked
Table(UT)
Security
Memory(SM)
…
P
$
Program ID
(PID)
Security
Level(SL)
Range Cache
(RC)
Pooled Bloom Filter
(PBF)
…
PID SL PBF
…
HashSet
Security
Cache(SC)
Figure 4.1: Overview of the Touchstone architecture.
Bloom filter 1
Bloom filter 2
Bloom filter N
.
.
.
Pool
HashFunction
Pooled Bloom Filter (PBF)
Cur. BF Num. Cur. Element Num. BFID 1 BFID 2 BFID N. . .
Address
=ØLookup
Insertion
T/F
Figure 4.2: Pooled Bloom Filter (PBF) design.
54

4.3.3 Touchstone Structures
Figure 4.1 gives an overview of the Touchstone architecture. The Touchstone hardware structures
are the per-processor Security Cache (SC) and the global Security Memory (SM). The SC is a
table associated with the cache hierarchy of the processor. It contains the addresses that have
been marked by all the active program analyses and have been recently accessed by this processor.
The SM is attached to the main memory (or to each memory module in a distributed memory
system). It contains the addresses that have been displaced from the SCs of the processors. The
sum of all the SCs and the SM contain all the addresses that have been marked by all the active
program analyses. Since the SC and SM are manipulated by the cache coherence protocol, they
store addresses at line level rather than at word level.
Touchstone also has a software table in main memory called the Unmarked Table (UT). We
will see that it is used to keep addresses that used to be marked and have since been unmarked.
Security Cache
Each entry of the SC has a PID and an SL, which are used to index the SC. In addition, each
entry has a growable Pooled Bloom Filter (PBF) and a Range Cache (RC). These two structures
contain the actual marked addresses for the PID and SL pair. Specifically, individual addresses
are stored in the PBF, while ranges go to the RC. The program analysis accesses the entry with
the PID of the program, and the SL assigned to the analysis, as it marks and checks memory
locations. Each processor contains the PID of the currently executing program in a register, so that
the corresponding entry can be accessed quickly without referring to the OS.
The SM is structured identically to the SC, except that it does not have the RC field. The
SM stores addresses displaced from the SCs, so that the monitoring of these addresses continues
uninterrupted. Displacements can happen either due to regular cache displacements (Section 4.3.4)
or SC entry displacements (Section 4.5.2).
55

Pooled Bloom Filter
Bloom filters are good hardware structures to store addresses in a compact manner. However, as
indicated in Section 4.2.1, they only work well when one can make good guesses about the number
of addresses to be stored in the filter. Unfortunately, since we want to support a variety of program
analyses, we cannot make reasonable assumptions about the number of addresses we may need to
store.
For this reason, in this chapter, we propose the Pooled Bloom Filter (PBF). The PBF is a
novel bloom-filter-based hardware structure that can adapt dynamically to the number of elements
inserted, by expanding its size on-the-fly, given a pre-set maximum false positive rate. As a result,
we do not need to guess the number of addresses to be stored in advance.
The idea behind the PBF is to keep a pool of available bloom filters (BF) and dynamically
increase the number of BFs used if needed. Specifically, first, we use a single BF to collect marked
addresses. When the number of addresses inserted reaches a certain threshold, we allocate a second
BF to collect more addresses. Before an address can be inserted in the second BF, however, we
need to check that it is not already in the first one. This process is repeated with as many BFs
as needed. With this PBF, an insertion requires first checking all the earlier BFs. Note that this
checking is done in a pipelined manner. Finally, to minimize the amount of hardware, the pool of
available BF is shared by all the PBFs in the Security Cache.
Figure 4.2 shows a diagram of a PBF, together with the Pool of BFs shared by all the PBFs.
A PBF is composed of three components. First, Cur. BF Num. indicates how many BFs are
currently allocated to this PBF. Second, Cur. Element Num. indicates how many addresses have
been inserted into the last BF allocated to this PBF. Finally, a set of BFID i contain the IDs of BFs
from the Pool that have been allocated for this PBF. A single PBF can at most utilize all the BFs
in the Pool.
Given an address, a PBF supports two operations, namely checking if the address is present
(lookup), and inserting the address in the PBF (insertion). Deletion of addresses is not supported
56

in hardware, but is supported in software using the UT (Section 4.3.3).
A lookup of an address is done by performing individual lookups on all allocated bloom filters
in the series. An individual lookup is performed by hashing the address and intersecting the result
with the given bloom filter. If the intersection results in the empty set, the lookup goes on to the
next bloom filter, until all bloom filters have been searched or a match has been found. Note that
the sequential nature of the lookup can lead to significant delays. This can be ameliorated by
adding more ports to the Pool and intersection units to parallelize the lookup. However, we found
in our evaluation that a sequential lookup did not impact performance for the configuration we
tested, since the latency is rarely in the critical path, and the lookup is performed in a pipelined
manner.
An insertion is done only after first performing a lookup of the address in the PBF, to avoid
inserting duplicate addresses in two different bloom filters in a single PBF. If the lookup does not
find a match, the actual insertion is performed on the last bloom filter in the series indicated by
Cur. BF Num. The insertion is done by unioning the hash of the address into the given bloom
filter and re-inserting it back to the pool. Also, Cur. Element Num. is incremented to reflect the
increase in the number of elements. If the number of elements exceeds a certain threshold, given
by the desired false positive rate, a new bloom filter is allocated from the pool and assigned to the
next entry in the series and Cur. BF Num. is incremented. If the PBF fails to allocate a new bloom
filter due to overflow in the pool, the PBF enters a new mode where it starts to insert addresses
in existing bloom filters in the series in round robin fashion (the new mode is indicated by a zero
value in Cur. Element Num.). This ensures a graceful degradation of the false positive rate when
the pool has run out of bloom filters.
In this way, the PBF can flexibly allocate and maintain as many bloom filters as are needed
to achieve the desired false positive rate, without knowing in advance how many addresses would
need to be stored.
57

Range Cache
The RC portion of an entry is where marked addresses are stored when the program analysis
decides to mark a contiguous range of addresses. This is often done when a program reads I/O
data into a buffer during data flow analysis, for example. The RC contains a handful of ranges
that consists of start and end addresses. In our evaluation, we needed no more than 10 ranges per
RC. When two ranges overlap or are contiguous, the hardware automatically detects it and merges
them into a single range. As in the case of the PBF, only checking and marking of addresses need
be supported by the RC since unmarking is done through the Unmarked Table.
Unmarked Table
The Unmarked Table constitutes the software component of Touchstone. It is essentially a soft-
ware hash set data structure that stores all the addresses that have been unmarked for a particular
process ID and security level. Being a purely software data structure, it resides in regular memory.
Addresses are inserted into the table by a software handler whenever a program analysis unmarks
a location. Likewise, a software handler searches the table whenever a check in the Security Cache
results in a “marked” reply to make sure that the address has not been unmarked previously.
Further discussions on why this particular component was implemented in software and the
resulting trade-offs can be found in Section 4.5.1.
4.3.4 Detailed Operation
All RCs pertaining to a particular entry are always kept coherent through broadcasts whenever
their is an update to one of the RCs. While broadcasts are typically expensive, we can afford to
do this because RC updates typically happen only a handful of times during the initial stages of a
program when buffers are allocated and I/O data is read.
On the other hand, PBF updates are much more common, for example due to data propagation
in data flow analysis. Hence, keeping PBFs synchronous through broadcasts is not feasible. Instead
58

Is range?
Mark request
Yes
Contiguous w/existing range?
Yes
Merge w/existing range
No
Space in RC?
Send RC updatesto other processors
Receive RC update
Allocatenew range
Yes
Displace smallestrange into PBF
No
Done
Hit in RC?No
Invalidate cache linein other processors;
make line dirty
Hit in PBF?No No
Add address to PBF
Receive PBF update
Yes Yes
If exists,remove Unmarked
Table entry(s)
(a)
Check request
Hit in RC?
Hit in PBF?
No
No
Continue Normally
Hit inUnmarked
Table?
Yes
Yes
Call Fault Handler
Yes
No
Raise Trap
(b)
(c)Request dirty cache line
Done
For all entries inSecurity Cache
Piggyback PID andLevel on replyYes
Add line address to PBF ofentry in remote Security Cache
No
Hit in PBF?
(d)
Write-back dirty cache line
Done
For all entries inSecurity Cache
Piggyback PID andLevel on write-backYes
Add line address to PBF ofentry in Security Memory
No
Hit in PBF?
(e)
Figure 4.3: Flowcharts for actions taken by the Security Cache when (a) marking, (b) checking, and (c)unmarking memory addresses and when (d) sharing and (e) writing back dirty cache lines.
59

multiple PBFs in the system pertaining to an entry rely on the cache coherence protocol to keep
their contents coherent with respect to one another. The underlying principle is that while the
contents of all PBFs do not have to be always up-to-date, it must be up-to-date for all memory
locations that are in the processor’s local cache. This is so that all accesses to lines that are already
in the cache do not generate any extra coherence actions. When a new line is added to the local
cache due to a cache miss, the relevant information needed to update the PBF is piggybacked on
the cache coherence reply message and the PBF is updated lazily.
The actions and coherence actions required of the Security Cache for various scenarios is sum-
marized in Figure 4.3 in the form of flow charts. External events and coherence events are shown
in bold face.
Mark Algorithm
Refer to Figure 4.3(a). A program analysis can request marking of either a single address using
the mark addr instruction, or a range of addresses using the mark range instruction. The request
is forwarded to the appropriate SC entry with the given PID and Security Level.
If the request is due to a mark range instruction, the range is inserted into the RC of the given
entry. If the range is contiguous to or overlaps with an existing range, the requested range is
merged into the old range. Otherwise, a new range is allocated in the RC. If the RC is already full,
the smallest range in the RC is displaced and all the addresses included in the range is inserted
into the PBF of that entry. That way, no information is lost. After the local update of the RC is
performed, an RC update message is broadcast to all processors in the system so that they can
update their local RCs in the same manner.
If the request is due to a mark addr instruction, the SC checks whether that address hit in the
RC or the PBF. If it does, the address is already included in the SC and nothing more needs to be
done. If the result is a miss, the SC marks the cache line that contains the address dirty, if it is not
already so, which results in an invalidation of all cache lines in remote processors. This is done
to force a coherence request when other processors later attempt to access that cache line, which
60

serves as a chance to lazily update the address in the SC of that processor. After the coherence
action, the SC is ready to add that address to its local PBF.
Before wrapping up, Touchstone invokes a software handler to search for the marked address
in the Unmarked Table and removes the entry if found.
Besides the mark addr and mark range instructions, there are two more ways an address can be
marked in the SC, through coherence events. One is through an RC update broadcast received from
a remote SC. The other is through a lazy PBF update message piggybacked when the processor
attempts to bring a new line into the local cache. These two cases are handled in an identical way
to an explicit mark request with the exception that no further coherence events are generated.
Check Algorithm
Refer to Figure 4.3(b). For every program load or store access, Touchstone performs implicit
checks against all relevant SC entries. To this end, all entries with the correct PID and enabled
Security Levels are located and lookups of the RCs and PBFs are performed. A hit on either the
RC or the PBF results in a trap, after which a software handler is invoked that performs a lookup
of the Unmarked Table. A hit in the UT means this address has been unmarked since marking
and inserting into the SC, and hence the trap is ignored. A miss in the UT causes Touchstone to
return a “marked” reply to the program analysis via a user defined fault handler. Depending on
the analysis, the handler may signal a data race, propagate a taint, or perform some other analysis
specific action.
Note that these checks are rarely on the critical path of program execution, unless a check
results in a trap. No instruction in a program has any data or control dependencies on the result of
a check. Hence, as long as the processor pipeline is able to perform the check before it is ready to
retire the memory access (and decide whether to raise a trap or not), the check does not slow down
execution. Moreover, the check can happen in parallel with the actual memory access and as soon
as the address of the access becomes available. This allows the check to happen completely off the
critical path in most cases.
61

Unmark Algorithm
Refer to Figure 4.3(c). Unmarking of addresses happens entirely in software. When a program
analysis wants to unmark an address, Touchstone invokes a software handler to simply add that
address to the Unmarked Table.
Dirty Cache Line Request
Refer to Figure 4.3(d). The set of dirty cache lines in the local cache of a processor is the set of
lines that have potentially been marked by the SC due to an addition to an PBF. So when a dirty
cache line is requested by another processor, the cache line address must be looked up in all the
PBFs in the SC. This is because the address may not yet have been transferred to other SCs due to
Touchstone’s lazy approach to coherence. Hence, if the cache line address hits in the PBF of any
entry, the PID and the Security Level of that entry needs to be piggybacked onto the reply request.
Upon receiving the request, the remote SC adds the address to the PBF of the corresponding entry.
Nothing needs to be done for clean cache lines since marking an address in an PBF always entails
dirtying the cache line.
Dirty Cache Line Writeback
Refer to Figure 4.3(e). When a dirty cache line is written back from a processor’s local cache ei-
ther due to displacement or a downgrade, Touchstone has to be careful not to loose any monitoring
capability. That cache line address may not have been transferred to other SCs yet and when the
local cache loses ownership of the line, the SC loses the opportunity to synchronize its contents
through piggybacking on coherence requests in the future. Hence, if the cache line address hits
in the PBF of any entry in the SC, the PID and the Security Level of that entry needs to be pig-
gybacked onto the write-back request. Upon receiving the request, the Security Memory adds the
address to the PBF of the corresponding entry. Later when any other processor requests that cache
line, the Security Memory can then piggyback the relevant information on the reply.
62

4.3.5 Limitations
Touchstone allows no false negatives, meaning that all accesses to addresses marked by a program
analysis are caught and handled. However, Touchstone can potentially experience false positives.
False positives come from two sources:
• The nature of bloom filters. Even as we try to minimize false positives by growing the
PBF, bloom filters are by design prone to false positives and hence we can never completely
remove them.
• False sharing. Since Touchstone leverages cache coherence to achieve its goals, it marks the
addresses in the PBF at cache line granularity. Hence, even if the program analysis marked
a different word in the cache line, the application might still experience an extraneous trap
due to false sharing.
The implication is that Touchstone can only be used in cases where false positives are ac-
ceptable. However, it is worth noting that Touchstone is not the only scheme that produces false
positives. Previous software and hardware proposals for address tainting suffer from the same
problem [17, 22, 58, 63]. Fortunately, many program analyses can tolerate false positives, albeit
with some overhead.
For example, false positives in taint analyses can be handled by means of a fast software fault
handler which can quickly verify whether a hit in the PBF is a false alarm, as described by Ho
et al. [22]. False positives in data race prevention analyses can result in the prevention of certain
interleavings but are otherwise harmless, as described by Qi et al. [46]. False positives in data race
detection analyses can be verified by applying an exact software analysis on the given address and
instruction.
In theory, the target false positive rate of the PBF for a given program analysis could be set
individually, putting into consideration the associated overheads. However, such a study is beyond
the scope of this work.
63

4.4 Usage Model
This section discusses several potential uses for Touchstone. We mainly focus on two important
uses: taint analysis and concurrency bug detection. For taint analysis, we look at a version that
uses just data flow analysis and also a version that uses both data flow and control flow analysis.
For concurrency bug detection, we look at one important type of concurrency bug: asymmetric
data races.
4.4.1 Taint Analysis
Taint analysis attempts to enhance security by disallowing certain data to be used for potentially
dangerous purposes (as part of a database SQL query for example). To do this, taint analysis
“taints” untrusted data at its source and propagates the taint alongside the data as the program
executes. The taint has to be propagated whenever a value is transferred from one location to
another and hence software implementations suffer from high runtime overheads [10, 48, 40].
Much of the overhead comes from querying whether a memory location has been tainted or not,
and every memory access requires a query even if typically only a miniscule proportion of locations
are tainted. We can virtually remove this overhead by using Touchstone by using the SC to perform
a quick check in the background, without involving the processor.
Taint analysis comes in two flavors. One that relies only on data flow analysis and one that
relies on both control flow and data flow analyses. The former propagates a taint only on data
dependencies and the latter propagates a taint also on control dependencies. Naturally, the latter
provides stronger protection compared to the former but suffers from higher overhead.
int a, b, c;
// only a is tainted at the beginning
b = a+2;
c = b*2;
Figure 4.4: Example of Data flow analysis
64

int a, x, y;
// only a is tainted at the beginning
If (a>10) {
x = 1;
}
else {
x = 2;
}
y = 10;
Figure 4.5: Example of Control flow analysis
Figure 4.4 shows an example of propagation through a data dependence. Assume a is already
tainted. As the value in a gets copied to b and c, both locations also get tainted. Figure 4.5 shows
an example of propagation through a control dependence. Again, assume that a is initially tainted.
Although a’s value is not involved in the computation of x, the outcome of the branch would affect
the value of x. Therefore, the taint is also propagated to location x. On the other hand, y would not
be tainted because its value doesn’t depend on the value of a in any way.
Typically memory accesses rarely land on tainted locations but all sources of data transfers
need to be checked anyway. In Figure 4.4, even if a was clean to start with, checks have to be
performed on a and b because they are sources of data transfers. Using Touchstone, software only
needs to mark tainted locations and the checks are done automatically by the SC. If an access lands
on a tainted location, a trap will be raised and the software handler can take the appropriate action,
which may include propagating the taint. When a tainted location is overwritten using clean data,
the location is unmarked.
4.4.2 Asymmetric Data Races
Asymmetric data race is a type of harmful race which occurs when at least one of the racing
threads is inside a synchronization-protected critical section[46]. Figure4.6 shows an example of
asymmetric data race.
In the past, several schemes have been proposed to detect and prevent asymmetric data races[46,
65
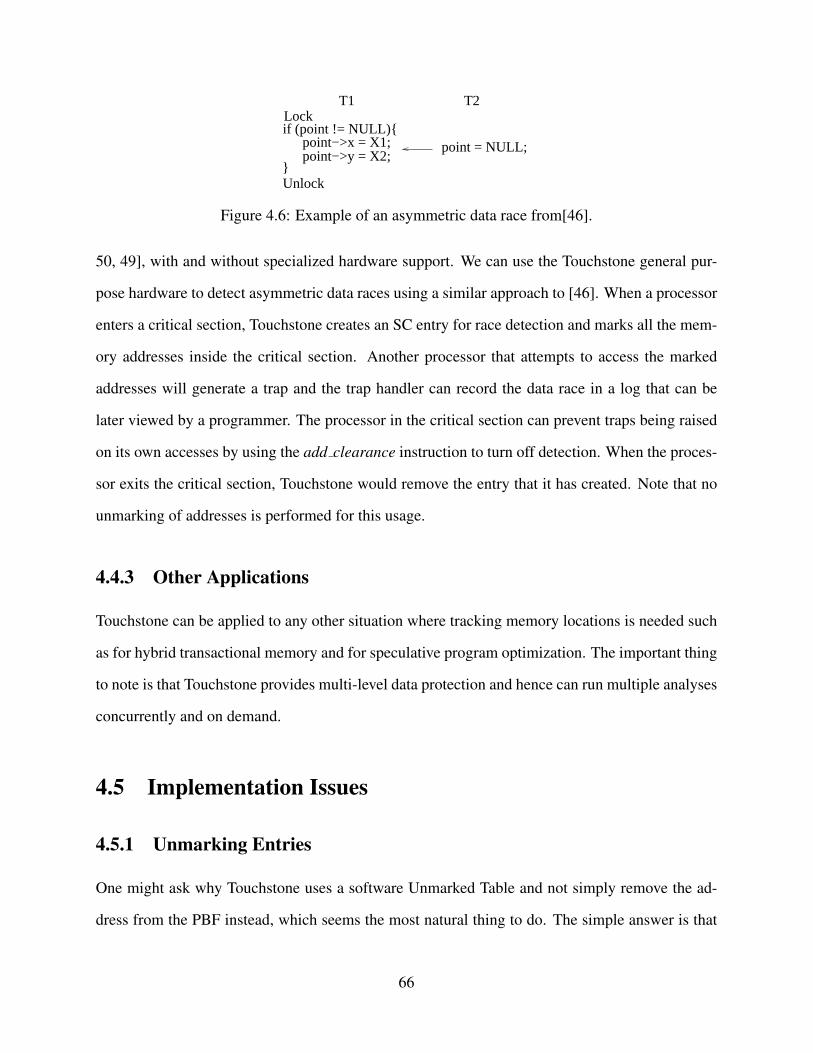
T1 T2Lockif (point != NULL){ point−>x = X1; point−>y = X2;}Unlock
point = NULL;
Figure 4.6: Example of an asymmetric data race from[46].
50, 49], with and without specialized hardware support. We can use the Touchstone general pur-
pose hardware to detect asymmetric data races using a similar approach to [46]. When a processor
enters a critical section, Touchstone creates an SC entry for race detection and marks all the mem-
ory addresses inside the critical section. Another processor that attempts to access the marked
addresses will generate a trap and the trap handler can record the data race in a log that can be
later viewed by a programmer. The processor in the critical section can prevent traps being raised
on its own accesses by using the add clearance instruction to turn off detection. When the proces-
sor exits the critical section, Touchstone would remove the entry that it has created. Note that no
unmarking of addresses is performed for this usage.
4.4.3 Other Applications
Touchstone can be applied to any other situation where tracking memory locations is needed such
as for hybrid transactional memory and for speculative program optimization. The important thing
to note is that Touchstone provides multi-level data protection and hence can run multiple analyses
concurrently and on demand.
4.5 Implementation Issues
4.5.1 Unmarking Entries
One might ask why Touchstone uses a software Unmarked Table and not simply remove the ad-
dress from the PBF instead, which seems the most natural thing to do. The simple answer is that
66

bloom filters, by design, only allows the insertion of elements and does not allow removal once
they are inserted. One might imagine using a counting bloom filter instead, which enables inser-
tion and removal by using an array of counters instead of an array of bits. However, elements can
only be safely removed from a counting bloom filter only when one can guarantee that the element
has been inserted in the past. Doing a membership test is not a safe guarantee of insertion since
membership tests can result in false positives. If an element that has not been inserted is removed,
this can result in false negatives which is unacceptable in most program analyses.
Moreover, it is often hard to tell whether an element has been inserted into the PBF or not.
In taint analysis for example, if a memory location has been overwritten with untainted data and
the address needs to be unmarked, there is no way of knowing for sure whether the location has
been tainted in the first place. One could query the SC, but again, membership tests in PBFs can
generate false positives.
Hence, using the Unmarked Table to maintain the exact set of unmarked addresses is the only
way of avoiding false negatives. While software hash sets can potentially be expensive, two facts
work to our advantage: 1) the number of addresses unmarked is typically very small for all the
program analyses we have studied which keeps the size of the hash set compact and 2) the pro-
portion of accesses to marked addresses is typically also small and hence the table is not accessed
very frequently.
For example, for taint analysis, a study by Qin et al. [48] found that only 1.32% of total memory
accesses were to marked addresses. As to asymmetric data race detection, there is no need for
unmarking addresses in the first place (See Section 4.4.2).
4.5.2 Virtualization / Context Switch
Since there is only a limited number of entries in the SC, the SC can potentially overflow with
enough processes and security levels. At such an event, the least recently used entry with a PID
that is different from the currently executing process is selected for displacement. We cannot
simply discard the displaced entry however, since the PBF of the entry may contain addresses
67
that have not yet been transferred to other SCs. Hence, before we discard the entry, we check
each dirty cache line in the private cache to see if the line address hits in the PBF of the entry
and perform a write-back to memory in that case. This will automatically transfer the address to
Security Memory and thus prevent the loss of monitoring capability.
As to the RC of the entry, the contents are already replicated in other processors so monitoring
continues uninterrupted. Also, software maintains the list of ranges it marked in the RC separately
as part of the process descriptor so that no information is lost.
Touchstone attaches very little additional complexity to context switches. Since SC entries
are tagged with PIDs, they need not be swapped out on a context switch and can remain there.
Typically, the only thing the OS needs to do on a context switch is to do set pid to update the
PID that is internally stored in the SC. To handle the rare case where an entry for the switched in
process has been displaced, the OS issues is entry valid for each security level that is active. In the
case where an entry is found missing, the OS adds the entry to the SC again and re-populates its
RC with the list of ranges in the process descriptor. The PBF of the entry need not be re-populated
since all addresses have been already transferred to the Security Memory at displacement.
4.6 Related Work
4.6.1 Memory Protection Schemes
There are several approaches using hardware to provide memory protection [19, 70, 77, 67, 57, 4,
59]. The most relevant one is a recent work by Greathouse et al. [19]. It demonstrated a hardware
scheme to provide an unlimited number of fine-grain data watchpoints for protection. The key idea
was to use a range cache and a bitmap cache to protect certain memory addresses. It showed that
this approach could be used for several software analyses including data race detection and taint
analysis. However, this approach does not support multi-processor systems very well. It uses a
software handler to broadcast every update to the range cache and bitmap cache. In comparison,
68

Touchstone relies on cache coherence to prevent most updates. Also, it requires complex software
to do the translation between the range cache and bitmap cache. Moreover, although this work
does provide general hardware for multiple software analyses, it is not clear how it can be used for
running multiple analysis at the same time. In comparison, Touchstone can use multiple PBFs to
run any number of program analyses concurrently.
Mondrian Memory Protection[70](MMP) is a hardware scheme which provides fine-grained
inter-process protection and is optimized for applications that do not perform frequent updates. The
memory protection information meta-data is stored in main memory and cached in a buffer called
PLB. In general, this design is not suitable for applications which need frequent updates. Also,
MMP is not design for multi-processor systems and neither can it support multiple concurrent
program analyses.
FlexiTaint [67] uses a separate cache(TPC) to separate taint information from the correspond-
ing data. However, on a TPC miss, an exception would be raised and a software handler has to deal
with the miss. In comparison, Touchstone uses a hierarchy of Security Caches and Security Mem-
ories coupled with cache coherence to avoid expensive exceptions and calls to software handlers
in similar situations. Moreover, FlexiTaint requires invasive changes to the processor pipeline to
do taint propagation and can only run a single analysis at one time.
Another common method of storing protection data is to put it alongside cache lines and mem-
ory [57, 4, 59, 77]. For these approaches, typically they use 2 bits for the security tag so that they
can not be used for running multiple analyses concurrently or providing multi-level data protec-
tion. And also, these approaches cannot provide no way of quickly marking a range of memory
locations.
4.6.2 Concurrency Bug Detection Schemes
In recent years, there have been many hardware schemes proposed for concurrency bug detection,
including data race detection and atomicity violation detection [44, 46, 34, 78, 33]. Unfortunately
most of them require special hardware to handle a specific concurrency bug. Touchstone provides a
69

general hardware framework which is flexible enough to be used by software to detect concurrency
bugs of various types, even concurrently.
4.7 Conclusion
This chapter proposed Touchstone, the first microarchitectural memory-access monitoring scheme
that (i) can monitor accesses for several uses at the same time, and (ii) leverages the multicores
hardware cache coherence to keep its metadata coherent across threads with negligible overhead.
Touchstone provides multi-level support for starting to monitor a location, stopping to monitor
it, and checking if a reference accesses it. Touchstone’s metadata is kept on a per-processor Se-
curity Cache (SC) in the cache hierarchy that is kept coherent in hardware. To store the moni-
tored addresses compactly, Touchstone introduced the Pooled Bloom Filter (PBF). The PBF is a
bloom-filter-based hardware structure that dynamically adapts to the number of elements inserted,
expanding its size on the fly. This capability is needed for new types of uses, where we do not
know in advance the rough number of addresses to be inserted in the filter.
To show Touchstone’s flexibility, we evaluated it with three concurrent uses: data-flow based
taint analysis, data- and control-flow based taint analysis, and asymmetric data-race detection.
We ran the SPLASH-2 codes with 8 threads on a simulated multicore. The results showed that
Touchstone added minimal overhead. The execution overhead was, on average, only 3.6%. The
storage overhead was at most 7KB in the per-processor SC plus 17KB in main memory. The SC
could be powered-on gradually, as longer PBFs are needed. If, instead, we used conventional
bloom filters, the corresponding storage overhead would be 12KB in the per-processor SC (which
would all be powered-on for the whole run) plus 24KB in main memory.
70

Chapter 5
Evaluation
In this chapter we evaluate our work. The chapter will start with the evaluation of Pacman, then
Falcon and finally it will end with Touchstone.
5.1 Pacman
Architecture CMP with 4 or 8 processorsCoherence protocol Snoopy basic-MESI on 64byte busProcessor type 2-issue, in-order, 1GHzSigTable parameters From Figure 2.8. Max: 8 rowsPrivate L1 cache 32Kbytes, 4-way asso., 64byte linesSignature size 1,024 bitsPrivate L2 cache 512Kbytes, 8-way assoc., 64byte linesSignature structure 8 128-bit Bloom filters with H3L1 hit latency 2 cycles round tripCycle detection latency 4-14 cyclesL2 hit latency 8 cycles round tripH-Block1 latency 2 cyclesL2 miss latency 30 cycles round trip to other L2sH-Block2 latency 2 cyclesL2 miss latency 250 cycles round trip to memory
Table 5.1: Default architectural parameters.
To evaluate Pacman, we instrument parallel application binaries with Intel’s Pin framework
connected to a cycle-by-cycle execution-driven architecture simulator based on SESC [51]. The
simulator models a chip multiprocessor (CMP) with 4 or 8 processors. The default parameters
of the architecture are shown in Table 5.1. The processors are two-issue, in-order, and overlap
memory accesses with instruction execution. Each processor has a private cache hierarchy kept
coherent by a basic MESI coherence protocol on an on-chip bus. The bus is connected to the
71

SigTable and to off-chip main memory. Unless otherwise indicated, the sizes of the fields in
a SigTable entry are those shown in Figure 2.8. To generate a signature, Pacman uses 8 128-bit
Bloom filters in parallel using the H3 hash function from [53], for a total of 1,024 bits per signature.
CS Max #Clean #Sig Max # Max CS# Dynamic Insts #Insts #Insts #Rd #Wr disps addrs sig addrs nesting
Category Application CS (%) per CS in CS per CS per CS per CS per CS in CS level
SPLASH-2 cholesky 6,957 0.0 30.3 161 10.7 4.7 0.0 6.4 11 1Kernels fft 32 0.3 33.9 47 11.9 10.5 0.1 5.8 7 1
lu/contiguous 272 0.0 36.1 47 12.6 10.7 0.0 6.0 7 1lu/non cont. 80 0.0 35.2 47 12.4 10.5 0.1 5.8 8 1radix 78 0.0 26.1 47 9.4 8.4 0.0 5.9 7 1
SPLASH-2 barnes 68,938 0.4 118.1 1,898 40.1 29.3 0.0 11.9 56 1Apps fmm 44,622 0.2 142.1 252 54.7 27.9 0.0 13.4 21 1
ocean/cont. 4,432 0.0 31.5 45 11.8 9.6 0.0 6.8 9 1ocean/non cont. 4,312 0.0 30.9 45 11.8 9.5 0.0 5.9 7 1radiosity 273,087 0.9 18.2 1,226 8.7 5.9 0.0 5.6 89 5raytrace 95,475 0.3 29.3 6,661 7.5 5.8 0.0 6.0 343 1volrend 72,524 0.0 12.1 50 5.0 3.0 0.0 4.9 8 1water-nsquared 6,292 0.0 50.3 51 34.4 12.4 0.0 17.0 18 1water-spatial 157 0.0 23.8 47 9.6 7.0 0.0 6.0 9 1
PARSEC canneal 4 0.0 7.0 10 2.5 3.5 0.0 3.3 4 1Kernels dedup 17,932 0.1 315.9 802 121.2 67.9 0.1 14.4 33 1
streamcluster 52,128 0.0 21.0 32 7.1 4.8 0.0 3.2 5 1
PARSEC blackscholes 0 – – – – – – – – –Apps bodytrack 8,273 0.0 37.0 1,228 15.6 11.1 0.0 6.9 34 1
facesim 7,921 0.0 37.0 154 18.0 9.9 0.0 5.4 11 2ferret 733 0.0 19.2 44 5.4 7.2 0.0 5.0 9 2fluidanimate 2,113,870 0.7 15.9 32 10.2 4.1 0.0 8.0 10 1raytrace 73 0.0 7.8 31 2.6 2.3 0.0 2.2 6 1swaptions 0 – – – – – – – – –vips 14,056 0.0 49.0 6,723 18.6 11.8 0.0 8.0 106 23x264 4,071 0.0 10.6 39 5.9 1.7 0.0 4.0 6 1
Other Apache 8,301 0.4 24.4 40 9.7 5.3 0.0 5.6 8 1Apps Sphinx3 94,382 3.5 208.5 2,946 86.7 29.1 0.1 6.0 243 2
Table 5.2: Characteristics of the critical sections (CS) in the applications.
For sensitivity analysis, we consider two cache hierarchy models, namely one where each
processor only has an L1 cache, and one where it has both a private L1 and a private L2. The first
model puts more pressure on Pacman.
We evaluate Pacman with all the 14 SPLASH-2 applications, the 12 PARSEC applications that
support pthreads, the Sphinx3 speech recognition software [54], and Apache-2.2.3. The SPLASH-
2 codes use their default inputs, while the PARSEC ones use the simmedium inputs. For Sphinx3,
we use the test input provided, which executes over 500 million instructions, while for Apache, we
set up clients that keep sending requests to the server, so that the server executes around 40 million
72

instructions.
In our evaluation, we slightly modify the Canneal and Ferret applications. At the beginning of
Canneal, a thread uses a critical section to initialize a large memory space — even though there
is no other active thread at that time. Consequently, we turn off Pacman during that time. In
Ferret, each thread initializes a random number generator within a critical section. Since only the
seed is a shared variable, we move the local-variable accesses in the random number generator
initialization routine outside of the critical section. If we did not do these changes, the statistics on
critical section sizes (Section 5.1.1) would be biased. In addition, for Ferret, if we inserted all the
local-variable addresses into the signature, we could potentially induce, through address aliasing
in the signatures, false positive conflicts with other threads, and unnecessarily stall them.
In the rest of this section, we characterize the critical sections, evaluate the overheads of Pac-
man, and examine the asymmetric data races discovered by Pacman.
5.1.1 Characterization of the Critical Sections
Table 5.2 characterizes the critical sections in all 28 applications on the 4-processor CMP. Column
3 lists the number of dynamic critical sections in each program. Column 4 shows the percentage
of the dynamic instructions in the programs that are inside the critical sections. We see that all
programs but Sphinx3 execute less than 1% of their instructions in critical sections. The percentage
in Sphinx3 is 3.5%. Columns 5 and 6 show the average and maximum number, respectively,
of instructions executed per critical section. We see that the applications tend to have modest-
sized critical sections. Most applications execute less than 100 instructions per critical section on
average. The maximum number of instructions in a critical section reaches nearly 7,000 in Vips.
Columns 7-8 list the average number of reads and writes per critical section.
Columns 9-11 correspond to the architecture with only the L1 caches. They show, per critical
section, the average number of clean line displacements, and the average and maximum number of
line addresses included in the signature. We can see that the average number of clean displacements
per critical section is close to zero. This means that this effect is minor. The average number of
73

line addresses included in a signature per critical section is typically less than 10 and, except for a
few cases, the maximum number is not much higher. These numbers suggest that the probability
of false positives in the signatures is low. Note that for the machine with both L1 and L2 caches,
these numbers will be smaller. This is because caches keep more state.
The last column shows the maximum nesting level of critical sections. A value more than one
means that the application has nested locks. We can see that most applications have a value of one.
Only Radiosity and Vips, which have a recursive structure, have significantly deeper levels.
Overall, given the typical sizes and properties of the critical sections observed, we believe that a
simple solution for asymmetric race detection is enough. Pacman provides such a simple solution.
5.1.2 Overheads of Pacman
There are two sources of execution overhead in Pacman. The first one is that some processors
receive Nacks and have to retry. The second one is additional network traffic created by three
event types: a notification message in a clean displacement inside a critical section, a retry after a
Nack, and the extra message in a successful lock acquire or release that hits on a cache line that is
in Dirty or Exclusive state.
Table 5.3 quantifies these effects for each application. Columns 3-8 show the total number of
Nacks observed during the execution of the application. For each application, we performed 3-5
runs, and show the maximum number of Nacks seen in any individual run. The data corresponds
to the architecture with L1 caches only, which is the worst case. Columns 3-5 correspond to 4-
processor runs, while Columns 6-8 correspond to 8-processor runs. For Apache, since the server
automatically sets the number of threads to a number larger than 8, we put the data under the 8-
thread columns. In each group of three columns, the first one shows the Nacks observed due to
true conflicts (i.e., two threads access the same variable), the second one the Nacks due to true
conflicts or false sharing, and the last one the Nacks due to true conflicts, false sharing, or false
positives.
The number of Nacks is very small. Only FMM and Bodytrack exhibit Nacks due to true
74

Number of Nacks Number of Nacks Increase in Increase in Sync hits(L1 only, 4 threads) (L1 only, 8 threads) traffic with traffic with per dyn
Category Application True True+ True+ True True+ True+ L1 only (%) L1+L2 (%) inst (%)FS FS+FP FS FS+FP
SPLASH-2 cholesky 0 0 0 0 0 0 0.0 0.0 0.00Kernels fft 0 0 0 0 0 0 0.0 0.0 0.00
lu/contiguous 0 0 0 0 0 0 0.0 0.0 0.00lu/non cont. 0 0 0 0 0 0 0.0 0.0 0.00radix 0 0 0 0 0 0 0.0 0.0 0.00
SPLASH-2 barnes 0 2 4 0 2 4 0.0 0.3 0.01Apps fmm 1 1 1 1 1 1 0.0 0.1 0.00
ocean/contiguous 0 0 0 0 0 0 0.0 0.0 0.00ocean/non cont. 0 0 0 0 0 0 0.0 0.0 0.00radiosity 0 13 15 0 28 32 1.0 1.4 0.04raytrace 0 0 4 0 0 6 0.0 0.1 0.01volrend 0 0 0 0 0 0 0.0 0.1 0.00water-nsquared 0 0 0 0 0 0 0.0 0.1 0.00water-spatial 0 0 0 0 0 0 0.0 0.0 0.00
PARSEC canneal 0 0 0 0 0 0 0.0 0.0 0.00Kernels dedup 0 0 0 0 2 2 0.1 0.2 0.00
streamcluster 0 0 0 0 0 0 0.0 0.0 0.00
PARSEC blackscholes 0 0 0 0 0 0 0.0 0.0 -Apps bodytrack 1 1 2 1 1 2 0.0 0.0 0.00
facesim 0 0 0 0 0 0 0.0 0.0 0.00ferret 0 0 0 0 0 0 0.0 0.0 0.00fluidanimate 0 0 0 0 0 0 1.5 2.4 0.05raytrace 0 0 0 0 0 0 0.0 0.0 0.00swaptions 0 0 0 0 0 0 0.0 0.0 -vips 0 0 2 0 0 3 0.0 0.0 0.00x264 0 0 0 0 0 0 0.0 0.0 0.00
Other Apache - - - 0 3 8 0.3 0.5 0.02Apps Sphinx3 0 4 6 0 10 14 0.8 1.1 0.02
Table 5.3: Quantifying the sources of overhead in Pacman.
conflicts. Each of them has one Nack. False sharing and false positives increase the number of
Nacks. The highest number is 32 for Radiosity. This is negligible compared to the 454M dynamic
instructions executed by Radiosity. Overall, the impact of any processor stall due to Nacks is
negligible.
Columns 9-10 show the percentage increase in the network traffic due to the three effects listed
above. Column 9 applies to the architecture with L1 caches only, while Column 10 applies to
the one with L1 and L2. The data shows that the increase in traffic is very small. In the worst
application, the increase is 1.5% for the case of L1 caches and 2.4% for the case of L1 and L2
caches. These low numbers result from the fact that critical sections have a modest size and account
for a small fraction of the execution time. Overall, the impact of this extra traffic is negligible.
Column 11 shows the number of successful lock acquires and releases that hit on a cache line
75
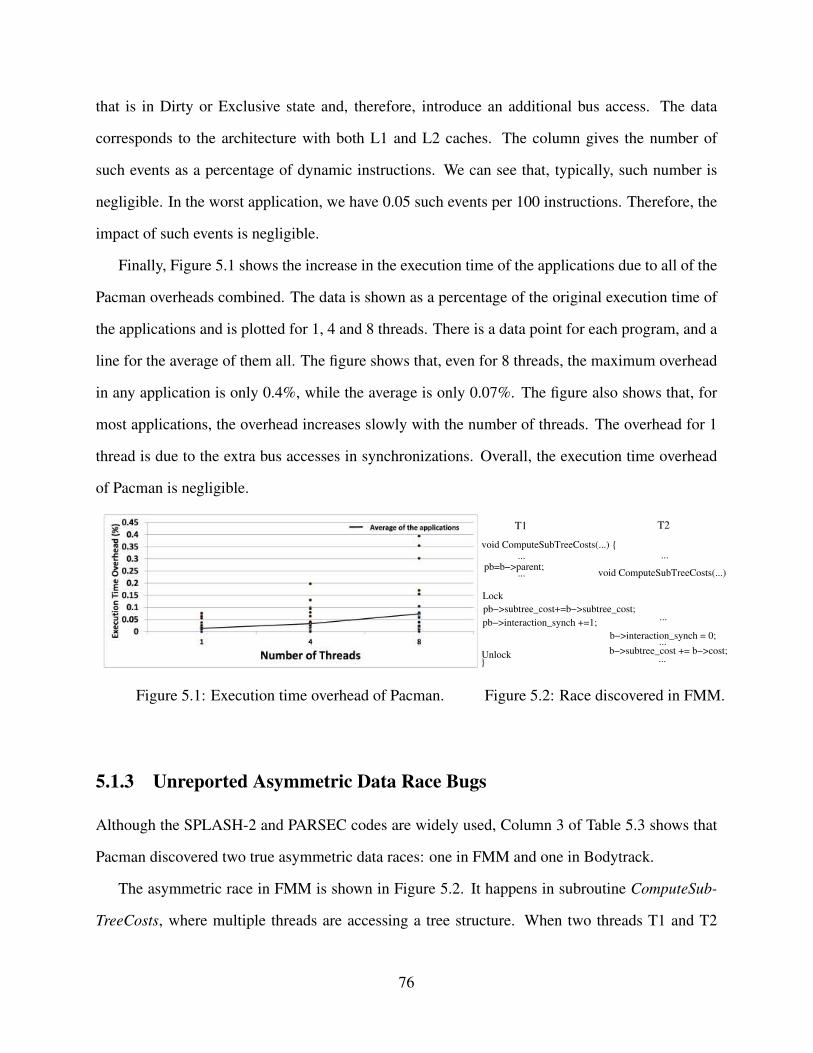
that is in Dirty or Exclusive state and, therefore, introduce an additional bus access. The data
corresponds to the architecture with both L1 and L2 caches. The column gives the number of
such events as a percentage of dynamic instructions. We can see that, typically, such number is
negligible. In the worst application, we have 0.05 such events per 100 instructions. Therefore, the
impact of such events is negligible.
Finally, Figure 5.1 shows the increase in the execution time of the applications due to all of the
Pacman overheads combined. The data is shown as a percentage of the original execution time of
the applications and is plotted for 1, 4 and 8 threads. There is a data point for each program, and a
line for the average of them all. The figure shows that, even for 8 threads, the maximum overhead
in any application is only 0.4%, while the average is only 0.07%. The figure also shows that, for
most applications, the overhead increases slowly with the number of threads. The overhead for 1
thread is due to the extra bus accesses in synchronizations. Overall, the execution time overhead
of Pacman is negligible.
Figure 5.1: Execution time overhead of Pacman.
Unlock
void ComputeSubTreeCosts(...) {
T1
...
...
Lock
pb=b−>parent;
pb−>interaction_synch +=1;
T2
...
void ComputeSubTreeCosts(...) {
...
...
...
b−>interaction_synch = 0;
pb−>subtree_cost+=b−>subtree_cost;
b−>subtree_cost += b−>cost;}
Figure 5.2: Race discovered in FMM.
5.1.3 Unreported Asymmetric Data Race Bugs
Although the SPLASH-2 and PARSEC codes are widely used, Column 3 of Table 5.3 shows that
Pacman discovered two true asymmetric data races: one in FMM and one in Bodytrack.
The asymmetric race in FMM is shown in Figure 5.2. It happens in subroutine ComputeSub-
TreeCosts, where multiple threads are accessing a tree structure. When two threads T1 and T2
76

are concurrently executing the subroutine, it may be that the two point to the same node from two
different places (pb in T1 is the same as b in T2), and an asymmetric data race can happen.
The asymmetric race in Bodytrack happens between subroutine Condition::Wait, where vari-
able nWakeupTickets is read and written inside a critical section, and subroutine Condition::
NotifyOne, where it is written outside any critical section.
5.2 Falcon
In this section, we evaluate Falcon including SW-IF and HW-IF. We start by describing our ex-
perimental setup (Section 5.3.1). Then, we characterize the IF statements in the applications
(Section 5.2.2), and evaluate the execution overhead of our algorithms (Section 5.2.3), their ef-
fectiveness at detecting new data race bugs (Section 5.2.4), and the sensitivity of SW-IF to the
delay inserted at Confirmation points (Section 5.2.5).
5.2.1 Experimental Setup
We use the Cetus source-to-source compiler [26] to analyze and transform applications for SW-IF
and HW-IF. Cetus uses its intermediate representation tree and call graph to find the IF state-
ments that access shared locations. It then instruments them with either Confirmation points or
Watch/Unwatch instructions.
For SW-IF, we run the applications with 8 threads on a desktop with 4 2-context Intel Xeon
cores running at 2.33 GHz. For HW-IF, since there is no hardware that implements the AWT
watchpoint table described in Section 3.5.2, we instrument the application code with PIN and call
an execution-driven, cycle-level architectural simulator. The simulator models a chip multiproces-
sor (CMP) with 4 or 8 processors and a memory subsystem. The simulator intercepts the Watch
and Unwatch instructions and emulates the AWT.
Each AWT entry is 62-bit long, and contains the line address, processor-ID, and Valid bit.
Although a watched IF statement only accesses 1.6 locations on average, we conservatively have
77
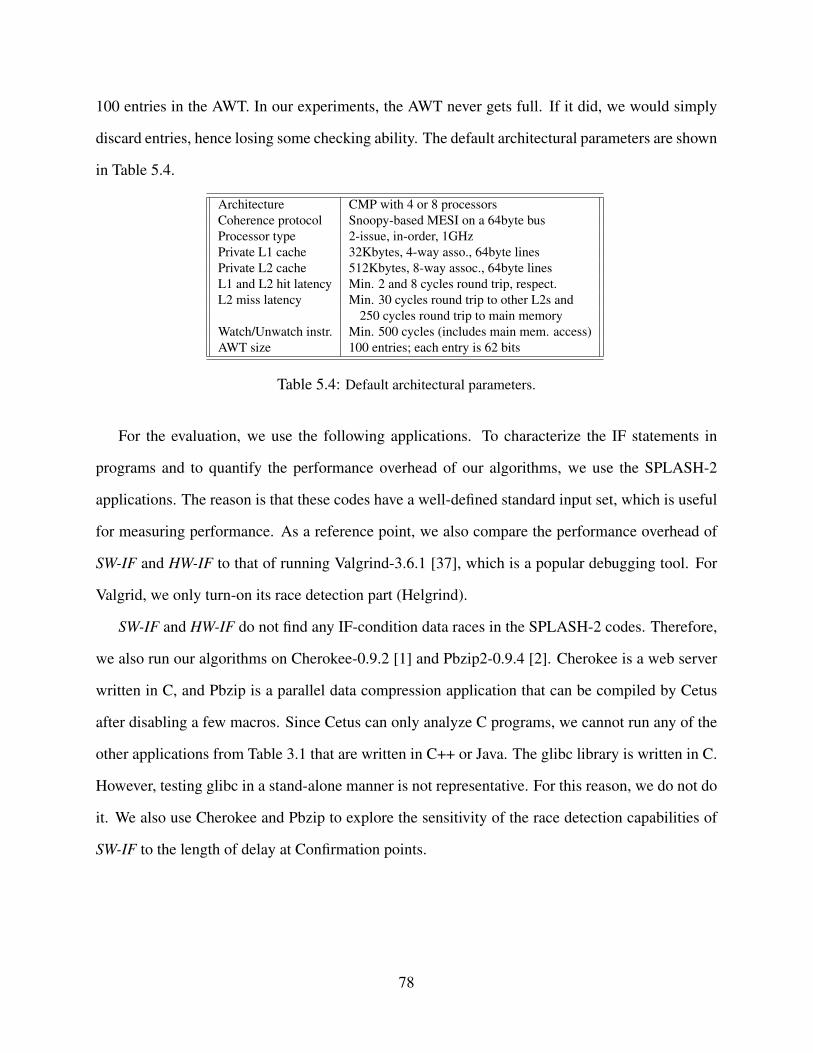
100 entries in the AWT. In our experiments, the AWT never gets full. If it did, we would simply
discard entries, hence losing some checking ability. The default architectural parameters are shown
in Table 5.4.
Architecture CMP with 4 or 8 processorsCoherence protocol Snoopy-based MESI on a 64byte busProcessor type 2-issue, in-order, 1GHzPrivate L1 cache 32Kbytes, 4-way asso., 64byte linesPrivate L2 cache 512Kbytes, 8-way assoc., 64byte linesL1 and L2 hit latency Min. 2 and 8 cycles round trip, respect.L2 miss latency Min. 30 cycles round trip to other L2s and
250 cycles round trip to main memoryWatch/Unwatch instr. Min. 500 cycles (includes main mem. access)AWT size 100 entries; each entry is 62 bits
Table 5.4: Default architectural parameters.
For the evaluation, we use the following applications. To characterize the IF statements in
programs and to quantify the performance overhead of our algorithms, we use the SPLASH-2
applications. The reason is that these codes have a well-defined standard input set, which is useful
for measuring performance. As a reference point, we also compare the performance overhead of
SW-IF and HW-IF to that of running Valgrind-3.6.1 [37], which is a popular debugging tool. For
Valgrid, we only turn-on its race detection part (Helgrind).
SW-IF and HW-IF do not find any IF-condition data races in the SPLASH-2 codes. Therefore,
we also run our algorithms on Cherokee-0.9.2 [1] and Pbzip2-0.9.4 [2]. Cherokee is a web server
written in C, and Pbzip is a parallel data compression application that can be compiled by Cetus
after disabling a few macros. Since Cetus can only analyze C programs, we cannot run any of the
other applications from Table 3.1 that are written in C++ or Java. The glibc library is written in C.
However, testing glibc in a stand-alone manner is not representative. For this reason, we do not do
it. We also use Cherokee and Pbzip to explore the sensitivity of the race detection capabilities of
SW-IF to the length of delay at Confirmation points.
78

5.2.2 IF Statement Characterization
We first try to understand the structure of the IF statements. For this experiment, we use SW-IF
with delay insertion. Table 5.5 lists the total number of IF statements in the codes and the number
of checked (i.e., monitored) IF statements — both the static number seen in the source code and the
dynamic number observed at runtime. We see that about a third of all the dynamic IF statements
are checked on average.
Apps # IF Statements # Checked IF StatementsStatic Dynamic Static Dynamic
Radiosity 357 12246807 216 3225037Water nsquared 63 13210272 39 13134311Water spatial 111 8995819 48 4955930Ocean con 518 141680 313 16794Ocean non 302 141676 235 8170Cholesky 283 834469 200 715804FFT 60 804 55 35LU cont 92 13620 79 12387LU non 64 449 58 285Radix 51 121 31 45Barnes 90 1686857 62 777343FMM 308 33421676 238 1432271Raytrace 354 8530683 159 3128360Average 204 6094225 133 2108213
Table 5.5: Static and dynamic number of IF statements.
Figure 5.3 characterizes the dynamic IF statements further. It breaks the number of dynamic
IF statements into Checked, SharedNoCheck, and PrivateOnly. Checked are those that are instru-
mented with data race checks; SharedNoCheck are those that have a shared location access in the
condition expression but are not instrumented due to compiler limitations; PrivateOnly are those
that only have accesses to private locations in the condition expression and thus do not need checks.
The figure shows that SW-IF checks almost all of the IF statements that have shared accesses. It
misses only 3% of the cases.
Figure 5.4 shows the fraction of checked dynamic IF statements that have delays inserted in
them to expose data races. The figure breaks the number of checked dynamic IF statements into
those that receive delays (Delayed) and those that do not, to minimize overhead. The Loop, Recur-
sive, and Lock categories show the cases where the IF statement did not receive a delay because it
was (i) in a loop, (ii) in a recursive call but not in a loop, and (iii) in a critical section but not in any
79

Radiosity
Water-nsquared
Water-spatial
Ocean_con
Ocean_non
Cholesky
FFTLU
_contLU
_nonR
adixBarnesFM
MR
aytraceAVER
AGE
0102030405060708090
100
# D
ynam
ic IF
Sta
tem
ents
(%
)
PrivateOnlySharedNoCheckChecked
Figure 5.3: Fraction of dynamic IF statements that are checked.
of the prior categories. The figure shows that SW-IF inserts delays in about 20% of the dynamic
checks on average. The main reason why this number is not higher is due to IF statements inside
loops.
Radiosity
Water-nsquared
Water-spatial
Ocean_con
Ocean_non
Cholesky
FFTLU
_contLU
_nonR
adixBarnesFM
MR
aytraceAVER
AGE
0102030405060708090
100
# D
ynam
ic C
heck
ed IF
Sta
tem
ents
(%)
LockRecursiveLoopDelayed
Figure 5.4: Checked dynamic IF statements that receive delays.
Further study shows that up to 45% of all the static checks in the source code are instrumented
with delays. This indicates that our delay insertion algorithm does a good job of instrumenting
many IF statements in the source code. Techniques such as sampling loop iterations for delay
insertion can be used to further increase coverage while controlling the overhead.
80

5.2.3 Performance Overhead
We now evaluate the performance overhead of SW-IF and HW-IF. To evaluate SW-IF, we run
the instrumented applications natively using 8 threads. We consider two scenarios: SW-IF is the
binary instrumented with Confirmation points but without any delays; SW-IFdelay is the binary in-
strumented with Confirmation points and 15 microsecond delays for the appropriate Confirmation
points as described in Section 3.4. This scenario is for when we want to expose new interleavings.
We compare the execution time to running the original uninstrumented binary (Original). As a
reference, we also show the execution time of the applications running on Helgrind, which is the
race detection part of Valgrind. While it is clear that Helgrind is a much more general data race
detector than SW-IF, it gives a reference data point. The results are shown in Figure 5.5 where, for
each application, the bars are normalized to Original.
Radiosity
Water-nsquared
Water-spatial
Ocean_con
Ocean_non
Cholesky
FFT
VolrendLU
_contLU
_nonR
adixBarnesFM
M
Raytrace
AVERAG
E
0
0.2
0.4
0.6
0.8
1.0
1.2
Nor
mal
ized
Exe
cutio
n T
ime
OriginalSW-IFSW-IFdelayHelgrind
2387 231 232 118 31 1141 349 61725 13 72
Figure 5.5: Execution time of the applications under SW-IF.
From the figure, we see that the average performance overhead of SW-IF is 2%. This is a very
low overhead, which shows that SW-IF could even be used in an on-the-fly production environ-
ment. SW-IFdelay has an average performance overhead of 6%, which is small enough to keep the
turnaround time for debugging and testing very low.
We also see that Helgrind has a much higher performance overhead. This is because it runs
sequentially and uses a general algorithm that can find many classes of races.
To evaluate HW-IF, we run 4- and 8-threaded applications on the architecture simulator de-
81

scribed in Section 5.3.1. The results are shown in Figure 5.6. The bars show the execution time
overhead of running the application on a machine with HW-IF hardware over one without HW-IF
hardware.
We see that, on average, the execution overhead is less than 1% for both 4 and 8 threads. This
makes HW-IF perfectly suitable for on-the-fly production environments.
Radiosity.4
Radiosity.8
Water-nsquared.4
Water-nsquared.8
Water-spatial.4
Water-spatial.8
Ocean-cont.4
Ocean-cont.8
Ocean-non.4
Ocean-non.8
Cholesky.4
Cholesky.8
FFT.4FFT.8Volrend.4Volrend.8LU
-cont.4LU
-cont.8LU
-non.4LU
-non.8R
adix.4R
adix.8Barnes.4Barnes.8FM
M.4
FMM
.8R
aytrace.4R
aytrace.8AVER
AGE.4
AVERAG
E.8
0
1
2
3
4
Exe
cutio
n O
verh
ead
(%)
Stalls due to NacksInstruction overhead
Figure 5.6: Execution time overhead of the programs under HW-IF. The figure shows data for 4- and8-threaded runs.
The execution time overhead shown in Figure 5.6 is broken down into two components: Stalls
due to Nacks and Instruction overhead. The Stall overhead is due to delays incurred by processors
when they are issuing bus requests that are Nacked by the AWT. The instruction overhead refers
to slowdowns incurred by processors when they are executing Watch and Unwatch instructions,
or when they suffer additional cache misses due to them. We can see from the results that the
stalls due to Nacks cause negligible overhead; the overhead primarily comes from the Watch and
Unwatch instructions.
There is no standard input set for Cherokee and Pbzip2. However, if we use the same input set
as in Yu et al. [73], the measured execution time overhead for Cherokee and Pbzip2 is 3.2% and
1.4%, respectively, for SW-IFdelay; 1.1% and 0.6%, respectively, for SW-IF; and 0.8% and 0.4%,
respectively, for HW-IF. These are small overheads.
82
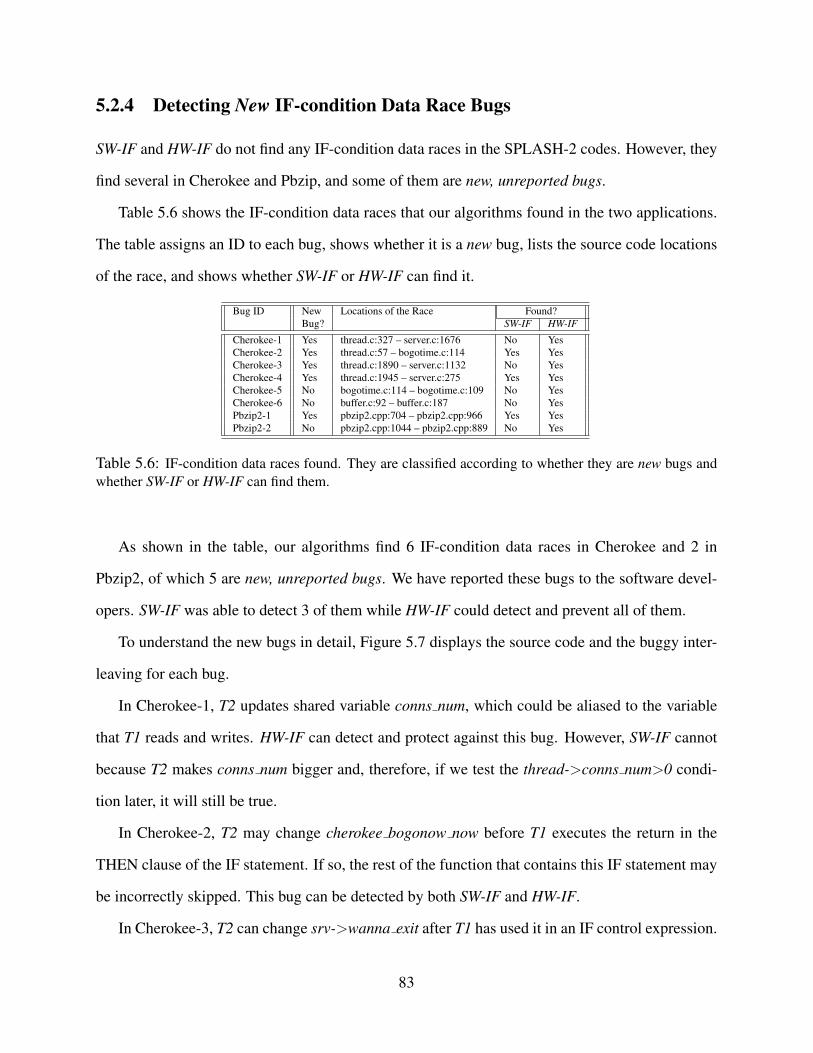
5.2.4 Detecting New IF-condition Data Race Bugs
SW-IF and HW-IF do not find any IF-condition data races in the SPLASH-2 codes. However, they
find several in Cherokee and Pbzip, and some of them are new, unreported bugs.
Table 5.6 shows the IF-condition data races that our algorithms found in the two applications.
The table assigns an ID to each bug, shows whether it is a new bug, lists the source code locations
of the race, and shows whether SW-IF or HW-IF can find it.
Bug ID New Locations of the Race Found?Bug? SW-IF HW-IF
Cherokee-1 Yes thread.c:327 – server.c:1676 No YesCherokee-2 Yes thread.c:57 – bogotime.c:114 Yes YesCherokee-3 Yes thread.c:1890 – server.c:1132 No YesCherokee-4 Yes thread.c:1945 – server.c:275 Yes YesCherokee-5 No bogotime.c:114 – bogotime.c:109 No YesCherokee-6 No buffer.c:92 – buffer.c:187 No YesPbzip2-1 Yes pbzip2.cpp:704 – pbzip2.cpp:966 Yes YesPbzip2-2 No pbzip2.cpp:1044 – pbzip2.cpp:889 No Yes
Table 5.6: IF-condition data races found. They are classified according to whether they are new bugs andwhether SW-IF or HW-IF can find them.
As shown in the table, our algorithms find 6 IF-condition data races in Cherokee and 2 in
Pbzip2, of which 5 are new, unreported bugs. We have reported these bugs to the software devel-
opers. SW-IF was able to detect 3 of them while HW-IF could detect and prevent all of them.
To understand the new bugs in detail, Figure 5.7 displays the source code and the buggy inter-
leaving for each bug.
In Cherokee-1, T2 updates shared variable conns num, which could be aliased to the variable
that T1 reads and writes. HW-IF can detect and protect against this bug. However, SW-IF cannot
because T2 makes conns num bigger and, therefore, if we test the thread->conns num>0 condi-
tion later, it will still be true.
In Cherokee-2, T2 may change cherokee bogonow now before T1 executes the return in the
THEN clause of the IF statement. If so, the rest of the function that contains this IF statement may
be incorrectly skipped. This bug can be detected by both SW-IF and HW-IF.
In Cherokee-3, T2 can change srv->wanna exit after T1 has used it in an IF control expression.
83

if(thd−>bogo_now
== cherokee_bogonow_now)
.bufsize<1 ||...){
return;
thread−>conns_num−−;
if (thread−>conns_num >0)
T1 T2Source Code
BugID
if(unlikely(srv−>wanna_exit))
thd−>exit = true;
if ((thd−>exit==false)&& ...)){
}
if(OutputBuffer[currBlock]
usleep(50000);
}
Cherokee−2
Cherokee−1
Cherokee−3
Cherokee−4
Pbzip2−1
step_MULTI_THREAD_block(thd, ...);
conns_num += THREAD(thread)
−>conns_num;
cherokee_bogonow_now = newtime;
srv−>wanna_exit= true;
THREAD(i)−>exit = true;
OutputBuffer[blockNum]
.bufSize=outSize;
Figure 5.7: Description of the new IF-condition data races found by SW-IF and HW-IF.
Since the latter contains the function call unlikely with potential side-effects, SW-IF cannot be
used. Hence, only the HW-IF scheme can detect this bug.
Cherokee-4 and Pbzip2-1 are similar to Cherokee-2 in that T2 can change the value of the IF
control expression while T1 is executing the THEN clause. For Cherokee-4, the result would be
an unnecessary block, whereas for Pbzip2-1, the result would be an unnecessary sleep. Both bugs
can be detected with SW-IF and HW-IF.
It is important to note that while SW-IF missed some IF-condition data races (false negatives)
due to the limitations described in Table 3.2, it did not suffer from any false positives: all races
reported by SW-IF were actual races. On the other hand, HW-IF was able to detect and prevent all
the IF-condition races that were reported by Helgrind. While HW-IF did suffer from the occasional
false positive due to false sharing and read-read conflicts in the AWT (as described in Table 3.2),
false positives only result in Nacks. These Nacks had negligible impact on performance as we saw
in Section 5.2.3.
Finally, Helgrind is also able to find the data races in Table 5.6. However, when we ran Hel-
grind, we obtained messages for hundreds of data races — many of which have low importance.
It took us several days to analyze the log.
84

5.2.5 Sensitivity of SW-IF to Delays
Previous work [15] showed that adding delays at strategic points is beneficial when trying to expose
data races. Hence, we do the same experiments as in the previous section with SW-IF but insert
delays at Confirmation points of the Delay&Monitor set. We add 15us of sleep time at every
instance. Our goal is to extend the time that SW-IF is able to detect the races.
We find that SW-IFdelay finds exactly the same number of data races as the baseline SW-IF,
namely those of Table 5.6. It seems, therefore, that delays are not important for exposing IF-
condition data races for the particular applications we use.
5.3 Touchstone
In this section, we evaluate Touchstone.
5.3.1 Evaluation Setup
To evaluate Touchstone, we instrument parallel application binaries with Intel’s PIN framework
[28] connected to a cycle-by-cycle execution-driven architecture simulator based on SESC [51].
The simulator models a chip multiprocessor (CMP) with 8 processors and a memory subsystem.
The default architectural parameters are shown in Table 5.7. The processors are two-issue, in-
order, and overlap memory accesses with instruction execution. Each processor has a private cache
hierarchy kept coherent by a basic MESI coherence protocol on an on-chip bus. The Security
Cache is near the L1 which can be accessed in parallel with the L1.
For the Security Caches, we use a pool of 7 1-Kbyte bloom filters. Each security cache entry
contains 10 ranges in the Range Cache and 7 BFIDs in the Pooled Bloom Filter. We target a
theoretical 1% false positive rate in the PBF, which translates to a maximum of 850 elements per
bloom filter if we assume a random distribution. The latency to access the Security Cache is 2
cycles plus 1 cycle per additional bloom filter in the PBF, due to the sequential nature of lookups.
85

The RC can be accessed in parallel with the PBF and hence does not add to the latency. As
described previously, each PBF initially starts with a single bloom filter and is expanded if needed
as more addresses are added.
For the Security Memory, we use a pool of 17 1-Kbyte bloom filters. We reserve more bloom
filters in the SM since it typically requires more bloom filters than individual SCs. This is because
displaced lines from all SCs in the system need to be stored in the SM. Accordingly, each PBF
in the SM has 17 BFIDs. Also, a 500 cycle access latency is added due to the round trip to the
memory module where the SM resides in. Otherwise, all other parameters are identical to that for
the Security Cache.
Architecture CMP with 8 processorsCoherence protocol Snoopy-based MESI on a 64byte busProcessor type 2-issue, in-order, 1GHzPrivate L1 cache 32Kbytes, 4-way asso., 64byte lines
L1 Cache hit latency 2 cycles round tripPrivate Security Cache
Bloom Filter Pool size 7 1-Kbyte bloom filtersAccess latency 2 cycles + 1 cycle per additional bloom filter
Private L2 cache 512Kbytes, 8-way assoc., 64byte linesL2 hit latency 8 cycles round tripRemote L2 hit latency 30 cycles round trip
Main Memory latency 500 cycles round tripSecurity Memory SizeSecurity Memory Size
Bloom Filter Pool size 17 1-Kbyte bloom filtersAccess latency 500 cycles + 1 cycle per additional bloom filter
Table 5.7: Default architectural parameters.
We evaluate three usages for Touchstone, taint analysis based on data flow (DF), taint analysis
based on data flow and control flow (DFCF) and asymmetric data race detection (AR). For taint
analysis, we implemented a system similar to DYTAN [10] optimized using Touchstone. We ran
all three program analyses simultaneously for all experiments to test the versatility of Touchstone.
We used the entire suite of SPLASH-2 applications with reference inputs to evaluate the three
usage models. For DF and DFCF, we considered all input data to be tainted.
86

Radiosity
Water-nsquared
Water-spatial
Ocean-cont
Ocean-non
Cholesky
FFTVolrendLU
-contLU
-nonR
adixBarnesFM
MR
aytraceAVER
AGE
0
1
2
3
4
5
6
7
8
Exe
cutio
n O
verh
ead
(%)
???
Figure 5.8: Overhead of Touchstone
5.3.2 Experimental Results
Figure 5.8 shows the performance overhead of Touchstone when running DF, DFCF and AR at the
same time. The baseline is running these analyses with an ideal scheme which performs checks on
memory locations with zero overhead. With 8 processors, the maximum overhead in SPLASH-2
is 7.3%, while the average is only 3.6%. The overhead mainly came from software accesses to
the Unmarked Table. All accesses that hit in the Security Cache needs to be checked against the
Unmarked Table.
We further analyze the overhead in Table 5.8 and Figure 5.9.
Table 5.8 shows the increase in the number of accesses to the L1 and L2 caches. The additional
accesses mostly comes from accesses to the Unmarked Table. In the worst case, the number of L1
accesses increases by 8.57%. However, these additional clean table accesses have good locality,
and most of them hit the L1 cache. Hence, the increase in L2 accesses is typically lower than the
increase in L1 accesses.
Figure 5.9 shows the increase in network traffic on the on-chip bus. Again, most of this traffic
came from accesses to the Unmarked Table. Another potential source of traffic is the coherence
87

actions taken when marking addresses in the PBF. But it turns out that, for taint analysis, almost all
locations are written immediately before being marked so the lines cache lines are already dirty by
the time Touchstone tries to mark them. Hence this effect was minimal. We measured the traffic
in terms of the total number of transactions on the bus. The maximum increase in traffic was 7.6%
with the average increase being 4%.
L1 access increase (%) L2 access increase (%)fft 2.25 0.25barnes 3.10 1.21cholesk 6.35 4.37fmm 3.53 1.56lucontiguous 2.98 0.97lunon cont 2.87 0.84oceancontiguous 7.76 3.45oceannon cont 8.57 3.53radiosity 2.75 0.83radix 7.58 2.2raytrace 4.17 2.15volend 6.41 4.43water-nsquared 1.08 0.93water-spatial 1.16 0.87
Table 5.8: Cache access increase percentage.
Radiosity
Water-nsquared
Water-spatial
Ocean-cont
Ocean-non
Cholesky
FFTVolrendLU
-contLU
-nonR
adixBarnesFM
MR
aytraceAVER
AGE
0
1
2
3
4
5
6
7
8
Net
wor
k T
raffi
c In
crea
se (
%)
???
Figure 5.9: Network traffic increase due to Touchstone
88

5.3.3 False Positives
Touchstone doesn’t allow false negative. However, false positives can still occur due to encoding
in the bloom filter and cache line false sharing. filter, it will cause false positive. The false positive
rate is shown in Figure 5.10.
0
0.5
1
1.5
2
2.5
Fa
lse
Po
siti
ve (
%)
DF
DFCF
Figure 5.10: False positive of Touchstone
Even though we target a theoretical maximal false positive rate of 1%, sometimes we get a
rate that is larger than 1% due to the effects of false sharing. If we did not have false sharing, the
false positive rate would always be lower than 1%. In any case, on average we achieve a low false
positive rate of 1.3% for DF and 1.4% for DFCF. The false positive number includes accesses to
tainted locations that are propagated from a location that has been tainted due to a false positive.
The false positive rate for AS was negligible since the number of addresses that needed to be
marked in a critical section was very small.
5.3.4 Size of Security Cache and Security Memory
Touchstone is the first hardware scheme which uses a growable bloom filter. As more elements
are inserted to the Scalable Bloom Filter, more space is allocated to maintain the 1% false positive
rate.
89

0
1
2
3
4
5
6
7
8
Spac
e Ove
rhea
d of
Sec
urity
Cac
he (K
B)
DFDFCFARDF+DFCF+AR
Figure 5.11: Space requirement for Security Cache
0
10
20
30
40
50
60
70
80
90
Spac
e o
verh
ead
of
Secu
rity
C
ach
e (
KB
) With range cache
Without rangecache
Figure 5.12: Space requirement for Security Cache
Figure 5.11 shows the space requirements for Security Cache to achieve the target 1% false
positive rate when DF, DFCF and AR are run separately and when they are run together simulta-
neously (DF+DFCF+AR). This shows how many bloom filters in the pool were allocated for each
scenario, in terms of kilobytes. Since critical sections typically involve a handful of addresses, the
space requirement for AR is very small and 1 KB PBFs are always sufficient. The space require-
ments of DF and DFCF are more significant but the maximum requirement reaches only 4 KB in
the worst case and 2.5 KB in the average case.
Due to the flexibility of the pooled structure of the PBFs, Touchstone is able to handle the most
stressful case (DF+DFCF+AR) with just 7 bloom filters (or 7 KBs) in the pool. In contrast, had
we used regular bloom filters, we would have needed 4 KB * 3 = 12 KB of space to achieve a
similar false positive rate (since the maximum space needed per analysis was 4 KB). The savings
90

0
2
4
6
8
10
12
14
16
18
Spac
e O
verh
ead
of S
ecur
ity
Mem
ory(
KB)
DF
DFCF
AR
DF+DFCF+AR
Figure 5.13: Space requirement for Security Memory
in space can increase dramatically as more analyses with differing space requirements are added
to the scenario.
Also, note that in the cases where not all 7 bloom filters are used in the pool, the unused
bloom filters can be powered down to save energy. This is another dimension in flexibility that is
not achievable using regular bloom filters. Even when a bloom filter is populated very sparsely,
there is no way to partially power down a single bloom filter. Although we do not evaluate the
power requirements directly, one can see that the number of bits that need to be turned on has high
variance across applications and scenarios. On average, only 5.3 KB would need to be powered on
out of the 7 KB.
Figure 5.13 shows the space requirements for Security Memory using identical scenarios. Us-
ing the same reasoning as in the Security Cache, we would have needed 8 KB * 3 = 24 KB of space
using regular bloom filters. Using PBFs, Touchstone was able to achieve a similar false positive
rate using just 17 KB of space. Also, on average, only 10.1 KB would need to be powered on out
of the 17 KB, resulting in significant energy savings.
Lastly, we evaluate the impact of Range Caches by calculating the space requirements for Secu-
rity Cache with and without Range Caches in Figure 5.12. We use the most stressful DF+DFCF+AR
scenario for the evaluation. Using only PBFs, Security Cache would require much more space. The
pool would have to provisioned for a maximum usage of 80 KB, and on average 53 KB of it would
have to be turned on. The main reason is that, in SPLASH-2, the input data we mark as tainted
91

usually comes in large contiguous data structures such arrays and matrices. These memory loca-
tions are conducive to marking using ranges which is much more space efficient compared to PBFs
in these cases. This shows that Range Caches are a necessary part of our design.
92

Chapter 6
Conclusion
Parallel programing is hard. Lots of dynamic analyses are designed to ensure programming cor-
rectness. This thesis proposes to add some extra hardware that can reduce the false positive and the
performance overhead of the dynamic software analyses. First, it proposes to detect asymmetric
data races, which is a type of harmful data race. Then it goes on to detect another type of harmful
data race - IF-Condition data race. Finally, it proposes a novel hardware framework which can
reduce the performance overhead for a set of dynamic analyses.
93

References
[1] Cherokee Web Server. http://www.cherokee-project.com/.
[2] Parallel BZIP2. http://compression.ca/pbzip2/.
[3] Advanced Micro Devices. AMD64 Architecture Programmers Manual Volume 32 SystemProgramming Guide, May 2013.
[4] Lee Baugh, Naveen Neelakantam, and Craig Zilles. Using hardware memory protection tobuild a high-performance, strongly-atomic hybrid transactional memory. In Inter. Symp. onComputer Architecture, June 2008.
[5] Burton H. Bloom. Space/time trade-offs in hash coding with allowable errors. Comm. of theACM, 13(7):422–426, 1970.
[6] Michael D. Bond, Katherine E. Coons, and Kathryn S. McKinley. PACER: Proportionaldetection of data races. In PLDI ’10, 2010.
[7] Luis Ceze, James Tuck, Pablo Montesinos, and Josep Torrellas. Bulksc: bulk enforcement ofsequential consistency. In ISCA, 2007.
[8] Luis Ceze, James Tuck, Josep Torrellas, and Calin Cascaval. Bulk disambiguation of spec-ulative threads in multiprocessors. In International Symposium on Computer Architecture,June 2006.
[9] Jong-Deok Choi, Keunwoo Lee, Alexey Loginov, Robert O’Callahan, Vivek Sarkar, andManu Sridharan. Efficient and precise datarace detection for multithreaded object-orientedprograms. In Programming Language Design and Implementation, June 2002.
[10] James Clause, Wanchun Li, and Alessandro Orso. Dytan: a generic dynamic taint analysisframework. In Proceedings of the 2007 international symposium on Software testing andanalysis, ISSTA ’07, 2007.
[11] David E. Culler, Anoop Gupta, and Jaswinder Pal Singh. Parallel Computer Architecture: AHardware/Software Approach. Morgan Kaufmann Publishers Inc., 1997.
[12] Leonardo Dagum and Ramesh Menon. OpenMP: An industry-standard API for shared-memory programming. IEEE Computational Science & Engineering, 5(1):46–55, 1998.
94

[13] Joseph Devietti, Benjamin P. Wood, et al. RADISH: Always-on sound and complete racedetection in software and hardware. In ISCA ’12, 2012.
[14] Dawson Engler and Ken Ashcraft. RacerX: Effective, static detection of race conditions anddeadlocks. In SOSP, October 2003.
[15] John Erickson, Madan Musuvathi, Sebastian Burckhardt, and KirkOlynyk. Effective data-race detection for the kernel. In OSDI. Slides inusenix.org/event/osdi10/tech/slides/erickson.pdf, October 2010.
[16] John Erickson, Madanlal Musuvathi, Sebastian Burckhardt, and Kirk Olynyk. Effective data-race detection for the kernel. In Op. Sys. Des. and Impl., Feb 2010.
[17] Malay Ganai, Dongyoon Lee, and Aarti Gupta. Dtam: dynamic taint analysis of multi-threaded programs for relevancy. In Proceedings of the ACM SIGSOFT 20th InternationalSymposium on the Foundations of Software Engineering, FSE ’12, 2012.
[18] Joseph Greathouse. Hardware Mechanisms for Distributed Dynamic Software Analysis. PhDthesis, 2012.
[19] Joseph L. Greathouse, Hongyi Xin, Yixin Luo, and Todd Austin. A case for unlimited watch-points. In Proceedings of the seventeenth international conference on Architectural Supportfor Programming Languages and Operating Systems, ASPLOS ’12, 2012.
[20] Mark Andrew Heinrich. The performance and scalability of distributed shared-memorycache coherence protocols. PhD thesis, Stanford University, CA, USA, 1999.
[21] Maurice Herlihy and J. Eliot B. Moss. Transactional memory: Architectural support forlock-free data structures. In ISCA, May 1993.
[22] Alex Ho, Michael Fetterman, Christopher Clark, Andrew Warfield, and Steven Hand. Prac-tical taint-based protection using demand emulation. In Proceedings of the 1st ACM SIGOP-S/EuroSys European Conference on Computer Systems 2006, EuroSys ’06, 2006.
[23] Intel Corporation. Intel 64 and IA-32 Architectures Software Developer’s Manual. Volume3B: System Programming Guide, Part II.
[24] Intel Corporation. Intel Thread Checker.http://www.intel.com, 2008.
[25] Intel Corporation. Intel 64 and IA-32 Architectures Software Developer’s Manual. Volume3B: System Programming Guide, Part II, October 2011.
[26] Sang Lee, Troy A. Johnson, and Rudolf Eigenmann. Cetus - An Extensible Compiler Infras-tructure for Source-to-Source Transformation. In LCPC’03, 2003.
[27] Shan Lu, Soyeon Park, et al. Learning from mistakes: A comprehensive study on real worldconcurrency bug characteristics. In ASPLOS’08, 2008.
95

[28] Chi-Keung Luk et al. Pin: Building customized program analysis tools with dynamic in-strumentation. In Conference on Programming Language Design and Implementation, June2005.
[29] Ewing Lusk, James Boyle, Ralph Butler, Terrence Disz, Barnett Glickfeld, Ross Overbeek,James Patterson, and Rick Stevens. Portable programs for parallel processors. Holt, Rinehart& Winston, 1988.
[30] Daniel Marino, Madanlal Musuvathi, and Satish Narayanasamy. LiteRace: Effective sam-pling for lightweight data-race detection. In PLDI ’09, 2009.
[31] Sang L. Min and Jong-Deok Choi. An efficient cache-based access anomaly detectionscheme. In International Conference on Architectural Support for Programming Languagesand Operating Systems, April 1991.
[32] Chi Cao Minh et al. An effective hybrid transactional memory system with strong isolationguarantees. In ISCA, 2007.
[33] Abdullah Muzahid, Norimasa Otsuki, and Josep Torrellas. AtomTracker: A ComprehensiveApproach to Atomic Region Inference and Violation Detection. In Proceedings of the 201043rd Annual IEEE/ACM International Symposium on Microarchitecture, MICRO ’43, 2010.
[34] Abdullah Muzahid, Dario Suarez, Shanxiang Qi, and Josep Torrellas. SigRace: Signature-based data race detection. In ISCA, June 2009.
[35] Mayur Naik, Alex Aiken, and John Whaley. Effective static race detection for Java. In PLDI,June 2006.
[36] Satish Narayanasamy, Zhenghao Wang, Jordan Tigani, Andrew Edwards, and Brad Calder.Automatically classifying benign and harmful data races using replay analysis. In Program-ming Language Design and Implementation, June 2007.
[37] Nicholas Nethercote and Julian Seward. Valgrind: A framework for heavyweight dynamicbinary instrumentation. In PLDI ’07, 2007.
[38] Robert H. B. Netzer and Barton P. Miller. Detecting data races in parallel program executions.In In Workshop on Advances in Languages and Compilers for Parallel Computing, pages109–129, 1990.
[39] Robert H. B. Netzer and Barton P. Miller. Improving the accuracy of data race detection. InPrinciples and Practice of Parallel Programming, April 1991.
[40] James Newsomei and Dawn Xiaodong Song. Dynamic taint analysis for automatic detection,analysis, and signature generation of exploits on commodity software. In NDSS 2005, 2005.
[41] Robert O’Callahan and Jong-Deok Choi. Hybrid dynamic data race detection. In Principlesand Practice of Parallel Programming, June 2003.
96

[42] Gilles Pokam, Klaus Danne, Cristiano Pereira, Rolf Kassa, Tim Kranich,Hu, Shiliang, Jusin E. Gottschlich, Nima Honarmand, Nathan Dautenhahn, Sam King, andJosep Torrellas. Quickrec: Prototyping an intel architecture extension for record and replayof multithreaded programs. In Proceedings of the 40th annual international symposium onComputer architecture, ISCA ’13, 2013.
[43] Polyvios Pratikakis, Jeffrey S. Foster, and Michael Hicks. Locksmith: Context-sensitivecorrelation analysis for race detection. In PLDI’06, June 2006.
[44] Milos Prvulovic. CORD: Cost-effective (and nearly overhead-free) order-recording and datarace detection. In International Symposium on High-Performance Computer Architecture,February 2006.
[45] Milos Prvulovic and Josep Torrellas. ReEnact: Using thread-level speculation mechanismsto debug data races in multithreaded codes. In International Symposium on Computer Archi-tecture, June 2003.
[46] Shanxiang Qi, Norimasa Otsuki, Lois Orosa Nogueira, Abdullah Muzahid, and Josep Torrel-las. Pacman: Tolerating asymmetric data races with unintrusive hardware. In Proceedings ofthe 2012 IEEE 18th International Symposium on High-Performance Computer Architecture,HPCA ’12, 2012.
[47] Feng Qin, Joseph Tucek, Jagadeesan Sundaresan, and Yuanyuan Zhou. Rx: Treating bugs asallergies—a safe method to survive software failures. In SOSP, October 2005.
[48] Feng Qin, Cheng Wang, Zhenmin Li, Ho-seop Kim, Yuanyuan Zhou, and Youfeng Wu. Lift:A low-overhead practical information flow tracking system for detecting security attacks. InProceedings of the 39th Annual IEEE/ACM International Symposium on Microarchitecture,MICRO 39, 2006.
[49] Sriram Rajamani, G. Ramalingam, Venkatesh Prasad Ranganath, and Kapil Vaswani. ISO-LATOR: Dynamically ensuring isolation in concurrent programs. In ASPLOS, March 2009.
[50] Paruj Ratanaworabhan, Martin Burtscher, Darko Kirovski, Ben Zorn, Rahul Nagpal, andKarthik Pattabiraman. Detecting and tolerating asymmetric races. In PPoPP, February 2009.
[51] Jose Renau, Basilio Fraguela, James Tuck, Wei Liu, Milos Prvulovic, Luis Ceze, SmrutiSarangi, Paul Sack, Karin Strauss, and Pablo Montesinos. SESC Simulator, January 2005.http://sesc.sourceforge.net.
[52] Michiel Ronsse and Koen De Bosschere. RecPlay: A fully integrated practical record/replaysystem. ACM Transactions on Computer Systems, 17(2):133–152, 1999.
[53] Daniel Sanchez, Luke Yen, Mark D. Hill, and Karthikeyan Sankaralingam. Implementingsignatures for transactional memory. In International Symposium on Microarchitecture, De-cember 2007.
97

[54] Ruchira Sasanka, Man-Lap Li, Sarita V. Adve, Yen-Kuang Chen, and Eric Debes. ALP:Efficient support for all levels of parallelism for complex media applications. ACM TACO, 4,March 2007.
[55] Stefan Savage, Michael Burrows, Greg Nelson, Patrick Sobalvarro, and Thomas Anderson.Eraser: A dynamic data race detector for multithreaded programs. ACM Transactions onComputer Systems, 15(4):391–411, 1997.
[56] Douglas C. Schmidt and Tim Harrison. Double-checked locking: An optimization pattern forefficiently initializing and accessing thread-safe objects. In Patt. Lang. of Prog. Des. Conf.,1996.
[57] Arrvindh Shriraman and Sandhya Dwarkadas. Sentry: light-weight auxiliary memory accesscontrol. In Proceedings of the 37th annual international symposium on Computer architec-ture, ISCA ’10, 2010.
[58] Manu Sridharan and Rastislav Bodık. Refinement-based context-sensitive points-to analysisfor java. In Proceedings of the 2006 ACM SIGPLAN conference on Programming languagedesign and implementation, PLDI ’06, 2006.
[59] G. Edward Suh, Jae W. Lee, David Zhang, and Srinivas Devadas. Secure program executionvia dynamic information flow tracking. In Proceedings of the 11th international conferenceon Architectural support for programming languages and operating systems, ASPLOS-XI,2004.
[60] Sun Microsystems. Sun Studio Thread Analyzer.http://developers.sun.com/sunstudio, 2007.
[61] Chen Tian, Vijay Nagarajan, et al. Dynamic recognition of synchronization operations forimproved data race detection. In ISSTA ’08, 2008.
[62] Mohit Tiwari, Banit Agrawal, Shashidhar Mysore, Jonathan Valamehr, and Timothy Sher-wood. A small cache of large ranges: Hardware methods for efficiently searching, storing,and updating big dataflow tags. MICRO 41, 2008.
[63] Omer Tripp, Marco Pistoia, Stephen J. Fink, Manu Sridharan, and Omri Weisman. Taj:effective taint analysis of web applications. In Proceedings of the 2009 ACM SIGPLANconference on Programming language design and implementation, PLDI ’09, 2009.
[64] Dan Tsafrir, Tomer Hertz, et al. Portably solving file TOCTTOU races with hardness ampli-fication. In FAST’08, 2008.
[65] James Tuck, Wonsun Ahn, Luis Ceze, and Josep Torrellas. Softsig: software-exposedhardware signatures for code analysis and optimization. SIGARCH Comput. Archit. News,36(1):145–156, 2008.
[66] Kaushik Veeraraghavan, Peter M. Chen, Jason Flinn, and Satish Narayanasamy. Detectingand surviving data races using complementary schedules. In SOSP, October 2011.
98

[67] Guru Venkataramani, Ioannis Doudalis, Yan Solihin, and Milos Prvulovic. Flexitaint: Aprogrammable accelerator for dynamic taint propagation. In In 14th International Symposiumon HighPerformance Computer Architecture (HPCA-14), 2008.
[68] Christoph von Praun and Thomas R. Gross. Object race detection. In Object-Oriented Pro-gramming, Systems, Languages, and Applications, October 2001.
[69] Jinpeng Wei and Calton Pu. TOCTTOU vulnerabilities in UNIX-style file systems: Ananatomical study. In FAST’05, 2005.
[70] Emmett Witchel, Josh Cates, and Krste Asanovic. Mondrian memory protection. In Pro-ceedings of the 10th international conference on Architectural support for programming lan-guages and operating systems, ASPLOS-X, 2002.
[71] Jingyue Wu, Heming Cui, and Junfeng Yang. Bypassing races in live applications withexecution filters. In OSDI, October 2010.
[72] Luke Yen et al. LogTM-SE: Decoupling hardware transactional memory from caches. InHPCA, 2007.
[73] Jie Yu and Satish Narayanasamy. A case for an interleaving constrained shared-memorymulti-processor. In ISCA ’09, 2009.
[74] Yuan Yu, Tom Rodeheffer, and Wei Chen. RaceTrack: Efficient detection of data race condi-tions via adaptive tracking. In Symposium on Operating Systems Principles, October 2005.
[75] Jiaqi Zhang, Weiwei Xiong, et al. ATDetector: improving the accuracy of a commercial datarace detector by identifying address transfer. In MICRO-44 ’11, 2011.
[76] Wei Zhang, Chong Sun, and Shan Lu. ConMem: Detecting severe concurrency bugs throughan effect-oriented approach. In ASPLOS, March 2010.
[77] Pin Zhou, Feng Qin, Wei Liu, Yuanyuan Zhou, and Josep Torrellas. iWatcher: Efficientarchitectural support for software debugging. In International Symposium on Computer Ar-chitecture, June 2004.
[78] Pin Zhou, Radu Teodorescu, and Yuanyuan Zhou. HARD: Hardware-assisted lockset-basedrace detection. In International Symposium on High Performance Computer Architecture,February 2007.
99