| 2016 jumex survey - grant thornton uk llp€¦ · junior mining and exploration companies...
TRANSCRIPT
INDUSTRY POSITION SURVEY | 2016
JUMEX SURVEYTHE ANNUAL SURVEY OF JUNIOR MINING AND EXPLORATION COMPANIES

CONTENTS
4 FOREWORD
5 INTRODUCTION
6 COMMODITY MARKETS OUTLOOK
10 FINANCING: THE ONLY WAY IS UP
19 STRATEGY: BUILDING VALUE
22 INNOVATION: MINING 3.0: DRONES AND SOCIAL MEDIA
24 SKILLSETS FOR GROWTH
27 SURVEY METHODOLOGY
29 IDEAS FOR GROWTH
30 KEY CONTRIBUTORS
31 ABOUT GRANT THORNTON
4
SIMON BENNISON, CHIEF EXECUTIVE OFFICER, ASSOCIATION OF MINING AND EXPLORATION COMPANIES (AMEC)
FOREWORD
Whilst it is disappointing to see a number of commodities still languishing with regard to prices, it certainly is pleasing to see the way others such as iron ore have held up while coking and thermal coal are also rebounding. Gold has had a stellar run and looks set to continue at current prices through 2017. Lithium stocks are also enjoying considerable support from investors. According to the analysts and forecasters the commodity pricing outlook in general looks promising and this view is supported by a number of responses in the survey.
IPOs are still very thin on the ground in the mining and exploration sectors although there appears to be a bottoming in 2015 with an increase in late 2016. Capital is still scarce and the Governments must continue with the various co-funded drilling programmes to ensure that greenfields exploration prospers and new discoveries drive employment and revenue streams for companies and the nation’s economy.
AMEC is committed to reducing the cost of doing business for the industry and this has been reflected in Government support across the exploration and mining sectors in various jurisdictions. These have included discounts on port charges(WA) to reductions in tenement expenditure (Qld). However much still remains to lock in these arrangements for the longer term and in particular to reduce the over-regulation of the industry.
The Federal Government must roll over the Exploration Development Incentive post June 2017. It will take nearly a decade for this programme to demonstrate its true value. This has been in part supported by the ACIL Allens report of 2015 that clearly demonstrated the returns of $20m for every $1m invested by the WA Government.
Australians should be very proud of the resources sector that continues to deliver a standard of living that is envied globally. But we must not be complacent. There are many professional activist groups that are very sophisticated in their campaigns in demonising the mining and exploration sectors. It is the responsibility for all resource interests to assist in educating the community of the benefits of our industry.
Governments must also better understand the continued role of the industry in driving the nation’s economy. Despite a drop in our contribution to GDP from 11% in 2013 to 7% in 2016, the industry still drives export income with mineral resources representing 70% and mineral services 50% of the goods and services sector.
State and Federal Governments must commit to the deregulation of the industry. They must improve efficiencies across the agencies that reduces costs through shorter approval timelines. Approval delays and administrative costs continue to cripple projects and constrain investment.
A recent Productivity Commission report stated that Government reforms resulted in far greater layers of regulation. This simply should not be an outcome of Government reforms. Many of these reforms have also resulted in higher administrative costs to industry. Governments must eradicate the mindset that they can simply load additional costs on to industry.
Our industry must work closely together to educate the community of the benefits that we bring to all corners of our country particularly in remote regional communities. Industry must better resource its advocacy groups to ensure they drive the messages home to political leaders and the community.
THE ASSOCIATION OF MINING AND EXPLORATION COMPANIES (AMEC) IS PLEASED TO PRESENT THE FOREWORD TO JUMEX 2016. GRANT THORNTON’S ANNUAL SURVEY PROVIDES AN EXCELLENT SUMMARY OF VARIOUS VIEWS ACROSS THE INDUSTRY ON TOPICS OF CONCERN.

5
INTRODUCTIONHOLLY STILES, NATIONAL HEAD OF ENERGY & RESOURCES, GRANT THORNTON AUSTRALIA
GRANT THORNTON AUSTRALIA IS PLEASED TO PRESENT THE FINDINGS FROM OUR 7TH ANNUAL SURVEY OF JUNIOR MINING AND EXPLORATION COMPANIES (JUMEX). THIS REPORT, WHICH WE ARE PROUD TO PREPARE IN COLLABORATION WITH AMEC AND ANZ, PROVIDES A COMPREHENSIVE MARKET OVERVIEW OF THE JUNIOR MINING AND EXPLORATION SECTOR IN AUSTRALIA.
It is pleasing to be able to approach this year’s JUMEX report from a much more positive perspective. After several challenging years, we are seeing a definite improvement in market conditions for junior miners that has been sustained now for over 6 months. We are seeing a strong improvement in fund raising success, particularly in certain sectors such as gold and lithium, but investor interest also seems to have filtered more broadly to other commodities, particularly for advanced stage assets.
Reflecting the importance of funding to the sector and the recent shift of sentiment, in addition to our survey of junior mining executives, this year we have also interviewed a number of investors in the sector. Their insights are shared throughout this report and provide an interesting perspective with guidance on maximising the appeal of investment propositions and building relationships with investors.
For directors and managers of junior mining companies, now is the time to position your company for its next phase. For those with existing assets that are focused on attractive commodities and with no significant negative factors, focus hard on those projects, raise funding as quickly and as efficiently as possible (being realistic about valuations) and fast track development to deliver the best shareholder outcomes. For those looking for new projects, be selective and get it right – focus on mainstream commodities and quality jurisdictions. Minimise risk and you will maximise your funding options in the future.
Whilst investor interest in resources and, in particular in junior miners, has definitely increased investors are still very selective and have a strong preference for advanced stage assets. Many junior mining companies have not had funding to significantly advance their projects or asset portfolio over the last few years and a lack of progress has frustrated shareholders. As funding becomes available, it is important that expectations of investors are clearly set, such that they understand what that funding will achieve and management focus on delivering to those promises, to regain trust and build a shareholder base that is loyal and committed.
From a broader industry perspective, one of the greatest challenges for the future is shifting the negative perception of the sector and changing the conversation away from messaging that the Australian economy is transitioning away from the resource sector. The industry will need to work hard to turn its reputation around, or risk impacts not only on investors but also on those in education considering their long term career prospects. Of course, Australia has a rich resource endowment and a world class mining sector and the mining industry will remain a significant part of the Australian economy for many years. That may seem obvious for those in the industry, but the message needs to be spread more broadly in order for the industry to continue to attract high quality people and new generations of investors.
Furthermore, it is important that the industry learns from the most recent downturn and builds a sustainable future. Producers have had to aggressively reduce costs and increase efficiencies in response to the downturn. Explorers and developers have had to be creative to deliver value with minimal funding and to maximise the attractiveness of projects in the face of falling commodity prices. It is really important that this discipline is not lost as funding pressures ease, in order to build sustainable returns and a portfolio of projects that will offer attractive returns despite short term commodity fluctuations.
We value our junior mining client base and look forward to working with you as you access finance and develop your projects.
GRANT THORNTON WOULD LIKE TO EXPRESS OUR SINCERE APPRECIATION TO ALL THOSE WHO PARTICIPATED IN THE SURVEY AND TO ALL INVESTORS WHO CONTRIBUTED THEIR INSIGHTS.

6
COMMODITY MARKETS OUTLOOK
ROLLERCOASTER RIDE FOR COMMODITIES TO CONTINUEWhile the commodity complex is looking decidedly better than it did this time last year, there are a number of challenges ahead that confirm our bias that any further appreciation in prices will be hard fought and limited.
Producers have adjusted quickly to the fall in prices. In iron ore, producers have been able to reduce operating costs by over 50% over the past couple of years. In the oil market, many US shale oil producers can be cash flow positive with prices as low as USD40/bbl.
To compound this, in certain commodities there is a pent-up level of capacity. Drilled, but uncompleted, oil wells in the US can be rapidly reactivated when prices rise. In base metals, recent capacity closures in China and Africa are at threat of being reversed if prices push too high. In the Chinese steel market, high prices could slow down recent closures as well.
However, the macro environment remains positive for commodities. There are signs that China’s growth momentum is stabilising. The recovery in China’s housing market looks likely to continue over the next 12 months. Led by an increase in SOE investment, housing starts in the first eight months of the year are up 4.6%. This strong growth should continue until at least of the end of 2016. We also see focused stimulus measures providing support to infrastructure spending. Growth in fixed asset investment in the infrastructure sector has jumped 20% in recent months after being in decline for the past couple for years.
All of this means that prices are likely to remain range-bound unless there is some major supply-side shock (pushing prices to the upside) or if the stabilisation in world economic growth is only temporary (pushing prices to the downside).
BULKSBulk markets may see some upside in the coming quarter should Chinese supplies continue to tighten. However, we think it will be a struggle to achieve higher prices given the rapid speed and trajectory at which prices have already accelerated. Heavy rainfall in northern China in August impacted domestic supply and infrastructure, placing greater reliance on imports. We expect this phenomenon to be short-lived, with rail lines and roads now reopening and ongoing disturbances diminishing in the coming weeks.
Restocking by Chinese steel mills and coke makers should also slow by the start of the national holidays in early October. This, combined with waning government stimulus, suggests underlying demand will likely be subdued in Q4. The market focus will therefore be on supply-side dynamics.
For iron ore, challenges remain in terms of China’s steel sector and overcapacity issues. China’s crude steel production has remained at elevated levels for most of the year.
In fact, after falling for the past two years, the y/y growth rate in steel production has picked up in recent months.
Expectations had been high that the Chinese government would accelerate capacity closures. However, to date there hasn’t been much evidence of this happening. China’s capacity reductions for the steel industry are less than half of the 2016 target of 45 million tonnes. We think there could be some upside to prices if China were to meet expectations and successfully accelerate reductions in Q4.
On the flipside, any move to remove overcapacity will contribute to higher steel margins and greater output. This then puts downward pressure on steel and iron ore prices (as the two are closely linked). We think this see-saw action is likely to keep iron ore prices in a tight range between USD50-60/t in Q4.
China has been even less successful in reducing coal capacity, with just 38% (or around 95 million tonnes) cut from the government’s 250 million tonne target.
Commentary is kindly supplied by ANZ.

7
That said, China’s policy for a reduction in the number of days domestic coal producers are allowed to operate (276 days annually versus 330 days previously) has cut coal production by an average 10% below 2015 levels. Indirectly, this has also contributed to greater imports as buyers secure supplies from a cheaper-priced seaborne market.
If China continues to adhere to its new coal policy, its reliance on imports will continue to increase, which should result in slightly better prices in Q4. However, much of it will be dependent on rising domestic prices and pass through costs to end users.
According to Wood Mackenzie, each RMB10/t increase in thermal coal prices in China increases power generation costs by approximately RMB18bn (roughly USD2.7bn).
With Chinese thermal coal prices continuing to spike above RMB550/t, the government could introduce further policy easing (in addition to those announced in early September), which may result in greater domestic coal supplies.
We think this could lower thermal coal prices, but the impact will be significantly less for coking coal. The tightness in coking coal supply both in China and Australia and an unexpected spike in Indian demand should support prices above USD110/t in Q4. However, similar to iron ore, prices will be capped by weak underlying Chinese steel demand.
We expect thermal and coking coal suppliers elsewhere to take the opportunity to address shortage concerns, but the market will correct slowly.
The thermal coal market will likely see an increase in Australian and Indonesian supplies, with the US remaining on the sidelines as prices weaken. For coking coal, US supplies could hit the market, but miners will likely tread cautiously given the recent price volatility and their precarious financial position.
ENERGYWe take a cautious view on oil prices for the next quarter. Although we expect prices to push towards the upper end of our USD45-55/bbl range in response to a tighter oil market balance, there is a risk that growing US shale and OPEC production will slow declines in oil inventories post the April peak.
That said, weather-related supply outages could buoy prices above our expected range, but any impact will likely be temporary. Meanwhile, prices are likely to remain buoyed as OPEC looks to ratify a temporary agreement to cut production at its November meeting.
Improved efficiencies by the US shale industry should continue to weigh on prices. Producer costs have fallen and drilled but uncompleted wells (DUC) have risen to a level where producers can rapidly reactivate supply when prices rise. This is likely to continue until the backlog of wells is cleared.
A faster than expected pace in rig additions is also making the market cautious, with rig counts up 30% since the bottom of the trough in May to 414 rigs. We suspect many of these rigs are being used on DUCs, with the drilling of new wells continuing to fall.
FIGURE 1. CHINA STEEL MARGINS & IRON ORE PRICE
FIGURE 2. CHINA COAL CUTS ARE DRIVING IMPORTS
0
-200
800
-600
400
200
-400
600
RMB
per t
onne
USD/
Tonn
e
70
65
50
60
45
55
40J M OM A DF J NA S
China steel mill margin
China coal imports
Iron ore price (RHS)
China coal output (RHS)
Source: Bloomberg, ANZ Research
Source: Bloomberg, ANZ Research
M to
nnes
M to
nnes
300
310
280
320
290
330
270
20
16
24
14
22
18
26
12
28 330
260
China announces working day restrictions
May 15 Nov 15 May 16Aug 15 Feb 16 Aug 16
Therefore, the impact of a rise in drilling activity will be short-lived, with any stabilisation in output not occurring until H2 2017.
Despite OPEC output rising, its tentative agreement to cut production represents a change in strategy for the group. Under the plan, production to be reduced to 32.5-30.0mb/d. Based on various sources, current output is around 33.7mb/d, so this agreement suggests output will be cut between 750-1,000kb/d. Its likely that Saudi Arabia will be required to meet most of this reduction, as Iran will be allowed to continue to ramp up production.Oil demand in Q4 should remain robust, with growth in the US, China, and India offsetting declines in Europe. Recent low prices have boosted US demand for gasoline, fuel oil, and jet oil, but distillate demand appears weak. Seasonal winter demand and the end of the seasonal refinery maintenance period should see distillate demand and refinery runs improve in Q4.
In addition, China and India continue to buy for strategic and commercial petroleum reserves, but the pace could slow as prices rise and the contango in the crude market narrows.
8
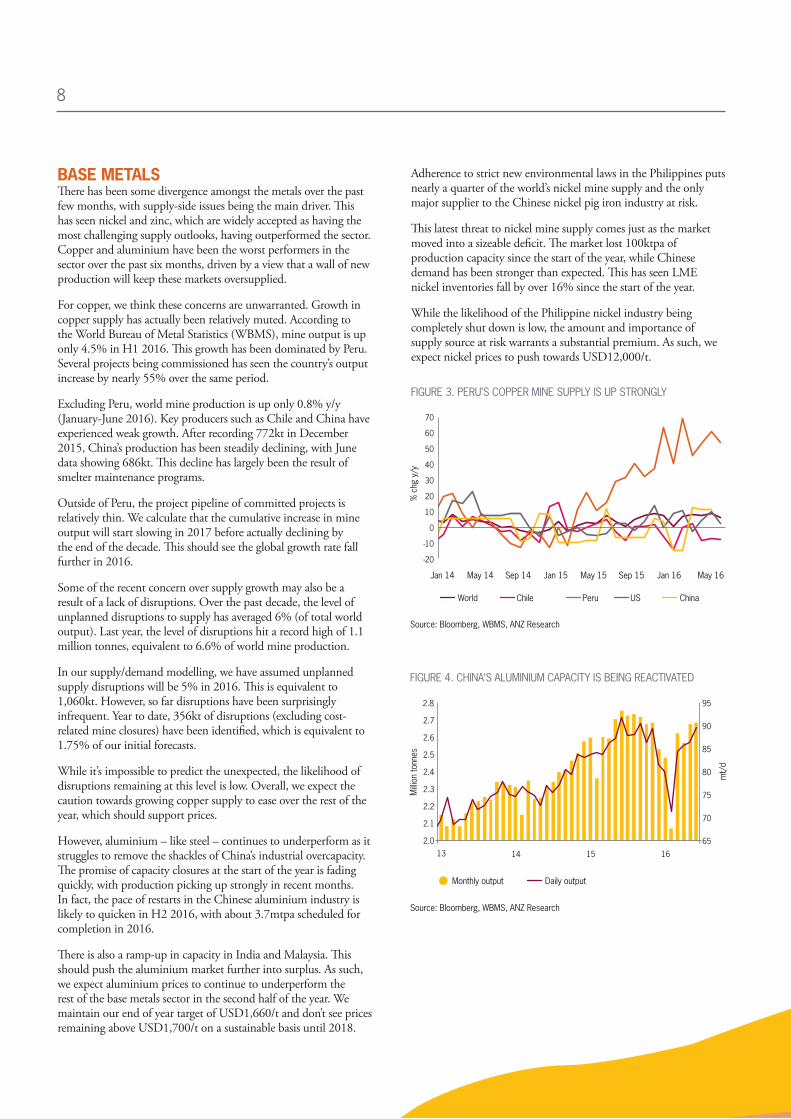
BASE METALSThere has been some divergence amongst the metals over the past few months, with supply-side issues being the main driver. This has seen nickel and zinc, which are widely accepted as having the most challenging supply outlooks, having outperformed the sector. Copper and aluminium have been the worst performers in the sector over the past six months, driven by a view that a wall of new production will keep these markets oversupplied.
For copper, we think these concerns are unwarranted. Growth in copper supply has actually been relatively muted. According to the World Bureau of Metal Statistics (WBMS), mine output is up only 4.5% in H1 2016. This growth has been dominated by Peru. Several projects being commissioned has seen the country’s output increase by nearly 55% over the same period.
Excluding Peru, world mine production is up only 0.8% y/y (January-June 2016). Key producers such as Chile and China have experienced weak growth. After recording 772kt in December 2015, China’s production has been steadily declining, with June data showing 686kt. This decline has largely been the result of smelter maintenance programs.
Outside of Peru, the project pipeline of committed projects is relatively thin. We calculate that the cumulative increase in mine output will start slowing in 2017 before actually declining by the end of the decade. This should see the global growth rate fall further in 2016.
Some of the recent concern over supply growth may also be a result of a lack of disruptions. Over the past decade, the level of unplanned disruptions to supply has averaged 6% (of total world output). Last year, the level of disruptions hit a record high of 1.1 million tonnes, equivalent to 6.6% of world mine production.
In our supply/demand modelling, we have assumed unplanned supply disruptions will be 5% in 2016. This is equivalent to 1,060kt. However, so far disruptions have been surprisingly infrequent. Year to date, 356kt of disruptions (excluding cost-related mine closures) have been identified, which is equivalent to 1.75% of our initial forecasts.
While it’s impossible to predict the unexpected, the likelihood of disruptions remaining at this level is low. Overall, we expect the caution towards growing copper supply to ease over the rest of the year, which should support prices.
However, aluminium – like steel – continues to underperform as it struggles to remove the shackles of China’s industrial overcapacity. The promise of capacity closures at the start of the year is fading quickly, with production picking up strongly in recent months. In fact, the pace of restarts in the Chinese aluminium industry is likely to quicken in H2 2016, with about 3.7mtpa scheduled for completion in 2016.
There is also a ramp-up in capacity in India and Malaysia. This should push the aluminium market further into surplus. As such, we expect aluminium prices to continue to underperform the rest of the base metals sector in the second half of the year. We maintain our end of year target of USD1,660/t and don’t see prices remaining above USD1,700/t on a sustainable basis until 2018.
Adherence to strict new environmental laws in the Philippines puts nearly a quarter of the world’s nickel mine supply and the only major supplier to the Chinese nickel pig iron industry at risk.
This latest threat to nickel mine supply comes just as the market moved into a sizeable deficit. The market lost 100ktpa of production capacity since the start of the year, while Chinese demand has been stronger than expected. This has seen LME nickel inventories fall by over 16% since the start of the year.
While the likelihood of the Philippine nickel industry being completely shut down is low, the amount and importance of supply source at risk warrants a substantial premium. As such, we expect nickel prices to push towards USD12,000/t.
FIGURE 3. PERU’S COPPER MINE SUPPLY IS UP STRONGLY
FIGURE 4. CHINA’S ALUMINIUM CAPACITY IS BEING REACTIVATED
World Chile Peru US China
Jan 14 Sep 14 May 15May 14 Jan 15 Sep 15 Jan 16 May 16
-20
-10
0
10
20
30
40
50
60
70%
chg
y/y
Source: Bloomberg, WBMS, ANZ Research
Source: Bloomberg, WBMS, ANZ Research
13 14 15 16
65
80
70
85
75
95
90
2.0
2.2
2.4
2.6
2.1
2.3
2.5
2.7
2.8
Milli
on to
nnes
mt/
d
Daily outputMonthly output

9
PRECIOUS METALSWith the shock of Brexit now gone and the focus returning to the next rate hike in the US, investor appetite for gold has been subdued, thus weighing on prices. However, we expect this pullback to be temporary. Over the next 6-12 months, the combination of looser monetary policy in the euro area, the UK and Japan, higher inflation, negative bond yields, and potential shocks should see gold push above USD1400/oz in the next six months.
Monetary easing programs in Japan and Europe continue unabated. The ECB will continue with its monetary easing bias until inflation targets are achieved. In Japan, subdued wage growth and declining inflation expectations should keep the Bank of Japan in easing mode.
In our view, central banks will continue adapting expansionary monetary policy to achieve their inflation targets. Potential shocks also lie ahead, which should see gold’s safe haven status come to the fore. In particular, the US presidential election in November could prompt a fresh bout of global political uncertainty.
With gold having once again demonstrated its value as a safe haven in the immediate aftermath of the UK’s vote to leave the EU, we think any correction in the coming months will be short-lived.
This should result in investor demand remaining strong. Already in 2016, gold held in ETFs has increased by more than 300t, making up for two years of declines. At its current pace, it is highly likely that 2016 can become the biggest year for ETF inflows – surpassing 2009 levels.
Weak physical demand has been a headwind recently, but there are signs that this is starting to turn around. Customs data from Hong Kong and Switzerland show that China’s imports of gold surged 71% y/y in July. That was also up 27% from June. In the seven months to July imports are now up 18% y/y. The picture in India, however, isn’t as positive. Data from the Indian Commerce Ministry shows that imports remained subdued in July. That said, with the country’s festival season fast approaching, we expect imports to improve in the coming months.
Central banks remained net buyers of gold in Q2 2016 (+77 tonnes), yet the pace of buying has slowed considerably. Despite this, we think the case for gold as a strategic reserve remains strong.
Gold
, USD
/oz
FIGURE 5. GOLD VS 10YR BOND YIELDS
Source: Bloomberg, WBMS, ANZ Research
Gold Japan 10yr Swiss 10yr German 10yr
1100
1000
1300
1200
1400
1150
1050
1350
1250
Yiel
d (%
, inv
erse
)
0.9
0.3
-0.3
0.7
0.1
-0.5
0.5
-0.1
-0.7
Jan 15 Jul 15Apr 15 Oct 15 Jan 16 Apr 16 Jul 16
Rate
FIGURE 6. GOLD VS FED FUND RATE
Source: Bloomberg, WBMS, ANZ Research
Fed Fund Rate USD (RHS)
Poin
ts
70 9080 00 1075 9585 05 15
0
8
4
12
16
2
10
6
14
18
20
100
80
120
140
70
110
90
130
150
160
In developing economies, buying remained strong. We expect this to continue as they typically have much lower gold holdings as a percentage of total reserves compared to advanced economies.
The upshot is that we expect further upside for gold, and see prices ending the year at USD1,375/oz, with a push above USD1,400/oz expected in 2017.

10
FINANCINGTHE ONLY WAY IS UPOVER THE PAST SIX MONTHS THERE HAS BEEN A NOTICEABLE AND SIGNIFICANT INCREASE IN INVESTOR APPETITE FOR JUNIOR MINING AND EXPLORATION COMPANIES. THE TIDE APPEARS TO HAVE TURNED…
Experienced significant challenges
Experienced moderate challenges
Experienced limited challenges
We have been successful in raising funds without any particular challenges
We experienced strong investor support with fundraising oversubscribed / scaled back
We haven’t had a need to raise funds in the past year
As everyone in the industry is only too aware, the lack of capital available for junior mining companies has had a significant impact on the sector over the past years. A soft commodity market, combined with investors’ preference for safer bets, resulted in a drought of capital for exploration and development of mining projects.
The tide is turning, with many seeing the bottom of the market in the early part of this calendar year, and the change has been quick for a few commodities. Grant Thornton has seen the trend clearly in our client base: companies that have struggled to find funding for some time have successfully completed fund raisings in recent months and a number achieved heavily oversubscribed fund raisings – a joy that junior miners haven’t experienced in many years!
26% of respondents that needed to raise funds during FY2016 reported no challenges in raising capital or strong investor interest, compared to just 10% in FY2015. Whilst the companies experiencing the strongest interest have generally been gold or lithium focused, the interest has started to broaden to other commodities. As a result there has been a dramatic improvement in expectations regarding investor interest amongst junior miners, with nearly 60% seeing signs of improvement in investor interest already or even strong investor interest, compared to just 15% in 2015 (none of which were already seeing strong investor interest). Conversely, in 2016, a quarter of respondents thought it would take a year or more for investor interest levels to improve, compared to over 60% in 2015.
Seeing strong investor interest at the moment
Seeing some signs of improvement in investor interest at the moment
Expect investor interest levels to improve over the coming 6-12 months
Expect investor interest levels to improve from 12 months time onwards
Expect investor interest levels to improve from two years time onwards
No prospects for improvement in investor interest levels in the short to medium term
Unsure
EXPECTATIONS REGARDING INVESTOR INTEREST IN JUMEX COMPANIES
2016
15%
18%
18%20%
23%
6%
12%
46%
16%
16%
8%
20
15
1% 1%
SUCCESS IN FUNDRAISING
29%
26%11%
7%
27%
25%
22%
12%
14%
8%
19%2016
20
15
11
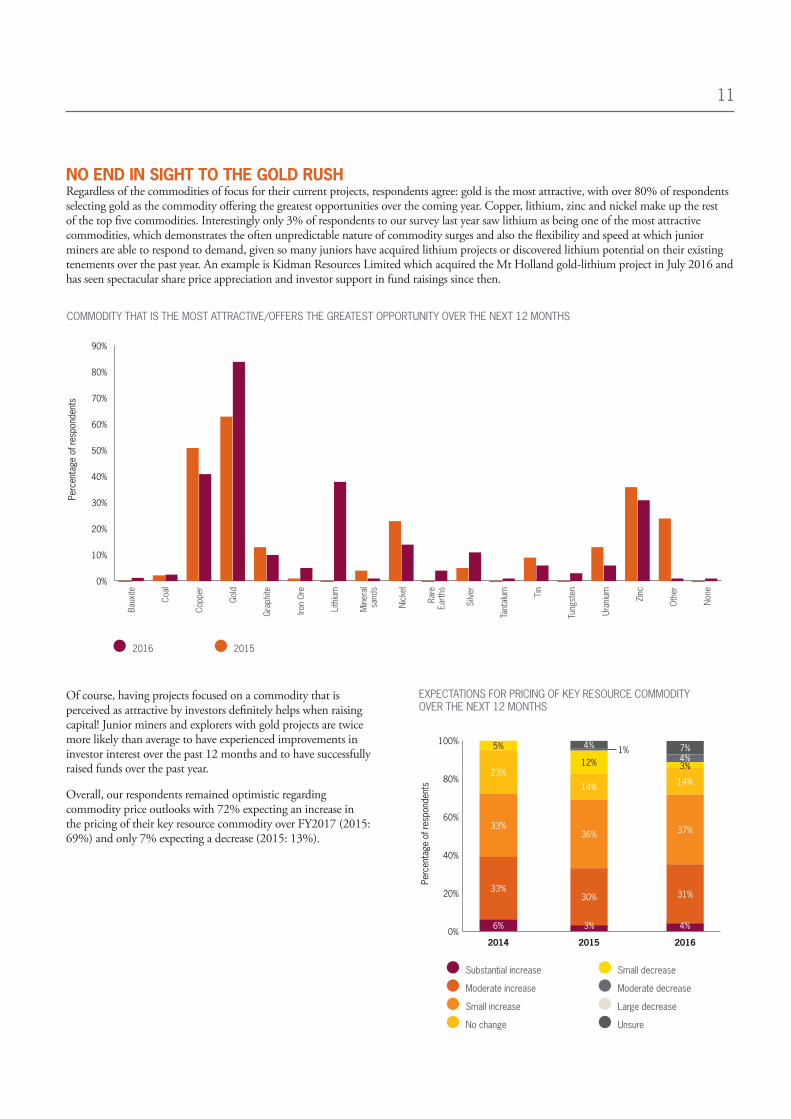
NO END IN SIGHT TO THE GOLD RUSH Regardless of the commodities of focus for their current projects, respondents agree: gold is the most attractive, with over 80% of respondents selecting gold as the commodity offering the greatest opportunities over the coming year. Copper, lithium, zinc and nickel make up the rest of the top five commodities. Interestingly only 3% of respondents to our survey last year saw lithium as being one of the most attractive commodities, which demonstrates the often unpredictable nature of commodity surges and also the flexibility and speed at which junior miners are able to respond to demand, given so many juniors have acquired lithium projects or discovered lithium potential on their existing tenements over the past year. An example is Kidman Resources Limited which acquired the Mt Holland gold-lithium project in July 2016 and has seen spectacular share price appreciation and investor support in fund raisings since then.
Of course, having projects focused on a commodity that is perceived as attractive by investors definitely helps when raising capital! Junior miners and explorers with gold projects are twice more likely than average to have experienced improvements in investor interest over the past 12 months and to have successfully raised funds over the past year.
Overall, our respondents remained optimistic regarding commodity price outlooks with 72% expecting an increase in the pricing of their key resource commodity over FY2017 (2015: 69%) and only 7% expecting a decrease (2015: 13%).
2016 2015
Baux
ite
Iron
Ore
Silve
r
Coal
Lith
ium
Tant
alum
Copp
er
Min
eral
sa
nds
Tin
Zinc
Gold
Nick
el
Tung
sten
Oth
er
Grap
hite
Rare
Ea
rths
Uran
ium
None
0%
10%
20%
30%
40%
50%
60%
70%
80%
90%
COMMODITY THAT IS THE MOST ATTRACTIVE/OFFERS THE GREATEST OPPORTUNITY OVER THE NEXT 12 MONTHS
EXPECTATIONS FOR PRICING OF KEY RESOURCE COMMODITY OVER THE NEXT 12 MONTHS
0%
20%
40%
60%
100%
2014 2015 2016
80%
4% 7%5%
12%23%
14% 14%
33%36% 37%
33%30% 31%
6% 3% 4%
3%4%
Substantial increase
Moderate increase
Small increase
No change
Small decrease
Moderate decrease
Large decrease
Unsure
Perc
enta
ge o
f res
pond
ents
1%
Perc
enta
ge o
f res
pond
ents
12
INVESTOR CORNER
While many investors are attracted to gold, most have a broad outlook on commodities they perceive as attractive. A few are even seriously looking again at coal – a commodity that has seen very little interest in recent years. More broadly than the commodity, investors look at a wide range of factors when evaluating assets, with a strong focus on minimising risk. Jurisdiction of the project, position on the cost curve, technical complexities, progress of permitting and management track record are all significant factors in the investment decision process.
‘Management is critical. They need to have listed company experience and in particular corporate and capital markets experience. Technical skill and experiences is, of course, very important but you also need to be able to take investors on the journey with you in order to generate value and to be able to access funds when you need them.’
Andrew Sparke, Landstead Investors
The good news: all investors interviewed expressed a keen interest on new opportunities and are aggressively looking for transactions.
CURRENT CASH BALANCE
0%
20%
40%
60%
100%
80%
2014
1%5%5%
20%
19%
50%
2015
1%
12%
5%
12%
18%
52%
2016
1%
6%
10%
10%
23%
50%
< $2m
$2m - 5m
$5m - 10m
$10m - 20m
$20m - 100m
> $100m
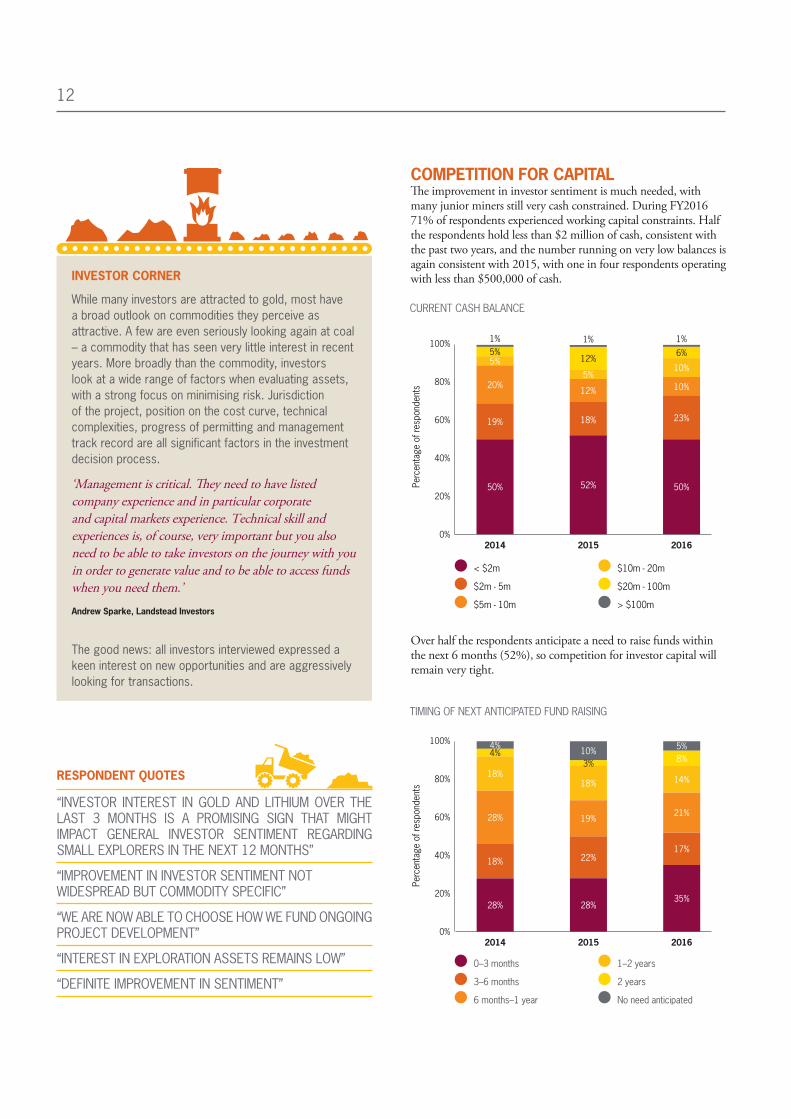
COMPETITION FOR CAPITALThe improvement in investor sentiment is much needed, with many junior miners still very cash constrained. During FY2016 71% of respondents experienced working capital constraints. Half the respondents hold less than $2 million of cash, consistent with the past two years, and the number running on very low balances is again consistent with 2015, with one in four respondents operating with less than $500,000 of cash.
TIMING OF NEXT ANTICIPATED FUND RAISING
0%
20%
40%
60%
100%
80%
0–3 months
3–6 months
6 months–1 year
1–2 years
2 years
No need anticipated
2015
10%
18%
19%
22%
28%
3%
2016
8%
14%
21%
17%
35%
5%
2014
18%
28%
18%
28%
4%4%
“INVESTOR INTEREST IN GOLD AND LITHIUM OVER THE LAST 3 MONTHS IS A PROMISING SIGN THAT MIGHT IMPACT GENERAL INVESTOR SENTIMENT REGARDING SMALL EXPLORERS IN THE NEXT 12 MONTHS”
“IMPROVEMENT IN INVESTOR SENTIMENT NOT WIDESPREAD BUT COMMODITY SPECIFIC”
“WE ARE NOW ABLE TO CHOOSE HOW WE FUND ONGOING PROJECT DEVELOPMENT”
“INTEREST IN EXPLORATION ASSETS REMAINS LOW”
“DEFINITE IMPROVEMENT IN SENTIMENT”
Over half the respondents anticipate a need to raise funds within the next 6 months (52%), so competition for investor capital will remain very tight.
Perc
enta
ge o
f res
pond
ents
Perc
enta
ge o
f res
pond
ents
RESPONDENT QUOTES

13
With so many junior miners seeking funds in the short term (there were 666 JUMEX companies at 30 May 2016 and so our survey results imply that 350 will be seeking capital before the end of the calendar year), how will companies differentiate themselves? We asked our respondents what they believe to be their competitive advantage and the top responses were the board and management (59%), exploration potential (53%) and demonstrable asset quality (43%).
In terms of approach to fund raising, private placements remain the most popular fund raising method, with three quarters of companies considering a placement for their next fund raising. Rights issues remain the next most popular option. Interestingly there was a dramatic decrease in the number of companies considering a royalty, streaming or private equity transaction for the next fundraising compared to 2015, with only 5% of companies considering one or more of those options compared to 27% in 2015. This may reflect the more favourable investor outlook reducing the need for more creative financing solutions.
WHAT DO YOU CONSIDER TO BE YOUR COMPANY’S COMPETITIVE ADVANCES RELATIVE TO OTHER JUNIOR MINERS?
0%
10%
20%
30%
40%
50%
60%
70%
43%
Demonstrable asset quality (reserves and
resources)
39%
Cash reserves and funding ability
53%
Exploration potential
59%
Key company personnel (including
board)
25%
Company strategy Other
5%
We do not have a competitive
advantage
4%
SOURCES OF FUNDS CONSIDERED FOR NEXT RAISING
0% 10% 20% 30% 40% 50% 60% 70% 80%
Private placement
Rights issue
Public offer
Joint venture
Asset sale
Debt/project finance
Convertible notes
Royalty agreement, private equity or streaming
Other
Perc
enta
ge o
f res
pond
ents
“TOO MANY PROJECTS ALL CHASING THE SAME INVESTMENT DOLLARS”
2016
2014 2015 2016
RESPONDENT QUOTES
Percentage of respondents
14
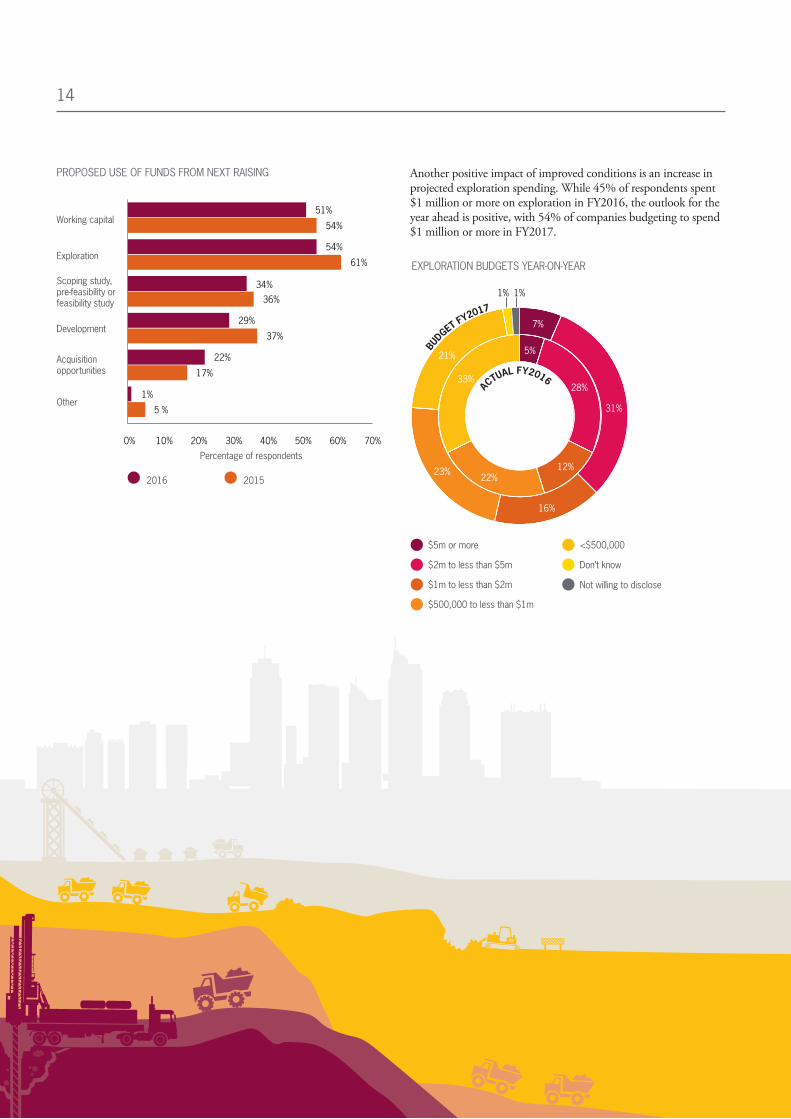
Another positive impact of improved conditions is an increase in projected exploration spending. While 45% of respondents spent $1 million or more on exploration in FY2016, the outlook for the year ahead is positive, with 54% of companies budgeting to spend $1 million or more in FY2017.
PROPOSED USE OF FUNDS FROM NEXT RAISING
Other
Acquisition opportunities
Development
Scoping study, pre-feasibility or feasibility study
Exploration
Working capital
2016 2015
51%
54%
54%
61%
34%36%
29%
37%
22%
17%
1%
5 %
0% 30% 60%20%10% 50%40% 70%
EXPLORATION BUDGETS YEAR-ON-YEAR
$5m or more
$2m to less than $5m
$1m to less than $2m
$500,000 to less than $1m
<$500,000
Don’t know
Not willing to disclose
BUDGET F
Y2017
ACTUAL FY2016
1% 1%
7%
31%
16%
23%
21%
33%
5%
28%
12%22%
Percentage of respondents
15
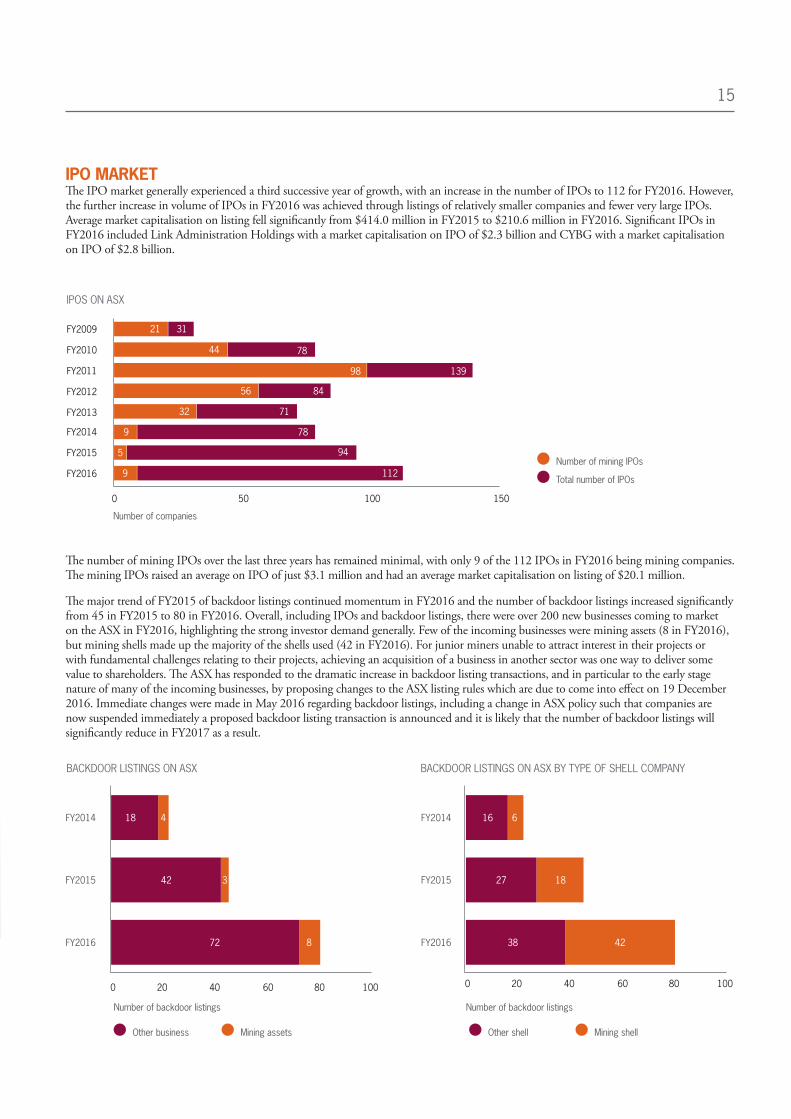
IPO MARKET The IPO market generally experienced a third successive year of growth, with an increase in the number of IPOs to 112 for FY2016. However, the further increase in volume of IPOs in FY2016 was achieved through listings of relatively smaller companies and fewer very large IPOs. Average market capitalisation on listing fell significantly from $414.0 million in FY2015 to $210.6 million in FY2016. Significant IPOs in FY2016 included Link Administration Holdings with a market capitalisation on IPO of $2.3 billion and CYBG with a market capitalisation on IPO of $2.8 billion.
The number of mining IPOs over the last three years has remained minimal, with only 9 of the 112 IPOs in FY2016 being mining companies. The mining IPOs raised an average on IPO of just $3.1 million and had an average market capitalisation on listing of $20.1 million.
The major trend of FY2015 of backdoor listings continued momentum in FY2016 and the number of backdoor listings increased significantly from 45 in FY2015 to 80 in FY2016. Overall, including IPOs and backdoor listings, there were over 200 new businesses coming to market on the ASX in FY2016, highlighting the strong investor demand generally. Few of the incoming businesses were mining assets (8 in FY2016), but mining shells made up the majority of the shells used (42 in FY2016). For junior miners unable to attract interest in their projects or with fundamental challenges relating to their projects, achieving an acquisition of a business in another sector was one way to deliver some value to shareholders. The ASX has responded to the dramatic increase in backdoor listing transactions, and in particular to the early stage nature of many of the incoming businesses, by proposing changes to the ASX listing rules which are due to come into effect on 19 December 2016. Immediate changes were made in May 2016 regarding backdoor listings, including a change in ASX policy such that companies are now suspended immediately a proposed backdoor listing transaction is announced and it is likely that the number of backdoor listings will significantly reduce in FY2017 as a result.
IPOS ON ASX
Number of mining IPOs
Total number of IPOs
Number of companies
0 50 100 150
FY2012
FY2015
FY2011
FY2014
FY2010
FY2013
FY2016
FY2009
9 112
945
9 78
7132
56 84
98 139
78
31
44
21
Other business Mining assets
BACKDOOR LISTINGS ON ASX
Number of backdoor listings
FY2016
FY2015
FY2014
0 20 40 60 80 100
1818 4
42 3
872
BACKDOOR LISTINGS ON ASX BY TYPE OF SHELL COMPANY
Number of backdoor listings
Other shell Mining shell
FY2016
FY2015
FY2014
0 20 40 60 80 100
16
27
38 42
6
18
16
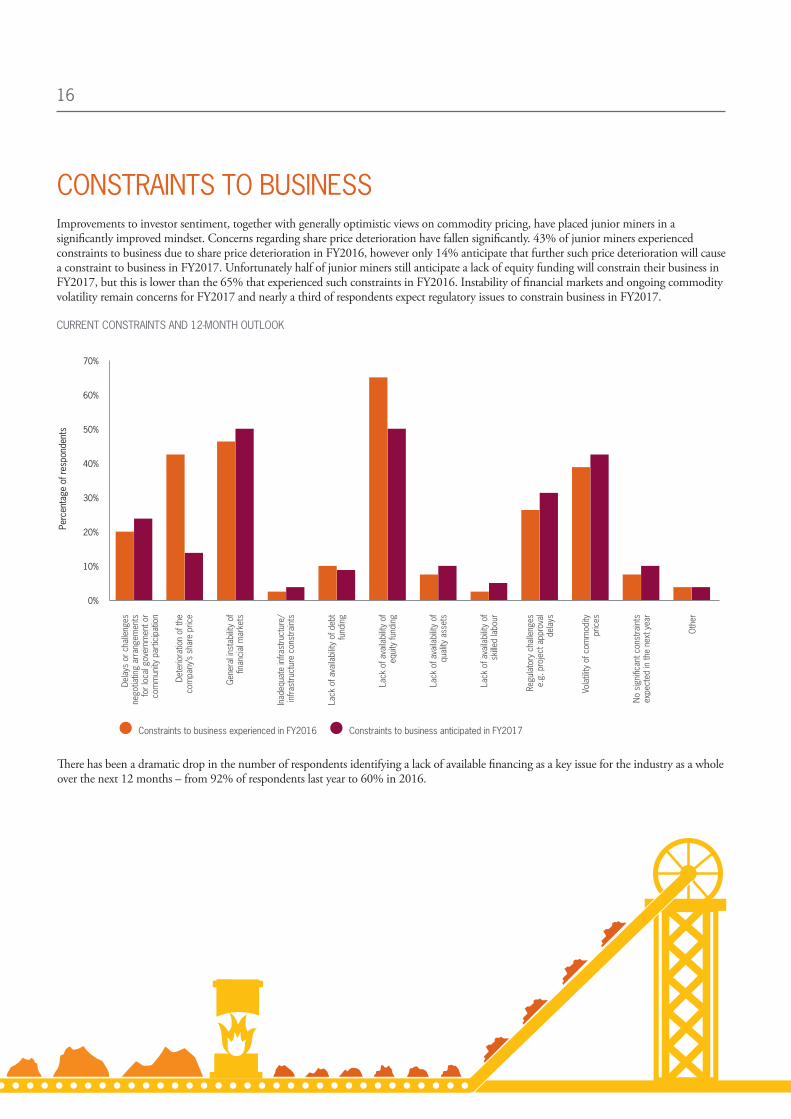
CONSTRAINTS TO BUSINESSImprovements to investor sentiment, together with generally optimistic views on commodity pricing, have placed junior miners in a significantly improved mindset. Concerns regarding share price deterioration have fallen significantly. 43% of junior miners experienced constraints to business due to share price deterioration in FY2016, however only 14% anticipate that further such price deterioration will cause a constraint to business in FY2017. Unfortunately half of junior miners still anticipate a lack of equity funding will constrain their business in FY2017, but this is lower than the 65% that experienced such constraints in FY2016. Instability of financial markets and ongoing commodity volatility remain concerns for FY2017 and nearly a third of respondents expect regulatory issues to constrain business in FY2017.
There has been a dramatic drop in the number of respondents identifying a lack of available financing as a key issue for the industry as a whole over the next 12 months – from 92% of respondents last year to 60% in 2016.
CURRENT CONSTRAINTS AND 12-MONTH OUTLOOK
Constraints to business experienced in FY2016 Constraints to business anticipated in FY2017
0%
10%
40%
20%
50%
30%
70%
60%
Dela
ys o
r cha
lleng
es
nego
tiatin
g ar
rang
emen
ts
for l
ocal
gov
ernm
ent o
r co
mm
unity
par
ticip
atio
n
Lack
of a
vaila
bilit
y of
qu
ality
ass
ets
Inad
equa
te in
frast
ruct
ure/
infra
stru
ctur
e co
nstra
ints
Vola
tility
of c
omm
odity
pr
ices
Dete
riora
tion
of th
e co
mpa
ny’s
shar
e pr
ice
Lack
of a
vaila
bilit
y of
sk
illed
labo
ur
Lack
of a
vaila
bilit
y of
deb
t fu
ndin
g
No s
igni
fican
t con
stra
ints
ex
pect
ed in
the
next
yea
r
Gene
ral i
nsta
bilit
y of
fin
anci
al m
arke
ts
Regu
lato
ry c
halle
nges
e.
g. p
roje
ct a
ppro
val
dela
ys
Lack
of a
vaila
bilit
y of
eq
uity
fund
ing
Oth
er
Perc
enta
ge o
f res
pond
ents

17
After volatility of commodity prices and lack of availability of financing, “red tape” or bureaucratic processes are seen as the third most significant challenge for the industry over the next 12 months.
THE REGULATION ISSUEREGULATION CONTINUES TO HAMPER THE INDUSTRY, WITH SIGNIFICANT FINANCIAL COSTS FOR SOME.
The regulatory landscape has not improved compared to 2015 and over a quarter (26% of respondents) faced regulatory challenges as a constraint to business in FY2016 and nearly a third (31% of respondents) anticipate these challenges to remain a constraint in FY2017. Delays in the granting of exploration permits and mining licences is the number one issue, affecting 66% of all respondents facing regulatory challenges (up from 45% in FY2015), followed by land access issues and environmental approvals. “Red tape” is considered to be a key issue for the industry overall for over half of respondents (53%). The financial cost of regulatory issues can be significant, with 38% of respondents estimating the costs of the regulatory challenges they are facing to be $500,000 or more. The main components of these costs include additional consultancy costs to navigate complex legislation and holding costs whilst waiting for project approvals.
MAIN REGULATORY CHALLENGES
0% 10% 20% 30% 40% 50% 60% 70%
Regulatory issues in conservation areas
Cultural heritage issues
Land access issues
Delays or challenges in obtaining environmental approvals
Delays or challenges in obtaining water permits
Delays or challenges on the granting of exploration permits and mining licenses
Other
COST OF REGULATORY CHALLENGES
Less than $100,000
$100,000 to less than $500,000
$500,000 to less than $1m
$1m to less than $2m
$2m to less than $5m
$5m or more
Not possible to quantify
14%
41%
10%
14%
7%
7%
7%
FY2016
“ONGOING LEGAL AND ADMINISTRATIVE COSTS; THE MATERIAL OPPORTUNITY COSTS OF UNCERTAINTY AND DELAYS; AND THE IMPACT ON COMPANY’S CAPACITY TO FUND ITSELF ARE KEY REGULATORY CHALLENGES”
“WE NEED TO ADDRESS THE CONSTANT TALKING DOWN OF THE RESOURCES SECTOR BY ALL MAJOR PARTIES IN CANBERRA. POLITICIANS SHOULD STOP TALKING DOWN ONE OF AUSTRALIA’S MOST IMPORTANT INDUSTRIES”
“THE COMPANY HAS WITHDRAWN FROM EXPLORATION OPERATIONS AND THE JURISDICTION AS A DIRECT RESULT OF THE COSTS ASSOCIATED WITH GAINING THE NECESSARY SOCIAL LICENCES TO COMMENCE EXPLORATION ACTIVITIES”
FY14 FY15 FY16Percentage of respondents
RESPONDENT QUOTES
18
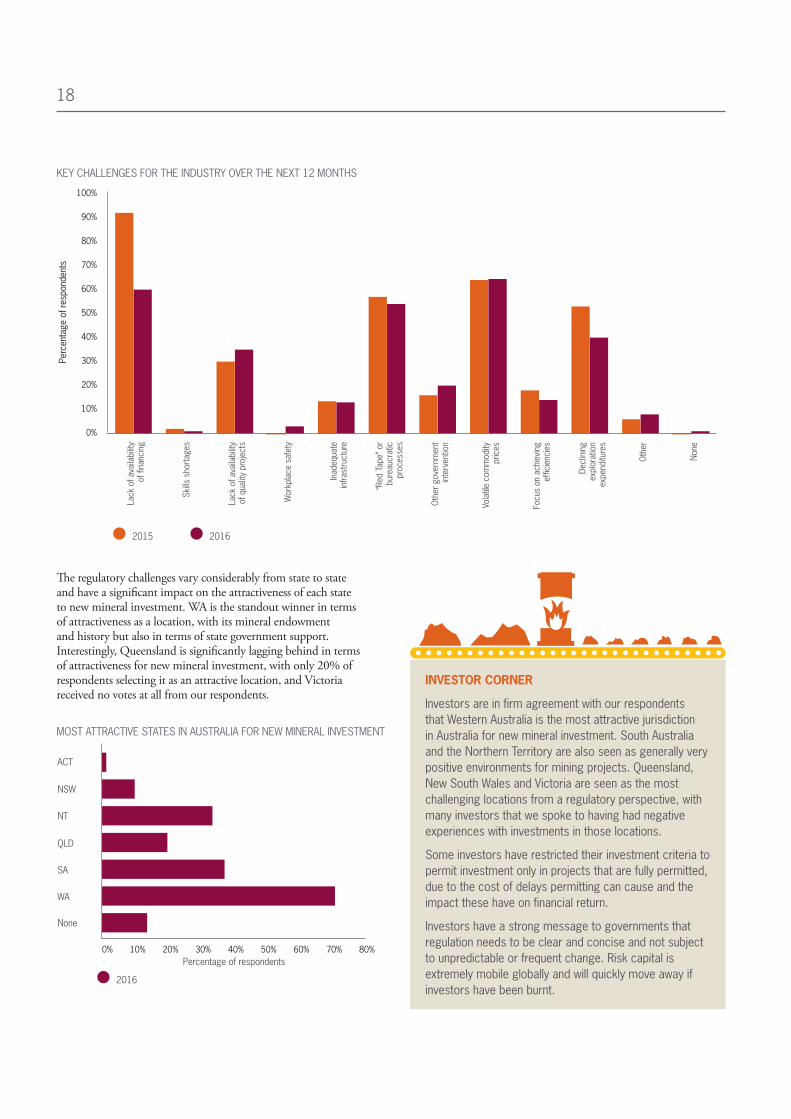
The regulatory challenges vary considerably from state to state and have a significant impact on the attractiveness of each state to new mineral investment. WA is the standout winner in terms of attractiveness as a location, with its mineral endowment and history but also in terms of state government support. Interestingly, Queensland is significantly lagging behind in terms of attractiveness for new mineral investment, with only 20% of respondents selecting it as an attractive location, and Victoria received no votes at all from our respondents.
KEY CHALLENGES FOR THE INDUSTRY OVER THE NEXT 12 MONTHS
2015 2016
0%
10%
40%
20%
50%
30%
90%
100%
80%
60%
70%
Lack
of a
vaila
bilit
y of
fina
ncin
g
Oth
er g
over
nmen
t in
terv
entio
n
Wor
kpla
ce s
afet
y
Decl
inin
g ex
plor
atio
n ex
pend
iture
s
Skills
sho
rtag
es
Vola
tile
com
mod
ity
pric
es
Inad
equa
te
infra
stru
ctur
e
Oth
er
Lack
of a
vaila
bilit
y of
qua
lity
proj
ects
Focu
s on
ach
ievin
g ef
ficie
ncie
s
“Red
Tap
e” o
r bu
reau
crat
ic
proc
esse
s
None
MOST ATTRACTIVE STATES IN AUSTRALIA FOR NEW MINERAL INVESTMENT
ACT
NSW
NT
QLD
SA
WA
None
0% 10% 40%20% 50%30% 80%60% 70%
2016
INVESTOR CORNER
Investors are in firm agreement with our respondents that Western Australia is the most attractive jurisdiction in Australia for new mineral investment. South Australia and the Northern Territory are also seen as generally very positive environments for mining projects. Queensland, New South Wales and Victoria are seen as the most challenging locations from a regulatory perspective, with many investors that we spoke to having had negative experiences with investments in those locations.
Some investors have restricted their investment criteria to permit investment only in projects that are fully permitted, due to the cost of delays permitting can cause and the impact these have on financial return.
Investors have a strong message to governments that regulation needs to be clear and concise and not subject to unpredictable or frequent change. Risk capital is extremely mobile globally and will quickly move away if investors have been burnt.
Perc
enta
ge o
f res
pond
ents
Percentage of respondents
19
STRATEGYBUILDING VALUEAFTER A FEW CHALLENGING YEARS, CONDITIONS ARE NOW MORE FAVOURABLE FOR JUNIOR MINERS TO BUILD VALUE FOR SHAREHOLDERS, THROUGH EXPLORATION SUCCESS, PROJECT DEVELOPMENT AND ASSET REALISATION.
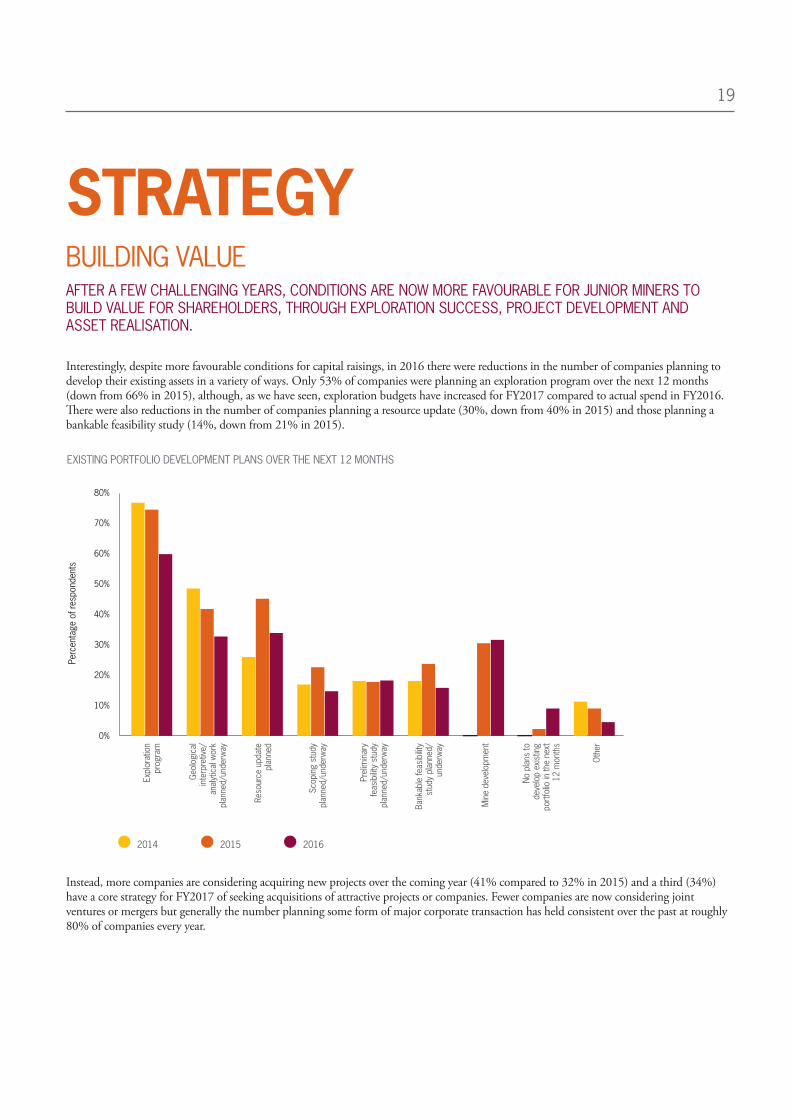
Interestingly, despite more favourable conditions for capital raisings, in 2016 there were reductions in the number of companies planning to develop their existing assets in a variety of ways. Only 53% of companies were planning an exploration program over the next 12 months (down from 66% in 2015), although, as we have seen, exploration budgets have increased for FY2017 compared to actual spend in FY2016. There were also reductions in the number of companies planning a resource update (30%, down from 40% in 2015) and those planning a bankable feasibility study (14%, down from 21% in 2015).
Instead, more companies are considering acquiring new projects over the coming year (41% compared to 32% in 2015) and a third (34%) have a core strategy for FY2017 of seeking acquisitions of attractive projects or companies. Fewer companies are now considering joint ventures or mergers but generally the number planning some form of major corporate transaction has held consistent over the past at roughly 80% of companies every year.
EXISTING PORTFOLIO DEVELOPMENT PLANS OVER THE NEXT 12 MONTHS
0%
10%
40%
20%
50%
30%
80%
60%
70%
Expl
orat
ion
prog
ram
Scop
ing
stud
y pl
anne
d/un
derw
ay
Min
e de
velo
pmen
t
Geol
ogic
al
inte
rpre
tive/
anal
ytic
al w
ork
plan
ned/
unde
rway
Prel
imin
ary
feas
ibilit
y st
udy
plan
ned/
unde
rway
No p
lans
to
deve
lop
exis
ting
port
folio
in th
e ne
xt
12 m
onth
s
Reso
urce
upd
ate
plan
ned
Bank
able
feas
ibilit
y st
udy
plan
ned/
unde
rway
Oth
er
Perc
enta
ge o
f res
pond
ents
2014 2015 2016
20
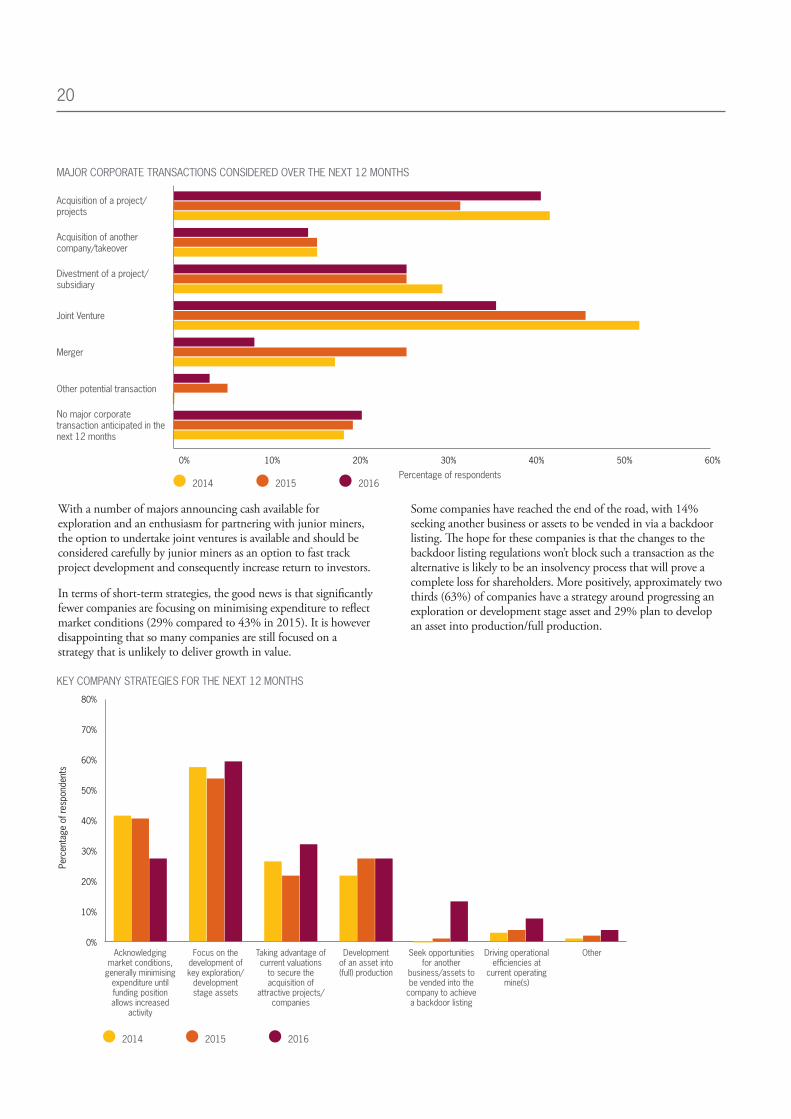
With a number of majors announcing cash available for exploration and an enthusiasm for partnering with junior miners, the option to undertake joint ventures is available and should be considered carefully by junior miners as an option to fast track project development and consequently increase return to investors.
In terms of short-term strategies, the good news is that significantly fewer companies are focusing on minimising expenditure to reflect market conditions (29% compared to 43% in 2015). It is however disappointing that so many companies are still focused on a strategy that is unlikely to deliver growth in value.
Some companies have reached the end of the road, with 14% seeking another business or assets to be vended in via a backdoor listing. The hope for these companies is that the changes to the backdoor listing regulations won’t block such a transaction as the alternative is likely to be an insolvency process that will prove a complete loss for shareholders. More positively, approximately two thirds (63%) of companies have a strategy around progressing an exploration or development stage asset and 29% plan to develop an asset into production/full production.
MAJOR CORPORATE TRANSACTIONS CONSIDERED OVER THE NEXT 12 MONTHS
No major corporate transaction anticipated in the next 12 months
Other potential transaction
Merger
Joint Venture
Divestment of a project/subsidiary
Acquisition of another company/takeover
Acquisition of a project/projects
0% 10% 20% 30% 40% 50% 60%
2014 2015 2016
KEY COMPANY STRATEGIES FOR THE NEXT 12 MONTHS
0%
10%
40%
20%
50%
30%
80%
60%
70%
Acknowledging market conditions,
generally minimising expenditure until funding position allows increased
activity
Focus on the development of key exploration/
development stage assets
Taking advantage of current valuations
to secure the acquisition of
attractive projects/ companies
Development of an asset into (full) production
Seek opportunities for another
business/assets to be vended into the
company to achieve a backdoor listing
Driving operational efficiencies at
current operating mine(s)
Other
Perc
enta
ge o
f res
pond
ents
2014 2015 2016
Percentage of respondents

21
From a long-term strategy perspective, shareholder value can be delivered through various approaches in the mining sector. Of course, it does not necessarily follow that a gold exploration company will one day deliver shareholder value through developing and operating a gold mine. Yet, when we asked our respondents to define the core longer term strategy of their junior mining company, the top response (44%) was an intention to successfully transition from an exploration company into a mining company. Development of a project into production can of course generate significant value. However, making the transition from exploration to production typically requires fundamental changes to most aspects of the business and it may be more realistic for some companies to consider developing assets and then delivering shareholder value through a sale/joint venture etc.
INVESTOR CORNER
Investors are looking for clear strategies. In the junior mining sector, many companies spend a significant amount of time looking for more attractive projects to acquire. Whilst it is always good to be open to new opportunities, investors appreciate clarity and focus. Therefore companies that have attractive assets should be focused and prioritise their time progressing their existing project(s) as quickly and as effectively as possible.
Management teams of companies that have had low activity levels for several years (due to funding constraints) need to re-establish credibility and trust by delivering on what they have set out they will do.
‘Communicate. Think outside the box. Consider opportunities to partner.’
David Izzard, SMS Innovative Mining Solutions
LONG TERM STRATEGY
32%
44%
15%
1%
8%
2016
To create value through mineral discovery
To successfully transition from an exploration company into a mining company
To purchase and operate an existing mine
To develop attractive assets and then secure the best price for them
Other“THERE IS A STRONG NEED TO STAY ABREAST OF INDUSTRY TRENDS AND OPPORTUNITIES”
RESPONDENT QUOTE
22
INNOVATIONMINING 3.0: DRONES AND SOCIAL MEDIAJUNIOR MINERS ARE BECOMING MORE OPEN TO NEW TECHNOLOGIES AND THE PACE OF INNOVATION IN THE JUNIOR MINING SECTOR APPEARS TO BE INCREASING.
Whilst there is clear evidence of the use of cutting edge technology at the big end of town, with majors operating driverless trucks and trains and running operations from remote centres, technology use has been slower to filter down to juniors. The results from our 2015 JUMEX survey were disappointing on this point, with a third of respondents seeing innovation as having minimal or no impact on the junior mining sector in the coming 12 to 24 months. The great news is that this has changed significantly with respondents increasingly keen on driving innovation: the percentage of nay-sayers regarding opportunities to innovate within the industry has dropped from a third in 2015 to a tenth in 2016.
There are now many technologies that are applicable to juniors, including improved exploration and drilling technologies, improved technologies for data processing and interpretation and even the use of drones for surveying. These technologies reduce costs, speed up processes and deliver improved outcomes. We estimate that the year ahead will bring increased adoption of innovation mainly in terms of technologies employed during exploration, but also see opportunities for new approaches to project development and business model diversification.
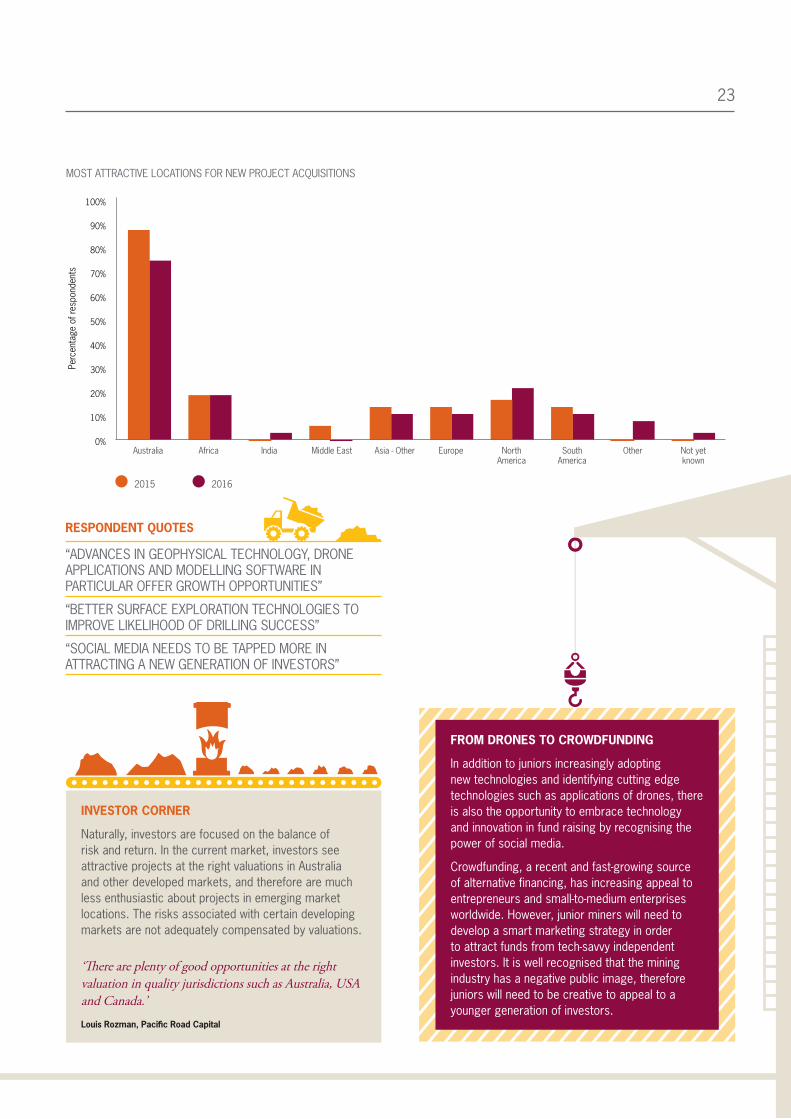
In terms of new locations for projects, a strong trend in recent years has been a refocus on Australia. With funding constrained and a number of companies having had negative experiences overseas, a high number of companies have restricted their search for new projects to Australia. Whilst Australia is still by far the most popular location, with more positive sentiments starting to appear a growing number are looking offshore. This year 76% of respondents are considering Australian projects, down from 89% in 2015. The most popular location offshore is now North America, with 22% of respondents considering North American locations for new project acquisitions, overtaking Africa which has been the top offshore spot since 2012.
INVESTOR CORNER
Whilst investors are keen to see new technologies adopted for improved exploration outcomes, they are very wary of new and unproven technologies or approaches that drive investment outcomes. With all new mining projects encompassing a wide range of risks, investors are unenthusiastic about projects where returns are dependent on the successful implementation of an unproven technology. Juniors need a balanced combination of technological innovation and risk management in order to attract investor interest and maximise valuations.
‘Innovation is important and companies we invest in have embraced technology. The challenge is that there can be so many risks in resource projects; technical risk, political risk and market risk, that it can be difficult to add technology risk.’
Louis Rozman, Pacific Road Capital
23
FROM DRONES TO CROWDFUNDING
In addition to juniors increasingly adopting new technologies and identifying cutting edge technologies such as applications of drones, there is also the opportunity to embrace technology and innovation in fund raising by recognising the power of social media.
Crowdfunding, a recent and fast-growing source of alternative financing, has increasing appeal to entrepreneurs and small-to-medium enterprises worldwide. However, junior miners will need to develop a smart marketing strategy in order to attract funds from tech-savvy independent investors. It is well recognised that the mining industry has a negative public image, therefore juniors will need to be creative to appeal to a younger generation of investors.
“ADVANCES IN GEOPHYSICAL TECHNOLOGY, DRONE APPLICATIONS AND MODELLING SOFTWARE IN PARTICULAR OFFER GROWTH OPPORTUNITIES”
“BETTER SURFACE EXPLORATION TECHNOLOGIES TO IMPROVE LIKELIHOOD OF DRILLING SUCCESS”
“SOCIAL MEDIA NEEDS TO BE TAPPED MORE IN ATTRACTING A NEW GENERATION OF INVESTORS”
INVESTOR CORNER
Naturally, investors are focused on the balance of risk and return. In the current market, investors see attractive projects at the right valuations in Australia and other developed markets, and therefore are much less enthusiastic about projects in emerging market locations. The risks associated with certain developing markets are not adequately compensated by valuations.
‘There are plenty of good opportunities at the right valuation in quality jurisdictions such as Australia, USA and Canada.’
Louis Rozman, Pacific Road Capital
2015 2016
0%
10%
40%
20%
50%
30%
90%
100%
80%
60%
70%
Australia North America
Middle East Not yet known
Africa South America
Asia - OtherIndia OtherEurope
MOST ATTRACTIVE LOCATIONS FOR NEW PROJECT ACQUISITIONS
Perc
enta
ge o
f res
pond
ents
RESPONDENT QUOTES
24
SKILLSETS FOR GROWTHPROJECTED RECRUITMENT FIGURES ARE RECOVERING ACROSS THE INDUSTRY. JUNIOR MINING COMPANIES WILL SOON NEED TO ANSWER A LONGER TERM QUESTION: WHAT WILL THE NEW GENERATION OF EXPLORERS LOOK LIKE?
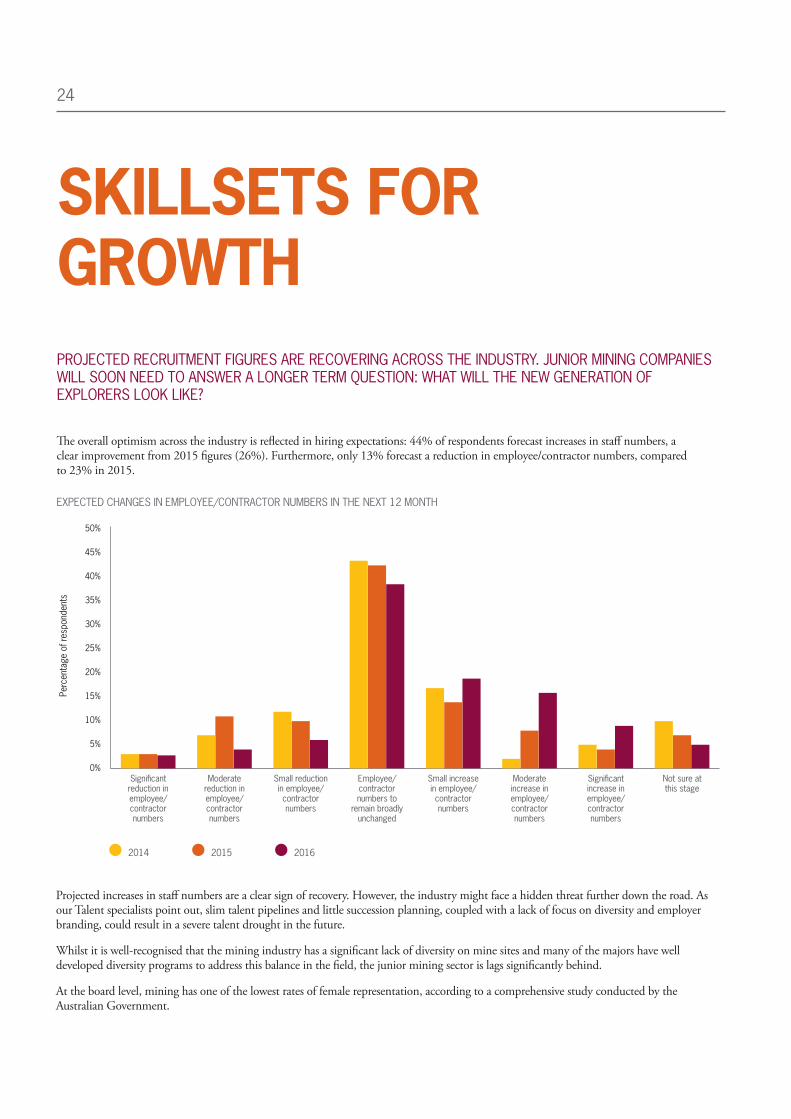
The overall optimism across the industry is reflected in hiring expectations: 44% of respondents forecast increases in staff numbers, a clear improvement from 2015 figures (26%). Furthermore, only 13% forecast a reduction in employee/contractor numbers, compared to 23% in 2015.
Projected increases in staff numbers are a clear sign of recovery. However, the industry might face a hidden threat further down the road. As our Talent specialists point out, slim talent pipelines and little succession planning, coupled with a lack of focus on diversity and employer branding, could result in a severe talent drought in the future.
Whilst it is well-recognised that the mining industry has a significant lack of diversity on mine sites and many of the majors have well developed diversity programs to address this balance in the field, the junior mining sector is lags significantly behind.
At the board level, mining has one of the lowest rates of female representation, according to a comprehensive study conducted by the Australian Government.
0%
5%
20%
10%
25%
15%
45%
50%
40%
30%
35%
EXPECTED CHANGES IN EMPLOYEE/CONTRACTOR NUMBERS IN THE NEXT 12 MONTH
Significant reduction in employee/contractor numbers
Moderate reduction in employee/contractor numbers
Small reduction in employee/contractor numbers
Employee/contractor numbers to
remain broadly unchanged
Small increase in employee/contractor numbers
Moderate increase in employee/contractor numbers
Significant increase in employee/contractor numbers
Not sure at this stage
Perc
enta
ge o
f res
pond
ents
2014 2015 2016

25
Our junior mining company respondents were asked to rate the diversity of their boards (considering all forms of diversity) and 36% consider their boards to be not particularly diverse, with only 6% rating their board as very diverse.
FEMALE BOARD REPRESENTATION ACROSS AUSTRALIAN COMPANIES – PROPOTION OF WOMEN ON BOARDS AND GOVERNING BODIES, BY INDUSTRY
Manufacturing
Mining
Professional, scientific and technical services
Financial and insurance services
All industries
0% 40%20% 100%80%60%
None
Up to a quarter
Up to a half
More than a half
Reference: Gender Equity Insights 2016. Inside Australia’s Gender Pay Gap, BCEC / WGEA Gender Equity Series
DIVERSITY OF JUMEX BOARDS TODAY
2016
Very diverse
Somewhat diverse
Not particularly diverse
6%
58%
36%
IMPORTANCE OF BOARD DIVERSITY FOR JUNIOR MINERS AND EXPLORATION COMPANIES
2016
Not all important
Slightly important
Moderately important
Very important
Extremely important
12%
24%
41%
20%
3%
Interestingly, whilst junior miners acknowledge the importance of the board (with key company personnel being the most common perceived competitive advantage, even ahead of the quality of assets and exploration potential), most respondents view professional experience and industry connections as far more important than diversity. When looking at diversity in all its forms, including skills, experience, age, gender and culture, over a third of respondents (36%) see diversity of the board as not at all or only slightly important.
26
This lack of recognition of the importance of diversity of thought at the board level is concerning, given the wide and growing body of evidence pointing to the benefits of board diversity, most significantly on corporate financial performance.
Many respondents noted the challenges in attracting board members through the past few years of funding constraints and hopefully improving sentiment will ease these constraints.
There are two key profiles that junior miners need in order to attract investor interest: engaged and experienced boards and management teams and strong technical specialists. The concern for the future is the pipeline of talent for an industry facing negative public perceptions and strong messages that the mining industry is diminishing in importance to the future of Australia.
The industry does need to adopt strategies to refresh its public image. However, before it starts marketing itself to a new social media-savvy and mobile generation, it should consider changing the weight it assigns to its talent pipeline planning and its definition of diversity.
“INDUSTRY IS TOO DEFENSIVE ABOUT ITS ROLE AND VALUE IN SOCIETY. WE HAVE SURRENDERED AUTHORITY TO THE ANTI-MINING ACTIVISTS”
“ALL THIS “TRANSITIONING” AWAY FROM MINING COMMENTARY IS NOT ONLY WRONG BUT IS DAMAGING COMMUNITY AND INVESTOR PERCEPTIONS OF THE SECTOR BOTH LOCALLY AND INTERNATIONALLY”
“A BOARD FOR A JUNIOR EXPLORER NEEDS TO BE PARTICULARLY NIMBLE, WITH DEEP CONNECTIONS INTO THE MINING AND EXPLORATION BUSINESS, PLUS CONNECTIONS INTO THE CAPITAL MARKETS. IT IS THESE SKILLS THAT ARE MOST IMPORTANT, WAY AND ABOVE “DIVERSITY””
“LOTS OF PROFESSIONAL LABOUR AVAILABLE, BUT THE BOOM HAS CREATED AN UNSKILLED GENERATION WITH OUT-OF-TOUCH EXPECTATIONS ON REMUNERATION. GENERALLY THE BOOM PROFESSIONALS CAN’T BE RE-DEPLOYED INTO THE NEW LOOK MINING SECTOR”
“SUITABLE CANDIDATES FOR ADDRESSING GENDER DIVERSITY TAKES TIME AND BOARD RENEWAL IS ALSO A DIFFICULT PROCESS”
INVESTOR CORNER
Apart from the attractiveness of the assets, investors’ number one factor when considering investment opportunities is the strength of the board and management team. Investors are looking for highly engaged teams, with skin in the game, a track record of success and relevant skills. It is important to recognise that different skills are needed at different stages of the development curve, so as companies progress the board structure and composition should be reviewed and adjusted.
Board members should invest personally so they have a significant interest. Having a number of independent directors is not considered as important at the junior stage – investors really want to see management teams who are highly motivated for success by personal investment.
‘Having good networks to solve problems quickly and at low cost is very important. The overall capability of the board, their track record, sense of commitment and energy are the most important things.’
Gordon Galt, Taurus Funds Management
When it comes to diversity, most investors consider it important.
‘Gender diversity is very important and the industry has a long way to go. It is also it is really important to have diversity of skills, age and experience. Without that diversity it may be difficult for a company to present their investment opportunity appropriately to fund managers who may be significantly younger.’
Andrew Sparke, Landstead Investors
RESPONDENT QUOTES
27
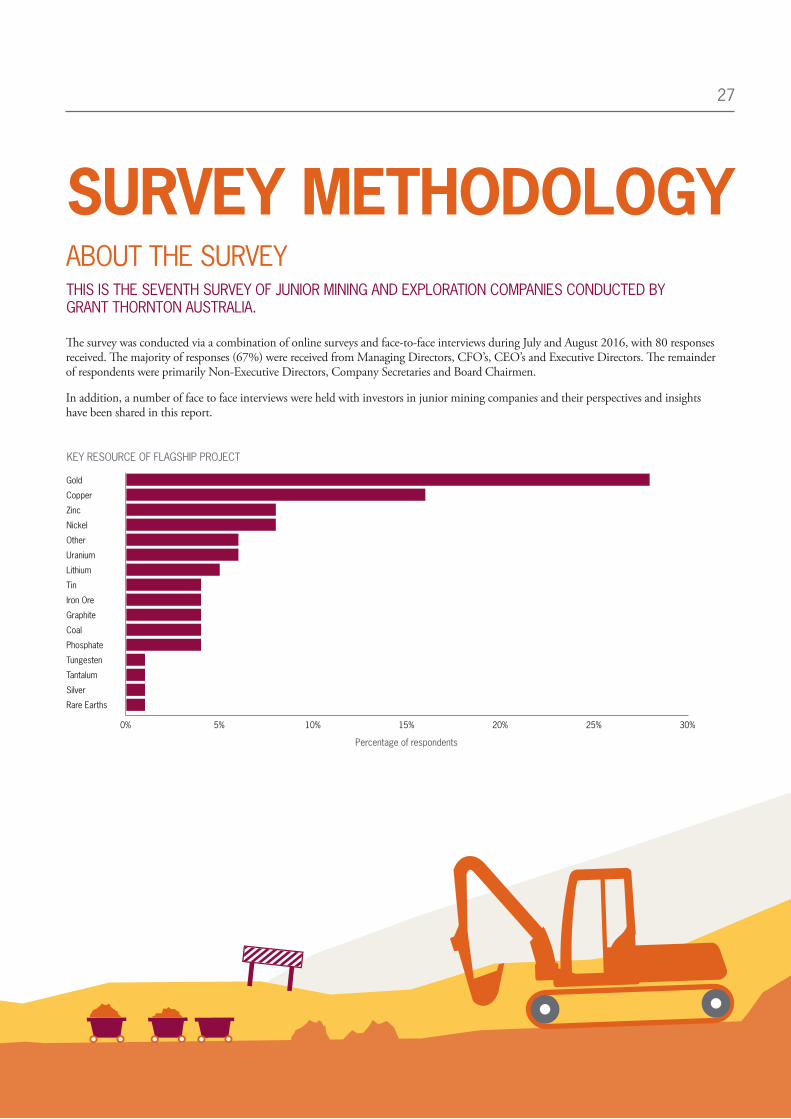
SURVEY METHODOLOGYABOUT THE SURVEYTHIS IS THE SEVENTH SURVEY OF JUNIOR MINING AND EXPLORATION COMPANIES CONDUCTED BY GRANT THORNTON AUSTRALIA.
The survey was conducted via a combination of online surveys and face-to-face interviews during July and August 2016, with 80 responses received. The majority of responses (67%) were received from Managing Directors, CFO’s, CEO’s and Executive Directors. The remainder of respondents were primarily Non-Executive Directors, Company Secretaries and Board Chairmen.
In addition, a number of face to face interviews were held with investors in junior mining companies and their perspectives and insights have been shared in this report.
KEY RESOURCE OF FLAGSHIP PROJECT
0% 5% 10% 15% 20% 25% 30%
Gold
Nickel
Lithium
Graphite
Tungesten
Copper
Other
Tin
Coal
Tantalum
Zinc
Uranium
Iron Ore
Phosphate
Silver
Rare Earths
Percentage of respondents

28
58%
5%
6%
4%
17%
3%
1%6%
LOCATION OF FLAGSHIP PROJECT
CURRENT STAGE OF FLAGSHIP PROJECT
26%
8%
12%21%
19%
5%
9%
Greenfield exploration
Brownfield exploration
Scoping study
Pre-feasibility
Bankable feasibility
Development
Mining
CURRENT MARKET CAPITALISATION (IN AUSTRALIAN DOLLARS)
<$2m
$2m - $5m
$5m - $10m
$10m - $20m
$20m - $100m
$100m - $500m
>$500m
14%
24%
30%
9%
1%
6%
16%
NSW 5%
QLD 9%
TAS 1%
NT 5%
SA 10%
WA 28%

29
IDEAS FOR GROWTH
OVER DELIVEROutline clear project milestones and meet them, or better still over deliver ahead of time and budget and investors will return for the next stage.
EXPLORE PARTNERSHIPS
Junior miners and explorers can benefit from partnering
with major players: from tapping into additional funding
to accessing new technologies, collaboration with majors
can be a win-win. Also consider more creative approaches
to collaborating with other juniors and even service
companies, to secure funding and fast track project
development and returns.
ATTRACT AND RETAIN WELL REGARDED BOARD MEMBERS WITH ‘SKIN IN THE GAME’
Junior mining boards are perceived as more attractive to investors when board members have significant personal financial interests and are therefore highly motivated to drive successful outcomes to the benefit of all investors. Ensure the board and management team have a broad range of relevant skills, diverse experience and strong networks. Take a long look at the board composition and consider whether new additions would bring fresh perspectives and allow access to new networks.
BE PREPARED TO MEET THE MARKET
Despite several years of restricted capital, many juniors are still reluctant to accept market valuations on financing packages. Of course it is very important to protect the interests of existing shareholders, however sometimes there is a need to meet the market in order to raise required funds and move on.
TURN RISK MANAGEMENT INTO AN ADVANTAGE
Investors are very focused on minimising risk – be
aware of these drivers and be highly selective when
evaluating new projects. Be disciplined in rejecting
projects with any high risk factors.
LEVERAGE THE STRENGTHS OF THE INDUSTRY
With industry image one of the key complaints of junior miners and explorers, it is perhaps time to review the manner in which the sector communicates. For example, many junior miners have strong community programs, particularly when working in developing nations and publicising these more effectively could be a good way to engage and attract younger generations of investors and employees.
30
KEY CONTRIBUTORS
ANZ provide a range of banking and financial products and services to around eight million customers and employ 48,000 people worldwide. Thank you in particular to Daniel Hynes who assisted with the macro-economic view and commodities outlook which is presented in the paper.
The Association of Mining and Exploration Companies (AMEC), which is the peak industry representative body for mineral exploration and mining companies throughout Australia. Our sincere thanks to Simon Bennison and his team for participating in our boardroom research discussions and helping us communicate the results.
A number of institutional and corporate investors focussed on the mining sector.
OUR SINCERE APPRECIATION IS EXTENDED TO THOSE THAT ASSISTED US WITH THIS RESEARCH AND CONTRIBUTED TO DEVELOPING OUR DEEPER UNDERSTANDING OF THE MARKET. WE REACHED OUT TO AND WERE SUPPORTED BY A NUMBER OF PARTIES INCLUDING:

31
ABOUT GRANT THORNTON
AUDIT & ASSURANCE
PRIVATE ADVISORY
Private wealth
Family office services
Superannuation
Business advisory services
TAX
FINANCIAL ADVISORY
Forensic consulting
Corporate finance
Restructuring advisory
GROWTH ADVISORY
Asia practice
Leadership, talent & culture
Technology advisory & solutions
Business risk services
Performance improvement
NATIONAL SPECIALIST TAX
Indirect tax
Transfer pricing
Remuneration taxes
PUBLIC SECTOR ADVISORY
These firms help dynamic organisations unlock their potential for growth by providing meaningful, forward looking advice. Proactive teams, led by approachable partners in these firms, use insights, experience and instinct to understand complex issues for privately owned, publicly listed and public sector clients and help them to find solutions.
Grant Thornton Australia has more than 1,200 people working in offices in Adelaide, Brisbane, Cairns, Melbourne, Perth and Sydney. We combine service breadth, depth of expertise and industry insight with an approachable “client first” mindset and a broad commercial perspective.
More than 42,000 Grant Thornton people, across over 130 countries, are focused on making a difference to clients, colleagues and the communities in which we live and work. Through this membership, we access global resources and methodologies that enable us to deliver consistently high quality outcomes for owners and key executives in our clients.
42,000+PEOPLE GLOBALLY
130+COUNTRIES
$4.6BNWORLDWIDE REVENUE 2015 (USD)
1,200+PEOPLE NATIONALLY
GRANT THORNTON IS ONE OF THE WORLD’S LEADING ORGANISATIONS OF INDEPENDENT ASSURANCE, TAX AND ADVISORY FIRMS.
OUR SERVICES TO DYNAMIC BUSINESSES
Grant Thornton Australia Limited ABN 41 127 556 389 ACN 127 556 389
‘Grant Thornton’ refers to the brand under which the Grant Thornton member firms provide assurance, tax and advisory services to their clients and/or refers to one or more member firms, as the context requires. Grant Thornton Australia Ltd is a member firm of Grant Thornton International Ltd (GTIL). GTIL and the member firms are not a worldwide partnership. GTIL and each member firm is a separate legal entity. Services are delivered by the member firms. GTIL does not provide services to clients. GTIL and its member firms are not agents of, and do not obligate one another and are not liable for one another’s acts or omissions. In the Australian context only, the use of the term ‘Grant Thornton’ may refer to Grant Thornton Australia Limited ABN 41 127 556 389 and its Australian subsidiaries and related entities. GTIL is not an Australian related entity to Grant Thornton Australia Limited.
Liability limited by a scheme approved under Professional Standards Legislation. Liability is limited in those States where a current scheme applies.
EPI.156.16
www.grantthornton.com.au
Holly Stiles Sydney
Partner – Corporate Finance T +61 2 8297 2487 E [email protected]
Justin Humphrey Adelaide
Partner – Audit & AssuranceT +61 8 8372 6621 E [email protected]
Tim Hands Brisbane
Partner – TaxT +61 7 3222 0367 E [email protected]
Gerry Mier Cairns
Market Leader T +61 7 4046 8800 E [email protected]
Brad Taylor Melbourne
Partner – Audit & Assurance T +61 3 8663 6137 E [email protected]
Peter Hills Perth
Partner – Tax T +61 8 9480 2126 E [email protected]
KEY CONTACTS