article · article j. braz. chem. soc., vol. 20, ... a contribuição dos veículos leves e pesados...
TRANSCRIPT
Arti
cle
J. Braz. Chem. Soc., Vol. 20, No. 3, 518-529, 2009.Printed in Brazil - ©2009 Sociedade Brasileira de Química0103 - 5053 $6.00+0.00
*e-mail: [email protected]
Particle-Associated Polycyclic Aromatic Hydrocarbons in a Suburban Region of Rio de Janeiro, Brazil, with Industrial and Traffic Emissions
Larissa F. C. S. Marques,a Graciela Arbilla,*,a Simone L. Quiterioa,b and Mauro Cesar S. Machadoc
aDepartamento de Físico Química, Instituto de Química da UFRJ, CT, Bloco A, Sala 408, Cidade Universitária, 21949-900 Rio de Janeiro-RJ, Brazil
bCentro Federal de Educação Tecnológica de Química de Nilópolis-Unidade Maracanã, Rua Senador Furtado 121, 20270-021 Rio de Janeiro-RJ, Brazil
cAnalytical Solutions, Rua Jardim Botânico, 1024, 22460-000 Rio de Janeiro-RJ, Brazil
Amostras de partículas totais em suspensão (PTS) e MP10 foram coletadas no Campus da FIOCRUZ, Rio de Janeiro (Brasil), entre abril de 2006 e março 2007, uma região suburbana com atividades industriais e comerciais intensas. Foram determinadas as concentrações de 16 compostos policíclicos aromáticos (HPAs) usando cromatografia gasosa acoplada com espectrometria de massas. As concentrações individuais se encontraram entre o limite de detecção (acenaftileno, acenafteno, antraceno e fluoreno) e 6,16 ng m-3 para o benzo[b]fluoranteno. Os cinco HPAs mais importantes, no PTS, foram B[b]F, Ipy, Py, Chry e DB[ah]An e a soma das concentrações médias dos 16 HPAs foi 15,53 ng m-3. Os mesmos compostos mais abundantes foram encontrados em MP10, onde foi determinada uma massa total de 8,99 ng m-3. Foram calculadas as relações características e as emissões veiculares foram identificadas como as fontes potenciais de HPAs no material particulado. A contribuição dos veículos leves e pesados é significativa, mas a análise de conglomerados e a análise fatorial não permitiram a classificação em emissões do diesel e da gasolina.
From April 206 to March 2007, total suspended particles (TSP) and PM10 samples were collected at the Campus of FIOCRUZ, situated in a suburban region with intense industrial and commercial activities in Rio de Janeiro (Brazil). The concentrations of 16 selected polycyclic aromatic hydrocarbons (PAHs) were determined by gas chromatography with mass selective detection. Individual concentrations were between the detection limit (acenaphtylene, acenaphthene, anthracene and fluorene) and 6.16 ng m-3 for benzo[b]fluoranthene. The five most abundant PAHs, in TSP, samples were B[b]F, Ipy, Py, Chry and DB[ah]An, and the mean sum of 16 PAHs was 15.53 ng m-3. The same most abundant compounds were obtained in PM10 samples and a total mean mass of 8.99 ng m-3 was determined. Diagnostic ratios were calculated and vehicular emissions were determined as the potential sources for PAHs in particulate matter. The contribution of both light duty and diesel engines is significant, but the cluster and factorial analysis failed to classify clearly in gasoline or diesel emissions.
Keywords: polycyclic aromatic hydrocarbons, total particulate matter, PM10, diagnostic ratios, vehicular emissions
Introduction
Polycyclic aromatic hydrocarbons (PAHs) are products of incomplete combustion and pyrolysis of organic matter such as coal, oil, wood, diesel oil and petroleum.1
In urban areas, where the major contributors to anthropogenic emissions are vehicular sources, PAHs are predominant due to the combustion of fuels, mainly gasoline and diesel.2
Many studies developed in Brazil and several urban locations in the world showed that PAHs contributed substantially to atmospheric pollution. In Brazil, most studies were conducted in urban centers and many reports
Marques et al. 519Vol. 20, No. 3, 2009
were published in the last twenty years. In 1996, Lopes and De Andrade3 reviewed the sources, reactivity and analytical methods to determine PAHs and the main results obtained up to that date. Among the studies published in the last ten years, we may mention those conducted in the cities of São Paulo,4-6 Rio de Janeiro,7-10 Porto Alegre,11,12
Campo Grande,13,14 Niterói,15-20 Campos dos Goytacares21 and Salvador.22 Most of these and other studies reported PAHs concentrations in total suspended particles (TSP). Data for inhalable particles (PM10) are rather sparce.5,9,11,23 Also, some results in PM 2.5 were reported.6,12
Certainly, several studies report data for other places in the world. Nevertheless, it should be noted that concentrations of PAHs depend on several factors such as geographical and meteorological conditions, sampling, extraction and analysis procedures, sampling seasons and emission sources. Comparisons between literature data may lead to incorrect conclusions. For all these reasons, data for other countries are not discussed here and comparisons with other reports for Brazilian cities may be considered with caution.
To our knowledge, PAHs concentrations data for the metropolitan area of Rio de Janeiro (RJMA), Brazil, are in general related to total particulate matter. Since the high level of particulate matter is considered to be the main air quality problem in the RJMA,23 considering the biological properties of some PAHs, it is important to understand the abundance and potential sources of PAHs in order to improve the mechanisms for atmospheric pollution control.
In the metropolitan area of Rio de Janeiro, Bonsucesso is considered to be one of the most polluted suburbs. Values reported by FEEMA, the regulatory state agency for air quality, show that for the period of 1998-2005, PM10 levels in Bonsucesso were between 80 and 110 µg m-3.24 The reported value for 2006 was 76 µg m-3.24 These values are higher than 50 µg m-3, the primary and secondary standards for Brazil.25
In this work, the concentrations of the 16 PM10-bound PAHs included in the EPA’s Priority Pollutant list26 will be reported: naphthalene (Na), acenaphthene (Ace), acenaphtylene (Acy), fluoranthene (Flt), phenanthrene (Phe), anthracene (An), fluorene (Flu), pyrene (Py), benzo[a]anthracene (B[a]An), chrysene (Chry), benzo[b]fluoranthene (B[b]F), benzo[k]fluoranthene (B[k]F), benzo[a]pyrene (B[a]Py), dibenz[ah]anthracene (DB[ah]An), benzo[ghi]perylene (B[ghi]Pe) and indene[1,2,3-cd]pyrene (IPy). Samples of total suspended particles and PM10 were collected in the area of Bonsucesso. Previous studies in this area in total particulate matter27,28 and PM109 gave quite controversial results. As previously
discussed, concentrations obtained by Quiterio et al.9 in 2005 were about ten times lower than those obtained in 1999. The difference was attributed to the reduction of the production and further closing of a petroleum refinery (Manguinhos), located about 1.5 km from the sampling site, in 2005. The refinery was re-opened in 2006 only for the commercialization of derivatives, and the refine of petroleum was not re-initiated because of economic reasons. In February 2007, the refinery was authorized by the state government to produce biodiesel. Because of that a further detailed comparison of the TSP and PM10 samples seems interesting.
Experimental
The area of study
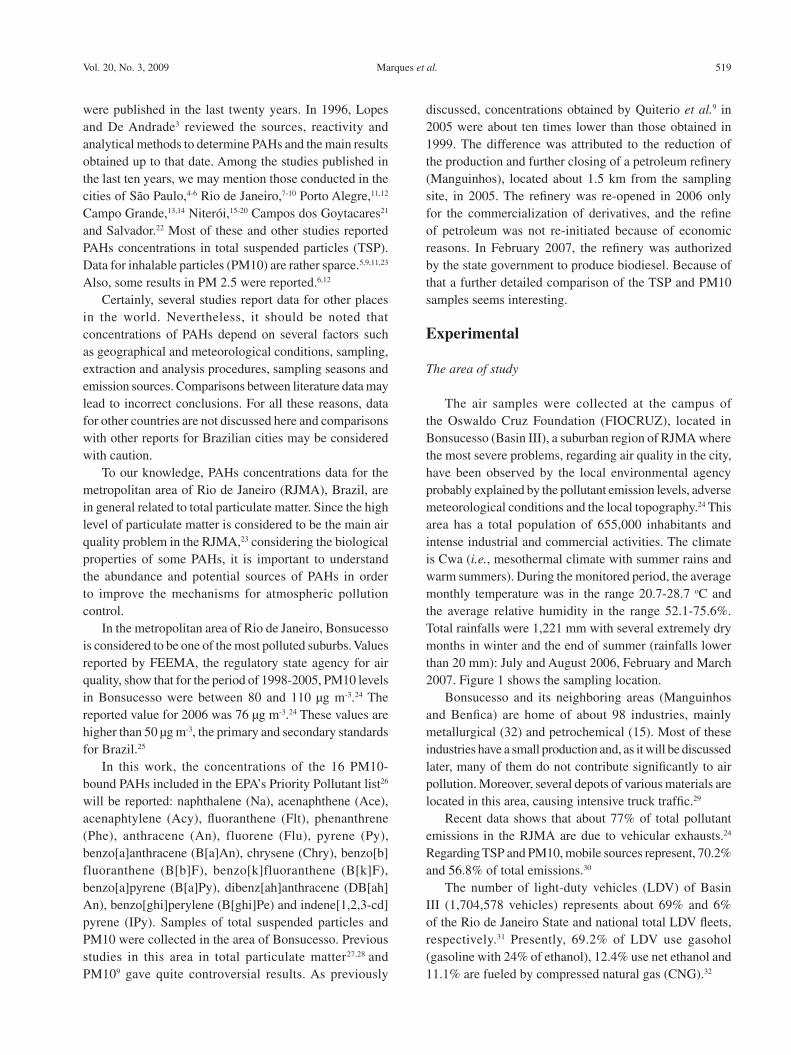
The air samples were collected at the campus of the Oswaldo Cruz Foundation (FIOCRUZ), located in Bonsucesso (Basin III), a suburban region of RJMA where the most severe problems, regarding air quality in the city, have been observed by the local environmental agency probably explained by the pollutant emission levels, adverse meteorological conditions and the local topography.24 This area has a total population of 655,000 inhabitants and intense industrial and commercial activities. The climate is Cwa (i.e., mesothermal climate with summer rains and warm summers). During the monitored period, the average monthly temperature was in the range 20.7-28.7 oC and the average relative humidity in the range 52.1-75.6%. Total rainfalls were 1,221 mm with several extremely dry months in winter and the end of summer (rainfalls lower than 20 mm): July and August 2006, February and March 2007. Figure 1 shows the sampling location.
Bonsucesso and its neighboring areas (Manguinhos and Benfica) are home of about 98 industries, mainly metallurgical (32) and petrochemical (15). Most of these industries have a small production and, as it will be discussed later, many of them do not contribute significantly to air pollution. Moreover, several depots of various materials are located in this area, causing intensive truck traffic.29
Recent data shows that about 77% of total pollutant emissions in the RJMA are due to vehicular exhausts.24 Regarding TSP and PM10, mobile sources represent, 70.2% and 56.8% of total emissions.30
The number of light-duty vehicles (LDV) of Basin III (1,704,578 vehicles) represents about 69% and 6% of the Rio de Janeiro State and national total LDV fleets, respectively.31 Presently, 69.2% of LDV use gasohol (gasoline with 24% of ethanol), 12.4% use net ethanol and 11.1% are fueled by compressed natural gas (CNG).32
Particle-Associated Polycyclic Aromatic Hydrocarbons in a Suburban Region of Rio de Janeiro, Brazil J. Braz. Chem. Soc.520
Regarding high duty vehicles (HDV), they represent about 58% and 3.4% of the Rio de Janeiro State and national total number of truck and buses, currently fueled by diesel, respectively.31
Two samplers were installed at FIOCRUZ in an area distant from any buildings or trees (S: 22052`47``/ W: 43014`25``), at approximately 50 m from Brazil Avenue and about 200 m from the Faria Timbo river, which is polluted by industrial rejects. Brazil Avenue is the most important highway that connects the downtown area of the city with the suburban region of the RJMA (Duque de Caxias and the other cities of Baixada Fluminense and the west area of the City of Rio de Janeiro). At rush hour, 20-30% of the vehicular fleet in Brazil Avenue consists of diesel-fueled buses and trucks,33 which are the major contributors (about 56%) to atmospheric particulate matter concentrations emitted by mobile sources since levels of emissions by light-duty vehicles are controlled by the national government through a severe legislation.34 Additionally, Brazil Avenue accounts for 25-30% of the total vehicular emissions in the RJMA, with the contribution of about 250,000 cars a day.24,30
Sampling
Sampling of ambient TSP and PM10 was conducted during the period April 2006-March 2007. A total of 30 samples of both TSP and PM10 were taken. During daytime, 6 h samplings were carried out by using two high-volume samplers (Sibata, Model HVC500) with a
flow rate of aspiration of 500 L min-1 (25 ºC, 760 mmHg)
and borosilicate glass micro fiber filters with a porosity of 0.8 µm and a diameter of 110 mm (Sibata). The samplers were located 2 m above the ground in two locations approximately 20 m apart. Unfortunately, for security reasons, it was not possible to install and operate the samplers after sunset and during weekends.
After sampling, filters were wrapped in aluminum foil and stored at −20 ºC for no more than 14 days prior to extraction.
Extraction procedure and analysis
In order to check the best extraction procedure, a standard solution containing the 16 PAHs specified on USEPA Method 61034 and internal standards (naphthalene-D 8, acenaphthene-D10, phenanthrene-D10, chrysene-D12, and perylene-D12) obtained from AccuStandard was used. A known PAHs standards amount was added to a blank filter and submitted to three different procedures for comparison: ultrasonic extraction, agitating table and both, at different dichloromethane (DMC) volumes and extraction times.
Best recoveries (85-95%) were obtained with the procedure described bellow (Method 3550b36), which was followed for all the samples.
Briefly, the filters were cut and 50 mL dichloromethane (DCM) added. Prior extraction, surrogate PAHs (2-Fluorobiphenyl, D14-Terphenyl) were added (Method 8270-Surrogate Standard M-8270-SS-PAK37). Thus the samples were extracted by ultrasom, using Technal Model USC 1400 equipment, for 15 min. Then, the organic extract was filtered and stocked at a temperature below −4 oC. The procedure was repeated more three times and then another extraction using 100 mL of DMC for 20 min was performed. The extracted and concentrated samples were stored at −20 oC up to chromatographic analysis.
All samples were analyzed using gas chromatography (GC Agilent Model 6890) with mass selective detection (Agilent Model 5973) following Method 8270c.37 A 30 m × 0.25 mm × 0.25 µm films HP-5 (5% of phenilmetilsiloxane and 95% of dimetilsiloxane) was used. Samples of 1 µL were injected using splitless mode with 60 mL min-1 at 0.75 min and an injector temperature of 300 oC. The carrier gas was helium at a constant flow of 1.2 mL min-1. Oven temperature was programmed as follows: 50 ºC for 2 min; 12 ºC min-1 until 300 ºC, with final isotherm for 10 min. Quantitative analyses were performed using a single ion monitoring (SIM) method of electron energy, 70 eV. The molecular ion of each PAHs was used for quantification and specific ion for confirmation was monitored as well.
Figure 1. Map of the sampling location (FIOCRUZ Campus, Rio de Janeiro) and Basin III area.

Marques et al. 521Vol. 20, No. 3, 2009
Data acquisition and processing were controlled by a Chemstation data system, from Agilent Technologies.
Chromatografic peaks were identified and quantified, based on retention times and mass spectra, by GC-MS using authentic standard compounds as a reference (AccuStandard-naphthalene (Na), acenaphtylene (Acy), acenaphthene (Ace), fluorene (Flu), phenanthrene (Phe), anthracene (An), fluoranthene (Flt), pyrene (Py), benzo[a]anthracene (B[a]An), chrysene (Chry), benzo[b]fluoranthene (B[b]F), benzo[k]fluoranthene (B[k]F), benzo[a]pyrene (B[a]Py), indene[1,2,3-cd]pyrene (IPy), dibenz[ah]anthracene (DB[ah]A) and benzo[ghi]perylene (B[ghi]P)). Field blanks, which accompanied samples to the sampling sites, were used to determine any background contamination.
Analytical accuracy and precision was assessed for PAHs analysis by conducting replicate analysis of a standard solution containing the 16 PAHs. The procedure showed relative standard deviation of approximately 10%. The surrogate recoveries were 48-72%. PAHs concentrations were corrected for recovery efficiency during extraction.
Detection (LOD) and quantification (LOQ) limits were calculated following Ribani et al.,38 using the equations 1 and 2:
LOD = 3.3 s/S (1)LOQ = 10 s/S (2)
Where s is the standard deviation and S is the slope of the regression equation calculated using seven points with concentrations similar to the lowest point in the calibration curve. The LOD and LOQ were estimated as 0.006 ng m-3 and 0.018 ng m-3, respectively.
Statistical analysis
Uniunivariate analysis was initially performed and the histogram for each determined compound was displayed in order to investigate the statistical distribution of data. Then, experimental data were analysed through cluster analysis (CA) using the STATISTICA (Statsoft) program. Also, factorial analysis was carried out to confirm previous results.
Results and Discussion
TSP and PM10 levels
TSP and PM10 levels were determined by gravimetry. TSP and PM10 levels were in the range 70 to 950 µg m-3
and 20 to 189 µg m-3, respectively. For TSP, the geometrical
mean concentration for the period was 382 ± 239 µg m-3. In the same period, the PM10 arithmetic mean concentration was 64 ± 52 µg m-3. This value is in the same range as the reported value for 200624 and, as previously noted, it is higher than the primary and secondary standards for Brazil.25
PAHs levels in TSP
The concentrations of the studied PAHs samples are shown in Figure 2. The average values (in ng m-3) are mean values for the 30 samples. Individual concentrations were between the detection limit (acenaphtylene, acenaphthene, anthracene and fluorene) and 6.16 ng m-3 for benzo[b]fluoranthene.
As previously discussed in the introduction, levels of PAHs are dependent on sampling site location, meteorological conditions, sampling, extraction and analysis procedures and emission patterns. A direct comparison between different studies is not straightforward and may lead to incorrect conclusions. However, to put our data into perspective, a comparison of our data with other results for Rio de Janeiro and neighboring cities is presented in Table 1.3,5,9,11,27
In general, the values found in this work are similar to the ones obtained by Pereira Netto et al.27 in samples collected in 1999 in the same location for total particulate matter. The samples were collected using the same experimental system and a 24 h period except for benzo[a]anthracene, chrysene and benzo(b)fluoranthene. For these compounds, the concentrations determined in 1999 are about twice the values obtained in this study for 2006-2007.
As reported by Lopes and De Andrade,3 Daisey and co-workers3 determined 9 PAHs in total particulate matter. Samples were collected, in 1984, in locations with high
Figure 2. Mean PAHs concentrations determined in the FIOCRUZ Campus, Rio de Janeiro, in the period of April 2006-March 2007 (n = 30). The bars indicate the minimum and maximum values for each compound.

Particle-Associated Polycyclic Aromatic Hydrocarbons in a Suburban Region of Rio de Janeiro, Brazil J. Braz. Chem. Soc.522
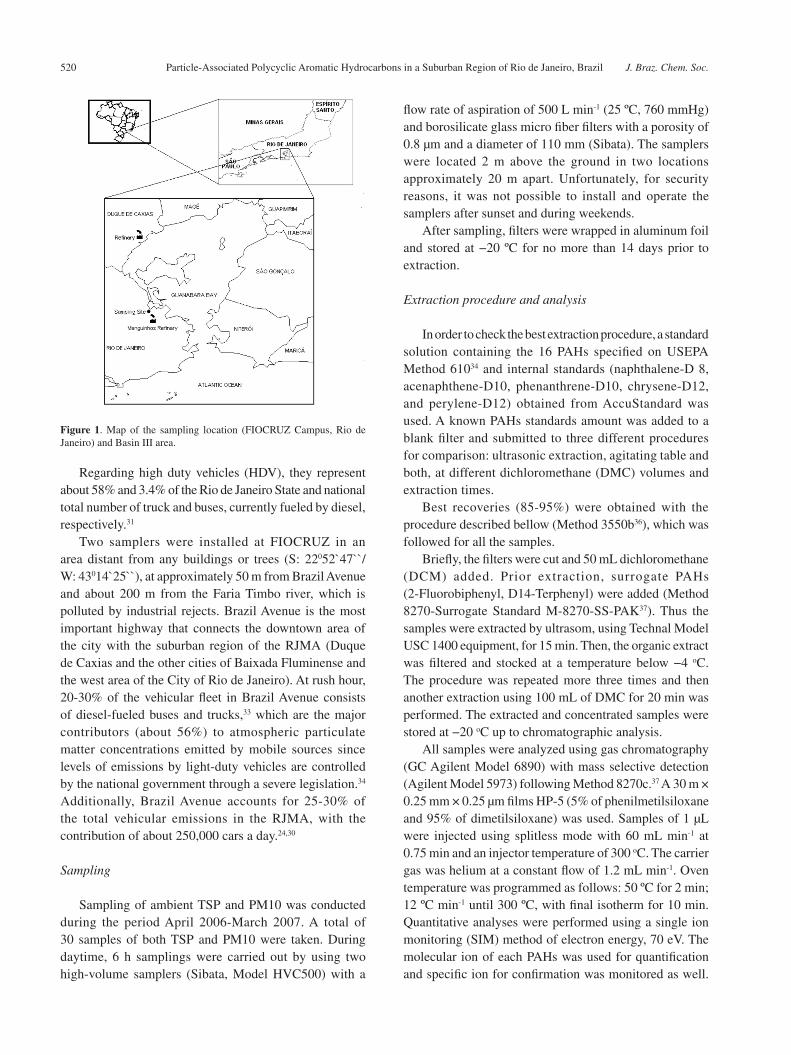
Table 1. PAHs mean concentrations (in ng m-3), obtained at FIOCRUZ Campus, Rio de Janeiro. Values obtained in other locations are shown for comparison. A brief description of each sampling location, sampling and analytical method is provided. Symbols and abbreviations are indicated as a footnote
Low molecular weight U.S. EPA priority PAHs
Molecular weight 128 152 154 166 178 178 202 202
Locations Description of the locations
Particles Sampling; period; extraction Analysis
Na Acy Ace Flt Phe An Flu Py
This study (FIOCRUZ) RJ, Brazil
Dense vehicular traffic
TSP HVS; 24 h; 1600 m3 ULT DCM
GC/MS 0.619 0.259 0.178 0.130 0.769 0.138 1.259 1.892
This study (FIOCRUZ) RJ, Brazil
Dense vehicular traffic
PM10 HVS; 24 h; 1600 m3 ULT DCM
GC/MS 0.438 0.129 0.081 0.056 0.448 0.063 0.637 1.012
Rio de Janeiro, Brazil27
Dense vehicular traffic
TSP HVS; 24 h; 500 L min-1 ULT DCM
GC/MS na na na 1.34 1.06 0.14 na 1.57
Niterói, Brazil27 Urban area TSP HVS; 24 h; 500 L min-1 ULT DCM
GC/MS na na na 0.30 0.27 0.031 na 0.38
Rio de Janeiro3 Dense vehicular traffic
TSP - HPLC na na na 1.49 na na na 1.28
Vila Isabel, RJ, Brazil3
Dense vehicular traffic
TSP - HPLC na na na 7.90 15.0 0.49 na 7.92
Santa Barbara Tunnel, RJ, Brazil3
Dense vehicular traffic
TSP HVS; 12 h; 1.12 m3 min-1
ULT MeCN
HPLC na na na 69.6 96.9 4.19 na 76.3
FIOCRUZ RJ, Brazil9
Dense vehicular traffic
PM10 HVS; 24 h; 1600 m3
ULT DCM
GC/MS 0.027 0.013 0.018 0.131 0.386 0.302 0.005 0.194
São Paulo, Brazil5
Center city PM10 HVS; 24 h; 0.66 m3 min-1
Soxhlet DCM
GC/MS 10.5 1.4 6.4 8.0 12.7 na 6.5 12.7
Porto Alegre, Brazil, CEASA11
Dense vehicular traffic
PM10 HVS; 24 h; 1.13 m3 min-1
Soxhlet DCM
GC/MS na na 0.06 0.41 0.53 0.06 0.15 0.19
Porto Alegre, Brazil, 8º Distrito11
Dense vehicular traffic
PM10 HVS; 24h; 1.13 m3 min-1 Soxhlet DCM
GC/MS na na 0.04 1.12 0.64 0.28 0.17 0.38
Porto Alegre, Brazil, Charqueadas11
Urban and industrial area
PM10 HVS; 24h; 1.13 m3 min-1 Soxhlet DCM
GC/MS na na 0.09 0.49 0.87 0.06 0.31 0.4
“ Carcinogenic” U.S. EPA priority PAHs39
Molecular weight 228 228 252 252 252 278 276 276
Locations Description of the locations
Particles Sampling; period; extraction Analysis
B[a]An Chry B[b]F B[k]F B[a]Py DB[ah]An B[ghi]Pe IPy
This study (FIOCRUZ) RJ, Brazil
Dense vehicular traffic
TSP HVS; 24h; 1600 m3 ULT DCM
GC/MS 0.847 1.401 2.369 0.901 1.031 0.275 2.113 1.379
This study (FIOCRUZ) RJ, Brazil
Dense vehicular traffic
PM10 HVS; 24h; 1600 m3 ULT DCM
GC/MS 0.534 0.822 1.528 0.591 0.639 0.122 1.105 0.753
Rio de Janeiro, Brazil27
Dense vehicular traffic
TSP HVS; 24h; 500 L min-1
ULT DCM
GC/MS 1.71 2.72 4.01 0.67 1.23 0.21 2.78 1.75
Marques et al. 523Vol. 20, No. 3, 2009
vehicular flux in the City of Rio de Janeiro. Levels obtained in this work are similar for Py, Chry, B[a]An, B[k]F and B[b]F. For B[a]Py and Flt concentrations in this study are 0.49 and 0.09 times values obtained by Daisey and co-workers3 in 1984.
In 1986, Miguel and Andrade3 quantified 11 PAHs in total particulate matter sampled in Vila Isabel, a residential-commercial area of Rio de Janeiro. They reported mean concentrations in the range 0.49 ng m-3 for anthracene to 19.9 ng m-3 for benzo[ghi]perylene. Total concentration in Vila Isabel was 121.2 ng m-3, that is 8.1 times higher than the value obtained in this study. Samples collected at Santa Bárbara Tunnel (1.3 km), in the same period, showed concentrations 5-10 times higher than those obtained in Vila Isabel,3 for total particulate matter, and 30-88 times higher than those obtained for PM10 in this study.
PAHs levels in PM10 samples
The concentrations of the studied PAHs samples are also shown in Figure 2. The average values (ng m-3) are mean values for 30 samples. Individual concentrations were between the detection limit (acenaphtylene, acenaphthene, fluorene and dibenz[ah]anthracene) and 4.61 ng m-3 for indene[1,2,3-cd]pyrene.
As shown in Table 1,3,5,9,11,27 results obtained by Quiterio et al.9 in samples collected in 2005 in the same location, are lower for almost all compounds, except for Phe and DB[ah]An, which are quite similar, and for Flt and An, which are 2.5 and 5 times higher, respectively. For the other compounds, results in this study are higher, in particular, 127 times for Flu, 16 times for B[b]F and Na, 10 times for Acy. Since samples were obtained using an AGV with a
“ Carcinogenic” U.S. EPA priority PAHs39
Molecular weight 228 228 252 252 252 278 276 276
Locations Description of the locations
Particles Sampling; period; extraction Analysis
B[a]An Chry B[b]F B[k]F B[a]Py DB[ah]An B[ghi]Pe IPy
Niterói, Brazil27
Urban area (Summer)
TSP HVS; 24h; 500 L min-1
ULT DCM
GC/MS 0.13 0.24 1.34 0.21 0.33 0.061 0.99 0.86
Rio de Janeiro3 Dense vehicular traffic
TSP - HPLC 0.97 1.40 2.29 1.04 2.62 na 4.01 2.86
Vila Isabel, RJ, Brazil3
Dense vehicular traffic
TSP - HPLC 8.08 9.87 14.6 3.7 17.6 na 19.9 16.1
Santa Barbara Tunnel, RJ, Brazil3
Dense vehicular traffic
TSP HVS; 12h; 1.12 m3 min-1 ULT MeCN
HPLC 51.3 69.5 88.2 36.7 90.7 na 162 84.2
FIOCRUZ RJ, Brazil9
Dense vehicular traffic
PM10 HVS; 24h; 1600 m3 ULT DCM
GC/MS 0.123 0.258 0.097 0.157 0.106 0.143 0.184 0.207
São Paulo, Brazil5
Center city PM10 HVS; 24h; 0.66 m3 min-1
Soxhlet DCM
GC/MS 4.3 7.0 12.8a na 2.7 0.2 3 3.2
Porto Alegre, Brazil, CEASA11
Dense vehicular traffic
PM10 HVS; 24h; 1.13 m3 min-1 Soxhlet DCM
GC/MS 0.43 0.35 0.751a 0.52 0.21 0.85 0.71
Porto Alegre, Brazil, 8º Distrito11
Dense vehicular traffic
PM10 HVS; 24h; 1.13 m3 min-1 Soxhlet DCM
GC/MS 1.28 0.8 1.801a 1.09 0.54 2.3 0.8
Porto Alegre, Brazil, Charqueadas11
Urban and industrial area
PM10 HVS; 24h; 1.13 m3 min-1 Soxhlet DCM
GC/MS 0.55 0.43 1.161a 0.38 0.26 0.99 0.93
Ace - Acenaphthene; Acy - Acenaphthylene; Flu - Fluorene; Na - Naphthalene; B[a]Py - Benzo(a)pyrene; B[b]F - Benzo(b)fluoranthene; B[k]F - Benzo(k)fluoranthene; B[ghi]Pe - Benzo(g,h,i)perylene; D[bah]An - Dibenz(a,h)anthracene; IPy - Indeno(1,2,3-cd) pyrene; An - Anthracene; Phe - Phenanthrene, Py - Pyrene, Flt - Fluoranthene; B[a]A - Benzo(a)anthracene; Chry – Chrysene; RJ: Rio de Janeiro; TSP: total suspended particulate matter; PM10: particulate matter with diameter less than 10 µm; HPLC: high performance liquid chromatography; GC/MS: gas chromatograph coupled to a mass spectrometry detector; HVS: high-volume sampler; DCM: dichloromethane; MeCN: acetonitrile; ULT: ultrasonically; a ∑B[k]F + B[b]F; na: no available; nd: not-detected; Lopes and De Andrade3 1996 ; Martinis et al.5 2002; Quiterio et al.9 2007; Dalarossa et al.11 2005; Pereira Netto et al.27 2001.
Table 1. continuation
Particle-Associated Polycyclic Aromatic Hydrocarbons in a Suburban Region of Rio de Janeiro, Brazil J. Braz. Chem. Soc.524
flow rate of aspiration of 1600 m3 and 24 h sampling period, the comparison between these results and those previously obtained by Quiterio et al.9 is not straightforward. Also, the meteorological and emission conditions may be quite different.
These values are in general lower than those reported for a residential/commercial district of São Paulo, Brazil, with dense vehicle traffic, in 1994.5 Samples were collected during 24 h periods using a flow rate of 660 L min-1. Mean concentrations observed in this work are 1.6 (DB[ah]An)-28.0 (Phe) times lower than the values reported for São Paulo.
A comparison of the results obtained in this work with those reported for Porto Alegre, another Brazilian city, State capital of Rio Grande do Sul, shows that our values are 0.14 (for Flt) to 5.3 (for Py) times those obtained in CEASA.11 This location is a great vegetable and fruit distribution center located near two highways with heavy traffic. Samples were collected during a continuous period of 24 h, every 15 days, between November 2001 and November 2002.11 Other sampling locations in the city of Porto Alegre were studied: an area with high traffic and the contribution of an hospital waste burning facility and a location near a national highway. In general, higher concentrations were determined.11
Values reported in this work are probably a low limit for PAHs concentrations.9 It is known that long sampling periods may alter the chemical composition of samples. Volatilization, chemical and photochemical transformations may lead to underestimated PAHs concentrations. Ciganek et al.39 reported a comparative study of PAHs concentrations determined in PM10 and GF/PUF (glass fiber filters and a polyurethane foam filter) samples collected at two urban stations in the city of Brno, Czech Republic. Compared with the high volume sampling of the PM10 fraction, sampling by the GF/PUF method gave a several times higher amount of low molecular weight U.S.EPA priority PAHs (Na, Acy, Ace, Flu, Phe, An, Flt, Py). Concentration for carcinogenic U.S.EPA priority PAHs, of higher molecular weights, are similar for both methods. Ciganek et al.39 concluded that sampling using the PM10 method could lead to an underestimation of overall PAHs concentrations and, in particular, low molecular weight compounds. Eventually, the use of another method of sampling could lead to higher PAH’s concentrations. Unfortunately, there are few studies reporting the vapor-phase PAHs in Brazil.13,14,40
In 2002, Tavares et al.40 determined the concentrations of vapor phase PAHs at the central bus station of Londrina (Brazil) where only diesel-powered vehicles circulate. Phenanthrene appeared as the most abundant PAH followed by fluorene and naphthalene. The ratio phenanthrene/fluorene (2.5) was attributed to direct emissions from diesel
exhausts and is clearly higher than the value obtained in this work, in which the volatile and semi-volatile PAHs are underestimated.
In 2003, Ströher et al.14 determined the PAHs collected in quartz filters and gas-phase PAHs using a polyuretane foam sampler. Three different sites were selected for sampling. In the first, an urban park, there were larger contributions of Na, DB[ah]An, Ipy, Chry and B[ghi]Pe. In the second location, a downtown square with intense traffic, the higher contributions were from Na, DB[ah]An, Ipy, Phe and B[ghi]Pe. The third location was an industrial area, and the most abundant PAHs were Na, B[ghi]Pe, DB[ah]An, Ipy and Phe. The authors indicated the vehicular traffic and the biomass combustion as major PAHs sources in the three sampling sites. Na and Phe concentrations were significantly higher than those determined in our study. Again, the underestimation of the volatile and semi-volatile compounds is the probable reason for this result.
Potential sources of PAHs
As pointed out by Guo et al.,41 it is possible to use PAHs concentrations and molecular ratios to distinguish emissions and indicate the impact of different sources of airborne compounds.42-45
These ratios should be carefully used because PAHs are emitted from a variety of sources and their profiles can be altered due to their reactivity,46 meteorological conditions, sampling and analytical methods.
In Table 2,17,47-55 diagnostic ratios between PAHs are presented. Typical ratios for diesel and gasoline vehicles, urban samples, soil dust and paved road dust are also listed for comparison. Ratios are very similar for PM10 and TSP samples.
In 2004, Manoli et al.47 published the PAHs profiles for several urban, industrial and geological sources, in particular diesel fueled buses, paved road dust and soil dust absorbed to PM10 samples. In general, diagnostic ratios for ambient urban samples were similar to those obtained for paved road and soil dust. Ratios obtained from the exhaust of diesel vehicles are rather different suggesting that the PM10 fraction has an important contribution of mechanical sources and re-suspension of dust. Many of these data are shown in Table 2. Urban samples were those determined by Mantis et al.48 in an Aristotelous street, in downtown Athens, with dense vehicular traffic and commercial activities, and by Manoli et al.47 in the city center of Thessalonike, Greece, an area with high commercial activities and traffic density.
The sum of concentrations of the nine combustion PAHs (CPAH) divided by the total concentration of PAHs
Marques et al. 525Vol. 20, No. 3, 2009
gave the value 0.85. This value is in the same range as the ratios reported for diesel vehicles47,48 and also for soil and paved road dust.47
The ratios B[ghi]Pe/B[a]Py, calculated as 2.61 and 2.15, for TSP and PM10, respectively, may be compatible with paved road dust and some urban samples. Some reported data for gasoline and diesel vehicles are also in this range. Nevertheless, these values are significatively higher than that determined by Manoli et al.47 for direct diesel exhaust and lower than the ratio for gasoline cars.
Considering the carcinogenic compounds, the ratios, B[a]An/(B[a]An + Chry) and B[a]Py/(B[a]Py + Chry) were calculated as 0.35-0.36 and 0.42, values associated to urban areas with a high vehicular flux and road dust.47
The ratios Flt/(Flt+Py) were calculated as 0.41 and 0.68 for TSP an PM10, respectively. These values are in good agreement with the ratios reported for soil and paved road dust.47 It is also very similar to the values previously reported by Dallarosa et al.12 for two urban areas in Porto Alegre (Brazil) with heavy traffic.
The vehicular fleet in Rio de Janeiro is distributed in 89% of light vehicles, 10% of trucks and 1% of buses. Light vehicles are fueled by neat ethanol (11%), vehicular gas (16%), flex (7%) and gasohol (66%), which is gasoline blended with 24% of ethanol.31,32
As previously noted, during the rush hour, in Brazil Avenue, about 20-30% of vehicles are fueled by diesel. Considering that particulate emissions of diesel motors
are greater than those of light-duty vehicles, an important contribution of diesel emissions may be expected (about 56%) and both emissions from cars and heavy vehicles should be considered.
The CPAH/∑PAH, Flt/(Flt + Py) B[a]An/(b[a]An + Chry) ratios are similar to those obtained by Tsapakis et al.46 in Santiago of Chile in 1998, for PM2.5 samples. The studied region was a large industrial urbanized area with a vehicular fleet of about 1,000,000 motor vehicles and industrial facilities (copper smelters, oil refineries, power plants and chemical industries).
Also, during the summer of 1998/1999, Fernandes et al.10 determined polycyclic aromatic and monoaromatic hydrocarbons in this location. Benzo[a]pyrene concentrations are in the same range of the values obtained in this work. Considering the B[ghi]Pe/Ipy ratio, the authors also identified mobile sources as the main pollutants emitters.
The Flt/(Flt+Py) obtained in this work for TSP is also in good agreement with the value reported by Azevedo et al.7
for the Rebouças Tunnel (0.40) and Cinelândia-downtown (0.34) in Rio de Janeiro. The samples were collected in 1997 and the authors concluded that the main sources contributing to the aerosol PAHs mixture were vehicle emissions (car emissions and used motor or lubrificating oils).
According to the emission inventory for the Rio de Janeiro Metropolitan Area, the contribution of mobile sources to the total emission of inhalable particulate
Table 2. Diagnostic PAHs ratios for samples obtained at FIOCRUZ Campus, Rio de Janeiro. Typical results for diesel and gasoline vehicles, urban samples, soil and paved dust and industrial furnaces are shown for comparison
This studyTSP
This studyPM10
Diesel vehicles
Gasoline vehicles
Urban samples
Soil dust
Paved road dust
Industrial furnaces
CPAH/∑PAH 0.85 ± 0.06 0.85 ± 0.11 0.7747; 0.8848
0.7347; 0.6053
0.9547 ; 1.1817; 09248
0.8947; 0.8347
0.8247; 0.8647; 0.8747
na
B[ghi]Pe/B[a]Py 2.61 ± 2.55 2.15 ± 1.41 0.1147; 3.6948; 1.2-2.249
3.0547; 1.7247; 2.5-3.349
2.0047; 1.2617; 4.3648
1.1847; 0.2547
2.7047; 1.0947; 3.6747; 0.9150
0.02-0.0655
B[a]An/(B[a]An +Chry) 0.35 ± 0.09 0.36 ± 0.10 0.7347; 0.3748
0.7647; 0.5847
0.4347; 0.2017; 0.4048
0.2947; 0.2047
0.6747; 0.4247; 0.3247; 0.5051,52; 0.3854
na
Flt/(Flt+Py) 0.41 ± 0.07 0.68 ± 0.15 0.3847; 0.4648
0.1447; 0.1747; 0.4754; 0.4151,52 0.4049
0.3747; 0.3417; 0.3848
0.5247; 0.6147
0.4247; 0.5247; 0.4249
0.21-0.2655
B[a]Py/(B[a]Py+Chry) 0.42 ± 0.11 0.42 ± 0.16 0.38-0.6551,52; 0.4653
na 0.1817 na na na
CPAH: Flt +Py+B[a]An+Chry+B[b]F+B[k]F+B[a]Py+B[ghi]Pe+IPy; Pereira et al.17 2002; Manoli et al.47 2004; Mantis et al.48 2005; Rogge et al.49 1993; Rogge et al.50 1993; Kavouras et al.51 1999; Kavouras et al.52 2001; Sienra et al.53 2005; Oda et al.54 2001; Yang et al.55 1998; na: no available.
Particle-Associated Polycyclic Aromatic Hydrocarbons in a Suburban Region of Rio de Janeiro, Brazil J. Braz. Chem. Soc.526
matter is about 42%. In 2005, Pires29 identified and compiled 1641 stationary sources of Metropolitan Area of Rio de Janeiro. In the city of Rio de Janeiro, 203 industries were identified as the main contributions are due to petroleum refineries (42%), energy production (31%), petrochemical industries (10%) and ceramic production (5%). In the sampling area, during the period April 2006-March 2007, the main industrial activities were those of metallurgical and petrochemical (plastic and rubber) facilities, the contribution of petroleum refinery was insignificant since, as previously discussed, Manguinhos refinery was not processing petroleum and oil. Considering these data, it may be expected that the industrial contribution should be clearly smaller than the vehicular input.
It must be noted that PAHs ratios may depend on the sampling procedure, meteorological variables, volatilization and photodegradation processes during sampling. Considering the standard deviations, ratios obtained in this work are very similar to those obtained by Quiterio et al.9 for the same location. Calculated ratios using the reported values for 199917 are quite different, mainly for CPAH/∑PAH (1.18) and B[ghi]Pe/B[a]Py (1.26), reinforcing the idea that since the interruption of the petroleum refine in the region, the main source of pollutants has been the vehicular flux.
The use of neat ethanol, gasohol (a mixture of 78% gasoline and 22% ethanol) and vehicular natural gas (about 80% methane) in the Brazilian vehicular fleet may result in different PAHs patterns from those found in other urban regions around the world. This fact has been previously discussed by Martinis et al.5 and Quiterio et al.9 and supports the necessity of more monitoring campaigns as well as the study of ethanol motor vehicular exhaust.
Multivariate analysis
In order to get some insight about the main correlations among PAHs, cluster analysis (CA) and factorial analysis (FA) were applied to each set of data.
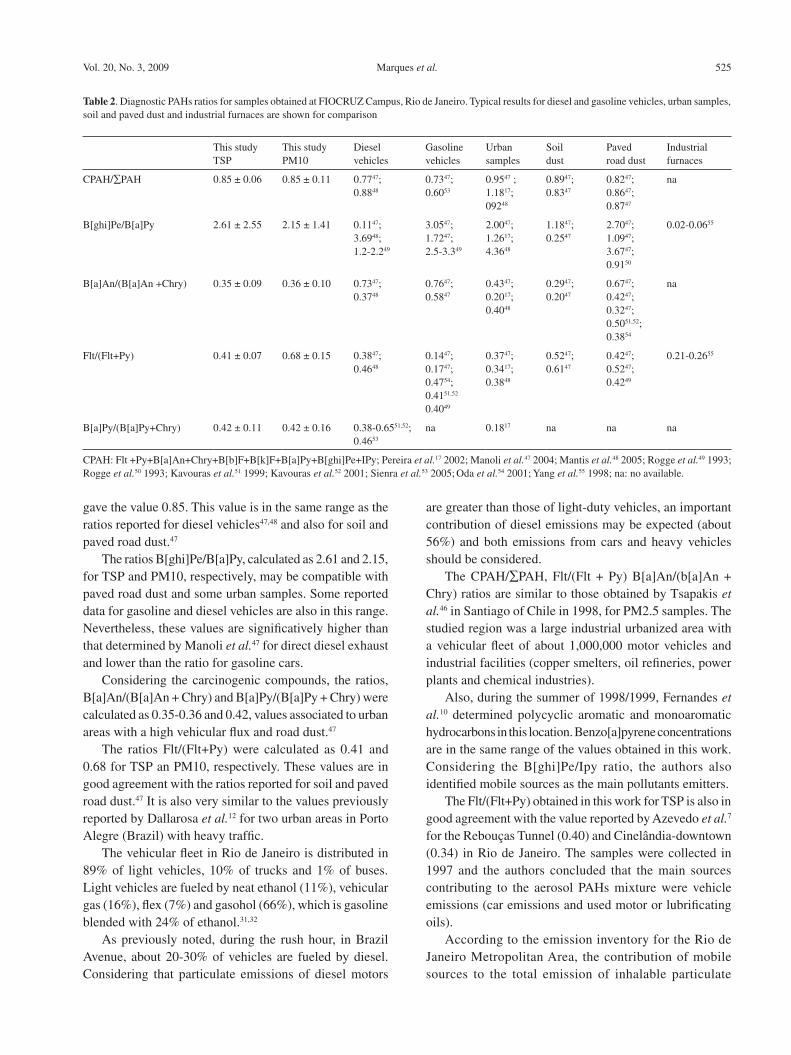
For TSP samples (Figure 3, Table 3), the correlation matrix [30 × 16] gave three main clusters and four significant principal components (PCs) which explain 82.4% of the total variance.
The first cluster contains the elements of PC2 (B[k]F, IPy, DB[ah]An, B[ghi]Per). The second cluster contains the PAHs included in the first principal component (Phe, An, B[a]An, Chry, B[a]Py) and fourth principal component (Phe, Flu, Py, B[b]F), the third cluster contains the elements of PC3 (Na, Acy, Ace, Flt). All components are mainly associated to vehicular emissions.
There is no clear classification in gasoline or diesel emissions. Both clusters and principal components seem to be grouped considering the vapor pressure of compounds, in the increasing order cluster 1 to cluster 3.
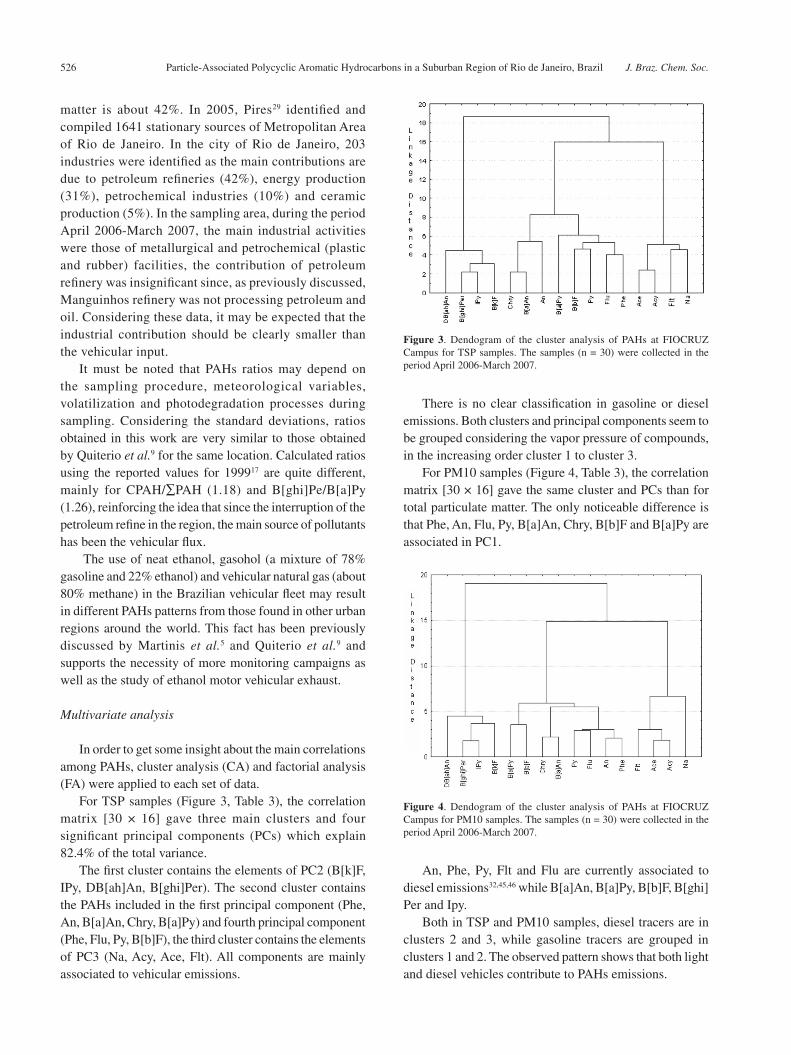
For PM10 samples (Figure 4, Table 3), the correlation matrix [30 × 16] gave the same cluster and PCs than for total particulate matter. The only noticeable difference is that Phe, An, Flu, Py, B[a]An, Chry, B[b]F and B[a]Py are associated in PC1.
An, Phe, Py, Flt and Flu are currently associated to diesel emissions32,45,46 while B[a]An, B[a]Py, B[b]F, B[ghi]Per and Ipy.
Both in TSP and PM10 samples, diesel tracers are in clusters 2 and 3, while gasoline tracers are grouped in clusters 1 and 2. The observed pattern shows that both light and diesel vehicles contribute to PAHs emissions.
Figure 3. Dendogram of the cluster analysis of PAHs at FIOCRUZ Campus for TSP samples. The samples (n = 30) were collected in the period April 2006-March 2007.
Figure 4. Dendogram of the cluster analysis of PAHs at FIOCRUZ Campus for PM10 samples. The samples (n = 30) were collected in the period April 2006-March 2007.
Marques et al. 527Vol. 20, No. 3, 2009
The available meteorological data were obtained in the two airports (Galeão and Santos Dumont) which re placed several kilometers from the sampling location and in an area with different topographical characteristics. Anyway the correlation between the concentrations values with temperature and rain falls registered at Galeão airport was checked. No relation was found between concentrations and meteorological parameters similar results were obtained previously for the same location.
The possibility of failing to obtain a clear grouping of PAHs in function of emission sources because other related parameters, such wind speed and direction, were not considered. Anyway, the contribution of other sources, such as waste burning and some industrial inputs may be probable reasons.
PAHs ratios are, as previously discussed, in apparent agreement with oil and fuel burning.
As previously suggested by Guo et al.,32 due to the similarity of PAHs profiles from different source types, individual PAHs may be used as source markers only when combined with data for other air pollutants.
Conclusions
Particle-associated PAHs were determined in the ambient air of a suburban region of Rio de Janeiro. The average concentrations for the sum of 16 PAHs were,15.53 and 8.99 ng m-3 for TSP and PM10 samples. PAHs profiles were very similar for both TSP and PM10 samples. The more volatile compounds were probably underestimated. Based on the diagnostic ratios and multivariate analysis, it is concluded that vehicular emissions were the predominant source of airborne PAHs in this are of Rio de Janeiro. The contribution of diesel engines is highly significant. Diagnostic ratios are in good agreement with previous data for the same location and may be considered as typical values for the Brazilian fleet.
Acknowledgments
We thank CNPq (Conselho Nacional de Desenvolvimento Científico e Tecnológico) and FAPERJ (Fundação de Apoio a Pesquisa do Estado do Rio de Janeiro) for the partial
Table 3. Results of PCA for the correlation matrix [30 × 16] obtained with TSP and PM10 data at FIOCRUZ Campus. The samples (n = 30) were collected in the period April 2006-March 2007.
TSP PM10
[30 × 16] [30 × 16]
PC 1 2 3 4 1 2 3
Eigenvalues 6.0 3.7 2.5 1.0 8.3 3.2 2.0
% total variance 37.3 23.3 15.4 6.4 52.0 20.2 12.2
Loading
Na 0.2 -0.2 0.7 0.5 0.4 0.0 0.6
Ace -0.1 0.1 0.9 0.0 0.2 0.1 0.9
Acy 0.0 0.0 1.0 0.0 0.1 0.0 1.0
Flu 0.3 -0.1 0.8 0.1 0.4 0.0 0.9
Phe 0.6 0.1 0.1 0.6 0.9 0.2 0.2
An 0.8 0.0 0.0 0.0 0.9 0.1 0.3
Flt 0.3 0.5 0.1 0.7 0.8 0.3 0.2
Py 0.2 0.1 0.1 0.9 0.9 0.2 0.2
B[a]An 0.9 -0.1 0.1 0.4 0.9 0.0 0.2
Chry 0.9 0.1 0.0 0.2 0.9 0.1 0.1
B[b]F 0.4 0.4 0.4 0.5 0.7 0.4 0.4
B[k]F 0.2 0.9 0.1 0.1 0.3 0.9 0.0
B[a]Py 0.6 0.5 0.2 0.1 0.7 0.6 0.1
IPy 0.0 1.0 –0.1 0.0 0.0 1.0 0.0
DB[ah]An -0.1 0.9 0.0 0.1 0.1 0.8 0.1
B[ghi]Pe 0.1 0.9 –0.1 0.1 0.2 1.0 0.1
Factor loadings > 0.5 are in bold.
Particle-Associated Polycyclic Aromatic Hydrocarbons in a Suburban Region of Rio de Janeiro, Brazil J. Braz. Chem. Soc.528
financial support. The authors also thank CESTEH/ENSP/FIOCRUZ, especially MSc. Marcos Menezes, for supplying the sampling equipment.
References
1. Yang, X.Y.; Okada, Y.; Tang, N.; Matsunaga, S.; Tamura, K.; Lin
J.M.; Kameda, T.; Toriba, A.; Hayakawa, K.; Atmos. Environ.
2007, 41, 2710.
2. Velasco, E.; Siegmann, P.; Siegmann, H.C.; Atmos. Environ.
2004, 38, 4957.
3. Lopes, W. A.; De Andrade, J. B.; Quim. Nova 1996, 19, 497.
4. Vasconcellos, P. C.; Zacarias, D. ; Carvalho, L. R. F. ; Pires, M.
A. F. ; Pool, C.; Atmos. Environ. 2003, 37, 3009.
5. De Martinis, B.; Okamoto, R. A. B.; Kado, N.Y.; Gundel, L.;
Carvalho, L. R. F.; Atmos. Environ. 2002, 36, 307.
6. Bourotte, C.; Forti, M. C.; Taniguchi, S.; Bícego, C.; Lotufo,
P. A.; Atmos. Environ. 2005, 39, 3799.
7. Azevedo, D. A.; Moreira, L. S.; Siqueira, D. S.; Atmos. Environ.
1999, 33, 4987.
8. Oliveira, A. S.; Fernandes, M. B.; Moreira, J. C.; Ferreira, L.
F. V.; J. Braz. Chem. Soc. 2002, 13, 245.
9. Quiterio, S. L.; Arbilla, G.; Bauerfeldt, G. F.; Moreira, J. C.;
Water, Air, Soil Poll. 2007, 179, 79.
10. Fernandes, M. B.; Brickus, L. S. R.; Moreira, J. C.; Cardoso,
J. N.; Chemosphere 2002, 47, 417.
11. Dallarosa, J. B.; Mônego, J. G.; Teixeira, E. C.; Stefens, J. L.;
Wiegand, F.; Atmos. Environ. 2005, 39, 1609.
12. Dallarosa, J. B.; Teixeira, E. C.; Meira L.; Wiegand, F.; Atmos.
Environ. 2008, 89, 76.
13. Ré-Poppi, N.; Santiago-Silva, M.; Atmos. Environ. 2005, 39,
2839.
14. Ströher, G. L.; Ré-Poppi, N.; Raposo Jr., J. L.; Souza, J. B. G.;
Microchem. J. 2007, 86, 112.
15. Pereira Netto, A. D.; Cunha, I. F.; Muniz, F. C.; Rego, E. C. P.;
Bull. Environ. Contam. Toxicol. 2001, 67, 271.
16. Pereira Netto, A. D.; Muniz, F. C.; Rego, E. C. P.; Bull. Environ.
Contam. Toxicol. 2002, 68, 831.
17. Pereira Netto, A. D.; Barreto, R. P.; Moreira, J. C.; Arbilla, G.;
Bull. Environ. Contam. Toxicol. 2002, 69, 173.
18. Pereira Netto, A. D.; Sisinno, C. L.; Moreira, J. C.; Arbilla,
G.; Dufrayer M. C.; Bull. Environ. Contam. Toxicol. 2002, 68,
148.
19. Pereira Netto, A. D.; Krauss, T. M.; Cunha, I. F.; Rego, E.C.P.;
Water, Air, Soil Pollut. 2006, 176, 57.
20. Lima, F. M.; MSc Disseratation, Federal University Fluminense,
Brazil, 2006.
21. Azevedo, D. A.; Dos Santos, C. Y. M.; Aquino Netto, F. R.;
Atmos. Environ. 2002, 36, 2383.
22. De Andrade J. B.; Pereira, P. A. P.; Miguel, A. H.; J. Environ.
Monit. 2002, 4, 558.
23. Dallarosa, J. B.; Teixeira, E. C.; Pires, M.; Fachel, J.; Atmos.
Environ. 2005, 39, 6587.
24. http:// www.feema.rj.gov.br, accessed in January 2007.
25. http://www.lei.adv.br/conama.htm, accessed in December 2007.
26. Public Health Services. Agency for Toxic Substances and
Disease Registry, [s.v.: s.n.]; Toxicological Profile for
Polycyclic Aromatic Hydrocarbons, Departament of Health
and Human Services: Atlanta, Georgia, U.S., August 1995,
487 pages.
27. Pereira Netto, A. D.; Barreto, R. P.; Arbilla, G.; Moreira, J. C.;
Bull. Environ. Contam. Toxicol. 2001, 66, 36.
28. Pereira Netto, A. D.; Barreto, R. P.; Moreira, J. C.; Arbilla, G.;
Bull. Environ. Contam. Toxicol. 2005, 75, 1004.
29. Pires, D. O.; MSc Dissertation, Federal University of Rio de
Janeiro, Brazil, 2005; <http://www.ppe.ufrj.br/ppe/production/
tesis/dopires.pdf >; accessed in April 2006.
30. Loureiro, L.N.; MSc Dissertation, Federal University of Rio de
Janeiro, Brazil, 2005, <http://www.ppe.ufrj.br/ppe/production/
tesis/lnloureiro.pdf>; accessed in November 2007.
31. http://www.denatran.gov.br, accessed in July 2007.
32. http://www.detran.rj.gov.br, accessed in July 2007.
33. Campos, I. C. B.; Pimentel, A. S.; Corrêa, S. M.; Arbilla, G.;
J. Braz. Chem. Soc. 1999, 10, 203.
34. http://www.ibama.gov.br, accessed in June 2005.
35. http://www.epa.gov/Region9/qa/pdfs/40cfr136_03.pdf,
accessed in July 2006.
36. http://www.epa.gov/epaoswer/hazwaste/test/pdfs/3550c.pdf,
accessed in July 2006.
37. http://www.epa.gov/epaoswer/hazwaste/test/pdfs/8270c.pdf,
accessed in July 2006.
38. Ribani, M.; Bottoli, C. B. G.; Collins, C. H.; Jardim, I. C. S. F.;
Melo, L. F. C.; Quim. Nova 2004, 27, 771.
39. Ciganek, M.; Neca, J.; Adamec, V.; Janosek, J.; Machala, M.;
Sci. Total Environ. 2004, 334-335, 141.
40. Tavares Jr., T.; Pinto, J. P.; Souza, A. L.; Scarmínio, I. S.; Solci,
M. C.; Atmos. Environ. 2004, 38, 5039.
41. Guo, H.; Lee, S. C.; Ho, K. F.; Wang, X. M.; Zou, S. C.; Atmos.
Environ. 2003, 37, 5307.
42. Venkataraman, C.; Lyons, J. M.; Friedlander, S. K.; Environ.
Sci. Technol. 1994, 28, 555.
43. Cotham, W. E.; Bidleman, T. F.; Environ. Sci. Technol. 1995,
29, 2782.
44. Harrison, R. M.; Smith, D. J. T.; Luhana, L.; Environ. Sci.
Technol. 1996, 30, 825.
45. Alves, C.; Pio, C.; Duarte, A.; Atmos. Environ. 2001, 35,
5485.
46. Tsapakis, M.; Lagoudaki, E.; Stephanou, E. G.; Kavouras, I.G.;
Koutrakis, P.; Oyola, P.; von Baer, D.; Atmos. Environ. 2002,
36, 3851.
47. Manoli, E.; Kouras, A.; Samara, C.; Chemosphere 2004, 56,
867.

Marques et al. 529Vol. 20, No. 3, 2009
48. Mantis, J.; Chaloulakou, A.; Samara, C.; Chemosphere 2005,
59, 593.
49. Rogge, W. F.; Hildemann, L. M.; Mazurek, M. A.; Cass, G. R.;
Simoneit, B. R. T.; Environ. Sci. Technol. 1993, 27, 636.
50. Rogge, W. F.; Hildemann, L. M.; Mazurek, M. A.; Cass, G. R.;
Simoneit, B. R. T.; Environ. Sci. Technol. 1993, 27, 1892.
51. Kavouras, I. G.; Lawrence, J.; Koutrakis, P.; Stephanou, E. G.;
Oyola P.; Atmos. Environ. 1999, 33, 4977.
52. Kavouras, I. G.; Koutrakis, P.; Tsapakis, M.; Lagoudaki, E.;
Stephanou, E. G.; Von Baer, D.; Oyola, P.; Environ. Sci. Technol.
2001, 35, 2288.
53. Sienra, M. R.; Rosazza, N. G.; Préndez, M.; Atmos. Res. 2005,
75, 267.
54. Oda, J.; Nombra, S.; Yasuhara, A.; Shibamoto, T.; Atmos.
Environ. 2001, 35, 4819.
55. Yang, H. H.; Lee, W. J.; Chen, S. J.; Lai, S. O.; J. Hazard. Mater.
1998, 60, 159.
Received: May 26, 2008
Web Release Date: March 6, 2009