03-liaw 6/2/03 1:57 pm page 41 - higher education learning
TRANSCRIPT

P A R T 3 Commercial Banks
4 Investment Banks
5 Investment Companies
6 Brokerage and Clearing Companies
7 Insurance Companies
MAJOR FINANCIAL INSTITUTIONSMAJOR FINANCIAL INSTITUTIONS
2
03-Liaw 6/2/03 1:57 PM Page 41

03-Liaw 6/2/03 1:57 PM Page 42

3Commercial Banks
The banking environment has undergone a structural change. Financial inno-vations, advances in technology, deregulation, and globalization have brokendown the boundaries between traditional industry sectors, and have con-tributed to increased inter- and intra-industry competition. Because of tech-nological developments, banks have branched into distant regions viaelectronic media.Today, the large multinational banks compete with each otherfor business on every continent. At the same time, nonbank financial institu-tions now offer many traditional banking services. Deposit insurance, reserverequirements, and capital requirements are among the very few traditionalcharacteristics still possessed by banks.
Facing this increasingly competitive and global market environment, bankshave expanded and continue to expand the array of services they offer.Deregulation has spurred this proliferation of banking services, which hasremoved most of the restrictions—imposed during the Great Depression of the1930s—that prevented banks from offering other financial services.As a result,commercial banks have entered new areas of business such as investment bank-ing, insurance, and asset management. The formation of Citigroup from theinvestment banking firm Salomon Smith Barney, the insurance companyTravelers Group, and the commercial banking giant Citicorp exemplifies thistrend toward the creation of financial services supermarkets.
The objectives of this chapter are to provide an understanding of:° The trends in the banking sector.° The implications of the financial modernization legislation.° Bank reserve requirements and capital requirements.° The use of technology in banking.° The main risks banks face and how they manage each type of risk.
C H A P T E R
Commercial Banks
43
03-Liaw 6/2/03 1:58 PM Page 43

MARKET OVERVIEW
Traditionally, banks have played several key roles in the economy. In their inter-mediation role, banks transform client savings into credit for businesses andindividuals. As payors, banks make payments for goods and services on behalfof their customers. In their guarantor role, banks provide guarantees of cus-tomers’ debt obligations. In addition, banks act as agents on behalf of their cus-tomers to manage and protect their property or to issue and redeem theirsecurities. Furthermore, banks play an important policy role in that they serveas a conduit for the Fed’s monetary policy actions to maintain price stabilityand sustainable economic growth.
Today, banks not only continue to perform these functions but have addeda host of new ones as well. As other financial services firms, such as securitieshouses and mutual fund companies, have begun to offer services that competewith traditional banking services, banks have countered by offering new prod-ucts and services and developing new methods of delivering them. Banks todaydo a lot more than just take deposits and make loans, as Table 3.1 shows.Thesefunctional changes have precipitated changes in organizational structure and atrend toward consolidation that continues to transform the banking industry.
Organizational Structures Banks fall under two categories of organization: independent banks or bankholding companies.An independent bank is a bank that doesn’t operate underthe control of a multibank holding company. Although an independent bankis often part of a one-bank holding company and may operate branches, it typ-
44 PART 2 Major Financial Institutions
TABLE 3.1 | Banking Services and Products
Traditional Services and Products:
Deposits and loans (consumer and business)Currency exchangesSafekeeping of valuablesSupporting government activities with creditTrust servicesFinancial advising
More Recent Services and Products:
Cash managementEquipment leasingVenture capitalInsurance servicesRetirement plansSecurities brokerage investment servicesMutual funds and annuitiesInvestment banking and merchant banking
03-Liaw 6/2/03 1:58 PM Page 44

ically conducts its business in its local or regional community. Most large bank-ing institutions are bank holding companies.A bank holding company ownsand manages subsidiary firms.The holding company is the parent organization,and the operating entities are the subsidiaries.
By definition, a small bank holding company has total consolidated assetsof less than $150 million, has no debt outstanding to the general public, anddoes not engage in nonbank activities involving financial leverage or in credit-extending activities. Large bank holding companies are either: (1) holdingcompanies with total consolidated assets of $150 million or more, or (2) multi-bank holding companies, regardless of size, that have debt outstanding to thegeneral public or engage in a nonbank activity involving financial leverage orin credit-extending activities.Table 3.2 lists the top fifteen bank holding com-panies in the United States.The largest banking concern, Citigroup, has totalassets of more than $1 trillion.Thirteen bank holding companies have assets ofat least $100 billion.
Geographic Expansion and GlobalizationSuch large bank holding companies have occurred in part by deregulation,which has removed restrictions on the ability of banks to expand geographically.In the past, bank branching across state lines was illegal unless the states involvedexpressly permitted interstate branching.The Riegle-Neal Interstate Bankingand Branching Efficiency Act of 1994 (IBBEA) permitted interstate branchbanking, thereby changing the landscape and structure of the banking industrythroughout the United States. Under the IBBEA, beginning on September 29,
CHAPTER 3 Commercial Banks 45
TABLE 3.2 | Top 15 Bank Holding Companies by Total Assets
Rank Name Headquartered State Total Assets ($ billions)
1 Citigroup NY 1,0572 J.P. Morgan Chase NY 7123 Bank of America NC 6194 Wachovia NC 3195 Wells Fargo CA 3116 Banc One IL 2627 Taunus Corporation NY 2258 FleetBoston MA 1929 ABN Amro North America IL 174
10 U.S. Bancorp MN 16411 HSBC North America NY 11012 SunTrust GA 10613 National City OH 10014 Keycorp OH 8015 Bank of New York NY 76
Note: Data are from National Information Center (http://www.ffiec.gov/nic) and are as of March 31, 2002.
03-Liaw 6/2/03 1:58 PM Page 45

1995, a bank holding company can acquire a bank in any state.There are twoimportant restrictions, though. First, the holding company’s community re-investment record must pass a review by the Federal Reserve Board of Gov-ernors.1 Second, limits on deposit concentrations apply; the total amount ofinsured deposits that any banking organization may obtain by mergers andacquisitions caps at 30 percent in a single state and 10 percent nationally.
Another aspect of this geographic expansion is that more large banks havegone global. Large U.S. banks such as Citibank, J.P. Morgan Chase, Bank ofAmerica, and Bank of New York provide banking services in many countries.Similarly, foreign banks such as Deutsche Bank, UBS, and Sumitomo haveoperations in the United States.These global banks compete with each otheron almost every continent of the world.
Functional ExpansionA functional expansion has accompanied the geographic expansion of banks,which has enabled banks to go far beyond their traditional functions andbecome veritable financial services supermarkets. A series of deregulatorymeasures, which removed many restrictions that had been imposed on thebanking industry during the Great Depression of the 1930s, has contributed tothis functional expansion. The intent of this legislation had been to try toensure the safety of the financial services industry by sharply segregating itsthree main components—banks, securities firms, and insurers.
One of the key pieces of this legislation was the Glass-Steagall Act of1933. Section 20 of the act prohibits the affiliation of a member bank (a bankthat is a member of the Federal Reserve System) with a company “engagedprincipally” in underwriting or dealing in securities. In 1987, the FederalReserve Board of Governors interpreted that phrase to allow bank subsidiaries,so-called section 20 subsidiaries or underwriting subsidiaries, to under-write and deal in securities that a member bank itself could not underwrite ordeal in.The Board approved applications by three bank holding companies tounderwrite and deal in so-called tier 1 securities such as commercial paper,municipal revenue bonds, mortgage-backed securities, and securities related toconsumer receivables. In 1988, the Board allowed five bank holding companiesto underwrite and deal in tier 2 securities (all debt and equity securities).
The Board of Governors established a revenue test to determine whethera company “engages principally” in underwriting and dealing for the purposeof section 20. Initially, a section 20 subsidiary could not derive more than5 percent of its total revenue from activities involving bank-ineligible securi-ties.The Board increased the limit to 10 percent of total revenue in 1989 andraised it to 25 percent in 1997. Finally, with the passage of the Gramm-Leach-Bliley Act of 1999 (GLB), the limit was effectively eliminated. Under the act,a bank holding company that elects to become or be treated as a financial
46 PART 2 Major Financial Institutions
1Congress enacted the Community Reinvestment Act in 1977 to encourage federally insured financialinstitutions to meet the credit needs of the entire community, including low- and moderate-incomeresidents.
03-Liaw 6/2/03 1:58 PM Page 46

holding company may engage in securities underwriting, dealing, or market-making activities through its subsidiaries (called securities subsidiaries).
The GLB did far more than just eliminate the limits of the revenue test.The act has enabled a financial services firm, such as a commercial bank or asecurities house, to become a one-stop shop that can supply all of its customers’financial needs. By allowing banks, insurance companies, and securities firms toaffiliate with each other, the act has opened the way for financial servicessupermarkets that offer a vast array of products and services including savingsand checking accounts, credit cards, mortgages, stock and bond underwriting,insurance (homeowners, auto, and life), mergers and acquisitions advice, com-mercial loans, and derivative securities and foreign exchange trading. Box 3.1(see p. 48) describes the first and largest of these financial supermarkets in theUnited States.
The GLB has not only opened up new opportunities for banks but has alsoprovided significant protection for investors and consumers, while striving tocreate a level playing field for all financial services firms. It established a newsystem of functional regulation whereby banking regulators oversee bankingactivities, state insurance regulators supervise insurance activity, and securitiesregulators supervise securities activities. In this new regulatory environment,investment-banking houses can offer a full menu of financial services to meetclient demand. At the same time, commercial banks can engage in formerlyforbidden activities such as stock underwriting and dealing.
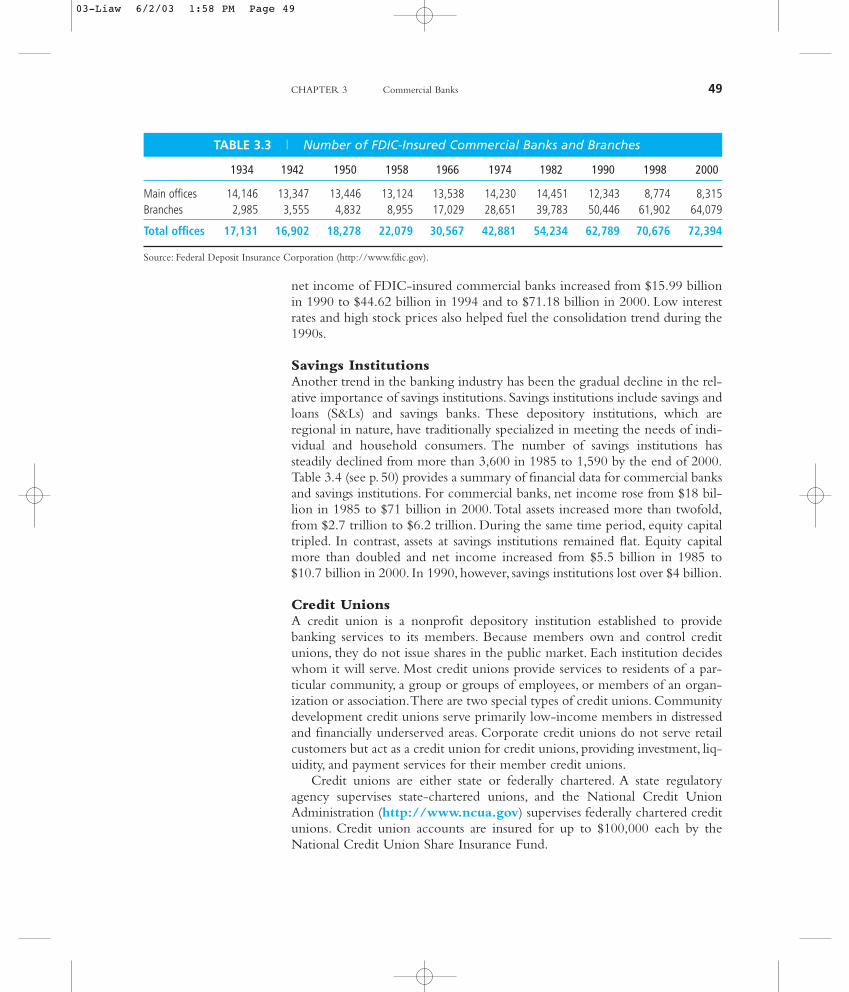
Consolidation TrendsThe wave of consolidation that accompanied those organizational and func-tional changes is reshaping the banking industry. Mergers and acquisitions(M&As) among banks and financial services companies occur at a torrid pace.Megamergers—M&As between banks with assets over $1 billion—havebecome common. Some of the marriages are reaching the scale of supermega-mergers, M&As between institutions with assets of over $100 billion each.Recent examples of supermegamergers include Citicorp-Travelers,BankAmerica-NationsBank, Banc One-First Chicago, Norwest-Wells Fargo,and Chase Manhattan-J.P. Morgan. Forces behind the consolidation trendsinclude technological progress, improvements in financial condition, excesscapacity, international consolidation of markets, and deregulation of geographicor product restrictions.2 Table 3.3 (see p. 49) reports on trends in the numberof banks and branches insured by the Federal Deposit Insurance Corporation(FDIC). As shown in Table 3.3, the number of banks has declined, but thenumber of branches has increased over the years.
Advances in information and computer technology have had tremendousimpacts on banking, but larger financial institutions can use many of the newtools of financial engineering more efficiently. Some new delivery methodssuch as phone centers, automatic teller machines (ATMs), personal computer(PC) and Internet banking, and back-office operations may exhibit greater
CHAPTER 3 Commercial Banks 47
2Berger, Demsetz, and Strahan (1998).
03-Liaw 6/2/03 1:58 PM Page 47

48 PART 2 Major Financial Institutions
3.1MARKETS IN ACTION
On April 6, 1998, Citicorp and TravelersGroup announced that they had agreedto merge, forming Citigroup, Inc., the
first true one-stop shop in financial services in theUnited States. On September 24, 1999, Citicorp andTravelers Group received approval from the Fed tomerge. Following a mandatory fifteen-day waitingperiod, Citigroup officially opened for business onOctober 8, 1999. The company, comprised ofCitibank, Travelers, Salomon Smith Barney,Commercial Credit, and Primerica Financial Services,delivers a full range of products and services to over
100 million customers in 100 countries. Citigroupoffers traditional banking, consumer finance, creditcards, investment banking, securities brokerage,asset management, and property, casualty, and lifeinsurance (Citigroup has spun off part of propertyand casualty insurance). In addition to Smith Barney,Citigroup consists of four groups: Consumer Group,Corporate and Investment Banking, CitigroupInternational, and Global Investment Managementand Private Banking. The following chart depicts theorganizational structure of these four groups:
Citigroup
Citigroup Organizational Chart
Citibanking
Cards
CitiFinancial
Primerica FinancialServices
Global Securities Services
Global Equities
Global Fixed Income
Global Investment BankingGlobal Relationship Banking
Cash, Trade, and Treasury Services
Citibank The Citigroup Private Bank
Citigroup AssetManagement
Global RetirementServices
Travelers Life andAnnuity
Citigroup AlternativeInvestments
Consumer Group Citigroup’s Corporateand Investment Bank Citigroup International Global Investment Management
and Private Banking Group
Citigroup
economies of scale than traditional branching networks. Through M&As,banks can take advantage of these economies of scale and enhance theirefficiency.
Improvement in the financial condition of banks was another factor behindthe recent rise in M&As among banks in the 1990s and 2000.With few excep-tions, bank profitability has been on an upward trend during those years.3 The
3One such exception occurred during the third and fourth quarters of 1998 in the wake of the globalfinancial crisis.
Source: How Citigroup Is Organized, Citigroup, Inc.
03-Liaw 6/2/03 1:58 PM Page 48
CHAPTER 3 Commercial Banks 49
TABLE 3.3 | Number of FDIC-Insured Commercial Banks and Branches
1934 1942 1950 1958 1966 1974 1982 1990 1998 2000
Main offices 14,146 13,347 13,446 13,124 13,538 14,230 14,451 12,343 8,774 8,315Branches 2,985 3,555 4,832 8,955 17,029 28,651 39,783 50,446 61,902 64,079
Total offices 17,131 16,902 18,278 22,079 30,567 42,881 54,234 62,789 70,676 72,394
Source: Federal Deposit Insurance Corporation (http://www.fdic.gov).
net income of FDIC-insured commercial banks increased from $15.99 billionin 1990 to $44.62 billion in 1994 and to $71.18 billion in 2000. Low interestrates and high stock prices also helped fuel the consolidation trend during the1990s.
Savings InstitutionsAnother trend in the banking industry has been the gradual decline in the rel-ative importance of savings institutions. Savings institutions include savings andloans (S&Ls) and savings banks. These depository institutions, which areregional in nature, have traditionally specialized in meeting the needs of indi-vidual and household consumers. The number of savings institutions hassteadily declined from more than 3,600 in 1985 to 1,590 by the end of 2000.Table 3.4 (see p. 50) provides a summary of financial data for commercial banksand savings institutions. For commercial banks, net income rose from $18 bil-lion in 1985 to $71 billion in 2000.Total assets increased more than twofold,from $2.7 trillion to $6.2 trillion. During the same time period, equity capitaltripled. In contrast, assets at savings institutions remained flat. Equity capitalmore than doubled and net income increased from $5.5 billion in 1985 to$10.7 billion in 2000. In 1990, however, savings institutions lost over $4 billion.
Credit UnionsA credit union is a nonprofit depository institution established to providebanking services to its members. Because members own and control creditunions, they do not issue shares in the public market. Each institution decideswhom it will serve. Most credit unions provide services to residents of a par-ticular community, a group or groups of employees, or members of an organ-ization or association.There are two special types of credit unions. Communitydevelopment credit unions serve primarily low-income members in distressedand financially underserved areas. Corporate credit unions do not serve retailcustomers but act as a credit union for credit unions, providing investment, liq-uidity, and payment services for their member credit unions.
Credit unions are either state or federally chartered. A state regulatoryagency supervises state-chartered unions, and the National Credit UnionAdministration (http://www.ncua.gov) supervises federally chartered creditunions. Credit union accounts are insured for up to $100,000 each by theNational Credit Union Share Insurance Fund.
03-Liaw 6/2/03 1:58 PM Page 49

Credit unions often offer very competitive rates on everything from sav-ings accounts to automobile and home loans, in part because they are not-for-profit institutions and do not have to pay taxes.They also have lower marketingcosts and overhead than commercial institutions. Thus, they can pay theirmembers above-average rates on deposits and charge below-average rates onloans and credit cards.
Between 1960 and 1981, there were more than 20,000 credit unions in theUnited States.4 Since 1981, the number has steadily declined, to 10,684 in2000. Nevertheless, membership has increased from 12 million in 1960 to 45million in 1981 and to almost 80 million in 2000. Thus, the average size ofcredit unions has increased. As membership increased, total savings in creditunions climbed from $5 billion in 1960 to $64 billion in 1981 and to $390 bil-lion in 2000. Loans followed a similar trend, increasing from $4.4 billion in1960 to $309.4 billion in 2000. Total assets crossed the $100 billion mark in1984 and reached $450 billion in 2000. Note, however, that the total assets of$450 billion for the whole credit union industry was less than half ofCitigroup’s $1 trillion in assets.
REGULATORY ENVIRONMENT
Banks are the core of the financial system. Not only do banks hold a signifi-cant portion of household assets, but they also have the power to create moneyand play a key role in the Federal Reserve’s ability to influence market inter-est rates. Consequently, ensuring the safety and soundness of the banking sys-tem is crucial for the U.S. economy.The safeguards established to protect the
50 PART 2 Major Financial Institutions
TABLE 3.4 | Financial Data for Commercial Banks and Savings Institutions ($ Billions)
COMMERCIAL BANKS
1985 1990 2000
Net income $17.9 15.9 71.1Total assets 2,730.6 3,389.4 6,238.7Equity capital 169.1 218.6 529.5
SAVINGS INSTITUTIONS
1985 1990 2000
Net income 5.5 -4.7 10.7Total assets 1,262.6 1,259.1 1,221.8Equity capital 44.7 67.5 103.2
Source: Federal Deposit Insurance Corporation.
4Data are from the Credit Union National Association (http://www.cuna.org).
03-Liaw 6/2/03 1:58 PM Page 50

banking system include reserve requirements, capital requirements, and depositinsurance. Box 3.2 (see p. 52) summarizes the most important legislationenacted to regulate (or deregulate) the U.S. banking industry. In addition, theBasel Committee on Banking Supervision of the Bank for InternationalSettlements (http://www.bis.org) has established capital requirements forvarious risks.This institution regulates U.S. banks as well.
Reserve RequirementsReserve requirements refer to the percentage of deposits that a bank musthold either as vault cash or on deposit at a Federal Reserve Bank. TheMonetary Control Act of 1980 (MCA; part of the Depository InstitutionsDeregulation and Monetary Control Act) authorized the Board of Governorsof the Federal Reserve System to impose a reserve requirement. FederalReserve Regulation D sets uniform reserve requirements for all depositoryinstitutions that have transaction accounts or nonpersonal time deposits.
Transaction accounts include checking accounts, NOW accounts, savingsaccounts, and accounts that permit more than a limited number of telephoneor preauthorized payments or transfers each month.Time deposits are depositsor certificates with an original maturity of at least seven days and savingsaccounts that allow the institution at least seven days’ notice by the depositorbefore a withdrawal takes place.
To relieve small depository institutions of the burden of reserve require-ments, each depository institution has a zero percent reserve requirement onthe first $5.5 million of its reservable liabilities in 2001.5 Transaction accountsover $5.5 million up to $42.8 million have a reserve requirement of 3 percent.Transaction accounts over $42.8 million have a 10 percent reserve require-ment. Hence, for most banks the marginal reserve requirement is 10 percent.Table 3.5 (see p. 55) lists the reserve requirement schedule for depositoryinstitutions.
Under the regulation, a bank’s average reserves over the period endingevery other Wednesday must equal the required percentage of its averagedeposits in the two-week period ending Monday, two days earlier. Thus, thereserve computation period begins on a Tuesday and ends on a Monday four-teen days later. A bank’s average reserves over the period ending every otherWednesday must equal the required reserves.The key goal of reserve manage-ment is to keep legal reserves at the required level with neither excess reservesnor a reserve deficit. If a bank has temporary excess reserves, it will generallylend out the funds, called federal funds, to other banks that have reservedeficits. If the excess reserves are long lasting, the bank could purchase securi-ties or make new loans. If a bank runs a reserve deficit, it will usually borrowfederal funds from other institutions.The interest rate in the federal funds mar-ket is the federal funds rate.
CHAPTER 3 Commercial Banks 51
5The exempt amount receives an annual adjustment by a factor equal to 80 percent of the percentage changein total transaction accounts in the United States.This is the reservable liabilities exemption adjustment.
03-Liaw 6/2/03 1:58 PM Page 51

52 PART 2 Major Financial Institutions
3.2MARKETS IN ACTION
National Bank Act of 1864Established a national banking systemand the chartering of national banks.
Federal Reserve Act of 1913 Established theFederal Reserve System as the central banking sys-tem of the United States.
The McFadden Act of 1927 Prohibited interstatebanking.
Banking Act of 1933 (Glass-Steagall Act)Established the FDIC as a temporary agency.Separated commercial banking from investmentbanking, establishing them as separate lines ofcommerce.
Banking Act of 1935 Established the FDIC as apermanent agency of the government.
Federal Deposit Insurance Act of 1950 Revisedand consolidated earlier FDIC legislation into oneact. Embodied the basic authority for the operationof the FDIC.
Bank Holding Company Act of 1956 RequiredFederal Reserve Board approval for the establishmentof a bank holding company. Prohibited bank holdingcompanies headquartered in one state from acquir-ing a bank in another state.
International Banking Act of 1978 Brought for-eign banks within the federal regulatory framework.Required deposit insurance for branches of foreignbanks engaged in retail deposit taking in the UnitedStates.
Financial Institutions Regulatory and InterestRate Control Act of 1978 (FIRIRCA) Created theFederal Financial Institutions Examination Council.Established limits and reporting requirements forbank insider transactions. Included major statutoryprovisions regarding electronic fund transfers.
Depository Institutions Deregulation andMonetary Control Act of 1980 (DIDMCA)Established “NOW accounts.” Began the phase-outof interest rate ceilings on deposits. Established theDepository Institutions Deregulation Committee.
Granted new powers to thrift institutions. Raised thedeposit insurance ceiling to $100,000.
Depository Institutions Act of 1982(Garn-St. Germain Act) Expanded the FDIC’s powersto assist troubled banks. Established the Net WorthCertificate program. Expanded the powers of thriftinstitutions.
Competitive Equality Banking Act of 1987(CEBA) Established new standards for availability ofexpedited funds. Recapitalized the Federal Savings &Loan Insurance Company (FSLIC). Expanded theFDIC’s authority for open bank assistance transac-tions, including bridge banks.
Financial Institutions Reform, Recovery, andEnforcement Act of 1989 (FIRREA) FIRREA’s pur-pose was to restore the public’s confidence in thesavings and loan industry. Abolished the FSLIC andgave the FDIC the responsibility of insuring thedeposits of thrift institutions in its place. The FDICinsurance fund created to cover thrifts was namedthe Savings Association Insurance Fund (SAIF); thefund covering banks was called the Bank InsuranceFund (BIF).
Abolished the Federal Home Loan Bank Board andcreated two new agencies, the Federal HousingFinance Board (FHFB) and the Office of ThriftSupervision (OTS), to replace it.
Created the Resolution Trust Corporation (RTC) asa temporary agency of the government with theresponsibility of managing and disposing of theassets of failed institutions. Created an OversightBoard to supervise the RTC and the ResolutionFunding Corporation (RFC) to provide funding forRTC operations.
Title XXV of the Crime Control Act of 1990(Comprehensive Thrift and Bank Fraud Prosecutionand Taxpayer Recovery Act of 1990) Greatlyexpanded the authority of federal regulators to com-bat financial fraud. Prohibited undercapitalizedbanks from making golden parachute and otherindemnification payments to institution-affiliatedparties. Increased penalties and prison time for thoseconvicted of bank crimes, increased the powers and
Important Banking Legislation
03-Liaw 6/2/03 1:58 PM Page 52

CHAPTER 3 Commercial Banks 53
MARKETS IN ACTION
authority of the FDIC to take enforce-ment actions against institutions operat-ing in an unsafe or unsound manner,
and gave regulators new procedural powers torecover assets improperly diverted from financialinstitutions.
Federal Deposit Insurance CorporationImprovement Act of 1991 (FDICIA) Greatlyincreased the powers and authority of the FDIC.Recapitalized the Bank Insurance Fund and allowedthe FDIC to strengthen the fund by borrowing fromthe Treasury.
Mandated a least-cost resolution method andprompt resolution approach to problem and failingbanks and ordered the creation of a risk-baseddeposit insurance assessment scheme. Restricted bro-kered deposits, the solicitation of deposits, and non-bank activities of insured state banks. Created newsupervisory and regulatory examination standardsand put forth new capital requirements for banks.
Housing and Community Development Act of1992 Established regulatory structure for govern-ment-sponsored enterprises (GSEs), combatedmoney laundering, and provided regulatory relief tofinancial institutions.
RTC Completion Act Required the RTC to adopt aseries of management reforms and to implementprovisions designed to improve the agency’s recordin providing business opportunities to minorities andwomen when issuing RTC contracts or selling assets.Expanded the existing affordable housing programsof the RTC and the FDIC by broadening the poten-tial affordable housing stock of the two agencies.
Increased the statute of limitations on RTC civillawsuits from three years to five, or to the periodprovided in state law, whichever is longer. Also pro-vided that in cases in which the statute of limitationshad expired, claims could be revived for fraud andintentional misconduct resulting in unjust enrich-ment or substantial loss to the thrift. Provided finalfunding for the RTC and established a transitionplan for transfer of RTC resources to the FDIC. SetDecember 31, 1995 as the RTC’s sunset date when
the FDIC would assume its conservatorship andreceivership functions.
Riegle Community Development and RegulatoryImprovement Act of 1994 Established aCommunity Development Financial Institutions Fund,a wholly owned government corporation that wouldprovide financial and technical assistance to CDFIs.
Contained several provisions aimed at curbing thepractice of “reverse redlining” in which nonbanklenders target low- and moderate-income home-owners, minorities, and the elderly for home equityloans on abusive terms. Relaxed capital requirementsand other regulations to encourage the private-sector secondary market for small business loans.
Contained more than fifty provisions to reducebank regulatory burden and paperwork require-ments. Required the Treasury Department to developways to substantially reduce the number of currencytransactions filed by financial institutions. Containedprovisions aimed at shoring up the National FloodInsurance Program.
Riegle-Neal Interstate Banking and BranchingEfficiency Act of 1994 (IBBEA) Permitted ade-quately capitalized and managed bank holding com-panies to acquire banks in any state one year afterenactment. Provided that concentration limits applyand required Community Reinvestment Act (CRA)evaluations by the Federal Reserve before acquisi-tions are approved. Beginning June 1, 1997, allowedinterstate mergers between adequately capitalizedand managed banks, subject to concentration limits,state laws, and CRA evaluations. Extended thestatute of limitations to permit the FDIC and RTC torevive lawsuits that had expired under state statutesof limitations.
Economic Growth and Regulatory PaperworkReduction Act of 1996 (EGRPR) Modified financialinstitution regulations, including regulations imped-ing the flow of credit from lending institutions tobusinesses and consumers. Amended the Truth inLending Act and the Real Estate SettlementProcedures Act of 1974 to streamline the mortgagelending process.
Important Banking Legislation (continued)
03-Liaw 6/2/03 1:58 PM Page 53

54 PART 2 Major Financial Institutions
MARKETS IN ACTION
Amended the Federal DepositInsurance Act (FDIA) to eliminate orrevise various application, notice, and
record-keeping requirements to reduce the regula-tory burden and the cost of credit. Amended theFair Credit Reporting Act to strengthen consumerprotections.
Established consumer protections for potentialclients of consumer repair services. Clarified lenderliability and federal agency liability issues under theComprehensive Environmental Response,Compensation, and Liability Act (CERCLA). Directedthe FDIC to impose a special assessment on deposi-tory institutions to recapitalize the SAIF, aligned SAIFassessment rates with BIF assessment rates, andmerged the SAIF and BIF into a new DepositInsurance Fund.
Gramm-Leach-Bliley Act of 1999 Repealed theGlass-Steagall Act of 1933. Modified portions of theBank Holding Company Act (BHCA) to allow affilia-tions between banks and insurance underwriters.While preserving the states’ authority to regulateinsurance, prohibited state actions that have theeffect of preventing bank-affiliated firms from sellinginsurance on an equal basis with other insuranceagents. Created a new financial holding company,under section 4 of the BHCA, authorized to engagein underwriting and selling insurance and securities,conducting both commercial and merchant banking,investing in and developing real estate, and other
“complimentary activities.” Also put limits on thekinds of nonfinancial activities these new entitiesmay engage in.
Allowed national banks to underwrite municipalbonds. Restricted the disclosure of nonpublic cus-tomer information by financial institutions. Requiredall financial institutions to provide customers theopportunity to “opt out” of the sharing of the cus-tomers’ nonpublic information with unaffiliated thirdparties. Imposed criminal penalties on anyone whoobtains customer information from a financial insti-tution under false pretenses.
Amended the CRA to provide that financial hold-ing companies cannot be formed before theirinsured depository institutions receive and maintain asatisfactory CRA rating. Also required public disclo-sure of bank-community CRA-related agreements.Granted some regulatory relief to small institutionsby reducing the frequency of their CRA examinationsif they have received outstanding or satisfactory rat-ings. Prohibited affiliations and acquisitions betweencommercial firms and unitary thrift institutions.
Made significant changes in the operation of theFederal Home Loan Bank (FHLB) system, easingmembership requirements and loosening restrictionson the use of FHLB funds.
Source: Federal Deposit Insurance Corporation(http://www.fdic.gov). Reprinted with permission from theFederal Deposit Insurance Corporation.
Important Banking Legislation (continued)
For example, suppose that a bank has a reserve deficit of $30 million andpurchases that amount of federal funds at a rate of 4.82 percent to meet itsreserve requirement for seven days.The cost to the bank will be
$30,000,000 � � �� 7 � $28,116.67.
Note that a 360-day year is used in the denominator because the federal fundsmarket is a money market.
0.0482�360
3.1
03-Liaw 6/2/03 1:58 PM Page 54

CHAPTER 3 Commercial Banks 55
TABLE 3.5 | Reserve Requirement Schedule
TYPE OF DEPOSIT RESERVE REQUIREMENTS
Net Transaction Accounts
$0 to $5.5 million 0%$5.5 million to $42.8 million 3%More than $42.8 million $1.119 million plus 10% of amount over $42.8 million
Nonpersonal time deposits 0%
Note: The Monetary Control Act of 1980 requires that the amount of transaction accounts against which the 3 percentreserve requirement applies be modified annually by 80 percent of the percentage change in transaction accounts heldby all depository institutions. The schedule listed in the table became effective in September 2001.
Source: Reserve Requirements, the Federal Reserve System, 2001.
Capital Requirements for Credit RiskBanks also have to meet risk-based capital standards that protect against creditrisk, or the risk that a bank will sustain a loss as a result of the default of a bor-rower or a counterparty. Banks also base the guidelines used to evaluate capi-tal adequacy on the perceived credit risk associated with balance-sheet assets,as well as certain off-balance-sheet items such as unused loan commitmentsand letters of credit. The most important element is the linkage between abank’s minimum capital requirement and the credit risk of its assets through arisk-weighted system.A leverage ratio requirement supplements the risk-basedcapital guidelines.
For the purpose of risk-based capital, a bank’s total capital consists of twomajor components: core capital elements (included in tier 1 capital) and sup-plemental capital elements (included in tier 2 capital).
° Tier 1 capital is the sum of core capital elements (common equity, qual-ifying noncumulative perpetual preferred stock, and minority interest inthe equity accounts of consolidated subsidiaries) less goodwill, unrealizedholding losses in the available-for-sale equity portfolio, and other intangi-ble assets that do not qualify within capital.
° Tier 2 capital consists of a limited amount of the allowance for loan andlease losses, perpetual preferred stock that does not qualify for inclusionin tier 1 capital, mandatory convertible securities and other hybrid capi-tal instruments, long-term preferred stock with an original term oftwenty years or more, and limited amounts of term subordinated debt,intermediate-term preferred stock, and unrealized holding gains on quali-fying equity securities.
The sum of tier 1 and tier 2 capital, less any deductions, makes up the totalcapital.
03-Liaw 6/2/03 1:58 PM Page 55
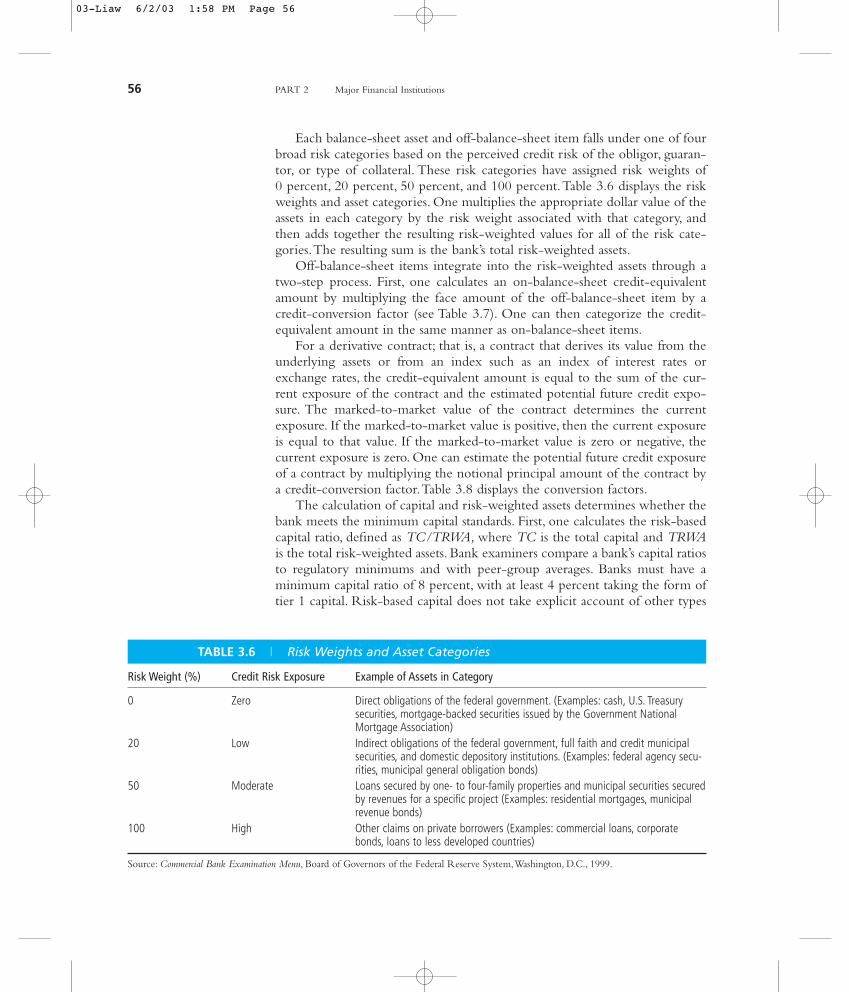
Each balance-sheet asset and off-balance-sheet item falls under one of fourbroad risk categories based on the perceived credit risk of the obligor, guaran-tor, or type of collateral. These risk categories have assigned risk weights of0 percent, 20 percent, 50 percent, and 100 percent.Table 3.6 displays the riskweights and asset categories. One multiplies the appropriate dollar value of theassets in each category by the risk weight associated with that category, andthen adds together the resulting risk-weighted values for all of the risk cate-gories.The resulting sum is the bank’s total risk-weighted assets.
Off-balance-sheet items integrate into the risk-weighted assets through atwo-step process. First, one calculates an on-balance-sheet credit-equivalentamount by multiplying the face amount of the off-balance-sheet item by acredit-conversion factor (see Table 3.7). One can then categorize the credit-equivalent amount in the same manner as on-balance-sheet items.
For a derivative contract; that is, a contract that derives its value from theunderlying assets or from an index such as an index of interest rates orexchange rates, the credit-equivalent amount is equal to the sum of the cur-rent exposure of the contract and the estimated potential future credit expo-sure. The marked-to-market value of the contract determines the currentexposure. If the marked-to-market value is positive, then the current exposureis equal to that value. If the marked-to-market value is zero or negative, thecurrent exposure is zero. One can estimate the potential future credit exposureof a contract by multiplying the notional principal amount of the contract bya credit-conversion factor.Table 3.8 displays the conversion factors.
The calculation of capital and risk-weighted assets determines whether thebank meets the minimum capital standards. First, one calculates the risk-basedcapital ratio, defined as TC/TRWA, where TC is the total capital and TRWAis the total risk-weighted assets. Bank examiners compare a bank’s capital ratiosto regulatory minimums and with peer-group averages. Banks must have aminimum capital ratio of 8 percent, with at least 4 percent taking the form oftier 1 capital. Risk-based capital does not take explicit account of other types
56 PART 2 Major Financial Institutions
TABLE 3.6 | Risk Weights and Asset Categories
Risk Weight (%) Credit Risk Exposure Example of Assets in Category
0 Zero Direct obligations of the federal government. (Examples: cash, U.S. Treasurysecurities, mortgage-backed securities issued by the Government NationalMortgage Association)
20 Low Indirect obligations of the federal government, full faith and credit municipalsecurities, and domestic depository institutions. (Examples: federal agency secu-rities, municipal general obligation bonds)
50 Moderate Loans secured by one- to four-family properties and municipal securities securedby revenues for a specific project (Examples: residential mortgages, municipalrevenue bonds)
100 High Other claims on private borrowers (Examples: commercial loans, corporatebonds, loans to less developed countries)
Source: Commercial Bank Examination Menu, Board of Governors of the Federal Reserve System,Washington, D.C., 1999.
03-Liaw 6/2/03 1:58 PM Page 56

of risks such as interest rate, liquidity, market, or operational risks, however, soexaminers generally expect banks to operate with capital positions above theminimum ratios. Banks that do not meet the minimum have to develop andimplement plans for achieving adequate levels of capital.
Another requirement is that a bank must have a tier 1 leverage ratio of atleast 3 percent; the tier 1 leverage ratio is the ratio of tier 1 capital to totalaverage assets.An institution operating at or near this level ought to have well-diversified risk, including no undue interest rate risk exposure, excellent assetquality, high liquidity, and good earnings.Table 3.9 (see p. 58) shows an exam-ple of capital and leverage ratios.
In addition to looking at those ratios, bank examiners also use theCAMELS system to rate the quality of a bank’s operations. CAMELS is anumerical rating system based on the examiner’s judgment of the bank’sCapital adequacy, Asset quality, Management quality, Earnings record,Liquidity position, and Sensitivity to market risk.6 The rating scale ranges from1 to 5, with 1 indicating strong performance and 5 unsatisfactory performance.Banks with a composite CAMELS rating of 4 or 5 receive examinations morefrequently than banks with a rating of 1 or 2.
CHAPTER 3 Commercial Banks 57
TABLE 3.7 | Conversion Factors for Off-Balance-Sheet Items
Conversion Factor (%) Examples of Off-Balance-Sheet Items
100 Standby letters of credit issued to back repayment of commercial paper50 Standby letters of credit that guarantee a customer’s future performance and unused bank loan
commitments covering periods longer than one year20 Standby letters of credit backing the issue of state and local government general obligation bonds
Trade-based commercial letters of credit and bankers’ acceptances0 Loan commitments with less than one year in remaining maturity, guarantees of federal or central
government borrowings
TABLE 3.8 | Conversion Factors for Derivative Contracts (in Percent)
TYPES OF DERIVATIVE CONTRACT
Remaining Maturity Foreign Exchange Precious Metals Other Commodities of Contract Interest Rates Rate and Gold Equity (excluding gold) (excluding precious metals)
One year or less 0.0 1.0 6.0 7.0 10.0One to five years 0.5 5.0 8.0 7.0 12.0Over five years 1.5 7.5 10.0 8.0 15.0
6The original CAMEL rating system was adopted in 1979. It is maintained by the Federal FinancialInstitutions Examination Council. Starting on January 1, 1997, a sixth rating component was added toaddress sensitivity to market risk; hence, the CAMELS system.
03-Liaw 6/2/03 1:58 PM Page 57

Capital Requirements for Market RiskThe risk-based capital standards primarily address bank exposure to credit risk.With the increased prominence of trading activities at many large bankinginstitutions, regulators have imposed a new requirement, known as the marketrisk rule, that sets minimum capital standards for market risk exposure.Market risk is the risk of loss from adverse movements in interest rates,exchange rates, equity prices, and commodity prices. Because the market riskrule principally addresses the market risk arising from trading activities (infixed-income securities, foreign exchange, equity, and commodity contracts),only large banks with significant amounts of trading activity have to meet mar-ket risk requirements. In particular, the standards require any bank or bankholding company, with trading account positions exceeding either $1 billionor 10 percent of its total assets, to measure market risk with its own internalvalue-at-risk (VaR) model and to hold a commensurate amount of capital.Themarket risk rule became effective as of January 1998.
The requirements distinguish between general market risk and specificrisk. General market risk is the risk that arises from movements in the generallevel of underlying market factors such as interest rates, foreign exchange rates,equity prices, and commodity prices. Specific risk is the risk of an adversemovement in the price of an individual security resulting from factors related
58 PART 2 Major Financial Institutions
TABLE 3.9 | Example of Capital and Leverage Ratios
Amount Risk Weighting Risk-Weighted Assets ($ millions) (%) Amount ($ millions)
Cash 15 0 0Treasury securities 300 0 0Balances at domestic banks 15 20 3Municipal general obligation bonds 20 20 4Residential mortgages 100 50 50Commercial loans 300 100 300
Credit-equivalent amount of off-balance-sheet items 150 100 150
Total 900 507
Tier 1 capital 30.42Total capital 45.63
Tier 1 capital ratio = = 6%
Total capital ratio = = 9%
Tier 1 leverage ratio = = 3.38%$30.42�$900
$45.63�$507
$30.42�$507
03-Liaw 6/2/03 1:58 PM Page 58

to the security issuer.Thus, debt and equity securities in bank trading portfo-lios have specific risks.
As mentioned previously, the output of a bank’s internal value-at-riskmodel determines the capital requirements for general market risk. A value-at-risk (VaR) model produces an estimate of the maximum amount that thebank can lose on a particular portfolio over a given holding period with agiven degree of statistical confidence. VaR estimates, calibrated to a 10-day,99th percentile standard, determine the general market risk capital require-ment. For example, if the 10-day, 99th percentile VaR estimate is $10 million,then the bank expects to lose more than $10 million in only 1 out of 100 10-day periods.The capital requirement for general market risk equals the averageVaR estimate over the previous 60 trading days multiplied by a scaling factor,which generally equals to three.
Capital requirements for specific risk cover the risk of adverse price move-ments resulting from factors related to the issuer of a security.A scaling factorof four determines the specific risk related capital requirements. The scalingfactor could be adjusted when market practice evolves and banks can demon-strate that their specific risk modeling adequately addresses both idiosyncraticrisks and event risks that a VaR model might not have captured.
New Capital AccordWe have just discussed that, under the Basel Capital Accord of 1988 (alsoknown as Basel I), banks must set aside capital to meet requirements for creditrisk. Starting in 1996, banks must meet trading-book requirements (market riskrule) as well. In 2001, the Basel Committee on Banking Supervision releaseda consultation package setting out details for the New Capital Accord, orBasel II, to promote the safety and soundness of the global banking system.Basel II introduces a more comprehensive approach to addressing risk, placingmore emphasis on banks’ internal risk methodologies, supervisory review, andmarket discipline. Basel II will take effect in 2006. Bank for InternationalSettlements publishes detailed information on Basel II on its Web site(http://www.bis.org).
Basel II has three pillars:
° Pillar 1 covers minimum capital requirements for market, credit, and oper-ational risks.
° Pillar 2 covers supervisory review.
° Pillar 3 covers market discipline.
Under Pillar 1, minimum capital requirements for market risk are similar tothose under Basel I. Pillar 1 sets new capital requirements for credit risk (morerisk sensitive) and operational risk. The new credit risk requirements will bemuch more closely tied to the riskiness of particular exposures. Basel II aims atestablishing a system that is more risk sensitive than Basel I.Thus, banks haveincentive to pursue more sophisticated and effective risk-management tech-niques. Many banks in the developed nations have begun to develop their own
CHAPTER 3 Commercial Banks 59
03-Liaw 6/2/03 1:58 PM Page 59

Internal Ratings Based (IRB) approach to assess the credit risk in their port-folios, under which banks have to estimate the probability of default associatedwith each borrower and the amount of losses if default occurs. Another newcomponent for minimum capital requirements is operational risk, the risk ofloss resulting from inadequate or failed internal processes, people and systemsor from external events. Banks must establish a system to effectively manageoperational risk and quantify the risk exposure. The total minimum capitalrequirement will be the sum of the requirements for credit risk, operationalrisk, and the current trading-book charge.
Pillar 2 aims at ensuring that financial institutions have adequate capital.Regulators will require banks to operate with capital above a Pillar 1 mini-mum. Pillar 2 also gives local regulators considerable discretion. It is thereforepossible that different regulators take different approaches.Also, some countriesmay introduce Pillar 2 gradually.
Pillar 3 focuses on market discipline via disclosure requirements. Basel IIdistinguishes between required and recommended disclosures. Banks must dis-close required disclosure to qualify for a particular regulatory capital treatment;for example, to use the IRB approach. Recommended disclosures are disclo-sures that Basel II wants institutions to make in the interest of transparency.Financial institutions need to indicate in the disclosure information whether areasonable investor would consider the matter important. In addition, underPillar 3, banks that use internal methods for setting the Pillar 1 capital require-ments must disclose information on the nature of the procedures covered bythe approach. Another area of quantitative disclosure covers the performanceof the bank’s rating process.
Deposit InsuranceThe Federal Deposit Insurance Corporation (FDIC; http://www.fdic.gov)insures bank deposits up to $100,000 per account.The FDIC uses a risk-basedsystem to assess deposit insurance premiums for the deposit insurance funds—the Bank Insurance Fund (BIF) and the Savings Association Insurance Fund(SAIF).The FDIC assigns each institution to one of nine risk categories basedon its capital ratios (the capital group assignment) and other relevant informa-tion (supervisory subgroup assignment).
There are three capital groups, defined as follows:
° Group 1 (well capitalized):The institution’s total risk-based capital ratio isat least 10 percent, its tier 1 risk-based capital ratio equals or exceeds 6 per-cent, and its tier 1 leverage ratio equals or exceeds 5 percent.
° Group 2 (adequately capitalized): The institution is below the well-capitalized level; its total risk-based capital ratio equals or exceeds 8 percent,its tier 1 capital ratio equals or exceeds 4 percent, and its tier 1 leverage ratioequals or exceeds 4 percent.
° Group 3 (undercapitalized): The institution is worse than adequatelycapitalized.
60 PART 2 Major Financial Institutions
03-Liaw 6/2/03 1:58 PM Page 60

CHAPTER 3 Commercial Banks 61
TABLE 3.10 | Deposit Insurance Rate Schedule (in basis points)
SUPERVISORY SUBGROUP ASSIGNMENT
Capital Ratio Assignment A B C
Well capitalized 0 3 17Adequately capitalized 3 10 24Undercapitalized 10 24 27
Source: Risk-based assessment system—Current assessment rate schedule, Federal Deposit Insurance Corporation.
After an examination and a review of pertinent information, the FDIC alsoassigns each BIF or SAIF institution to a supervisory subgroup based on itsCAMELS rating:
° Subgroup A: Financially sound institutions with a primary federal regula-tor’s composite rating of 1 or 2.
° Subgroup B:Weaker institutions with problems that, if not corrected, couldresult in significant deterioration.This group generally corresponds to theprimary federal regulator’s composite rating of 3.
° Subgroup C: Institutions that pose a substantial probability of loss to theBIF or the SAIF unless those institutions take effective corrective actions.This group generally corresponds to the primary federal regulator’s com-posite rating of 4 or 5.
The deposit insurance rate schedule for BIF and SAIF insured institutionsis between 0 and 27 cents per $100 in assessable deposits, as shown inTable 3.10.
TECHNOLOGY IN BANKING
Technological advances including automatic teller machines (ATMs), tele-phone banking, personal computer (PC) banking, check imaging, and Internetbanking have fundamentally changed the way banks conduct business.Consumers show strong preferences for transacting certain types of businesselectronically, such as paying bills, booking airline tickets, trading securities, andpurchasing consumer products.
Telephone and PC BankingTelephone banking enables customers to bank from home: they can pay billsby phone, transfer funds from one account to another, or just check an accountbalance anytime. PC banking provides an easy and convenient way for cus-tomers to access their accounts using a popular financial software package suchas the bank’s own proprietary software, Microsoft® Money®, or Quicken®.With PC banking, clients can check balances; confirm which checks, deposits,withdrawals, and ATM activities have cleared the account; keep track of credit
03-Liaw 6/2/03 1:58 PM Page 61

card transactions; transfer funds between accounts; and communicate with thebank through electronic messages.
Check ImagingCheck processing is one of the most costly divisions of any bank. Throughcheck imaging, banks use technology to help reduce costs. Special cameras,installed on the check-sorting devices, are used to create digital images of thechecks to be processed.The banks next use images rather than paper in pro-cessing, which facilitates the rapid distribution of check information.Customers receive check images with their statements and an image archivereplaces microfilm storage of checks with electronic storage. Thus, imagingtechnology streamlines the processing environment and provides banks withnew capabilities that can be leveraged into new products and services.
Internet BankingBanking on the Internet means a home computer can access a virtual 24-hourbank branch.With Internet banking, customers can dash off checks to any-one, anytime.The Internet also enables financial institutions to offer 24-hourlending services with immediate lending approval. Applicants can apply overthe Internet while talking live with agents to obtain answers to questions orassistance in completing loan applications.
Many banks—including such major banks as Citibank, J.P. Morgan Chase,Wells Fargo, and Bank of America—offer their customers Internet banking aswell as branches. On the other hand, a few Internet-based banks do not offerbranch services to customers. Examples include NetBank (http://www.net-bank.com) and E*Trade Bank (http://www.etradebank.com).
CREDIT RISK AND LIQUIDITY RISK MANAGEMENT
Banks face credit, market, liquidity, and operation risks.As we have seen, creditrisk arises from the possibility of default by counterparties, whereas market riskis the potential that the value of financial assets may decline due to a changein market prices or interest rates. Liquidity risk refers to the possibility thata bank will not have sufficient funds to meet its payout obligations. Operationrisk is the possibility that employee error or system failure will occur.
This section covers credit and liquidity risk management, and the next twosections focus on the management of market risk and operation risk. Banksseek opportunities to take credit risk prudently and manage it effectively inorder to create value for their shareholders. Efficient liquidity managementenables banks to meet their cash needs and make new investments.
Credit Risk ManagementTraditionally, the primary risk of banks has been credit risk that arises from thepossibility that a borrower or counterparty will fail to meet its contractual obli-gations. It is important to realize that credit losses per se are not risky.A bank
62 PART 2 Major Financial Institutions
03-Liaw 6/2/03 1:58 PM Page 62

can factor predictable losses into its prices and covers them as a normal cost ofdoing business.The volatility of losses presents the most risk and is thereforethe primary concern of credit risk management.
Credit risk management begins by measuring the default risk associatedwith all credit exposures, including loans, receivables, lending commitments,derivative contracts, and foreign exchange contracts. Management of consumercredit risk begins with an internal model that projects credit quality and estab-lishes credit-underwriting standards. Ideally, the development phase of a con-sumer product establishes risk parameters. The cost of credit risk thenintegrates into the product’s profit dynamics. For commercial credit risk, mostbanks manage to diversify exposures by obligator, risk grade, industry, product,and geographic location. Some banks also securitize some of their loans andsell off pieces to other investors.7 But securitization requires homogeneousassets; assets with widely different characteristics and terms are difficult to secu-ritize. Credit default swaps allow banks to isolate, price, and trade firm-specificcredit risk by unbundling a basket of loans and transferring each componentrisk to those best suited or most interested in managing it. A credit defaultswap is a privately negotiated contract with payoffs linked to a credit-relatedevent, such as a default or a credit rating downgrade. For example, in June1997, an international bank that already had a basket of 20 loans, totaling morethan $500 million to mostly investment-grade companies,wanted to lend moremoney to the same companies. J.P. Morgan sold the bank the right to requireJ.P. Morgan to pay off any of the loans if a borrower goes bankrupt. J.P. Morgancould retain the default risks in its portfolio and collect the premium, or sellthem to institutional investors such as insurance companies, hedge funds, orother banks. Meanwhile, J.P. Morgan’s client retains the actual loans and thecustomer relationship.
For risk management purposes, off-balance-sheet exposures are convertedto loan-equivalent amounts.With respect to derivatives and foreign exchangecontracts, banks utilize those instruments during the normal course of business.Although derivative and foreign exchange markets most frequently usenotional principal, the nominal value used to calculate payments of financialcontracts, as a volume measure, it is not a useful measure of credit risk. Thenotional principal typically does not change hands, but is simply a quantity forthe calculation of interest and other payments. Commonly, the value of aderivative or a foreign exchange contract is marked-to-market. A positivemarked-to-market value indicates that the counterparty owes the bank money,so the bank faces a repayment risk.When the marked-to-market value is neg-ative, the bank owes the counterparty and thus does not have repayment risk.When a bank has more than one transaction with a particular counterparty,and there is a legally enforceable master netting agreement, the net marked-to-market exposure represents the netting of the positive and negative exposureswith the same counterparty. Net marked-to-market exposure is a good
CHAPTER 3 Commercial Banks 63
7Chapter 13 provides detailed coverage of the subject.
03-Liaw 6/2/03 1:58 PM Page 63

measure of credit risk under such circumstances.Major banks generally disclosetheir net marked-to-market exposures by customer type and credit rating intheir annual reports.
Liquidity Risk ManagementOne of the most important tasks facing the management of any bank is toensure adequate liquidity. Liquidity risk is the risk that the bank may be unableto meet a financial commitment to a customer, creditor, or investor when due.Lack of adequate liquidity is one of the first signs that a bank is in financial dif-ficulties.The troubled bank begins to lose deposits, which erodes its supply ofcash and forces the institution to dispose of its liquid assets. Other banksbecome reluctant to lend to the troubled bank. Eventually, the bank teeters onthe brink of failure.
Liquidity management provides the proper mix of core and noncoredeposits and capital to ensure sufficient funding for anticipated obligations andplanned asset generation. Core deposits—stable deposits that are not highlyrate sensitive—are a major source of liquidity for banking operations. Coredeposits include savings accounts, checking accounts, money market accounts,and time deposits of less than $100,000. Liquidity can also be obtained throughthe issuance of commercial paper, medium-term notes, long-term debt, andpreferred and common stock.
Marketable securities and other short-term investments can be readily con-verted to cash, if needed. In addition, loan syndication networks and securiti-zation programs facilitate the timely disposition of assets and the obtaining ofnecessary liquidity.
MARKET RISK MANAGEMENT
The increasing importance of market risk has prompted the Federal FinancialInstitutions Examination Council to revise the financial institutions rating sys-tem.As explained earlier, in January 1997, a sixth component called “sensitiv-ity to market risk” was added by the Federal Financial Institutions ExaminationCouncil to the original CAMEL rating system. Market risk is the exposure toan adverse change in the value of financial instruments as a result of changesin market factors such as interest rates, foreign exchange rates, securities prices,and commodity prices. For most banks without active foreign exchange ortrading transactions, interest rate risk is the most significant type of market riskexposure arising from their asset-liabilities activities. Interest rate risk is theexposure to adverse changes in rates that affect revenues such as net interestincome, securities gains/losses, and other rate-sensitive income/expense items.A variety of sources contribute to interest rate risk, including differences intiming between the maturities or the repricing of assets, liabilities, and deriva-tives. For example, changes in market interest rates affect a bank’s net interestincome, because the repricing characteristics of loans and other interest-earning assets do not necessarily match those of deposits or borrowings. Banksexpose themselves to basis risk, which is the difference in the pricing char-
64 PART 2 Major Financial Institutions
03-Liaw 6/2/03 1:58 PM Page 64

acteristics of two instruments. For example, a bank faces basis risk when theprime rate determines its lending interest rate, but the interest rate it pays forfunds changes with the LIBOR.8 This section reviews several measures used inrisk management, including gap analysis, duration gap analysis, and the value-at-risk approach.
Gap AnalysisGap analysis is the simplest way of representing the interest rate risk compo-nent of market risk. Assets and liabilities are placed in gap intervals based ontheir repricing dates.The Fed requires commercial banks to report the repric-ing gaps for assets and liabilities with the following maturities:
1. One day.2. More than one day to three months.3. More than three months to six months.4. More than six months to twelve months.5. More than one year to five years.6. More than five years.
One can calculate the net gap for each time period by subtracting therepriced liabilities in that interval from the repriced assets.A positive gap, withmore assets repricing than liabilities, will benefit earnings in a rising interestrate environment because assets will earn more interest income. At the sametime, interest expense will not rise as much. A positive gap will depress earn-ings in a declining interest rate environment because interest income willdecrease by a larger amount than interest expense. Conversely, a negative gapwill benefit earnings when interest rates fall and have the potential to depressearnings when interest rates rise. Here is a summary of these relationships:
Net Gap Change in Interest Rates Change in Net Interest Income
Positive Increase IncreasePositive Decrease DecreaseNegative Increase DecreaseNegative Decrease IncreaseZero Increase NoneZero Decrease None
Because this model bases the gap on a specific time point, there are actu-ally two gaps: a periodic and a cumulative gap.The periodic gap compares rate-sensitive assets with rate-sensitive liabilities across a single point in time. Thecumulative gap compares rate-sensitive assets with rate-sensitive liabilities overthe time horizon from the present up to the designated time point.
CHAPTER 3 Commercial Banks 65
8The prime rate is the base rate for loans to a bank’s financially strong borrowers. LIBOR is theLondon InterBank Offered Rate, which is the interest rate major banks in London charge each other forborrowings.
03-Liaw 6/2/03 1:58 PM Page 65

Table 3.11 shows an example of repricing gaps.The one-day gap indicatesa negative $30 million difference between assets and liabilities being repricedin one day.The bank has borrowed more one-day funds than it has lent. If theovernight interest rate increases by 5 basis points, the annualized interestincome will increase by $30,000. However, the annualized interest expense willincrease by $45,000, resulting in a decrease in net interest income of $15,000.9
Duration Gap AnalysisGap analysis is a useful tool for protecting against interest rate changes, but itdoes not fully account for the bank’s equity value. Hence, management usesduration gap analysis to examine how the market value of shareholderequity will change when interest rates change. Duration gap analysis comparesthe price sensitivity of a bank’s total assets with that of its total liabilities.Thedifferential impact between these two is the resulting change in the marketvalue of equity.
One can calculate duration as a weighted average of the time until thereceipt of the cash flows. Chapter 10 covers the technical aspect of duration.In this chapter, we will use the duration concept to analyze the changes inbank equity value as a result of interest rate changes. Suppose D denotes dura-tion, y the interest rate, and P the initial price. For any given change in inter-est rate, the change in value of the instrument equals approximately
� D � [∆y⁄(1 � y)] � P,
where ∆y is the change in interest rate; ∆y is positive if the rate increases andnegative if the rate declines.
Applying this formula to duration gap analysis, the change in the bank’s networth for any given change in interest rate is
�� DA � � A�� �� DL � � L�,∆y
�(1 � y)
∆y�(1 � y)
66 PART 2 Major Financial Institutions
3.3
9One basis point is one-hundredth of 1 percent.
3.2
TABLE 3.11 | Repricing Gaps ($ millions)
Assets Liabilities Gaps
1 day 60 90 –301 day–3 months 90 120 –303 months–6 months 210 255 –456 months–12 months 270 210 601 year–5 years 120 90 30Over 5 years 30 15 15
03-Liaw 6/2/03 1:58 PM Page 66

where A denotes assets, L denotes liabilities, and DA and DL indicate the dura-tion of assets and liabilities, respectively.The first term in Equation 3.3 denotesthe change in asset value, and the second term denotes the change in the valueof liabilities.The formula can be simplified to
� A � �DA � DL � �.
As shown in the above expression, a bank’s interest rate risk relates to thesize of the interest rate change, the size of the bank, and the leverage-adjustedduration gap. The duration gap provides information about how the marketvalue of shareholder equity will change when interest rates change.A positiveduration gap, in which the duration of assets (DA) exceeds the duration of lia-bilities (DL) adjusted for the ratio of liabilities to assets,will increase shareholdervalue in a declining interest rate environment and will depress shareholdervalue in a rising interest rate environment. Conversely, a negative duration gapwill benefit equity value in a rising interest rate environment but will depressvalue in a declining interest rate environment.These relationships are:
Net Duration Gap Change in Interest Rates Change in Shareholder Equity
Positive Increase DecreasePositive Decrease IncreaseNegative Increase IncreaseNegative Decrease DecreaseZero Increase NoneZero Decrease None
As an example, a bank manager has calculated that the duration of assets is5 years and the duration of liabilities is 4 years.The manager learns from thebank’s economic forecast that interest rates should go up by 30 basis points,from 8.00 percent to 8.30 percent.The bank has total assets of $500 million,liabilities of $400 million, and shareholder equity of $100 million.The increasein interest rates will result in a decline in bank value of $2.5 million:
� A � �DA � DL � �� � $500m � �5 � 4 � �� �$2.5m.
However, gap analysis cannot reveal the impact of such factors as new pric-ing strategies for consumer and business deposits, changes in balance-sheetmix, or the effects of various options embedded in balance-sheet instruments.Therefore, a bank usually supplements a gap analysis with simulations under avariety of interest rate scenarios.
$400m�$500m
�0.003��(1 � 0.08)
L�A
� ∆y�(1 � y)
L�A
� ∆y�(1 � y)
CHAPTER 3 Commercial Banks 67
3.4
3.5
03-Liaw 6/2/03 1:58 PM Page 67

Market Risk ManagementAs we have seen, gap analysis captures interest rate risk, but market risk alsoarises from adverse changes in foreign exchange rates, commodity prices, andequities prices.The common representation of market risk is the value-at-risk(VaR) measure. Banks, in their annual reports, disclose their interest rate VaR,foreign exchange VaR, commodities VaR, and equities VaR for each market fac-tor. Since prices do not move in the same direction and by the same propor-tion, typically a portfolio benefits from a diversification effect that will lowerthe VaR of the whole portfolio.That is, the portfolio VaR is less than the sumof the component VaRs.
The VaR can be estimated using several methods, including historical sim-ulation, the parametric approach, and Monte Carlo simulation. Under the his-torical simulation approach, one can construct the distribution of profits andlosses by using the observed past changes in the market factors during each ofthe last 250 trading days to calculate the values of the current portfolio.10 Thisresults in the building of 250 sets of hypothetical market factors using theircurrent values and the changes that occurred during the time period. One canuse these hypothetical values to compute 250 hypothetical marked-to-marketportfolio values. Comparing those 250 hypothetical portfolio values with thecurrent value of the portfolio produces 250 profits and losses on the portfolio.Once the calculation of hypothetical marked-to-market profit or loss for eachof the last 250 trading days occurs, the distribution of profits and losses and theVaR can then be calculated.
The parametric approach assumes that the underlying market factors havea multivariate normal distribution. Therefore, the distribution of marked-to-market portfolio profits and losses is also normal.A key step in this approach isrisk mapping, which entails taking the actual instruments and mapping theminto a set of simpler, standardized positions or instruments. Each of these stan-dardized positions connects with a single market factor. In essence, for anyactual portfolio, risk mapping finds a portfolio of standardized positions that isequivalent to the original portfolio.This portfolio of standardized positions hasthe same sensitivities to changes in the values of the market factors.The VaRof that equivalent portfolio can then be calculated.
In many respects, the Monte Carlo simulation approach is similar to his-torical simulation.The main difference is that, rather than using the observedpast changes in the market factors over the last N trading days, the MonteCarlo simulation relies on a chosen statistical distribution that its proponentsbelieve adequately captures or approximates the possible changes in the mar-ket factors. Then, a random number generator creates thousands or tens ofthousands of hypothetical changes in the market factors.These changes help tocalculate thousands of hypothetical profits or losses on the current portfolioand to construct the distribution of possible portfolio profit or loss. Finally, thisdistribution determines the VaR.
68 PART 2 Major Financial Institutions
10The time period used is generally one year, so the number of days used is often about 250.
03-Liaw 6/2/03 1:58 PM Page 68

Although VaR estimates a bank’s exposure to market risk factors in normalmarkets, it does not capture the risk of unlikely, but still plausible, events inabnormal markets. Hence, many institutions include stress tests in their marketrisk management process. Effective stress tests involve changes in market ratesand prices that result from prespecified financial scenarios, including both his-torical and hypothetical market events. Continuous review and updating ofstress scenarios are key to the success of stress testing.
OPERATION RISK MANAGEMENT
Banks, like all large corporations, face various types of operating risks.Examples include fraud by employees, unauthorized transactions by employeesand customers, and errors related to computer or communications systems.Theexperience of the Bank of New York in 1985 demonstrates the significance ofoperation risk. During a computer malfunction, the Bank of New York couldaccept deliveries of securities, but it could not make them.The Bank had topay out funds when accepting deliveries of securities on behalf of its clients,but it could not take in any money because it could not deliver the securitiesout to counterparties. The bank had to borrow $22.5 billion from the NewYork Fed to cover the deficit created by the snafu. In recent years, the adventof the euro and Y2K issues raised the possibility of even more costly problems.
European Economic and Monetary UnionOn January 1, 1999, the European Economic and Monetary Union (EMU)took effect (Chapter 17 provides a detailed discussion of the EMU), and intro-duced the new common currency, the euro (i).The exchange rates of the cur-rencies of the 12 participating countries (Austria, Belgium, Finland, France,Germany, Greece, Ireland, Italy, Luxembourg, the Netherlands, Portugal, andSpain; Greece joined in 2000) were fixed irrevocably. Until 2002, the nationalcurrencies and the new euro coexisted. During the three-year transition periodfrom 1999 to 2002, banks that had exposure to the euro, whether through for-eign exchange business, custodial services, cash management, or funds transferservices, had to have the capability to service clients in both national currencyunits and in euros.The costs for a large bank ran into the tens of millions ofdollars.
Year 2000The year 2000 problem (Y2K) involved the ability of time-sensitive computersystems to recognize the date change from December 31, 1999, to January 1,2000, and the worldwide challenge that ensued. Banks, the core of the finan-cial system, not only had to assess and modify their own computer systems andbusiness processes to ensure that they would continue to function but also hadto assess the readiness of third parties with which they interfaced.
In addition to internal upgrading and testing, banks and securities firmsparticipated in many tests with customers and in industry-wide (street) testing.
CHAPTER 3 Commercial Banks 69
03-Liaw 6/2/03 1:58 PM Page 69
70 PART 2 Major Financial Institutions
Street testing covered agencies such as the New York Fed, Depositary TrustCompany, Automated Clearing House, Clearing House Interbank PaymentsSystem, Government Securities Clearing Corporation, National SecuritiesClearing Corporation, Mortgage Backed Securities Clearing Corporations,Society for Worldwide Interbank Financial Telecommunication (SWIFT),Clearstream, Euroclear, and others. Such testing was crucial since a failure ofexternal interface could have a material adverse effect on a bank’s operations.Banks also carried out major customer and business partner due diligence.Most large banks incorporated Y2K customer risks into their credit risk analy-sis and their credit and liquidity planning.
The banking industry prepared itself well for Y2K problems because of theclose monitoring by many regulatory agencies. Nevertheless, central banksengaged in additional concrete actions, as well as public relations gestures.TheFederal Reserve took several measures to prevent Y2K disasters:
° Making up to $200 billion in extra currency available.
° Setting up a special Y2K credit window for banks to borrow extra reserves.Extending the maturity of some repurchase agreements with primary deal-ers and expanding the collateral used in repos to include mortgage-backedsecurities such as Ginnie Maes and Freddie Macs.
° Selling liquidity call options that give primary dealers the right to borrowsubstantial funds from the Federal Reserve if the federal funds rate roseabove 7 percent.
Most major central banks took similar steps. All the preparations and effortspaid off. The dire predictions of technological chaos resulting from the Y2Kproblem proved almost empty.
CONCLUDING SUMMARY
Citigroup offers services in traditional banking; consumer finance; credit cards;investment banking; securities brokerage and asset management; and property,casualty, and life insurance to over 100 million customers in 100 countriesaround the world. This financial supermarket exemplifies the trend towardone-stop shopping in financial services.
Technology has received a great deal of attention and has revolutionizedthe way banks operate.The challenge for banks is to have a well thought outstrategic plan for their online banking activities.The challenge for regulators isto ensure that customers have full security and privacy.
In another important development, banks have gained new powers. Bankholding companies can now establish securities subsidiaries to underwrite anddeal in corporate debt and equity securities. As banks expand the menu ofproducts and services they offer, credit risk has become only one of their sig-nificant risk exposures. Banks’ exposure to market risk arises from changes ininterest rates, foreign exchange rates, securities prices, and commodity prices.To protect against credit risk, bank regulators impose risk-based capital stan-
03-Liaw 6/2/03 1:58 PM Page 70

CHAPTER 3 Commercial Banks 71
dards. Each balance-sheet asset and off-balance-sheet item falls into one of fourbroad risk categories based on the perceived credit risk. For market risk, banksuse the value-at-risk approach. Banks must calculate the amount of value atrisk arising from each of the market factors. In addition, liquidity risk man-agement and operation risk management are essential to successful bankingoperations.
Key Terms
bank holding company 45basis risk 64Basel II 59CAMELS 57core deposit 64credit default swap 63credit risk 55duration gap analysis 66gap analysis 65Glass-Steagall Act 46interest rate risk 64Internet banking 62liquidity risk 62market risk 58
market risk rule 58New Capital Accord 59notional principal 63operation risk 62reserve requirements 51section 20 subsidiaries 46securities subsidiaries 47specific risk 58tier 1 capital 55tier 2 capital 55tier 1 leverage ratio 57underwriting subsidiaries 46value at risk (VaR) 59
Review Questions
1. What major roles do banks play in the financial system? Compare and contrast thetraditional roles with the newer ones.
2. Bank holding companies have obtained new powers to underwrite and deal insecurities.At the same time, regulators have imposed certain firewalls.What are thepurposes of the firewalls?
3. Bank CBA has assets and capital as follows:
Assets Amount ($ millions)Cash $ 12Treasury securities 50Balances due from domestic banks 22Residential mortgages 100Corporate loans 88Off-balance-sheet credit-equivalent amount 38Tier 1 capital 5Tier 2 capital 8
Does Bank CBA meet regulatory capital requirements?
4. Explain the CAMELS rating system.
5. A bank discloses that its total portfolio VaR is $26 million on December 31, 2002.This is based on a 1-day, 99th percentile standard.What does this mean?
6. How do CAMELS ratings integrate into the risk-based insurance premiumsystem?
03-Liaw 6/2/03 1:58 PM Page 71

72 PART 2 Major Financial Institutions
7. Asset securitization involves packaging bank assets and then selling them in theform of securities. Explain how securitization helps in the management of creditrisk. Does it provide any benefits?
8. What is market risk? Does the market risk rule apply to every bank and thrift?Why or why not?
9. Discuss the major implications of the Gramm-Leach-Bliley Act of 1999.
10. What are the VaRs of the three largest U.S. banks? Compare their componentVaRs and portfolio VaRs. Explain the differences between banks.
Select Bibliography
Berger, N. A., R. S. Demsetz, and P. E. Strahan. “The consolidation of the financial services industry:Causes, consequences, and implication for the future.” Staff Reports, Federal Reserve Bank of New York,December 1998.
Cumming, C. M., and B. J. Hirtle.“The challenges of risk management in diversified financial compa-nies.” Economic Policy Review 7:1, Federal Reserve Bank of New York, 2001, pp. 1–17.
Federal Deposit Insurance Corporation. History of the Eighties—Lessons for the Future. Washington, D.C.,1997.
Galai, D., D. Ruthenberg, M. Sarnat, and B. Z. Schreber. Risk Management and Regulation in Banking.Hingham, Mass.: Kluwer, 1999.
Koch,T.W., and S. S. MacDonald. Bank Management. Fort Worth,Tex.:The Dryden Press, 2000.
Linsmeier,T. J., and N. D. Pearson.“Risk management: an introduction to value at risk.” working paper,University of Illinois at Champaign-Urbana, 1996.
McLaughlin, S. “The impact of interstate banking and branching reform: Evidence from the states.”Current Issues in Economics and Finance 1, no. 2, Federal Reserve Bank of New York (May 1995), pp. 1–6.
Radecki, L. J., and J.Wenninger. “Paying electronic bills electronically.” Current Issues in Economics andFinance 5, no. 1, Federal Reserve Bank of New York (January 1999), pp. 1–6.
Rose, P. S. Commercial Bank Management. New York: McGraw-Hill, 1999.
Saunders, A. Credit Risk Measurement: New Approaches to Value at Risk and Other Paradigms. New York:John Wiley & Sons, 1999.
Terrile, J. G. Y2K: Ready or Not? Merrill Lynch Global Securities Research and Economics Group, July1999.
Weinstein, S., N. E. Stroker, and R.W. Merritt.“Securitization and its impact on bank ratings.” FinancialServices Special Report, Fitch IBCA, March 1999.
03-Liaw 6/2/03 1:58 PM Page 72