06. land observation satellites - gers laboratory at...
TRANSCRIPT
1
2
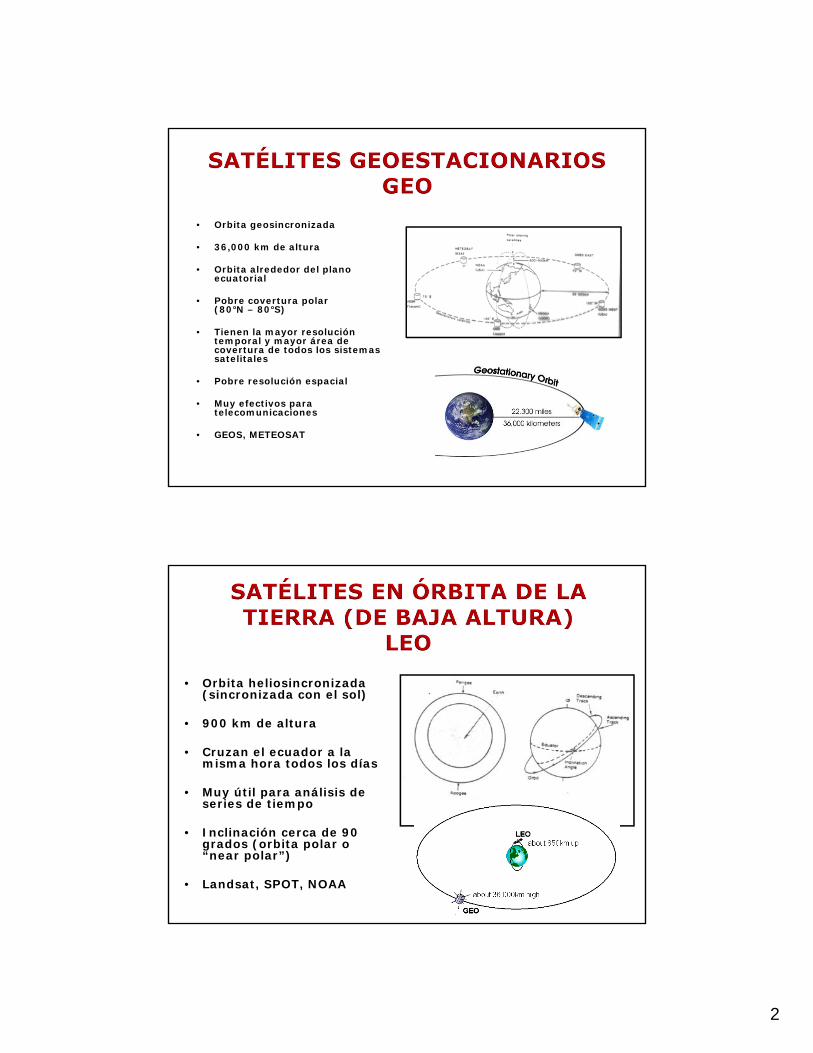
• Orbita geosincronizada
• 36,000 km de altura
• Orbita alrededor del plano ecuatorial
• Pobre covertura polar (80°N – 80°S)
• Tienen la mayor resolución temporal y mayor área de covertura de todos los sistemas satelitales
• Pobre resolución espacial
• Muy efectivos para telecomunicaciones
• GEOS, METEOSAT
• Orbita heliosincronizada(sincronizada con el sol)
• 900 km de altura
• Cruzan el ecuador a la misma hora todos los días
• Muy útil para análisis de series de tiempo
• Inclinación cerca de 90 grados (orbita polar o “near polar”)
• Landsat, SPOT, NOAA
3
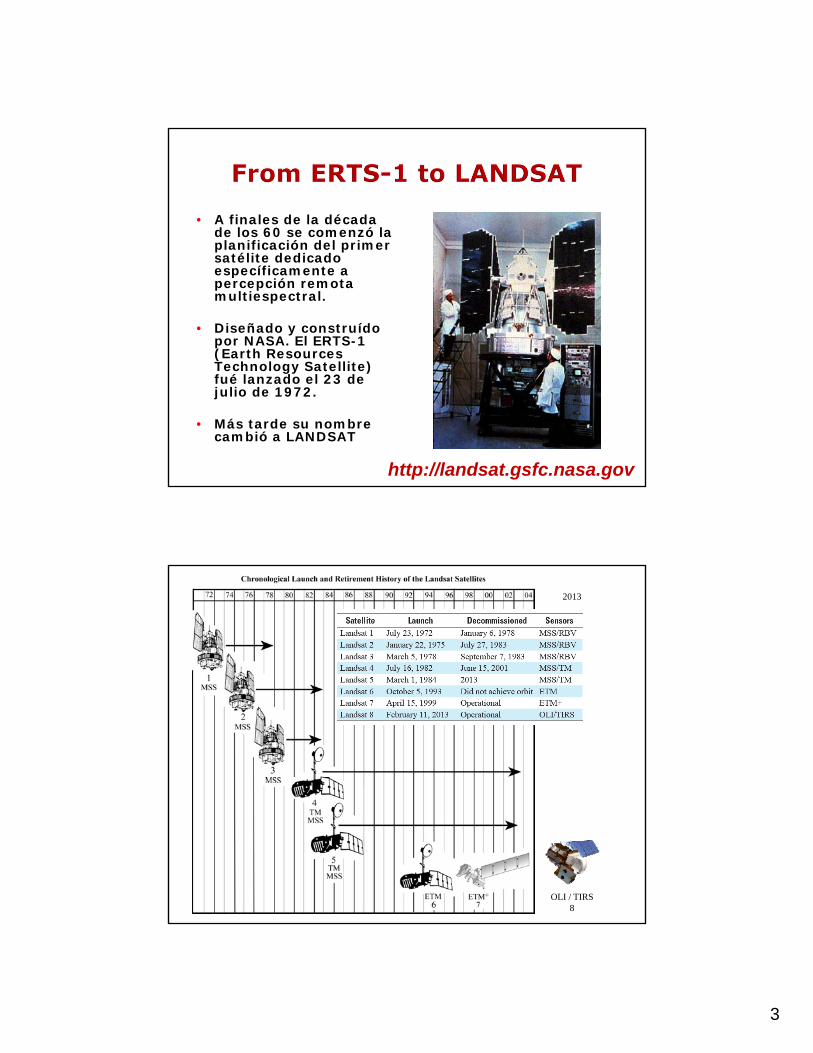
• A finales de la década de los 60 se comenzó la planificación del primer satélite dedicado específicamente a percepción remota multiespectral.
• Diseñado y construído por NASA. El ERTS-1 (Earth Resources Technology Satellite) fué lanzado el 23 de julio de 1972.
• Más tarde su nombre cambió a LANDSAT
http://landsat.gsfc.nasa.gov
OLI / TIRS8
2013
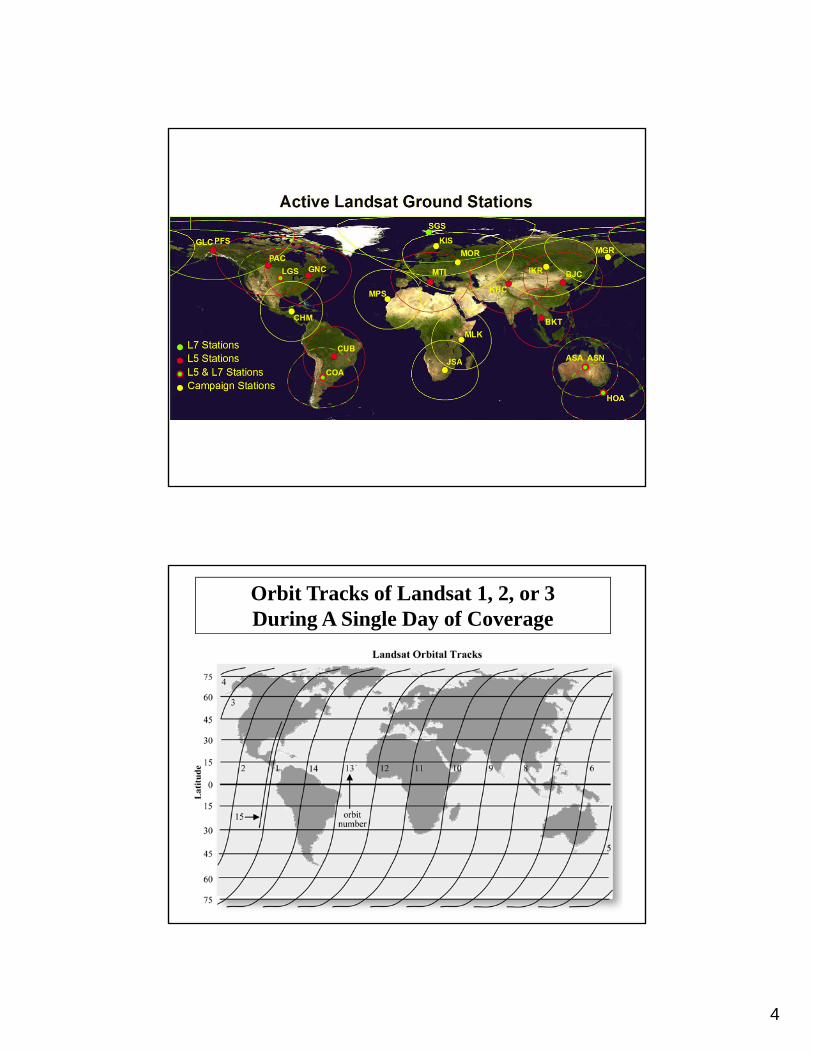
4
Orbit Tracks of Landsat 1, 2, or 3 During A Single Day of Coverage

5
•orbita “near-polar” (inclinación aproximada de 98° en el ecuador, pasando a menos de 8 grados en los polos) y sincronizada con el sol.
•Cruza el ecuador (viajando de norte a sur) cada día entre 9:30 y 10:00 A.M., hora local.
•Landsats 1-3 : altitud: 570 millas (923 km) completa 14 órbitas desplazadas 2875 km ó 1785 miles al oeste cada día (3 veces sobre USA), repite cada 252 orbitas (18 días).
•Landsats 4-5, altitud: 438 millas (705 km), regresa a la misma órbita cada 16 días, después de 233 orbitas.
LANDSAT: REMOTE SENSORSReturn Beam Vidicon camera (RBV) B,G,R
Multispectral Scanner (MSS) G,R, 2 NIR
Thematic Mapper (TM) B,G,R, NIR, 2 MIR, FIR
Enhanced Thematic Mapper Plus (ETM+) B,G,R, NIR, 2 MIR, FIR, PAN
Operational Land Imager (OLI) 2B,G,R, NIR, 3MIR, PAN
Thermal Infrared Sensor (TIRS) 2 Thermal Bands

6
Sensor de imágenes digitales a bordo de un satélite que obtiene la información reflejadade la superficie terrestre en 4 bandas del espectro electromagnético.
El MSS consiste deun telescopioespejo explorador (oscila 2.89° a ambos lados)6 detectores por bandacomponentes electrónicos
Band Number (L1-L3)
Band Number(L4-L5)
µm Resolution
4 ~ 2 (0.52–0.60 µm) 0.5-0.6 68 m X 83 m
5 ~ 3 (0.63–0.69 µm) 0.6-0.7 68 m X 83 m
6 ~ 4 (0.76–0.90 µm) 0.7-0.8 68 m X 83 m
7 ~ 4 0.8-1.1 68 m X 83 m
8 ~ 6 (2.08–2.35 µm) 10.41-12.6 68 m X 83 m
Bands 4, 5, and 7
7
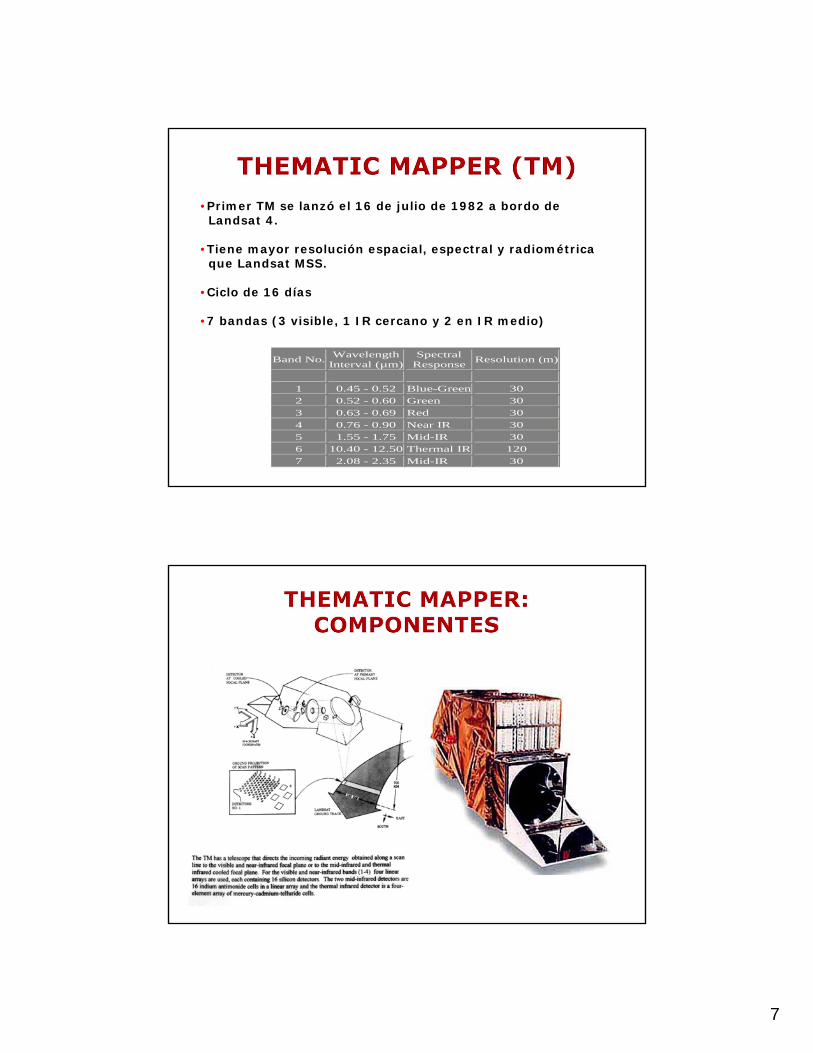
Band No. Wavelength
Interval (µm)Spectral
Response Resolution (m)
1 0.45 - 0.52 Blue-Green 30
2 0.52 - 0.60 Green 30
3 0.63 - 0.69 Red 30
4 0.76 - 0.90 Near IR 30
5 1.55 - 1.75 Mid-IR 30
6 10.40 - 12.50 Thermal IR 120
7 2.08 - 2.35 Mid-IR 30
•Primer TM se lanzó el 16 de julio de 1982 a bordo de Landsat 4.
•Tiene mayor resolución espacial, espectral y radiométrica que Landsat MSS.
•Ciclo de 16 días
•7 bandas (3 visible, 1 IR cercano y 2 en IR medio)

8
False color (TM bands 2, 3, 5 in blue, green,and red) rendition of mountain ranges insoutheastern California and western Nevada.The large valley towards the left is DeathValley, with the Panamint Range to its left.The large range near the upper right is theSpring Mountains, whose reddish tonesindicate vegetation (mixed evergreens anddeciduous trees). The bottom of the imageincludes the north edge of the Mojave Desert.
Sonoran Desert of northwest Mexico (abit of the Gulf of California appears inthe lower left), shown here in truecolor. Star and crescentic sand dunesdominate this subscene in this vastsand sea deposited over igneous lavas.The dark patches in the upper right arevolcanic lavas but the dark mass to itssouthwest is the Sierra del Rosario,composed of granitic rocks
ETM+ BANDS
Band MicrometersResolution
(M)
1 .45 to .515 30
2 .525 to .605 30
3 .63 to .690 30
4 .75 to .90 30
5 1.55 to 1.75 30
6 10.40 to 12.5 60
7 2.09 to 2.35 30
Pan .52 to .90 15
ETM+ TECHNICAL SPECIFICATIONS
Typeopto-mechanical
scanner
Spatial resolution
15/30/60 m
Spectral range 0.45-12.5 µm
Number of bands
8
Temporal resolution
16 days
Size of image 183 x 170 km
Swath 183 km
Stereo n
Programmable y
9
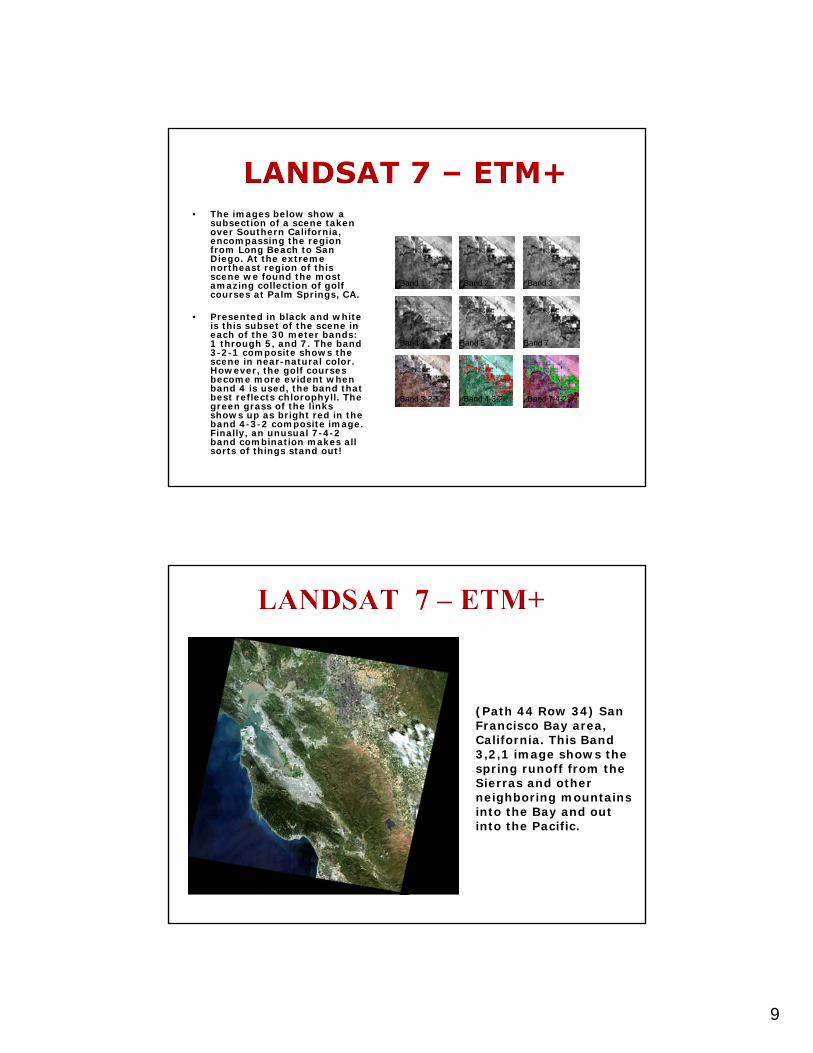
• The images below show a subsection of a scene taken over Southern California, encompassing the region from Long Beach to San Diego. At the extreme northeast region of this scene we found the most amazing collection of golf courses at Palm Springs, CA.
• Presented in black and white is this subset of the scene in each of the 30 meter bands: 1 through 5, and 7. The band 3-2-1 composite shows the scene in near-natural color. However, the golf courses become more evident when band 4 is used, the band that best reflects chlorophyll. The green grass of the links shows up as bright red in the band 4-3-2 composite image. Finally, an unusual 7-4-2 band combination makes all sorts of things stand out!
Band 1 Band 2 Band 3
Band 4 Band 5 Band 7
Band 3-2-1 Band 4-3-2 Band 7-4-2
(Path 44 Row 34) San Francisco Bay area, California. This Band 3,2,1 image shows the spring runoff from the Sierras and other neighboring mountains into the Bay and out into the Pacific.
10
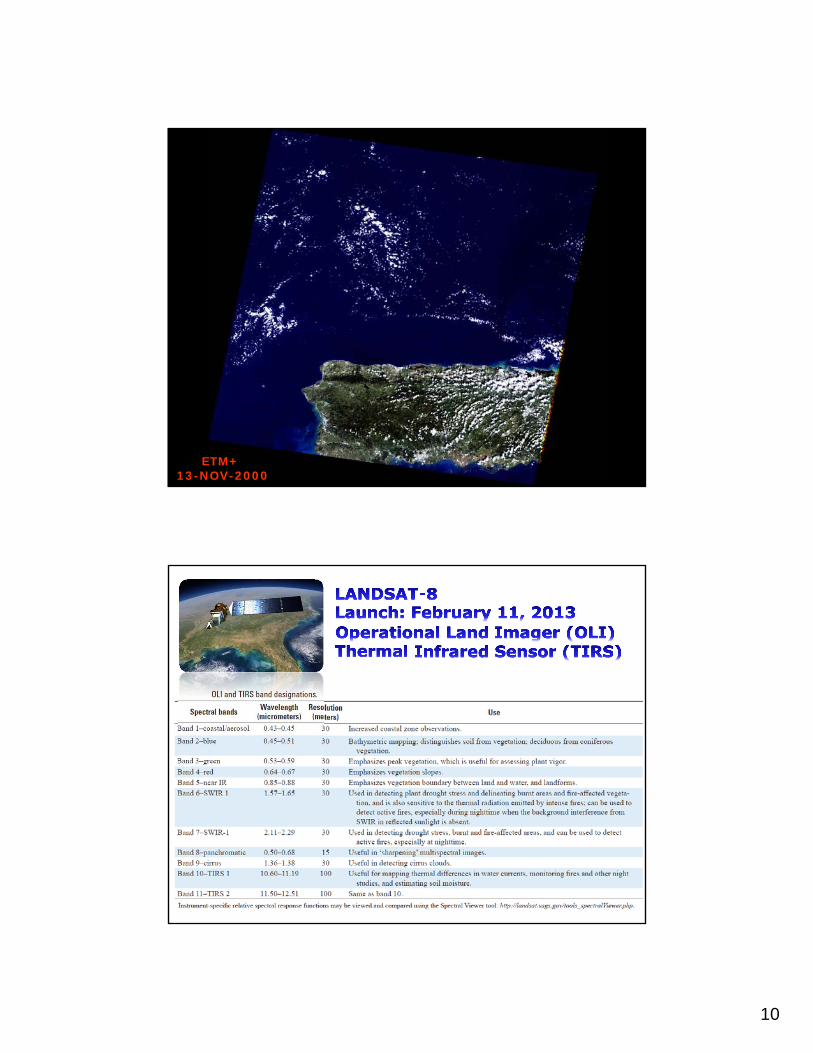
ETM+ 13-NOV-2000

11
Resolutions of OLI:
Spatial=30 m, 15 pan
Spectral=9 bands
Radiometric=12 bits
Temporal=16 days
Bands of Landsat 7 and 8

12
Bands of Landsat 7 and 8
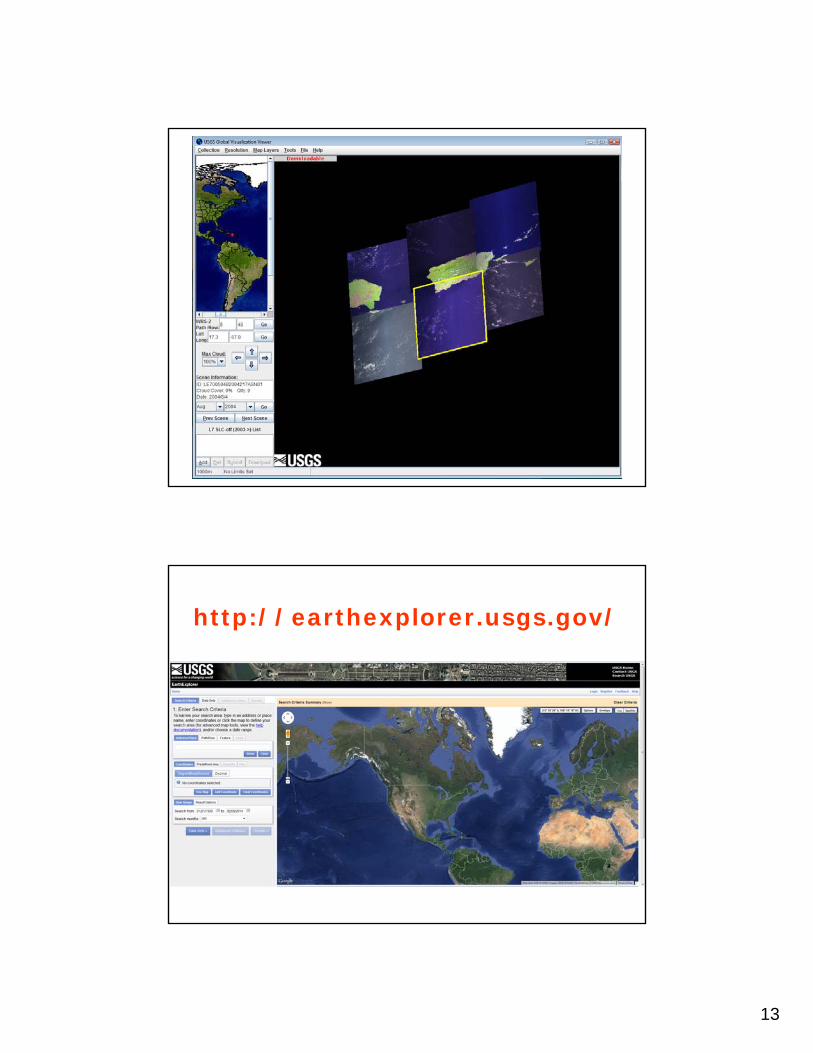
http://glovis.usgs.gov
13
http://earthexplorer.usgs.gov/
14
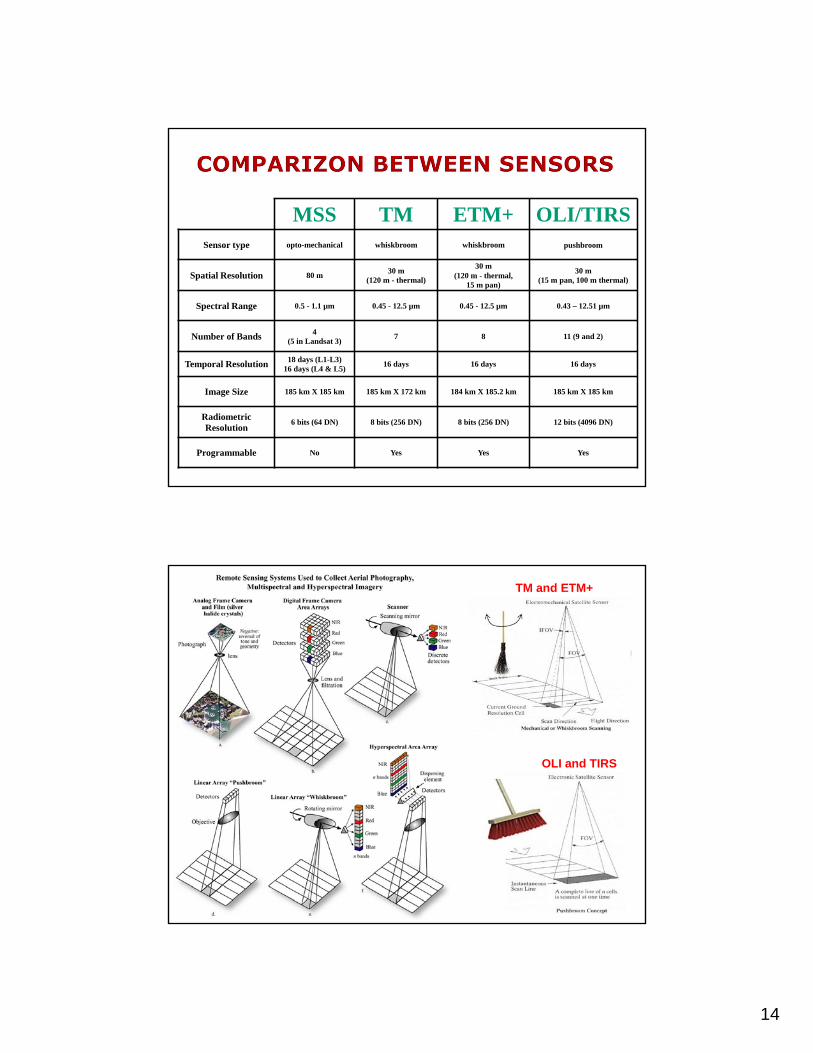
MSS TM ETM+ OLI/TIRSSensor type opto-mechanical whiskbroom whiskbroom pushbroom
Spatial Resolution 80 m30 m
(120 m - thermal)
30 m (120 m - thermal,
15 m pan)
30 m (15 m pan, 100 m thermal)
Spectral Range 0.5 - 1.1 µm 0.45 - 12.5 µm 0.45 - 12.5 µm 0.43 – 12.51 µm
Number of Bands 4 (5 in Landsat 3)
7 8 11 (9 and 2)
Temporal Resolution 18 days (L1-L3)16 days (L4 & L5)
16 days 16 days 16 days
Image Size 185 km X 185 km 185 km X 172 km 184 km X 185.2 km 185 km X 185 km
Radiometric Resolution
6 bits (64 DN) 8 bits (256 DN) 8 bits (256 DN) 12 bits (4096 DN)
Programmable No Yes Yes Yes
TM and ETM+
OLI and TIRS
15
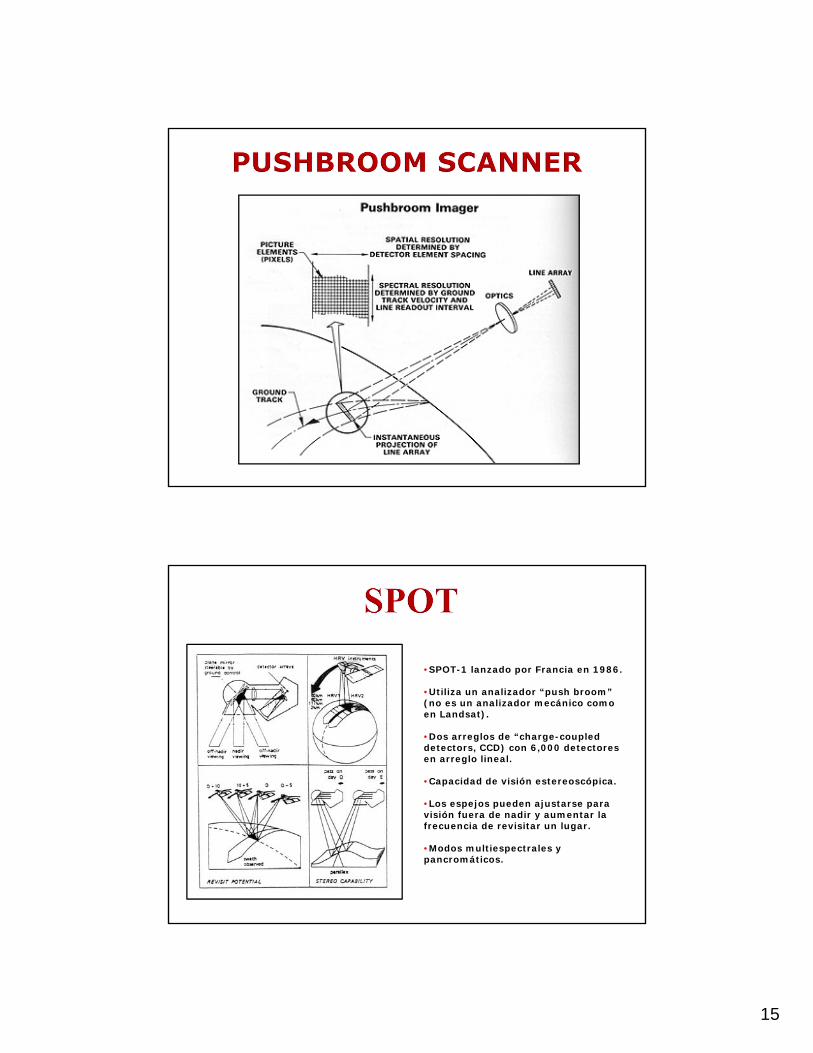
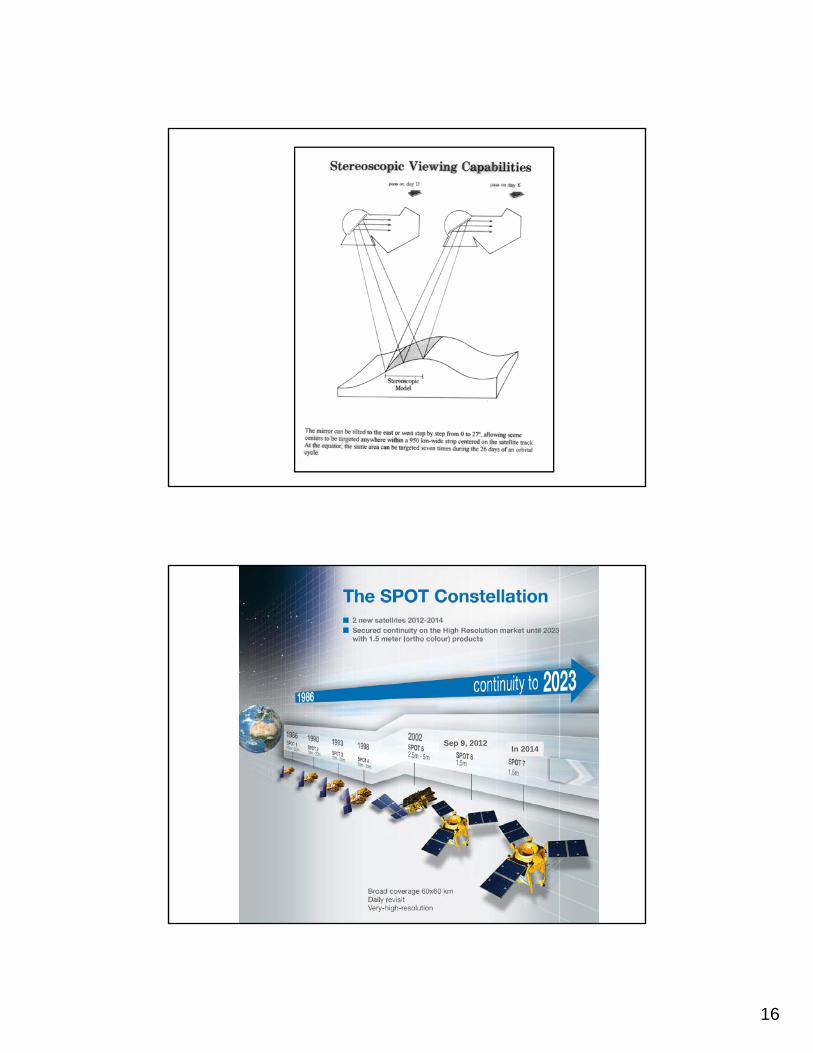
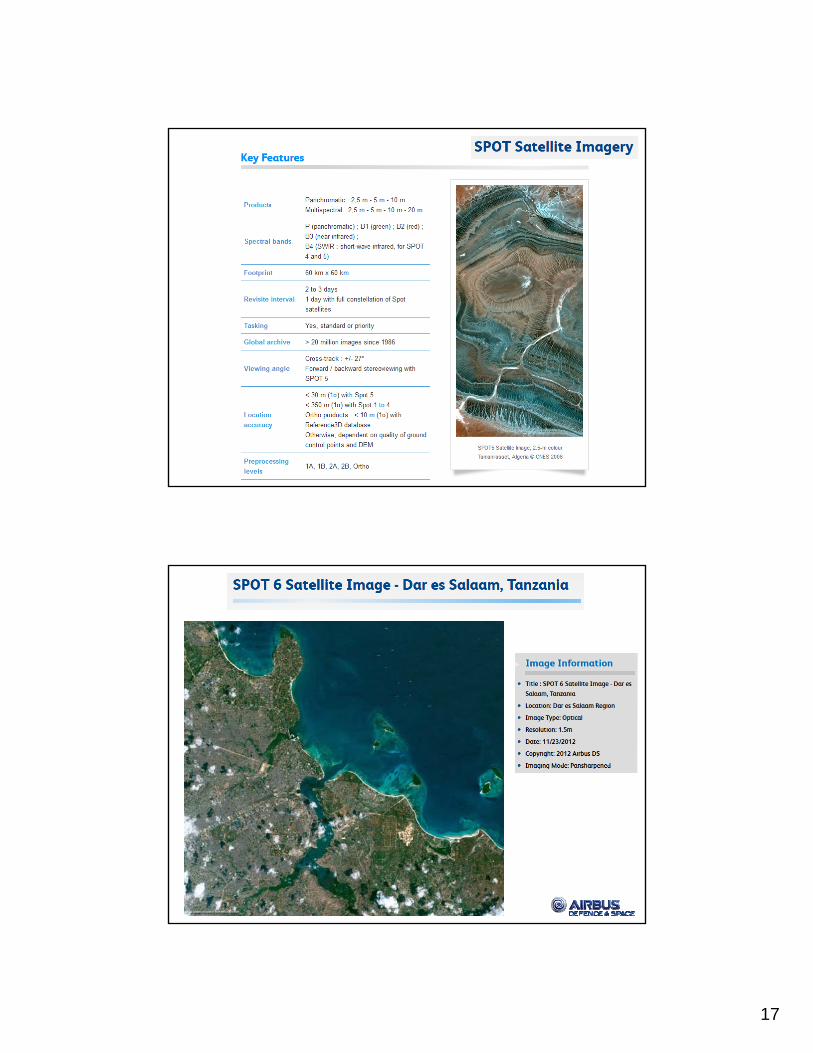
•SPOT-1 lanzado por Francia en 1986.
•Utiliza un analizador “push broom” (no es un analizador mecánico como en Landsat).
•Dos arreglos de “charge-coupled detectors, CCD) con 6,000 detectores en arreglo lineal.
•Capacidad de visión estereoscópica.
•Los espejos pueden ajustarse para visión fuera de nadir y aumentar la frecuencia de revisitar un lugar.
•Modos multiespectrales y pancromáticos.
16
Sep 9, 2012In 2014
17
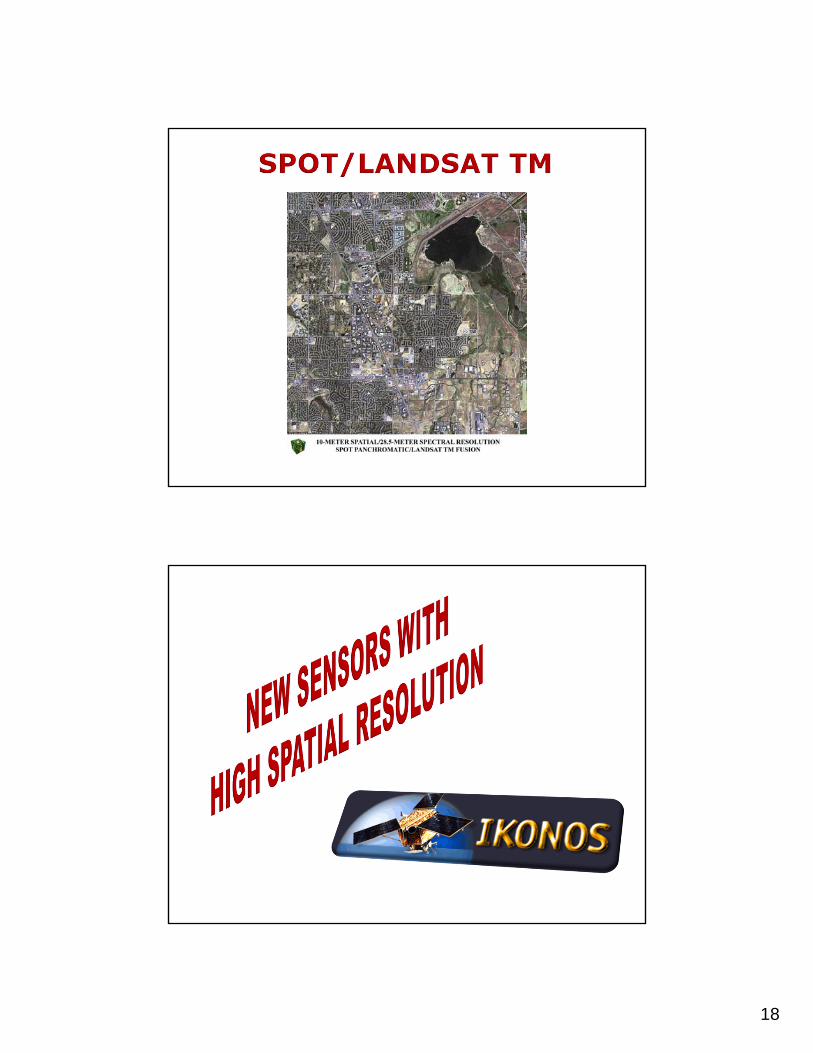
18

19
IKONOS SENSOR
IKONOS is derived from the Greek word for "image." The IKONOS satellite is the world's first commercial satellite to collect black-and-white images with 1-meter resolution and multispectral imagery with 4-meter resolution.
Sensor Characteristics
The IKONOS satellite weighs about 1600 pounds. It orbits the Earth every 98 minutes at an altitude of approximately 680 kilometers or 423 miles. IKONOS was launched into a sun-synchronous orbit, passing a given longitude at about the same local time (10:30 A.M.) daily. IKONOS can produce 1-meter imagery of the same geography every 3 days.
Spectral Range1-meter black-and-white
(panchromatic)0.45 - 0.90 mm.
4-meter multispectral Blue: 0.45 - 0.52 mm
Green: 0.51 - 0.60 mmRed: 0.63 - 0.70mm
Near IR: 0.76 - 0.85 mm
1 m
eter
–B
/W
1 m
eter
–T
rue
Co
lor
4 m
eter
–F
alse
Co
lor
4 m
eter
–T
rue
Co
lor
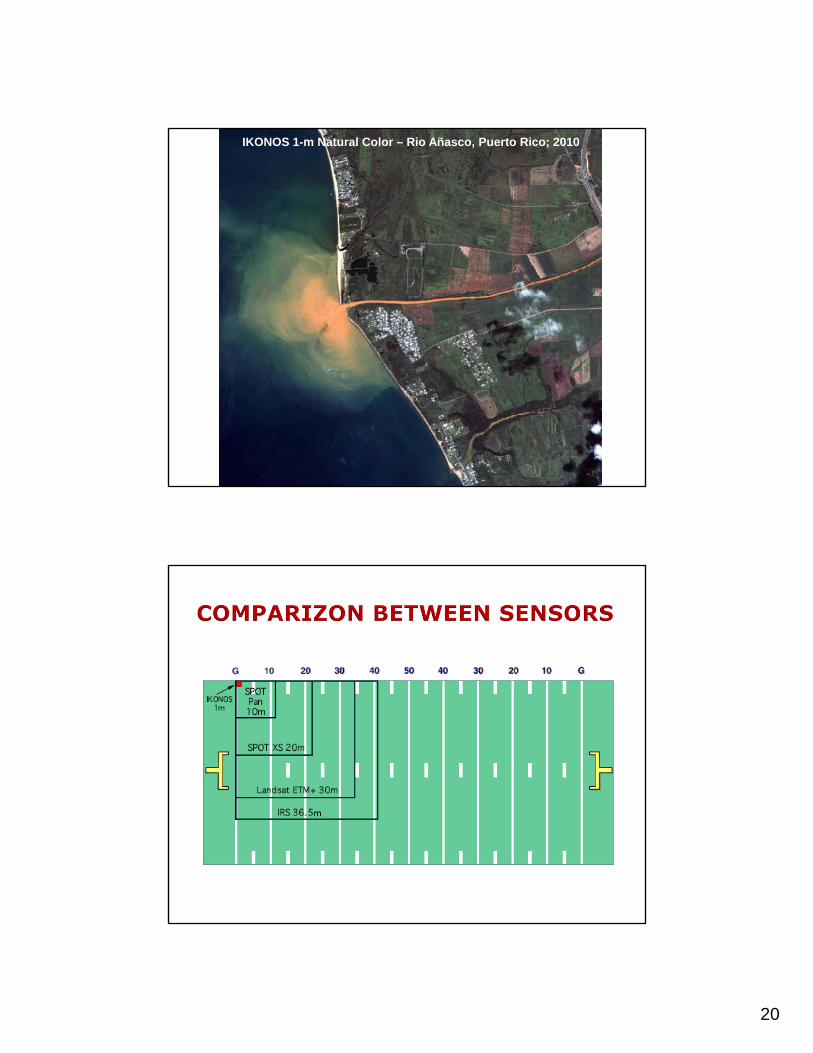
20
IKONOS 1-m Natural Color – Rio Añasco, Puerto Rico; 2010
21

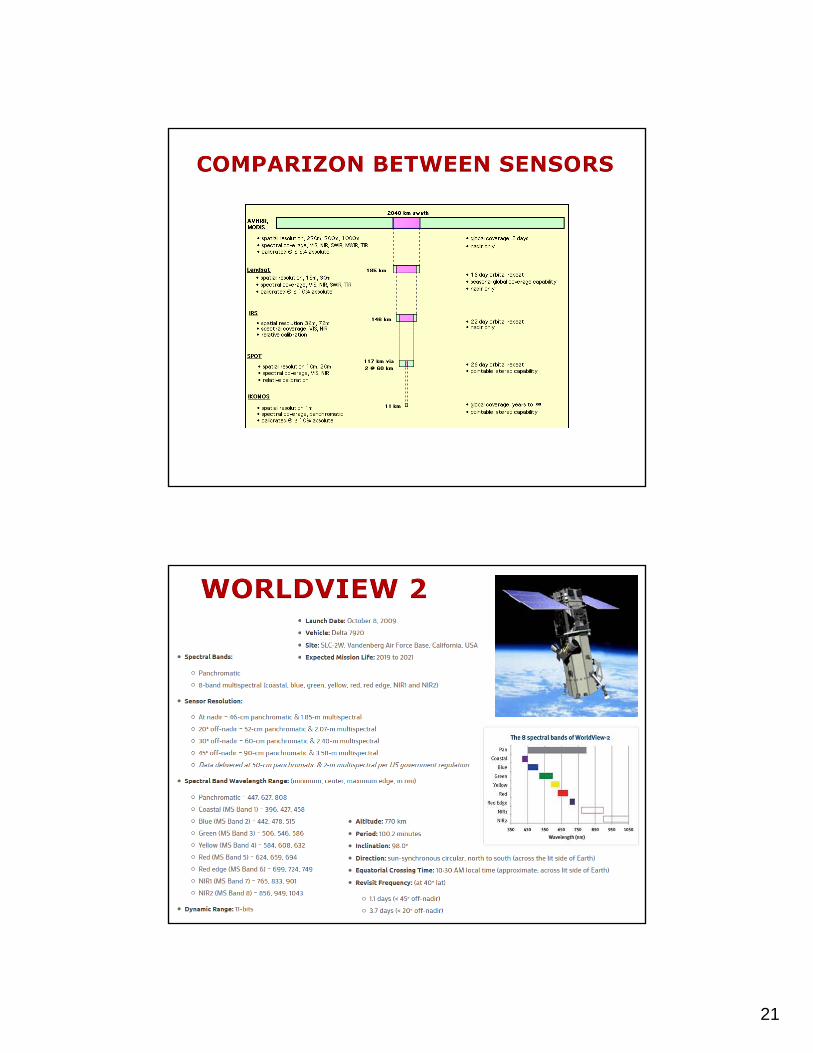
22
WorldView-2 50-cm Natural Color - Buenos Aires, Argentina; January 22, 2013
1. Read Chapter 6 and answer the review questions 3, 5, and 10 (at the end of the chapter).