08__050610_scip/seb_psr_delivery.1 temperature and density diagnostics with secchi euvi j.s. newmark...
Post on 20-Dec-2015
223 views
TRANSCRIPT
08__050610_SCIP/SEB_PSR_Delivery.1
Temperature and Density Diagnostics with SECCHI EUVI
J.S. Newmark
Naval Research Laboratory
(202) 767-0244

08__050610_SCIP/SEB_PSR_Delivery.2
EUVI Temperature Response
Contaminating Lines (Mg VII, Si VII)
Contaminating Line (Si XI)
08__050610_SCIP/SEB_PSR_Delivery.3
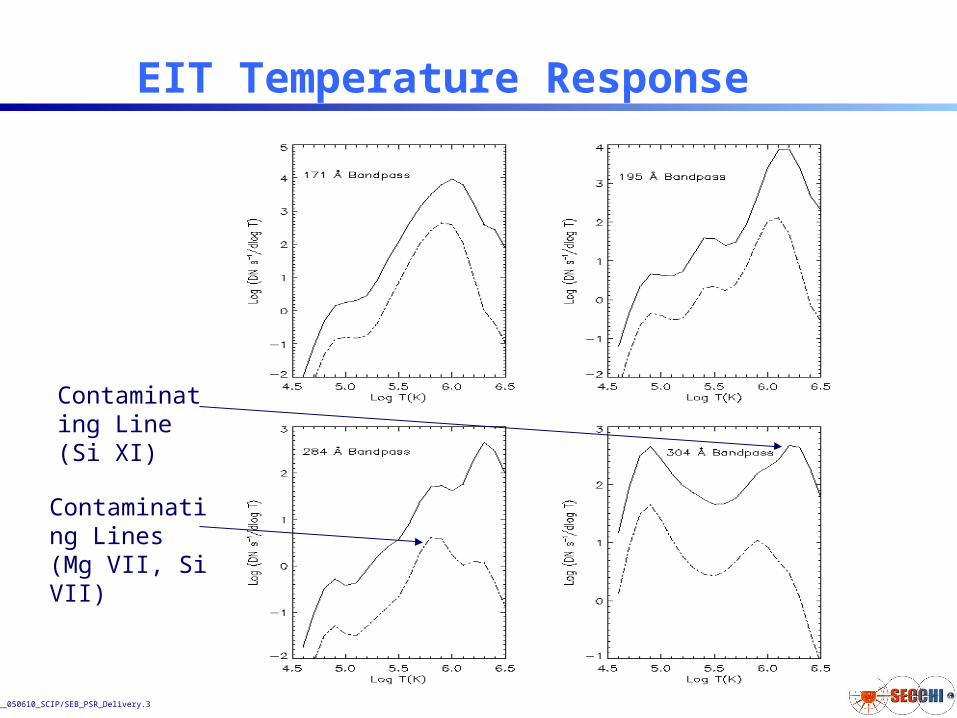
EIT Temperature Response
Contaminating Lines (Mg VII, Si VII)
Contaminating Line (Si XI)

08__050610_SCIP/SEB_PSR_Delivery.4
EUVI and EIT Fe XV

08__050610_SCIP/SEB_PSR_Delivery.5
Differential Emission Measure
• I(ergs cm-2 s-1 sr-1) = F(atomic physics)* DEM, DEM = Ne2dl/dlogT, assumes optically thin, steady state equilibrium, atomic physics = CHIANTI
• Applications: Solar absolute intensity maps- lines or bandpasses, thermal structure of the solar atmospheric energy balance, model radio thermal bremsstrahlung emission – appropriate for “stable” structures or long term studies, not FLARE related events.
• Loop temperatures and coronal heating
• EIT derived DEMs - Cook et al. 1999, 2003, forward modeling, full disk, pixel-by-pixel DEM maps from 80,000 K - 2.5 MK

08__050610_SCIP/SEB_PSR_Delivery.6
Computing DEM from Starter (tested
for insensitivity)

08__050610_SCIP/SEB_PSR_Delivery.7
Data and Model
Comparison
Fe IX/X and Fe XII

08__050610_SCIP/SEB_PSR_Delivery.8
Data and Model
Comparison Fe XV and
He II
08__050610_SCIP/SEB_PSR_Delivery.9
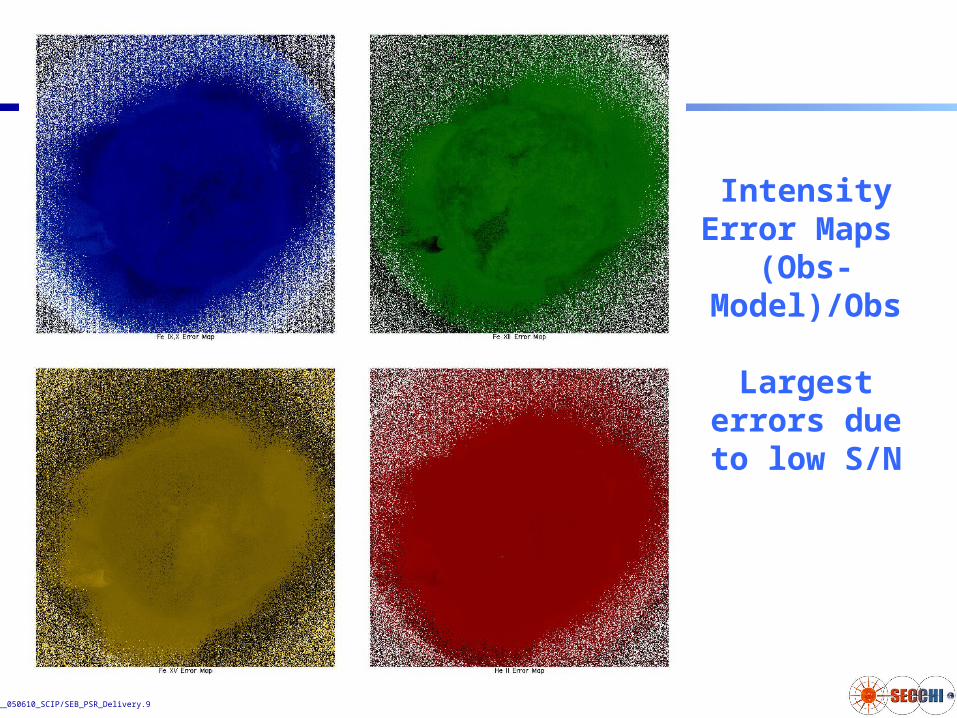
Intensity Error Maps
(Obs-Model)/Obs
Largest errors due to low S/N

08__050610_SCIP/SEB_PSR_Delivery.10
Intensity Error Histograms (Obs-Model)/Obs

08__050610_SCIP/SEB_PSR_Delivery.11
EIT DEM Determined Irradiance and SOHO SEM Measured

08__050610_SCIP/SEB_PSR_Delivery.12
Average DEMs
Active Region
Quiet Sun
Coronal Hole

08__050610_SCIP/SEB_PSR_Delivery.13
Model Temperature Slices (Log T = 5.0,5/5,6.0,6.5)

08__050610_SCIP/SEB_PSR_Delivery.14
He II (30.4 nm) Bandpass Decomposition

08__050610_SCIP/SEB_PSR_Delivery.15
Maps of Peak Temperature and Slope (LogT)

08__050610_SCIP/SEB_PSR_Delivery.16
Comparison DEM and EM
Isothermal Emission Measure Determined from single ratio – note multi-thermal nature
Ratio emission measureEM/0.3 (LogT range)
Ratio emission measureEM*0.7/0.3 (<EM> over LogT distribution)
Isothermal EM = DEM x LogT

08__050610_SCIP/SEB_PSR_Delivery.17
DEM and Irradiance Software
• Solarsoft + CHIANTI
• EUVI DEM Software
– EUVI_DEM_TOOL
– EUVI_LINE_MAP
– EUVI_IRRAD_SPEC
– 1024x1024x25 array takes ~2 minutes
– User’s beware – please read assumptions in code, e.g. abundance, ionization equilibrium, helium enhancement, etc.
• 170 – 340 Å spectra, 10 Å bins
– Website