1 – 1 operations management chapter 1 – operations and productivity powerpoint presentation to...
Post on 19-Dec-2015
555 views
TRANSCRIPT

1 – 1
Operations ManagementOperations ManagementChapter 1 – Chapter 1 – Operations and Operations and ProductivityProductivity
PowerPoint presentation to accompany PowerPoint presentation to accompany Heizer/Render Heizer/Render Principles of Operations Management, 7ePrinciples of Operations Management, 7eOperations Management, 9e Operations Management, 9e

1 – 8
What Is Operations What Is Operations Management?Management?
ProductionProduction is the creation of is the creation of goods and servicesgoods and services
Operations management (OM)Operations management (OM) is the set of activities that is the set of activities that
creates value in the form of creates value in the form of goods and services by goods and services by
transforming inputs into transforming inputs into outputsoutputs

1 – 9
Organizing to Produce Organizing to Produce Goods and ServicesGoods and Services
Essential functions:Essential functions: Marketing – generates demandMarketing – generates demand
Production/operations – creates Production/operations – creates the productthe product
Finance/accounting – tracks how Finance/accounting – tracks how well the organization is doing, pays well the organization is doing, pays bills, collects the moneybills, collects the money

1 – 10
Organizational ChartsOrganizational Charts
OperationsTeller SchedulingCheck ClearingCollectionTransaction processingFacilities design/layoutVault operationsMaintenanceSecurity
FinanceInvestmentsSecurityReal estate
Accounting
Auditing
MarketingLoans Commercial Industrial Financial Personal Mortgage
Trust Department
Commercial Bank
Figure 1.1(A)Figure 1.1(A)

1 – 11
Organizational ChartsOrganizational Charts
OperationsGround support equipmentMaintenanceGround Operations Facility maintenance Catering Flight Operations Crew scheduling Flying Communications DispatchingManagement science
Finance/ accountingAccounting Payables Receivables General LedgerFinance Cash control International exchange
Airline
Figure 1.1(B)Figure 1.1(B)
MarketingTraffic administration Reservations Schedules Tariffs (pricing)SalesAdvertising

1 – 12
MarketingSales promotionAdvertisingSalesMarket research
Organizational ChartsOrganizational Charts
OperationsFacilities Construction; maintenance
Production and inventory control Scheduling; materials control
Quality assurance and controlSupply chain managementManufacturing Tooling; fabrication; assembly
Design Product development and design Detailed product specifications
Industrial engineering Efficient use of machines, space, and personnel
Process analysis Development and installation of production tools and equipment
Finance/ accountingDisbursements/ credits Receivables Payables General ledgerFunds Management Money market International exchangeCapital requirements Stock issue Bond issue and recall
Manufacturing
Figure 1.1(C)Figure 1.1(C)
1 – 13
Why Study OM?Why Study OM?
OM is one of three major functions OM is one of three major functions (marketing, finance, and operations) (marketing, finance, and operations) of any organizationof any organization
We want (We want (and needand need) to know how ) to know how goods and services are producedgoods and services are produced
We want to understand what We want to understand what operations managers dooperations managers do
OM is such a costly part of an OM is such a costly part of an organizationorganization

1 – 14
Options for Increasing Options for Increasing ContributionContribution
SalesSales $100,000$100,000 $150,000$150,000 $100,000$100,000 $100,000$100,000
Cost of Goods Cost of Goods –– 80,000 80,000 –– 120,000 120,000 –– 80,000 80,000 –– 64,000 64,000
Gross MarginGross Margin 20,00020,000 30,00030,000 20,00020,000 36,00036,000
Finance CostsFinance Costs –– 6,000 6,000 –– 6,000 6,000 –– 3,000 3,000 –– 6,000 6,000
SubtotalSubtotal 14,00014,000 24,00024,000 17,00017,000 30,00030,000
Taxes at 25%Taxes at 25% –– 3,500 3,500 –– 6,000 6,000 –– 4,250 4,250 –– 7,500 7,500
ContributionContribution $ 10,500$ 10,500 $ 18,000$ 18,000 $ 12,750$ 12,750 $ 22,500$ 22,500
Finance/Finance/MarketingMarketing AccountingAccounting OMOM
OptionOption OptionOption OptionOption
IncreaseIncrease ReduceReduce ReduceReduceSalesSales FinanceFinance ProductionProduction
CurrentCurrent Revenue 50%Revenue 50% Costs 50%Costs 50% Costs 20%Costs 20%

1 – 15
What Operations What Operations Managers DoManagers Do
PlanningPlanning
OrganizingOrganizing
StaffingStaffing
LeadingLeading
ControllingControlling
Basic Management FunctionsBasic Management Functions
1 – 16
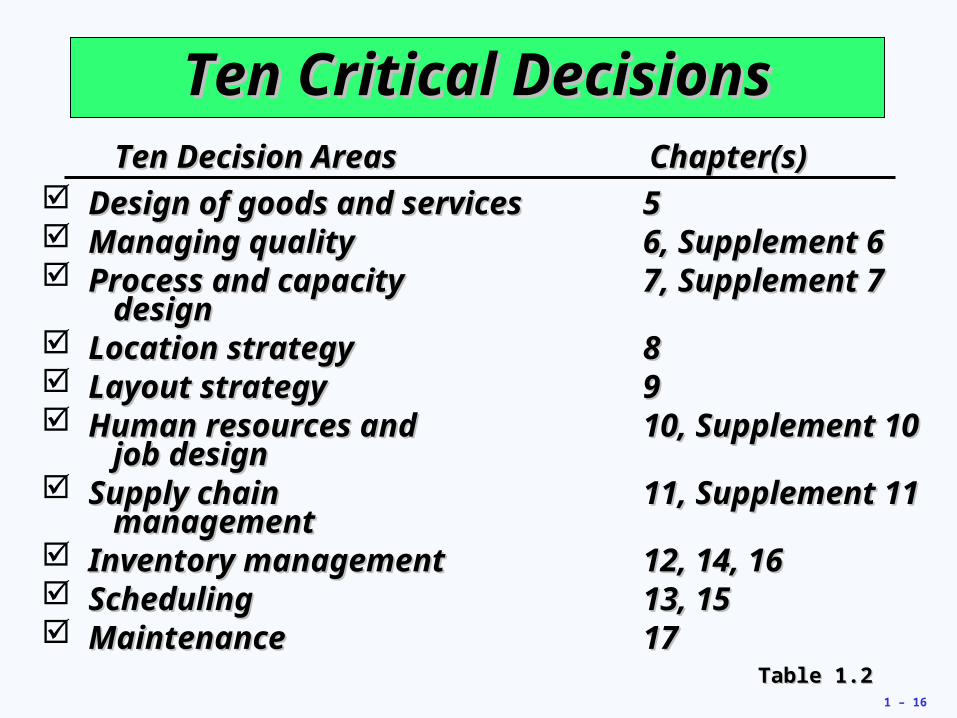
Ten Critical DecisionsTen Critical DecisionsTen Decision AreasTen Decision Areas Chapter(s)Chapter(s)
Design of goods and servicesDesign of goods and services 55 Managing qualityManaging quality 6, Supplement 66, Supplement 6 Process and capacity Process and capacity 7, Supplement 77, Supplement 7
design design Location strategyLocation strategy 88 Layout strategyLayout strategy 99 Human resources and Human resources and 10, Supplement 1010, Supplement 10
job design job design Supply chain Supply chain 11, Supplement 1111, Supplement 11
management management Inventory managementInventory management 12, 14, 1612, 14, 16 SchedulingScheduling 13, 1513, 15 MaintenanceMaintenance 1717
Table 1.2Table 1.2

1 – 17
The Critical DecisionsThe Critical Decisions
Design of goods and servicesDesign of goods and services What good or service should we What good or service should we
offer?offer? How should we design these products How should we design these products
and services? and services?
Managing qualityManaging quality How do we define quality?How do we define quality? Who is responsible for quality?Who is responsible for quality?
Table 1.2 (cont.)Table 1.2 (cont.)

1 – 18
The Critical DecisionsThe Critical Decisions
Process and capacity designProcess and capacity design What process and what capacity will What process and what capacity will
these products require?these products require?
What equipment and technology is What equipment and technology is necessary for these processes?necessary for these processes?
Location strategyLocation strategy Where should we put the facility?Where should we put the facility?
On what criteria should we base the On what criteria should we base the location decision?location decision?
Table 1.2 (cont.)Table 1.2 (cont.)

1 – 19
The Critical DecisionsThe Critical Decisions Layout strategyLayout strategy
How should we arrange the facility?How should we arrange the facility?
How large must the facility be to meet How large must the facility be to meet our plan?our plan?
Human resources and job designHuman resources and job design How do we provide a reasonable work How do we provide a reasonable work
environment?environment?
How much can we expect our How much can we expect our employees to produce?employees to produce?
Table 1.2 (cont.)Table 1.2 (cont.)

1 – 20
The Critical DecisionsThe Critical Decisions
Supply chain managementSupply chain management Should we make or buy this component?Should we make or buy this component?
Who are our suppliers and who can Who are our suppliers and who can integrate into our e-commerce program?integrate into our e-commerce program?
Inventory, material requirements Inventory, material requirements planning, and JITplanning, and JIT How much inventory of each item should How much inventory of each item should
we have?we have?
When do we re-order?When do we re-order?Table 1.2 (cont.)Table 1.2 (cont.)

1 – 21
The Critical DecisionsThe Critical Decisions
Intermediate and shortIntermediate and short––term term schedulingscheduling Are we better off keeping people on Are we better off keeping people on
the payroll during slowdowns?the payroll during slowdowns?
Which jobs do we perform next?Which jobs do we perform next?
MaintenanceMaintenance Who is responsible for maintenance?Who is responsible for maintenance?
When do we do maintenance?When do we do maintenance?
Table 1.2 (cont.)Table 1.2 (cont.)
1 – 35
Characteristics of GoodsCharacteristics of Goods
Tangible productTangible product
Consistent product Consistent product definitiondefinition
Production usually Production usually separate from separate from consumptionconsumption
Can be inventoriedCan be inventoried
Low customer Low customer interactioninteraction
1 – 36
Characteristics of ServiceCharacteristics of Service Intangible productIntangible product
Produced and Produced and consumed at same timeconsumed at same time
Often uniqueOften unique
High customer High customer interactioninteraction
Inconsistent product Inconsistent product definitiondefinition
Often knowledge-basedOften knowledge-based
Frequently dispersedFrequently dispersed

1 – 37
Industry and Services as Industry and Services as Percentage of GDPPercentage of GDP
ServicesServices ManufacturingManufacturing
Au
stra
liaA
ust
ralia
Can
ada
Can
ada
Ch
ina
Ch
ina
Cze
ch R
epC
zech
Rep
Fra
nce
Fra
nce
Ger
man
yG
erm
any
Ho
ng
Ko
ng
Ho
ng
Ko
ng
Jap
anJa
pan
Mex
ico
Mex
ico
Ru
ssia
n F
edR
uss
ian
Fed
So
uth
Afr
ica
So
uth
Afr
ica
Sp
ain
Sp
ain
UK
UK
US
US
90 90 −
80 80 −
70 70 −
60 60 −
50 50 −
40 40 −
30 30 −
20 20 −
10 10 −
00 −

1 – 38
Goods Versus ServicesGoods Versus Services
Table 1.3Table 1.3
Can be resoldCan be resold
Can be inventoriedCan be inventoried
Some aspects of quality Some aspects of quality measurablemeasurable
Selling is distinct from Selling is distinct from productionproduction
Product is transportableProduct is transportable
Site of facility important for costSite of facility important for cost
Often easy to automateOften easy to automate
Revenue generated primarily Revenue generated primarily from tangible productfrom tangible product
Attributes of GoodsAttributes of Goods(Tangible Product)(Tangible Product)
Attributes of ServicesAttributes of Services (Intangible Product) (Intangible Product)
Reselling unusualReselling unusual
Difficult to inventoryDifficult to inventory
Quality difficult to measureQuality difficult to measure
Selling is part of service Selling is part of service
Provider, not product, isProvider, not product, isoften transportableoften transportable
Site of facility important forSite of facility important forcustomer contactcustomer contact
Often difficult to automateOften difficult to automate
Revenue generated primarily Revenue generated primarily from the intangible servicefrom the intangible service

1 – 39
Goods and ServicesGoods and ServicesAutomobile
Computer
Installed carpeting
Fast-food meal
Restaurant meal/auto repair
Hospital care
Advertising agency/investment management
Consulting service/teaching
Counseling
Percent of Product that is a GoodPercent of Product that is a Good Percent of Product that is a ServicePercent of Product that is a Service
100%100% 7575 5050 2525 00 2525 5050 7575 100%100%|| || || || || || || || ||
Figure 1.4Figure 1.4

1 – 40
120120 –
100 100 –
80 80 –
60 60 –
40 40 –
20 20 –
0 0 –| | | | | | |
19501950 19701970 19901990 2010 (est)2010 (est)19601960 19801980 20002000
Em
plo
ymen
t (m
illi
on
s)E
mp
loym
ent
(mil
lio
ns)
Manufacturing and Service Manufacturing and Service EmploymentEmployment
Figure 1.5 (A)Figure 1.5 (A)
ManufacturingManufacturing
ServiceService

1 – 41
Manufacturing Employment Manufacturing Employment and Productionand Production
Figure 1.5 (B)Figure 1.5 (B)
40 40 –
30 30 –
20 20 –
10 10 –
0 0 – | | | | | | |19501950 19701970 19901990 2010 (est)2010 (est)
19601960 19801980 20002000
– 150150
– 125125
– 100100
– 7575
– 5050
– 2525
– 00
Em
plo
ymen
t (m
illi
on
s)E
mp
loym
ent
(mil
lio
ns)
In
dex
: 19
97 =
100
Ind
ex:
1997
= 1
00
Manufacturingemployment
(left scale)
Industrial Industrial productionproduction
(right scale)(right scale)
1 – 42
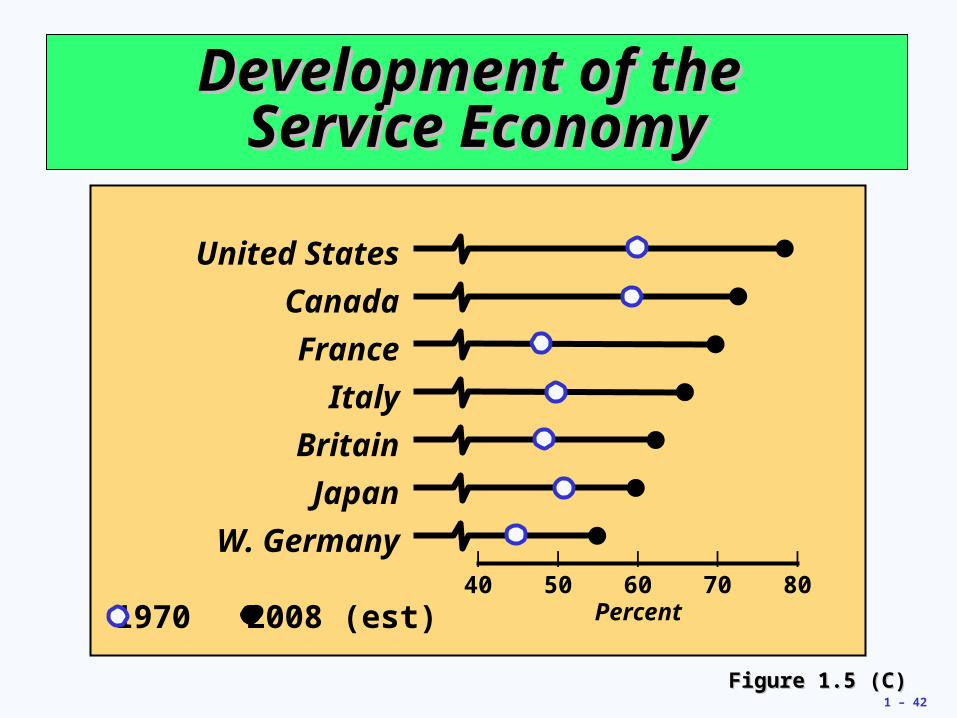
Development of the Development of the Service EconomyService Economy
Figure 1.5 (C)Figure 1.5 (C)
United States
Canada
France
Italy
Britain
Japan
W. Germany
1970 2008 (est)
| | | | |
40 50 60 70 80Percent

1 – 50
Productivity ChallengeProductivity Challenge
Productivity is the ratio of outputs (goods Productivity is the ratio of outputs (goods and services) divided by the inputs and services) divided by the inputs
(resources such as labor and capital)(resources such as labor and capital)
The objective is to improve productivity!The objective is to improve productivity!
Important Note!Production is a measure of output
only and not a measure of efficiency

1 – 51
FeedbackFeedback looploop
OutputsOutputs
Goods and
services
ProcessesProcesses
The U.S. economic system transforms inputs to outputs
at about an annual 2.5% increase in productivity per
year. The productivity increase is the result of a
mix of capital (38% of 2.5%), labor (10% of 2.5%), and
management (52% of 2.5%).
The Economic SystemThe Economic System
InputsInputs
Labor,capital,
management
Figure 1.7Figure 1.7

1 – 54
Measure of process improvementMeasure of process improvement
Represents output relative to inputRepresents output relative to input
Only through productivity increases Only through productivity increases can our standard of living improvecan our standard of living improve
ProductivityProductivity
Productivity =Productivity =Units producedUnits produced
Input usedInput used
1 – 55
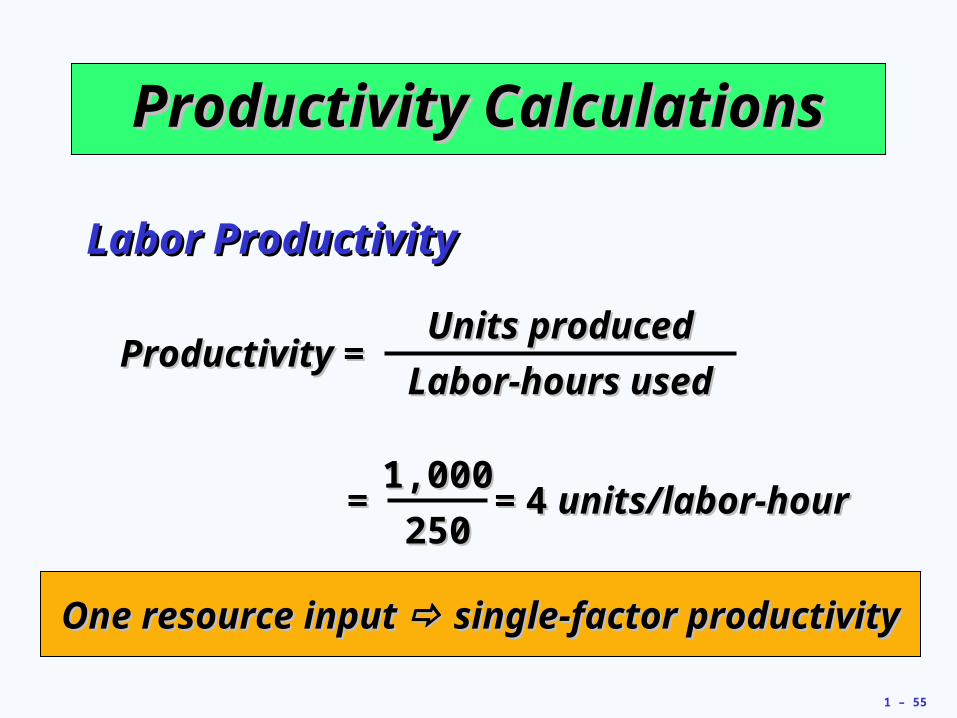
Productivity CalculationsProductivity Calculations
Productivity =Productivity =Units producedUnits produced
Labor-hours usedLabor-hours used
= = = = 44 units/labor-hour units/labor-hour1,0001,000
250250
Labor ProductivityLabor Productivity
One resource input One resource input single-factor productivity single-factor productivity

1 – 56
Multi-Factor Productivity Multi-Factor Productivity
OutputOutput
Labor + Material + Energy Labor + Material + Energy + Capital + Miscellaneous+ Capital + Miscellaneous
Productivity =Productivity =
Also known as total factor productivityAlso known as total factor productivity
Output and inputs are often expressed Output and inputs are often expressed in dollarsin dollars
Multiple resource inputs Multiple resource inputs multi-factor productivity multi-factor productivity

1 – 57
Collins Title ProductivityCollins Title Productivity
Staff of Staff of 44 works works 8 8 hrs/dayhrs/day 88 titles/day titles/dayPayroll cost = Payroll cost = $640$640/day/day Overhead = Overhead = $400$400/day/day
Old System:Old System:
==Old labor Old labor
productivityproductivity88 titles/day titles/day
3232 labor-hrs labor-hrs

1 – 58
Collins Title ProductivityCollins Title Productivity
Staff of Staff of 44 works works 88 hrs/day hrs/day 88 titles/day titles/dayPayroll cost = Payroll cost = $640$640/day/day Overhead = Overhead = $400$400/day/day
Old System:Old System:
88 titles/day titles/day
3232 labor-hrs labor-hrs==
Old labor Old labor productivityproductivity = = .25.25 titles/labor-hr titles/labor-hr

1 – 59
Collins Title ProductivityCollins Title Productivity
Staff of Staff of 44 works works 8 8 hrs/dayhrs/day 88 titles/day titles/dayPayroll cost = Payroll cost = $640$640/day/day Overhead = Overhead = $400$400/day/day
Old System:Old System:
1414 titles/day titles/day Overhead = Overhead = $800$800/day/day
New System:New System:
88 titles/day titles/day
3232 labor-hrs labor-hrs==
Old labor Old labor productivityproductivity
==New labor New labor
productivityproductivity
= .25 titles/labor-hr= .25 titles/labor-hr
1414 titles/day titles/day
3232 labor-hrs labor-hrs

1 – 60
Collins Title ProductivityCollins Title Productivity
Staff of Staff of 44 works works 88 hrs/day hrs/day 88 titles/day titles/dayPayroll cost = Payroll cost = $640$640/day/day Overhead = Overhead = $400$400/day/day
Old System:Old System:
1414 titles/day titles/day Overhead = Overhead = $800$800/day/day
New System:New System:
88 titles/day titles/day
3232 labor-hrs labor-hrs==
Old labor Old labor productivityproductivity = = .25.25 titles/labor-hr titles/labor-hr
14 14 titles/daytitles/day
3232 labor-hrs labor-hrs==
New labor New labor productivityproductivity = = .4375.4375 titles/labor-hr titles/labor-hr

1 – 61
Collins Title ProductivityCollins Title Productivity
Staff of Staff of 44 works works 88 hrs/day hrs/day 88 titles/day titles/dayPayroll cost = Payroll cost = $640$640/day/day Overhead = Overhead = $400$400/day/day
Old System:Old System:
1414 titles/day titles/day Overhead = Overhead = $800$800/day/day
New System:New System:
==Old multifactor Old multifactor
productivityproductivity88 titles/day titles/day
$640 + 400$640 + 400

1 – 62
Collins Title ProductivityCollins Title Productivity
Staff of Staff of 44 works works 88 hrs/day hrs/day 88 titles/day titles/dayPayroll cost = Payroll cost = $640$640/day/day Overhead = Overhead = $400$400/day/day
Old System:Old System:
1414 titles/day titles/day Overhead = Overhead = $800$800/day/day
New System:New System:
88 titles/day titles/day
$640 + 400$640 + 400==
Old multifactor Old multifactor productivityproductivity = = .0077.0077 titles/dollar titles/dollar

1 – 63
Collins Title ProductivityCollins Title Productivity
Staff of Staff of 44 works works 88 hrs/day hrs/day 88 titles/day titles/dayPayroll cost = Payroll cost = $640$640/day/day Overhead = Overhead = $400$400/day/day
Old System:Old System:
1414 titles/day titles/day Overhead = Overhead = $800$800/day/day
New System:New System:
88 titles/day titles/day
$640 + 400$640 + 400==
Old multifactor Old multifactor productivityproductivity
==New multifactor New multifactor
productivityproductivity
= = .0077.0077 titles/dollar titles/dollar
1414 titles/day titles/day
$640 + 800$640 + 800

1 – 64
Collins Title ProductivityCollins Title Productivity
Staff of Staff of 44 works works 88 hrs/day hrs/day 88 titles/day titles/dayPayroll cost = Payroll cost = $640$640/day/day Overhead = Overhead = $400$400/day/day
Old System:Old System:
1414 titles/day titles/day Overhead = Overhead = $800$800/day/day
New System:New System:
88 titles/day titles/day
$640 + 400$640 + 400
1414 titles/day titles/day
$640 + 800$640 + 800
==Old multifactor Old multifactor
productivityproductivity
==New multifactor New multifactor
productivityproductivity
= = .0077.0077 titles/dollar titles/dollar
= = .0097.0097 titles/dollar titles/dollar

1 – 65
Measurement ProblemsMeasurement Problems
QualityQuality may change while the may change while the quantity of inputs and outputs quantity of inputs and outputs remains constantremains constant
External elementsExternal elements may cause an may cause an increase or decrease in productivityincrease or decrease in productivity
Precise unitsPrecise units of measure may be of measure may be lackinglacking

1 – 66
Productivity VariablesProductivity Variables
LaborLabor - contributes - contributes about about 10%10% of the of the annual increaseannual increase
CapitalCapital - contributes - contributes about about 38%38% of the of the annual increaseannual increase
ManagementManagement - - contributes about contributes about 52%52% of the annual increaseof the annual increase
1 – 68
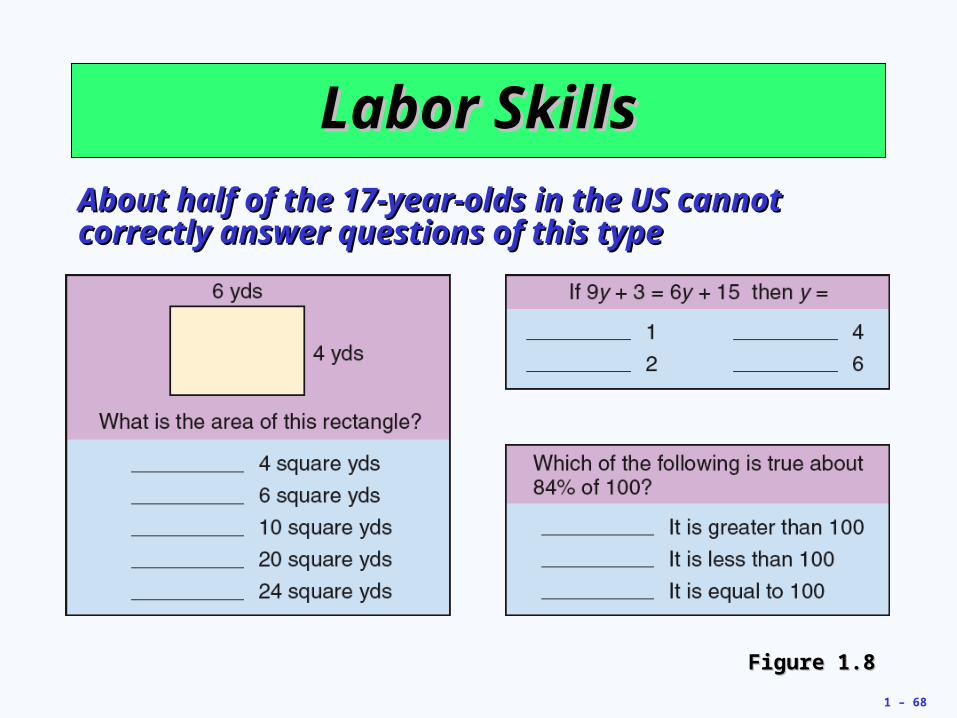
Labor SkillsLabor Skills
About half of the 17-year-olds in the US cannot About half of the 17-year-olds in the US cannot correctly answer questions of this typecorrectly answer questions of this type
Figure 1.8Figure 1.8

1 – 69
Investment and Productivity Investment and Productivity
1010
88
66
44
22
00
Per
cen
t in
crea
se in
pro
du
ctiv
ity
Per
cen
t in
crea
se in
pro
du
ctiv
ity
Percentage investmentPercentage investment
1010 1515 2020 2525 3030 3535
1 – 70
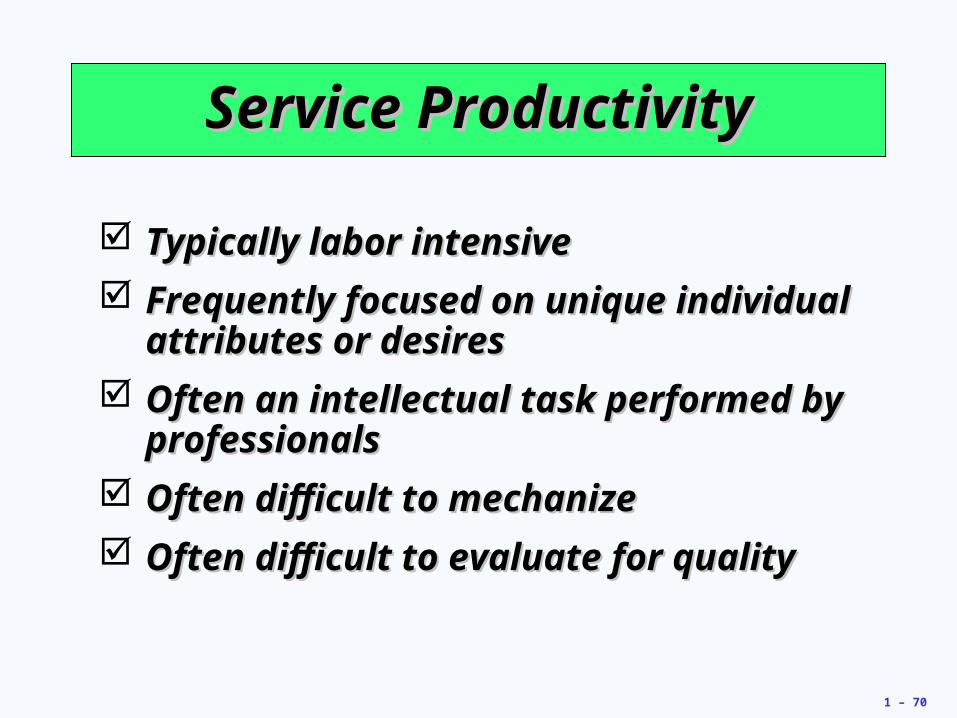
Service ProductivityService Productivity
Typically labor intensiveTypically labor intensive
Frequently focused on unique Frequently focused on unique individual attributes or desiresindividual attributes or desires
Often an intellectual task performed by Often an intellectual task performed by professionalsprofessionals
Often difficult to mechanizeOften difficult to mechanize
Often difficult to evaluate for qualityOften difficult to evaluate for quality

1 – 73
Ethics and Social ResponsibilityEthics and Social Responsibility
Challenges facing Challenges facing operations managers:operations managers:
Developing and producing safe, Developing and producing safe, quality productsquality products
Maintaining a clean environmentMaintaining a clean environment
Providing a safe workplaceProviding a safe workplace
Honoring community commitmentsHonoring community commitments