· pdf file978 1 4202 3848 8. content. contents. introduction vi curriculum mapping: syllabus...
TRANSCRIPT

macmillan
NSWYear 11biology
CAROLYN JEFFERY
UNCORRECTED PROOFS

978 1 4202 3848 8 Content
CONTENTS
Introduction viCurriculum mapping:Syllabus outline by module viii Australian curriculum Year 11 Units 1 and 2 learning outcomes ix NSW Year 11/12 course objectives/learning outcomes: Skills x NSW Year 11 course objectives/learning outcomes: Knowledge and understanding xList of essential verbs for assessment xiHow to distinguish between: reliability and validity xiiAcknowledgements xiii
Module 1 Cells as the basis of life1 Development of cell theory 4
Secondary source investigation 1.1.1: Tracing the impact of technology on cell theory 25
Secondary source investigation 1.1.2: Prokaryotic versus eukaryotic cells AND plant versus animal cells 29
2 Structure of a eukaryotic cell 33Secondary source investigation 1.2.1: Using electron micrographs to examine cell structures and organelles 43
Depth study 1.2.1: Investigating structures and organelles in plant and animal cells 44
3 Chemistry of living cells 52Practical investigation 1.3.1: Chemical nature of food 61
4 Transport across cell membranes 69Practical investigation 1.4.1: Osmosis in plant cells: using plasmolysis to estimate osmotic concentration of cells 80
Practical investigation 1.4.2: Modelling osmosis and diffusion of other molecules and ions 84
Practical investigation 1.4.3: Modelling diffusion into cells with different surface area to volume ratios 92
5 The role of enzymes 96Practical investigation 1.5.1: Experiments with proteases in fruit 100
Depth study 1.5.1: Effect of temperature, pH and substrate concentration on an enzyme 108
Module 1 Review questions 114Module 1 Mini exam questions and assessment tasks 114
Module 2 Organisation of living things6 Obtaining energy 122
Practical investigation 2.6.1: Light and chlorophyll are both needed for photosynthesis 130
Secondary source investigation 2.6.1: Ringtail possums, tiger quolls and honey possums: marsupials with different diets 139
Practical investigation 2.6.2: Reaction rate of liver enzyme 143
iii
202359_NSW_Biology_Y11_text_prelims_3pp.indd 3 18/07/17 9:29 pm
UNCORRECTED PROOFS

978 1 4202 3848 8
Secondary source investigation 2.6.2: Tracing paths of elements through animals and plants 145
Practical investigation 2.6.3: Demonstrating waste gases: carbon dioxide from mammals and oxygen from plants 147
7 Plant organs and transport systems 152Practical investigation 2.7.1: Demonstrating the function of xylem in celery stalks 160
Secondary source investigation 2.7.1: Using a virtual lab to demonstrate and explain factors affecting transpiration rate 162
Secondary source investigation 2.7.2: Investigating the two-way flow of phloem 165
Practical investigation 2.7.2: Constructing diagrams of xylem and phloem 166
8 Animal respiratory systems—exchanging gases 171Secondary source investigation 2.8.1: Gas exchange in mammals 177
Depth study 2.8.1: Investigating animal respiratory systems 178
9 Animal circulatory systems—transporting nutrients, gases and wastes 182Practical investigation 2.9.1: Investigating human blood cells 189
Secondary source investigation 2.9.1: Measuring blood gases: oxygen and carbon dioxide 193
Module 2 Review questions 197Module 2 Mini exam questions and assessment tasks 197
Module 3 Biological diversity 10 Past ecosystems 203
Secondary source investigation 3.10.1: Chemicals necessary for life: Urey and Miller’s experiment 215
11 Fossil record and evolution 220Secondary source investigation 3.11.1: Evolutionary timeline 229
Secondary source investigation 3.11.2: Plant and animal fossils 233
Secondary source investigation 3.11.3: Impact of the fossil record on ideas 235
12 The theory of evolution 238Secondary source investigation 3.12.1: Historical development of theories of evolution: social and political influences 246
Practical investigation 3.12.1: Camouflage as a tool for natural selection 257
Secondary source investigation 3.12.2: A modern-day example of natural selection 258
Secondary source investigation 3.12.3: Forelimb structure in vertebrates 265
Secondary source investigation 3.12.4: Biochemical evidence supports Darwin’s theory of evolution 267
Secondary source investigation 3.12.5: Development of new species 269
13 Australian biota and their evolution 274Secondary source investigation 3.13.1: Formation of Australia as an island continent from Gondwana 277
Secondary source investigation 3.13.2: Studying natural selection as a process for evolution 292
Depth study 3.13.1: Variation within species 302
Macmillan Biology NSW Year 11iv
202359_NSW_Biology_Y11_text_prelims_3pp.indd 4 18/07/17 9:29 pm
UNCORRECTED PROOFS

978 1 4202 3848 8 Contents
14 Australian fossil evidence 308Secondary source investigation 3.14.1: Fossil evidence for origins of Australian biota 316
Practical investigation 3.14.1: Comparing current life forms with fossils 319
15 Maintaining Australia’s biodiversity 322Secondary source investigation 3.15.1: Monitoring biodiversity: Backyard Birds Survey 332
Module 3 Review Questions 336Module 3 Mini exam questions and assessment tasks 336
Module 4 Ecosystem dynamics 16 Defining ecosystems 341
17 Abiotic factors in terrestrial and aquatic environments 351
18 Population abundance and distribution 367Practical investigation 4.18.1: Different sampling techniques used to estimate populations 377
Depth study 4.18.1: Field study: intertidal rocky shore ecosystem 381
19 Relationships in ecosystems 400
20 Energy flow 411Secondary source investigation 4.20.1: Discovering nutrient cycles: carbon, nitrogen and phosphorus 416
21 Future ecosystems: human impacts 422Secondary source investigation 4.21.1: Australian exotic species 430
Module 4 Review Questions 443Module 4 Mini exam questions and assessment tasks 443
22 Skills 45222.1 How to use a microscope 452
22.2 Preparing a wet mount 455
22.3 Drawing diagrams 456
22.4 Calculating and estimating the size of organelles and organisms 458
22.5 Presenting data: graphs 461
22.6 Preparing a bibliography 472
Review Questions 477Mini exam questions and assessment tasks 477
Glossary xxIndex xxPermissions acknowledgements xx
v
202359_NSW_Biology_Y11_text_prelims_3pp.indd 5 18/07/17 9:29 pm
UNCORRECTED PROOFS

978 1 4202 3848 8
Module 1 Cells as the basis of life
NSW SYLLABUS LEARNING OUTCOMESBIO11-1 develops and evaluates
questions and hypotheses for scientific investigation
BIO11-2 designs and evaluates investigations in order to obtain primary and secondary data and information
BIO11-3 conducts investigations to collect valid and reliable primary and secondary data and information
BIO11-4 selects and processes appropriate qualitative and quantitative data and information using a range of appropriate media
BIO11-5 analyses and evaluates primary and secondary data and information
BIO11-6 solves scientific problems using primary and secondary data, critical thinking skills and scientific processes
BIO11-7 communicates scientific understanding using suitable language and terminology for a specific audience or purpose
BIO11-8 describes single cells as the basis for all life by analysing and explaining cells’ ultrastructure and biochemical processes
Macmillan Biology NSW Year 112
202359_NSW_Biology_Y11_text_mo01_3pp.indd 2 20/07/17 8:41 pm
UNCORRECTED PROOFS

978 1 4202 3848 8
Introduction to cellsAccording to cell theory, the cell is the smallest unit of life, all organisms are made up of cells, and all living cells arise from pre-existing cells. In other words, the cell is the basic unit of life. Organisms may be composed of a single cell and are called unicellular organisms, or they may be made up of many cells and are said to be multicellular organisms.
Unicellular organisms are primitive life forms that exist as simple prokaryotes such as bacteria or as more complex eukaryotes such as Amoeba or Paramecium. If you observe these organisms under a microscope, you will see them whizzing about in droplets of water. While many multicellular organisms such as cyanobacteria are prokaryotes, that is, simple cells without membrane-bound organelles, most multicellular organisms such as humans (Homo sapiens) are made up of differentiated eukaryotic cells containing membrane-bound organelles.
Therefore, multicellular eukaryotic organisms are made up of different types of cells that have specific structures and specialised functions necessary for the survival of the organism; and yet, each of these cells has the same genetic makeup. The exceptions to this are your mature red blood cells and mature xylem cells in plants, which do not contain a nucleus with DNA.
It is universally recognised that size constraints dictated the types of organisms that developed in particular environments. At the cellular level, however, there is an optimal size for all cells and unicellular organisms, regardless of the species or its environment. This is because above the optimal size, the surface area to volume ratio of a cell will be relatively smaller, leading to a slower rate of diffusion of nutrients, gases and wastes. Therefore, most organisms have evolved to have millions of small cells, instead of hundreds of large cells, to maintain the efficiency of transport.
Scientists accept that eukaryotic cells originally formed from prokaryotic cells engulfed by another prokaryote. How then do prokaryotic and eukaryotic cells differ? How do cells function? How do cells obtain nutrients, water and gases, and dispose of waste? Why is water necessary for life? What is the role of enzymes? To answer these questions, we will delve into the structure and function of cells, and investigate how our ideas and knowledge have developed over the years owing to scientific research.
Figure 1.3 Multicellular organisms such as a) the eastern grey kangaroo and b) the dunnart greatly differ in size, and yet each began life, like humans, as a similar-sized fertilised egg (a zygote).
1 millimetre (mm) = 1000 micrometres (µm) or microns. 1 µm = 10-3 mm
Figure 1.1 A unicellular eukaryote: Amoeba proteus (~500 µm long)
Figure 1.2 A multicellular prokaryote: cyanobacteria Anabaena (5 µm wide)
a b
Module 1 Cells as the basis of life 3
202359_NSW_Biology_Y11_text_mo01_3pp.indd 3 20/07/17 8:41 pm
UNCORRECTED PROOFS

978 1 4202 3848 8
Module 1 Inquiry Questions
• What distinguishes one cell from another?
• How do cells coordinate activities with their internal and external environments?
Figure 1.4 A scanning electron micrograph of sperm (blue) about to penetrate and fertilise a human egg (pink)—only one sperm will be successful.
How do unicellular, colonial and multicellular organisms differ?Colonial organisms such as sponges consist of unicellular organisms joined together to form a colony. If they separate, colonial organisms can survive independently. In contrast, cells that form a multicellular organism cannot survive on their own.
bionote
Macmillan Biology NSW Year 114
202359_NSW_Biology_Y11_text_mo01_3pp.indd 4 20/07/17 8:42 pm
UNCORRECTED PROOFS

978 1 4202 3848 8
Chapter 5 The role of enzymesSTUDENTS:
1B4 conduct a practical investigation to model the action of enzymes in cells (ACSBL050)
1B5 investigate the effects of the environment on enzyme activity through the collection of primary or secondary data (ACSBL050, ACSBL051)
The importance of enzymesAll cells in multicellular organisms such as humans and eucalypts contain enzymes—large proteins that act as biological catalysts for the complex chemical reactions taking place in the cells. Enzymes regulate the rate of reactions so that the molecules needed for the body to function are created at the rate required to sustain life. Enzymes are necessary for growth and reproduction, maintenance and repair, and for appropriate responses to the environment.
All the life-sustaining chemical reactions in the body are collectively referred to by the term metabolism. The chemical reactions of metabolism are categorised as either catabolic or anabolic. Catabolic reactions use enzymes to break large molecules into their smaller subunits with the release of energy. For example, the polysaccharide starch is broken down into monosaccharide glucose and disaccharide sucrose subunits; the latter is further broken down into its constituent monosaccharide subunits—glucose and fructose.
Catabolic reactions include the breakdown of:• polysaccharides into monosaccharides
• lipids into fatty acids
• proteins into amino acids
• nucleic acids into nucleotides.
In anabolic reactions, simpler molecules are linked to form more complex molecules and energy is consumed in this process. Proteins, constructed from amino acids linked by peptide bonds, are an example of larger molecules created by anabolic reactions.
A catalyst speeds up chemical reactions, but is not changed during these reactions.
metabolism: from Greek; means change or transformation.
How many reactions rely on enzymes?Enzymes are known to act as catalysts for about 4000 reactions. Many more enzyme-catalysed reactions are likely to be discovered through biochemical research.
bionote
Figure 1.5.1 Anabolic reactions require enzymes and energy to build large molecules from smaller ones; catabolic reactions use enzymes to break large molecules into their smaller subunits with the release of energy.
Catabolic
Anabolic
Chapter 5 The role of enzymes 93
202359_NSW_Biology_Y11_text_ch05_3pp.indd 93 20/07/17 8:42 pm
UNCORRECTED PROOFS

978 1 4202 3848 8
Naming enzymesEach enzyme is generally named after the chemical reaction for which it acts as a catalyst, and the suffix –ase is usually added to its name to indicate that it is an enzyme. Metabolic enzymes (such as dehydrogenase and urease) and digestive enzymes are grouped into types based on the substrate that they catalyse. For example: • amylases break down carbohydrates into simpler sugars
• proteases break down proteins into polypeptides, peptides and amino acids
• lipases break down fats and oils into glycerol and fatty acids
• nucleotidases break down nucleic acids into nucleotides or nucleotides into base, phosphate and sugar.
For example, the breakdown of the milk sugar lactose (substrate) is carried out by the enzyme lactase, an amylase. Table 1.5.1 shows some common enzymes that act as catalysts in catabolic reactions.
Table 1.5.1 Some common enzymes that catalyse catabolic reactions
Enzyme Type of enzymeSubstrate for catabolic reaction (broken down by enzyme)
Products of catabolic reaction
Alpha-amylase Amylase Starch (in plants, seeds) Sugars
Lactase Amylase Lactose (milk sugar) Sugars
Cellulase Cellulase Cellulose (in plant cell walls) Sugars
Rennin Protease Caseinogen (protein in milk) Insoluble casein
Casease Protease Casein (protein in milk) Peptides and amino acids
Peptidase Protease Protein (in gelatine, meat, grains and vegetables) Amino acids
Trypsin Protease Protein (in legumes, other plants and in milk) Amino acids
Pancreatic lipase Lipase Animal and vegetable fats and oils Fatty acids and glycerol
Esterase Esterase Esters (fats and oils) Fatty acids and glycerol
Catalase Catalase Hydrogen peroxide Water and oxygen
Alcohol dehydrogenase Dehydrogenase Alcohol (ethanol) Acetaldehyde
Urease Urease Urea (nitrogenous by-product of metabolism in urine) Ammonia and carbonic acid
Enzyme structureEnzymes are proteins that contain the elements carbon (C), oxygen (O), hydrogen (H) and nitrogen (N) in different amounts. They consist of chains of amino acids joined by peptide bonds to form polypeptides that are usually folded into three-dimensional conformations. Each enzyme is formed from a specific sequence of amino acids that gives rise to its unique shape. Therefore, each type of enzyme will only catalyse one kind of reaction.
Each enzyme has one or more active sites; each active site is usually made up of three or four amino acids. Specific substrates will temporarily bind to the active sites of specific enzymes to form an enzyme–substrate complex. The substrates combine to form new products that are then
Macmillan Biology NSW Year 1194
202359_NSW_Biology_Y11_text_ch05_3pp.indd 94 20/07/17 8:42 pm
UNCORRECTED PROOFS

978 1 4202 3848 8
released from the active sites. The enzyme remains unchanged at the end of the reaction; that is, it retains its original shape, and can catalyse more reactions.
(a) Pool of amino acids
(b) Dipeptides
(c) Polypeptide chain of amino acids
(d) Active site
Peptide bond
Figure 1.5.2 Formation of an enzyme (a protein): a) from a pool of amino acids, b) a peptide bond will bind two amino acids together to form a dipeptide; c) when many amino acids are joined together by peptide bonds, a polypeptide is formed. d) These polypeptides fold into proteins, including enzymes, with specific shapes. The active sites within enzymes combine with the substrate.
Enzyme + substrate Enzyme + productsEnzyme – substratecomplex
Catabolic reaction
Figure 1.5.3 A catabolic reaction where a) the enzyme–substrate complex forms, b) new products are released
ba
Chapter 5 The role of enzymes 95
202359_NSW_Biology_Y11_text_ch05_3pp.indd 95 20/07/17 8:42 pm
UNCORRECTED PROOFS

978 1 4202 3848 8
NSW Syllabus Outcomes
BIO11-1 develops and evaluates questions and hypotheses for scientific investigation
BIO11-2 designs and evaluates investigations in order to obtain primary and secondary data and information
BIO11-3 conducts investigations to collect valid and reliable primary and secondary data and information
BIO11-5 analyses and evaluates primary and secondary data and information
BIO11-6 solves scientific problems using primary and secondary data, critical thinking skills and scientific processes
BIO11-7 communicates scientific understanding using suitable language and terminology for a specific audience or purpose
BIO11-8 describes single cells as the basis for all life by analysing and explaining cells’ ultrastructure and biochemical processes
Practical investigation 1.5.1
Experiments with proteases in fruitStudents:
1B4 conduct a practical investigation to model the action of enzymes in cells (ACSBL050)
1B5 investigate the effects of the environment on enzyme activity through the collection of primary or secondary data (ACSBL050, ACSBL051)
Figure 1.5.4 Two beakers of jelly containing gelatin, a protein product made from collagen. Because fresh pineapple containing the protease enzyme bromelain was added to the one on the right, it did not set. In contrast, the jelly on the left is set because canned pineapple was added—heat during the canning process would have denatured the bromelain protease and made it inactive.
IntroductionPlant and animal cells have similar enzymes such as proteases that catalyse chemical reactions to break down protein into amino acids. In animals, proteases digest protein-rich food into its smaller breakdown products, which can be absorbed by the body, while in fruit, proteases function as an anti-microbial reagent. For example, the enzyme bromelain is produced by pineapples, while a similar protease called papain is produced by papaya (paw paw). Both these enzymes are also used as meat tenderisers. Excessive heat, however, denatures enzymes, making them inactive. Therefore, canned pineapple will be used as a control (everything except the test substance) in
the experiment Part B—Protease bromelain from pineapple because the heat of pasteurisation in the canning process will have denatured enzymes so that they no longer function.
Macmillan Biology NSW Year 1196
202359_NSW_Biology_Y11_text_ch05_3pp.indd 96 20/07/17 8:42 pm
UNCORRECTED PROOFS

978 1 4202 3848 8
Therefore, this investigation will illustrate the enzymatic reaction of the proteases bromelain and papain. Note that each test will be done more than once (replicated) to account for human errors and any other variations, and averaged to account for these variations. Results for each replicate of the same test should be similar. If results are very different, we can infer that something other than the substance being tested is influencing the results.
A written report of your laboratory investigations is required. This includes completion of two tables (Table 1.5.2 Effect of the protease papain on gelatin and Table 1.5.3 Effect of the protease bromelain on gelatin), answering the discussion questions and a bibliography.
Note: Remember that your experimental work should reflect reliability and validity. For the experiment to be reliable, you must use more than one replicate (n = 2 or more) to ensure results are relatively consistent. For the experiment to be valid, it must test the stated hypothesis and include a control to compare with the experimental treatment.
Aim• To demonstrate the effect of proteases in fruit on
the setting of gelatin
Hypothesis • If the proteases papain (from paw paw) and
bromelain (from fresh pineapple) are added to gelatin, they will digest its collagen protein and prevent it from solidifying.
Materials and methods• Use 10 mL, 20 mL and 100 mL measuring
cylinders to measure small, medium and large volumes, respectively. Rinse thoroughly between treatments.
• Label test tubes and beakers with a marker pen.
• For the reaction of the proteases papain and bromelain, record subjective rate of reaction: 0 = no reaction (solid gel); 1 = some reaction (viscous); 2 = strong reaction (watery).
• Work in groups and always wear safety glasses.• Complete the exercises in A Protease papain
from paw paw and B Protease bromelain from pineapple.
• Record results in tables 1.5.2 and 1.5.3.
Part A—Protease papain from paw paw• Safety glasses• Hot plate• Gelatin• Five test tubes and holders• 10 mL measuring cylinders• Stirring rods• 500 mL beaker of iced water• 150 mL beaker• Teaspoon• Distilled water• Meat tenderiser with papain• 100 mL measuring cylinders• Glass-marking pen• Test tube rack
Treatment + protease
Control– protease
2ml papain solution+
3ml gelatin solution
n = 2
5 ml 5 ml 5 ml 5 ml
2ml water+
3ml gelatin solution
Figure 1.5.5 Treatment (+ papain) and control (- papain) replicates (n = 2)
Chapter 5 The role of enzymes 97
202359_NSW_Biology_Y11_text_ch05_3pp.indd 97 20/07/17 8:42 pm
UNCORRECTED PROOFS

978 1 4202 3848 8
±Papain and gelatin solutionNote: the control is everything except the test substance.
1 To prepare a gelatin solution, add 1 teaspoon of gelatin to 100 mL distilled water in a beaker. Heat gently (do not boil) and mix with a stirring rod until dissolved. Cool to room temperature.
2 Add a quarter of a teaspoon of meat tenderiser (with papain) to 4 mL distilled water in a test tube. Pour 2 mL of this solution into each of two other test tubes (treatments).
3 Pour 2 mL of distilled water into each of two remaining test tubes (controls).
4 Add 3 mL of gelatin solution to each of last four test tubes.
5 Gently swirl the contents of each test tube to mix them.
6 Place these four test tubes in a beaker of iced water for 10 minutes.
7 Remove all test tubes and record results in table 1.5.2.
Part B—Protease bromelain from pineapple• Safety glasses• Hot plate• Gelatin• Four 50 mL beakers• Fresh pineapple chunks• 20 mL measuring cylinders• Stirring rods• 150 mL beaker• Teaspoon• Distilled water• Glass-marking pen
• Canned pineapple chunks• 100 mL measuring cylinders• 500 mL beaker of iced water
± Bromelain and gelatin solutionNote: the control is everything except the test substance.
1 To prepare a gelatin solution, add 1 teaspoon of gelatin to 100 mL distilled water in a beaker. Heat gently (do not boil) and mix with a stirring rod until dissolved. Cool to room temperature.
2 Pour 20 mL of gelatine solution into each of four beakers.
3 Add four chunks of similar-sized fresh pineapple to two of these beakers.
4 Add four chunks of similar-sized canned pineapple to the remaining two beakers.
5 Place these four beakers in a larger beaker of iced water for 10 minutes.
6 Remove all beakers from iced water and record results in table 1.5.3.
Results
Part A—Protease papain from paw pawTable 1.5.2 Effect of the protease papain on gelatin
The control is everything except the test substance.
Test tube 1 Test tube 2 Mean (n = 2)
+ Papain
No papain
Subjective rate of reaction: 0 = no reaction (solid gel); 1 = some reaction (viscous); 2 = strong protease reaction (watery)
Treatment + protease
Control– protease
Fresh pineapple+
20 ml gelatin solution
Canned pineapple+
20 ml gelatin solutionn = 2
Figure 1.5.6 Treatment (fresh pineapple + bromelain) and control (canned pineapple – bromelain) replicates (n = 2)
Macmillan Biology NSW Year 1198
202359_NSW_Biology_Y11_text_ch05_3pp.indd 98 20/07/17 8:42 pm
UNCORRECTED PROOFS

978 1 4202 3848 8
Factors influencing enzyme activity: temperature, pH, substrate concentration
The activity of an enzyme depends on a variety of factors in its environment. Enzymes usually function within a specific temperature and pH range and respond to the amount of substrate available. Outside the range of temperatures and pH specific to a certain enzyme, the enzyme shape may alter as bonds get broken. This can make the active sites of the enzyme inaccessible, and hinders substrate binding. In other words, the enzyme is denatured and can no longer function. This change is irreversible—the enzyme cannot return to its original shape and remains inactive.
If the rates of reaction slow down too much, the organism dies. That is why cold-blooded organisms (such as the cane toads introduced in north Queensland) can be killed humanely by placing them in freezers. Similarly, many adult insects die in the harsh cold of winter, but their eggs become dormant and survive to hatch when conditions are warmer and enzymes become more active.
Because increased energy causes increased rate of collision of substrate molecules, enzyme activity is higher at elevated temperatures than at lower temperatures. This explains why cold-blooded animals such as snakes and lizards are more active during summer. There is, however, an optimum temperature at which enzyme activity reaches its peak rate. Although different parts of the human body may be at different temperatures, the average constant body temperature in humans is 37°C, and the optimum temperatures for human enzymes range from 35–40°C. If the human body temperature cannot be maintained when external temperatures are very high or very low, enzyme activity will cease due to enzyme denaturation and cell death will result.
pH is another factor that affects enzyme activity. pH is a measure of acidity based on the concentration of hydrogen (H+) ions. The activity of an enzyme is
Part B—Protease bromelain from pineappleTable 1.5.3 Effect of the protease bromelain on gelatin** The control is everything except the test substance.
Beaker 1 Beaker 2 Mean (n = 2)
+ Bromelain (fresh pineapple)
No bromelain (canned pineapple)
Subjective rate of reaction: 0 = no reaction (solid gel); 1 = some reaction (viscous); 2 = strong protease reaction (watery)
Discussion questions1 Identify two safety measures used when doing
protease experiments.2 Define ‘control’.3 Identify the experimental treatments.
4 Clarify whether the controls in each experiment were adequate.
5 Explain why it was necessary to mix the contents of each test tube when testing for the effect of papain.
6 Explain why there were always two samples of each treatment.
7 Describe and deduce the results of each experiment.
8 Discuss whether these experiments are valid.9 Explain the role of protease enzymes in these
experiments.10 If the fresh pineapple was heated before it
was added to the gelatin solution, compare the expected results with those when canned pineapple was used. Explain the results and identify a control for this experiment.
Snake venom enzymesAustralia has the world’s most venomous snake—the inland taipan Oxyuranus microlepidotus (also known as small-scaled snake and fierce snake). Snake venom is modified saliva that may contain more than 20 different toxic enzymes. Most snake venoms contain 6 to 12 of these enzymes, including neurotoxins (such as cholinesterase) and proteases to immobilise and digest prey. Enzymes in snake venom can coagulate blood, affect blood pressure, attack the nervous system and relax muscles.
bionote
Figure 1.5.7 The eastern brown snake (Pseudonaja textilis) is the second most venomous land snake.
Chapter 5 The role of enzymes 99
202359_NSW_Biology_Y11_text_ch05_3pp.indd 99 20/07/17 8:42 pm
UNCORRECTED PROOFS

978 1 4202 3848 8
Active siteSubstrate Substrate
Extreme temp/pH
Denaturing
Extreme temp/pH
Denaturing
Substrate fitsperfectlyinto active site
Substrate nolonger fitsinto active site
Figure 1.5.8 Denaturation occurs when an enzyme is subjected to extreme temperatures and pH outside its normal range of activity. The enzyme changes shape so that appropriate substrates can no longer access active sites in the enzyme. This change is permanent and the enzyme is unable to function.
highest at optimum pH. Different parts of the human body have different pH relevant to the enzyme activity in the specific organ (see figure 1.5.10).
Enzyme activity is also a function of substrate concentration—the more substrate available, the faster the reaction. The rate of reaction increases until all the active sites on an enzyme are occupied by the substrate. At this saturation point, the rate of reaction is the maximum, and further increase in substrate concentration will not increase the rate of reaction any further.
Figure 1.5.9 Hydrogen ion concentration of a solution is measured on a pH scale from 1–14, with 7 (pure water) being neutral.
pH = 0
pH = 1
pH = 2
pH = 3
pH = 4
pH = 5
pH = 6
pH = 7
pH = 8
pH = 9
pH = 10
pH = 11
pH = 12
pH = 13
pH = 14
Battery acid
Hydrochloric acid
Vinegar
Orange juice
Acid rain
Black coffee
Saliva
Pure water
Sea water
Baking soda
Milk of magnesia
Ammonia solution
Soapy water
Oven cleaner
Liquid drain cleaner
Increasingacidity
Increasingalkalinity
Neutral
Figure 1.5.10 Pepsin has an optimum pH of 2 (acidic), while trypsin has an optimum pH of 8 (alkaline).
Rate
of r
eact
ion
Pepsin
Trypsin
0 2 4 6 8 10pH
Macmillan Biology NSW Year 11100
202359_NSW_Biology_Y11_text_ch05_3pp.indd 100 20/07/17 8:42 pm
UNCORRECTED PROOFS

978 1 4202 3848 8
Activation energyAs we have seen so far, enzymes speed up chemical reactions and influence metabolic reactions—catabolic reactions (breakdown of large molecules into smaller subunits) and anabolic reactions (formation of complex molecules from smaller ones). Collisions between molecules provide the energy necessary to break molecular bonds for these reactions to occur. How much of this activation energy is required is also determined by the presence of enzymes. Enzymes lower the activation energy necessary for a particular chemical reaction to proceed and thus, speed up the rate of reactions.
Only minute amounts of enzyme are required to act as a catalyst for these reactions. Enzymes remain unchanged and so they can catalyse more reactions.
Ener
gy
Time
No enzyme:uncatalysedreaction
With enzyme:catalysed reaction
Activationenergy
Activationenergy
Figure 1.5.11 Enzymes lower the activation energy of a chemical reaction.
Anabolic reactionSubstrate
Active site
Enzyme Enzyme–substratecomplex
Product
Enzyme (remains unchanged)
Figure 1.5.12 An anabolic reaction—substrate binds to an enzyme’s active site forming an enzyme–substrate complex, followed by the release of products (e.g. amino acids join to form polypeptides).
Alternative models of enzyme actionTwo models have been proposed to explain enzyme action: the lock and key model and induced fit model. The lock and key model (see figure 1.5.13), proposed in 1894 by German scientist Emil Fischer (1852–1919), is based on the complementary shape of a substrate to the active site of an enzyme. That is, the substrate acts as a key that fits exactly into the active site (the keyhole) of its specific enzyme (the lock). Only a matching key will open a lock. Similarly, only a specific substrate will fit into its matching active site on a specific enzyme, enabling the enzyme to function as a catalyst in the reaction.
However, the lock and key model cannot explain all reactions catalysed by enzymes. In 1958, an American scientist Daniel Koshland (1920–2007) proposed the induced fit model (see figure 1.5.14). Rather than necessitating an exact fit between the shape of the substrate and the active site of the enzyme, this model is based on the premise that the active site is flexible so that the enzyme temporarily changes shape to mould around the substrate,
Chapter 5 The role of enzymes 101
202359_NSW_Biology_Y11_text_ch05_3pp.indd 101 20/07/17 8:42 pm
UNCORRECTED PROOFS

978 1 4202 3848 8
similar to a hand-in-glove fit. While other substrates may fit into the active site, only the substrate specific to the enzyme will be able to change the enzyme’s shape such that it can catalyse the reaction.
Coenzymes, cofactors and enzyme inhibitorsEnzymes sometimes require the presence of other molecules to catalyse reactions. These may bind to the active sites of the enzyme to aid catalysis, but are not classified as substrates. For example, coenzymes (organic molecules such as vitamins) and cofactors (inorganic metal ions such as copper, Cu2+; zinc, Zn2+; iron, Fe2+, Fe3+) are required for some enzymes to function properly.
Enzyme inhibitors, on the other hand, decrease or inhibit enzyme function by attaching to its active sites or altering its shape. Many drugs, such as antibiotics, are enzyme inhibitors; they target the enzymes within pathogens, resulting in the death of the pathogen. For example, penicillin blocks the active site of enzymes in bacteria that are used to form cell walls. Some pesticides, such as dichlorodiphenyltrichloroethane (DDT) or 1080 (sodium monofluoroacetate) used in fox baiting, and pindone used to control rabbit populations, are also enzyme inhibitors.
Figure 1.5.13 Lock and key model – A specific substrate (the key) will fit exactly into the active site of a specific enzyme (the lock), enabling the reaction to be catalysed.
Figure 1.5.14 Induced fit model – the active site of an enzyme is flexible so that the enzyme moulds around a specific substrate to determine the final shape necessary for a reaction to take place.
Lock and key model
Key = substrateenzyme
enzyme
substrate
substrate
Lock = enzyme Correct fit, will react
Incorrect substrate No reaction (the key does not fit)
Induced fit model
Substrate
Active siteEnzyme
Enzyme + substrateentering active site
Enzyme--substratecomplex
Enzyme--productscomplex
Enzyme + productsleaving active site
Enzyme alters shape slightlyas substrate enters
active site, making the fit more exact
Products
Macmillan Biology NSW Year 11102
202359_NSW_Biology_Y11_text_ch05_3pp.indd 102 20/07/17 8:42 pm
UNCORRECTED PROOFS

978 1 4202 3848 8
Enzyme dysfunction: porphyriaPorphyria is a group of genetic or acquired diseases caused by enzyme dysfunction and characterised by neurological symptoms and/or skin lesions upon exposure to sunlight. The name ‘porphyria’ is derived from the Greek word ‘porphyrus’ meaning purple pigment. This is probably because the patient’s urine and faeces appear purple after exposure to sunlight.
bionote
Diseases caused by enzyme dysfunctionGenetic mutations leading to enzyme dysfunction can cause many diseases such as Tay Sachs disease and phenylketonuria (PKU). These diseases are termed ‘inborn errors of metabolism’, ‘congenital metabolic diseases’ or ‘inherited metabolic diseases’. Disease can also result from deficiencies in coenzymes (such as deficiency in vitamin B12 causing anaemia and nerve degeneration) and cofactors (as in porphyria).
PKU is a disease in which the genetic code on chromosome 12 for the enzyme phenylalanine hydroxylase has a mutation of a single amino acid. This enzyme, found in the liver, is required to break down the amino acid phenylalanine into the amino acid tyrosine. Therefore, those with PKU cannot break down phenylalanine and, as it is found in many foods, it accumulates in the body and can cause severe damage to brain cells and affect brain development. A strict diet that eliminates phenylalanine will let affected individuals function normally throughout life. Newborn babies in Australia are now screened for PKU using the Guthrie test—a routine blood test in which a blood sample is collected by a simple heel prick.
1080 and pindone: enzyme inhibitors used in pest control1080 and pindone are used in Australia to manage the populations of introduced species of fox and rabbit. Target species such as rabbits usually
show no symptoms of poisoning by 1080 until sudden death. Because 1080 is very toxic to dogs and cats, pindone is often used in urban areas to control rabbits. Commercially produced pindone is coloured green and is usually spread on small pieces of carrot; the green dye acts
as a deterrent to birds. Pindone is an enzyme inhibitor that prevents blood from clotting. Symptoms of poisoning include vomiting, blood in the mouth and faeces, excessive salivation and general weakness. The antidote to pindone poisoning is an injection of vitamin K.
bionote
ba
Figure 1.5.15 Enzyme inhibitors a) 1080 and b) pindone are used to control fox and rabbit populations, respectively.
Chapter 5 The role of enzymes 103
202359_NSW_Biology_Y11_text_ch05_3pp.indd 103 20/07/17 8:42 pm
UNCORRECTED PROOFS

978 1 4202 3848 8
Effect of temperature, pH and substrate concentration on an enzymeStudents:
1B4 conduct a practical investigation to model the action of enzymes in cells (ACSBL050)
1B5 investigate the effects of the environment on enzyme activity through the collection of primary or secondary data (ACSBL050, ACSBL051)
Depth study 1.5.1
IntroductionEnzymes act as catalysts in chemical reactions. Each enzyme has an optimum temperature, pH and substrate concentration where it functions best. That is, there is decreased enzyme activity at exposure to non-optimal temperatures and pH and/or if all the active sites of the enzyme are occupied by substrate. Outside its range of activity, an enzyme may denature as bonds are broken due to extreme temperatures and pH conditions.
Rennin is an enzyme secreted by the stomach cells of young mammals. In the presence of hydrochloric acid (HCl) produced by the stomach, rennin causes the soluble protein caseinogen in milk to set or clot by forming insoluble casein (as a curd). Because rennin is readily available in the form of junket tablets from supermarkets, and because its activity is affected by changes in temperature, pH and substrate concentration, it can be used to test the effects of these factors on its activity. The time taken for milk to set or clot can be used to indicate the rate of activity of rennin. Setting should take no more than 20 minutes.
Part A—Effect of temperature on the enzyme renninAn increase in temperature will inject more energy into a system so that molecules are more likely to collide with one another. This increased temperature is therefore associated with increased enzyme activity. At extremes of temperature, however, enzymes can change shape and denature such that they can no longer function. Therefore, within a certain range, there is an increase in rate of chemical reaction with increase in temperature up to the optimum temperature for a specific enzyme. Any increase beyond this temperature will cause a decrease in enzyme activity until denaturation occurs, where there will be no reaction at all.
Rat
e of
rea
ctio
n
30 40 50
Temperature (˚C)
Figure 1.5.16 Enzyme activity increases up to an optimum temperature followed by decreased activity above this temperature as the enzyme denatures.
NSW Syllabus Outcomes
BIO11-1 develops and evaluates questions and hypotheses for scientific investigation
BIO11-2 designs and evaluates investigations in order to obtain primary and secondary data and information
BIO11-3 conducts investigations to collect valid and reliable primary and secondary data and information
BIO11-4 selects and processes appropriate qualitative and quantitative data and information using a range of appropriate media
BIO11-5 analyses and evaluates primary and secondary data and information
BIO11-6 solves scientific problems using primary and secondary data, critical thinking skills and scientific processes
BIO11-7 communicates scientific understanding using suitable language and terminology for a specific audience or purpose
BIO11-8 describes single cells as the basis for all life by analysing and explaining cells’ ultrastructure and biochemical processes
Macmillan Biology NSW Year 11104
202359_NSW_Biology_Y11_text_ch05_3pp.indd 104 20/07/17 8:42 pm
UNCORRECTED PROOFS

978 1 4202 3848 8
Aim • To determine the effect of temperature on the activity
of the enzyme rennin
Hypothesis• Construct an appropriate hypothesis for this
experiment.
Materials• Safety glasses• 200 mL of milk• Test tube rack• 10 mL measuring cylinders• Water baths• Thermometers• Hot water• Eyedropper• Pre-mixed solution of rennin (0.07 g/mL)*• 16 test tubes• Stopwatch• 5 mL graduated pipettes• Crushed ice• Marking pen• Distilled water• Test tube holders*Note: A rennin solution will be made up in the laboratory using junket tablets from a supermarket. To ensure clotting occurs in this experiment, it is suggested
that 10 drops of rennin solution be used for every 10 mL of milk. Different brands of junket tablets, however, can vary in the amount of rennin they contain. Therefore, the suggested volume of rennin should be tested for its ability to set milk before conducting the experiment. Necessary adjustments in volumes of enzyme (rennin) and substrate (milk) may need to be made.
Method1 Use a marking pen to label each of 16 test tubes
(e.g. 0°C Treatment 1, 80°C Control 2 – refer to table 1.5.4).
2 Add 10 mL of milk to each test tube.3 Add 10 drops of rennin to the 8 test tubes labelled as
Treatments.4 Add 10 drops of distilled water to the remaining 8 test
tubes labelled as Controls.5 Place test tubes in appropriate water baths set at
0°C, 20°C, 37°C and 80°C and begin timing the experiment.
6 To check whether the milk has clotted, gently tilt each test tube every 30 seconds. If clotting has occurred, there should be no movement.
7 Record the times taken for the milk to set in table 1.5.4.
8 Construct a graph showing how different temperatures affect the time taken for milk to clot.
Note that the control test tube contains everything except the test substance.
n = 2
Temperature of water bath(˚C)
Enzymerennin
+ rennin – rennin
Treatment Control
0 20 37 80
+–
Figure 1.5.17 Experimental design used to test the effect of temperature on the enzyme rennin
Chapter 5 The role of enzymes 105
202359_NSW_Biology_Y11_text_ch05_3pp.indd 105 20/07/17 8:42 pm
UNCORRECTED PROOFS
978 1 4202 3848 8
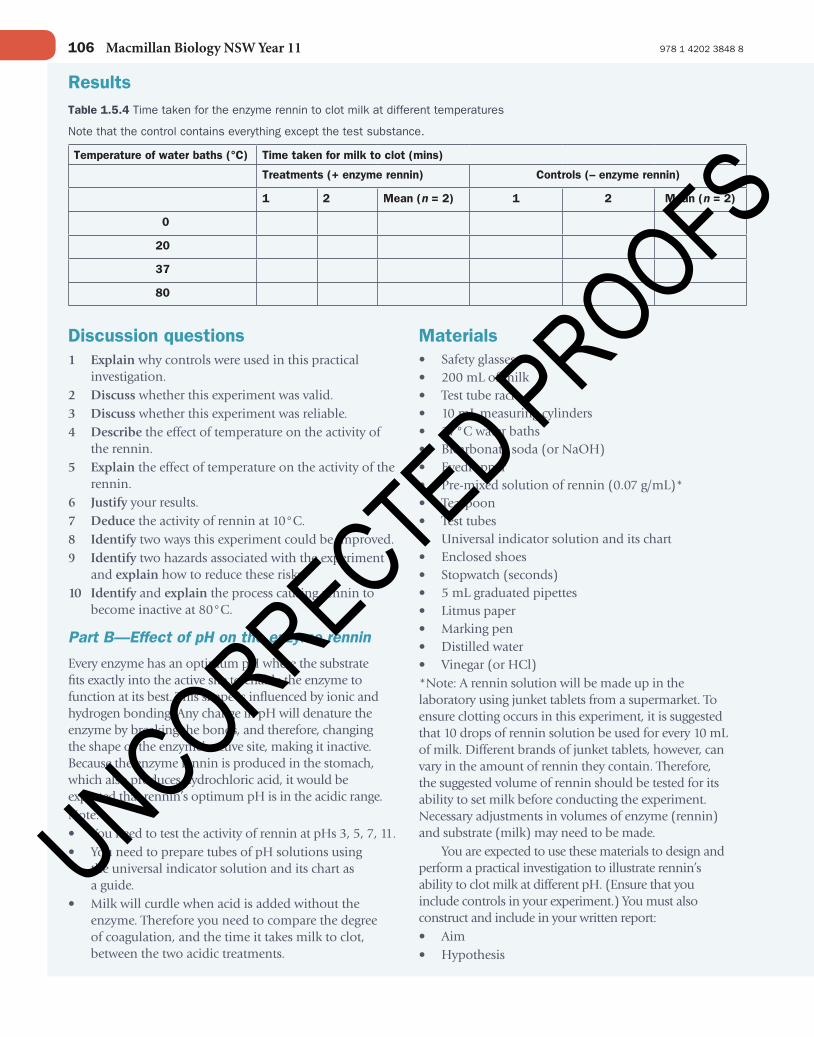
Discussion questions1 Explain why controls were used in this practical
investigation.2 Discuss whether this experiment was valid. 3 Discuss whether this experiment was reliable. 4 Describe the effect of temperature on the activity of
the rennin. 5 Explain the effect of temperature on the activity of the
rennin. 6 Justify your results. 7 Deduce the activity of rennin at 10°C.8 Identify two ways this experiment could be improved.9 Identify two hazards associated with the experiment
and explain how to reduce these risks.10 Identify and explain the process causing rennin to
become inactive at 80°C.
Part B—Effect of pH on the enzyme rennin
Every enzyme has an optimum pH where the substrate fits exactly into the active site to enable the enzyme to function at its best. This shape is influenced by ionic and hydrogen bonding. Any change in pH will denature the enzyme by breaking the bonds, and therefore, changing the shape of the enzyme’s active site, making it inactive. Because the enzyme rennin is produced in the stomach, which also produces hydrochloric acid, it would be expected that rennin’s optimum pH is in the acidic range.Note:• You need to test the activity of rennin at pHs 3, 5, 7, 11.• You need to prepare tubes of pH solutions using
the universal indicator solution and its chart as a guide.
• Milk will curdle when acid is added without the enzyme. Therefore you need to compare the degree of coagulation, and the time it takes milk to clot, between the two acidic treatments.
Materials• Safety glasses• 200 mL of milk• Test tube rack• 10 mL measuring cylinders• 37°C water baths• Bicarbonate soda (or NaOH)• Eyedropper• Pre-mixed solution of rennin (0.07 g/mL)*• Teaspoon• Test tubes• Universal indicator solution and its chart• Enclosed shoes• Stopwatch (seconds)• 5 mL graduated pipettes• Litmus paper• Marking pen• Distilled water• Vinegar (or HCl)*Note: A rennin solution will be made up in the laboratory using junket tablets from a supermarket. To ensure clotting occurs in this experiment, it is suggested that 10 drops of rennin solution be used for every 10 mL of milk. Different brands of junket tablets, however, can vary in the amount of rennin they contain. Therefore, the suggested volume of rennin should be tested for its ability to set milk before conducting the experiment. Necessary adjustments in volumes of enzyme (rennin) and substrate (milk) may need to be made.
You are expected to use these materials to design and perform a practical investigation to illustrate rennin’s ability to clot milk at different pH. (Ensure that you include controls in your experiment.) You must also construct and include in your written report: • Aim • Hypothesis
ResultsTable 1.5.4 Time taken for the enzyme rennin to clot milk at different temperatures
Note that the control contains everything except the test substance.
Temperature of water baths (°C) Time taken for milk to clot (mins)
Treatments (+ enzyme rennin) Controls (– enzyme rennin)
1 2 Mean (n = 2) 1 2 Mean (n = 2)
0
20
37
80
Macmillan Biology NSW Year 11106
202359_NSW_Biology_Y11_text_ch05_3pp.indd 106 20/07/17 8:42 pm
UNCORRECTED PROOFS

978 1 4202 3848 8
• Materials and methods• Results• Discussion• Bibliography
To help you with your write-up, refer to Writing your report at the end of this depth study.
Part C—Effect of substrate concentration on the enzyme renninWhen all active sites on enzymes are occupied by the substrate (the saturation point), the enzyme activity is maximum. Therefore, if the substrate is diluted, and the enzyme is then exposed to increasing concentrations of substrate, there will be an increase in enzyme activity relative to this increase, up until saturation, when the maximum rate of reaction will occur. Addition of more substrate will not result in an increase in enzyme activity because all active sites are already occupied.
Materials• Safety glasses• 50 mL of milk• Test tube rack• 10 mL measuring cylinders• 37°C water bath• Marking pen• Pre-mixed solution of rennin (0.07 g/mL)*• 8 test tubes• Stopwatch (seconds)• 5 mL graduated pipettes• Distilled water• Eyedropper*Note: A rennin solution was made up in the laboratory using junket tablets from a supermarket. To ensure clotting occurs in this experiment, it is suggested that 10 drops of rennin solution be used for every 10 mL of milk. Different brands of junket tablets, however, can vary in the amount of rennin they contain. Therefore, the suggested volume of rennin should be tested for its ability to set milk before conducting the experiment. Necessary adjustments in volumes of enzyme (rennin) and substrate (milk) may need to be made.
You are expected to use these materials to design and perform a practical investigation to illustrate rennin’s ability to clot milk at different substrate concentrations. (Ensure that you include controls in your experiment.) You must also construct and include in your written report: • Aim • Hypothesis
• Materials and methods• Results• Discussion• Bibliography
To help you with your write-up, refer to Writing your report below.
Writing your reportA written report on your practical investigations on the functioning of the enzyme rennin is required. You should not have aims and hypotheses identical to those already provided in this textbook because that is plagiarism. Instead, you should write the hypotheses in your own words or rehash those given to you. Your report should contain:• Title – Also include subtitles because you conducted
separate experiments on how rennin was affected by temperature, pH and substrate concentration.
• Abstract – This contains a brief summary of all your findings with some explanation of your results.
• Aim – For each practical investigation (Part A Effect of temperature on the enzyme rennin, Part B Effect of pH on the enzyme rennin and Part C Effect of substrate concentration on the enzyme rennin), write a brief statement on the purpose of each experiment, that is, what you planned to do. You may have more than one aim.
• Hypothesis – You need to predict what you expected to find in all of your practical investigations (Part A Effect of temperature on the enzyme rennin, Part B Effect of pH on the enzyme rennin and Part C Effect of substrate concentration on the enzyme rennin). You may have more than one hypothesis.
• Materials and methods – List all the materials used and describe in detail the methods you used. You must also construct and include experimental designs for Part B Effect of pH on the enzyme rennin and Part C Effect of substrate concentration on the enzyme rennin. Refer to figure 1.5.17 to help you with this.
• Results – Include and label the completed table 1.5.4 from Part A Effect of temperature on the enzyme rennin as table 1. All other results should be entered in new tables and graphed where possible. Each of these must have a title and a number that will be referred to when you describe your results in the text of your Results section; for example, ‘at 0°C, enzyme activity was low (table 1, figure 2)’.
• Discussion – Explain your results from each experiment by using information that you have gathered from reference books or journal articles. You
Chapter 5 The role of enzymes 107
202359_NSW_Biology_Y11_text_ch05_3pp.indd 107 20/07/17 8:42 pm
UNCORRECTED PROOFS

978 1 4202 3848 8
profile of a scientist
Ecologist with diverse research interests
Ross Coleman is the Director of the Centre for Research on Ecological Impacts of Coastal Cities (EICC) and convenor of the Coastal and Marine Ecosystems group at the University of Sydney. This is in addition to his other role as Director of Graduate Research for the University. He is originally from the UK, but has lived in Australia since 2005 and calls Australia home. He got his BSc in Biological Sciences where his honours project focused on the spatial arrangement of leaf mining insects on rare plants. He followed this up with a brief foray into high school teaching (maths and biology), but returned to science in 1993 to do a PhD at the University of Southampton. His research there was directed at understanding interactions between feeding herbivores, changes in host plant chemistry and responses of the next trophic level—the insects that fed upon the herbivores. This was a very successful project, leading to four publications and an acquired life-time aversion to cabbage. The arrival of Prof Steve Hawkins at the University of Southampton enabled Ross to switch systems and examine how the distribution of limpet grazers on the rocky intertidal affected their chances of being eaten by birds. Somehow, this translated into a career obsession with trying to understand why limpets are arranged in space in the way they are.
An appointment to the academic staff at the University of Plymouth in 1999 allowed Ross to diversify his research interests into many different aspects of marine ecology, including evaluating the UK’s first ever statutory No-Take Marine reserve for conservation. He also supervised several PhD, Masters and honours students in a wide variety of projects, many of which have been successfully published. An opportunity afforded by a Royal Society International Fellowship meant a research visit to Sydney, which in addition to yielding a good publication, also led to a long-standing friendship with Professors Tony Underwood and Gee Chapman at the University of Sydney. In 2005, Ross moved to the University of Sydney to take over from Tony and Gee in running the Centre for Research on EICC upon their retirement. He is now a successful researcher in marine ecology with a diverse range of interests from invasive species through ecological impacts to the ecology of grazing. And yes, he (and his PhD students) continues to study limpets.
To find out more about Ross’s research interests, access the following website:macbiology.com.au/w/am
Associate Professor Ross Coleman
Figure 1.5.18 Ross Coleman in the field at Cape Banks, the northern head of Botany Bay, NSW
also should include conclusions from your practical investigations.
Answer all discussion questions posed in Part A Effect of temperature on the enzyme rennin. Construct five questions plus answers to each question for Part B Effect of pH on the enzyme rennin and Part C Effect of substrate concentration on the enzyme rennin.
• Bibliography – This is a list of references that you used when writing your report; for example, if they provided information to help you explain some of your observations and data sets. (Journal articles are best because they are reviewed by experts. Internet articles may be inaccurate—anyone, not necessarily experts, can set up a website.)
Macmillan Biology NSW Year 11108
202359_NSW_Biology_Y11_text_ch05_3pp.indd 108 20/07/17 8:42 pm
UNCORRECTED PROOFS

978 1 4202 3848 8
The role of enzymes
Main points• Metabolism is defined as all the
life-sustaining chemical reactions in the body.
• The chemical reactions of metabolism are either catabolic (breakdown of large molecules into subunits) or anabolic (use energy to build complex molecules from smaller ones).
• The activity of an enzyme is affected by temperature, pH and substrate concentration.
• Enzymes are proteins that work as catalysts to speed up chemical reactions; they remain unaltered during these reactions.
• Enzymes function within narrow ranges of temperature and pH and can be denatured by extremes of temperature or pH.
• Enzymes are substrate specific.
• Enzyme action can be explained by the lock and key model and the induced fit model.
• Because the lock and key model cannot explain all reactions catalysed by enzymes, the induced fit model was proposed.
Revision questions1 Define ‘enzyme’ and identify the
role of enzymes in metabolism.
2 Identify three common enzymes found in humans and explain the reactions they catalyse.
3 Describe the chemical composition of enzymes.
4 Construct a diagram to demonstrate the function and specificity of an enzyme on a substrate.
5 Construct diagrams of the lock and key model and the induced fit model. Explain each model and distinguish between them.
6 Figure 1.5.19 illustrates the effect of substrate concentration
on enzyme activity. Describe a practical investigation that you did to examine this phenomenon. In your report, include the following: Aim, Hypothesis, Method, Results and Conclusion.
Substrate concentration
Enzy
me
acti
vity
Figure 1.5.19 Effect of substrate concentration on enzyme activity
7 Clarify two risks involved in the experiment from Question 6 and explain how you reduced these risks.
8 Define ‘pH’.
9 Identify an enzyme inhibitor and explain how it functions.
10 Explain how temperature and pH can denature enzymes.
chapter 5 review
Chapter 5 The role of enzymes 109
202359_NSW_Biology_Y11_text_ch05_3pp.indd 109 20/07/17 8:43 pm
UNCORRECTED PROOFS

978 1 4202 3848 8
MODULE REVIEW
Cells as the basis of life: module review
Review questions1 Describe the observations of Robert Hooke, Robert
Brown, Matthias Schleiden, Theodor Schwann and Rudolf Virchow that led to the development of cell theory.
2 Identify the main advances in technology that led to modern cell theory.
3 Describe how modern cell theory expands cell theory.
4 Explain why the use of dyes was so important for Walther Flemming’s discoveries.
5 Construct diagrams to explain endosymbiotic theory.
6 Knowledge is often a result of scientific collaboration. Rosalind Franklin was not officially recognised for her (unknowing) part in the discovery of the structure of DNA. Evaluate the scientific ethics of Wilkins, Watson and Crick for their part in the discovery.
7 Explain why cells have an optimal size.
8 Identify some features of prokaryotic cells that distinguish them from eukaryotic cells.
9 Describe cellular respiration.
10 Describe the chemical nature of living organisms.
11 Define ‘osmosis’ and construct a diagram to illustrate this process.
12 Compare passive and active transport and describe two examples of each.
13 Explain the concept of Surface Area to Volume ratio.
14 Identify a shape that would enhance absorption.
15 Describe the fluid mosaic model of the cell (plasma) membrane.
16 Explain the function of the cell’s semipermeable plasma membrane.
17 Identify the role of enzymes in metabolism.
18 Explain why there are specific substrates for enzymes.
19 Identify the optimum pH for the enzyme rennin.
20 Identify two enzyme inhibitors and describe the effects of each.
Cells as the basis of life: assessment
Mini exam questions1 Of the following cell structures, identify those that are
only visible under an electron microscope.
A nucleus, mitochondrion, cell wall
B ribosome, endoplasmic reticulum, cell membrane
C mitochondrion, chloroplast, vacuole
D cell membrane, mitochondrion, Golgi body2 Identify which of the following cell diameters has the
largest surface area to volume ratio.
A 2 µm
B 2 mm
C 10 µm
D 0.1 mm3 Identify which of these molecules is the most
important energy source for plant and animal cells.
A amino acid
B lipid
C glucose
D DNA4 Identify which of the following processes is involved
in transporting large molecules across plasma membranes against a concentration gradient.
A simple diffusion
B endocytosis
C facilitated diffusion
D osmosis5 Identify which of the following forms the chemical
composition of an enzyme.
A carbohydrate
B lipid
C protein
D nucleic acid6 Explain why advances in microscopy led to the
development of cell theory.
7 Construct diagrams of a mitochondrion and a chloroplast.
Macmillan Biology NSW Year 11110
202359_NSW_Biology_Y11_text_mr01_3pp.indd 110 20/07/17 8:43 pm
UNCORRECTED PROOFS

978 1 4202 3848 8
8 Identify the organelles commonly found in plant meristems (or growth areas e.g. shoots) and in liver cells. Explain why these organelles are so prevalent in these tissues.
9 Construct a diagram to illustrate the fluid mosaic model of the cell membrane.
10 Enzymes are vital components of metabolism.
A Explain why enzymes are sometimes called ‘biological catalysts’.
B Describe and compare the two models for enzyme activity: lock and key, and induced fit.
C Explain how extremes of temperature affect enzyme activity.
Test question with sample answers
QuestionCompare the characteristics of prokaryotic and eukaryotic cells, and include a detailed definition for each.
High range answer
Prokaryotic cells Eukaryotic cells Definition
Cell (plasma) membrane
Cell (plasma) membrane
Membrane surrounding all cells
Cytosol Cytosol and cytoplasm
Cytosol is the fluid within cells, excluding all organelles; cytoplasm is cell material, including all organelles except for nucleus, contained by the cell membrane
Cytoskeleton Cytoskeleton Protein network in all cells (maintains cell shape, provides cell movement by cilia and flagella, involved in movement of materials within cells, cell division)
Nucleoid region (1 circular chromosome – DNA) with no membrane to contain it
Nucleus (several chromosomes – DNA) contained by nuclear membrane
Genetic material – DNA (nucleus has nucleolus where nucleotides and RNA are produced)
Plasmids Plasmids (rarely) Double stranded, often circular DNA
Cell wall Cell wall in plants, algae and fungi
Outside cell membrane, supports and protects cells
No organelles; cyanobacteria have membranes with chlorophyll
Membrane-bound organelles such as chloroplasts, vacuoles, mitochondria, Golgi bodies, endoplasmic reticulum
‘Little organ with a function’ surrounded by membrane(s)
Ribosomes Ribosomes Non-membranous organelles that translate mRNA into proteins
Flagella (hollow tubes) with spiral motion – in many cells
Flagella (9 fused pairs of microtubules around 2 central microtubules) move from side to side) – in protists, sperm
Extensions from body involved in locomotion
Satisfactory answer
Prokaryotic cells Eukaryotic cells Definition
Cell membrane Cell membrane Surrounds cells
Cytosol Cytosol and cytoplasm
Fluid within cells
Cytoskeleton Cytoskeleton Protein network in all cells
Nucleoid region Nucleus DNA
Plasmids Plasmids DNA
Cell wall Cell wall Outside cell membrane
No organelles Organelles ‘Little organ with a function’
Ribosomes Ribosomes Organelles that help form proteins
Flagella Flagella Involved in locomotion
Assessment task: pH maintains enzyme reactionsNote: An alternative assessment is available in the Teacher Resources.Students:
1B4 conduct a practical investigation to model the action of enzymes in cells (ACSBL050)
1B5 investigate the effects of the environment on enzyme activity through the collection of primary or secondary data (ACSBL050, ACSBL051)
IntroductionEnzymes act as catalysts in chemical reactions and their rate of reaction is determined by temperature, pH and substrate concentration. While enzyme action increases
111Module 1 Cells as the basis of life
202359_NSW_Biology_Y11_text_mr01_3pp.indd 111 20/07/17 8:43 pm
UNCORRECTED PROOFS

978 1 4202 3848 8
up to a point, depending on the amount of substrate avail-able, each type of enzyme performs best within a narrow range of temperatures or pH. Above or below a specific optimal temperature or pH, enzyme function decreases. Outside this range, the shape of the enzyme (a protein) changes, making the active sites inoperable. Eventually, the enzyme gets denatured and no reaction takes place.
All animal cells (such as in liver) produce the enzyme catalase that breaks down hydrogen peroxide H
2O
2
(a toxic by-product of metabolism) into non-toxic water and oxygen (2H
2O
2 catalase 2H
2O + O
2). In the laboratory,
the rate of reaction can be measured by the volume of oxygen released. The greater the amount of oxygen measured, the faster the reaction.
The task• To plan and perform a practical investigation to
determine the optimal pH for the enzyme catalase
• To write a report using the headings below
Note: When you have completed the experiment, please clean all equipment and leave the work space as it was at the start of the assessment.
Aim 2 marks
Hypothesis3 marks
MaterialsFresh liver
1M HCl (pH 3)
Water – H2O (pH 7)
1M NaOH (pH 9)
6% H2O2 (pH 6)
Marker pen
Safety razor blade
Large test tubes
Test tube holders
Test tube rack
2 mL pipettes or 10 mL measuring cylinders
Safety goggles
**Note that this experiment works best with each test tube containing 2 mL of required pH + 2 mL H2O2 + 1 cm cube of liver (where appropriate)
Risk assessment
Describe two possible risks/hazards during the experiment and a way to reduce each risk/hazard.
4 marks
MethodUse dot points to construct an ordered plan of your controlled experiment
6 marks
Results Tabulate results and construct a graph of results
6 marks
Discussion questions1 Define ‘control’ and identify the control test tubes.
3 marks
2 Explain the function of the control in this experiment.
3 marks
3 Identify the optimal pH for catalase.
1 mark
4 Identify whether each test tube treatment was acidic, neutral or alkaline.
2 marks
5 Explain why it is necessary for cells to maintain a stable pH.
3 marks
6 Explain the effect of different pHs on the activity of the enzyme catalase.
2 marks
7 Identify the dependent and independent variables in the experiment.
2 marks
8 Describe whether this experiment is reliable.
2 marks
9 Describe whether this experiment is valid.
2 marks
10 Describe two ways by which this experiment could be improved.
4 marks
Marking scheme1 Report (including answers to discussion questions)
45 marks
2 Experimental method
Safe work practices marks2 marks
Independence1 mark
Appropriate use of equipment1 mark
Clean and tidy work space and equipment cleaned1 mark
/5 marks
Total/50 marks
Macmillan Biology NSW Year 11112
202359_NSW_Biology_Y11_text_mr01_3pp.indd 112 20/07/17 8:43 pm
UNCORRECTED PROOFS