1 7.6 graphs of the sine and cosine functions 7.8 phase shift; sinusoidal curve fitting in these...
TRANSCRIPT
1
7.6 Graphs of the Sine and Cosine Functions7.8 Phase shift; Sinusoidal Curve Fitting
In these sections, we will study the following topics:
The graphs of basic sine and cosine functionsThe amplitude and period of sine and cosine functionsTransformations of sine and cosine functionsSinusoidal curve fitting

3
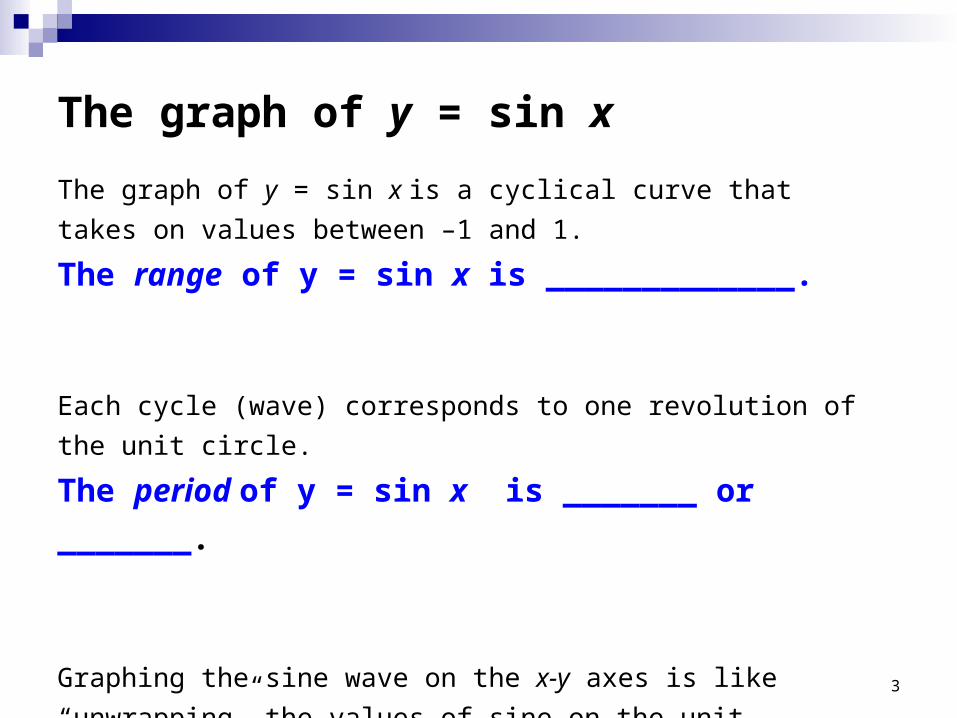
The graph of y = sin x
The graph of y = sin x is a cyclical curve that takes on values
between –1 and 1.
The range of y = sin x is _____________.
Each cycle (wave) corresponds to one revolution of the unit circle.
The period of y = sin x is _______ or _______.
Graphing the sine wave on the x-y axes is like “unwrapping” the
values of sine on the unit circle.
4
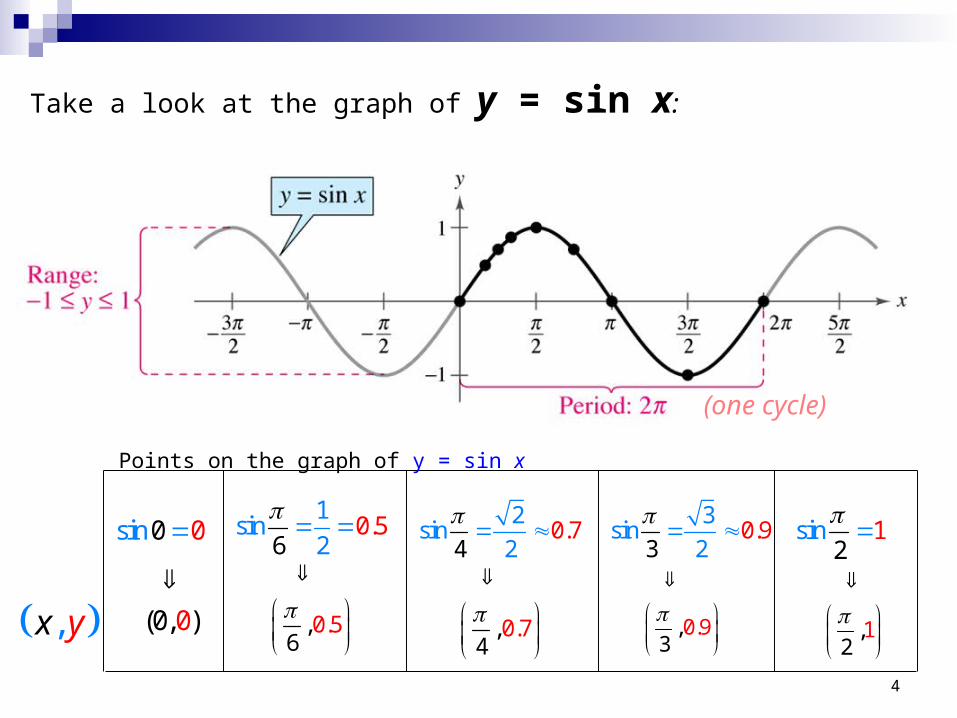
Take a look at the graph of y = sin x:
(one cycle)
sin 12
1sin
2.
60 5
2
sin2
.4
0 7
3
sin2
.3
0 9
sin 0 0
,x y (0, )0
0.5,6
0.7,4
1,2
0.9,3
Points on the graph of y = sin x
5
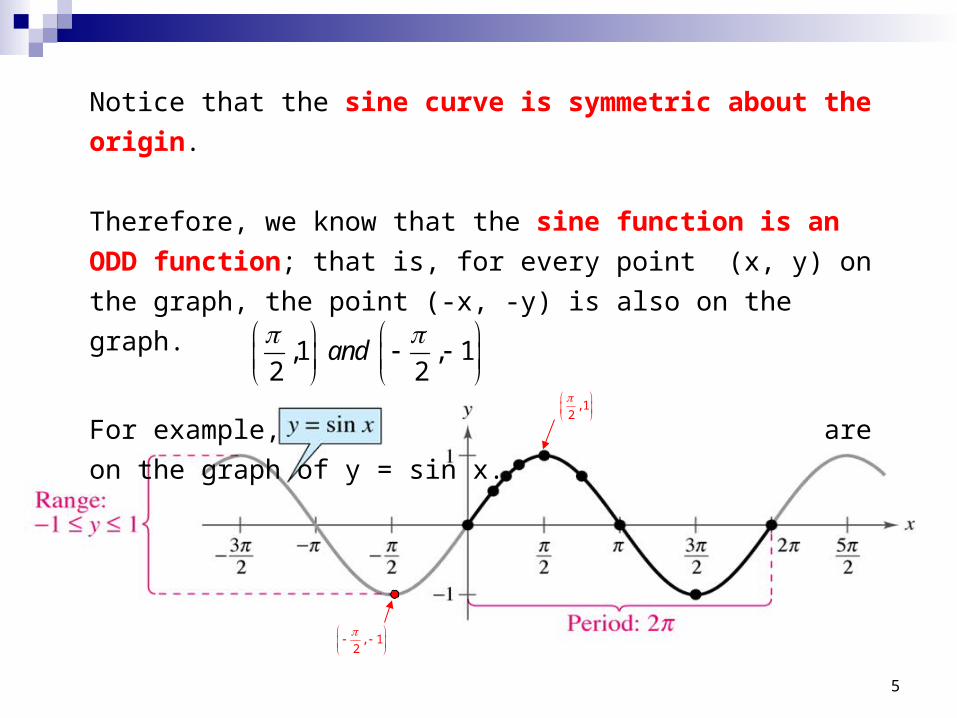
Notice that the sine curve is symmetric about the origin.
Therefore, we know that the sine function is an ODD function;
that is, for every point (x, y) on the graph, the point (-x, -y) is also
on the graph.
For example, are on the graph of y = sin x.,1 , 12 2
and
, 1
2
, 12
6
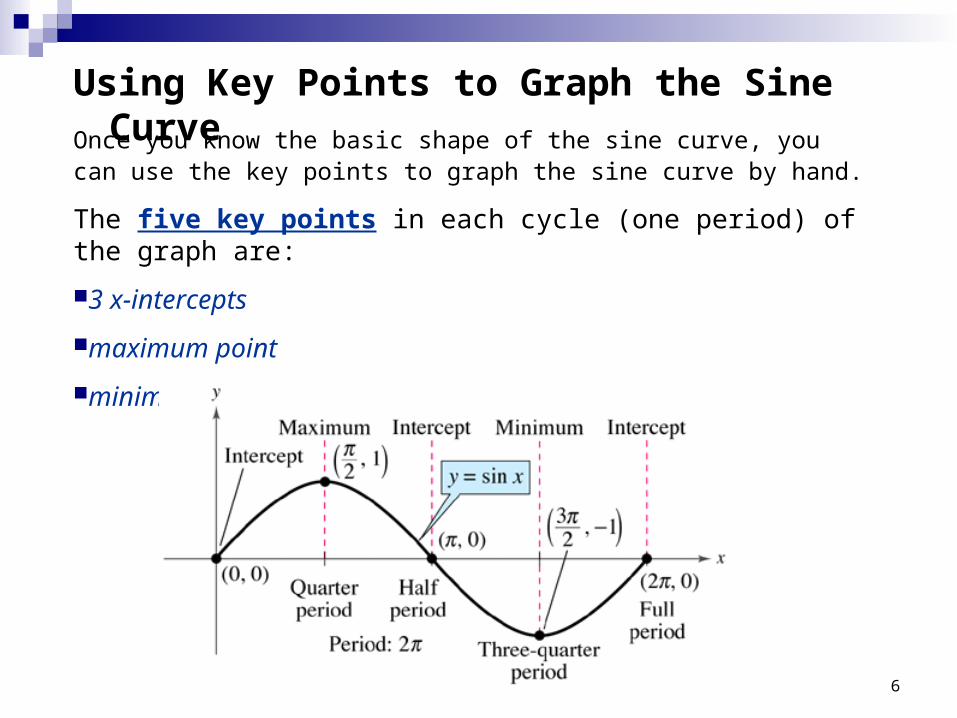
Using Key Points to Graph the Sine Curve
Once you know the basic shape of the sine curve, you can use the key points to graph the sine curve by hand.
The five key points in each cycle (one period) of the graph are:
3 x-intercepts
maximum point
minimum point
7
The graph of y = cos x
The graph of y = cos x is also a cyclical curve that takes on values
between –1 and 1.
The range of the cosine curve is ________________.
The period of the cosine curve is _______ or _______.
8
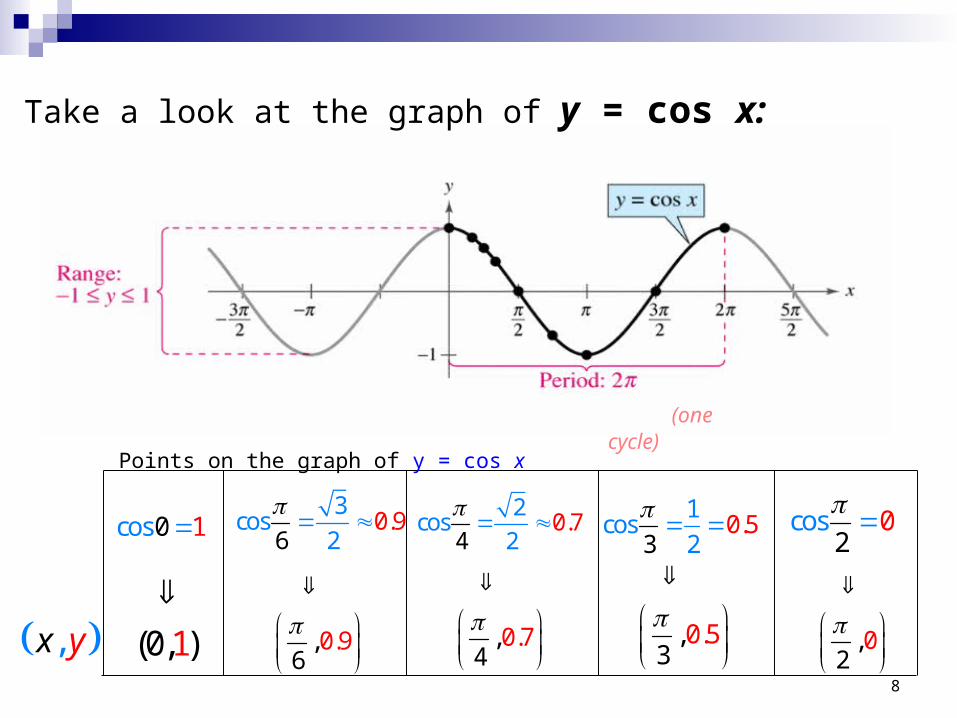
Take a look at the graph of y = cos x:
(one cycle)
cos 0 1 cos 02
1
cos2
.3
0 5
2
cos2
.4
0 7
3
cos2
.6
0 9
,x y (0, )1
0.9,
6
0.7,4
0,2
0.5,3
Points on the graph of y = cos x
9
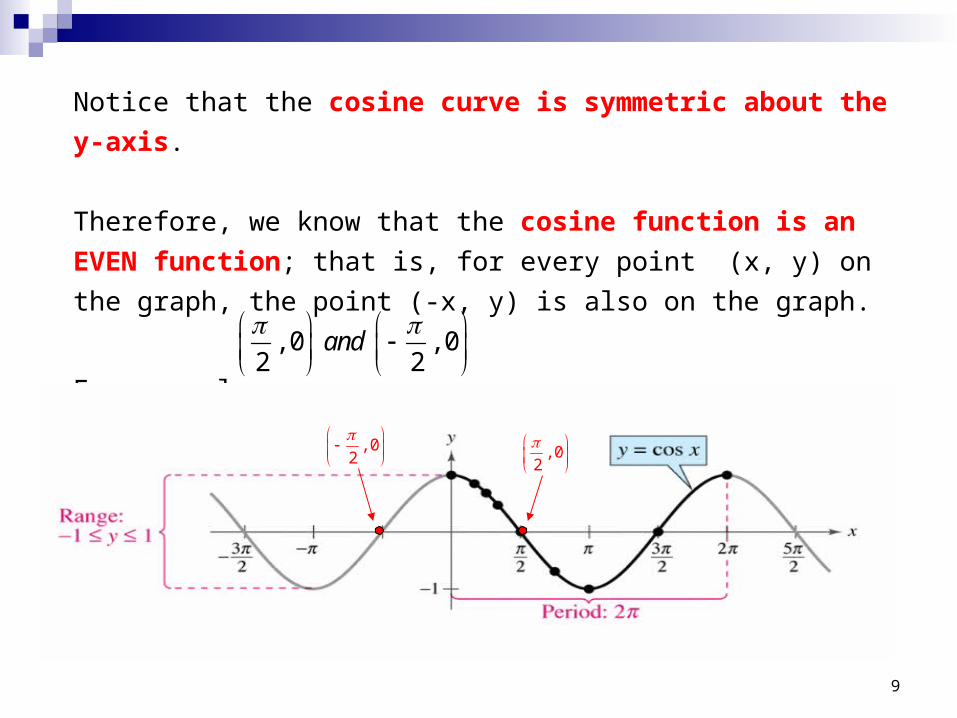
Notice that the cosine curve is symmetric about the y-axis.
Therefore, we know that the cosine function is an EVEN function;
that is, for every point (x, y) on the graph, the point (-x, y) is also on
the graph.
For example, are on the graph of y = cos x., 0 , 02 2
and
, 02
, 02
10
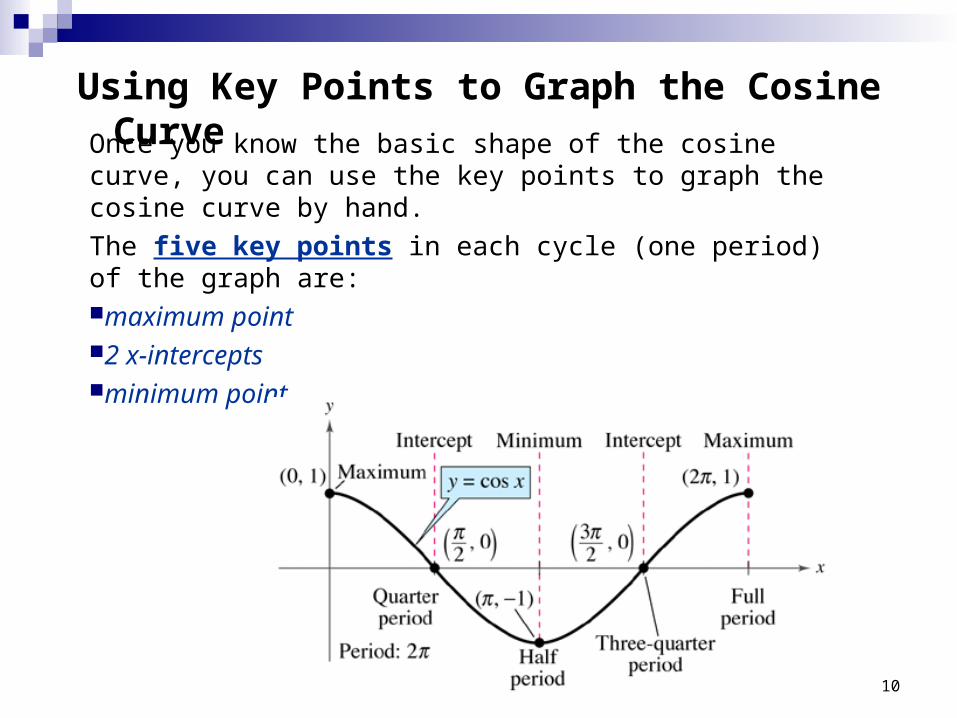
Using Key Points to Graph the Cosine Curve
Once you know the basic shape of the cosine curve, you can use the key points to graph the cosine curve by hand.
The five key points in each cycle (one period) of the graph are:maximum point2 x-interceptsminimum point
11
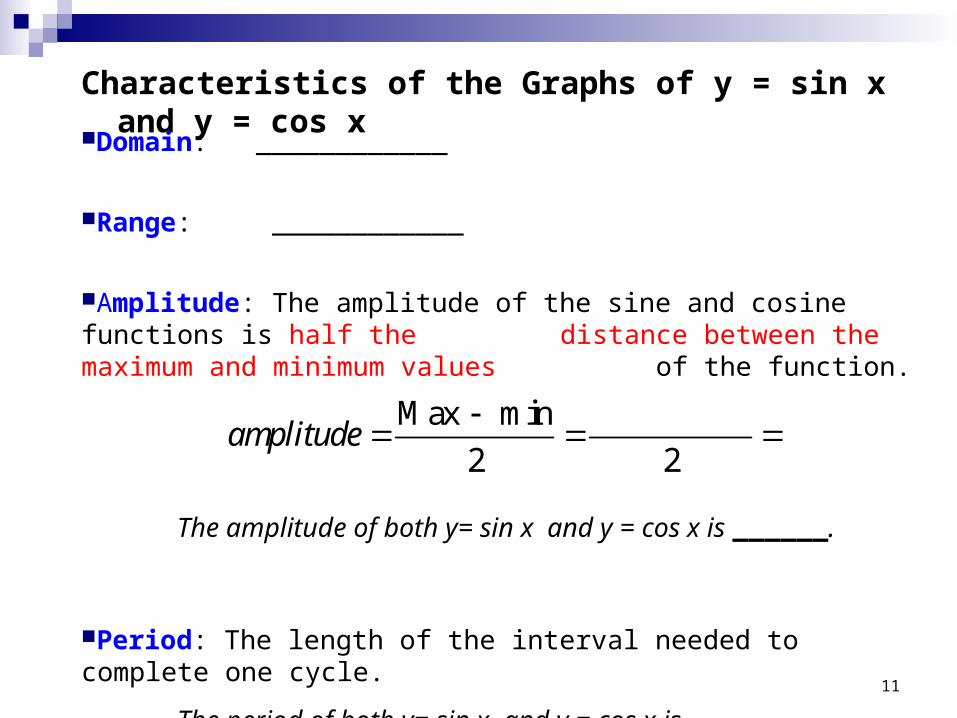
Characteristics of the Graphs of y = sin x and y = cos x
Domain: ____________
Range: ____________
Amplitude: The amplitude of the sine and cosine functions is half the distance between the maximum and minimum values of the function.
The amplitude of both y= sin x and y = cos x is ______.
Period: The length of the interval needed to complete one cycle.
The period of both y= sin x and y = cos x is ________.
Max min
2 2amplitude

13
Transformations of the graphs of y = sin x and y = cos x
Reflections over x-axis
Vertical Stretches or Shrinks
Horizontal Stretches or Shrinks/Compression
Vertical Shifts
Phase shifts (Horizontal)
14
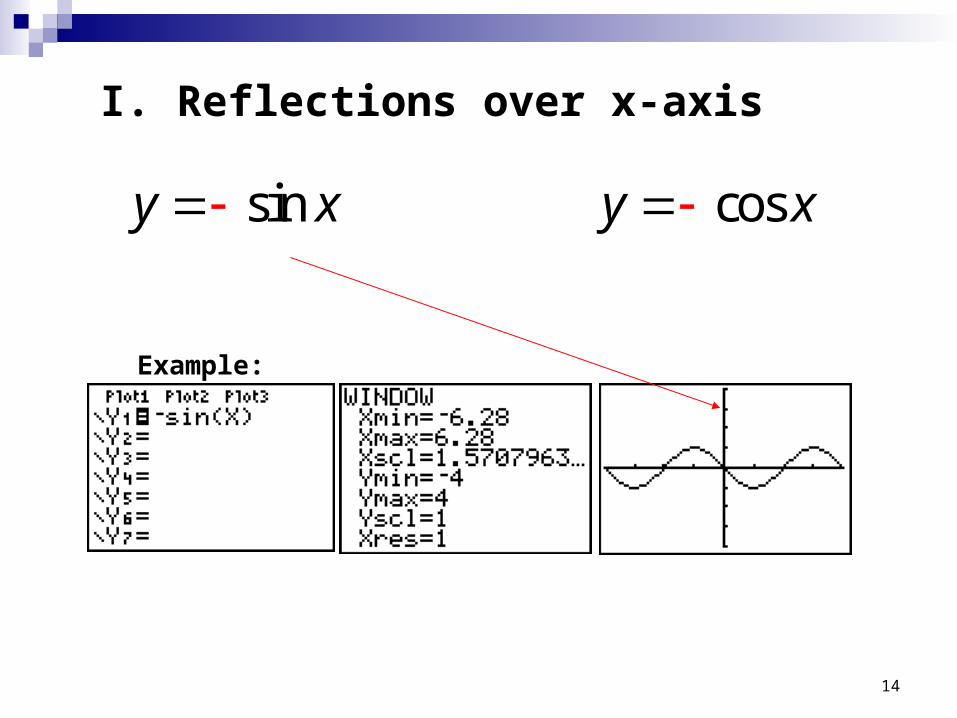
I. Reflections over x-axis
sin cosy x y x
Example:
15
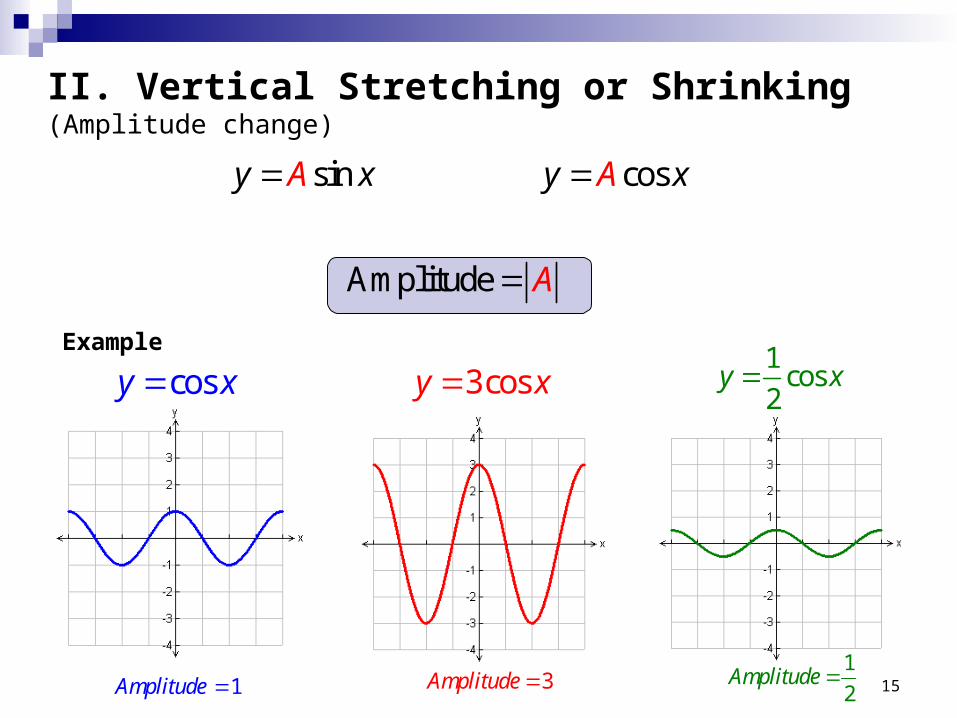
II. Vertical Stretching or Shrinking (Amplitude change)
sin cos
Amplitude
A A
A
y x y x
Example
cosy x
1Amplitude
3cosy x
3Amplitude
1cos
2y x
1
2Amplitude
16
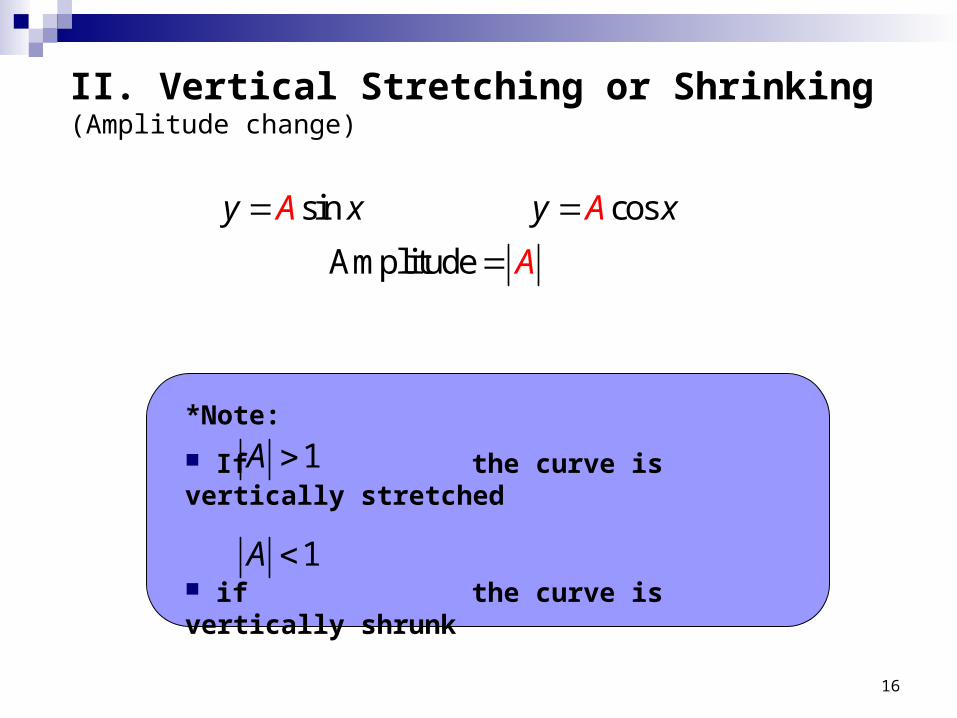
II. Vertical Stretching or Shrinking (Amplitude change)
sin cos
Amplitude
A A
A
y x y x
*Note:
If the curve is vertically stretched
if the curve is vertically shrunk
1A
1A
17
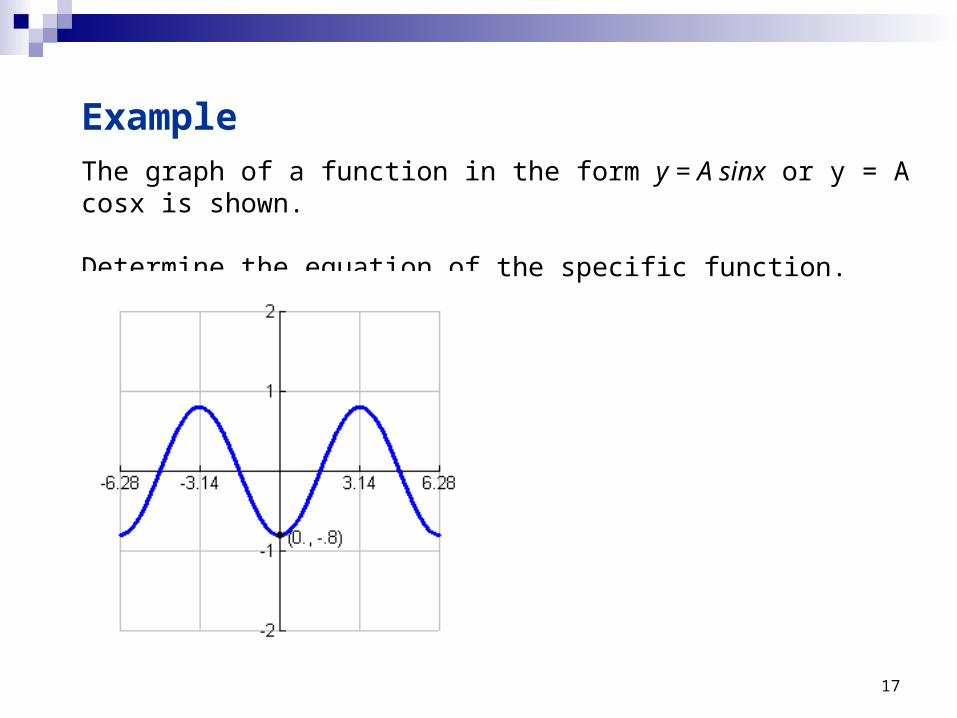
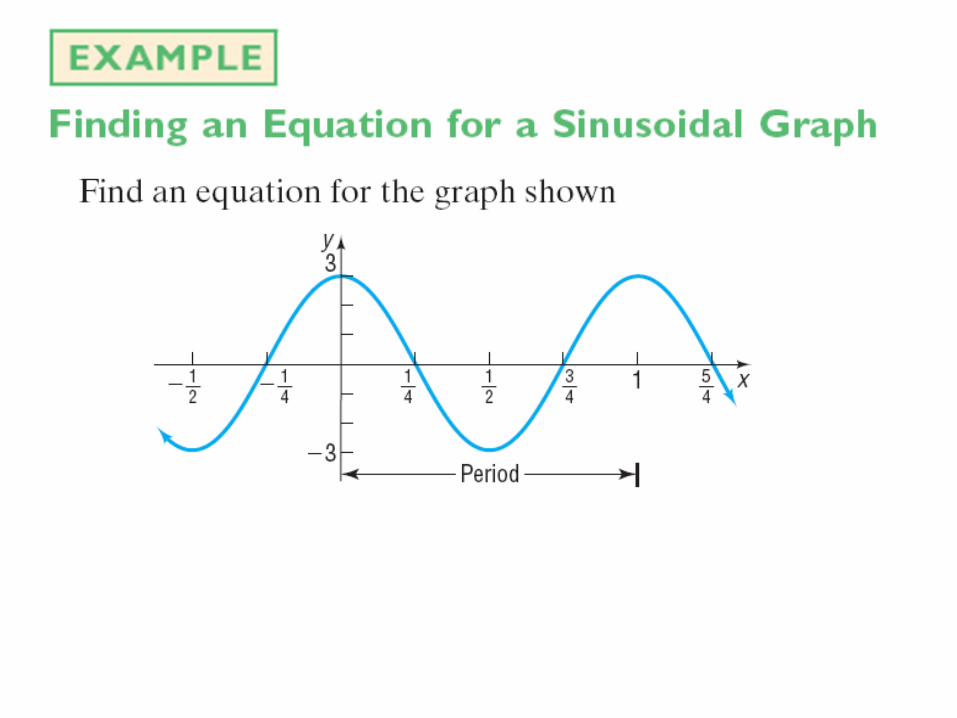
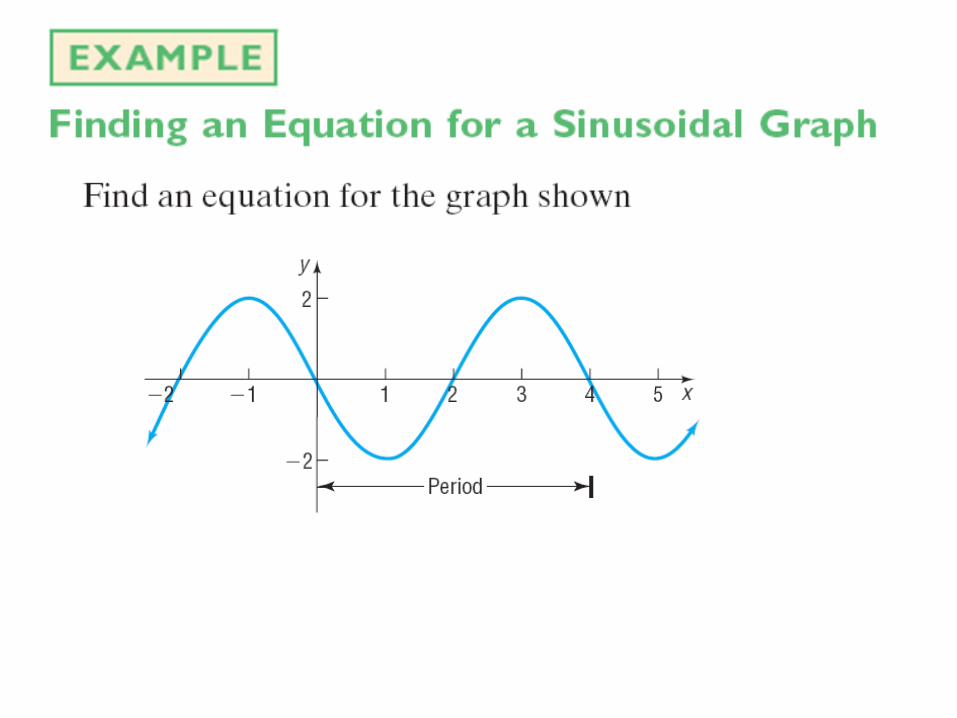
ExampleThe graph of a function in the form y = A sinx or y = A cosx is shown. Determine the equation of the specific function.

19
sin cos
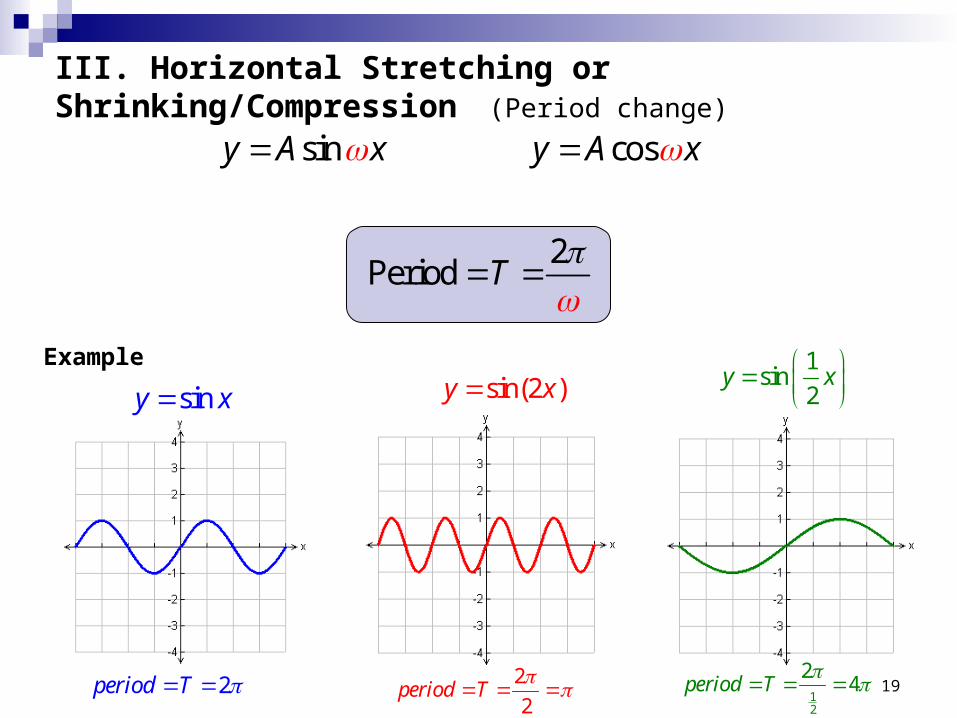
2Period
y A x y A x
T
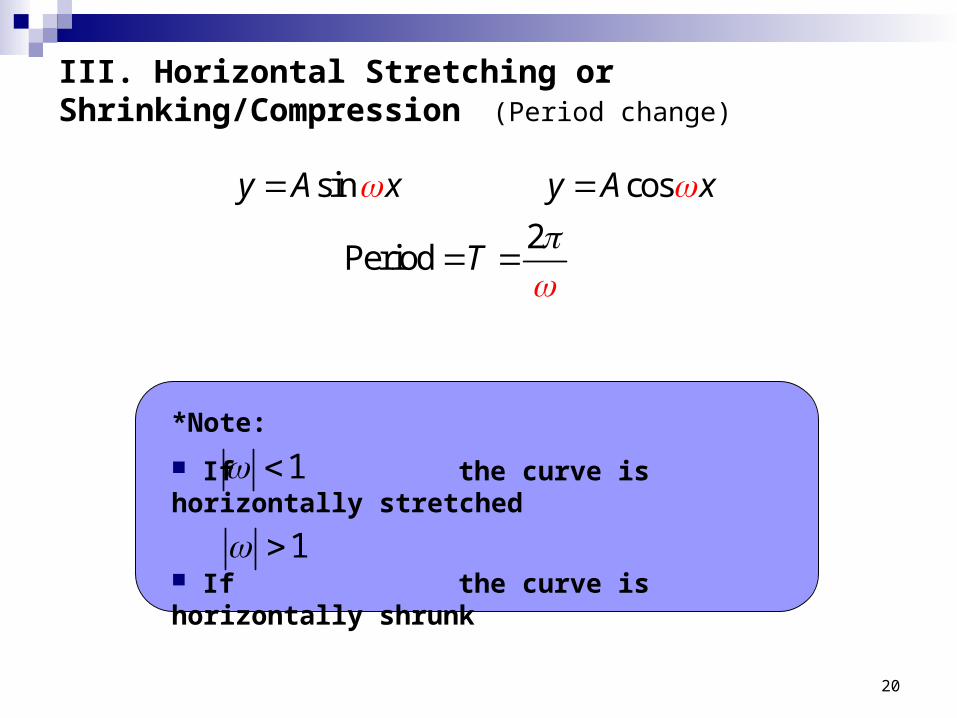
III. Horizontal Stretching or Shrinking/Compression (Period change)
Example
siny x
2period T
sin(2 )y x
2
2period T
1sin
2y x
12
24period T
20
sin cos
2Period
y A x y A x
T
*Note:
If the curve is horizontally stretched
If the curve is horizontally shrunk
1
1
III. Horizontal Stretching or Shrinking/Compression (Period change)
21
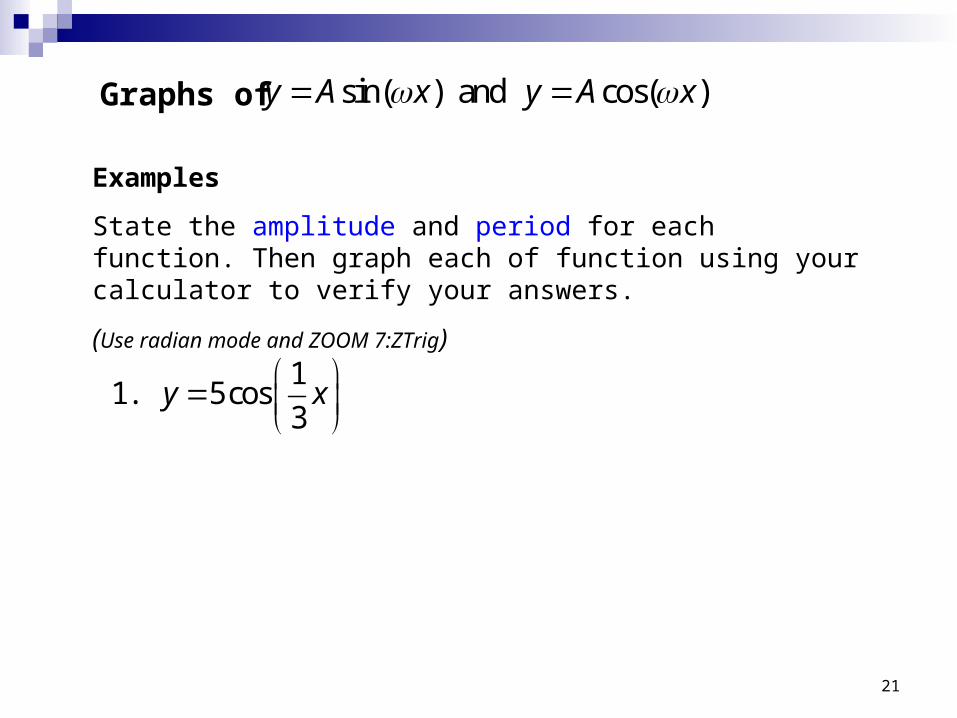
Graphs of
Examples
State the amplitude and period for each function. Then graph each of function using your calculator to verify your answers.
(Use radian mode and ZOOM 7:ZTrig)
11. 5cos
3y x
sin( ) and cos( )y A x y A x
22
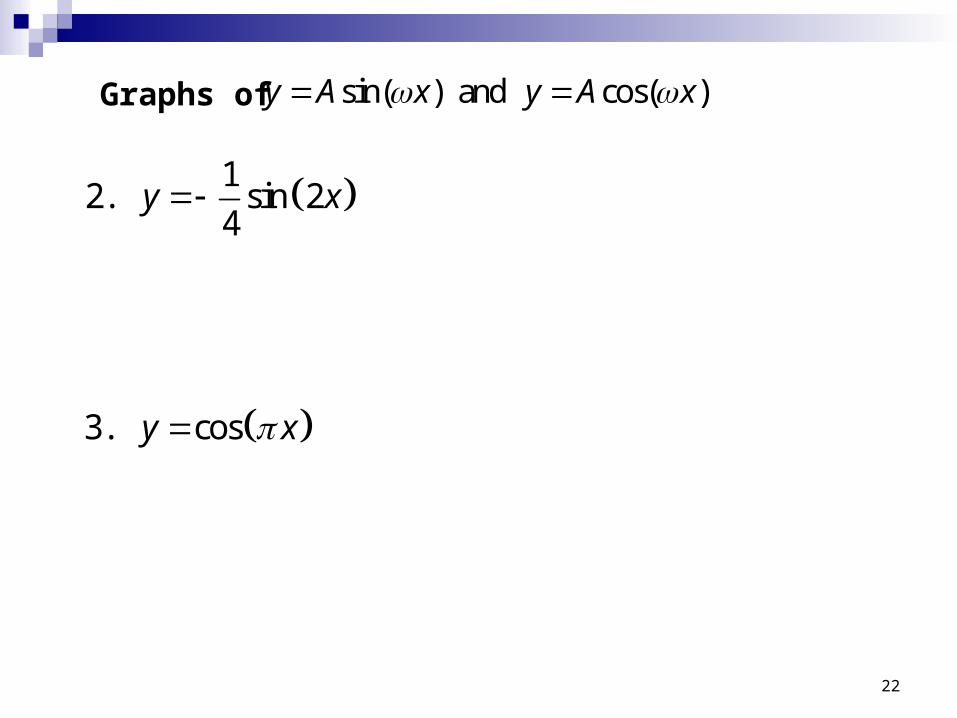
Graphs of
12. sin 2
4
3. cos
y x
y x
sin( ) and cos( )y A x y A x
23
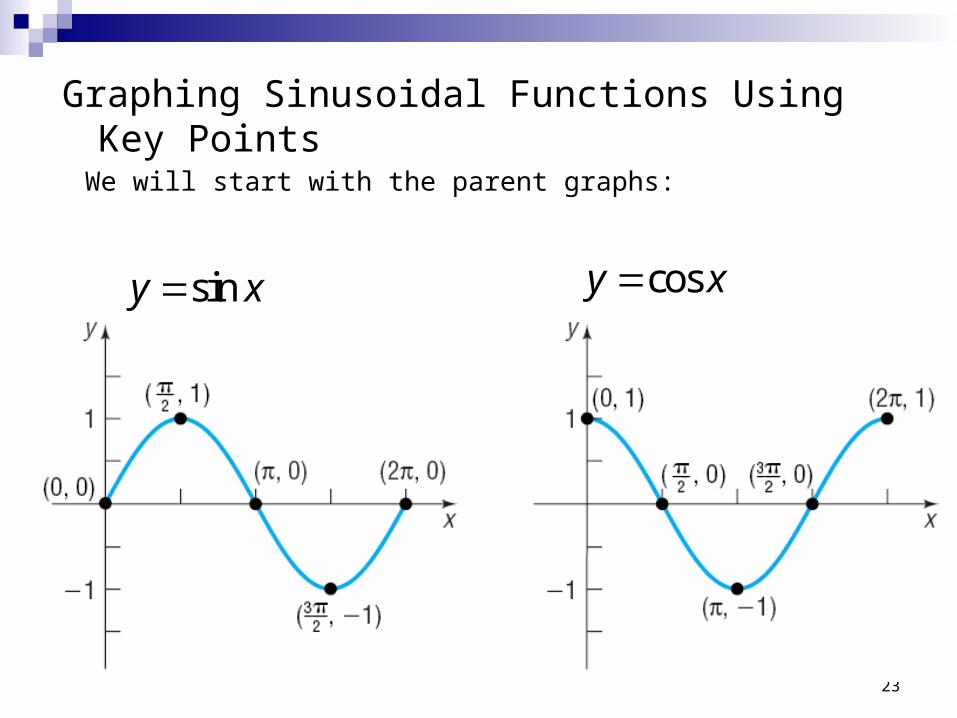
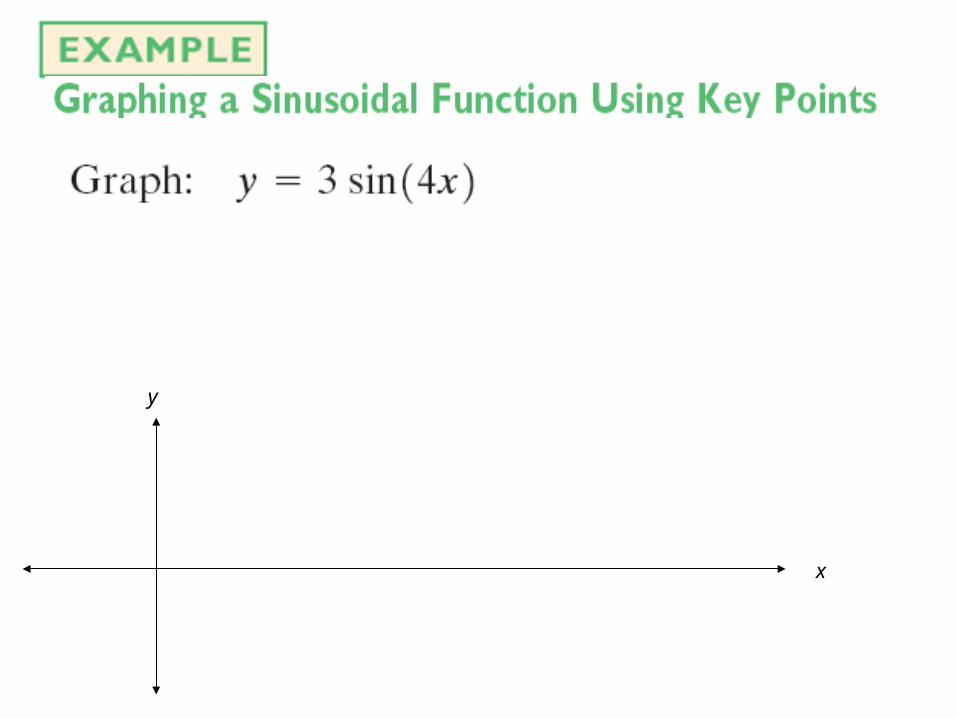
Graphing Sinusoidal Functions Using Key Points
We will start with the parent graphs:
siny x cosy x
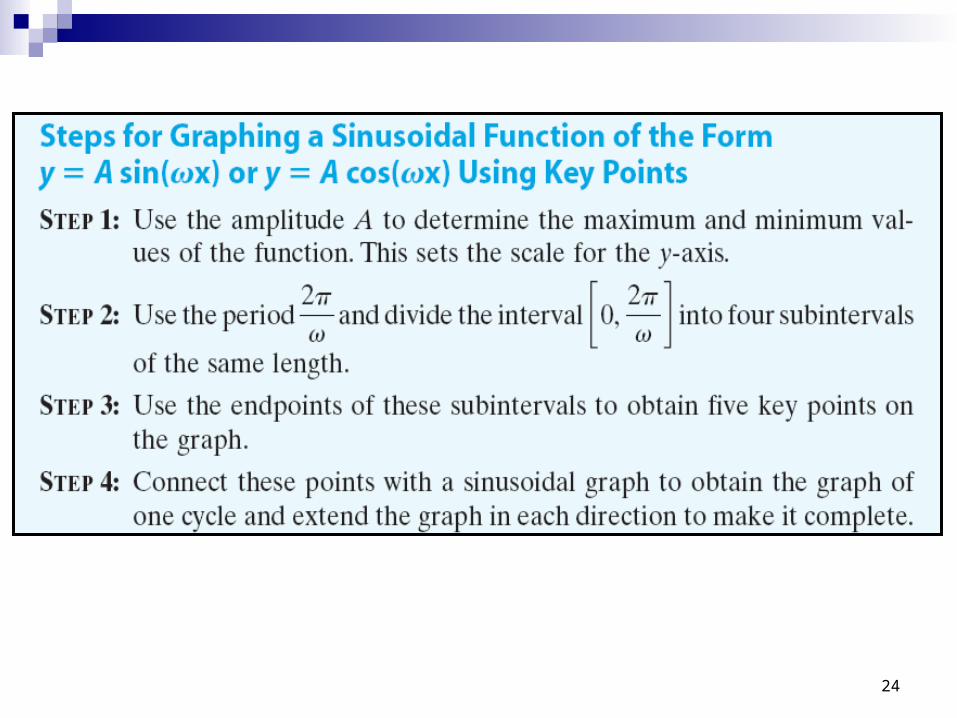
24
x
y
28
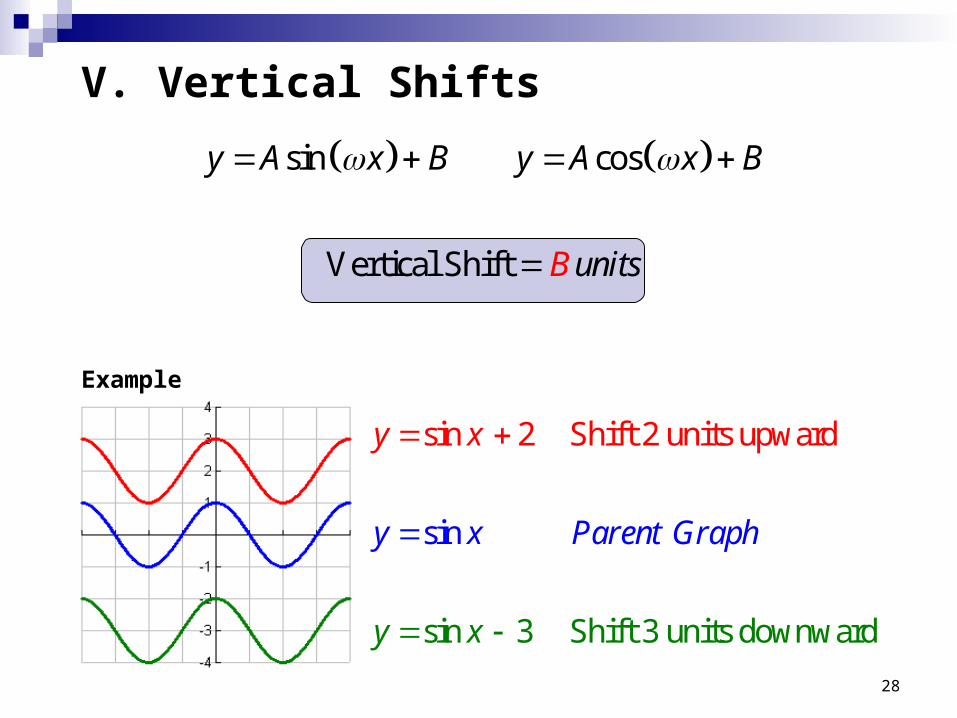
V. Vertical Shifts
sin cos
Vertical Shift
y A x B y A x B
nBu its
Example
sin 3 Shift 3 units downw
sin 2 Shift 2 uni
s
ts up
ar
in
d
ward
y x Parent G
y
raph
x
y x
29
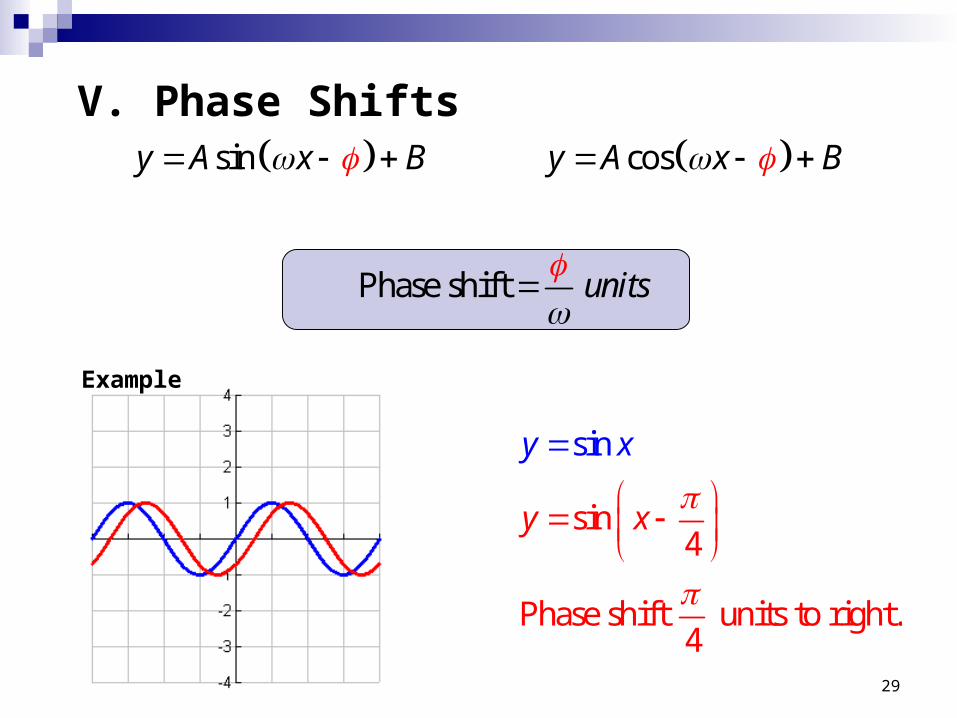
sin cos
Phase shift
y A x B y A x B
units
V. Phase Shifts
Example
sin4
Phase shift units
sin
to right.4
y x
y x

31
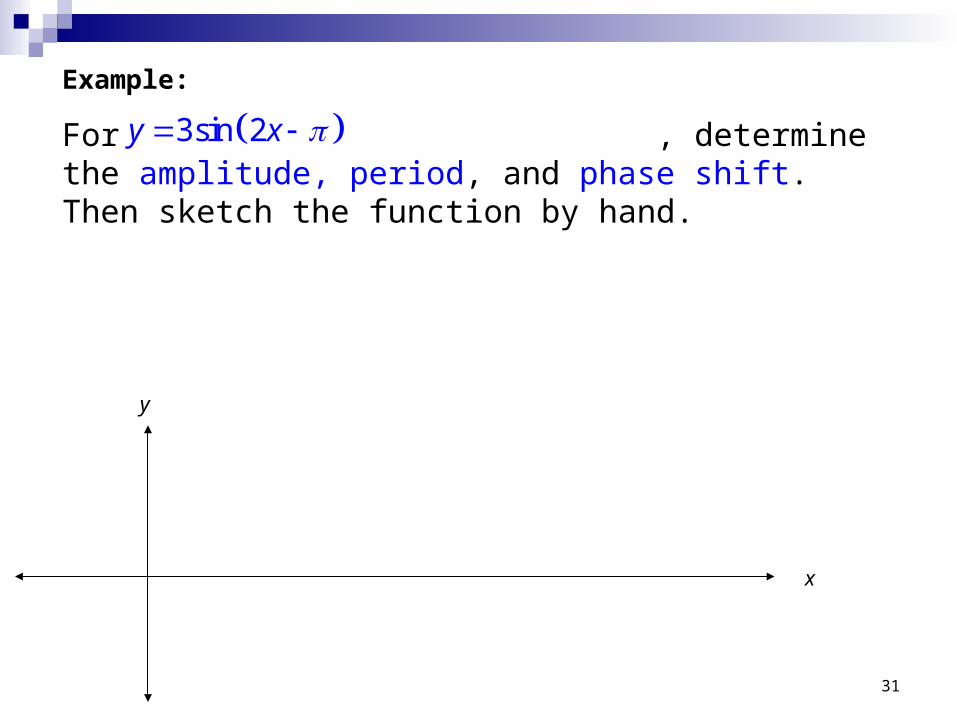
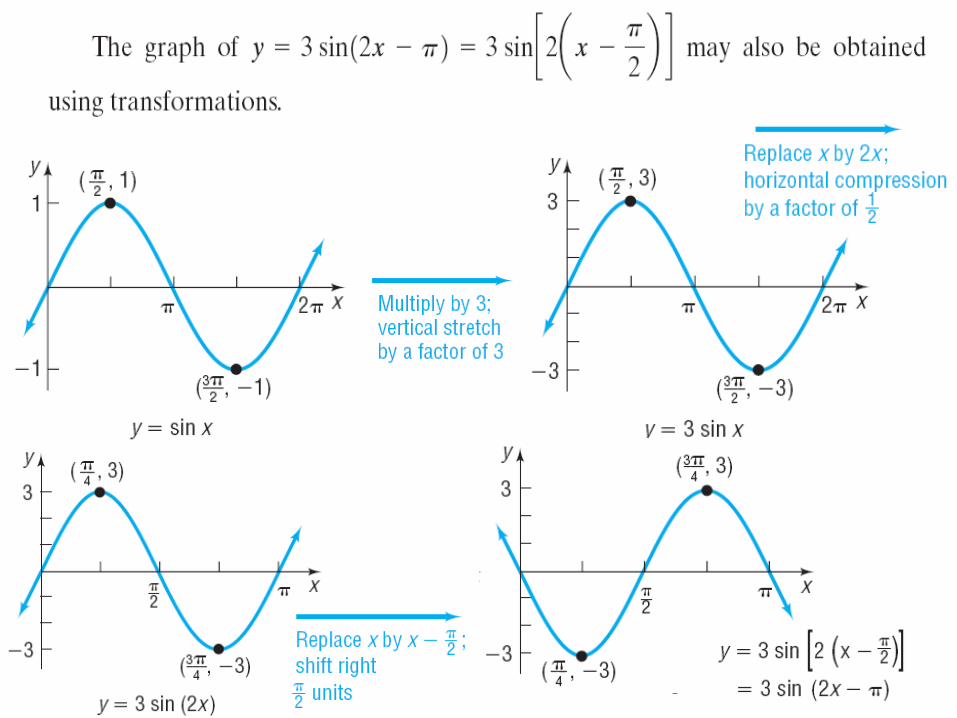
Example:
For , determine the amplitude, period, and phase shift. Then sketch the function by hand.
3sin 2y x
x
y
33
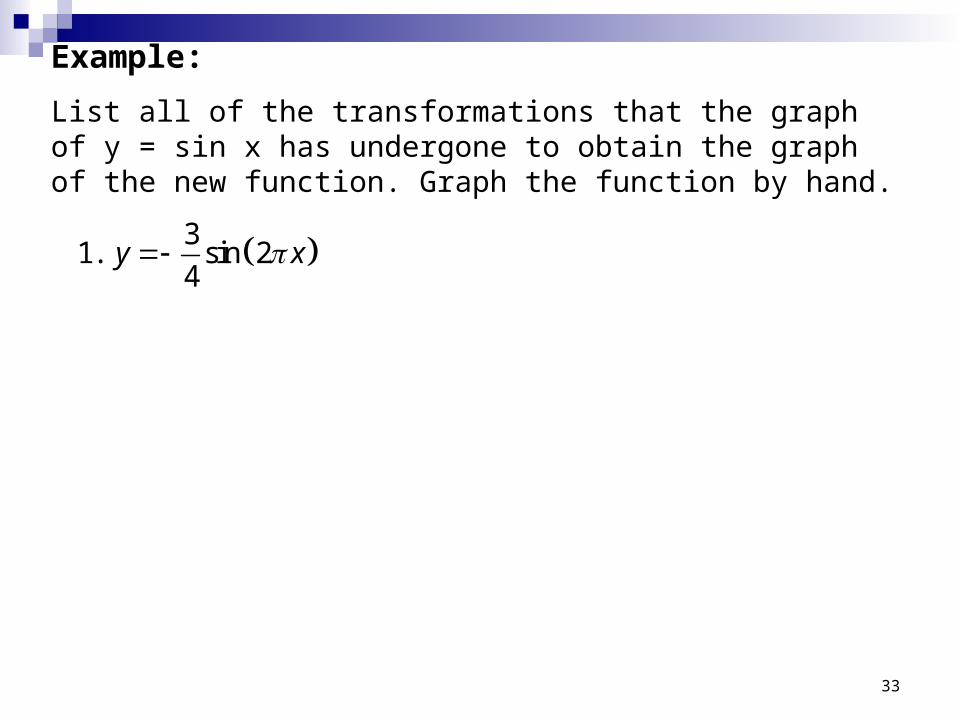
Example:
List all of the transformations that the graph of y = sin x has undergone to obtain the graph of the new function. Graph the function by hand.
31. sin 2
4y x
34
31. sin 2
4y x
x
y
35
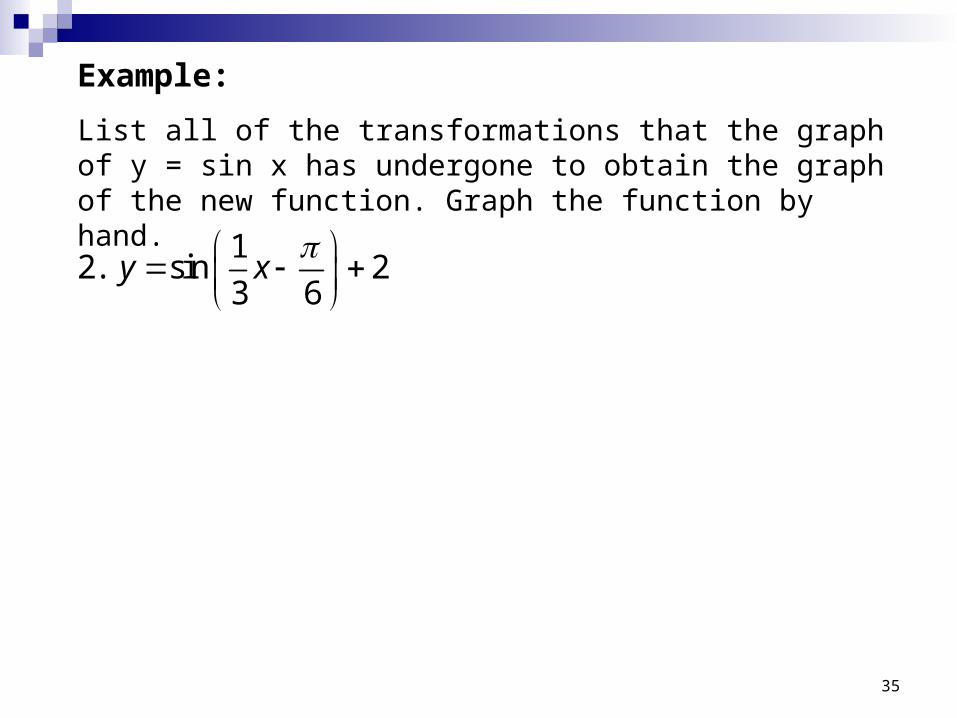
Example:
List all of the transformations that the graph of y = sin x has undergone to obtain the graph of the new function. Graph the function by hand.
12. sin 2
3 6y x
36
12. sin 2
3 6y x
x
y
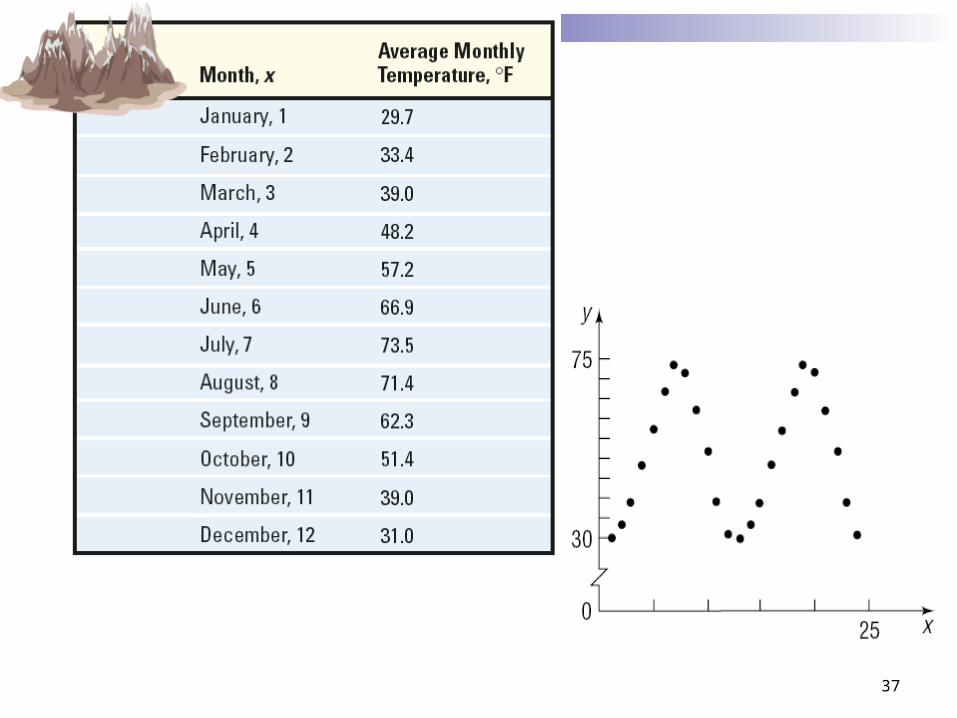
37
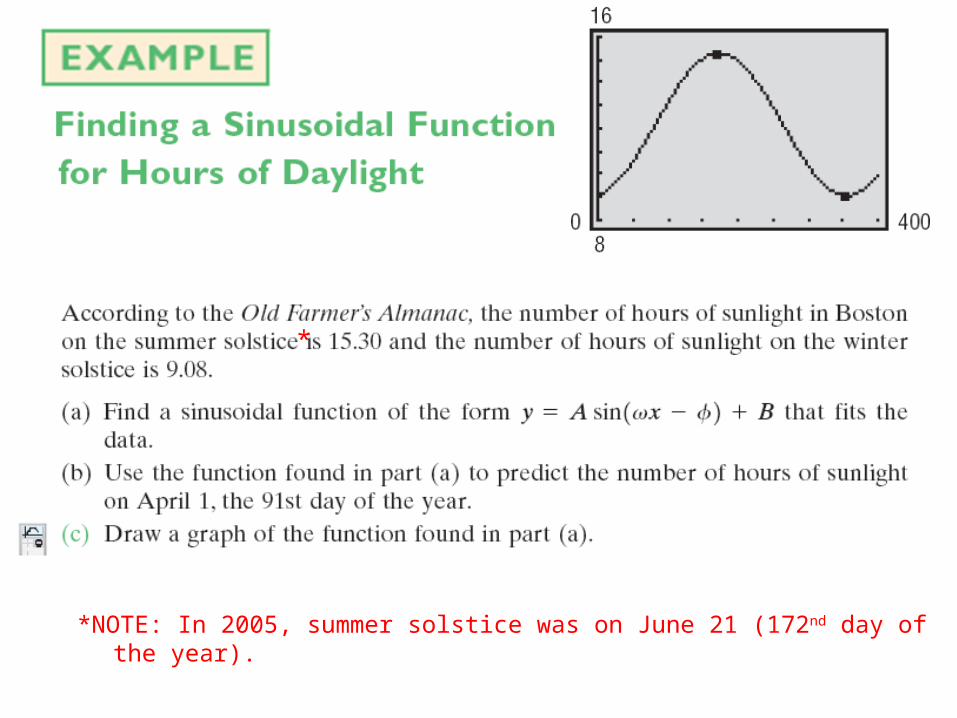
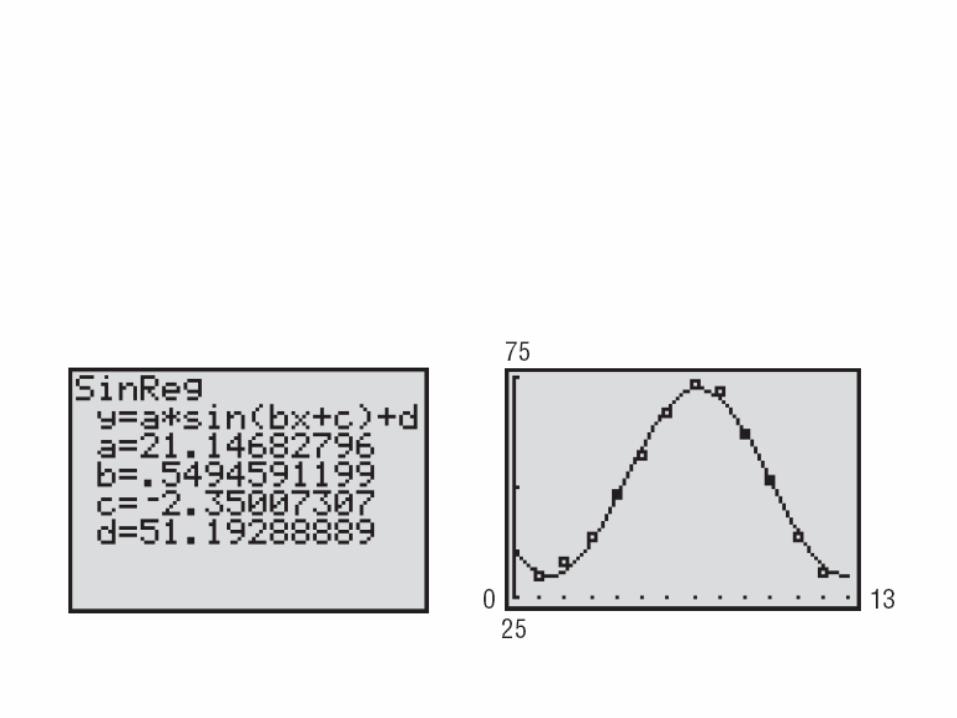
*NOTE: In 2005, summer solstice was on June 21 (172nd day of the year).
*

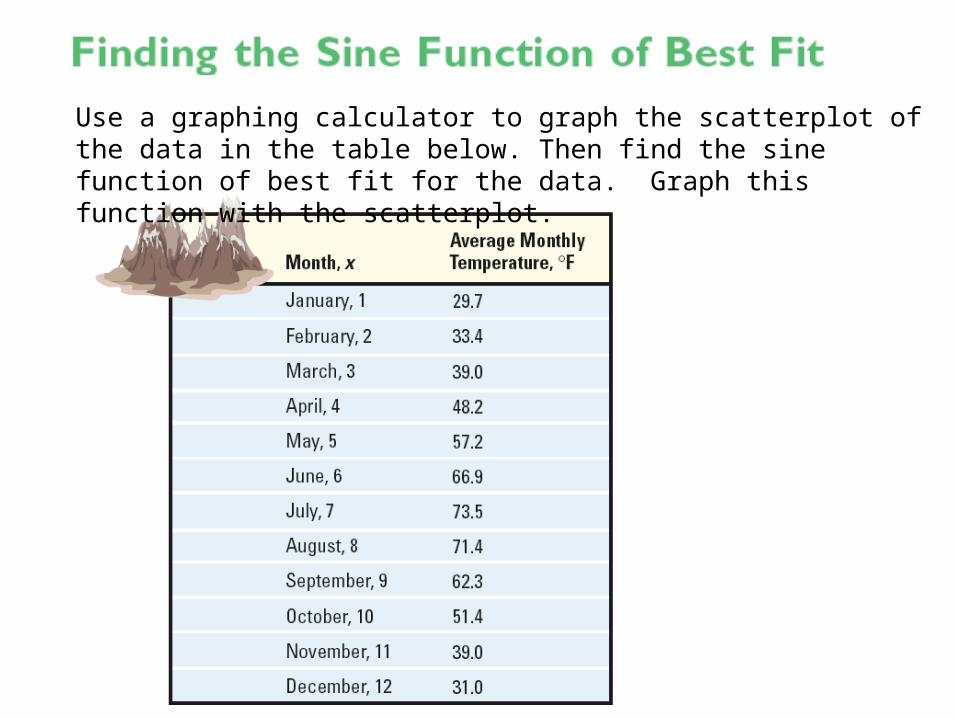
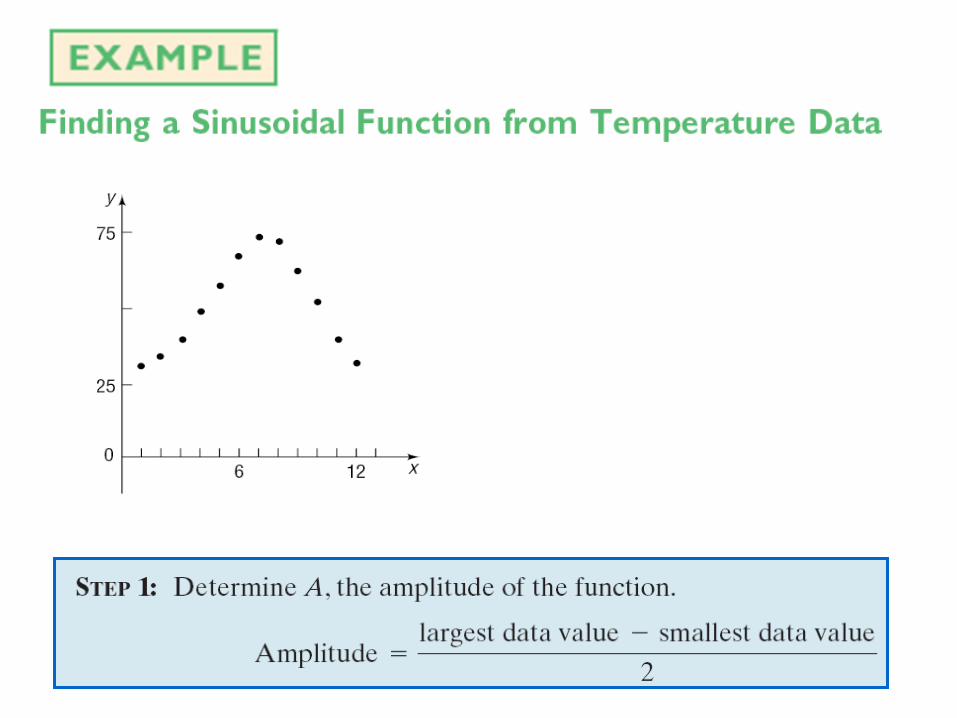
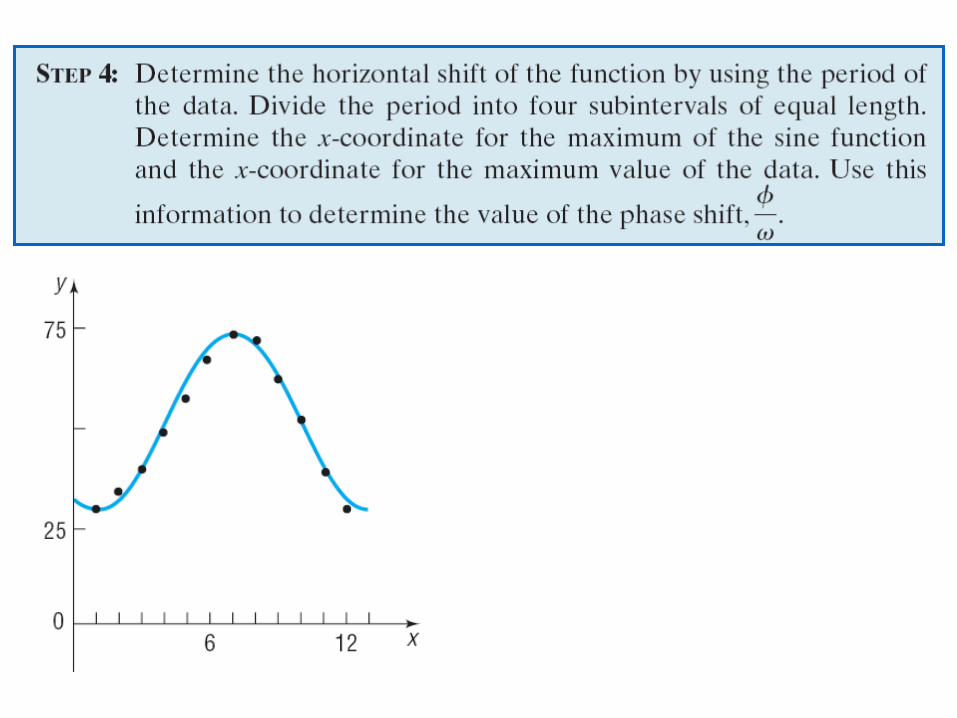
Use a graphing calculator to graph the scatterplot of the data in the table below. Then find the sine function of best fit for the data. Graph this function with the scatterplot.
47
End of Sections 7.6 & 7.8