1 a tale of two cities a statistical analysis of baltimore’s mature workers presentation for...
TRANSCRIPT
1
A Tale of Two CitiesA Statistical Analysis of Baltimore’s
Mature Workers
Presentation forSeptember 2008 Board Meeting
2
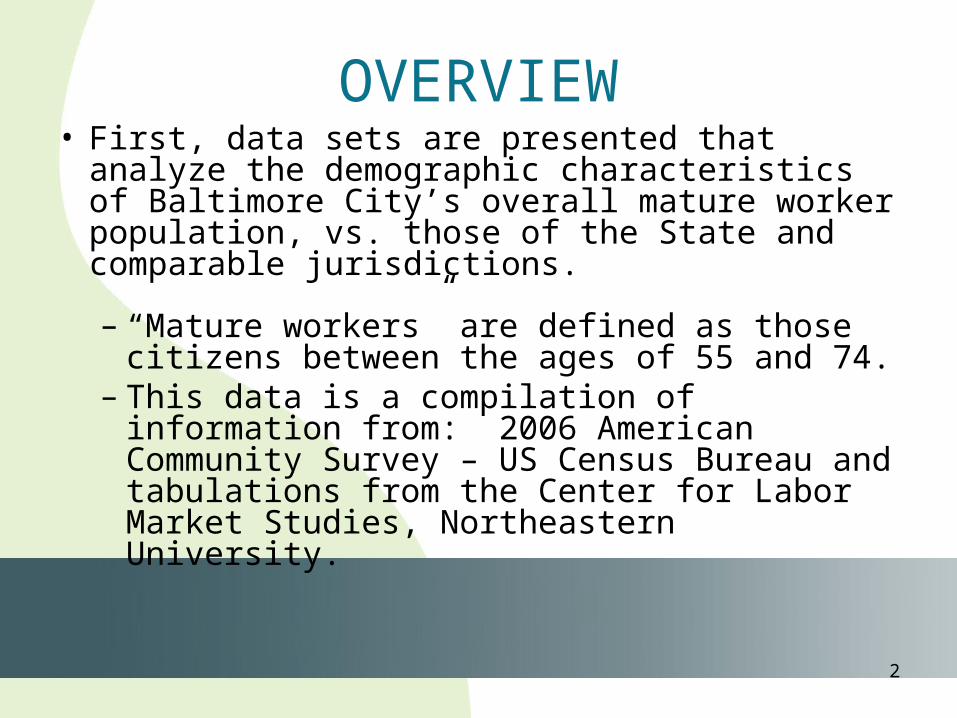
OVERVIEW• First, data sets are presented that analyze the
demographic characteristics of Baltimore City’s overall mature worker population, vs. those of the State and comparable jurisdictions.
– “Mature workers” are defined as those citizens between the ages of 55 and 74.
– This data is a compilation of information from: 2006 American Community Survey – US Census Bureau and tabulations from the Center for Labor Market Studies, Northeastern University.

3
OVERVIEW• Next, data is presented which provides a more
focused assessment of a sub-set of Baltimore’s mature workers: those who have utilized one of MOED’s One-Stop Career Centers.
– For this assessment, “mature workers” are defined as all of those citizens above 55 years of age.
– This data is a compilation of information provided by MOED’s Performance and Planning Division.

4
Baltimore’s Mature Workers

5
Population Data
Area Total
Population
55 – 74 Year Olds
Percentage of Total
Population
Baltimore City 631,451 103,452 16.4%
Montgomery County
932,487 163,187 17.5%
Prince George’s County
841,538 127,394 15.1%
State of Maryland 5,615,727 949,982 16.9%
**For Baltimore, another 91,331 individuals are in the 45 – 54 age bracket (15% of total
population.**
6
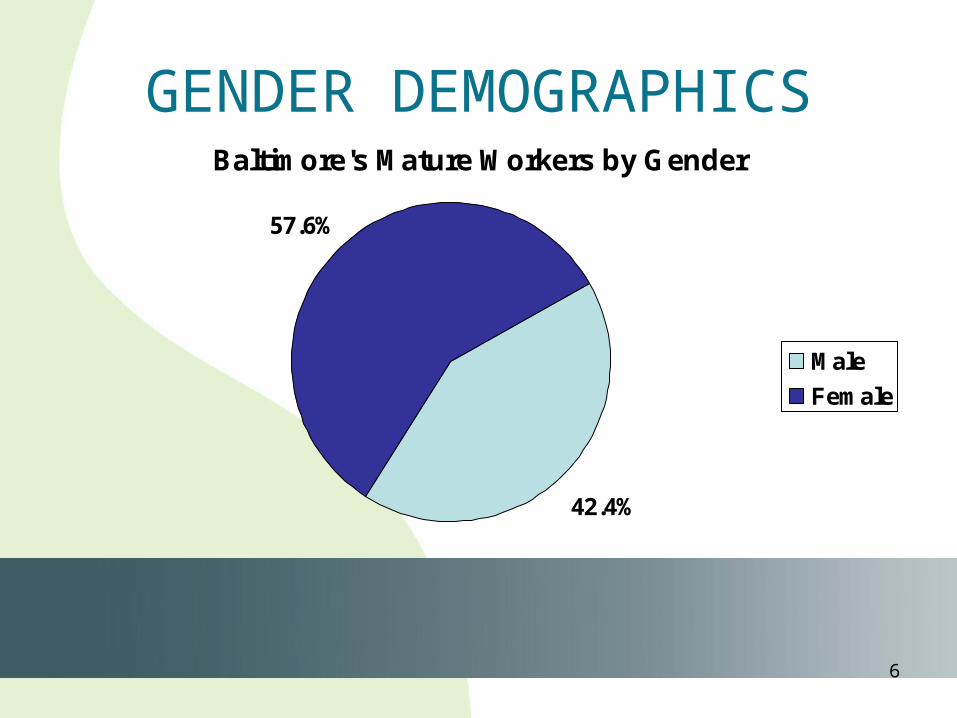
GENDER DEMOGRAPHICSBaltimore's Mature Workers by Gender
42.4%
57.6%
Male
Female
7
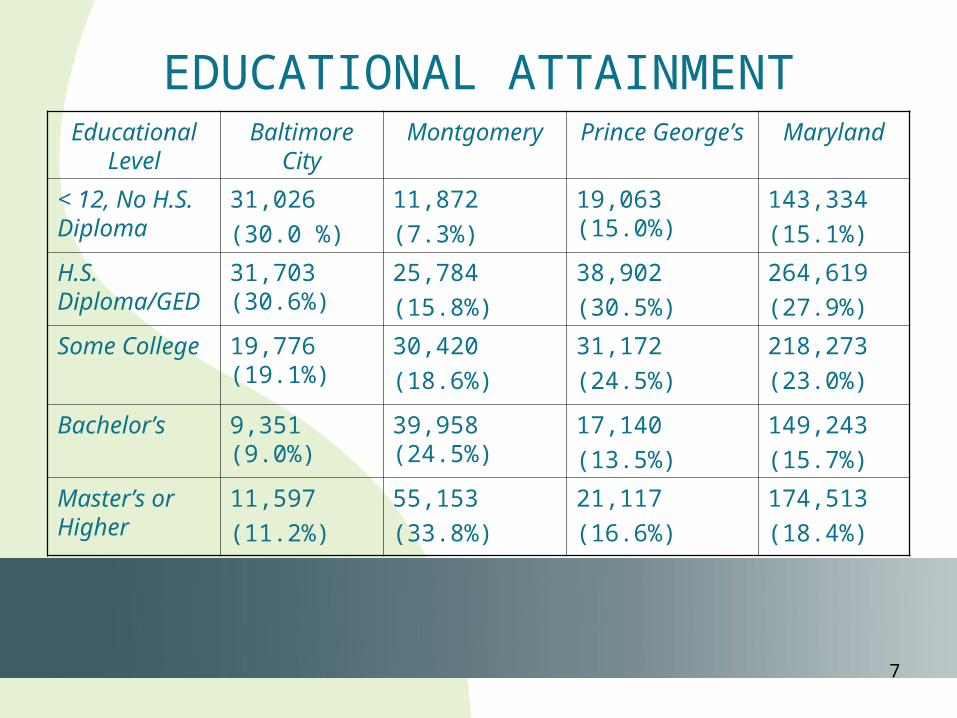
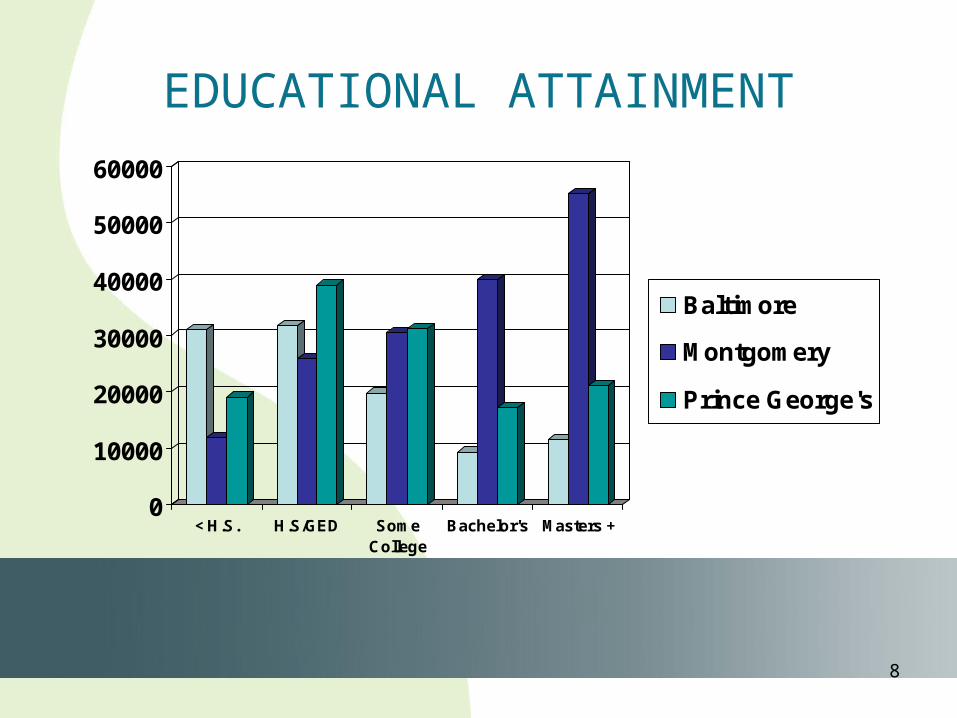
EDUCATIONAL ATTAINMENTEducational
LevelBaltimore
CityMontgomery Prince
George’sMaryland
< 12, No H.S. Diploma
31,026 (30.0 %)
11,872 (7.3%)
19,063(15.0%)
143,334(15.1%)
H.S. Diploma/GED
31,703 (30.6%)
25,784(15.8%)
38,902(30.5%)
264,619(27.9%)
Some College
19,776 (19.1%)
30,420(18.6%)
31,172(24.5%)
218,273(23.0%)
Bachelor’s 9,351 (9.0%)
39,958 (24.5%)
17,140(13.5%)
149,243(15.7%)
Master’s or Higher
11,597(11.2%)
55,153(33.8%)
21,117(16.6%)
174,513(18.4%)
8
EDUCATIONAL ATTAINMENT
0
10000
20000
30000
40000
50000
60000
< H.S. H.S/GED SomeCollege
Bachelor's Masters +
Baltimore
Montgomery
Prince George's

9
ANNUAL MEAN EARNINGSEducational
LevelBaltimore
CityMontgomery Prince
George’sMaryland
< 12, No H.S. Diploma
$6,108(17.0%)
$10,687(12.2%)
$9,700(14.7%)
$9,058(13.9%)
H.S. Diploma/GED
$13,134(36.5%)
$18,978(21.7%)
$20,162(30.6%)
$17,130(26.3%)
Some College
$19,246(53.4%)
$34,961(39.9%)
$28,616(43.5%)
$27,914(42.9%)
Bachelor’s $36,306(100.8%)
$47,953(54.7%)
$36,138(54.9%)
$44,521(68.3%)
Master’s or Higher
$47,345(131.4%)
$80,970(92.4%)
$56,290(85.5%)
$66,543(102.2%)
**Percentages are of each jurisdiction’s 2006 median household income (Baltimore - $36,031, Montgomery - $87,624, Prince George’s - $65,861, and Maryland - $65,144). **

10
ANNUAL MEAN EARNINGS
0100002000030000400005000060000700008000090000
Income
< H.S. SomeCollege
Masters +
Baltimore
Montgomery
Prince George's
11
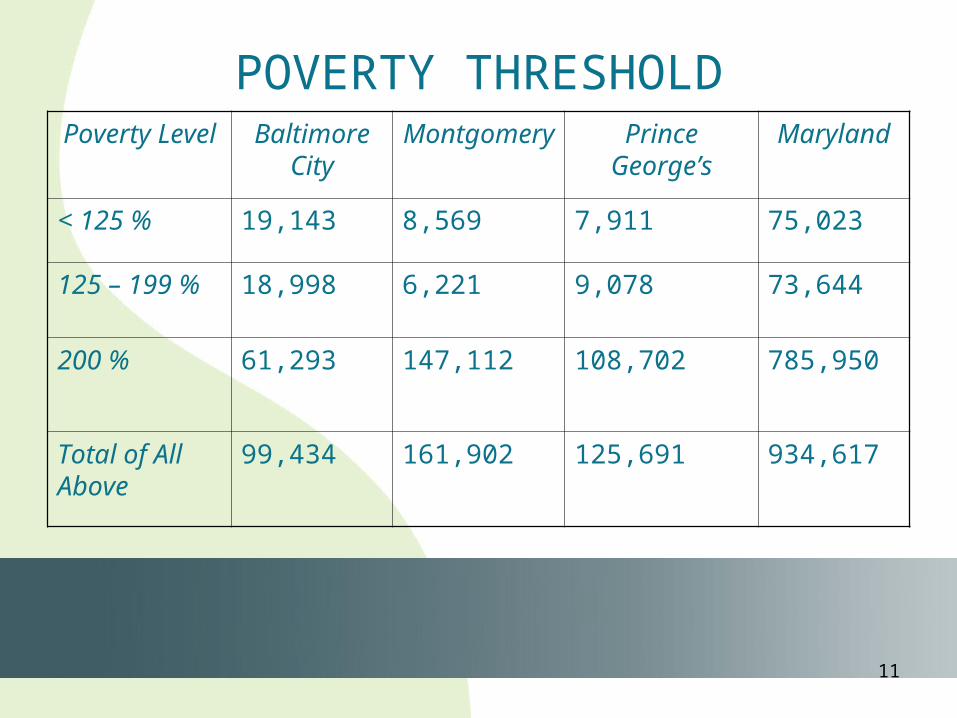
POVERTY THRESHOLDPoverty Level
Baltimore City
Montgomery
Prince George’s
Maryland
< 125 % 19,143 8,569 7,911 75,023
125 – 199 %
18,998 6,221 9,078 73,644
200 % 61,293 147,112 108,702 785,950
Total of All Above
99,434 161,902 125,691 934,617

12
POVERTY/LOW-INCOME DATA
Level Baltimore City
Montgomery
Prince George’s
Maryland
Poor 13.4% 4.1% 4.4% 5.5%
Near Poor (150%)
18.5% 5.3% 6.2% 7.9%
Low Income
36.9% 9.1% 13.3% 15.6%

13
LABOR FORCE PARTICIPATION
Baltimore City
Montgomery
Prince George’
s
Maryland
All 39.7% 61.8% 56.2% 52.9%
Male 39.4% 70.4% 62.4% 58.8%
Female 40.0% 54.1% 51.2% 47.8%
14
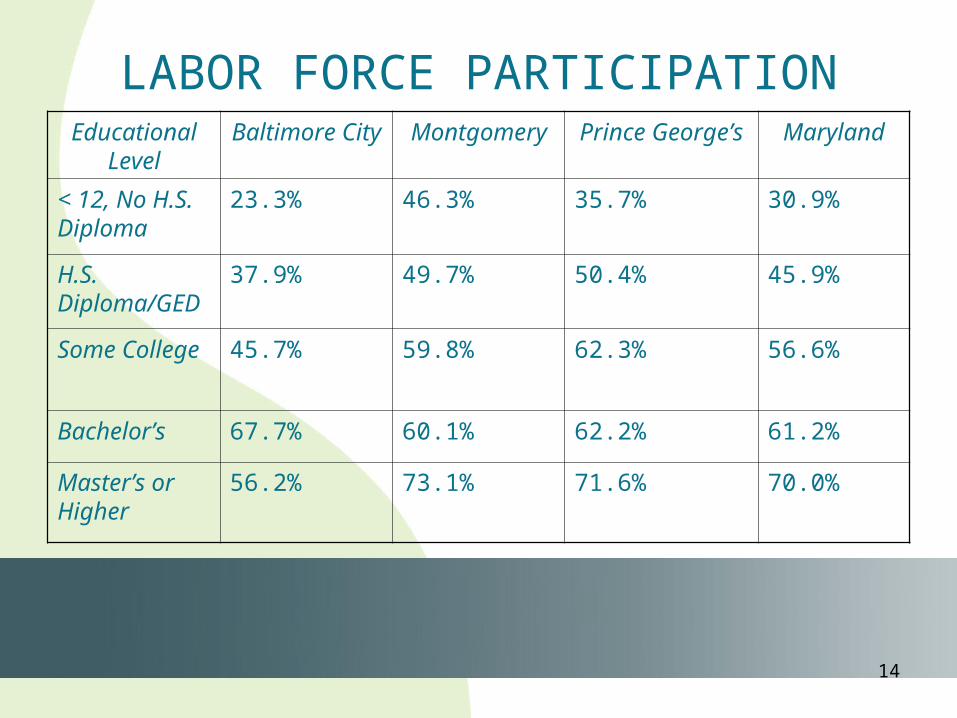
LABOR FORCE PARTICIPATIONEducational
LevelBaltimore
CityMontgomery Prince
George’sMaryland
< 12, No H.S. Diploma
23.3% 46.3% 35.7% 30.9%
H.S. Diploma/GED
37.9% 49.7% 50.4% 45.9%
Some College
45.7% 59.8% 62.3% 56.6%
Bachelor’s 67.7% 60.1% 62.2% 61.2%
Master’s or Higher
56.2% 73.1% 71.6% 70.0%

15
UNEMPLOYMENT RATES
Age Level
Baltimore City
(10.7%)
Montgomery (4.0%)
Prince George’
s(6.8%)
Maryland (5.3%)
55 - 64 6.5% 3.5% 4.4% 3.3%
64 - 74 6.3% 1.3% 2.4% 3.1%
74 + 0.0% 0.0% 2.5% 1.3%
**It is important to note that unemployment statistics only count individuals who are collecting federal Unemployment Insurance (UI) benefits. Once UI expires, a person drops of the unemployment rolls, but could very well still be out of work.**

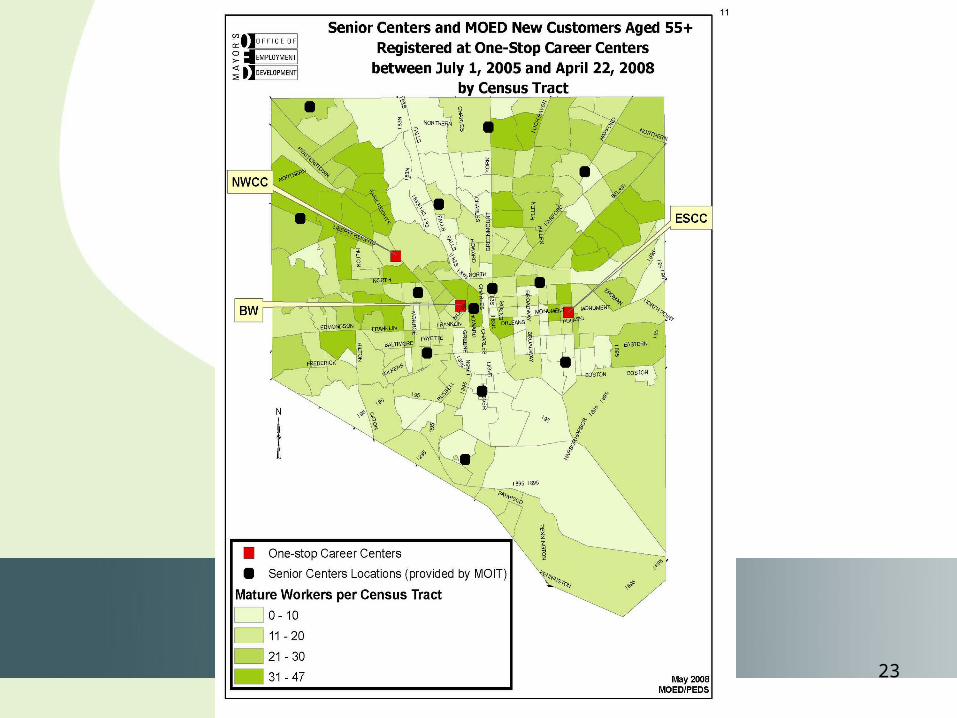
16
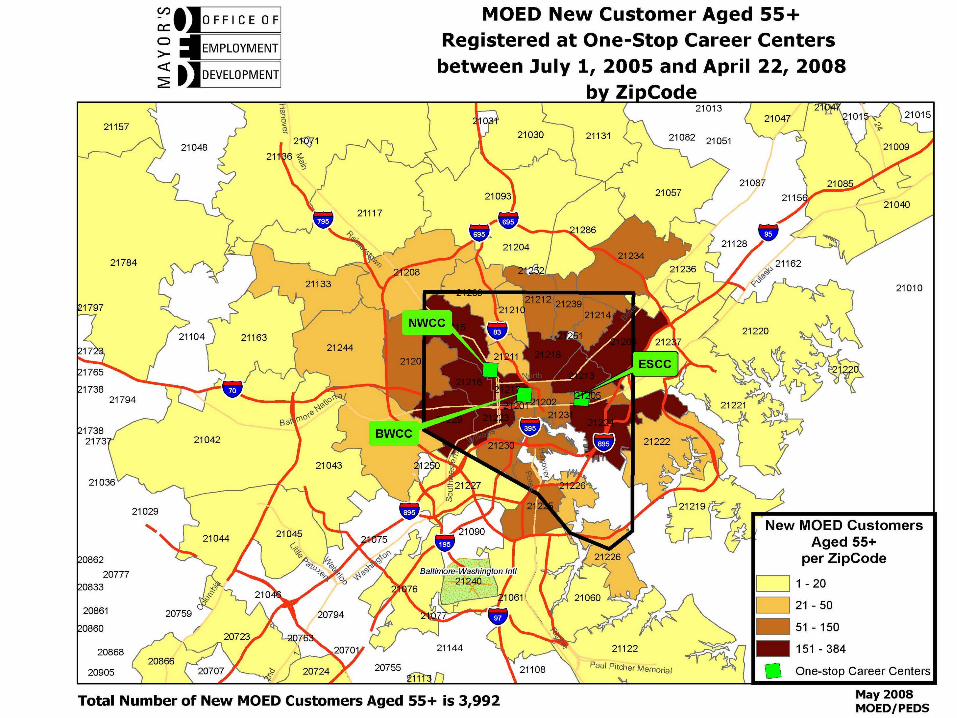
Mature Workers Served By
MOED

17
MATURE WORKERS SERVED BY MOED
FY 2005 FY 2006
FY 2007
FY 2008 (up to 3Q
2008)
% Change (05 – 07)
Total Pre-Registered Customers
14,881 15,350 18,515 13,909 24.4%
Number of Pre-Registered Customers, Age 55+
1,042 (7%)
1,228 (8%)
1,666 (9%)
1,391(10%)
59.9%

18
MATURE WORKERS SERVED BY MOED
Gender: Male – 52% Female – 48%
Age: 55 – 61 – 72%62 – 70 – 22%71 – 80 – 5%81 + – 1%
Employment Status: Employed – 10% Not Employed –
90%

19
EDUCATIONAL ATTAINMENTEducational Level MOED Customers,
55+MOED Customers,
All Ages
< 12, No H.S. Diploma
18% 21%
H.S. Diploma/GED 42% 48%
Vo-Tech or Prof. Certification
1% 2%
Some College 14% 12%
Associate 5% 3%
Vocational/Technical
3% 4%
Bachelor’s 9% 5%
Master’s or Higher 5% 1%

20

21
22
23

24
Concluding Remarks• Overall, Baltimore’s mature workers confront
the same set of challenges faced by all city residents (low income levels, limited educational attainment, lack of employment).
• In general, however, the mature workers who utilize MOED’s services exhibit greater stability in each of these areas.
25
Concluding Remarks• This statistical assessment provides us with a
firm foundation for future research into employment issues facing mature workers.
• Going forward, the Mature Worker Task Force plans on conducting surveys with businesses (including BWIB member firms), and select groups of mature workers.
• These surveys will investigate the needs of these respective populations, vis-à-vis mature work employment development.
• Questions or Comments?

26