)1 colonized african mountains along two fronts in sweet
TRANSCRIPT
1
Sweet vernal grasses (Anthoxanthum) colonized African mountains along two fronts in 1
the Late Pliocene, followed by secondary contact, polyploidization and local extinction in 2
the Pleistocene 3
4
5
Felly Mugizi Tusiime 1, 2
, Abel Gizaw2, 3
, Tigist Wondimu2, 3
, Catherine Aloyce Masao2, 4
, 6
Ahmed Abdikadir Abdi2, 5
, Vincent Muwanika1, Pavel Trávníček
6, Sileshi Nemomissa
3, 7
Magnus Popp2, Gerald Eilu
1, Christian Brochmann
2# and Manuel Pimentel
2, 7# 8
9
1School of Forestry, Geographical and Environmental Sciences, Department of Forestry, 10
Biodiversity and Tourism, Makerere University, P.O. Box 7062 Kampala, Uganda; 2Natural 11
History Museum, University of Oslo, PO Box 1172 Blindern, NO-0318 Oslo, Norway; 12
3Department of Plant Biology and Biodiversity Management, Addis Ababa University, P. O. 13
Box 3434 Addis Ababa, Ethiopia; 4Sokoine University of Agriculture, Department of Forest 14
Biology, P.O. Box 3010, Morogoro, Tanzania; 5National Museums of Kenya, P. O. Box 15
40658-00100 Nairobi, Kenya; 6Institute of Botany, Department of Flow Cytometry, CZ-252 16
43 Průhonice, Czech Republic; 7
CICA, Centro de Investigacións Científicas Avanzadas, 17
Universidade da Coruña, Galicia, Spain. 18
19
Keywords: Africa, colonization, hybridization, polyploidization, tropical-alpine 20
21
*For correspondence: Manuel Pimentel. 7CICA, Centro de Investigacións Científicas 22
Avanzadas, Universidade da Coruña, Galicia, Spain; mailto: [email protected]; telephone: 23
0034 981167000. Fax: 0034 981167065. 24
25
Running title: Grass jumping across the African sky islands 26
27
# shared senior authorship 28
29
30
2
Abstract 31
High tropical mountains harbor remarkable and fragmented biodiversity thought to a large 32
degree to have been shaped by multiple dispersals of cold-adapted lineages from remote 33
areas. Few dated phylogenetic/phylogeographic analyses are however available. Here we 34
address the hypotheses that the sub-Saharan African sweet vernal grasses have a dual 35
colonization history and that lineages of independent origins have established secondary 36
contact. We carried out range-wide sampling across the eastern African high mountains, 37
inferred dated phylogenies from nuclear ribosomal and plastid DNA using Bayesian methods, 38
and performed flow cytometry and AFLP (Amplified Fragment Length Polymorphism) 39
analyses. We inferred a single Late Pliocene Eurasian origin of the eastern African taxa. The 40
putative dodecaploid populations in one mountain group formed a distinct phylogeographic 41
group and carried plastids that diverged from those of the currently allopatric southern 42
African lineage in the Mid- to Late Pleistocene. We show that Anthoxanthum has an 43
intriguing history in sub-Saharan Africa, including Late Pliocene colonization from southeast 44
and north, followed by secondary contact, hybridization, allopolyploidization, and local 45
extinction during one of the last glacial cycles. Our results add to a growing body of evidence 46
showing that isolated tropical high mountain habitats have a dynamic recent history involving 47
niche conservatism and recruitment from remote sources, repeated dispersals, diversification, 48
hybridization, and local extinction. 49
50
51
52
53
3
Introduction 54
High tropical mountains house exceptional ecosystems with remarkable biodiversity, peculiar 55
life forms and high levels of endemism (Gehrke & Linder 2014; Merckx et al. 2015), but our 56
knowledge of the temporal and geographical origin and evolution of this diversity is limited. 57
The highest peaks are inhabited by organisms adapted to extreme conditions such as nightly 58
frosts and constitute highly fragmented ‘sky archipelagos’ interrupted by tropical lowland 59
biotas. The upper parts of high tropical mountains appear to have been mostly colonized by 60
long-distance dispersed organisms that already had been cold-adapted in remote areas of the 61
world (Hedberg 1970, 1992; von Hagen & Kadereit 2001; Bell & Donoghue 2005; Assefa et 62
al. 2007; Ehrich et al. 2007; Popp et al. 2008; Gehrke & Linder 2009; Merckx et al. 2015; 63
Gizaw et al. 2016a). The patterns of recruitment of these long-distance dispersers are still 64
poorly known (Gehrke & Linder 2009), but their high degree of endemicity has been used to 65
suggest that they arrived to the tropics a long time ago (Hedberg, 1961). New evidence, 66
however, points to a relatively recent origin of tropical-alpine lineages (Pliocene-Pleistocene; 67
Linder 2014; Hughes & Atchison 2015; Merckx et al. 2015; Hughes 2016 but see Gizaw et al. 68
2016a), but only few dated phylogenies are available. 69
The high mountain systems in eastern Africa (i.e. East Africa and Ethiopia) provide an 70
excellent model for the study of biogeographical questions such as colonization processes and 71
routes, the role of climatic refugia in the preservation of genetic diversity, and the role of gene 72
flow, hybridization and polyploidization in an extremely fragmented system (Sklenář et al. 73
2014; Wondimu et al. 2014; Gizaw et al. 2016b). Most of these mountains emerged in 74
connection with the tectonic activity forming the East African Rift System (EARS; Baker et 75
al. 1972; Ebinger et al. 2000), consisting of one western and one eastern branch, the latter 76
extending through East Africa to Ethiopia. With a few exceptions such as Mt Ruwenzori, 77

4
which is a block mountain that emerged 8-3 million years ago (Mya), the mountains have 78
volcanic origins and vary considerably in age (Gehrke & Linder 2014). Most formed during 79
the Late Miocene to the Pleistocene, with the Ethiopian mountains (>40-7 Mya) and Mt Elgon 80
being the oldest (23-12 Mya), and Mt Kilimanjaro (2.5-1 Mya) and Mt Meru (2.0-0.06 Mya) 81
among the youngest (Gehrke & Linder 2014). 82
The alpine vegetation in eastern Africa mainly consists of endemic species (~80% in vascular 83
plants; Hedberg 1957, 1969; Gehrke & Linder, 2014). Some endemics occur exclusively in a 84
single mountain, but many of them are found along both branches of the Rift Valley and both 85
in East Africa and Ethiopia, demonstrating that widespread intermountain dispersal has taken 86
place after initial colonization of the region. The afro-alpine plant communities are mostly 87
composed of C3 taxa that appear to have their closest relatives in montane and alpine areas in 88
southern Africa, Eurasia and even the Americas, rather than in the surrounding afro-tropical, 89
often C4-dominated plant communities (Hedberg 1970, 1992; Assefa et al. 2007; Ehrich et al. 90
2007; Popp et al. 2008; Gehrke & Linder 2009; Sikolia et al. 2009; Pimentel et al. 2013; 91
Gehrke et al. 2016; Gizaw et al. 2016a). 92
A central question is whether the frost-tolerant plant lineages inhabiting the eastern African 93
mountains colonized the mountains as soon as they formed, which could help explaining the 94
high degree of afro-alpine endemism (cf. Hedberg 1961), or whether the initial colonization of 95
these mountains primarily was facilitated by the Plio-Pleistocene climatic oscillations (e.g. 96
Assefa et al. 2007). The dated phylogenies available do not point to a single answer. Arabis 97
alpina was inferred to have colonized eastern Africa twice in the Pleistocene (Koch et al. 98
2006), and afro-alpine Alchemilla also appear to have evolved during the Pleistocene (Gehrke 99
et al. 2016). Late Pliocene Eurasian origin was inferred for the afro-alpine Anthoxanthum 100
nivale K.Schum. (Pimentel et al. 2013). A few broader phylogenies dated using fossil-101

5
calibrated clocks have included at least one species occurring at high altitudes in eastern 102
Africa, with origins ranging from the Miocene to the Pleistocene (Antonelli 2009; Jabbour & 103
Renner 2012; Nürk et al. 2015; Gizaw et al. 2016a). 104
Although some lineages apparently colonized the first eastern African mountain from remote 105
areas several millions of years ago, subsequent colonization of other mountains may have 106
happened much later and/or repeatedly. In Lychnis, we estimated that several species 107
originated in the Late Pliocene, but the terminal branches within species were often short, 108
indicating that the contemporary populations in many mountains result from recent 109
colonization (within the last 0.3 Myr; Gizaw et al. 2016a). In some species, it appears that a 110
single Ethiopian population may have been the source for colonization of remote mountains in 111
East and even West Africa during the last glacial cycles of the Pleistocene. A similar pattern 112
with old (Miocene) species but recent (Pleistocene) intraspecific divergence has also been 113
demonstrated in an afro-montane forest species (Canarina eminii; Mairal et al. 2015). Such 114
patterns can be explained by extinction of intermediate populations (Antonelli & Sanmartin 115
2011; Mairal et al. 2015). Thus, it is possible that the eastern African mountains have 116
experienced cycles of colonization, extinction, and recolonization of the same species during 117
the Pleistocene climatic oscillations, and that many contemporary populations are recent re-118
colonists. Recent phylogeographic studies also suggest that afro-alpine species have a 119
dynamic history involving intermountain divergence, repeated long-distance dispersals and 120
hybridization, but the inferred histories differ considerably from species to species and among 121
different mountains (Gizaw et al. 2013, 2016b; Masao et al. 2013; Wondimu et al. 2014). 122
Detailed studies of more plant groups that are suspected to have diverged at different times 123
and with different biogeographic affinities are needed to better understand the history of the 124
enigmatic afro-alpine habitat. Here we aim to reconstruct the history of the sub-Saharan sweet 125
6
vernal grasses (Anthoxanthum L.; Fig. 1a) by constructing dated phylogenies coupled with a 126
phylogeographic analysis of the eastern African populations. Our preliminary analyses 127
suggested that the sub-Saharan Anthoxanthum entered Africa at least twice in the Late 128
Pliocene, once to southern Africa from Southeast Asia (section Ataxia), and at least once to 129
eastern Africa from Eurasia (section Anthoxanthum; Pimentel et al. 2013). Two species of 130
Anthoxanthum occur in eastern Africa, the East African endemic A. nivale and the Ethiopian 131
endemic Anthoxanthum aethiopicum I.Hedberg. However, only two specimens from one 132
population of A. nivale and none of A. aethiopicum were included in our previous study. 133
Anthoxanthum nivale occurs in most East African mountains on moist ground in grassland 134
and moorland between 2400 and 4800 m (Fig. 1b; Clayton 1970). Two cytotypes are known, 135
tetraploids with 2n = 4x = 20 and dodecaploids with 2n = 12x = 60 (Hedberg 1957, 1976). 136
Anthoxanthum aethiopicum is tetraploid and only known from a few moist sites between 2700 137
and 4500 m in the Bale and Arsi Mountains (Hedberg 1976, Phillips 1995). 138
Here we address the origin and evolution of the sub-Saharan African Anthoxanthum by 139
including the Ethiopian A. aethiopicum and by extending our sampling of the East African A. 140
nivale to represent its entire distribution area. In particular, we address whether the eastern 141
African (i.e. East African and Ethiopian) sweet vernal grasses have been in secondary contact 142
with the southern African lineage of the genus, because both northern and southern affinities 143
have been suggested for A. nivale based on morphology. It has been suggested to be most 144
closely related to A. aethiopicum and European plants of the Anthoxanthum odoratum L. s.l. 145
complex (Hedberg 1976; Phillips 1995), whereas Clayton (1970) reported it as 146
morphologically variable with some specimens resembling the southern African endemic 147
Anthoxanthum ecklonii Stapf. (section Ataxia), which extends northwards to Malawi (Fig. 1a). 148
In addition, the occurrence of two cytotypes in A. nivale raises the intriguing possibility that 149
7
the two independently immigrated and currently allopatric lineages of sub-Saharan 150
Anthoxanthum once have been in secondary contact, resulting in hybridization and 151
polyploidization. To address these hypotheses we carried out range-wide field sampling 152
across the eastern African high mountains, sequenced nuclear ribosomal (ITS, ETS) and 153
plastid (trnT-L, trnL-F) DNA, reconstructed dated phylogenies using Bayesian methods, and 154
performed flow cytometry and AFLP (Amplified Fragment Length Polymorphism) analyses. 155
156
8
Materials and Methods 157
Plant materials 158
We sampled 35 Anthoxanthum nivale populations (150 plants; Fig. 1a,b; Appendix 1) from 159
seven mountains/mountain systems in Uganda, Kenya and Tanzania. Because we found 160
strong genetic differentiation between one eastern and one western mountain group, we will 161
refer to ‘eastern A. nivale’ as the populations occurring on the four mountains east of the 162
eastern branch of the Rift Valley (Mt Meru, Mt Kilimanjaro, Mt Aberdare, Mt Kenya), and 163
‘western A. nivale’ as the populations occurring on Mt Elgon west of the eastern branch and 164
on two mountains along the western branch (Mt Ruwenzori, Mt Muhavura). The sampling 165
covered the total distribution range of the species except for three small areas close to the 166
sampled mountains (Hedberg 1957, Clayton 1970). Five (if possible) plants separated by at 167
least 10 m were sampled to represent one population. Fresh leaf tissue was dried and three of 168
the plants were pressed and deposited in the following herbaria: one at the National 169
Herbarium of Ethiopia, Addis Ababa University, Ethiopia (ETH); one at the Natural History 170
Museum, University of Oslo, Norway (O); and one in the country of collection: East African 171
Herbarium, National Museum of Kenya, Nairobi, Kenya (EAH); National Herbarium of 172
Tanzania, Arusha, Tanzania (NHT); or Makerere University Herbarium, Kampala, Uganda 173
(MHU). We were not able to find any Anthoxanthum aethiopicum plants in the field. Thus, 174
this species could not be included in the AFLP or flow cytometry analyses, but we used three 175
samples from the Uppsala University Herbarium (UPS) successfully for DNA sequencing. 176
Flow cytometry 177
All silica-dried A. nivale samples were analysed using flow cytometry. Five plants were 178
analysed twice to check for errors. DNA ploidy level and relative nuclear DNA-content of 179
9
somatic cells were determined following Schönswetter et al. (2007a). Bellis perennis L. (2C = 180
3.38 pg; Schönswetter et al. 2007b) was used as an internal standard. Fluorescence intensity 181
was measured following the modified two-step Otto procedure of Suda and Trávníček (2006). 182
The relative fluorescence intensity of at least 5000 DAPI-stained particles was estimated 183
using a Partec PA II flow cytometer (Partec GmbH, Münster, Germany) equipped with a 184
HBO-100 mercury arc lamp. Results were expressed as high-resolution histograms of 185
fluorescence intensity. We were not able to obtain chromosome numbers for our samples (the 186
seeds did not germinate despite several attempts). We divided the data into different DNA-187
content groups (Supporting Information Figs. S1, S2) which likely represent different ploidy 188
levels. Differences between groups were tested using a univariate analysis of variance 189
(ANOVA). Statistical analyses were conducted using IBM SPSS (IBM, Armonk, USA). 190
DNA extraction 191
Total genomic DNA was extracted from the silica-dried leaves of A. nivale using an 192
automated GeneMole® robot and the MoleStrips
TM DNA Plant Kit following the 193
manufacturer’s protocol (Mole Genetics AS, Lysaker, Norway). About 1 cm2 leaf tissue was 194
ground in 2.0 ml crushing tubes with two tungsten carbide beads for 4 min at 23 Hz in a mixer 195
mill (MM301, Retsch® GmbH & Co., Haan, Germany). DNA from the herbarium material of 196
A. aethiopicum was extracted using the DNAeasy Plant Extraction Kit (Qiagen, Hilden, 197
Germany) using the manufacturer’s protocol. The quality of the extracted DNA was checked 198
on 1% TBE-agarose gels and DNA was quantified using an UV-Vis spectrophotometer 199
(Nanodrop, ThermoScientific, Wilmington, USA). 200
DNA sequencing and sequence alignment 201
10
For A. nivale, 1-3 plants from each of 17 populations representing its entire distribution range 202
were selected for sequencing (Appendix 2). For A. aethiopicum, we obtained DNA sequences 203
from all three available herbarium specimens. Amplification and sequencing of the four DNA 204
regions (internal transcribed spacer, ITS, and external transcribed spacer, ETS of nuclear 205
rDNA, and trnL-F and trnT-L of plastid DNA) followed Pimentel et al. (2013). Because we 206
did not observe multiple bands for ITS or ETS in any accessions, no cloning was conducted. 207
A total of 96 new sequences were generated for this study (27 ETS, 24 ITS, 24 trnL-F and 22 208
trnT-L; Appendices 2, 3). We also included sequences from 16 Anthoxanthum and Hierochloë 209
R.Br. specimens from Pimentel et al. (2013), including representatives of southern African 210
species. Nine additional sequences representing the main lineages in the subfamily Pooideae 211
were retrieved from GenBank and used as outgroups (Appendix 3). The DNA regions were 212
separately aligned using the MUSCLE algorithm (Edgar, 2004) as implemented in the 213
software SeaView v4 (Gouy et al. 2010) and manually adjusted. Indels were excluded from 214
all analyses. 215
Phylogenetic analyses and dating 216
We conducted Bayesian analyses using MrBayes v. 3.2.5 (Huelsenbeck & Ronquist 2001). 217
The GTR+I+G substitution model was selected based on MrModelTest v. 2.3 (Nylander, 218
2004); indels were not coded. The plastid and nuclear datasets were analyzed separately for 219
15000000 generations (25% burn-in) with sampling every 1000 generations and allowing the 220
program to estimate the likelihood parameters required. We assessed convergence using (i) 221
the ‘compare’ function in the online application AWTY (Nylander et al. 2008) and (ii) 222
TRACER v.1.5 (with the Effective Sample Size-ESS >200 for all parameters; Rambaut & 223
Drummond 2007). Results collected prior to stationarity were discarded as burn-in. Results 224
were presented as majority rule posterior probability consensus trees, summarised using 225
11
MrBayes. Indels were coded following the simple method by Simmons & Ochoterena (2000) 226
and all phylogenetic analyses were conducted with and without considering the indels. No 227
improvement in posterior probability support was obtained when indels were included so they 228
were eliminated from the final analyses. 229
Bayesian divergence date analyses were conducted on the nuclear and plastid data sets using 230
BEAST v. 1.8.1 (Drummond et al. 2012). Samples for which not all DNA regions had been 231
successfully sequenced were excluded from this analysis. Input data for BEAST were 232
compiled using BEAUTI v.1.7.2, and the strict clock was selected for all analyses following 233
Drummond & Bouckaert (2015). A multispecies coalescence model as implemented in 234
*BEAST (Heled & Drummond 2010) was applied since most species were represented by 235
more than one sample. Other model priors were set as follows: (i) the date of divergence 236
between tribe Meliceae and tribes Brachypodieae + Aveneae/Poaeae + Triticeae, normal prior 237
distribution with mean 32.1 million years (My) and standard deviation 3.65; (ii) the date of 238
divergence between tribes Aveneae/Poaeae and Triticeae, normal prior distribution with mean 239
23.4 My and standard deviation 3.10, and (iii) log-normal distributions and broad ranges 240
spanning all biologically realistic values were established for substitution rates following 241
Drummond & Bouckaert (2015). All secondary calibration ages (mean and standard 242
deviation) were taken from Vicentini et al. (2008). 243
In the *BEAST analyses, a first test was conducted giving all A. nivale sequences the same 244
taxonomic label, disregarding the geographic origin or their position in the plastid vs nuclear 245
trees. Next, multi-labelled specimen trees were built in order to unravel the origin of the 246
progenitor lineages of clades putatively affected by reticulation processes (Pirie et al. 2009; 247
Popp et al. 2011; Blanco-Pastor et al. 2012). In this approach, species trees were 248
reconstructed by assigning unique taxon labels to plastid and nuclear sequences from samples 249
12
that displayed incongruence between the plastid and nuclear phylogeny and therefore were 250
suspected to be putative hybrids. “N” and “P” were added to the names of nuclear and plastid 251
sequences, respectively, thus treating plastid and nuclear sequences as belonging to different 252
taxa. The matrices were balanced by inserting “empty taxa” for uniquely labelled entries. 253
Thus, each sequence in the nuclear matrix labelled “N” had a corresponding entry consisting 254
of missing data labelled “N” in the plastid matrix, and each sequence in the plastid matrix 255
labelled “P” had a corresponding entry consisting of missing data labelled “P” in the nuclear 256
matrix (Pirie et al. 2009; Blanco-Pastor et al. 2012). Three MCMC analyses were run for 15 x 257
107 generations each with a sample frequency of 1 x 10
4. One extra analysis was run for 5 x 258
107 generations without data to test the influence of priors on posterior values following 259
Heled & Drummond (2010). Log files were analysed using TRACER v1.5 to assess 260
convergence. Maximum credibility trees were built using TreeAnnotator v.1.7.2 (Drummond 261
& Rambaut, 2007). 262
Phylogenetic conflict analysis 263
Conflict between nuclear and plastid trees was assessed by comparing nodes with posterior 264
probability support (PPS) ≥0.8 and illustrated by means of a tanglegram of the Bayesian 265
consensus trees using Dendroscope 3 (Huson & Scornavacca 2012). We used coalescent 266
simulations in Mesquite (Maddison & Maddison 2009) in order to test whether gene tree 267
differences could be explained by coalescent stochasticity (Maureira-Butler et al. 2008; 268
Mugrabi de Kuppler et al. 2015). This method assumes (i) known clade ages (ultrametric, 269
time calibrated trees), (ii) constant generation time and effective population size, and (iii) 270
panmixis within populations (Mugrabi de Kuppler et al. 2015). Two alternative species trees 271
(plastid and nuclear) were constructed representing the two phylogenetic hypotheses for A. 272
nivale by pruning the multilabelled Bayesian species tree built with *BEAST. Each species 273
13
was reduced to a single accession and all samples labelled as plastid were pruned from the 274
nuclear species tree and vice versa. Only Helictotrichon was kept as outgroup. Two 275
corresponding gene trees were also built from the multilabelled gene trees keeping all ingroup 276
accessions and Helictotrichon (samples labelled as plastid were pruned from the nuclear gene 277
tree and vice versa). Terminals were pruned using the R-based package APE v. 2.7-3 (Paradis 278
et al. 2004) and the pruned trees were re-scaled using Mesquite. Divergence times were 279
translated from millions of years to generations assuming a generation time of 1 year for A. 280
nivale and A. aethiopicum, because closely related species such as A. odoratum and 281
Anthoxanthum amarum Brot. usually flower in the first year (M. Pimentel, pers. obs.). We 282
used the “Coalescent Contained within Current Tree” module of Mesquite to simulate 283
samples of 1000 gene trees from the species trees and gene trees built with APE. Constant 284
effective population sizes (Ne) were assumed to range from 1 x 10⁴ to 1 x 10
6. We used the 285
partition metric (Penny & Hendy 1985) implemented in PAUP 4.0b10 (Swofford 2002) as the 286
symmetric distance to estimate the difference between the plastid and nuclear gene trees and 287
the distribution of differences between the original gene trees pruned with APE and the 288
simulated gene trees (Mugrabi de Kuppler et al. 2015). The null hypothesis of lineage sorting 289
stochasticity should be rejected when the distance between the two gene trees is higher than 290
95% of the distribution of tree to tree differences of simulated trees from their respective gene 291
trees (Maureira-Butler et al. 2008). 292
AFLP analysis of A. nivale 293
AFLP fingerprinting followed Gaudeul et al. (2000). A preliminary test was conducted using 294
15 primer combinations and 16 plants representing all mountains. Three primer combinations 295
were selected for final analysis: [6-FAM (EcoRI-AGA/ MseI -CCG), VIC (EcoRI-AGG/ MseI 296
-CTG) and NED (EcoRI-ACC/ MseI -CAT)]. A total of 126 plants were retained in the AFLP 297
14
matrix after removal of samples that did not amplify (Fig. 1a,b; Appendix 1). For each 298
sample, 2.0 μl 6-FAM, 2.0 μl VIC and 3.0 μl NED labelled selective PCR products were 299
mixed with 11.7 μl formamide and 0.3 μl GeneScan ROX internal lane size standard (Applied 300
Biosystems, Foster City, USA) and run on an ABI 3100 sequencer (Applied Biosystems, 301
Foster City, USA). Thirteen samples (~10%) were duplicated (i.e. DNA extracted twice) for a 302
reproducibility test (Bonin et al. 2004). Data analysis and scoring were conducted following 303
Masao et al. (2013). 304
The final AFLP data matrix was transformed using the R-script AFLPdat (Ehrich, 2006). 305
Genetic diversity (calculated as percentage of polymorphic markers; %PL), Nei’s average 306
gene diversity (D; Nei 1987; Kosman 2003), and Nei’s unbiased expected heterozygosity (He; 307
Nei 1987; Gaudeul et al. 2000) were estimated using Arlequin v.3.5 (Excoffier & Lischer 308
2010). Genetic rarity was calculated as down-weighed marker values (DW) following 309
Schönswetter and Tribsch (2005) with modifications implemented in AFLPdat (Ehrich 2006). 310
We calculated pairwise genetic similarity among AFLP phenotypes using Dice coefficient in 311
NTSYSpc v.2.11a (Rohlf 2002), visualized using Principal Coordinate Analyses (PCoAs). A 312
Neighbor Joining (NJ) tree was constructed based on Nei & Li’s (1979) genetic distance using 313
the software TREECON 1.3b (Van-de-Peer & De-Wachter 1994). The tree was midpoint 314
rooted and support for branches was estimated from 1000 bootstrap replicates. 315
Genetically homogenous groups were inferred from Bayesian clustering analysis using 316
STRUCTURE version 2.3.3 (Pritchard et al. 2000). We used the recessive allele model taking 317
into account the dominant nature of AFLP markers (Falush et al. 2007). Both the admixture 318
and the non-admixture models with uncorrelated allele frequencies were tested. Based on the 319
result of the preliminary analysis we selected the admixture model with correlated allele 320
frequencies for the final analysis. The analyses were performed at the Lifeportal, University 321
15
of Oslo (http://www.lifeportal.uio.no) with number of genetic groups (K) ranging from 1 to 10 322
with 10 replicate runs for each K and a burn-in period of 2 x 10⁵ and 10
6 iterations. Separate 323
tests were performed for each main genetic group to assess additional structure. We used the 324
STRUCTURE-SUM R-script (Ehrich et al. 2007) to summarize the results and to infer the 325
optimal value of K based on the estimated posterior log likelihood of the data L(K), the 326
similarity among different runs for the same K (Nordborg et al. 2005), and the rate of change 327
in probability between successive runs, ΔK, as a function of K, calculated following Evanno 328
et al. (2005). The average estimate of individual admixture values among the replicated runs 329
for the selected optimal K was calculated using the program CLUMPP (Jakobsson & 330
Rosenberg 2007) and the result was visualized using the program DISTRUCT (Rosenberg 331
2004). 332
Partitioning of genetic variation in the total dataset was explored using analyses of molecular 333
variance (AMOVAs, Excoffier et al. 1992) in Arlequin version 3.5 (Excoffier & Lischer 334
2010). For each analysis, 10000 permutations were performed to assess the significance of the 335
results. Genetic differentiation was also estimated as the unbiased Fst (θw) of Weir and 336
Cockerham (1984) using the same software. The 95% confidence interval for the estimator 337
was obtained by bootstrapping 1000 replicates over loci. 338
339
16
Results 340
Nuclear DNA-content 341
The five plants duplicated in the flow cytometry analysis did not reveal any errors. A total of 342
110 samples (of 130 attempted) were successfully analysed. These were tentatively divided 343
into three DNA-content groups (G1-G3) except for ten plants that were considered as outliers 344
(Supporting Information Figs. S1, S2). The mean relative DNA content values (as compared 345
to unit value of standard plant Bellis perennis) of the three groups were significantly different 346
in the analysis of variance: G1: 1.60 ± 0.09 (7 plants), G2: 2.89 ± 0.23 (26 plants), and G3: 347
4.78 ± 0.23 (67 plants). G1 plants were rare, only occurring in the two westernmost 348
mountains, G2 plants occurred in all three western mountains, and G3 plants were restricted 349
to the four eastern mountains (Fig. 1b). 350
Phylogenetic reconstruction, divergence dating and phylogenetic conflict analysis 351
We obtained congruent topologies for the two plastid markers and for the two nuclear 352
markers, but conflict between the plastid and nuclear topologies affecting section Ataxia 353
(Pimentel et al. 2013) and the eastern high polyploid A. nivale. The plastid and nuclear 354
datasets were therefore not combined. The aligned plastid DNA matrix comprised 43 355
terminals (Appendices 2, 3) and 1851 characters (1-1094, trnL-F; 1095-1851, trnT-L). 356
Monophyly was rejected for A. nivale in the plastid tree (Fig. 2). Two major plastid clades 357
were recovered. One contained the western low-ploid (DNA-content groups G1 and G2) 358
samples of A. nivale together with A. aethiopicum and the European species A. alpinum and A. 359
odoratum. The other major clade contained the eastern high-ploid (G3) samples of A. nivale 360
together with the southern African. 361
17
The aligned nuclear DNA matrix included 42 terminals (Appendix 1) and 1385 characters (1-362
747, ETS; 748-1385, ITS). In the nuclear tree, the southern African species formed a group 363
sister to all eastern African (A. nivale and A. aethiopicum) and European accessions (Fig. 3). 364
The eastern African accessions formed a fully supported subclade as sister to a poorly 365
supported group consisting of the European species A. alpinum and A. odoratum. 366
Anthoxanthum aethiopicum was recovered as a monophyletic group in a trichotomy with the 367
two fully supported subclades corresponding to the western low-ploid (G1 and G2) accessions 368
and the eastern high-ploid (G3) accessions of A. nivale. 369
In the *BEAST analysis, treating plastid and nuclear sequences of the eastern A. nivale 370
accessions as different taxa resulted in a more resolved tree than when treating them as the 371
same taxon. The plastid and nuclear topologies from the *BEAST analyses (Supporting 372
Information Figs. S3, S4) were congruent with those from MrBayes (Figs. 2, 3). In the 373
multilabelled species tree (Fig. 4), the plastid sequences of the high-ploid eastern A. nivale 374
accessions were recovered in a southern African clade as sister to A. dregeanum, from which 375
they diverged in the Mid- to Late Pleistocene [mean 0.125 Mya, 95% highest posterior 376
density (HPD) 0.0-0.7 Mya; Fig. 4, A]. In contrast, the nuclear sequences of these eastern A. 377
nivale accessions were recovered in a fully supported clade with all other A. nivale and A. 378
aethiopicum sequences. This eastern African clade was estimated to have diverged from its 379
European sister during the Late Pliocene (mean 2.882 Mya, HPD 2.0-3.9 Mya; Fig. 4, B). The 380
eastern accessions of A. nivale were estimated to have diverged from the western ones in the 381
Late Pliocene or Early- to Mid Pleistocene (mean 1.37 Mya, HDP 0.4-2.6 Mya; Fig. 4, C). 382
The phylogenetic conflict analysis further demonstrated the incongruence between the plastid 383
and nuclear topologies (Supporting Information Fig. S5). The coalescent simulations resulted 384
in a symmetric distance of 48 between the plastid and nuclear gene trees constructed. The null 385
18
hypothesis of lineage sorting stochasticity was rejected in all analyses with Ne below 400000 386
based on plastid data and below 250000 based on nuclear data (Fig. 5). 387
AFLP variation in A. nivale 388
The final AFLP dataset contained 424 polymorphic markers scored in 126 plants from 35 389
populations (Appendix 1). Reproducibility was 97.7%. Two genetic groups, one containing 390
all western populations (DNA-content groups G1 and G2) and one containing all eastern 391
populations (G3), were inferred in the STRUCTURE analyses (K = 2; Figs. 1b, 6; Supporting 392
Information Fig. S6). In the western group, two subgroups corresponding to the two DNA-393
content groups (G1 and G2) were inferred in separate analyses. In the eastern group, 394
subdivisions reflected geography but the optimal number of subgroups was unclear. The 395
PCoA and NJ analyses revealed a similar structuring of the dataset (Figs. 6B, 6C; Supporting 396
Information Fig. S7). The first two axes in the PCoA analysis separated the plants into three 397
distinct groups corresponding to the three DNA-content groups (Fig. 6B). The three DNA-398
content groups were also recovered in the NJ tree (Fig. 6C). 399
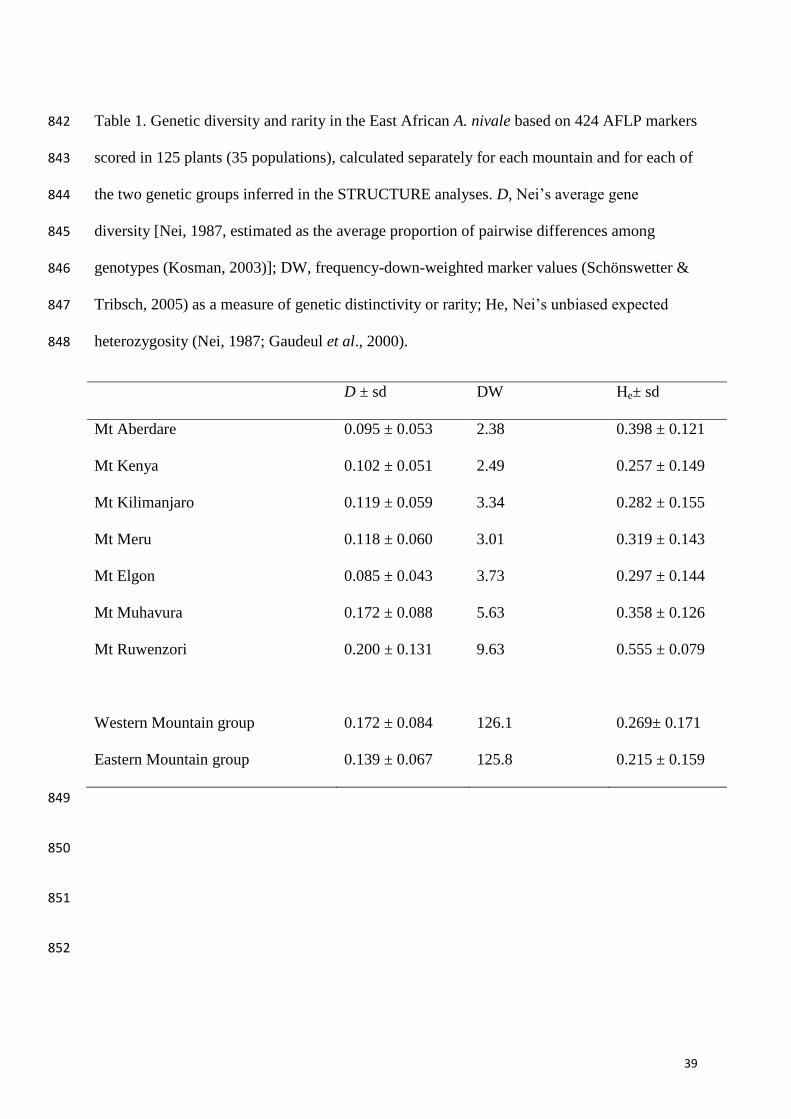
Nei’s genetic diversity (D) across all AFLP phenotypes was 0.185 ± 0.089, mean 400
heterozygosity (He) was 0.195 ± 0.162, and mean number of polymorphic loci (PL) was 401
51.2% ± 37.5%. Intrapopulation genetic diversity ranged from 0.031 to 0.190 (Appendix 1). 402
Genetic diversity (D) and rarity (DW) were highest in the two western Rift mountains 403
(Ruwenzori and Muhavura). When calculated separately for the three DNA-content groups, 404
G3 contained highest gene diversity (D = 0.139 ± 0.067; He = 0.215 ± 0.159). The combined 405
G1-G2 group had even higher diversity (D = 0.172 ± 0.084; He = 0.269 ± 0.17; Table 1). In a 406
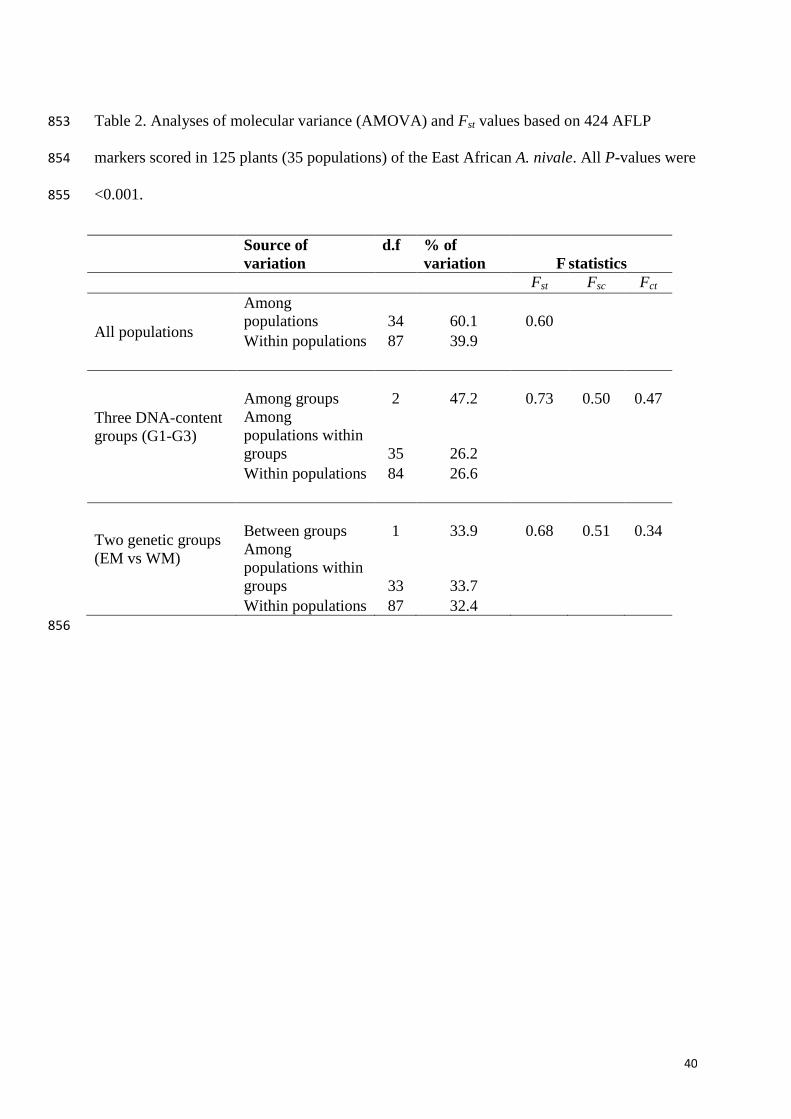
non-hierarchical AMOVA, 60% of the total AFLP variation was attributed to variation among 407
populations (Table 2). Hierarchical AMOVAs showed high variation between the two genetic 408

19
groups (33.9%, Fst = 0.509), among the three DNA-content groups (47.2%, Fst = 0.734) and 409
among individual mountains (37.3%, Fst = 0.624). 410
411
20
Discussion 412
Double colonization followed by secondary contact, allopolyploidization and extinction 413
Our results imply that the genus Anthoxanthum has an intriguingly dynamic biogeographic 414
history in eastern Africa and in sub-Saharan Africa as a whole, initiated by double Late 415
Pliocene colonization from two different sources and followed by expansion of the two 416
distinctly divergent lineages, one from the south and one from the north. Our extended 417
analyses thus corroborate the double colonization hypothesis presented in our previous study 418
(Pimentel et al. 2013). Furthermore, based on the extension of our sampling to cover the 419
entire range in East Africa and combined phylogenetic, phylogeographic, and DNA content 420
inference, we conclude that the two currently allopatric lineages of sub-Saharan 421
Anthoxanthum once must have met and hybridized in East Africa to produce an allopolyploid 422
during the climatic oscillations of the later parts of the Pleistocene. 423
Our nuclear phylogeny (Figs 3, 4) shows that the eastern African taxa originated after a single 424
immigration of a Eurasian lineage in the Late Pliocene, in agreement with the morphology-425
based hypothesis of their close relationship to the A. alpinum/odoratum complex (Hedberg 426
1976). The eastern African nuclear sequences were recovered in three well-supported 427
allopatric subclades (with unresolved relationships), one with the Ethiopian A. aethiopicum, 428
one with eastern East African A. nivale, and one with western East African A. nivale. The 429
subclades were inferred to have diverged during the Late Pliocene/Middle Pleistocene. The 430
southern African taxa also formed a distinct clade in our nuclear phylogeny, consistent with a 431
single colonization of southern Africa from Southeast Asia in the Late Pliocene (Pimentel et 432
al. 2013). 433
In contrast, our plastid phylogeny (Figs 2, 4) recovered eastern A. nivale in a clade with the 434
21
southern African taxa, whereas western A. nivale was recovered in an eastern 435
African/Eurasian clade in agreement with the nuclear tree. Coalescent simulations rejected 436
lineage sorting stochasticity as explanation for the incongruence between the plastid and 437
nuclear data (Fig. 5) when effective populations sizes were below 400000 (plastid data) and 438
250000 (nuclear data). Large effective population sizes are unlikely for most species in the 439
phylogeny (narrow endemics with pronounced clonal reproduction); only the Eurasian A. 440
odoratum and A. alpinum have large distribution areas. However, estimates for other 441
widespread, outcrossing taxa have recovered values well below our numbers (Maureira-Butler 442
et al. 2008). We therefore conclude that even though the southern and eastern African 443
lineages are currently allopatric (Fig. 1a), they once met and hybridized. Based on plastid 444
divergence we inferred this event to have taken place in the Middle/Late Pleistocene. Based 445
on morphology (see below) and our AFLP analysis, however, the hybridization event seems 446
not solely to have resulted in plastid capture. The eastern samples formed a highly distinct 447
genetic group, separated from the western samples by 20.2% along the first PCoA axis and by 448
33.9% (Fst = 0.509) in an AMOVA analysis (Fig. 6, Table 2). As AFLPs are known to mainly 449
represent genome-wide nuclear markers (Ridout & Donini 1999), this high level of 450
divergence may reflect that also the nuclear genome of eastern A. nivale contains DNA from 451
the southern African lineage. The placement of eastern A. nivale in the eastern 452
African/Eurasian clade in our nuclear phylogeny (Fig. 3), which was inferred from ribosomal 453
sequences, is thus most likely caused by elimination of southern African rDNA from the 454
hybrid via concerted evolution. 455
Our hybridization hypothesis thus resolves the conflicting morphology-based opinions of 456
whether A. nivale has northern affinities (Hedberg 1976; Phillips 1995) or southern affinities 457
(Clayton 1970). It has both, and our inference that eastern A. nivale not only contains plastid 458
22
DNA but also nuclear DNA from the southern African lineage is strengthened by the 459
observation that some specimens of A. nivale show morphological similarities with the 460
southern African endemics, which currently only extend northwards to Malawi (Fig. 1a; 461
Clayton 1970). As the eastern East African mountains are well explored, the southern African 462
lineage seems to have gone extinct in this area after the hybridization event. We also found 463
that whereas the western samples of A. nivale were low-ploid (DNA-content groups G1 and 464
G2), the eastern samples were high-ploid (G3; Figs 1b; Supporting Information Figs. S1, S2). 465
This finding suggests that the hybridization event between the northern and southern lineages 466
of Anthoxanthum in sub-Saharan Africa involved allopolyploidy, which is common in this 467
genus (Chumová et al. 2015). The putative allopolyploid nature of these eastern A. nivale 468
populations, together with their high genetic differentiation in the AFLP study would merit 469
them to be recognized as a new species following the evolutionary or the phylogenetic species 470
concept (reviewed in Soltis et al. 2007). However Soltis et al. (2007) suggested that the 471
definition of new taxa in polyploid complexes should be subjected to strict criteria including 472
morphological differentiation, so we await a final taxonomic conclusion until an in-depth 473
morphological analysis of A. nivale is available. 474
The Pleistocene hybridization event detected in this study is particularly intriguing in light of 475
the deeper history of the two involved lineages. The southern African lineage belongs to 476
section Ataxia, a mostly SE Asian, tropical-alpine group which itself originated by a Miocene 477
hybridization event between the genera Anthoxanthum and Hierochloë (Pimentel et al. 2013). 478
Our results therefore imply that the East African allopolyploid has a double hybrid 479
background spanning millions of years and widely different geographic affinities. This 480
hybridization event between cold-adapted SE Asian (through southern Africa) and Eurasian 481
23
lineages in East Africa constitutes one of the very few examples of a connection between two 482
tropical-alpine habitats in the Old World (Gehrke & Linder 2009; Linder 2014). 483
The eastern African lineage: immigration and polyploid evolution 484
We were not able to directly verify ploidy levels corresponding to the three DNA-content 485
groups (G1 and G2 in the western mountains and G3 in the eastern mountains; Figs 1b; 486
Supporting Information Figs. S1, S2) observed in this study because our attempts to 487
germinate seeds failed. A comparison of our dataset with the extensive chromosome counts 488
published by Hedberg (1976) suggests however that our groups correspond to tetraploids (2n 489
= 4x = 20), octoploids (2n = 8x = 40) and dodecaploids (2n = 12x = 60). This ploidy level 490
assignment is largely consistent with the DNA content values observed, but without 491
chromosome counts it must be regarded as tentative. Hedberg (1976) only found two ploidy 492
levels, tetraploids both on the western and eastern mountains and dodecaploids on the eastern 493
mountains. Because dodecaploids by far dominated her counts from the eastern mountains, 494
our DNA-content group G3 clearly corresponds to dodecaploids. She detected a few 495
tetraploids only on one eastern mountain (Mt Aberdare), where they co-occurred with 496
dodecaploids, but low-ploids were not found in our limited sampling from this mountain. 497
From the western mountains, she mainly examined plants from Mt Elgon and found only 498
tetraploids. On this mountain we only observed putative octoploids (DNA-content group G2 + 499
one transitional specimen between G1 and G2) based on quite extensive sampling. Octoploids 500
were not detected by Hedberg (1976) who made all her counts in plants collected at 3550 m or 501
below, whereas all the populations we sampled in Mt Elgon grew above 3800 m. A direct 502
relationship between ploidy and altitude was observed by Hedberg (1976) in other mountain 503
systems and sharp altitudinal limits between the ranges of different cytotypes are common in 504
other Anthoxanthum polyploid complexes (Felber-Girard et al. 1996). From the westernmost 505
24
mountains (Ruwenzori and Muhavura), where we found both low-ploid DNA content groups 506
(G1 and G2) based on extensive sampling, she only reported a single tetraploid count. We 507
therefore conclude that the plants with the lowest DNA-content (G1) in our sampling most 508
likely are tetraploids while the less common octoploids went undetected in her study. 509
The lineage colonizing eastern Africa from Eurasia in the Late Pliocene was thus probably 510
tetraploid and closely related to the Eurasian diploid/tetraploid complex constituted by A. 511
alpinum and A. odoratum (Figs 2, 3). We found tetraploids to be dominant in the westernmost 512
mountains in East Africa (G1, Appendix 1). Because the block mountain Ruwenzori was in its 513
final uplift stage at this time (Gehrke & Linder 2014) and harbors tetraploids as well as the 514
highest levels of genetic (AFLP) diversity and rarity in East Africa (Table 1), it is possible 515
that the ancestral lineage first arrived in this area. Here tetraploids and octoploids co-occur, 516
suggesting that the octoploids may have formed in situ via autopolyploidy (Fig. 1b), similar to 517
the well-documented instances of autopolyploidy in the A. alpinum/odoratum complex in 518
Europe (Chumová et al. 2015). The western East African tetraploids and/or octoploids may 519
later have spread eastwards to the eastern mountains as well as northwards to Ethiopia in the 520
Late Pliocene/Early Pleistocene (Fig. 4). In the eastern East African mountains, they 521
apparently came into contact with sweet vernal grasses belonging to the expanding southern 522
African lineage, hybridized and formed allopolyploids, followed by local extinction of the 523
parental southern lineage. We are not aware of any published chromosome counts for the 524
southern African taxa, but according to J. Loureiro (pers. comm.), all but one of them are 525
tetraploids, which is consistent with our hypothesis. 526
Sweet vernal grasses are today absent from the Arabian Peninsula and most of the Middle 527
East, but they grow in coastal and mountainous areas of North Africa from Morocco to 528
Tunisia (Maire, 1931; Tutin 1980). This might suggest that the Eurasian lineage migrated to 529

25
western East Africa via North Africa, not via the Arabian Peninsula as suggested for other 530
afro-alpine species (e.g. Assefa et al. 2007; Popp et al. 2008). However, all specimens of 531
North African sweet vernal grasses we have examined so far belong to a more distantly 532
related Mediterranean lineage (the A. aristatum/ovatum lineage; Pimentel et al. 2013), so 533
further consideration of this alternative must await clarification of the taxonomy and 534
phylogenetic relationships of the North African Anthoxanthum. 535
Distribution of genetic diversity in A. nivale 536
We observed high differentiation and virtually no introgression in A. nivale across the Rift 537
Valley (Figs. 6A, B, C), a well-known barrier to gene flow (e.g. Assefa et al. 2007; Masao et 538
al. 2013). In our study, however, the relative effects of geography and ploidy in explaining the 539
absence of gene flow are difficult to disentangle. The AMOVA analyses (Table 2) showed 540
that DNA content explained the highest percentage of genetic variation (47.2%) followed by 541
the division between the western and eastern mountains (33.9%). Introgression was detected 542
within each region, but never across DNA-content groups (Figs. 6B and C). These results 543
indicate a long history of isolation between ploidy levels as well as between the eastern and 544
western groups of populations. 545
The overall genetic diversity in A. nivale (D = 0.155) is lower than expected for an 546
outcrossing, perennial plant taxon (Nybom 2004), as also observed in many other afro-alpine 547
species (Ehrich et al. 2007; Geleta & Bryngelsson 2009; Masao et al. 2013). This finding is 548
consistent with the hypothesis that afro-alpine species may have experienced severe 549
bottlenecks during cycles of colonization-extinction-recolonization, and that the current 550
populations have established after recent long-distance colonization. Our finding of higher 551
diversity (D = 0.172 ± 0.084 and He = 0.269 ± 0.171) and rarity (5.3) in the western than in 552
26
the eastern mountains (D = 0.139 ± 0.067, He = 0.215 ± 0.159; 2.9) supports the hypothesis of 553
longer persistence of the species in the west, which may have been the first area to be 554
colonized by the Eurasian lineage. 555
Dynamic history of afro-alpine plant communities 556
Our results add to a growing body of evidence showing that tropical high mountain habitats 557
have a dynamic recent history involving niche conservatism, recruitment from remote 558
sources, repeated dispersals, diversification, hybridization, and extinction (Hughes 2016; 559
Lagomarsino et al. 2016). The alpine zone of isolated tropical high mountains seems mainly 560
to have been colonized via long-distance dispersal of lineages that already were preadapted to 561
cold conditions in other areas, as recently shown for several groups of organisms on Mt 562
Kinabalu on Borneo (Merckx et al. 2015). This scenario also holds true for the sweet vernal 563
grasses in sub-Saharan Africa, which show an exceptionally dynamic history with expansion 564
of two independently immigrated lineages, secondary contact resulting in hybridization and 565
allopolyploidization, and local extinction of one parental lineage after the hybridization event. 566
The extinction event was possible to trace because the now locally extinct lineage left its 567
footprint in an allopolyploid derivative. Our results are thus consistent with a hypothesis of 568
cycles of local colonization, extinction, and recolonization during the Pleistocene climatic 569
oscillations as drivers shaping afro-alpine and afro-montane plant communities, as also 570
suggested by recent documentation of old species that show recent interpopulational 571
divergence (Mairal et al. 2015; Gizaw et al. 2016a). Our study also adds to the emerging 572
evidence suggesting that long-distance-dispersed frost-tolerant plant lineages colonized 573
eastern Africa successively over a long time period, some possibly before the formation of the 574
current high mountains (Late Miocene/Early Pliocene; Gizaw et al. 2016a), some possibly at 575
the time of their final uplift phase (Ruwenzori in the Late Pliocene; Pimentel et al. 2013 and 576
27
this study), and some long after their formation (Ethiopian mountains in the Pleistocene; Koch 577
et al. 2006). 578
579
Acknowledgements 580
This work was supported by the Norwegian Programme for Development, Research and 581
Higher Education (NUFU; project no. 2007/1058: AFROALP-II - Afro-alpine ‘sky islands’: 582
genetic versus taxonomic biodiversity, climate change, and conservation) to CB and SN. 583
Partial support was provided by the Academy of Sciences of the Czech Republic (Project 584
RVO 67985939) to PT. We thank the Uganda National Council for Science and Technology, 585
Uganda Wildlife Authority, Tanzanian Commission for Science and Technology, Tanzanian 586
National Parks Authority, and National Museums of Kenya for permission to conduct 587
fieldwork. We thank the staff at ETH, O, EA, MHU, SUA and NHT for curation of our 588
specimens. 589
590
28
References 591
Antonelli A (2009) Have giant lobelias evolved several times independently? Life form shifts 592
and historical biogeography of the cosmopolitan and highly diverse subfamily 593
Lobelioideae (Campanulaceae). BMC Biology, 7, 82. 594
Antonelli A, Sanmartín I (2011) Why are there so many plant species in the Neotropics?. 595
Taxon, 60, 403-414. 596
Assefa A, Ehrich D, Taberlet P, Nemomissa S, Brochmann C (2007) Pleistocene colonisation 597
of afro-alpine 'sky islands' by the arctic-alpine Arabis alpina. Heredity 99: 133-142. 598
Baker BH, Mohr PA, Williams LAJ (1972) Geology of the eastern rift system of Africa. 599
Geological Society of America Special Papers, 136, 1-68. 600
Bell CD, Donoghue MJ (2005) Phylogeny and biogeography of Valerianaceae (Dipsacales) 601
with special reference to the South American valerians. Organisms, Diversity and 602
Evolution, 5, 147-159. 603
Blanco-Pastor JL,Vargas P, Pfeil BE (2012) Coalescent simulations reveal hybridization and 604
incomplete lineage sorting in Mediterranean Linaria. PLOS One, 7, e39089. 605
Bonin A, Bellemain E, Eidesen PB, Pompanon F, Brochmann C, Taberlet P (2004) How to 606
track and assess genotyping errors in population genetics studies. Molecular Ecology, 13, 607
3261-3273. 608
Chumová Z, Krejčíková J, Mandáková T, Suda J, Trávníček P (2015) Evolutionary and 609
taxonomic implications of variation in nuclear genome size: lesson from the grass genus 610
Anthoxanthum (Poaceae). PLOS One, 10, e0133748. 611
Clayton WD (1970) Gramineae (Part 1). In: Flora of Tropical East Africa (eds Milne-612
Redhead E, Polhill RM). Crown Agents for Overseas Governments and Administration, 613
London, UK. 614
29
Drummond AJ, Rambaut A (2007) Beast: Bayesian evolutionary analysis by sampling trees. 615
BMC Evolutionary Biology, 7, 214. 616
Drummond AJ, Suchard A, Xie D, Rambaut A (2012) Bayesian phylogenetics with BEAUTi 617
and the BEAST 1.7. Molecular Biology and Evolution, 29, 1969-1973. 618
Drummond AJ, Bouckaert RR (2015) Bayesian evolutionary analysis with BEAST. 619
Cambridge University Press, Cambridge, UK. 620
Ebinger CJ, Yemane T, Harding DJ, Tesfaye S, Kelley S, Rex DC (2000) Rift deflection, 621
migration and propagation: Linkage of the Ethiopian and Eastern Rifts, Africa. Geological 622
Society of America Bulletin, 112, 163-176. 623
Edgar RC (2004) MUSCLE: multiple sequence alignment with high accuracy and high 624
throughput. Nucleic Acids Research, 32, 1792-1797. 625
Ehrich D (2006) AFLPdat: a collection of R functions for convenient handling of AFLP data. 626
Molecular Ecology Notes, 6, 603-604. 627
Ehrich D, Gaudeul M, Assefa A, Koch MA, Mummenhoff K, Nemomissa S, Intrabiodiv 628
Consortium, Brochmann C (2007) Genetic consequences of Pleistocene range shifts: 629
contrast between the Arctic, the Alps and the East African mountains. Molecular Ecology, 630
16, 2542-2559. 631
Evanno G, Regnaut S, Goudet J (2005) Detecting the numbers of clusters of individuals using 632
the software STRUCTURE: a simulation study. Molecular Ecology, 14, 2611-2620. 633
Excoffier L, Lischer HEL (2010) Arlequin suite ver 3.5: a new series of programs to perform 634
population genetics analyses under linux and windows. Molecular Ecology Resources, 10, 635
564-567. 636
30
Excoffier L, Smouse PE, Quattro JM (1992) Analysis of molecular variance inferred from 637
metric distances among DNA haplotypes: application to human mitochondrial DNA 638
restriction data. Genetics, 131, 479-491. 639
Falush D, Stephens M, Pritchard JK (2007) Inference of population structure using multilocus 640
genotype data: dominant markers and null allele. Molecular Ecology Notes, 7, 574-578. 641
Felber-Girard M, Felber F, Buttler A (1996) Habitat differentiation in a narrow hybrid zone 642
between diploid and tetraploid Anthoxanthum alpinum. New Phytologist, 133, 531-540. 643
Gaudeul M, Taberlet P, Till-Bottraud I (2000) Genetic diversity in an endangered alpine 644
plant, Eryngium alpinum L. (Apiaceae), inferred from amplified fragment length 645
polymorphism markers. Molecular Ecology, 9, 1625-1637. 646
Gehrke B, Linder HP (2009) The scramble for Africa: pan-temperate elements on the African 647
high mountains. Proceedings of the Royal Society of London B: Biological Sciences, 276, 648
2657-2665. 649
Gehrke B, Linder HP (2014) Species richness, endemism and species composition in the 650
tropical Afroalpine flora. Alpine Botany, 124, 165-177. 651
Gehrke B, Kandziora M, Pirie MD (2016) The evolution of dwarf shrubs in alpine 652
environments: a case study of Alchemilla in Africa. Annals of Botany, 117, 121-131. 653
Geleta M, Bryngelsson T (2009) Inter simple sequence repeat (ISSR) based analysis of 654
genetic diversity of Lobelia rhynchopetalum (Campanulaceae). Hereditas, 146, 122-130. 655
Gizaw A, Kebede M, Nemomissa S, Ehrich D, Tessema B, Mirré V, Popp M, Brochmann C 656
(2013) Phylogeography of the heathers Erica arborea and E. trimera in the afro-alpine 657
“sky-islands” inferred from AFLPs and plastid DNA sequences. Flora, 208, 453-463. 658
Gizaw A, Brochmann C, Nemomissa S, Wondimu T, Masao CA, Mugizi TF, Abdi AA, 659
Oxelman B, Popp M, Dimitrov D (2016a) Colonization and diversification in the African 660
31
“sky-islands”: insights from fossil-calibrated molecular dating of Lychnis 661
(Caryophyllaceae). New Phytologist, 211, 719-734. 662
Gizaw A, Wondimu T, Mugizi TF, Masao CA, Abdi AA, Popp M, Ehrich D, Nemomissa S, 663
Brochmann C (2016b) Vicariance, dispersal and hybridisation in a naturally fragmented 664
system: the afroalpine endemics Carex monostachya and C. runssoroensis (Cyperaceae). 665
Alpine Botany, 126, 59-71. 666
Gouy M, Guindon S, Gascuel O (2010) SeaView version 4: a multiplatform graphical user 667
interface for sequence alignment and phylogenetic tree building. Molecular Biology and 668
Evolution, 27, 221–224. 669
Hedberg I (1976) A cytotaxonomic reconnaissance of tropical African Anthoxanthum L. 670
(Graminaceae). Botaniska Notiser, 129, 85-90. 671
Hedberg O (1957) Afroalpine vascular plants. A taxonomic revision. Symbolae Botanicae 672
Upsalienses, 15, 1-411. 673
Hedberg O (1961) The phytogeographic position of the afroalpine flora. Recent Advances in 674
Botany, 1, 914-919. 675
Hedberg O (1969) Evolution and speciation in a tropical high mountain flora. Biological 676
Journal of the Linnean Society, 1, 135-148. 677
Hedberg O (1970) Evolution of the afroalpine flora. Biotropica, 2, 16-23. 678
Hedberg O (1992) Afroalpine vegetation compared to páramo: convergent adaptations and 679
divergent differentiation. In: Páramo: an Andean ecosystem under human influence (eds 680
Balslev H, Luteyn JL), pp. 15-29. Academic Press, London, UK. 681
Heled J, Drummond AJ (2010) Bayesian inference of species trees from multilocus data. 682
Molecular Biology and Evolution, 27, 570–580. 683
32
Huelsenbeck JP, Ronquist F (2001) MrBayes: Bayesian inference of phylogenetic trees. 684
Bioinformatics, 17, 754-755. 685
Hughes CE, Atchison GW (2015) The ubiquity of alpine plant radiations: from the Andes to 686
the Hengduan Mountains. New Phytologist, 207, 275-282. 687
Hughes CE (2016) The tropical Andean plant diversity powerhouse. New Phytologist, 210, 688
1152-1154. 689
Huson D, Scornavacca C (2012) Dendroscope 3 : an interactive tool for rooted phylogenetic 690
trees and networks. Systematic Biology, 61, 1061-1067. 691
Jabbour F, Renner SS (2012) A phylogeny of Delphinieae (Ranunculaceae) shows that 692
Aconitum is nested within Delphinium and that Late Miocene transitions to long life cycles 693
in the Himalayas and southwest China coincide with bursts in diversification. Molecular 694
Phylogenetics and Evolution, 62, 928-942. 695
Jakobsson M, Rosenberg NA (2007) CLUMPP: a cluster matching and permutation program 696
for dealing with label switching and multimodality in analysis of population structure. 697
Bioinformatics, 23, 1801-1806. 698
Koch MA, Kiefer C, Ehrich D, Vogel J, Brochmann C, Mummenhoff K (2006) Three times 699
out of Asia Minor: the phylogeography of Arabis alpina L.(Brassicaceae). Molecular 700
Ecology, 15, 825-839. 701
Kosman E (2003) Nei's gene diversity and the index of average differences are identical 702
measures of diversity within populations. Plant Pathology, 52, 533-535. 703
Lagomarsino LP, Condamine FL, Antonelli A, Mulch A, Davis CC (2016) The abiotic and 704
biotic drivers of rapid diversification in Andean bellflowers (Campanulaceae). New 705
Phytologist, 210, 1430-1442. 706

33
Linder HP (2014) The evolution of African plant diversity. Frontiers in Ecology and 707
Evolution, 2, 38. 708
Maddison WP, Maddison DR (2009) Mesquite: a modular system for evolutionary analysis. 709
URL http://mesquiteproject.org. [accessed 15 October 2015]. 710
Mairal M, Pokorny L, Aldasoro JJ, Alarcón M, Sanmartín I (2015) Ancient vicariance and 711
climate-driven extinction explain continental-wide disjunctions in Africa: the case of the 712
Rand Flora genus Canarina (Campanulaceae). Molecular Ecology, 24, 1335-1354. 713
Maire R (1931) Anthoxanthum L. In: Flore de l’Afrique du Nord (eds. Maire R, Guinochet M, 714
Fanel L), pp. 25-29. P Lechevalier, Paris, France. 715
Masao CA, Gizaw A, Piñeiro R, Tussiime FM, Wondimu T, Abdi AA, Popp M, Gussarova G, 716
Lye KA, Munishi P et al. (2013) Phylogeographic history and taxonomy of some afro-717
alpine grasses assessed based on AFLPs and morphometry: Deschampsia cespitosa, D. 718
angusta and Koeleria capensis. Alpine Botany, 123, 107-122. 719
Maureira-Butler IJ, Pfeil BE, Muangprom A, Osborn TC, Doyle JJ (2008) The reticulate 720
history of Medicago (Fabaceae). Systematic Biology, 57, 466-482. 721
Merckx VSFT, Hendriks KP, Beentjes KK, Mennes CB, Becking LE, Peijnenburg KTCA, 722
Afendy A, Arumugam N, de Boer H, Biun A et al. (2015) Evolution of endemism in a 723
young tropical mountain. Nature, 524, 347-350. 724
Mugrabi de Kupler AL, Fagundez J, Bellstedt DU, Oliver EG, Leon J, Pirie MD (2015) 725
Testing reticulate versus coalescent origins of Erica lusitanica using a species phylogeny 726
of the northern heathers (Ericeae, Ericaceae). Molecular Phylogenetics and Evolution, 88, 727
121-131. 728
Nei M (1987) Molecular Evolutionary Genetics. Columbia University, New York, USA. 729
34
Nei M, Li WH (1979) Mathematical model for studying genetic variation in terms of 730
restriction endonucleases. Proceedings of the National Academy of Sciences of the United 731
States of America, 76, 5269-5273. 732
Nordborg M, Hu TT, Ishino Y, Jhaveri J, Toomajian C, Zheng H, Bakker E, Calabrese P, 733
Gladstone J, Goyal R et al. (2005) The pattern of polymorphism in Arabidopsis thaliana. 734
PLoS Biology, e196. 735
Nürk NM, Uribe-Convers S, Gehrke B, Tank DC, Blattner FR (2015) Oligocene niche shift, 736
Miocene diversification – cold tolerance and accelerated speciation rates in the St. John’s 737
Worts (Hypericum, Hypericaceae). BMC Evolutionary Biology, 15, 80. 738
Nybom H (2004) Comparison of different nuclear DNA markers for estimating intraspecific 739
genetic diversity in plants. Molecular Ecology, 13, 1143-1155. 740
Nylander JAA. 2004. MrModeltest v2. URL https://github.com/nylander/MrModeltest2. 741
[accessed 15 September 2012]. 742
Nylander JAA, Wilgenbusch JC, Warren DL, Swofford DL (2008) AWTY (are we there 743
yet?): a system for graphical exploration of MCMC convergence in Bayesian 744
phylogenetics. Bioinformatics, 24, 581–583. 745
Paradis E, Claude J, Strimmer K (2004) APE: analyses of phylogenetics and evolution in R 746
language. Bioinformatics, 20, 289–290. 747
Penny D, Hendy MD (1985) The use of tree comparison metrics. Systematic Zoology, 34, 75-748
82. 749
Phillips S (1995) Poaceae (Gramineae). In: Flora of Ethiopia and Eritrea (eds Hedberg I, 750
Edwards S). The National Herbarium, Biology Department, Science Faculty Addis Ababa 751
University, Addis Ababa, Ethiopia. 752
35
Pimentel M, Sahuquillo E, Torrecilla Z, Popp M, Catalán P, Brochmann C (2013) 753
Hybridization and long-distance colonization at different time scales: towards resolution 754
of long-term controversies in the sweet vernal grasses (Anthoxanthum). Annals of Botany, 755
112, 1015-1030. 756
Pirie MD, Humphreys AM, Barker NP, Linder HP (2009) Reticulation, data combination, and 757
inferring evolutionary history: an example from Danthonioideae (Poaceae). Systematic 758
Biology, 58, 612–628. 759
Popp M, Gizaw A, Nemomissa S, Suda J, Brochmann C (2008) Colonization and 760
diversification in the African ‘sky islands’ by Eurasian Lychnis L. (Caryophyllaceae). 761
Journal of Biogeography, 35, 1016-1029. 762
Popp M, Mirré V, Brochmann C (2011) A single mid-Pleistocene long distance dispersal by a 763
bird can explain the extreme bipolar disjunction in crowberries (Empetrum). Proceedings 764
of the National Academy of Sciences of the United States of America, 108, 6520–6525. 765
Pritchard JK, Stephens M, Donnelly P (2000) Inference of population structure using 766
multilocus genotype data. Genetics, 155, 945-959. 767
Rambaut A, Drummond A (2007) Tracer v. 1.4. University of Edinburgh, Edinburgh, UK. 768
Ridout CJ, Donini P (1999) Use of AFLP in cereals research. Trends in Plant Science, 4, 76-769
79. 770
Rohlf FJ (2002) NTSYSpc, Numerical Taxonomy and Multivariate Analysis System. Version 771
2.11 a, User guide. [WWW document] URL 772
www.exetersoftware.com/downloads/ntsysguide21.pdf. [accessed 24 May 2014]. 773
Rosenberg NA (2004) DISTRUCT: a program for the graphical display of population 774
structure. Molecular Ecology Notes, 4, 137-138. 775
36
Schönswetter P, Lachmayer M, Lettner C, Prehsler D, Rechnitzer S, Reich DS, Sonnleitner 776
M, Wagner I, Huelber K, Schneeweiss GM et al. (2007a) Sympatric diploid and hexaploid 777
cytotypes of Senecio carniolicus (Asteraceae) in the Eastern Alps are separated along an 778
altitudinal gradient. Journal of Plant Research, 120, 721-725. 779
Schönswetter P, Suda J, Popp M, Weiss-Schneeweiss H, Brochmann C (2007b) Circumpolar 780
phylogeography of Juncus biglumis (Juncaceae) inferred from AFLP fingerprints, cpDNA 781
sequences, nuclear DNA content and chromosome numbers. Molecular Phylogenetics and 782
Evolution, 42, 92-103. 783
Schönswetter P, Tribsch A (2005) Vicariance and dispersal in the alpine perennial Bupleurum 784
stellatum L. (Apiaceae). Taxon, 54, 725-732. 785
Sikolia S, Onyango JC, Beck E, Kinyamario JI (2009) The distribution of C3 and C4 786
photosynthetic species of the Centrospermeae along an altitudinal gradient in Western 787
Kenya. International Journal of Botany, 5, 47-57. 788
Simmons MP, Ochoterena H (2000) Gaps as characters in sequence-based phylogenetic 789
analyses. Systematic Biology, 49, 329-381. 790
Sklenář P, Hedberg I, Cleef AM (2014) Island biogeography of tropical alpine floras. Journal 791
of Biogeography, 41, 287-297. 792
Soltis DE, Soltis PS, Schemske DW, Hancock JF, Thompson JN, Husband BC, Judd WS 793
(2007) Autopolyploidy in angiosperms: have we grossly underestimated the number of 794
species?. Taxon, 56, 13-30. 795
Suda J, Trávníček P (2006) Estimation of relative nuclear DNA content in dehydrated plant 796
tissues by flow cytometry. John Wiley & Sons, New York, USA. 797
Swofford DL (2002) PAUP* Version 4. Phylogenetic analysis using parsimony (*and Other 798
Methods). Sinauer Associates, Sunderland, Massachusetts. 799
37
Tutin TG (1980) Anthoxanthum L. In: Flora Europaea, Vol. 5 (eds. Tutin TG, Heywood VH, 800
Burges NA, Moore DM, Valentine DH, Walters SM, Webb DA), pp. 229-230. Cambridge 801
University Press, Cambridge, UK. 802
Van-De-Peer Y, De-Wachter Y (1994) TREECON for windows: a software package for the 803
construction and drawing of evolutionary trees for the Microsoft Windows environment. 804
Computer Applications in the Biosciences, 10, 569-70. 805
Vicentini A, Barber JC, Aliscioni SS, Giussani LM, Kellogg EA (2008) The age of the 806
grasses and clusters of origins of C4 photosynthesis. Global Change Biology, 14, 2963–807
2977. 808
Von Hagen KB, Kadereit JW (2001) The phylogeny of Gentianella (Gentianaceae) and its 809
colonization of the southern hemisphere as revealed by nuclear and chloroplast DNA 810
sequence variation. Organisms, Diversity and Evolution, 1, 61-79. 811
Weir BS, Cockerham CC (1984) Estimating F-statistics for the analysis of population 812
structure. Evolution, 38, 1358-1370. 813
Wondimu T, Gizaw A, Tusiime FM, Masao CA, Abdi AA, Gusarova G, Popp M, Nemomissa 814
S, Brochmann C (2014) Crossing barriers in an extremely fragmented system: two case 815
studies in the afro-alpine sky island flora. Plant Systematics and Evolution, 300, 415-430. 816
817
Data Accessibility 818
DNA sequences have been deposited in GenBank (for accession numbers see Appendices 1, 2 819
and 3). Sequence alignments (concatenated sequences) have been deposited in FigShare 820
entries DOI: XXXXX (nuclear DNA) and DOI: XXXXXX (plastid DNA) 821
The AFLP dataset has been deposited in FigShare entry DOI: XXXXXX 822
823

38
Author Contributions Box 824
CB and MPi conceived the study. CB, SN, GE and VM obtained funding. FMT, AG, TW, 825
CAM, AAA, VM, SN, MPo, GE and CB collected samples. FMT, AG, PT and MPi 826
performed most lab and computer analyses. FMT, AG, MPo, CB and MPi drafted the 827
manuscript. All authors contributed to the writing, read, and approved the final manuscript. 828
829
830
831
832
833
834
835
836
837
838
839
840
841
39
Table 1. Genetic diversity and rarity in the East African A. nivale based on 424 AFLP markers 842
scored in 125 plants (35 populations), calculated separately for each mountain and for each of 843
the two genetic groups inferred in the STRUCTURE analyses. D, Nei’s average gene 844
diversity [Nei, 1987, estimated as the average proportion of pairwise differences among 845
genotypes (Kosman, 2003)]; DW, frequency-down-weighted marker values (Schönswetter & 846
Tribsch, 2005) as a measure of genetic distinctivity or rarity; He, Nei’s unbiased expected 847
heterozygosity (Nei, 1987; Gaudeul et al., 2000). 848
D ± sd DW He± sd
Mt Aberdare 0.095 ± 0.053 2.38 0.398 ± 0.121
Mt Kenya 0.102 ± 0.051 2.49 0.257 ± 0.149
Mt Kilimanjaro 0.119 ± 0.059 3.34 0.282 ± 0.155
Mt Meru 0.118 ± 0.060 3.01 0.319 ± 0.143
Mt Elgon 0.085 ± 0.043 3.73 0.297 ± 0.144
Mt Muhavura 0.172 ± 0.088 5.63 0.358 ± 0.126
Mt Ruwenzori 0.200 ± 0.131 9.63 0.555 ± 0.079
Western Mountain group 0.172 ± 0.084 126.1 0.269± 0.171
Eastern Mountain group 0.139 ± 0.067 125.8 0.215 ± 0.159
849
850
851
852
40
Table 2. Analyses of molecular variance (AMOVA) and Fst values based on 424 AFLP 853
markers scored in 125 plants (35 populations) of the East African A. nivale. All P-values were 854
<0.001. 855
Source of
variation
d.f % of
variation
F statistics
Fst Fsc Fct
All populations
Among
populations 34 60.1
0.60
Within populations 87 39.9
Three DNA-content
groups (G1-G3)
Among groups 2 47.2
0.73
0.50
0.47
Among
populations within
groups 35 26.2
Within populations 84 26.6
Two genetic groups
(EM vs WM)
Between groups 1 33.9
0.68
0.51
0.34
Among
populations within
groups 33 33.7
Within populations 87 32.4
856
41
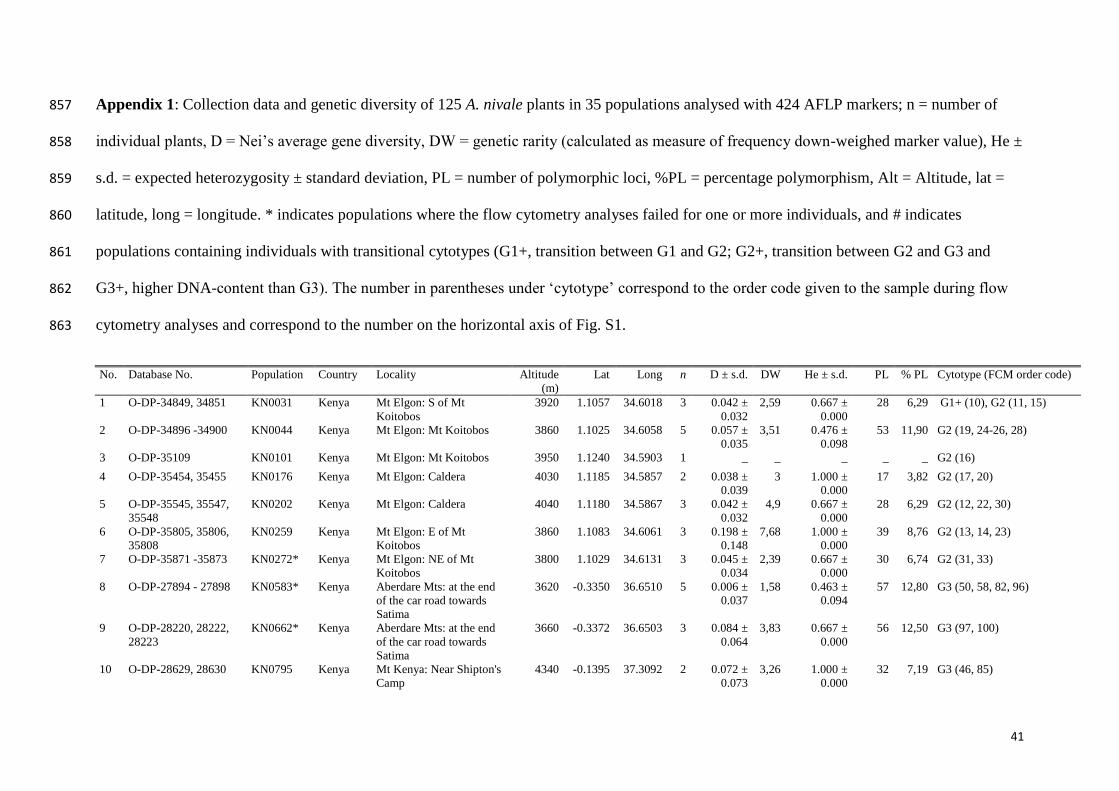
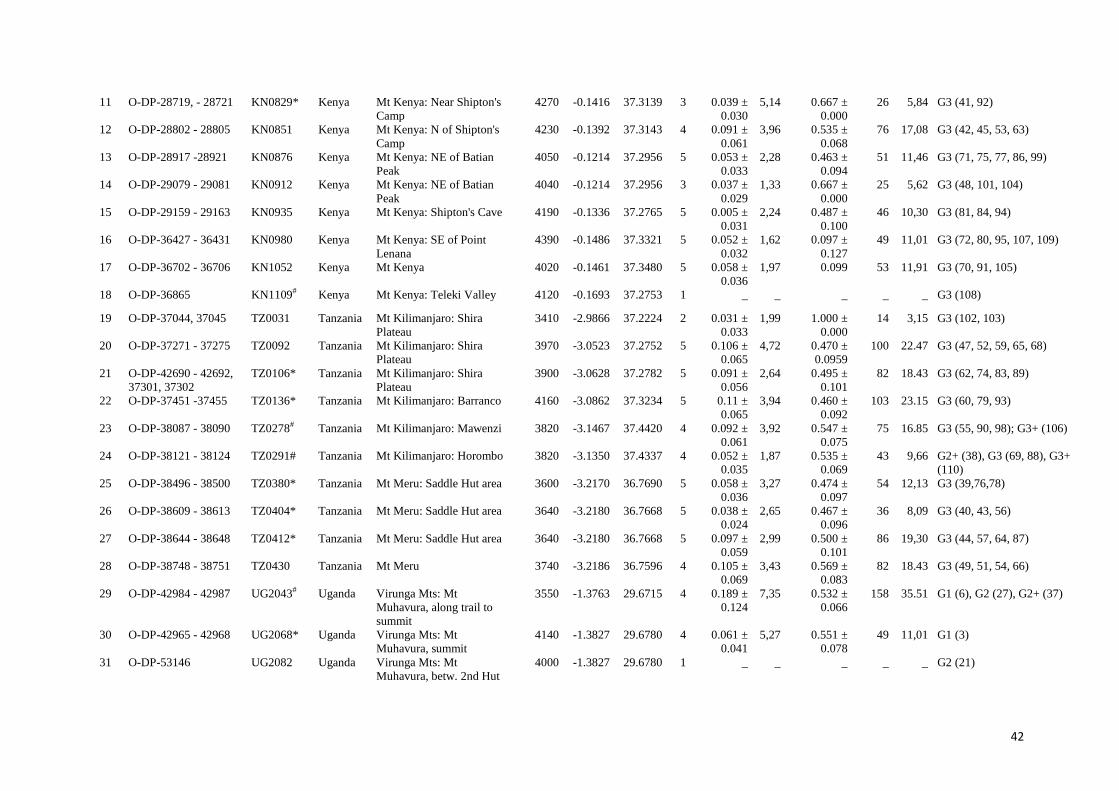
Appendix 1: Collection data and genetic diversity of 125 A. nivale plants in 35 populations analysed with 424 AFLP markers; n = number of 857
individual plants, D = Nei’s average gene diversity, DW = genetic rarity (calculated as measure of frequency down-weighed marker value), He ± 858
s.d. = expected heterozygosity ± standard deviation, PL = number of polymorphic loci, %PL = percentage polymorphism, Alt = Altitude, lat = 859
latitude, long = longitude. * indicates populations where the flow cytometry analyses failed for one or more individuals, and # indicates 860
populations containing individuals with transitional cytotypes (G1+, transition between G1 and G2; G2+, transition between G2 and G3 and 861
G3+, higher DNA-content than G3). The number in parentheses under ‘cytotype’ correspond to the order code given to the sample during flow 862
cytometry analyses and correspond to the number on the horizontal axis of Fig. S1. 863
No. Database No. Population Country Locality Altitude
(m)
Lat Long n D ± s.d. DW He ± s.d. PL % PL Cytotype (FCM order code)
1 O-DP-34849, 34851 KN0031 Kenya Mt Elgon: S of Mt
Koitobos
3920 1.1057 34.6018 3 0.042 ±
0.032
2,59 0.667 ±
0.000
28 6,29 G1+ (10), G2 (11, 15)
2 O-DP-34896 -34900 KN0044 Kenya Mt Elgon: Mt Koitobos 3860 1.1025 34.6058 5 0.057 ±
0.035
3,51 0.476 ±
0.098
53 11,90 G2 (19, 24-26, 28)
3 O-DP-35109 KN0101 Kenya Mt Elgon: Mt Koitobos 3950 1.1240 34.5903 1 _ _ _ _ _ G2 (16)
4 O-DP-35454, 35455 KN0176 Kenya Mt Elgon: Caldera 4030 1.1185 34.5857 2 0.038 ±
0.039
3 1.000 ±
0.000
17 3,82 G2 (17, 20)
5 O-DP-35545, 35547,
35548
KN0202 Kenya Mt Elgon: Caldera 4040 1.1180 34.5867 3 0.042 ±
0.032
4,9 0.667 ±
0.000
28 6,29 G2 (12, 22, 30)
6 O-DP-35805, 35806,
35808
KN0259 Kenya Mt Elgon: E of Mt
Koitobos
3860 1.1083 34.6061 3 0.198 ±
0.148
7,68 1.000 ±
0.000
39 8,76 G2 (13, 14, 23)
7 O-DP-35871 -35873 KN0272* Kenya Mt Elgon: NE of Mt
Koitobos
3800 1.1029 34.6131 3 0.045 ±
0.034
2,39 0.667 ±
0.000
30 6,74 G2 (31, 33)
8 O-DP-27894 - 27898 KN0583* Kenya Aberdare Mts: at the end
of the car road towards
Satima
3620 -0.3350 36.6510 5 0.006 ±
0.037
1,58 0.463 ±
0.094
57 12,80 G3 (50, 58, 82, 96)
9 O-DP-28220, 28222,
28223
KN0662* Kenya Aberdare Mts: at the end
of the car road towards
Satima
3660 -0.3372 36.6503 3 0.084 ±
0.064
3,83 0.667 ±
0.000
56 12,50 G3 (97, 100)
10 O-DP-28629, 28630 KN0795 Kenya Mt Kenya: Near Shipton's
Camp
4340 -0.1395 37.3092 2 0.072 ±
0.073
3,26 1.000 ±
0.000
32 7,19 G3 (46, 85)
42
11 O-DP-28719, - 28721 KN0829* Kenya Mt Kenya: Near Shipton's
Camp
4270 -0.1416 37.3139 3 0.039 ±
0.030
5,14 0.667 ±
0.000
26 5,84 G3 (41, 92)
12 O-DP-28802 - 28805 KN0851 Kenya Mt Kenya: N of Shipton's
Camp
4230 -0.1392 37.3143 4 0.091 ±
0.061
3,96 0.535 ±
0.068
76 17,08 G3 (42, 45, 53, 63)
13 O-DP-28917 -28921 KN0876 Kenya Mt Kenya: NE of Batian
Peak
4050 -0.1214 37.2956 5 0.053 ±
0.033
2,28 0.463 ±
0.094
51 11,46 G3 (71, 75, 77, 86, 99)
14 O-DP-29079 - 29081 KN0912 Kenya Mt Kenya: NE of Batian
Peak
4040 -0.1214 37.2956 3 0.037 ±
0.029
1,33 0.667 ±
0.000
25 5,62 G3 (48, 101, 104)
15 O-DP-29159 - 29163 KN0935 Kenya Mt Kenya: Shipton's Cave 4190 -0.1336 37.2765 5 0.005 ±
0.031
2,24 0.487 ±
0.100
46 10,30 G3 (81, 84, 94)
16 O-DP-36427 - 36431 KN0980 Kenya Mt Kenya: SE of Point
Lenana
4390 -0.1486 37.3321 5 0.052 ±
0.032
1,62 0.097 ±
0.127
49 11,01 G3 (72, 80, 95, 107, 109)
17 O-DP-36702 - 36706 KN1052 Kenya Mt Kenya 4020 -0.1461 37.3480 5 0.058 ±
0.036
1,97 0.099 53 11,91 G3 (70, 91, 105)
18 O-DP-36865 KN1109# Kenya Mt Kenya: Teleki Valley 4120 -0.1693 37.2753 1 _ _ _ _ _ G3 (108)
19 O-DP-37044, 37045 TZ0031 Tanzania Mt Kilimanjaro: Shira
Plateau
3410 -2.9866 37.2224 2 0.031 ±
0.033
1,99 1.000 ±
0.000
14 3,15 G3 (102, 103)
20 O-DP-37271 - 37275 TZ0092 Tanzania Mt Kilimanjaro: Shira
Plateau
3970 -3.0523 37.2752 5 0.106 ±
0.065
4,72 0.470 ±
0.0959
100 22.47 G3 (47, 52, 59, 65, 68)
21 O-DP-42690 - 42692,
37301, 37302
TZ0106* Tanzania Mt Kilimanjaro: Shira
Plateau
3900 -3.0628 37.2782 5 0.091 ±
0.056
2,64 0.495 ±
0.101
82 18.43 G3 (62, 74, 83, 89)
22 O-DP-37451 -37455 TZ0136* Tanzania Mt Kilimanjaro: Barranco 4160 -3.0862 37.3234 5 0.11 ±
0.065
3,94 0.460 ±
0.092
103 23.15 G3 (60, 79, 93)
23 O-DP-38087 - 38090 TZ0278# Tanzania Mt Kilimanjaro: Mawenzi 3820 -3.1467 37.4420 4 0.092 ±
0.061
3,92 0.547 ±
0.075
75 16.85 G3 (55, 90, 98); G3+ (106)
24 O-DP-38121 - 38124 TZ0291# Tanzania Mt Kilimanjaro: Horombo 3820 -3.1350 37.4337 4 0.052 ±
0.035
1,87 0.535 ±
0.069
43 9,66 G2+ (38), G3 (69, 88), G3+
(110)
25 O-DP-38496 - 38500 TZ0380* Tanzania Mt Meru: Saddle Hut area 3600 -3.2170 36.7690 5 0.058 ±
0.036
3,27 0.474 ±
0.097
54 12,13 G3 (39,76,78)
26 O-DP-38609 - 38613 TZ0404* Tanzania Mt Meru: Saddle Hut area 3640 -3.2180 36.7668 5 0.038 ±
0.024
2,65 0.467 ±
0.096
36 8,09 G3 (40, 43, 56)
27 O-DP-38644 - 38648 TZ0412* Tanzania Mt Meru: Saddle Hut area 3640 -3.2180 36.7668 5 0.097 ±
0.059
2,99 0.500 ±
0.101
86 19,30 G3 (44, 57, 64, 87)
28 O-DP-38748 - 38751 TZ0430 Tanzania Mt Meru 3740 -3.2186 36.7596 4 0.105 ±
0.069
3,43 0.569 ±
0.083
82 18.43 G3 (49, 51, 54, 66)
29 O-DP-42984 - 42987 UG2043# Uganda Virunga Mts: Mt
Muhavura, along trail to
summit
3550 -1.3763 29.6715 4 0.189 ±
0.124
7,35 0.532 ±
0.066
158 35.51 G1 (6), G2 (27), G2+ (37)
30 O-DP-42965 - 42968 UG2068* Uganda Virunga Mts: Mt
Muhavura, summit
4140 -1.3827 29.6780 4 0.061 ±
0.041
5,27 0.551 ±
0.078
49 11,01 G1 (3)
31 O-DP-53146 UG2082 Uganda Virunga Mts: Mt
Muhavura, betw. 2nd Hut
4000 -1.3827 29.6780 1 _ _ _ _ _ G2 (21)
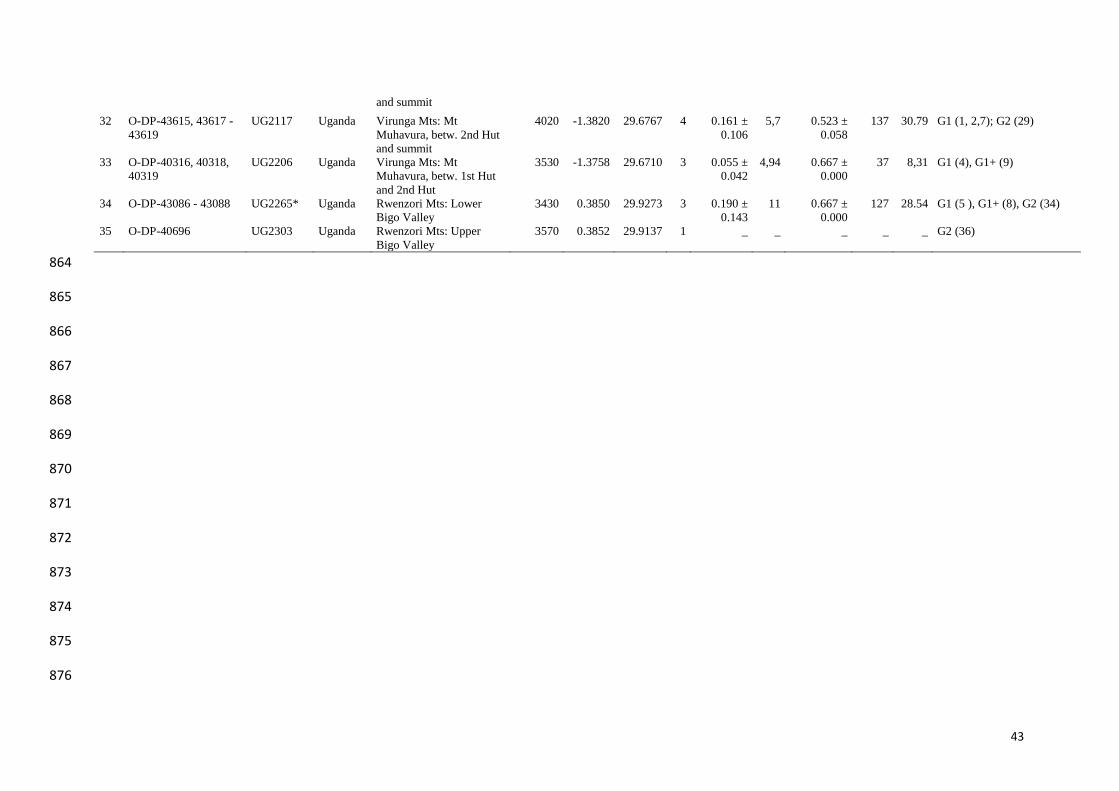
43
and summit
32 O-DP-43615, 43617 -
43619
UG2117 Uganda Virunga Mts: Mt
Muhavura, betw. 2nd Hut
and summit
4020 -1.3820 29.6767 4 0.161 ±
0.106
5,7 0.523 ±
0.058
137 30.79 G1 (1, 2,7); G2 (29)
33 O-DP-40316, 40318,
40319
UG2206 Uganda Virunga Mts: Mt
Muhavura, betw. 1st Hut
and 2nd Hut
3530 -1.3758 29.6710 3 0.055 ±
0.042
4,94 0.667 ±
0.000
37 8,31 G1 (4), G1+ (9)
34 O-DP-43086 - 43088 UG2265* Uganda Rwenzori Mts: Lower
Bigo Valley
3430 0.3850 29.9273 3 0.190 ±
0.143
11 0.667 ±
0.000
127 28.54 G1 (5 ), G1+ (8), G2 (34)
35 O-DP-40696 UG2303 Uganda Rwenzori Mts: Upper
Bigo Valley
3570 0.3852 29.9137 1 _ _ _ _ _ G2 (36)
864
865
866
867
868
869
870
871
872
873
874
875
876
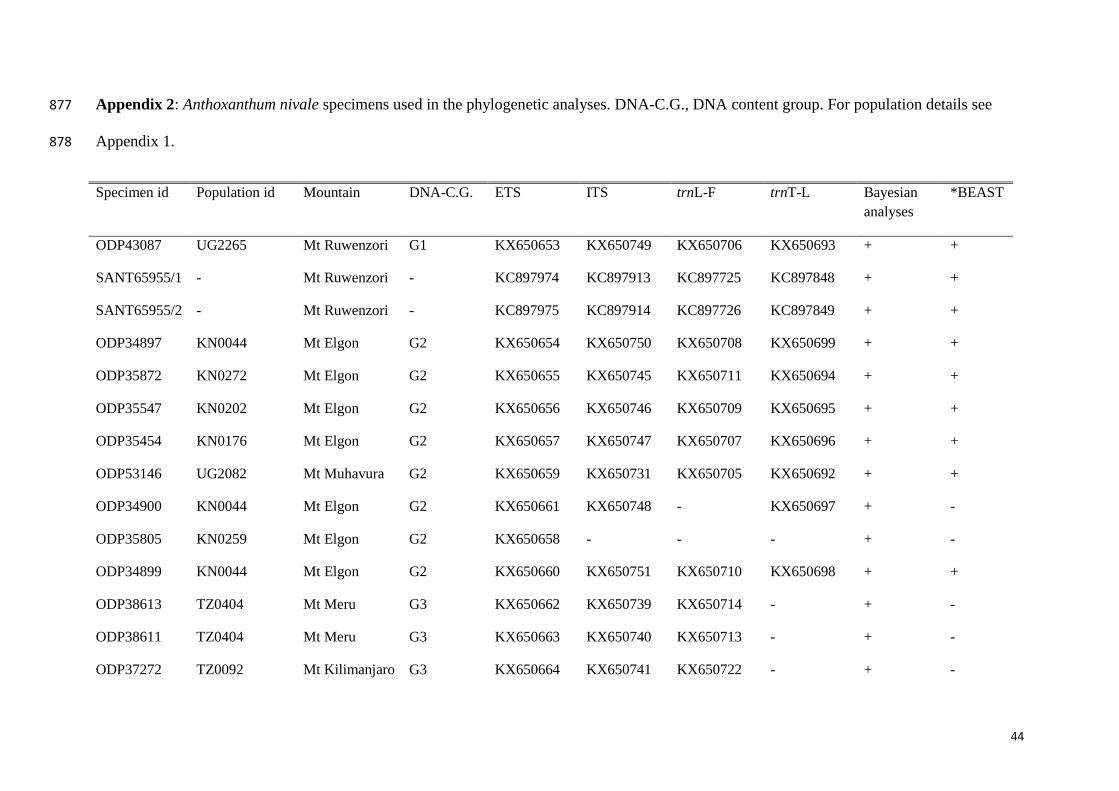
44
Appendix 2: Anthoxanthum nivale specimens used in the phylogenetic analyses. DNA-C.G., DNA content group. For population details see 877
Appendix 1. 878
Specimen id Population id Mountain DNA-C.G. ETS ITS trnL-F trnT-L Bayesian
analyses
*BEAST
ODP43087 UG2265 Mt Ruwenzori G1 KX650653 KX650749 KX650706 KX650693 + +
SANT65955/1 - Mt Ruwenzori - KC897974 KC897913 KC897725 KC897848 + +
SANT65955/2 - Mt Ruwenzori - KC897975 KC897914 KC897726 KC897849 + +
ODP34897 KN0044 Mt Elgon G2 KX650654 KX650750 KX650708 KX650699 + +
ODP35872 KN0272 Mt Elgon G2 KX650655 KX650745 KX650711 KX650694 + +
ODP35547 KN0202 Mt Elgon G2 KX650656 KX650746 KX650709 KX650695 + +
ODP35454 KN0176 Mt Elgon G2 KX650657 KX650747 KX650707 KX650696 + +
ODP53146 UG2082 Mt Muhavura G2 KX650659 KX650731 KX650705 KX650692 + +
ODP34900 KN0044 Mt Elgon G2 KX650661 KX650748 - KX650697 + -
ODP35805 KN0259 Mt Elgon G2 KX650658 - - - + -
ODP34899 KN0044 Mt Elgon G2 KX650660 KX650751 KX650710 KX650698 + +
ODP38613 TZ0404 Mt Meru G3 KX650662 KX650739 KX650714 - + -
ODP38611 TZ0404 Mt Meru G3 KX650663 KX650740 KX650713 - + -
ODP37272 TZ0092 Mt Kilimanjaro G3 KX650664 KX650741 KX650722 - + -
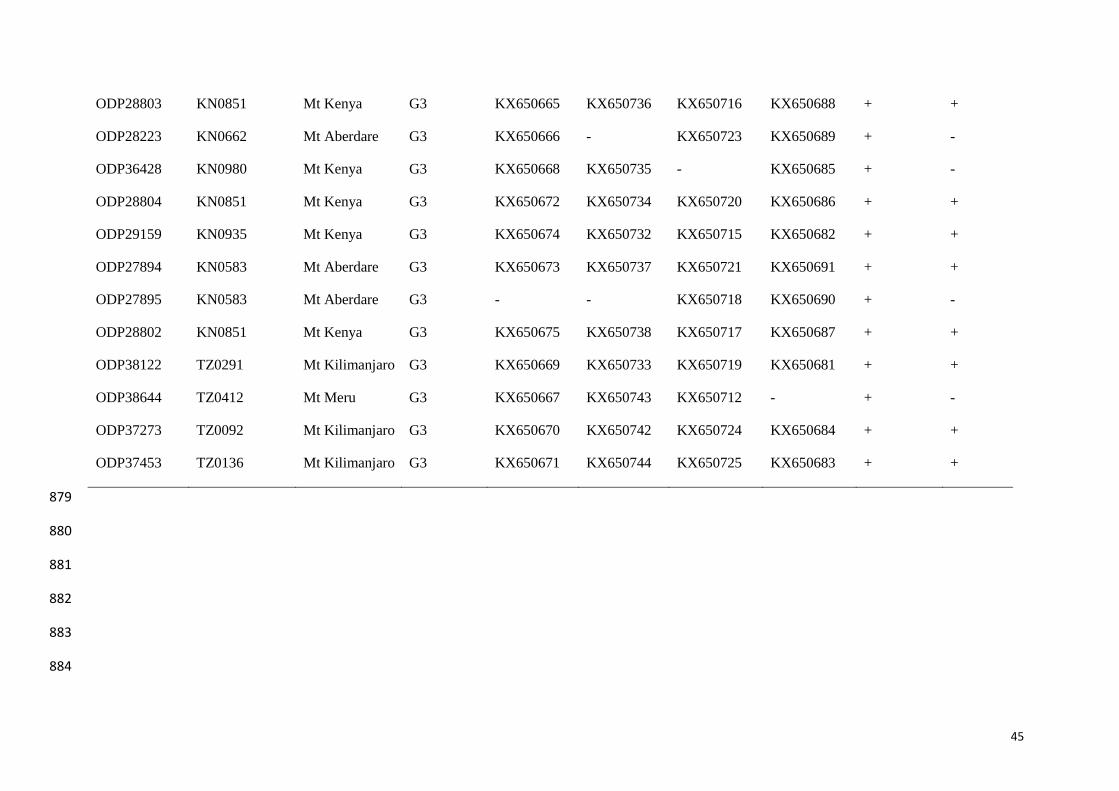
45
ODP28803 KN0851 Mt Kenya G3 KX650665 KX650736 KX650716 KX650688 + +
ODP28223 KN0662 Mt Aberdare G3 KX650666 - KX650723 KX650689 + -
ODP36428 KN0980 Mt Kenya G3 KX650668 KX650735 - KX650685 + -
ODP28804 KN0851 Mt Kenya G3 KX650672 KX650734 KX650720 KX650686 + +
ODP29159 KN0935 Mt Kenya G3 KX650674 KX650732 KX650715 KX650682 + +
ODP27894 KN0583 Mt Aberdare G3 KX650673 KX650737 KX650721 KX650691 + +
ODP27895 KN0583 Mt Aberdare G3 - - KX650718 KX650690 + -
ODP28802 KN0851 Mt Kenya G3 KX650675 KX650738 KX650717 KX650687 + +
ODP38122 TZ0291 Mt Kilimanjaro G3 KX650669 KX650733 KX650719 KX650681 + +
ODP38644 TZ0412 Mt Meru G3 KX650667 KX650743 KX650712 - + -
ODP37273 TZ0092 Mt Kilimanjaro G3 KX650670 KX650742 KX650724 KX650684 + +
ODP37453 TZ0136 Mt Kilimanjaro G3 KX650671 KX650744 KX650725 KX650683 + +
879
880
881
882
883
884
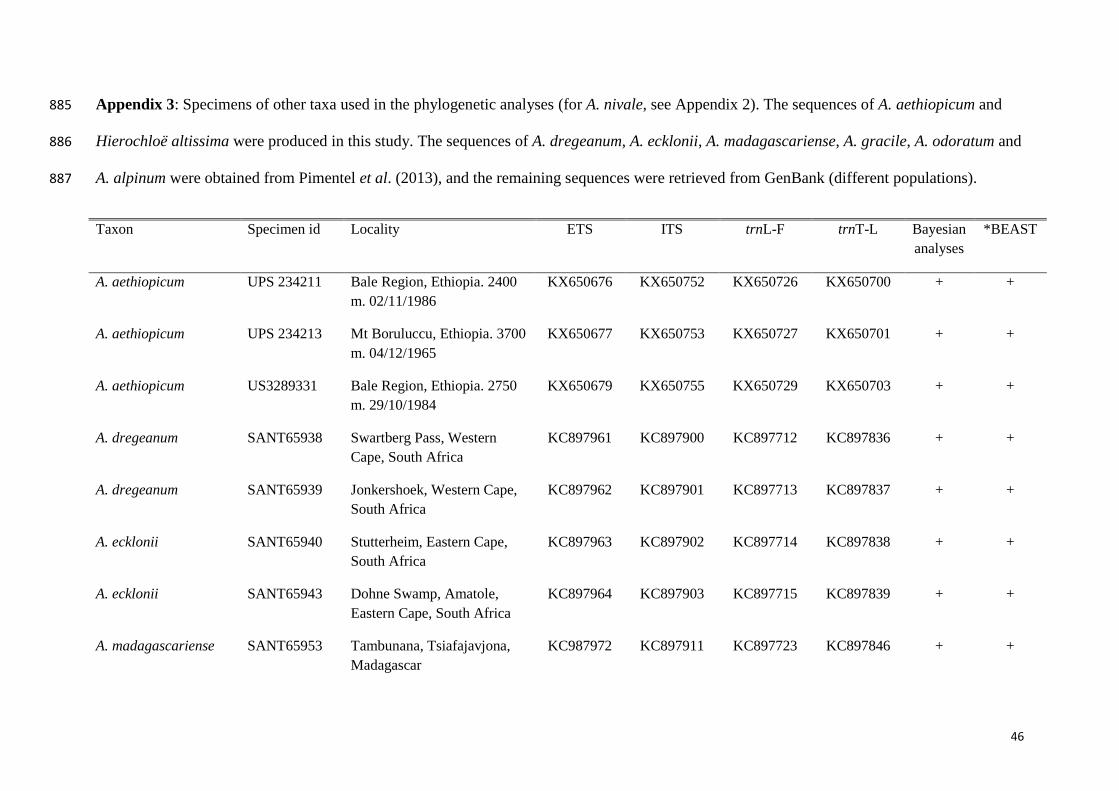
46
Appendix 3: Specimens of other taxa used in the phylogenetic analyses (for A. nivale, see Appendix 2). The sequences of A. aethiopicum and 885
Hierochloë altissima were produced in this study. The sequences of A. dregeanum, A. ecklonii, A. madagascariense, A. gracile, A. odoratum and 886
A. alpinum were obtained from Pimentel et al. (2013), and the remaining sequences were retrieved from GenBank (different populations). 887
Taxon Specimen id Locality ETS ITS trnL-F trnT-L Bayesian
analyses
*BEAST
A. aethiopicum UPS 234211 Bale Region, Ethiopia. 2400
m. 02/11/1986
KX650676 KX650752 KX650726 KX650700 + +
A. aethiopicum UPS 234213 Mt Boruluccu, Ethiopia. 3700
m. 04/12/1965
KX650677 KX650753 KX650727 KX650701 + +
A. aethiopicum US3289331 Bale Region, Ethiopia. 2750
m. 29/10/1984
KX650679 KX650755 KX650729 KX650703 + +
A. dregeanum SANT65938 Swartberg Pass, Western
Cape, South Africa
KC897961 KC897900 KC897712 KC897836 + +
A. dregeanum SANT65939 Jonkershoek, Western Cape,
South Africa
KC897962 KC897901 KC897713 KC897837 + +
A. ecklonii SANT65940 Stutterheim, Eastern Cape,
South Africa
KC897963 KC897902 KC897714 KC897838 + +
A. ecklonii SANT65943 Dohne Swamp, Amatole,
Eastern Cape, South Africa
KC897964 KC897903 KC897715 KC897839 + +
A. madagascariense SANT65953 Tambunana, Tsiafajavjona,
Madagascar
KC987972 KC897911 KC897723 KC897846 + +

47
A. gracile SANT65965 Lago Corsi, Iglesias,
Sardinia, Italy
KC897967 KC897906 KC897718 KC897842 + +
A. odoratum SANT65957 Little Sugar Loaf, Wicklow,
Ireland
KC897980 KC897921 KC897733 KC897856 + +
A. odoratum SANT65959 Carrigoona, Wicklow, Ireland KC897977 KC897916 KC897728 KC897851 + +
A. odoratum SANT65958 Carrickgollogan, Dublin,
Ireland
KC897976 KC897915 KC897727 KC897850 + +
A. odoratum SANT53424 Marei, O Corgo, Galicia,
Spain
KC897983 KC897924 KC897736 KC897859 + +
A. odoratum SANT52208 Jehlanka chalet, Rokytnice,
Czech Republic
KC897992-
KC897994
KC897933-
KC897935
KC897745-
KC897747
KC897868-
KC987870
+ +
A. odoratum SANT53394 Norrbotten, Sweden - - KC897696 KC897945 + -
A. alpinum SANT52191 Brévent, Chamonix, France KC897944 KC897883 KC897695 KC897819 + -
Hierochloë altissima SANT72671 Caleta el Molinar, Niebla,
Valdivia, Chile
KX650678 KX650754 KX650730 KX650704 + +
Helictotrichon sp. GenBank GenBank GQ324269 DQ336820.1 DQ336840.1 DQ336865.1 - +
Festuca pratensis GenBank GenBank JN187582 JN187604 JN187652 JQ973011.1 - +
Lolium perenne GenBank GenBank JN187583 JN187605 JN187653 KC897880 - +
Puccinellia sp. GenBank GenBank GQ283196.1 AF532934.1 AF533024.1 DQ336859 - +
Poa sp. GenBank GenBank GQ324369.1 JF904811.1 JN030969.1 JN030969.1 - +
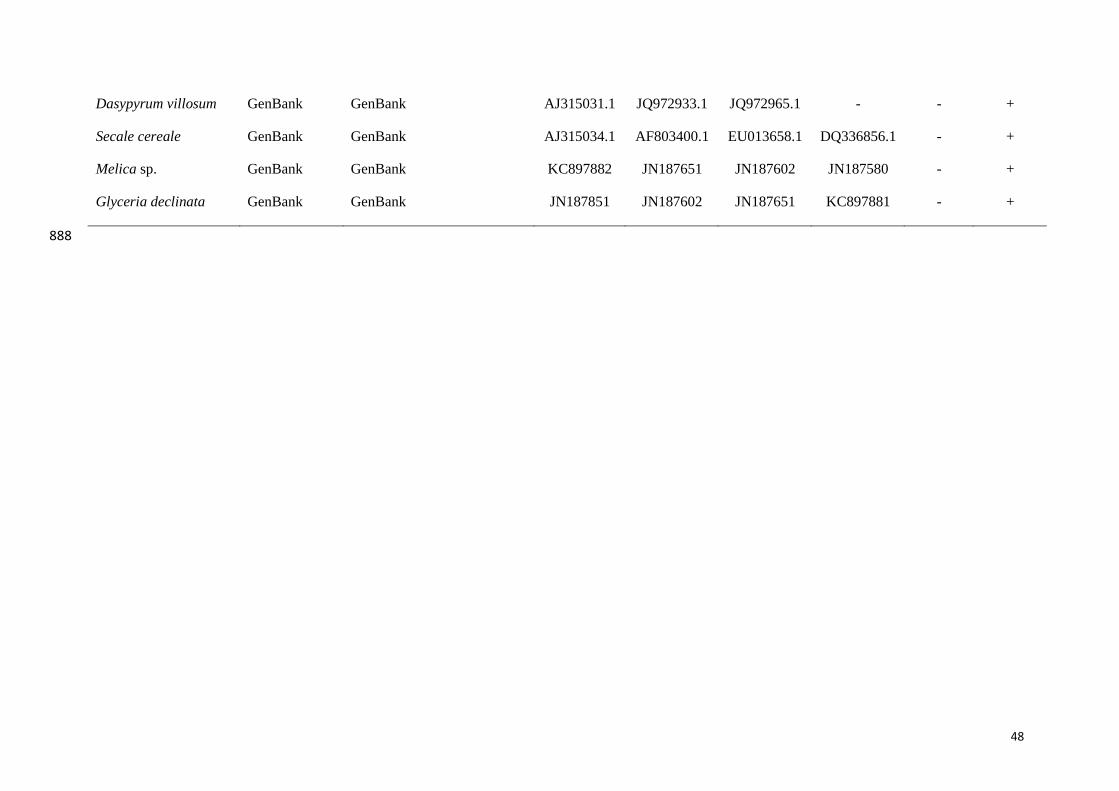
48
Dasypyrum villosum GenBank GenBank AJ315031.1 JQ972933.1 JQ972965.1 - - +
Secale cereale GenBank GenBank AJ315034.1 AF803400.1 EU013658.1 DQ336856.1 - +
Melica sp. GenBank GenBank KC897882 JN187651 JN187602 JN187580 - +
Glyceria declinata GenBank GenBank JN187851 JN187602 JN187651 KC897881 - +
888
49
Figure legends 889
Fig. 1. Distribution area of Sub-Saharan species and map of sampled populations. (a) Total 890
distribution of Anthoxanthum in sub-Saharan Africa, representing five largely allopatric 891
endemic species. Dots represent sampling sites for material included in the study. (b) 892
Sampling sites covering the entire geographic distribution of the East African endemic A. 893
nivale, showing the three DNA-content groups (G1: 1.6; G2: 2.89; G3: 4.78) identified using 894
flow cytometry and the two genetic groups (grey and white) inferred from STRUCTURE 895
analyses of 424 AFLP markers scored in 125 plants (35 populations). The stippled lines 896
represent the Great Rift Valley system. 897
Fig. 2. Majority rule consensus tree inferred from Bayesian analysis (MrBayes) of plastid 898
DNA sequences (trnT-L and trnL-F). Forty-four samples representing eight Anthoxanthum 899
taxa and one outgroup (Hierochloë altissima) are represented in the tree. The symbol // 900
denotes branches that were shortened to simplify presentation. Dashed lines indicate branches 901
with PP<0.8. For each terminal, the species name is followed by accession number 902
(Appendix 1), DNA-content group (G1-G3; for A. nivale only) or ploidy level (only known 903
for Eurasian taxa), and geographic origin (for A. nivale: EM - Eastern Mountains, WM - 904
Western Mountains). 905
Fig. 3. Majority rule consensus tree inferred from Bayesian analysis (MrBayes) of nuclear 906
ribosomal DNA sequences (ITS and ETS). Forty-seven samples representing eight 907
Anthoxanthum taxa and one outgroup (Hierochloë altissima) are represented in the tree. The 908
symbol // denotes branches that were shortened to simplify presentation. Dashed lines 909
indicate branches with PP<0.8. For each terminal, the species name is followed by accession 910
number (Appendix 1), DNA-content group (G1-G3; for A. nivale only) or ploidy level (only 911
50
known for Eurasian taxa), and geographic origin (for A. nivale: EM - Eastern Mountains, 912
WM - Western Mountains). 913
Fig. 4. Multilabelled maximum clade credibility species tree obtained in the *BEAST 914
analysis. In A. nivale, the Eastern Mountains (EM) group is inferred to be hybridogenous 915
(represented twice in the tree). Dashed lines indicate branches with PP<0.8. Bars show the 916
95% confidence interval for the age of the divergence. A, B, and C are nodes discussed in 917
detail in the text. 918
Fig. 5. Distribution of distances between each gene tree and each of 1000 simulated gene 919
trees from coalescence simulations. (a) distances of simulated gene trees from the plastid 920
gene tree. Black bars, Ne (effective population size)=10000; dark gray bars, Ne=250000; 921
light gray bars, Ne=1000000. (b) distances of simulated gene trees from the nuclear gene tree. 922
Black bars, Ne=10000; dark gray bars, Ne=4000000; light gray bars, Ne=1000000. The 923
arrow indicates the distance between the original plastid and nuclear gene trees. 924
Fig. 6. Genetic diversity and structuring in the East African A. nivale based on 424 AFLP 925
markers (126 plants, 35 populations). The three DNA-content groups are indicated as G1-G3, 926
the two genetic groups as grey and white, and the different mountains as symbols. (a) Genetic 927
groups inferred from STRUCTURE analyses (K = 2). (b) Principal Coordinates Analysis 928
(PCoA) based on Dice’s coefficient of similarity among the 125 AFLP genotypes. (c) 929
Neighbour-Joining dendrogram computed from pairwise Fst values as measures of distance 930
among the 35 populations. Branch support was estimated using 1000 bootstrap replicates 931
(only values >50% shown for major branches). 932
933 934
935 936 937
51
Short legends for SI figures 938
Fig. S1 DNA-content in 125 plants of Anthoxanthum nivale inferred from flow cytometry 939
analysis. 940
Fig. S2 Boxplots showing variation in the three DNA-content groups detected in A. nivale. 941
Fig. S5 Tanglegram of Bayesian maximum clade credibility trees based on plastid (right) and 942
nuclear (left) data. 943
Fig. S6 Results of STRUCTURE analyses based on AFLP data used to determine optimal 944
number of genetic groups (K) in A. nivale (left: total dataset; middle: Eastern Mountain 945
group; right: Western Mountain group). 946
Fig. S7 Principal Coordinates Analyses (PCoA) based on Dice’s coefficient of similarity 947
among AFLP genotypes of A. nivale. 948
949
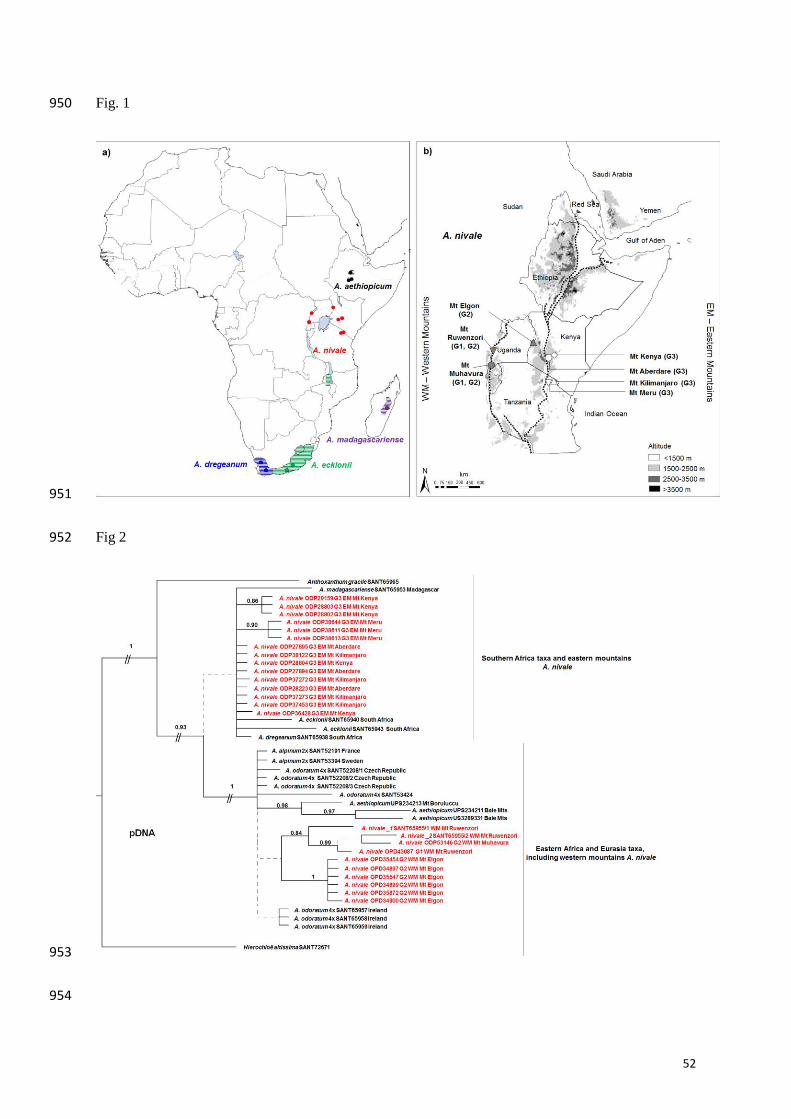
52
Fig. 1 950
951
Fig 2 952
953
954
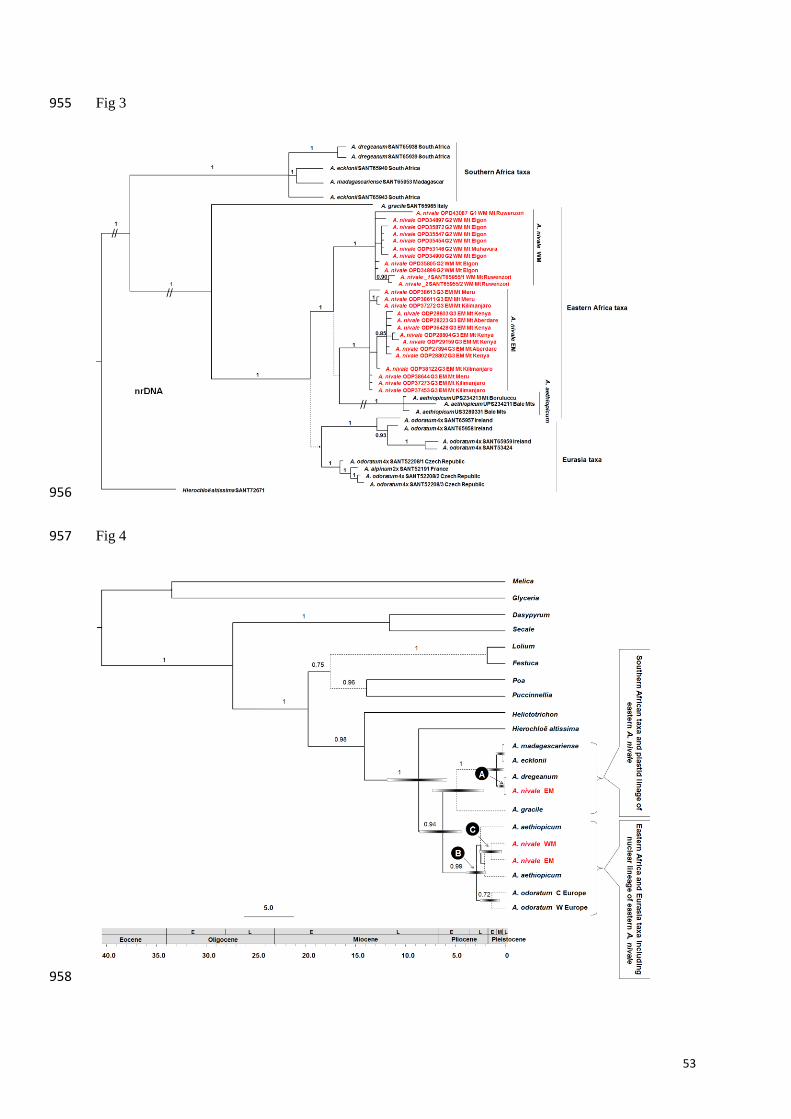
53
Fig 3 955
956
Fig 4 957
958
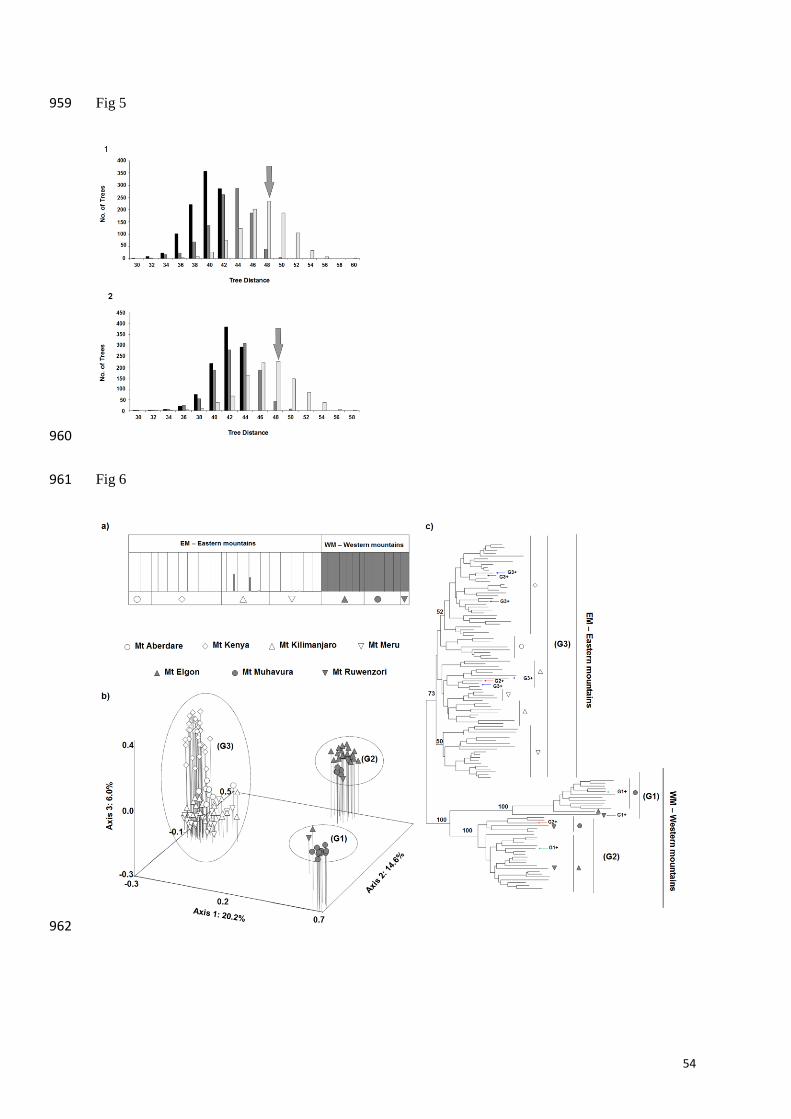
54
Fig 5 959
960
Fig 6 961
962