1 evaluation overview wanda hemsworth dr. finlay mcalister dr. merril knudtson april 14, 2008
TRANSCRIPT

1
Evaluation Overview
Wanda HemsworthDr. Finlay McAlisterDr. Merril Knudtson
April 14, 2008

2
Agenda
Expected Outcomes from the Evaluation
Definitions & Principles
Evaluation Framework / Plan
Key Performance Indicators
Data Collection Process
Data Sources
Lessons Learned
Importance of Local Data Collection
Regional Cardiac Data from APPROACH

3
Expected Outcomes from Evaluation
Viability & sustainabilit
y of province-
wide rollout
Improved access to cardiac health
services demonstrate
d
Increased patient &
practitioner satisfaction demonstrate
d Improved compliance with care guidelines
demonstrated
Improved health
outcomes demonstrate
d
Regional differences / similarities highlighted
Data source for research
papers
Baseline for future
initiatives
Scorecard for ongoing
performance monitoring
WTMSC Accountability /Requirements
Met
Alignment with Alberta
Quality Matrix Shown
Shared learnings for
policy & program
development

4
• Describes what happens subsequent to the delivery of the project
• Assesses whether the expected outcomes have been achieved
• Determines the overall project impact and estimates the relative costs
• Key Performance Indicators are quantifiable performance measurements used to define success factors and measure progress toward the achievement of goals
Indicator
Evaluation
Definitions and Principles
• Conducted to maximize credibility and objectivity of results
• Open and transparent
• Breadth and depth is reasonable and possible given the realities of the environment
• Opportunities to share results and lessons learned is optimized
Principles

5
Benefit / Expected Outcome
Planned Intervention / Activity
Evaluation Questions
Key Performance MeasuresPotential Data Source / Data
Collection PlanAnalysis Plan
AH&W Quality Matrix Support
Initiative Profile
Program Goals
Strong, well-developed Evaluation Framework / Plan
Evaluation Framework Building Blocks
4. Data Elements
3. Indicators
2. Evaluation Questions
1. Evaluation Objectives
5. Data Sources and Primary Research Projects
6. Data Collection Methods
7. Analytical Methods

6
Selection of Appropriate Key Performance Indicators
Evaluation Plan
Patient Navigation
Heart
Failure
Early Reperfusion
Region 9Region 1 (total sites xx )
Evaluation Plan
Patient Navigation
Heart
Failure
Early Reperfusion
Region 9Region 1 (total sites xx )
Site 1
(urban)
Site 1 Site 1 Site 1Site 2
(rural)
Site 2 Site 2 Site 2
ER
HF
PN
Agr
eed
Prog
ram
Indi
cato
rs
Program Indicators
from Sites
Level 4
Level 3
Level 2
Level 1
Regions/Sites
Pro
gra
ms/
Ind
icat
ors
How Sites were selected: • Patient Relevance (availability of data)
• Capacity (cycles to undertake)
• Readiness to Deploy (resources, physicians)
• Balance of Coverage (Programs - Regions)
• ACAC Budget (available funding/budget)
• Representative Population BaseHow Indicators were selected (by site): • Optimal Program Coverage & Site Contribution
• Noticeable improvement expected within evaluation timeframe
• Indicators should be Outcome based
• Demonstrate achievement of stated goals
• Definitions consistent across implementation variations
• Baseline available or easily determined
• Data easily collected & measured

7
Compliance with Care Guidelines # of STEMI patients provided with discharge
instructions in compliance with Safer Healthcare Now guidelines.
# and % patients receiving education and discharge instructions from HFC before hospital discharge
# of appropriate referrals
Project Success Number and type of multidisciplinary teams
formed; # of staff recruited & trained # and type of resources (e.g. tools) and
interventions developed and made available through patient navigation system
Number of multi-regional meeting/working sessions held
Number of sites participating Financial impact
Access to Cardiac Services Time to lytics < 30 minutes Time to primary PCI < 90 minutes Time from referral to initial HFC visit < 4 wks % of HF patients enrolled in a Heart Failure
Clinic Time from onset of symptoms to GP visit # of services booked by nurse navigator
Satisfaction Patient Satisfaction Clinician Satisfaction Provider Satisfaction Interviews with Project Teams
Examples of Key Performance Indicators

8
Flexible Data Collection Process
Individual Sites in Each Region
Collect Data
Databases
Surveys
Chart Reviews
SpreadsheetsRegional Data Collection
CoordinatorsCollect raw data from each site
in their regionStrip Identifiable patient
information from raw data Conduct Data Quality Checks
Data transferred to the Evaluation Repository in Capital Health through secure channels (i.e. SFTP)
External EvaluatorsConduct Data
Aggregation & Analysis
Compile Evaluation Report
Submit Evaluation Report to Alberta Wait Times Steering Committee
Evaluation Report
Alberta Health and Wellness
Provide data for comparison and supporting purposes
Evaluation Repository
9
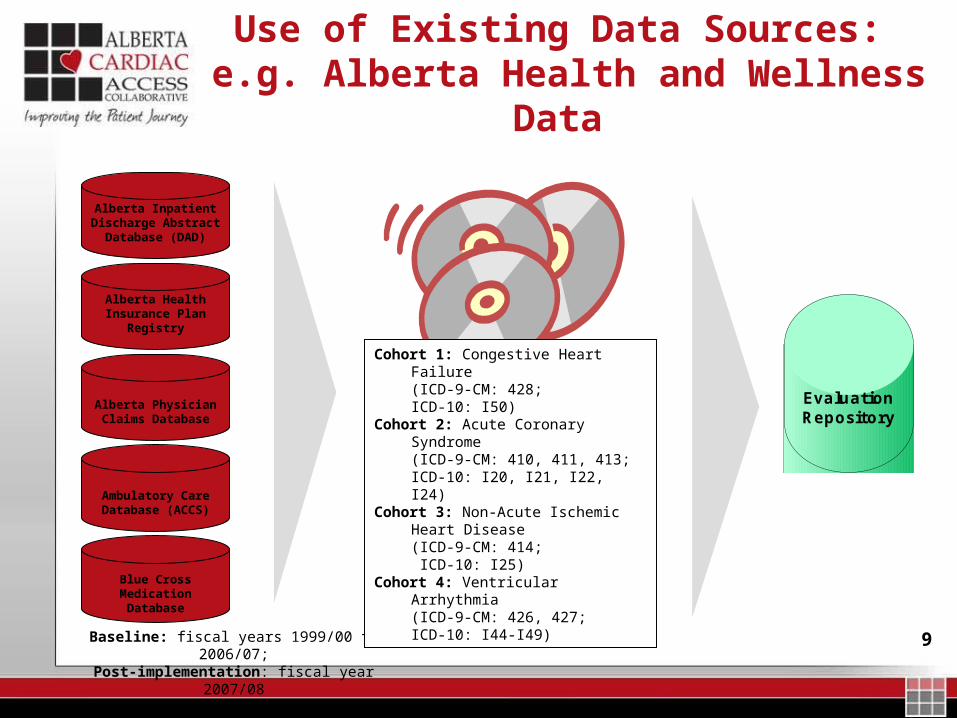
Use of Existing Data Sources: e.g. Alberta Health and Wellness Data
Evaluation Repository
Alberta Inpatient Discharge Abstract
Database (DAD)
Alberta Health Insurance Plan
Registry
Alberta Physician Claims Database
Ambulatory Care Database (ACCS)
Blue Cross Medication Database
Baseline: fiscal years 1999/00 to 2006/07;Post-implementation: fiscal year 2007/08
Cohort 1: Congestive Heart Failure (ICD-9-CM: 428;ICD-10: I50)
Cohort 2: Acute Coronary Syndrome (ICD-9-CM: 410, 411, 413; ICD-10: I20, I21, I22, I24)
Cohort 3: Non-Acute Ischemic Heart Disease (ICD-9-CM: 414; ICD-10: I25)
Cohort 4: Ventricular Arrhythmia (ICD-9-CM: 426, 427;ICD-10: I44-I49)

10
Lessons Learned
Collaborative and iterative approach to defining indicators
Involvement of project teams, program co-chairs in identification / definition
Workshops with regions to clarify and identify issues / variations
Desire to measure everything of interest
Focus on measures that will showcase improvement / achievement of goals
Balance local collection of data with provincial data sources
Factor in regional variations (implementation plans, processes, definitions) where possible when determining indicators
If variations are too great, consider selecting other indicators
Leverage project teams’ and regions’ past experiences with research and evaluation
Look for solutions that take into consideration:
Limited capability and resources in field to collect data
Aggressive timelines

11
Why do we need primary data collection too?
The Treatment-Risk Paradox in coronary disease – a cautionary tale
Some pts are less likely to be prescribed proven efficacious Rx:
Older pts
Women
Minorities
Socially Disadvantaged
Multiple co-morbidities

12
Copyright restrictions may apply.
Ko, D. T. et al. JAMA 2004;291:1864-1870.
Lipid lowering therapy with statins in high-risk elderly patients
OR for statin prescription in high risk pts vs. others: 0.75

13
Explanations for the Treatment-Risk Paradox
1) “…physicians may have misconceptions about the benefit-harm tradeoff”
2) “…physicians may prejudge the compliance of their patients”
3) “…may be explained by physician inattentiveness to cardiovascular prevention”
“…the survival benefits of statin therapy may never be fully realized until physicians appropriately attune their prescribing behaviors to the risk profiles of their pts”
14
Editorial in Am Heart J
“…it is the premise of matching risk to level of care that physicians fail to accept, heed, or understand”
Blazing M. Am Heart J 2005;149:381-383.

15
Is the treatment-risk paradox really due to clinician bias?
Prospective cohort study
3871 pts with CAD in AB cath labs between Feb 2004 and Nov 2005
Excluded deaths/CABG during index hospitalization
Detailed CLINICAL data at baseline
Mean age 64 (52% younger than 65), 78% men, Duke Jeopardy score mean 38%

16
Co-morbidities
0
10
20
30
40
50
60
70
HTN DM CKD COPD Smoker
17
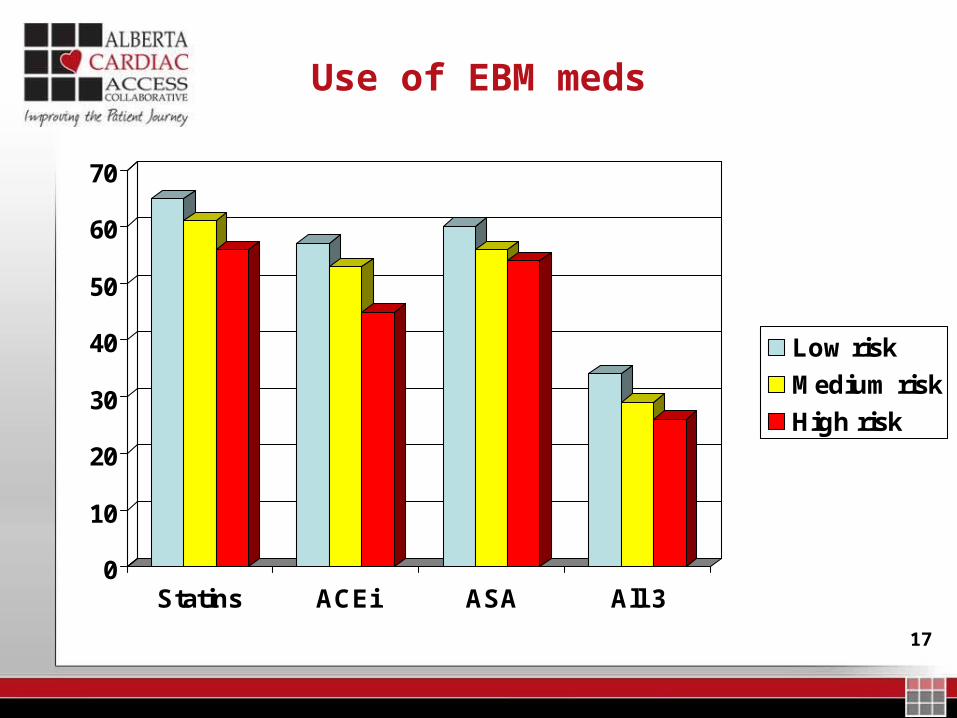
Use of EBM meds
0
10
20
30
40
50
60
70
Statins ACEi ASA All 3
Low risk
Medium risk
High risk

18
OR for statin prescription in high risk patients
28% less likely to get statin if “high risk”

19
OR for statin prescription in high risk patients
22% less likely to get statin if “high risk” after adjustment

20
OR for statin prescription in high risk patients

21
Bottom line
There is no treatment-risk mismatch if you include all clinical variables, including coronary anatomy,
patient functional status, and quality of life (none of which are in administrative data)

22
So…
Administrative databases don’t capture therichness and subtleties of clinical care
23
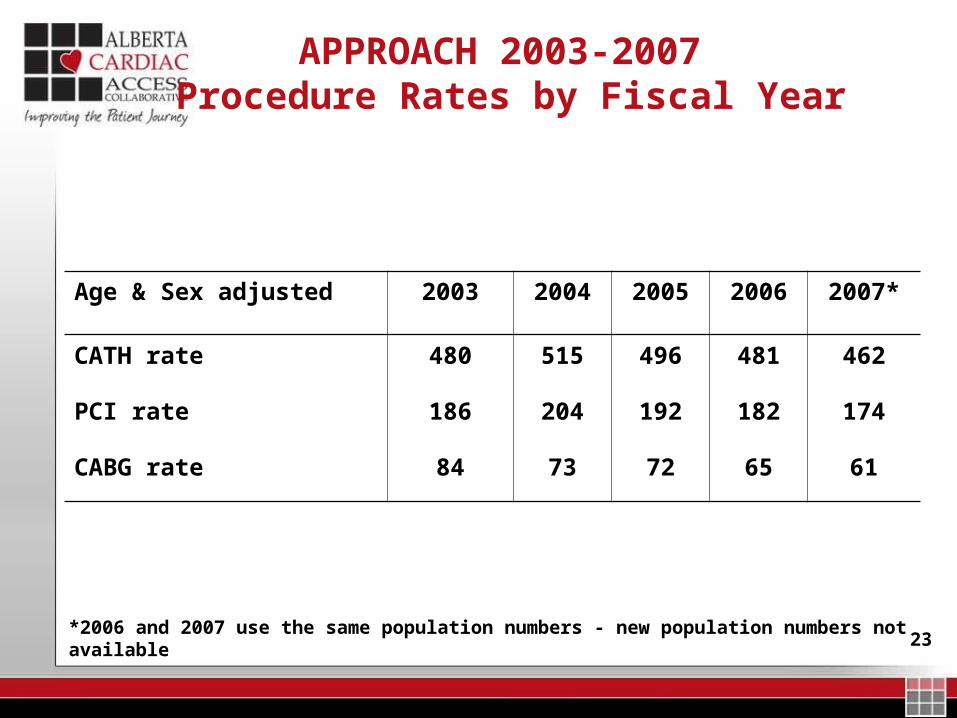
APPROACH 2003-2007 Procedure Rates by Fiscal Year
Age & Sex adjusted 2003 2004 2005 2006 2007*
CATH rate 480 515 496 481 462
PCI rate 186 204 192 182 174
CABG rate 84 73 72 65 61
*2006 and 2007 use the same population numbers - new population numbers not available

240
100
200
300
400
500
600
700
Chinook Palliser Calgary DavidThompson
East Central Capital Aspen PeaceCountry
NorthernLights
Total
Catheterizations 2003 Catheterizations 2004 Catheterizations 2005 Catheterization 2006 Catheterization 2007
Age and Sex-Adjusted Catheterization Rates by RHA
25
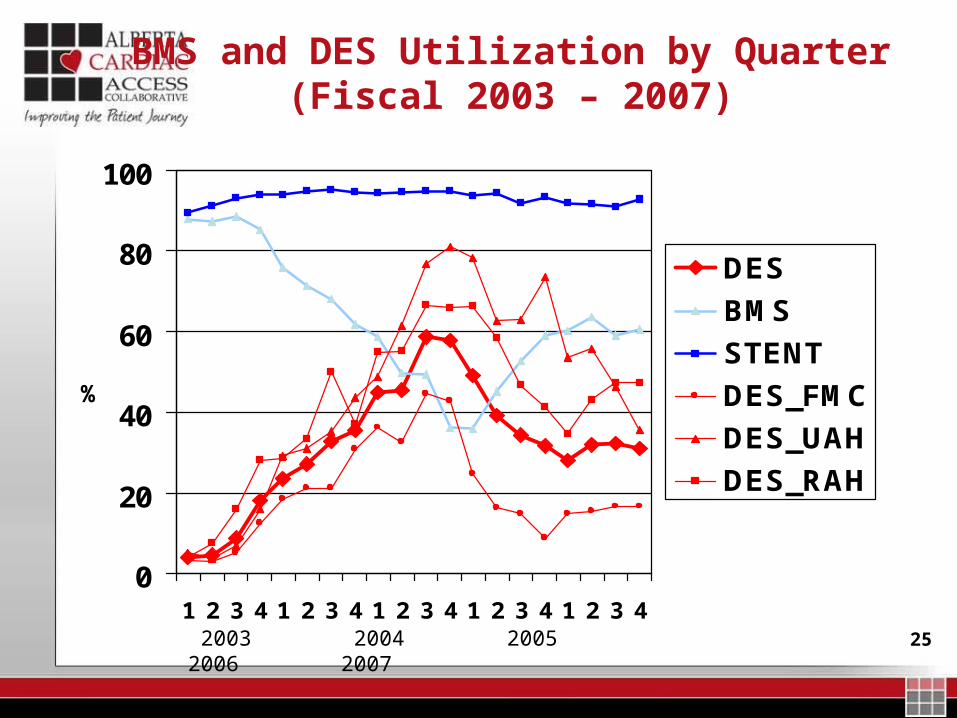
BMS and DES Utilization by Quarter(Fiscal 2003 – 2007)
0
20
40
60
80
100
1 2 3 4 1 2 3 4 1 2 3 4 1 2 3 4 1 2 3 4
DES
BMS
STENT
DES_FMC
DES_UAH
DES_RAH
2003 2004 2005 2006 2007
%

26
Risk-adjusted 30-Day AMI Mortality Rates
0
2
4
6
8
10
12
14
Chinook Palliser Calgary DTHR ECentral
Capital Aspen PeaceCountry
2000-02 2003-05
%
www.CIHI.ca/ Indicators

27
Questions?