1 fact book 2010 fact book 2010. 2 florida keys community college fact book 2010 president dr....
TRANSCRIPT

1
Fact Fact BookBook
20102010
FACT BOOK 2010

2
Florida Keys Community College
Fact Book 2010President
Dr. Lawrence Tyree
District Board of TrusteesSpencer Slate, Chair
Kim Bassett, Vice ChairEdwin Scales
Dr. Antoinette MartinAnn O’Bannon
Vice President/Instructional AffairsDr. Randy Charles
Fact Book 2010 Produced by the Office of Accreditation and Assessment
Dr. Erika MacWilliamsJillian Manzer
www.fkcc.edu
FKCC Locations:
Main CampusWilliam A. Seeker Campus5901 College RoadKey West, FL 33040(305) 296-9081
Middle Keys CenterIn Marathon High School900 Sombrero Beach RoadMarathon, FL 33050 (305) 743-2133
Upper Keys Center89951 US Highway 1Tavernier, FL 33070(305) 852-8007
The College will not tolerate any form of discrimination towards employees and applicants in its employment policies and practices on the basis of race, religion,
gender, age, sexual orientation, marital status, national origin or disability.
Florida Keys Community College is accredited by the Commission on Colleges of the Southern Association of Colleges and Schools to award the associate degree. Contact the Commission on Colleges at 1866 Southern
Lane, Decatur, Georgia 30033-4097 or call 404-679-4500 for questions about the accreditation of Florida Keys Community College.

3
Table of ContentsFKCC Student Headcount Enrollment 5FCCS: Ethnicity Headcount Enrollment 6FKCC: Ethnicity Headcount Enrollment 7FCCS: Minority Headcount Enrollment 8FKCC: Minority Headcount Enrollment 9Longitudinal Headcount by Gender 10Headcount by Ethnicity & Gender 11Headcount Enrollment by Program Area 12Headcount Enrollment for AA Program 13Headcount Enrollment for AS Program
14Headcount Enrollment for PSAV 15Headcount Enrollment for PSV 16
FKCC Program Completers 17Longitudinal Program Completers 18Program Completers for AA Degree 19Program Completers for AS Degree 20Program Completers for PSAV Certificate 21Program Completers for PSV Certificate 22
FKCC Employee Information 23Headcount by Occupational Activity 24Employees by Gender and Ethnicity Fall 2004 25FKCC & FCCS: Degree Level of F/T Instruct. 26FKCC: F/T Instructional Headcount 27FCCS: F/T Instructional Headcount 28FKCC: Instruct.Headcount by Gender & Ethnicity 29FCCS: Instruct. Headcount by Gender & Ethnicity 30FKCC & FCCS: Average Instructional Salary 31FKCC: Average F/T Instructional Salary 32FCCS: Average F/T Instructional Salary 33
Financial Information 34FKCC & FCCS: Annual Cost Analysis 2003-2004
35Longitudinal Cost Analysis by Function 36Longitudinal Expenditures by Function
37Longitudinal Cost Analysis Expenditures 38FKCC & FCCS Average: Full Cost Summary 39FKCC Longitudinal Full Cost Summary Report
40Fees for Credit Programs for Resident Students 41Fees for Credit Programs for Non-Resident Students
42FKCC & FCCS: Student Fee Comparison 43FKCC Resident & Non-Resident Fee Comparison
44
Facilities45
Sites, Inventory and Value 46
Learning Resources Center 47
Attendance 48
Transactions 49
Interlibrary Loans 50
Tours, Orientations, & Workshops 51
Participants in Programs 52Computer Lab Usage 53
Glossary54
_______________________________________

4
FKCC Student Headcount Enrollment
5
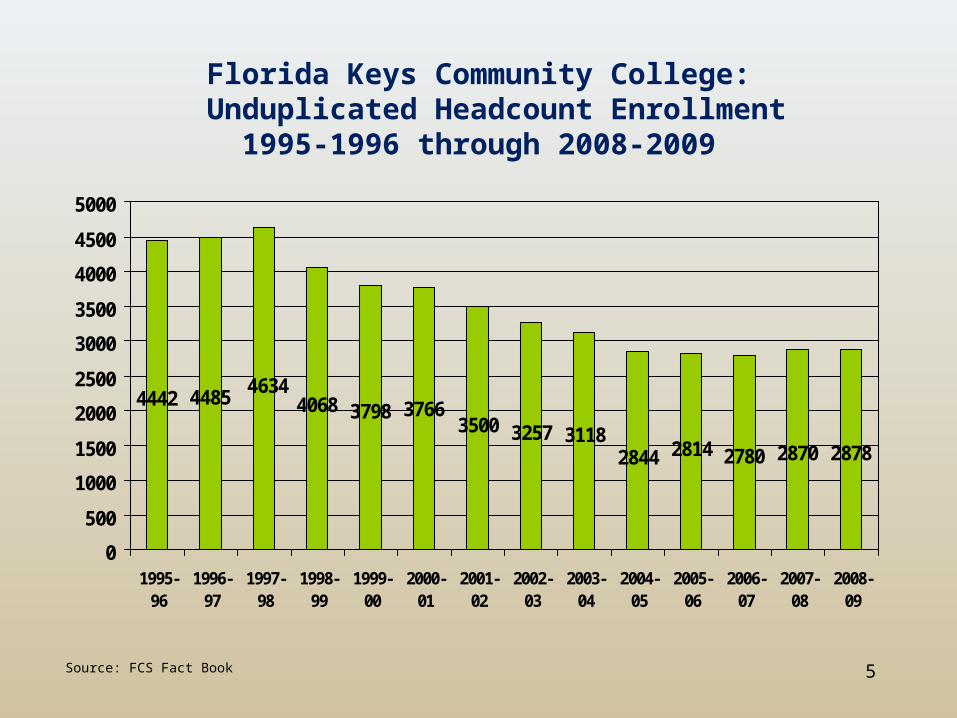
Florida Keys Community College: Unduplicated Headcount Enrollment
1995-1996 through 2008-2009
4442 4485
2780 2870 2878
46344068 3798 3766
3500 3257 31182844 2814
0
500
1000
1500
2000
2500
3000
3500
4000
4500
5000
1995-96
1996-97
1997-98
1998-99
1999-00
2000-01
2001-02
2002-03
2003-04
2004-05
2005-06
2006-07
2007-08
2008-09
Source: FCS Fact Book

6
Florida College System: Ethnicity Headcount Enrollment Beginning of Term Fall
2009-2010
Total Minority Enrollment = 42.5%
51%
2%
17%
3%
0%
22%
5%
White Non-Hispanic
Non-ResidentAlien
Black Non-Hispanic
AmericanIndian/AlaskanNativeAsian/PacificIslander
Hispanic
UnknownEthnicity
White Non-Hispanic 228,737
Non-Resident Alien 8,048
Black Non-Hispanic 78,344
American Indian/Alaskan Native
2,062
Asian/Pacific Islander 13,106
Hispanic 97,747
Unknown Ethnicity 21,425
Minority Total 191,259
Source: FCS Fact Book

7
Florida Keys Community College: Ethnicity Headcount Enrollment Beginning of Term Fall
2009-2010
0%
4%
20%
2%
14%
2%
69%
White Non-Hispanic
Non-ResidentAlien
Black Non-Hispanic
AmericanIndian/AlaskanNativeAsian/PacificIslander
Hispanic
UnknownEthnicity
White Non-Hispanic 890
Non-Resident Alien 16
Black Non-Hispanic 105
American Indian/Alaskan Native
7
Asian/Pacific Islander 24
Hispanic 233
Unknown Ethnicity 132
Minority Total 369
Total Minority Enrollment = 26%
Source: FCS Fact Book
8
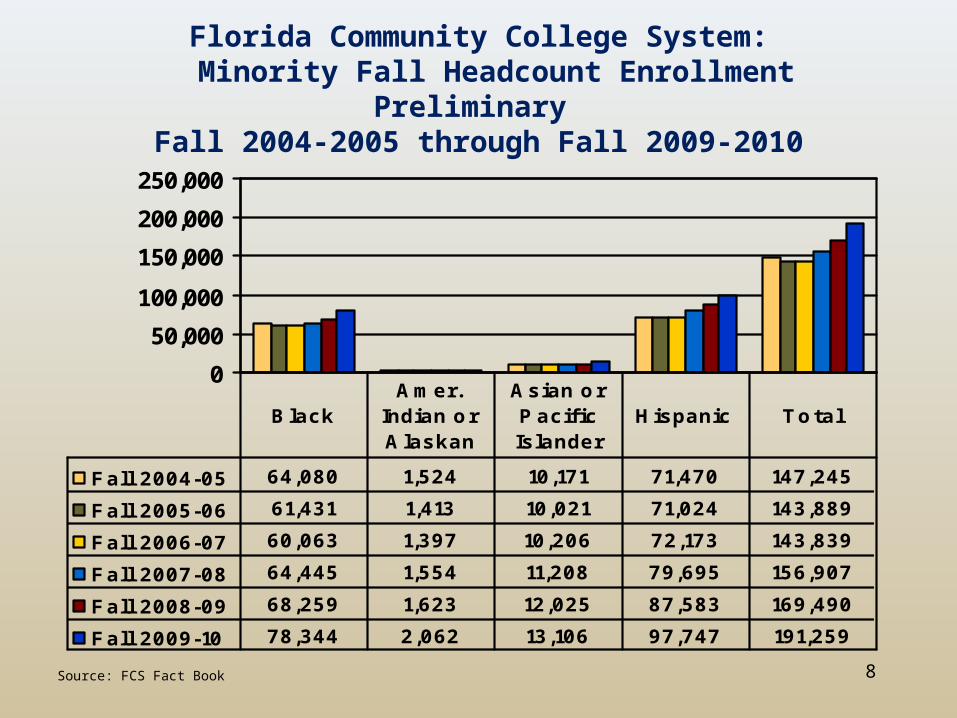
Florida Community College System: Minority Fall Headcount Enrollment Preliminary
Fall 2004-2005 through Fall 2009-2010
0
50,000
100,000
150,000
200,000
250,000
Fall 2004-05 64,080 1,524 10,171 71,470 147,245
Fall 2005-06 61,431 1,413 10,021 71,024 143,889
Fall 2006-07 60,063 1,397 10,206 72,173 143,839
Fall 2007-08 64,445 1,554 11,208 79,695 156,907
Fall 2008-09 68,259 1,623 12,025 87,583 169,490
Fall 2009-10 78,344 2,062 13,106 97,747 191,259
BlackAmer.
Indian or Alaskan
Asian or Pacific Islander
Hispanic Total
Source: FCS Fact Book

9
Florida Keys Community College: Minority Fall Headcount Enrollment Preliminary
Fall 2004-2005 through Fall 2009-2010
0
100
200
300
400
Fall 2004-05 111 5 14 169 299
Fall 2005-06 101 5 17 152 275
Fall 2006-07 77 8 24 131 240
Fall 2007-08 98 7 14 142 261
Fall 2008-09 110 3 21 184 318
Fall 2009-10 105 7 24 233 369
BlackAmer.
Indian or Alaskan
Asian or Pacific Islander
Hispanic Total
Source: FCS Fact Book

10
Florida Keys Community College: Headcount Enrollment by Gender
Preliminary Fall 2004-2005 through Fall 2009-2010
0
200
400
600
800
1000
Fall 2004-05 411 720
Fall 2005-06 482 683
Fall 2006-07 368 597
Fall 2007-08 421 591
Fall 2008-09 479 729
Fall 2009-10 576 831
Males Females
Source: FCS Fact Book

11
Florida Keys Community College: Headcount Enrollment by Ethnicity and Gender
Beginning of Term Fall 2001-2002 through Fall 2009-2010
Year
Ethnicity and Gender Total
Non-Resident
Alien
Black Non-Hispanic
American Indian or Alaskan
Asian or Pacific
Islander
Hispanic White Non-
Hispanic
Ethnicity Unknown
Female MaleF M F M F M F M F M F M F M
2001-02 10 6 57 33 3 1 16 10 107 80 765 503 7 2 965 635
2002-03 8 8 85 33 4 6 16 5 118 76 689 428 5 4 925 560
2003-04 12 5 84 31 2 8 8 4 111 68 558 385 2 5 777 506
2004-05 11 6 72 39 2 3 9 5 114 55 505 298 7 5 720 411
2005-06 9 6 55 46 3 2 10 7 89 63 507 342 10 16 683 482
2006-07 4 5 48 29 5 3 16 8 91 40 418 271 15 12 597 368
2007-08 7 9 57 41 3 4 8 6 91 51 411 291 14 19 591 421
2008-09 7 8 67 43 2 1 16 5 112 72 487 317 38 33 729 479
2009-10 7 9 72 33 6 1 14 10 125 108 541 349 66 66 831 576Source: FCS Fact Book

12
Florida Keys Community College: Headcount Enrollment by Program Area
Degree2004-2005
2005-2006
2006-2007
2007-2008
2008-2009
Change
07-08 to 08-09
Associate in Arts 345 356 368 391 417 +6.6%
College and Vocational Preparatory
305 281 316 297 351 +18%
Associate in Science 423 361 381 373 398 +6.7%
Post-Secondary Vocational
95 81 107 113 107 -5%
Post-Secondary Adult Vocational
85 69 83 69 105 +52%
Continuing Workforce Ed*
543 586 591 591 563 -5%
Recreation and Leisure 855 840 940 748 700 -6%
Life Long Learning 0 0 0 0 0 0%
Other (1) & (2) 1,174 1,054 1,078 384 799 +108%
Total (Duplicated) 3,825 3,628 3,864 2,993 3,477 +16%
Total (Unduplicated) 2,844 2,814 2,780 2,870 2,878 +.2%
Note: (1) These figures reflect students awaiting enrollment in limited access programs, students enrolled in apprenticeship courses, and students who are enrolled in courses related to employment, as general freshman or for other personal objectives.(2) There may be some duplication between major program areas.(3) Unduplicated headcount represents the unduplicated number of students, excluding recreation and leisure.*Continuing Workforce Education (CWE) was formerly Supplemental VocationalSource: FCS Fact Book

13
Florida Keys Community College: Headcount Enrollment for Associate in Arts Degree Program
by Ethnicity/Special Populations2002-2003 through 2008-2009
Year
Ethnicity and Gender Special Populations
Alien Asian American Indian
Black Hispanic White Un-known
Total Dis-abled
Limit Eng. Pro-
ficiency
Disad-vantaged Economi-cally/Academically
F M F M F M F M F M F M
2002-03 5 1 7 1 0 1 22 12 35 31 174 89 3 381 12 13 154
2003-04 1 0 7 0 1 2 30 13 39 27 169 92 6 387 13 11 173
2004-05 3 2 7 0 1 0 28 12 33 24 146 88 1 345 14 9 162
2005-06 1 2 5 1 0 2 19 14 34 15 161 99 3 356 11 10 169
2006-07 1 3 4 2 1 0 21 9 38 18 157 108 6 368 16 13 171
2007-08 1 5 1 2 1 1 23 11 42 19 176 98 10 390 15 18 163
2008-09 2 2 3 5 1 0 23 19 44 22 174 109 13 417 15 17 187
Source: FCS Fact Book

14
Florida Keys Community College: Headcount Enrollment for Associate in Science Degree Program
by Ethnicity/Special Populations2002-2003 through 2008-2009
Year
Ethnicity and Gender Special Populations
Alien Asian American Indian
Black Hispanic White Un-known
Total Dis-abled
Limit Eng. Pro-
ficiency
Disad-vantaged Economi-cally/Academically
F M F M F M F M F M F M
2002-03 6 4 5 4 2 4 27 9 46 31 237 171 7 553 7 12 265
2003-04 4 3 2 4 1 3 41 13 40 20 204 137 12 484 11 11 224
2004-05 7 4 2 5 0 3 36 16 27 25 182 115 1 423 12 13 222
2005-06 4 2 4 5 0 4 28 17 31 18 148 94 7 361 11 15 184
2006-07 3 4 5 3 1 5 25 19 33 20 158 101 4 381 9 22 178
2007-08 5 7 4 1 2 3 24 15 21 27 144 103 6 373 15 9 166
2008-09 2 7 3 1 1 0 32 12 33 25 145 120 17 398 21 12 197
Source: FCS Fact Book

15
Florida Keys Community College: Headcount Enrollment for Postsecondary Adult Vocational
Certificate Program by Ethnicity/Special Populations2002-2003 through 2008-2009
Year
Ethnicity and Gender Special Populations
Alien Asian American Indian
Black Hispanic White Un-known
Total Dis-abled
Limit Eng. Pro-
ficiency
Disad-vantaged Economi-cally/Academically
F M F M F M F M F M F M
2002-03 0 0 0 1 0 0 1 0 0 7 12 16 0 37 0 0 1
2003-04 0 0 0 1 0 0 6 5 1 15 26 60 2 116 0 2 8
2004-05 0 0 0 1 0 0 8 6 2 10 17 41 0 85 0 0 5
2005-06 0 0 0 0 0 0 7 7 3 11 10 31 0 69 0 0 6
2006-07 0 0 0 2 0 1 6 3 4 11 9 45 2 83 0 1 13
2007-08 0 0 0 2 0 1 10 3 1 6 10 31 5 69 0 0 15
2008-09 0 0 0 0 0 0 7 4 4 19 16 45 10 105 1 0 22
Source: FCS Fact Book

16
Florida Keys Community College: Headcount Enrollment for Postsecondary Vocational Certificate
Program by Ethnicity/Special Populations2002-2003 through 2008-2009
Year
Ethnicity and Gender Special Populations
Alien Asian American Indian
Black Hispanic White Un-known
Total Dis-abled
Limit Eng. Pro-
ficiency
Disad-vantaged Economi-cally/Academically
F M F M F M F M F M F M
2002-03 0 0 0 0 0 0 0 0 0 0 6 11 0 17 2 0 8
2003-04 1 0 1 1 0 0 10 3 6 7 30 58 2 119 8 1 48
2004-05 0 0 1 2 1 0 5 4 4 12 25 40 1 95 3 4 48
2005-06 0 0 1 1 0 0 3 3 2 7 24 38 2 81 4 1 39
2006-07 0 0 0 1 0 0 10 4 4 6 30 46 6 107 6 0 45
2007-08 0 0 0 0 1 0 9 5 2 10 37 41 8 113 6 1 49
2008-09 0 0 0 1 0 0 8 4 6 16 35 29 8 107 6 2 43
Source: FCS Fact Book

17
FKCC Program Completers

18
Florida Keys Community College: Program Completers 2003-2004 through 2008-2009
0
50
100
150
2003-2004 69 57 89
2004-2005 51 72 98
2005-2006 67 45 22
2006-2007 94 66 132
2007-2008 90 73 103
2008-2009 78 42 100
Associate in Arts
Associate in Science
Certificates
Source: FCS Fact Book

19
Florida Keys Community College: Program Completers for Associate in Arts Degree by
Ethnicity/Special Populations2002-2003 through 2008-2009
Year
Ethnicity and Gender Special Populations
Alien Asian American Indian
Black Hispanic White Un-known
Total Dis-abled
Limit Eng Pro-
ficiency
Disad-vantaged Economi-cally/Academically
F M F M F M F M F M F M
2002-03 1 0 2 1 0 0 2 0 6 2 37 13 2 66 2 3 13
2003-04 2 0 1 0 0 0 6 1 8 3 32 14 2 69 1 1 14
2004-05 1 0 2 0 0 0 6 0 4 1 23 14 0 51 2 1 13
2005-06 2 1 1 0 0 0 2 2 6 4 35 13 1 67 2 3 21
2006-07 0 2 1 0 0 0 4 3 13 3 43 24 1 94 6 3 31
2007-08 0 0 0 0 1 1 4 3 9 8 46 16 2 90 4 5 21
2008-09 0 1 0 1 0 0 0 3 10 1 40 20 2 78 2 7 16
Source: FCS Fact Book

20
Florida Keys Community College: Program Completers for Associate in Science Degree by
Ethnicity/Special Populations2002-2003 through 2008-2009
Year
Ethnicity and Gender Special Populations
Alien Asian American Indian
Black Hispanic White Un-known
Total Dis-abled
Limit Eng. Pro-
ficiency
Disad-vantaged Economi-cally/Academically
F M F M F M F M F M F M
2002-03 1 0 0 0 0 0 2 0 3 1 24 20 0 51 1 1 14
2003-04 1 0 1 0 2 0 4 3 3 1 28 14 0 57 3 3 15
2004-05 0 1 1 0 0 0 5 1 7 5 36 16 0 72 2 3 17
2005-06 1 0 0 0 0 1 4 0 2 1 24 12 0 45 1 3 14
2006-07 1 0 1 0 0 1 2 0 3 4 38 14 2 66 3 1 25
2007-08 2 1 1 0 1 2 2 1 9 3 37 14 0 73 1 3 25
2008-09 0 0 1 0 0 0 5 2 1 4 20 7 2 42 0 1 17
Source: FCS Fact Book

21
Florida Keys Community College: Program Completers for Postsecondary Adult Vocational Certificate
by Ethnicity/Special Populations2002-2003 through 2008-2009
Year
Ethnicity and Gender Special Populations
Alien Asian American Indian
Black Hispanic White Un-known
Total Dis-abled
Limit Eng. Pro-
ficiency
Disad-vantaged Economi-cally/Academically
F M F M F M F M F M F M
2002-03 0 0 0 1 0 0 1 0 0 7 12 16 0 37 0 0 1
2003-04 0 0 0 0 0 0 6 1 0 8 15 29 1 60 0 2 2
2004-05 0 0 0 1 0 0 1 6 2 8 15 46 0 79 0 0 5
2005-06 0 0 0 0 0 0 1 2 2 3 2 6 0 16 0 0 0
2006-07 0 0 0 0 0 0 0 2 0 8 5 25 0 40 0 1 1
2007-08 0 0 0 4 0 1 6 0 2 5 4 28 2 52 0 0 7
2008-09 0 0 0 0 1 0 2 3 2 10 9 25 6 58 1 0 11
Source: FCS Fact Book

22
Florida Keys Community College: Program Completers for Postsecondary Vocational Certificate by
Ethnicity/Special Populations2002-2003 through 2008-2009
Year
Ethnicity and Gender Special Populations
Alien Asian American Indian
Black Hispanic White Un-know
n
Total Dis-abled
Limit Eng. Pro-
ficiency
Disad-vantaged Economi-
cally/Academically
F M F M F M F M F M F M
2002-03 0 0 0 0 0 0 0 0 0 0 6 11 0 17 2 0 8
2003-04 0 0 0 0 0 0 0 3 0 2 8 15 1 29 1 2 15
2004-05 0 0 0 1 0 0 3 2 0 2 1 10 0 19 1 2 6
2005-06 0 0 0 0 0 0 0 0 0 0 1 4 1 6 0 0 2
2006-07 0 0 0 0 0 0 3 4 3 10 33 36 3 92 3 1 24
2007-08 0 0 0 0 1 2 1 3 0 11 15 17 1 51 4 0 15
2008-09 0 1 0 0 0 0 1 3 2 7 11 15 2 42 1 2 13
Source: FCS Fact Book

23
Employee Information

24
Florida Keys Community College: Employee Headcount by Position/Classification
Fall 2008
9%
8%
0%
13%
12%
8%
50%
Full-time Faculty (20)
Adjunct Faculty* (112)
Administrators (19)
Administrative Faculty** (0)
Professional (30)
Full-time Career (27)
Part-time (17)
*Includes adjuncts for credit and non-credit courses
**Comprised of Advisors and LibrariansSource: FKCC Human Resources
2008-2009 Equity Reports
(96) Full Time Employees)

25
0%
10%
20%
30%
40%
50%
60%
70%
80%
90%
Male 85% 2% 9% 1% 3%
Female 87% 3% 8% 1% 1%
White Black Hispanic Asian Other
103
127
0
20
40
60
80
100
120
140
Males Females
45%
55%
Source: FKCC Human Resources
Florida Keys Community College: All Employees by Gender and Ethnicity Fall 2006
(Percentage of gender, not of total)

26
Degree Level of Full-Time Instructional Personnel for FKCC and FCS Fall 2009-10
0%
0%
9%
14%
41%
23%
0.5%
2%
6%
9%
26%
9%
4%
0.0%
56%
0.5%
0% 10% 20% 30% 40% 50% 60%
Unknown/N/A
Other Degree
Less Than Associate
Associate
Bachelors
Masters
Masters +30
Doctorate
FCS
FKCC
Source: FCS Fact Book

27
Florida Keys Community College: Full-Time Instructional Personnel
Degree Level Headcount
Year
Doctorate Masters +30
Masters Bachelors Associate Less Than Associate
Other Degree
Unknown
N/A
Total# % # % # % # % # % # % # % # %
Fall 2001 0 0 0 0 0 0 0 0 0 0 0 0 26 - - - 26
Fall 2002 4 13 7 23 10 32 4 13 4 13 0 0 2 6 - - 31
Fall 2003 4 15 5 19 10 38 2 8 3 12 0 0 2 8 - - 26
Fall 2004 3 15 3 15 10 50 2 10 2 10 0 0 0 0 - - 20
Fall 2005 4 24 3 18 8 55 0 0 2 12 0 0 0 0 - - 17
Fall 2006 4 16 3 12 9 36 1 4 0 0 0 0 1 4 7 28 25
Fall 2007 6 26 4 17 7 30 2 9 0 0 0 0 1 4 3 13 23
Fall 2008 4 21 4 21 4 21 2 11 1 5 0 0 1 5 3 16 19
Fall 2009 5 23 2 9 9 41 3 14 2 9 0 0 1 4 0 0 22
Note: Full-time faculty with contracts less than 2 terms are not included
Source: FCS Fact Book

28
Florida College System:Full-Time Instructional Personnel
Degree Level Headcount
Year
Doctorate Masters +30
Masters Bachelors Associate Less Than Associate
Other Degree
Unknown
N/A
Total# % # % # % # % # % # % # % # %
Fall 2000 1,074 23 519 11 2,475 53 326 7 80 2 55 1 146 3 - - 4,675
Fall 2001 1,085 23 562 12 2,545 53 346 7 84 2 34 1 123 3 - - 4,779
Fall 2002 1065 22 541 11 2,571 53 381 8 88 2 37 1 124 3 - - 4,807
Fall 2003 1,087 22 486 10 2,668 54 350 7 100 2 26 1 207 4 - - 4,924
Fall 2004 1,141 23 509 10 2,796 56 372 7 102 2 29 0 24 0 - - 4,973
Fall 2005 1,204 24 570 11 2,799 55 325 6 112 2 31 1 24 0 - - 5,065
Fall 2006 1,219 24 458 9 2,992 58 317 6 106 2 25 0 23 0 48 1 5,188
Fall 2007 1,273 24 438 8 2,967 57 344 7 119 2 31 0 22 0 49 1 5,244
Fall 2008 1,316 25 419 8 3,042 57 337 6 120 2 25 .5 27 .6 42 .9 5,328
Fall 2009 1,356 26 455 9 2,983 56 298 6 119 2 23 0 25 .5 38 .5 5,297
Note: Full-time faculty with contracts less than 2 terms are not included
Source: FCS Fact Book

29
Florida Keys Community College: Full-Time Instructional Headcount by Gender and Ethnicity
Fall 2008-2009
0%
10%
20%
30%
40%
50%
60%
70%
80%
90%
100%
Male 99% 0% 1% 0%
Female 100% 0% 0% 0%
White Black Hispanic Other
9
11
0
2
4
6
8
10
12
Males Females
Source: FKCC Human Resources
45%
55%
(Percentage of gender, not of total)

30
Florida College System: Full-Time Instructional Headcount by Gender and Ethnicity
Fall 2009-2010
0%
10%
20%
30%
40%
50%
60%
70%
Male 67% 15% 13% 5%
Female 65% 17% 14% 4%
White Black Hispanic Other
7,53111,260
1
10
100
1,000
10,000
100,000
Males Females
Source: FCS Fact Book
40% 60%

31
Florida College System
& Florida Keys Community College (Fall 2009-10): Average Salary of Full-Time Instructional Personnel
$49,594
$58,532
$52,765
$70,091
$53,625
$65,041
$51,848
$62,059
$0
$10,000
$20,000
$30,000
$40,000
$50,000
$60,000
$70,000
$80,000
2.0 Semesters 2.5 Semesters 3.0 Semesters 2.0 SemesterEquivalent*
FKCCFCS
*2.0 Semester Equivalents have been determined by the application of conversion factors to the 2.5 and 3.0 Semester Salaries. These contract periods have been adjusted in order to develop a salary composite for 2.0 semesters or nine months. This period is the nationally recognized basis for comparison. The federal standard factors of 0.909 and 0.818 have been respectively applied to 2.5 and 3.0 Semester Salaries. Full-time faculty with contracts less than 2 terms are not included. The number of days per term included in a contract may vary among colleges.
Source: FCS Fact Book

32
Florida Keys Community College: Average Salary of Full-Time Instructional Personnel
Year
2.0 Semesters 2.5 Semesters 3.0 Semesters
2.0 Semester Equivalent*
% Increase
Number Salary Number Salary Number Salary Number Salary Number
Fall 2000-01 25 $35,937 0 - 8 $44,641 33 $36,080 14.1
Fall 2001-02 25 $36,939 0 - 1 $36,937 26 $36,681 1.7
Fall 2002-03 25 $38,670 0 - 6 $45,351 31 $38,367 4.6
Fall 2003-04 21 $39,906 0 - 5 $47,606 26 $39,722 3.5
Fall 2004-05 21 $37,362 0 - 4 $52,892 25 $38,308 -3.6
Fall 2005-06 15 $40,633 0 - 5 $55,696 20 41,867 9.3
Fall 2006-07 23 $42,672 0 - 2 $64,115 25 43,455 3.8
Fall 2007-08 21 $42,320 0 - 2 $64,115 23 $43,202 .6
Fall 2008-09 8 $48,127 9 $56,615 2 $67,395 19 $50,448 17
Fall 2009-10 5 $49,594 15 $58,532 2 $70,091 22 $52,765 4.9
*2.0 Semester Equivalents have been determined by the application of conversion factors to the 2.5 and 3.0 Semester Salaries. These contract periods have been adjusted in order to develop a salary composite for 2.0 semesters or nine months. This period is the nationally recognized basis for comparison. The federal standard factors of 0.909 and 0.818 have been respectively applied to 2.5 and 3.0 Semester Salaries. Full-time faculty with contracts less than 2 terms are not included. The number of days per term included in a contract may vary among colleges.
Source: FCS Fact Book

33
Florida College System: Average Salary of Full-Time Instructional Personnel
Year
2.0 Semesters 2.5 Semesters 3.0 Semesters
2.0 Semester Equivalent*
% Increase
Number Salary Number Salary Number Salary Number Salary Number
Fall 2000-01 1,593 $43,708 2,705 $48,495 377 $50,357 4,675 $43,725 5.5
Fall 2001-02 1,614 $44,607 2,792 $49,594 373 $51,501 4,779 $44,694 2.2
Fall 2002-03 1,856 $45,346 2,580 $51,104 371 $53,210 4,807 $45,803 2.5
Fall 2003-04 2,147 $46,731 2,430 $50,782 347 $55,691 4,924 $46,370 1.2
Fall 2004-05 2,349 $47,909 2,359 $52,619 363 $57,013 5,071 $47,784 3.0
Fall 2005-06 2,367 $49,207 2,341 $54,716 391 $59,433 5,099 $49,408 3.4
Fall 2006-07 2,607 $50,230 2,184 $57,322 397 $61,953 5,188 $51,057 3.3
Fall 2007-08 2,913 $51,232 1,951 $61,506 380 $63,059 5,244 $53,059 3.9
Fall 2008-09 2,948 $51,651 2,011 $61,892 369 $65,603 5,328 $53,533 .9
Fall 2009-10 2,975 $51,848 1,949 $62,059 373 $65,041 5,297 $53,625 .2
*2.0 Semester Equivalents have been determined by the application of conversion factors to the 2.5 and 3.0 Semester Salaries. These contract periods have been adjusted in order to develop a salary composite for 2.0 semesters or nine months. This period is the nationally recognized basis for comparison. The federal standard factors of 0.909 and 0.818 have been respectively applied to 2.5 and 3.0 Semester Salaries. Full-time faculty with contracts less than 2 terms are not included. The number of days per term included in a contract may vary among colleges.
Source: FCS Fact Book

34
Financial Information

35
Annual Cost Analysis 2008-2009FKCC & FCS
Direct Instruction
36%
Non-Instruct Costs
1%Plant Op. &
Maint.
15%
Institutional Support
24%
Student
Services
8%Academic Support
16%
Non-Instructional
Costs, 0%
Direct Instruction
36%
Plant O p. & Maintenance
12%
Institutioanl Support 30%
Student Services 8%
Academic Support 14%
Florida Keys Community College Total Florida College System Total
Source: FCS Fact Book
36
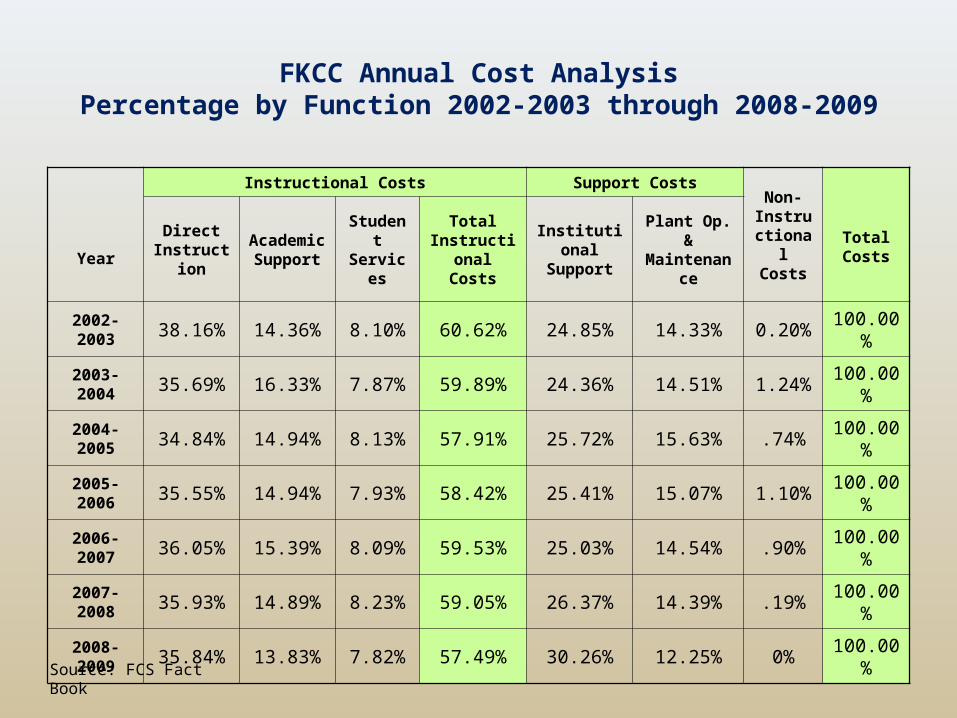
FKCC Annual Cost AnalysisPercentage by Function 2002-2003 through 2008-2009
Year
Instructional Costs Support CostsNon-
Instructional Costs
Total Costs
Direct Instruction
Academic Support
Student Services
Total Instructiona
l Costs
Institutional Support
Plant Op. & Maintenance
2002-2003 38.16% 14.36% 8.10% 60.62% 24.85% 14.33% 0.20% 100.00%
2003-2004 35.69% 16.33% 7.87% 59.89% 24.36% 14.51% 1.24% 100.00%
2004-2005 34.84% 14.94% 8.13% 57.91% 25.72% 15.63% .74% 100.00%
2005-2006 35.55% 14.94% 7.93% 58.42% 25.41% 15.07% 1.10% 100.00%
2006-2007 36.05% 15.39% 8.09% 59.53% 25.03% 14.54% .90% 100.00%
2007-2008 35.93% 14.89% 8.23% 59.05% 26.37% 14.39% .19% 100.00%
2008-2009 35.84% 13.83% 7.82% 57.49% 30.26% 12.25% 0% 100.00%
Source: FCS Fact Book

37
FKCC Annual Cost Analysis:Expenditures by Function 2002-2003 through 2008-2009
Year
Instructional Costs Support CostsNon-
Instructional Costs
Total Costs
Direct Instruction
Academic Support
Student Services
Total Instructional
Costs
Institutional Support
Plant Op. & Maintenance
2002-2003 2,633,276 990,764 558,792 4,182,832 1,714,764 989,155 13,894 6,900,645
2003-2004 2,557,888 1,170,499 563,947 4,292,334 1,746,031 1,039,745 89,141 7,167,251
2004-2005 2,546,100 1,091,395 594,184 4,231,679 1,879,242 1,141,974 54,307 7,307,202
2005-2006 2,818,055 1,184,041 628,828 4,630,924 2,041,222 1,194,424 87,090 7,926,660
2006-2007 2,963,591 1,265,506 664,873 4,893,970 2,057,536 1,195,209 73,918 8,220,633
2007-2008 3,123,223 1,293,661 715,784 5,132,668 2,291,573 1,250,557 16,590 8,691,388
2008-2009 3,083,582 1,190,412 672,360 4,946,354 2,602,657 1,052,894 0 8,601,904
Source: FCS Fact Book

38
Florida Keys Community College:Annual Cost Analysis Expenditures by Category
2001-2002 through 2008-2009
Year
Personnel Costs
Expenses Equipment Grand TotalFull-Time Part-Time Total
2001-2002 4,588,018 665,051 5,253,069 1,619,069 18,190 6,890,328
2002-2003 4,837,770 516,614 5,354,384 1,524,461 21,800 6,900,645
2003-2004 4,800,143 805,964 5,606,107 1,528,413 32,731 7,167,251
2004-2005 4,966,632 408,938 5,375,570 1,880,015 51,617 7,307,202
2005-2006 5,384,070 568,304 5,952,374 1,917,278 57,008 7,926,660
2006-2007 5,549,453 761,203 6,310,656 1,862,184 47,793 8,220,633
2007-2008 5,582,729 564,245 6,146,978 2,420,822 123,592 8,691,388
2008-2009 5,863,502 171,283 6,034,785 2,519,458 47,661 8,601,904
Source: FCS Fact Book
39
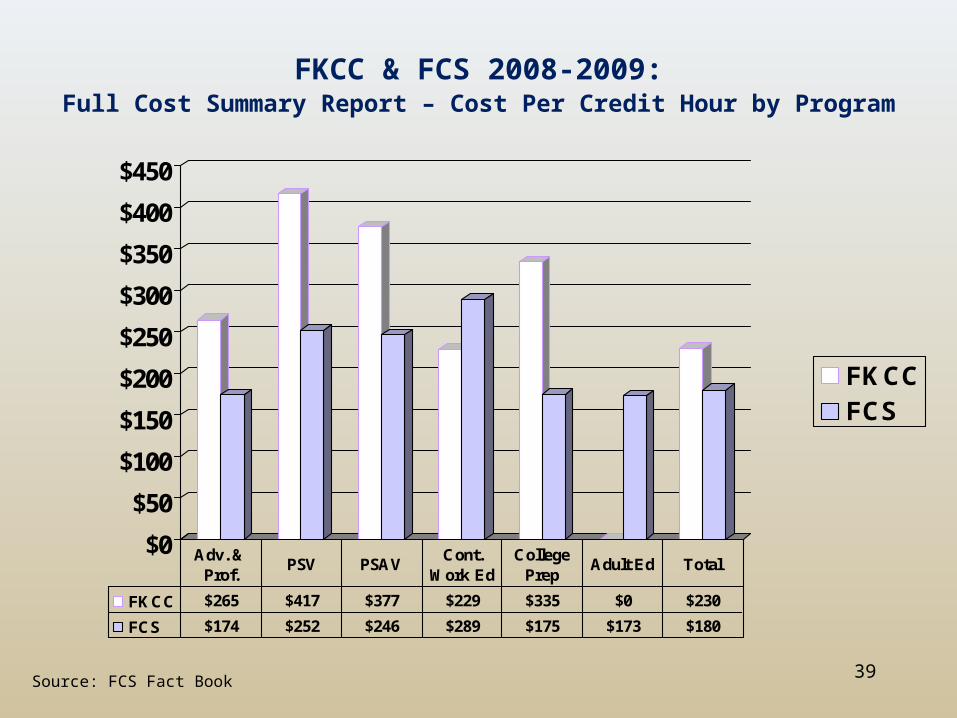
FKCC & FCS 2008-2009:Full Cost Summary Report – Cost Per Credit Hour by Program
$0
$50
$100
$150
$200
$250
$300
$350
$400
$450
FKCCFCS
FKCC $265 $417 $377 $229 $335 $0 $230
FCS $174 $252 $246 $289 $175 $173 $180
Adv. & Prof.
PSV PSAVCont.
Work EdCollege
PrepAdult Ed Total
Source: FCS Fact Book

40
FKCC Full Cost Summary ReportCost by Credit Hour 2002-2003 through 2008-2009
YearAdvanced & Professional
Postsecondary Vocational
Postsecondary Adult
Vocational
Continuing Workforce Education
College Preparatory
Adult Education
Total
2002-2003 $216 $287 $257 $335 $213 $0 $242
2003-2004 $235 $297 $308 $559 $291 $0 $268
2004-2005 $257 $359 $300 $391 $319 $0 $298
2005-2006 $295 $399 $388 $475 $351 $0 $339
2006-2007 $335 $442 $379 $501 $365 $0 $376
2007-2008 $314 $444 $515 $339 $369 $0 $366
2008-2009 $265 $417 $377 $229 $335 $0 $230
Source: FCS Fact Book

41
FKCC Student Fees for Credit Programs for Resident Students
Fall 2002 through Fall 2009
Year TuitionStudent
Financial Aid Fee
Student Activity Fee
Capital Improveme
nt Fee
Technology Fee
Total
Fees for Academic
Year
(30 Hours)
Fall 2002 $44.50 $3.10 $4.43 $1.00 $1.80 $54.83 $1,644.90
Fall 2003 $47.97 $3.33 $4.76 $1.00 $1.80 $58.86 $1,765.80
Fall 2004 $50.36 $3.49 $5.00 $1.00 $1.80 $61.65 $1,849.50
Fall 2005 $53.08 $3.84 $5.49 $3.00 $1.80 $67.21 $2,016.30
Fall 2006 $56.25 $3.94 $5.63 $5.00 $0.00 $70.82 $2,124.60
Fall 2007 $56.25 $3.94 $5.63 $5.00 $0.00 $70.82 $2,124.60
Fall 2008 $62.59 $4.38 $6.26 $6.26 $0.00 $79.49 $2,384.70
Fall 2009 $67.60 $4.73 $6.76 $6.76 $3.38 $89.23 $2,676.96
Source: FCS Fact Book

42
FKCC Student Fees for Credit Programs for Non-Resident Students
Fall 2002 through Fall 2009
Year TuitionOut of
State Fee
Student Financial Aid Fee
Student Activity
Fee
Capital Improvement
Fee
Technology Fee
Total
Fees for Academic
Year
(30 Hours)
Fall 2002 $44.50 $135.37 $12.53 $4.43 $3.00 $5.40 $205.23 $6,156.90
Fall 2003 $47.97 $145.79 $13.46 $4.76 $3.00 $5.40 $220.38 $6,611.40
Fall 2004 $50.36 $153.07 $14.13 $5.00 $3.00 $5.40 $230.96 $6,928.80
Fall 2005 $53.08 $161.10 $15.37 $5.49 $21.96 $5.40 $262.40 $7,872.00
Fall 2006 $56.25 $168.82 $15.75 $5.63 $22.51 $0.00 $268.96 $8,068.80
Fall 2007 $56.25 $168.28 $15.75 $5.63 $22.51 $0.00 $268.96 $8,068.80
Fall 2008 $62.59 $187.90 $17.53 $6.26 $25.05 $0.00 $299.33 $8,979.90
Fall 2009 $67.60 $187.90 $12.78 $6.76 $25.55 $12.78 $313.36 $9,400.80
Source: FCS Fact Book

43
FKCC & FCS Student Fee Comparison for Credit Programs
Resident and Non-Resident Fees Fall 2009
$2,677 $2,553
$9,400 $9,385
$0$1,000$2,000$3,000$4,000
$5,000$6,000$7,000$8,000$9,000
$10,000
Resident Student Non-Resident Student
FKCCFKC
Source: FCS Fact Book

44
FKCC Resident and Non-Resident Student Fee Comparison for Credit Programs:
Fall 2001 through Fall 2009
Resident Students Non-Resident Students
Fall 2002 Fall 2003 % Increase Fall 2002 Fall 2003 % Increase
$1,645 $1,766 7.35% $6,157 $6,611 7.38%
Fall 2003 Fall 2004 % Increase Fall 2003 Fall 2004 % Increase
$1,766 $1,850 4.74% $6,611 $6,929 4.80%
Fall 2004 Fall 2005 % Increase Fall 2004 Fall 2005 % Increase
$1,850 $2,016 9.02% $6,929 $7,872 13.61%
Fall 2005 Fall 2006 % Increase Fall 2005 Fall 2006 % Increase
$2,016 $2,125 5.37% $7,872 $8,069 2.50%
Fall 2006 Fall 2007 % Increase Fall 2006 Fall 2007 % Increase
$2,125 $2,125 0.00% $8,069 $8,069 0.00%
Fall 2007 Fall 2008 % Increase Fall 2007 Fall 2008 % Increase
$2,244 $2,385 6.26% $8,456 $8,980 6.20%
Fall 2008 Fall 2009 % Increase Fall 2008 Fall 2009 % Increase
$2,385 $2,677 4.69% $8,980 $9,401 4.69%
Source: FCS Fact Book
45
FKCC’s Facilities

46
FKCC’s FacilitiesSites, Inventory, and Value
2001-2002 through 2009-2010
Year# of Sites
Operating Campuses
Owned Acres
Owned Buildings
Owned Total Gross Sq. Ft.
Building Values
Content Values
Combined Values
2001-02 4 1 126 15 210,322 $29,883,815 $2,931,812 $32,815,627
2002-03 4 1 126 15 210,322 $31,570,120 $3,031,812 $34,601,932
2003-04 4 1 115 16 210,322 $31,788,462 $3,031,812 $34,820,274
2004-05 4 1 115 16 211,702 $31,963,979 $3,031,812 $34,995,791
2005-06 4 1 126 16 212,298 $32,229,447 $3,096,667 $35,326,114
2006-07 4 1 126 17 212,298 $32,110,782 $3,081,667 $35,192,449
2007-08 4 1 126 17 212,298 $33,653,989 $3,081,667 $36,735,656
2008-09 4 1 126 18 216,463 $35,151,194 $3,081,667 $39,232,861
2009-10 4 1 126 16 212,967 $36,151,194 $3,081,667 $39,232,861
Source: FCS Fact Book

47
FKCC’s Learning Resources Center
48
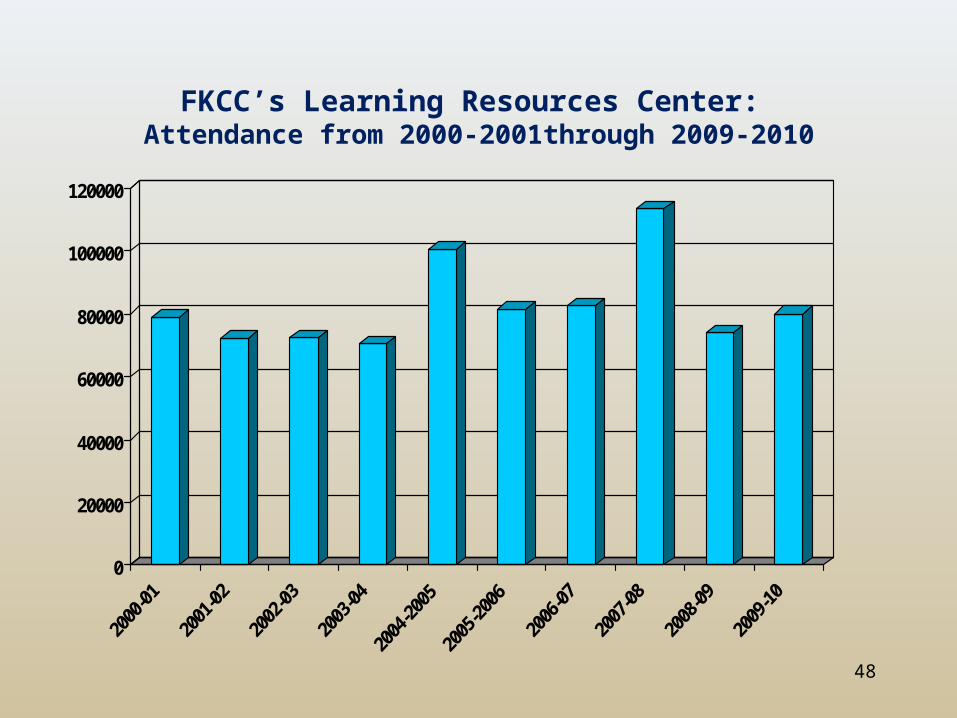
FKCC’s Learning Resources Center: Attendance from 2000-2001through 2009-2010
0
20000
40000
60000
80000
100000
120000

49
FKCC’s Learning Resources Center: Transactions from 2004-2005 through 2009-2010
0
5,000
10,000
15,000
20,000
25,000
30,000
35,000
2004
-05
2005
-06
2006
-07
2007
-08
2008
-09
2009
-10
Students Faculty Community
50
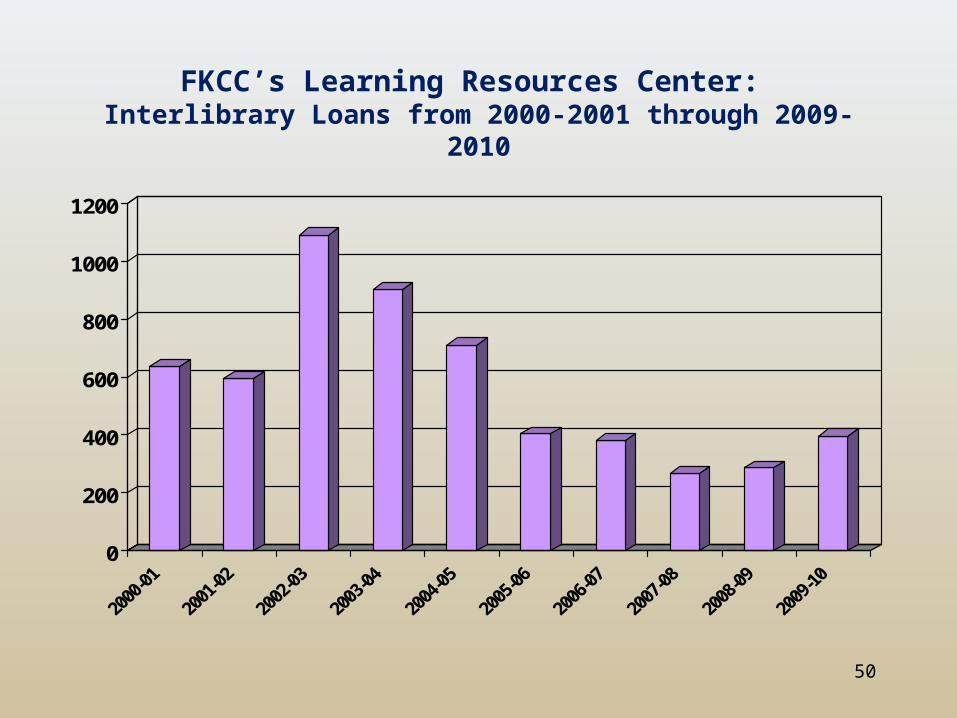
FKCC’s Learning Resources Center: Interlibrary Loans from 2000-2001 through 2009-2010
0
200
400
600
800
1000
1200

51
FKCC’s Learning Resources Center: Programs, Orientations, Workshops & Instruction
2000-2001 through 2009-2010
0
50
100
150
200
250

52
FKCC’s Learning Resources Center: People in Programs, Orientations, Workshops & Instruction
2000-2001through 2009-2010
0
500
1000
1500
2000
2500
Note: 2009-2010 includes January 2010-May 2010 only

53
FKCC’s Learning Resources Center: Computer Lab Use from 2000-2001 through 2009-2010
0
5000
10000
15000
20000
25000
30000

54
Glossary

55
Glossary (Source: FCS Fact Book 2010)A & P (Advanced and Professional)A program area with courses designed to provide the first two years of course work leading to an advanced or professional degree, including general education and specialized lower division courses to complete a transfer degree. It does not include college preparatory or non-college credit courses.
AA (Associate in Arts Degree)A program of instruction consisting of courses offered to freshmen and sophomores in baccalaureate programs. This degree is awarded when a student completes sixty (60) college credits and other specified performance requirements. This degree program is designed to allow transfer to a four-year institution. Florida has a statewide articulation agreement between the Florida Community College System and the State University System.
AAS (Associate in Applied Science Degree)Programs of instruction consisting of college-level courses that prepare students for entry into a specific field of employment. The degree is awarded when a student completes not less than sixty (60) college credits and other specified performance requirements.
Adult General EducationA comprehensive program of adult basic education, adult secondary education, general educational development (GED) test instruction, vocational preparatory instruction. Advanced Technical CertificateA program of instruction consisting of at least nine (9) hours and less than forty-five (45) credit hours of college level courses. Students in these programs must have already received an associate in science degree and are seeking an advanced specialized program of study to supplement their associate degree. ApprenticeshipA vocational program registered with an approved registration agency in accordance with state and federal laws and regulations. In this program, a student will receive structured vocational skill training in a given job through a combination of on-the-job training and classroom instruction.
AS (Associate in Science Degree)Programs of instruction consisting of college-level courses to prepare for entry into employment or transfer to a four-year institution. The degree is awarded when a student completes not less than sixty (60) college credits as well as attainment of specified performance. Average Converted SalariesThe federal standard conversion factors of 0.909 and 0.818 have been applied to 2.5 and 3.0 semester salaries respectively to convert to a 2.0 semester equivalent.
Bachelor’s Degree ProgramsThe following public community colleges have been authorized to offer baccalaureate degree programs: Chipola College; Miami Dade College; Okaloosa-Walton College; and St. Petersburg College.
BOT (Beginning-of-Term)Data submitted early in a term, but after the end of drop and add. This data will not include many students in Adult General Education, Continuing Workforce Education, or Postsecondary Adult Education because many of the courses in these programs begin at various times during the term.
CCPF (Community College Program Fund)Money allocated by the Legislature to operate the colleges for the next fiscal year.
CEEB (College Entrance Examination Board)A national, nonprofit education association with a membership of over 2,500 colleges, universities, secondary schools, and educational associations and agencies. It is frequently referred to as the College Board. It is known for its Scholastic Achievement Test (SAT) and Advanced Placement (AP) programs.
56
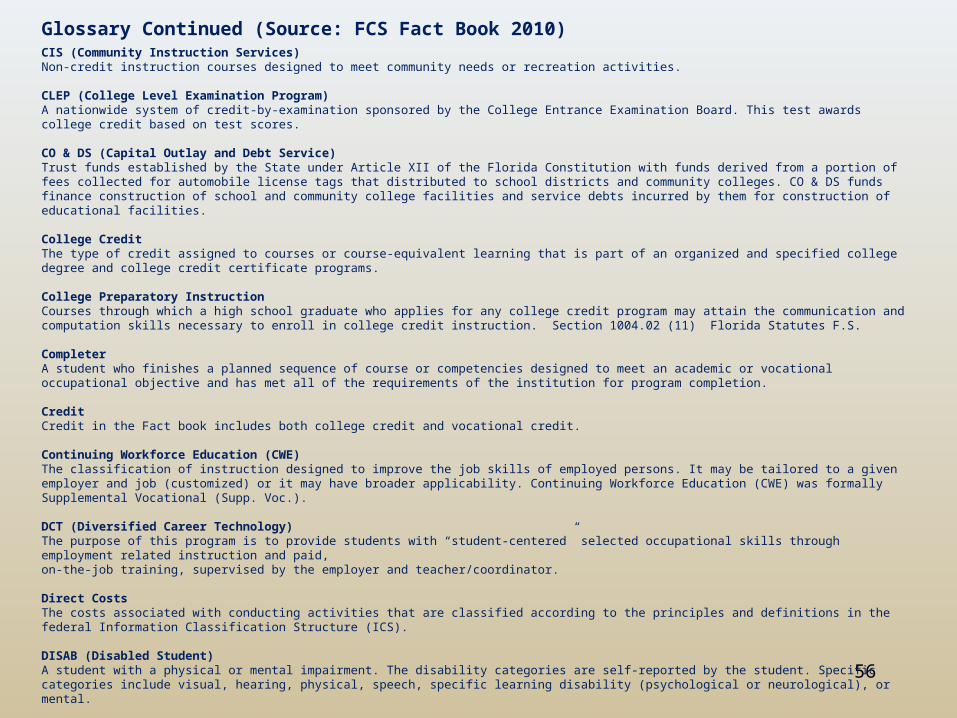
Glossary Continued (Source: FCS Fact Book 2010)CIS (Community Instruction Services)Non-credit instruction courses designed to meet community needs or recreation activities. CLEP (College Level Examination Program)A nationwide system of credit-by-examination sponsored by the College Entrance Examination Board. This test awards college credit based on test scores. CO & DS (Capital Outlay and Debt Service)Trust funds established by the State under Article XII of the Florida Constitution with funds derived from a portion of fees collected for automobile license tags that distributed to school districts and community colleges. CO & DS funds finance construction of school and community college facilities and service debts incurred by them for construction of educational facilities. College CreditThe type of credit assigned to courses or course-equivalent learning that is part of an organized and specified college degree and college credit certificate programs. College Preparatory InstructionCourses through which a high school graduate who applies for any college credit program may attain the communication and computation skills necessary to enroll in college credit instruction. Section 1004.02 (11) Florida Statutes F.S.
CompleterA student who finishes a planned sequence of course or competencies designed to meet an academic or vocational occupational objective and has met all of the requirements of the institution for program completion. CreditCredit in the Fact book includes both college credit and vocational credit.
Continuing Workforce Education (CWE)The classification of instruction designed to improve the job skills of employed persons. It may be tailored to a given employer and job (customized) or it may have broader applicability. Continuing Workforce Education (CWE) was formally Supplemental Vocational (Supp. Voc.). DCT (Diversified Career Technology)The purpose of this program is to provide students with “student-centered” selected occupational skills through employment related instruction and paid, on-the-job training, supervised by the employer and teacher/coordinator.
Direct CostsThe costs associated with conducting activities that are classified according to the principles and definitions in the federal Information Classification Structure (ICS). DISAB (Disabled Student)A student with a physical or mental impairment. The disability categories are self-reported by the student. Specific categories include visual, hearing, physical, speech, specific learning disability (psychological or neurological), or mental.
DISAD (Disadvantaged)A student who is economically and/or academically disadvantaged.
Dual EnrollmentEnrollment of an eligible secondary or home education student in a postsecondary course creditable toward high school completion and a career certificate or an associate or baccalaureate degree.

57
Glossary Continued (Source: FCS Fact Book 2010) EAPEnglish for Academic Purposes
Educational and General OperationsThose activities supported by the general current fund and the restricted current fund.
Electronic Library ResourcesOnline full-text and abstract databases, newspapers, periodicals, journals, encyclopedias, directories, dictionaries, digitized materials, and e-books. EnrollmentEnrollment is a duplicate count and refers to a count of students by course. A student will be counted for each course for which the student is enrolled.
First-Term, First-Year StudentFirst-Term, First-Year includes First-Time in College (FTIC) students, students enrolled in the Fall who were FTIC the prior summer, and students entering college for the first time after high school graduation with dual enrollment credit.
First-Year StudentA student who has completed less than 30 semester credits of undergraduate work.
FT (Full-Time) -- Credit StudentAny student enrolled for 12 semester credits or 24 or more contact hours during the Fall or Winter/Spring terms.
Full-Time Equivalent (FTE) EnrollmentStudent semester hours divided by 30 for Advanced and Professional and Postsecondary Vocational instruction. For all other instruction, instructional clock hours divided by 900 hours. There are three kinds of FTE- Estimated, Projected, and Actual.• Estimated Annual FTE for the current reporting year is based on the current FTE reported.• Projected Annual FTE for future years is based on 3 to 6 historical years. The last historical year may be estimated.• Actual FTE is the reported FTE as of the date of the report.
FTIC (First-Time in College) A student attending a college for the first time who has no credit toward a degree or formal award from any other institution who is enrolled in a course in an instructional area leading to a degree or certificate Full CostsThe costs related to producing a specific quantity of output. Full costing is accomplished only for instructional programs, the assumption being that instruction is the production function of the Florida Community Colleges.
General Current FundThe fund used to account for resources that are available for the general financial requirements of the college, of which the only restrictions are those imposed by law or the budget.
HeadcountHeadcount is an unduplicated count that counts each student only once regardless of the number of courses in which a student is enrolled.
IPEDSIntegrated Postsecondary Education Data System (IPEDS) of the National Center for Education Statistics (NCES) of the U.S. Department of Education is a program that collects data as authorized by Section 490 of the Higher Education Amendments of 1992. Completion of the IPEDS surveys is an important part of each institution’s Program Participation Agreement (PPA) with the Department of Education and is mandatory for eligibility for federal student financial assistance programs.

58
Glossary Continued (Source: FCS Fact Book 2010)LEPLimited English Proficiency.
Library Materials Catalog via the InternetThe catalog of library-owned materials accessed by users through the Internet. Library Materials Catalog via the TerminalThe catalog of library-owned materials accessed by users through dedicated LINCC (Library Information Network for Community Colleges) terminals. LLL (Life Long Learning)The classification for non-credit instruction of a community service nature, other than recreation or leisure, or the retaking of a course under specific circumstances. Lower LevelThe first two years of a baccalaureate degree program, also known as lower division. The term can refer to either the level of courses or the standing of a student. It traditionally consists of the freshman and sophomore year.
Matriculation FeesThe basic instructional charge paid by both resident and non-resident students per credit or credit equivalent. Non-Degree Seeking StudentA student enrolled in courses for credit who has not declared that he/she is seeking a degree or other formal award. Non-ResidentA student who is not a Florida resident and must pay the full tuition fees. Other First-Year StudentA First-Year Student who is not a first-time in college (FTIC) student.
PECO (Public Education Capital Outlay and Debt Service Trust Fund)The state bonding program for educational facilities in the public school, community college and university systems. Revenues are derived from the Gross Receipts tax on selected utility sales including electric, gas telecommunication services, co-generated electrical power transmission, including municipal corporations and recently added cable companies.
Printed Library MaterialsBooks, magazines, and other library materials physically housed at the institutional level. Program AreaProgram offerings are divided into the following types: Associate in Arts degree, College and Vocational Preparatory, Associate in Science degree, Associate in Applied Science degree, Postsecondary Vocational Certificate, Postsecondary Adult Vocational Certificate, Continuing Workforce Education, Adult Basic and Secondary (Adult High School and GED) Education, Community Instructional Services (Recreation and Leisure), Life Long Learning, and Apprenticeship.
Proprietary Electronic Library ResourcesCommercial information databases available to community colleges under statewide license. PSAV (Postsecondary Adult Vocational)- (Certificate Career Education)Job Preparation programs, excluding Continuing Workforce Education, through which a student receives a vocational certificate upon completion of instruction.

59
Glossary Continued (Source: FCS Fact Book 2010)PSV (Postsecondary Vocational)- (Degree Career Education)College credit job preparatory programs, through which a student receives an Associate in Science or Associate in Applied Science Degree, college credit certificate, Applied Technology Diploma, or an Advanced Technical Certificate, upon completion of instruction. PT (Part-Time)A student who is enrolled in less than 12 semester credits or less than 24 contact hours during the Fall or Winter/Spring terms. Recreation and LeisureThe classification for non-credit, usually short courses, designed to enhance recreation and leisure instruction.
Resident for Tuition PurposesA student who is a Florida resident per s.1009.21, F.S., and has maintained that residency for at least one year, and therefore eligible for the in-state tuition and fees rate.
Restricted Current FundThe fund used to account for resources that are available for the operation and support of the educational programs but are restricted by donors or other outside agencies as to the specific purpose for which they may be expended. Special PopulationsPeople who meet the criteria for classification as having a Disability (DISAB), Limited English Proficiency (LEP), and/or Disadvantaged Economically (DISAD). Tuition FeeThe instructional fee paid by non-resident students per credit or credit equivalent in addition to the matriculation fee.
Unexpended Plant FundThe fund used to account for resources that are available for the acquisition or construction of physical property to be used for institutional purposes and resources designated for the major repair and/or replacement of institutional property. Unweighted FTE (Full Time Equivalent)FTE that have been calculated without using any weighting factors. Upper LevelThe last two years of a baccalaureate degree program, also known as upper division. The term can refer to either the level of courses of the standing of a student. It traditionally consists of the junior and senior years.
Vocational CreditThe type of credit assigned to courses or course equivalent learning that is part of an organized and specified vocational certificate program. VOC. PREP. (Vocational Preparatory Instruction)Adult general education through which persons attain academic and workforce readiness skills at the level of functional literacy (grade level 6.0 – 8.9) or higher so that such persons may pursue certificate career education or higher level career education. Competency-based instruction for students preparing to enroll in vocational credit instruction. Workforce EducationEncompasses programs leading to Associate in Science degrees, Associate in Applied Science degrees, vocational certificates, college credit certificates, adult high school diplomas and GED’s as well as continuing workforce and literacy training.