1 fairview health services: a lean case study “using data to make decisions and drive quality and...
TRANSCRIPT

1
Fairview Health Services: A LEAN Case Study
“Using Data to Make Decisions and Drive Quality and Results”
Fairview Health Services: A LEAN Case Study
“Using Data to Make Decisions and Drive Quality and Results”
Institute for Quality in Laboratory MedicineApril 29, 2005
presented by Rick PanningPresident, Laboratory Services
Fairview Health Services
Institute for Quality in Laboratory MedicineApril 29, 2005
presented by Rick PanningPresident, Laboratory Services
Fairview Health Services

2
The building blocks of Performance Excellence
QualityImprovement
Methods(e.g., FOCUS-
PDCA, LEAN, 7-Step, DMAIC, Rapid Cycle
Improvement)
QualityImprovement
Methods(e.g., FOCUS-
PDCA, LEAN, 7-Step, DMAIC, Rapid Cycle
Improvement)
AcceleratedChange
AcceleratedChange
EffectiveResults
EffectiveResults
Performance Excellence – Clinical and FinancialPerformance Excellence – Clinical and Financial
x =

3
Understanding the need for changeUnderstanding the need for change• How does your laboratory fit into the overall
organization and provision of care?
– How can the laboratory enable high quality, cost-effective care?
• How is the laboratory performing? How will LEAN help you improve these measures?
– Productivity and Cost per test
– Turnaround time compliance
– Error rates (patient safety, quality)
• How does your laboratory fit into the overall organization and provision of care?
– How can the laboratory enable high quality, cost-effective care?
• How is the laboratory performing? How will LEAN help you improve these measures?
– Productivity and Cost per test
– Turnaround time compliance
– Error rates (patient safety, quality)

4
Lean is:
• Waste
• Flow, Flow, Flow
• Applies to both Mfg. &Non-Mfg. Environments

5
What is Lean?Relentless pursuit, identification
and elimination of waste in all business processes in order to produce value for the customer.

6
Make problems
visible
Mistake proofing
Just in TimeRight serviceRight amount
Right time
Pull SystemContinuous Flow
People and Teamwork
Waste Reduction
Stable and Standardized ProcessesVisual Management
Continuous Improvement
Best Quality, Cost, Delivery, Safety and Morale
From J.Liker, The Toyota Way

7
Core Principles of Lean(“start with the customer”)
• One Piece Flow vs. Batch & Queue
– Eliminates many forms of waste: waiting, inventory, overproduction. Batching inhibits flow.
– Focus on 1 specimen/patient at a time
• First In/First Out
– Best approach for the customer and best utilization of resources
• Mistake proofing
– Prevent errors and defects

8
Core Principles of Lean• Unified Layout
– Move from value added step to value added step
• Standard Work
– Develop a standard based on the best known way to do the work, yields quality and reliability
• Visual Management Control
– Tells at a glance what should be done, distinguishes normal from abnormal

9
How does Lean impact customers?
• Shorter and more consistent cycle times
• Reduction of costs – lower prices
• Efficient use of resources – allow your professionals to “do the right stuff”
• Consistent quality of outcomes
• Establishes standard work
“Without defined standards, there can be no improvement.” T. Ohno, Toyota

10
Reasons for implementing LEAN @ Fairview
Reasons for implementing LEAN @ Fairview
• Significant need to:
–Improve patient care services
–maximize efficiency / effectiveness of laboratory operations
–simplify processes
• Significant need to:
–Improve patient care services
–maximize efficiency / effectiveness of laboratory operations
–simplify processes

11
Project Goals & Value Stream
Product Flow
Group Technology
Operator Analysis
Job Guidance
Performance Measures
Standardized Work
Cell Layout Work Station
12
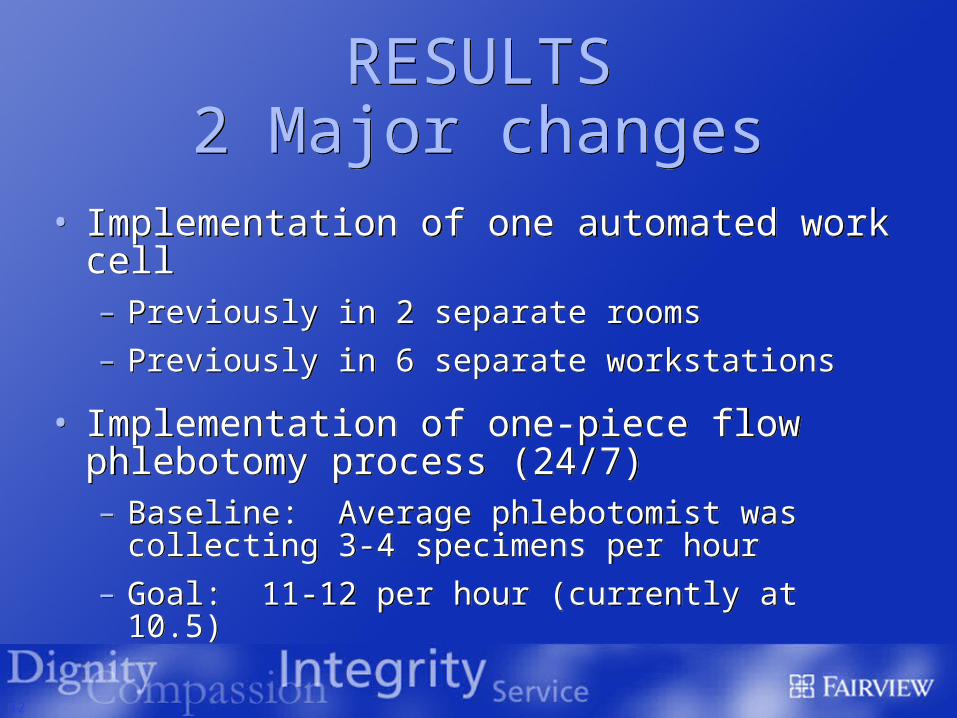
RESULTS2 Major changes
RESULTS2 Major changes
• Implementation of one automated work cell– Previously in 2 separate rooms
– Previously in 6 separate workstations
• Implementation of one-piece flow phlebotomy process (24/7)– Baseline: Average phlebotomist was collecting 3-4
specimens per hour
– Goal: 11-12 per hour (currently at 10.5)
• Implementation of one automated work cell– Previously in 2 separate rooms
– Previously in 6 separate workstations
• Implementation of one-piece flow phlebotomy process (24/7)– Baseline: Average phlebotomist was collecting 3-4
specimens per hour
– Goal: 11-12 per hour (currently at 10.5)

13
Cycle Time GoalCycle Time Goal• Goal: 95% of tests will be reported
within 30 minutes from the time the patient is drawn.
• Previous standard: Results reported within 60 min from the time the sample is received in the lab.
• Goal: 95% of tests will be reported within 30 minutes from the time the patient is drawn.
• Previous standard: Results reported within 60 min from the time the sample is received in the lab.

14
Distribution of Total TimeSTAT Draw for Vitros
Product Flow
Value added processing time
23%
Non value added processing time
12%
Inspection/Test2%
Transportation25% Storage
38%

15
TrafficTrafficAREA NAME: Specimen Processing Developed By: PREPARED BY: Jamie Miles
SUPERVISOR: Barry Langton The SMC Group DATE: 11/20/2002
NOTE: Depict rough scale of equipment layout; and, draw a point to point diagram of the complete product f low
Blood Bank
Laboratory LayoutNot to scale
Specimen Processing Walk Pattern 40 MinutesChemistry Technician's Walk Pattern 40 Minutes of work
Heme/Coag
Specimen Processing
Clerical Area
Chemistry
Tube system
AREA NAME: Specimen Processing Developed By: PREPARED BY: Jamie MilesSUPERVISOR: Barry Langton The SMC Group DATE: 11/20/2002
NOTE: Depict rough scale of equipment layout; and, draw a point to point diagram of the complete product f low
Blood Bank
Laboratory LayoutNot to scale
Specimen Processing Walk Pattern 40 MinutesChemistry Technician's Walk Pattern 40 Minutes of work
Heme/Coag
Specimen Processing
Clerical Area
Chemistry
Tube system
Chemistry (blue) Specimen Processing (red)

16
Diff &
Kit T
esting Monitor
Monitor
Bio Haz Cap
sSample V950Label
MisysMonitor
Lab
el MisysMonitor
MisysMonitor
Lab
el
MisysMonitor
Core Work Area for the Clinical Lab Scientists whoperform 90% of all Lab tests
After LEAN
One person walking 6 cycles in 30 min and operating 6 work stations
After LEAN
One person walking 6 cycles in 30 min and operating 6 work stations
Proposed LayoutProposed Layout

17
Collection to Result (Compliance within 30 min.) Collection to Result
(Compliance within 30 min.) • Hemoglobin
– Dec. 2002: 40%– Dec. 2004: 90%
• Potassium– Dec. 2002: 12%– Dec. 2004: 91%
• PTT– Dec. 2002: 5%– Dec. 2004: 89%
• Hemoglobin– Dec. 2002: 40%– Dec. 2004: 90%
• Potassium– Dec. 2002: 12%– Dec. 2004: 91%
• PTT– Dec. 2002: 5%– Dec. 2004: 89%
(Dec. 2002 to Dec 2004)(Dec. 2002 to Dec 2004)

18
Potassium Turn Around Times
Collection to Receipt plus Receipt to Result
Potassium Turn Around Times
Collection to Receipt plus Receipt to Result
0
20
40
60
80
100
120
140
160
1/12-1/18/2003 7/1-7/8/03 12/28 - 01/03 01/04 - 01/10 01/11 - 01/17 01/18 - 01/24 01/25 - 01/31 02/01 - 02/07 02/08 - 02/14
Tim
e In
min
ute
sT
ime
In m
inu
tes
Time period (Dec 2003 - Feb 2004)Time period (Dec 2003 - Feb 2004)
Project initiatedBaseline Dark Blue = Collection to receiptLight Blue = Receipt to result
160
140
120
100
80
60
40
20
0

19
PotassiumLab Collection vs. Nurse Collection
PotassiumLab Collection vs. Nurse Collection
14
11 119
11 1113
42
4745
40
3736
38
0
5
10
15
20
25
30
35
40
45
50
12/28 - 01/03 01/04 - 01/10 01/11 - 01/17 01/18 - 01/24 01/25 - 01/31 02/01 - 02/07 02/08 - 02/14
Tim
e in
min
ute
s (0
– 5
0 m
inu
tes)
Tim
e in
min
ute
s (0
– 5
0 m
inu
tes)
Weeks: Dec. 28 – Feb 14Weeks: Dec. 28 – Feb 14
Blue = LabPink = Nursing
50
45
40
35
30
25
20
15
10
5
0
14
42
11
47
11
45
9
40
11
37
11
36
13
37

20
Troponin: Its own challenges(goal is 95% within 45 minutes)
Troponin: Its own challenges(goal is 95% within 45 minutes)
• Dec. 2002: 10% • Feb. 2004: 55%• SIGNIFICANT IMPROVEMENT BUT STILL
NOT GOOD ENOUGH?!?!?!?!?!• Consistency improved greatly
• Current (Dec 2004): consistently within 45 minutes
• Dec. 2002: 10% • Feb. 2004: 55%• SIGNIFICANT IMPROVEMENT BUT STILL
NOT GOOD ENOUGH?!?!?!?!?!• Consistency improved greatly
• Current (Dec 2004): consistently within 45 minutes

21
Troponin - …but what does the customer need?
Troponin - …but what does the customer need?
Jan. 2005: Lab / ED piloting new POCT method on the I-Stat for the initial Troponin.
– Ultimately ED physicians decided not to implement because the “laboratories turnaround time was consistently exceptional”
Jan. 2005: Lab / ED piloting new POCT method on the I-Stat for the initial Troponin.
– Ultimately ED physicians decided not to implement because the “laboratories turnaround time was consistently exceptional”

22
Summary of BenefitsSummary of Benefits• Testing thru-put (TAT) reduced by 50%• Productivity improvement >40%• Cost reduction at 28%• Space savings of >450 ft2• Standardized work practices• Reduction in Errors and Error Potential
– Specimen and patient ID errors reduced• Performance measurement• Elimination of excess unused inventory ($16,100) • 100% cross-training of staff
• Testing thru-put (TAT) reduced by 50%• Productivity improvement >40%• Cost reduction at 28%• Space savings of >450 ft2• Standardized work practices• Reduction in Errors and Error Potential
– Specimen and patient ID errors reduced• Performance measurement• Elimination of excess unused inventory ($16,100) • 100% cross-training of staff

23
Additional BenefitsAdditional Benefits
• Development of a core team of people that has implemented “Lean Manufacturing” and are therefore available to spread the benefits organizationally
• Standard Work and Standard performance measurement tools developed
• 2004 employee engagement score in clinical lab rose by 0.48 on a 5 point scale
• Laboratory recognition from customers

24
Cycle Time ImprovementsProject #2 – Fairview RidgesCycle Time Improvements
Project #2 – Fairview Ridges
Cycle Time Pre-Lean Goal Pilot Post Lean % ImprovementAM draw Collect to Receive >34 10 5 6 82%Collect to Receive (all times) >20 10 10 6 70%Collect to Result: -Hemoglobin >58 30 40 24 59% -Potassium >61 32 45 29 52% -PTT >58 32 21 25 57% -Troponin >51 36 19 20 61%

25
Example of daily reporting to staff (next step: drill down
into “defects”)
Example of daily reporting to staff (next step: drill down
into “defects”)PTT TAT
Receipt to Result Goal <25 minutes
9.5%
90.5%
Tests attaining TAT Goal Tests not attaining TAT Goal

26
Quote from FRH physicianQuote from FRH physician“I ordered a set of stat and comprehensive labs last Friday morning and I was astounded by the short turnaround time for all testing. The level of efficiency (15 minutes for a Basic Metabolic Panel) resulted in a much earlier treatment for a critical issue for this patient. Please extend my thanks to the staff for this excellent level of service” (Physician came directly to laboratory to provide feedback and sent letter.)
“I ordered a set of stat and comprehensive labs last Friday morning and I was astounded by the short turnaround time for all testing. The level of efficiency (15 minutes for a Basic Metabolic Panel) resulted in a much earlier treatment for a critical issue for this patient. Please extend my thanks to the staff for this excellent level of service” (Physician came directly to laboratory to provide feedback and sent letter.)

27
Eliminating wasteful and meaningless work enhances the value of work for all employees and better serves our patients and community.

28
After the project is “finished”After the project is “finished”• Insure that day-to-day operational
leadership maintains the gain (supervisor)– Compliance with standard work is the key
• Track down-time and evaluate reasons• Measure daily, weekly, monthly• Keep measures in front of staff• Share positive feedback and impact on
patient care with staff– Laboratory professionals need to understand
that the change made a difference.
• Insure that day-to-day operational leadership maintains the gain (supervisor)– Compliance with standard work is the key
• Track down-time and evaluate reasons• Measure daily, weekly, monthly• Keep measures in front of staff• Share positive feedback and impact on
patient care with staff– Laboratory professionals need to understand
that the change made a difference.

29
What have we found?What have we found?• If we use the tools and apply them as
intended, the positive changes WILL occur
• If we try to “fiddle” with the model, it does not perform. Follow your rules! Don’t waiver!
• LEAN ultimately is not “rocket science”. It is basic, logical and data driven.
• If we use the tools and apply them as intended, the positive changes WILL occur
• If we try to “fiddle” with the model, it does not perform. Follow your rules! Don’t waiver!
• LEAN ultimately is not “rocket science”. It is basic, logical and data driven.

30
Lean Balance(behind every result is a properly educated and trained laboratory
professional)
Lean Balance(behind every result is a properly educated and trained laboratory
professional)