1 february 2016 canadian smid e&p americas/canada equity
TRANSCRIPT
DISCLOSURE APPENDIX AT THE BACK OF THIS REPORT CONTAINS IMPORTANT DISCLOSURES, ANALYST CERTIFICATIONS, AND THE STATUS OF NON-US ANALYSTS. US Disclosure: Credit Suisse does and seeks to do business with companies covered in its research reports. As a result, investors should be aware that the Firm may have a conflict of interest that could affect the objectivity of this report. Investors should consider this report as only a single factor in making their investment decision.
CREDIT SUISSE SECURITIES RESEARCH & ANALYTICS BEYOND INFORMATION®
Client-Driven Solutions, Insights, and Access
1 February 2016Americas/CanadaEquity Research
Oil & Gas Exploration & Production
Canadian SMID E&P SECTOR REVIEWResearch Analysts
David Phung403 476 6023
Robert Loebach403 476 6021
Mark Lear, CFA212 538 0239
Jason Frew403 476 6022
Brian Ho403 476 6009
Andrew M. Kuske416 352 4561
Paul Tan416 352 4593
AB Royalty Review – Is It Really Benign?The Alberta royalty review advisory panel released its findings and recommendations before the weekend. After a review of the proposals, aside from the oil sands space that saw essentially no changes, we do not believe the proposals are as benign as the headlines may suggest, at least within the context of our CDN SMID E&P coverage space. Final details to complete a full assessment of the proposed royalty changes may not be available until March 31, 2016.
■ Relatively More Certain – Oil Sands: For oil sands players, the recommendation was to maintain the existing royalty structure with no changes, except for greater transparency in determining allowable costs in the cost recovery calculations. Comparatively, this can be considered a positive outcome.
■ Relatively More Uncertain – Unconventionals: The current drilling credits that shelter our CDN SMID E&P names in the AB Montney, Duvernay and Deep Basin from higher royalty rates will be replaced by a system that includes (i) a 5% royalty rate until “payout” (definition is somewhat different, see details in note), (ii) a different royalty rate after payout, depending on commodity prices and (iii) a declining royalty rate with declining production during the mature phase of the well. The royalty rate does not distinguish between hydrocarbon products, which is a simplification. Our concern here is that many wells in the Montney, Duvernay and Deep Basin currently retain a relatively low 5% royalty rate even after “payout” and any potential changes could shift the investment risk profile unfavourably for investors. Directionally, we believe that the liquids rich assets may be at greater risk than dry gas assets, but we emphasize the details for a full assessment is not yet available.
■ TOU and ARC: Among our Outperform-rated names, Tourmaline’s Deep Basin assets in Alberta is generally dry gas, which may not be as impacted, and its liquids rich Lower Montney is in BC and may look increasingly desirable. As such, Tourmaline may be best suited to navigate this period of change. Among our other Outperform-rated names that are natural gas weighted is ARC, with most of its natural gas weighted assets in British Columbia.
■ PEY – No Better Place to Go with Cost Indexing: In order to promote lower industry costs, the proposals include cost indexing and a carrot and sticks approach to incentivize companies to reduce costs and become more efficient. If implemented, we wonder if Peyto has the most to gain since the company is the low cost operator to begin with and is most likely to fall under the average drilling and completion cost allowance metric.
1 February 2016
Canadian SMID E&P 2
Table of contentsLet's Get Straight Into the Meat (Excl. Oil Sands)....................................................3
When Do Things Change? 3
What Is New? 3
Before Payout 4
So “Payout” Is When Cumulative Revenue Exceeds C*…What Is C*? 4
The “Calibration Team” and Targeting Average Returns 5
Maturity Threshold 5
Some Things to Chew On ........................................................................................5
In Some Ways Simpler, In Other Ways Not So Much..............................................5
Potential Unintended Consequences.......................................................................6
Investment Risk Profile May Elevate........................................................................6
United States Competition Acknowledged, but Industry and the Markets Already
Knew That ..............................................................................................................11
So What Should Investors Do? ..............................................................................11
Tourmaline, ARC and Peyto 11
Appendix – Existing Alberta and British Columbia Crown Fiscal Terms ................12
Alberta – Old Natural Gas Royalty Structure 12
Alberta – Old Oil Royalty Structure 14
British Columbia – Current Natural Gas Royalty Structure 15
British Columbia – Oil Royalties 20
1 February 2016
Canadian SMID E&P 3
Let's Get Straight Into the Meat (Excl. Oil Sands)For our Canadian SMID E&P names operating in the Alberta Montney, Duvernay and/or Deep Basin we believe the following subjects are of most interest.
When Do Things Change?In general, the new framework will only apply to new wells drilled in 2017 and thereafter. Existing royalties will remain in effect for 10 years on prior investments before reverting to the new royalty framework. However, the current new well royalty incentives and deep gas drilling credits that is relevant to our coverage space will remain in effect for wells drilled in 2017 and rates would be effective until 2022 (five years) in order to more orderly transition to the new framework.
What Is New?New wells under the new royalty framework will be under a more simple structure where the royalty rate will apply to all hydrocarbon products. This is a simplification from the current royalty regime.
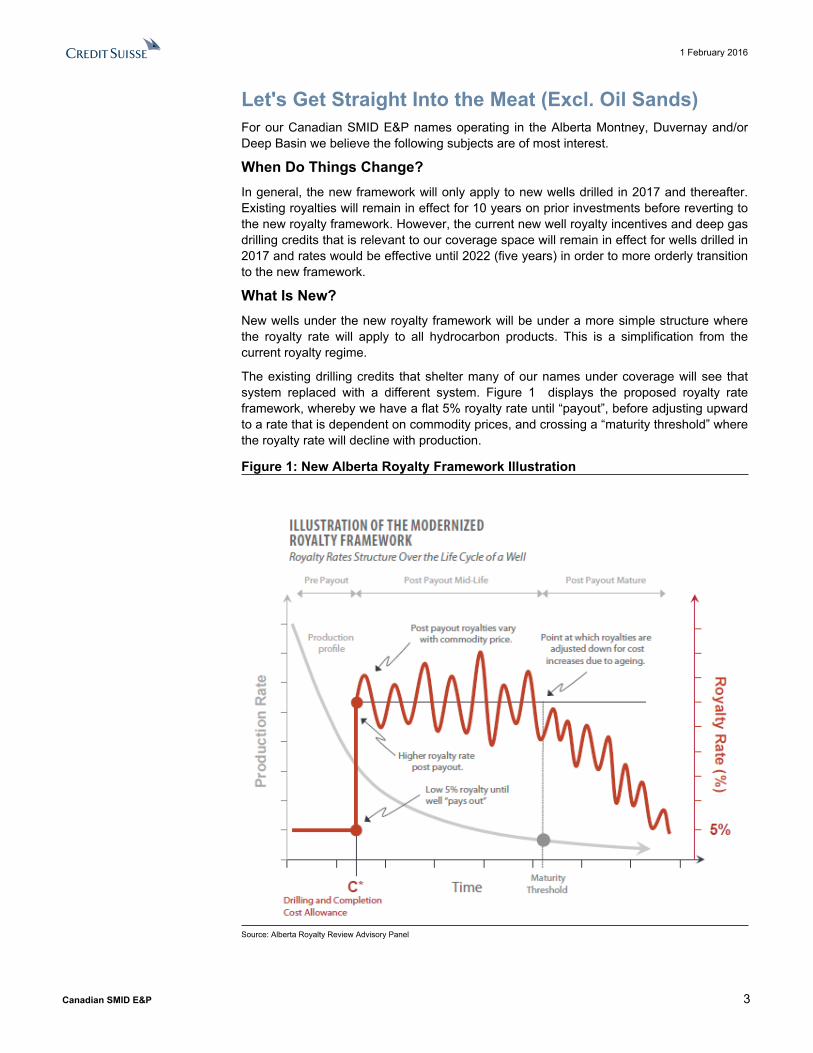
The existing drilling credits that shelter many of our names under coverage will see that system replaced with a different system. Figure 1 displays the proposed royalty rate framework, whereby we have a flat 5% royalty rate until “payout”, before adjusting upward to a rate that is dependent on commodity prices, and crossing a “maturity threshold” where the royalty rate will decline with production.
Figure 1: New Alberta Royalty Framework Illustration
Source: Alberta Royalty Review Advisory Panel
1 February 2016
Canadian SMID E&P 4
Before PayoutFrom our vantage point, determining the definition and impact of before payout is the first area of uncertainty, with a number of variables still yet to be ironed out.
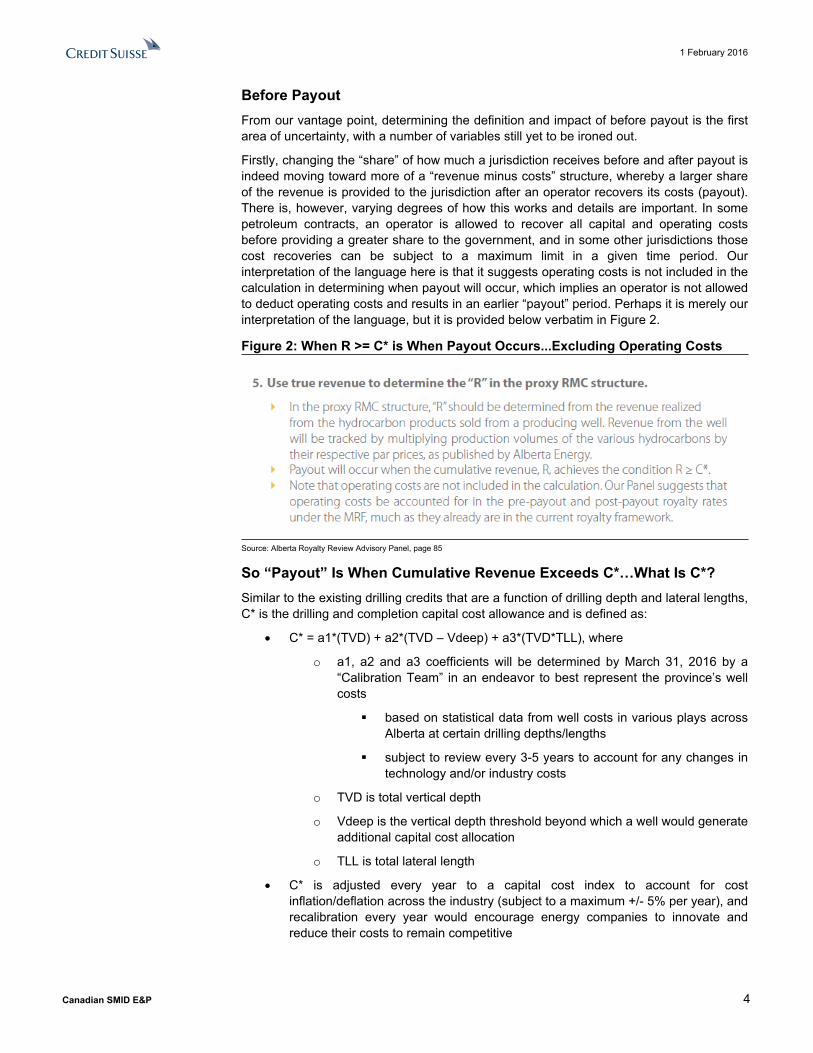
Firstly, changing the “share” of how much a jurisdiction receives before and after payout is indeed moving toward more of a “revenue minus costs” structure, whereby a larger share of the revenue is provided to the jurisdiction after an operator recovers its costs (payout). There is, however, varying degrees of how this works and details are important. In some petroleum contracts, an operator is allowed to recover all capital and operating costs before providing a greater share to the government, and in some other jurisdictions those cost recoveries can be subject to a maximum limit in a given time period. Our interpretation of the language here is that it suggests operating costs is not included in the calculation in determining when payout will occur, which implies an operator is not allowed to deduct operating costs and results in an earlier “payout” period. Perhaps it is merely our interpretation of the language, but it is provided below verbatim in Figure 2.
Figure 2: When R >= C* is When Payout Occurs...Excluding Operating Costs
Source: Alberta Royalty Review Advisory Panel, page 85
So “Payout” Is When Cumulative Revenue Exceeds C*…What Is C*?Similar to the existing drilling credits that are a function of drilling depth and lateral lengths, C* is the drilling and completion capital cost allowance and is defined as:
C* = a1*(TVD) + a2*(TVD – Vdeep) + a3*(TVD*TLL), where
o a1, a2 and a3 coefficients will be determined by March 31, 2016 by a “Calibration Team” in an endeavor to best represent the province’s well costs
based on statistical data from well costs in various plays across Alberta at certain drilling depths/lengths
subject to review every 3-5 years to account for any changes in technology and/or industry costs
o TVD is total vertical depth
o Vdeep is the vertical depth threshold beyond which a well would generate additional capital cost allocation
o TLL is total lateral length
C* is adjusted every year to a capital cost index to account for cost inflation/deflation across the industry (subject to a maximum +/- 5% per year), and recalibration every year would encourage energy companies to innovate and reduce their costs to remain competitive
1 February 2016
Canadian SMID E&P 5
The “Calibration Team” and Targeting Average ReturnsAlberta Energy is ultimately responsible in setting the above coefficients to determine C* and the post payout royalty rate formulas. Specifically, the advisory panel recommended that in determining these parameters, the Calibration Team consult with members of the Natural Gas and Crude Oil and Liquids Expert Groups (various individuals from industry), and to constrain its determination of parameters so that the resulting economic returns for industry are the same as it is today, on average. This is an attempt to maintain investment appeal during this period of transition, although we wonder if an average return target may not do justice for assets that currently achieve above average returns. When statistical averages are used, there will be assets above that average and some below that average. We wonder if some will benefit from this statistical approach more than others.
Calibration and implementation is expected to involve much work, and is recommended it be delivered by March 31, 2016.
Maturity ThresholdBased on initial assessments, the advisory panel suggests that for oil wells this threshold is 20 bbls/d and for natural gas wells it is 200 mmcf/d, which is when declining production and aging may result in a well not being able to support higher royalty rates. The recommendation is that the royalty rate decline linearly with production rates, with a minimum royalty rate of 5%.
Some Things to Chew OnBelow we put some of our thoughts on paper, but clearly there are still a number of variables that the Alberta Government still needs to provide before we can fully assess these proposals and the ultimate impact to the companies we currently have under coverage. Nonetheless, we move forward with the discussion.
In Some Ways Simpler, In Other Ways Not So MuchCertainly, the harmonization of the royalty rate that applies to all hydrocarbon production, instead of different royalty rates for different products, is a clear simplification over the old/existing royalty regime. In addition, it likely removes some degree of distortion from the current framework. Furthermore, the move to a greater emphasis on a “revenue minus costs” type of model to determine share of revenue based on “payout” is somewhat more intuitive and similar to many other petroleum sharing agreements internationally. Altogether, on the surface there seem to be fewer moving parts, though this is not really the case.
The “payout” period is still a function of C*, and is ultimately dependent on drilling depths and lateral lengths of wells, similar what is already in place in the form of deep drilling credits for unconventional horizontal wells. In addition to this, we add on statistical averages to determine C* and is indexed to industry inflation/deflation on an annual basis. Companies that can “beat the bar” on industry average well costs stand to benefit and vice versa. There are certainly good intentions here to foster competition, continuous innovation and cost reductions. However, as an objective market observer, we believe that Adam Smith’s invisible hand works well enough in general, especially given passage of time. As such, although a system that fosters continuous innovation to reduce costs is rooted in good intentions, we wonder if it is necessary since market forces would result in less efficient and higher cost operators out of the market over time.
Returning to the use of statistical averages in a “one-size-fits-all” type of approach, we wonder if it may create unintended consequences and distortions.
1 February 2016
Canadian SMID E&P 6
Potential Unintended ConsequencesCertainly, each asset has its own characteristics and attributes that can influence the ultimate costs of drilling, completion and development, whether that is related to the reservoir, product handling or surface access, among other considerations. Applying a statistical method to determine an average expected well cost allowance (C*) for a particular depth may not necessarily accurately reflect reality, and may place some operators at an advantage while others at a disadvantage. In some cases it may not even be in the best interest of the resource owner. The formula has appears to be unrelated to or does not account for differences in completion costs, frac intensity or even overall well productivity and long term hydrocarbon recovery.
One such example may be a higher well cost development, whether that is due to a more remote location relative to other plays, the product stream requiring different equipment, and/or the rock is more difficult to drill for whatever reason, but the vertical depths and lateral lengths may be similar. As such, the actual well costs may exceed the statistical average C* for that well depth and length, and the operator may be at a relative disadvantage under the proposed system not because they are inefficient operators, but because the use of statistical averages may discriminate its assets. Vice versa, an operator may at an advantage for all the opposite reasons. In essence, a C*, or drilling and completion cost allowance, based on a statistical average to determine a “payout” period, may not properly take into account specific attributes of an asset.
In potentially another example, the use of statistical averages may create misplaced incentives that could ultimately not be in the best interest of Albertans in the long term, because the formula does not appear to be a per unit of product basis, or in other words well productivity and ultimate reserves recovery. The proposed system is to encourage continuous innovation and cost reduction but perhaps at a particular asset, an operator may deem it beneficial to maintain the well cost instead of reducing it, in order to conduct more frac stages and stimulation intensity to increase well productivity. On a dollars per unit of product basis, this would likely be beneficial to the resource owner in the long term. Since the formula is only based on depth and there is only an incentive to drive down absolute dollar costs, there could be a misplaced incentive here and result in more hydrocarbons left in the ground. Essentially, we wonder if this proposed cost index system would incent companies to under capitalize an asset to “beat the bar” on costs in the short term instead of focusing on maximizing dollars per unit product produced to the benefit of Albertans in the long term. Perhaps an approach incorporating long term productivity and reserves recovery into this system may be a consideration.
Ultimately, we will need to wait and see what the overall system will look like before finalizing our thoughts. Perhaps the parameters that will be set will be more than enough to address some of our observations and questions.
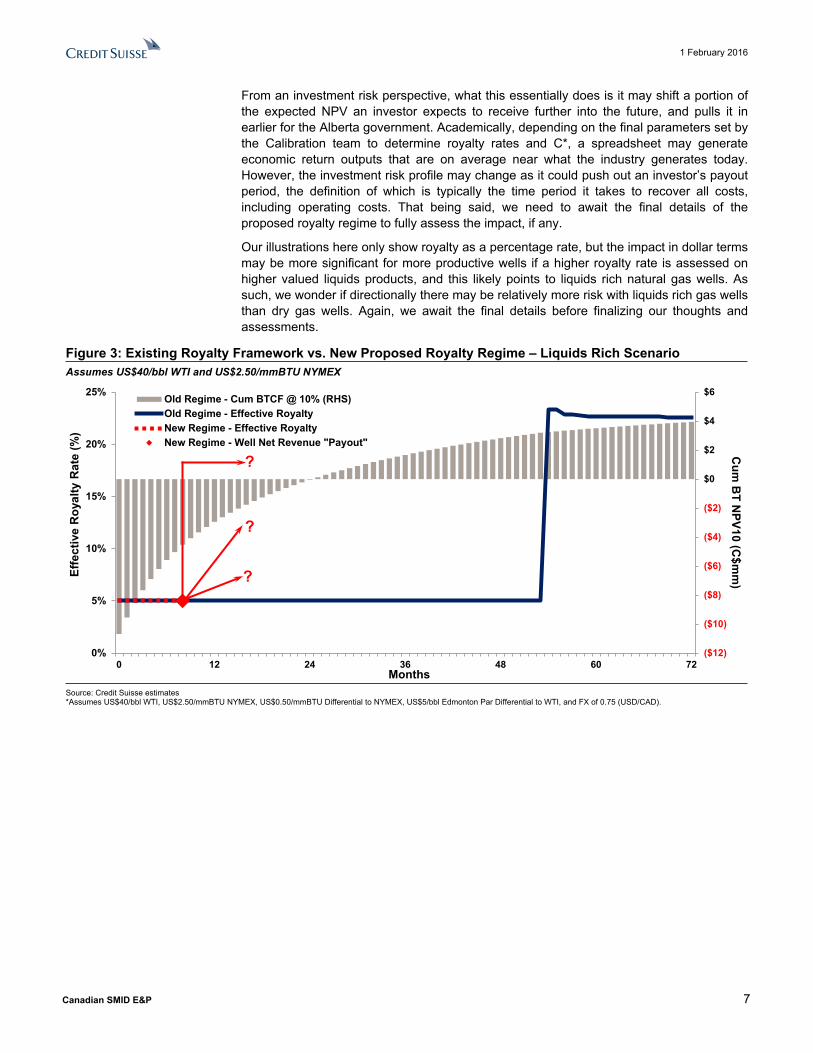
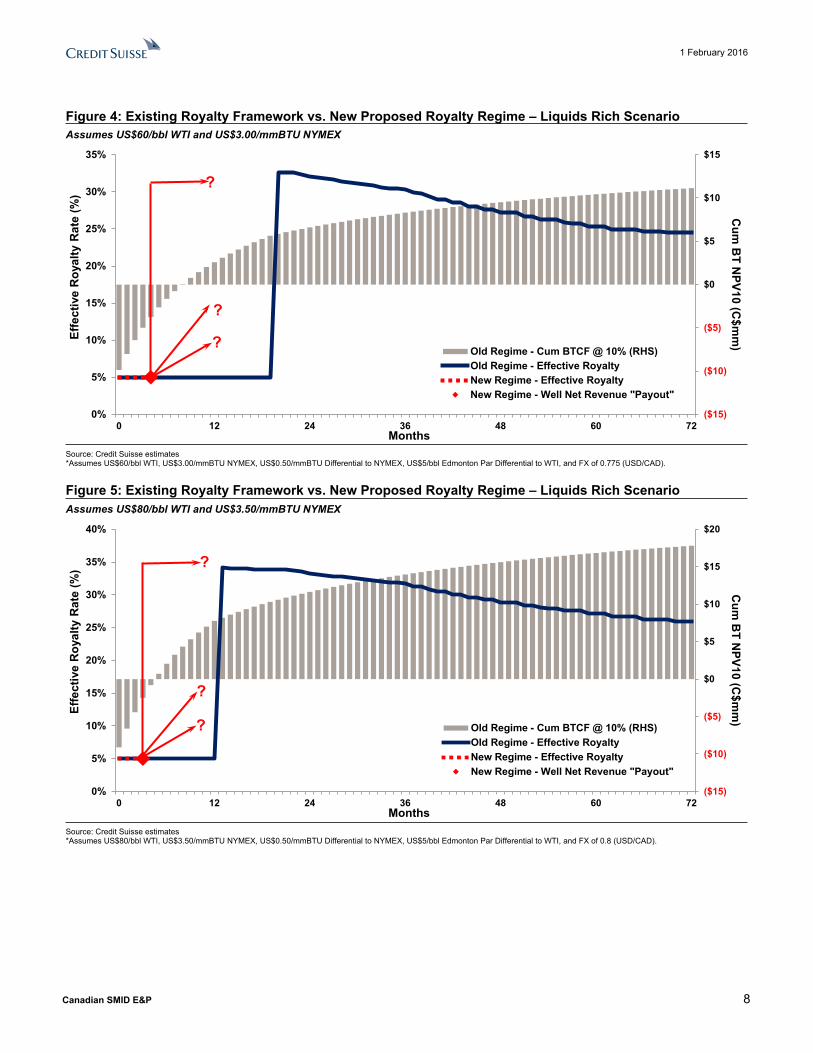
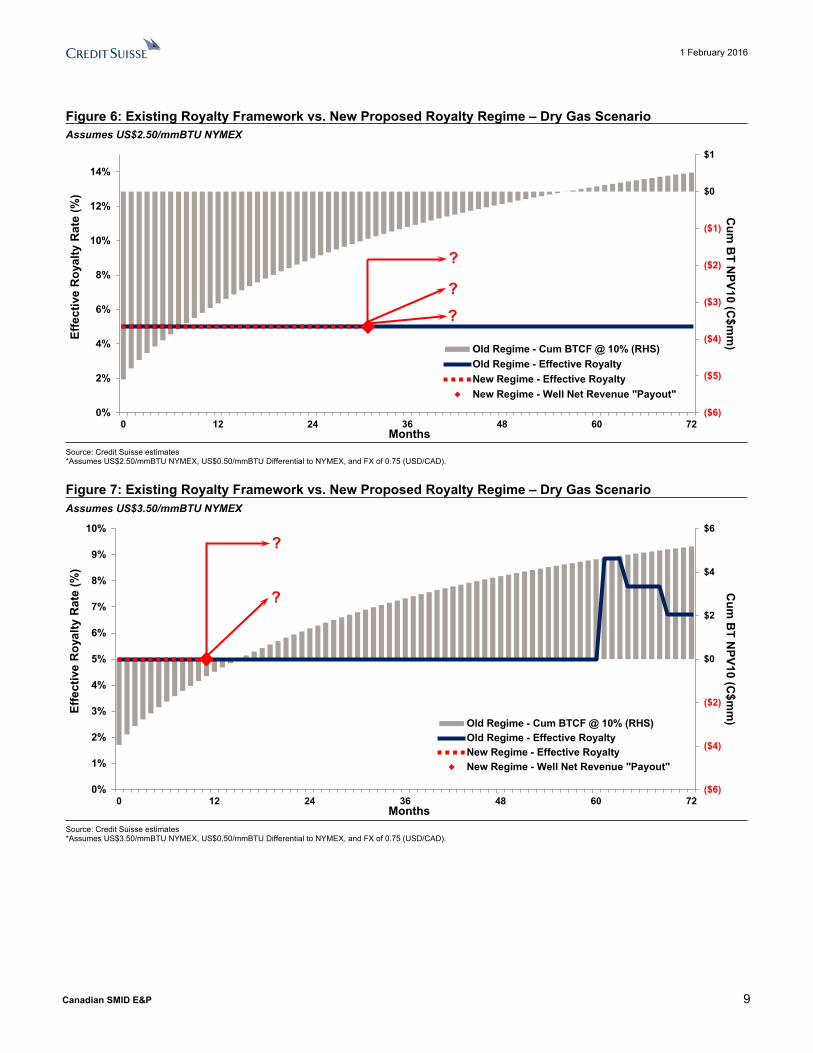
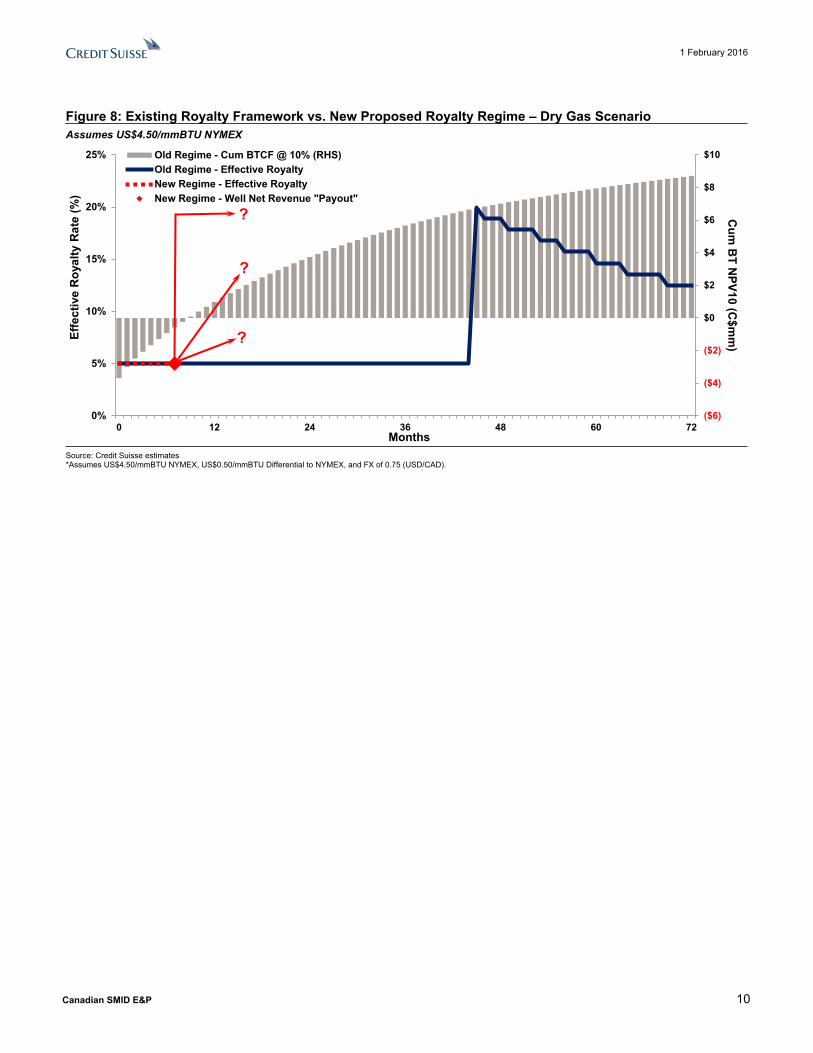
Investment Risk Profile May ElevateFigure 3 through Figure 8 provides a comparison (illustrations only) of the existing royalty framework with drilling credits, at different commodity prices, to the new proposed royalty regime, using liquids rich wells at one end of the spectrum and dry gas wells at the other end. Under current commodity prices, the royalty rate is 5% before “payout” and remains at 5% post “payout” for an extended period, the ultimate duration of which is largely dependent on the commodity price environment and the drilling credits generated. The general effect is that the lower the commodity price and more drilling credits available result in lower royalty rates for a longer duration, and vice versa. After the drilling credits are exhausted, then the royalty rate can rise significantly, but is usually at a time later in the life of the well when productivity is lower. Under the newly proposed royalty regime, this effect is somewhat opposite, whereby the royalty rate rises after “payout” and then declines in the mature phase of the life of the well.
1 February 2016
Canadian SMID E&P 7
From an investment risk perspective, what this essentially does is it may shift a portion of the expected NPV an investor expects to receive further into the future, and pulls it in earlier for the Alberta government. Academically, depending on the final parameters set by the Calibration team to determine royalty rates and C*, a spreadsheet may generate economic return outputs that are on average near what the industry generates today. However, the investment risk profile may change as it could push out an investor’s payout period, the definition of which is typically the time period it takes to recover all costs, including operating costs. That being said, we need to await the final details of the proposed royalty regime to fully assess the impact, if any.
Our illustrations here only show royalty as a percentage rate, but the impact in dollar terms may be more significant for more productive wells if a higher royalty rate is assessed on higher valued liquids products, and this likely points to liquids rich natural gas wells. As such, we wonder if directionally there may be relatively more risk with liquids rich gas wells than dry gas wells. Again, we await the final details before finalizing our thoughts and assessments.
Figure 3: Existing Royalty Framework vs. New Proposed Royalty Regime – Liquids Rich ScenarioAssumes US$40/bbl WTI and US$2.50/mmBTU NYMEX
($12)
($10)
($8)
($6)
($4)
($2)
$0
$2
$4
$6
0%
5%
10%
15%
20%
25%
0 12 24 36 48 60 72
Cum
BT N
PV10 (C$m
m)Ef
fect
ive
Roy
alty
Rat
e (%
)
Months
Old Regime - Cum BTCF @ 10% (RHS)Old Regime - Effective RoyaltyNew Regime - Effective RoyaltyNew Regime - Well Net Revenue "Payout"
?
?
?
Source: Credit Suisse estimates*Assumes US$40/bbl WTI, US$2.50/mmBTU NYMEX, US$0.50/mmBTU Differential to NYMEX, US$5/bbl Edmonton Par Differential to WTI, and FX of 0.75 (USD/CAD).
1 February 2016
Canadian SMID E&P 8
Figure 4: Existing Royalty Framework vs. New Proposed Royalty Regime – Liquids Rich ScenarioAssumes US$60/bbl WTI and US$3.00/mmBTU NYMEX
($15)
($10)
($5)
$0
$5
$10
$15
0%
5%
10%
15%
20%
25%
30%
35%
0 12 24 36 48 60 72
Cum
BT N
PV10 (C$m
m)Ef
fect
ive
Roy
alty
Rat
e (%
)
Months
Old Regime - Cum BTCF @ 10% (RHS)Old Regime - Effective RoyaltyNew Regime - Effective RoyaltyNew Regime - Well Net Revenue "Payout"
?
?
?
Source: Credit Suisse estimates*Assumes US$60/bbl WTI, US$3.00/mmBTU NYMEX, US$0.50/mmBTU Differential to NYMEX, US$5/bbl Edmonton Par Differential to WTI, and FX of 0.775 (USD/CAD).
Figure 5: Existing Royalty Framework vs. New Proposed Royalty Regime – Liquids Rich ScenarioAssumes US$80/bbl WTI and US$3.50/mmBTU NYMEX
($15)
($10)
($5)
$0
$5
$10
$15
$20
0%
5%
10%
15%
20%
25%
30%
35%
40%
0 12 24 36 48 60 72
Cum
BT N
PV10 (C$m
m)
Effe
ctiv
e R
oyal
ty R
ate
(%)
Months
Old Regime - Cum BTCF @ 10% (RHS)Old Regime - Effective RoyaltyNew Regime - Effective RoyaltyNew Regime - Well Net Revenue "Payout"
?
?
?
Source: Credit Suisse estimates*Assumes US$80/bbl WTI, US$3.50/mmBTU NYMEX, US$0.50/mmBTU Differential to NYMEX, US$5/bbl Edmonton Par Differential to WTI, and FX of 0.8 (USD/CAD).
1 February 2016
Canadian SMID E&P 9
Figure 6: Existing Royalty Framework vs. New Proposed Royalty Regime – Dry Gas ScenarioAssumes US$2.50/mmBTU NYMEX
($6)
($5)
($4)
($3)
($2)
($1)
$0
$1
0%
2%
4%
6%
8%
10%
12%
14%
0 12 24 36 48 60 72
Cum
BT N
PV10 (C$m
m)Ef
fect
ive
Roy
alty
Rat
e (%
)
Months
Old Regime - Cum BTCF @ 10% (RHS)Old Regime - Effective RoyaltyNew Regime - Effective RoyaltyNew Regime - Well Net Revenue "Payout"
??
?
Source: Credit Suisse estimates*Assumes US$2.50/mmBTU NYMEX, US$0.50/mmBTU Differential to NYMEX, and FX of 0.75 (USD/CAD).
Figure 7: Existing Royalty Framework vs. New Proposed Royalty Regime – Dry Gas ScenarioAssumes US$3.50/mmBTU NYMEX
($6)
($4)
($2)
$0
$2
$4
$6
0%
1%
2%
3%
4%
5%
6%
7%
8%
9%
10%
0 12 24 36 48 60 72
Cum
BT N
PV10 (C$m
m)Ef
fect
ive
Roy
alty
Rat
e (%
)
Months
Old Regime - Cum BTCF @ 10% (RHS)Old Regime - Effective RoyaltyNew Regime - Effective RoyaltyNew Regime - Well Net Revenue "Payout"
?
?
Source: Credit Suisse estimates*Assumes US$3.50/mmBTU NYMEX, US$0.50/mmBTU Differential to NYMEX, and FX of 0.75 (USD/CAD).
1 February 2016
Canadian SMID E&P 10
Figure 8: Existing Royalty Framework vs. New Proposed Royalty Regime – Dry Gas ScenarioAssumes US$4.50/mmBTU NYMEX
($6)
($4)
($2)
$0
$2
$4
$6
$8
$10
0%
5%
10%
15%
20%
25%
0 12 24 36 48 60 72
Cum
BT N
PV10 (C$m
m)Ef
fect
ive
Roy
alty
Rat
e (%
)
Months
Old Regime - Cum BTCF @ 10% (RHS)Old Regime - Effective RoyaltyNew Regime - Effective RoyaltyNew Regime - Well Net Revenue "Payout"
?
?
?
Source: Credit Suisse estimates*Assumes US$4.50/mmBTU NYMEX, US$0.50/mmBTU Differential to NYMEX, and FX of 0.75 (USD/CAD).
1 February 2016
Canadian SMID E&P 11
United States Competition Acknowledged, but Industry and the Markets Already Knew ThatIn our prior publications of “The Montney Stands Tall” and “Survival of the Fiscal Fittest”, we highlighted some of these risks, including infrastructure and basis differentials. We also highlighted how the existing fiscal structure compensated for these investment risks, including the “front-end loaded” low royalty rate at the onset and a progressive sliding scale that results in a lower royalty rate at lower commodity prices. However, this same structure is changing with these new proposals.
So What Should Investors Do?A complete final assessment of these new royalty proposals will not be possible until the final terms are provided, but we argue this proposed royalty framework and regime may not be as benign as some of the headlines may suggest. We believe that certain details of the suggested framework directionally points to an elevated risk profile for investors and operators, relative to the existing royalty regime, while directionally there may be more at risk with liquids rich revenue streams than natural gas weighted revenue streams.
In addition, although our focus here has been specifically targeted to Alberta’s new royalty proposals, we believe investors should not lose context of how Alberta currently fits into the overall North American natural gas markets. We believe rising competition from the United States is a real and elevating risk over time, and we currently do not see how the royalty proposals benefit companies in our coverage space in terms of competing for capital.
Tourmaline, ARC and PeytoWithin our coverage space, Tourmaline is our preferred Outperform rated name to navigate the current uncertainty with this proposed royalty regime, given its Deep Basin assets in Alberta are natural gas weighted and its liquids rich Montney is in British Columbia, both of which may not be as impacted. In terms of the cost index to which the drilling and completions capital cost allowance is adjusted every year and determines the “payout” period, investors may want to gravitate towards Peyto as the company is already the low cost producer and may be the benchmark that others strive toward.
Companies with natural gas assets primarily outside of Alberta include ARC, Crew, Painted Pony and to degree also Kelt. Among these names, ARC is rated Outperform.
1 February 2016
Canadian SMID E&P 12
Appendix – Existing Alberta and British Columbia Crown Fiscal TermsThe following discussion provides greater detail to the existing fiscal terms in Alberta and current unchanged terms in British Columbia as a reference point for investors.
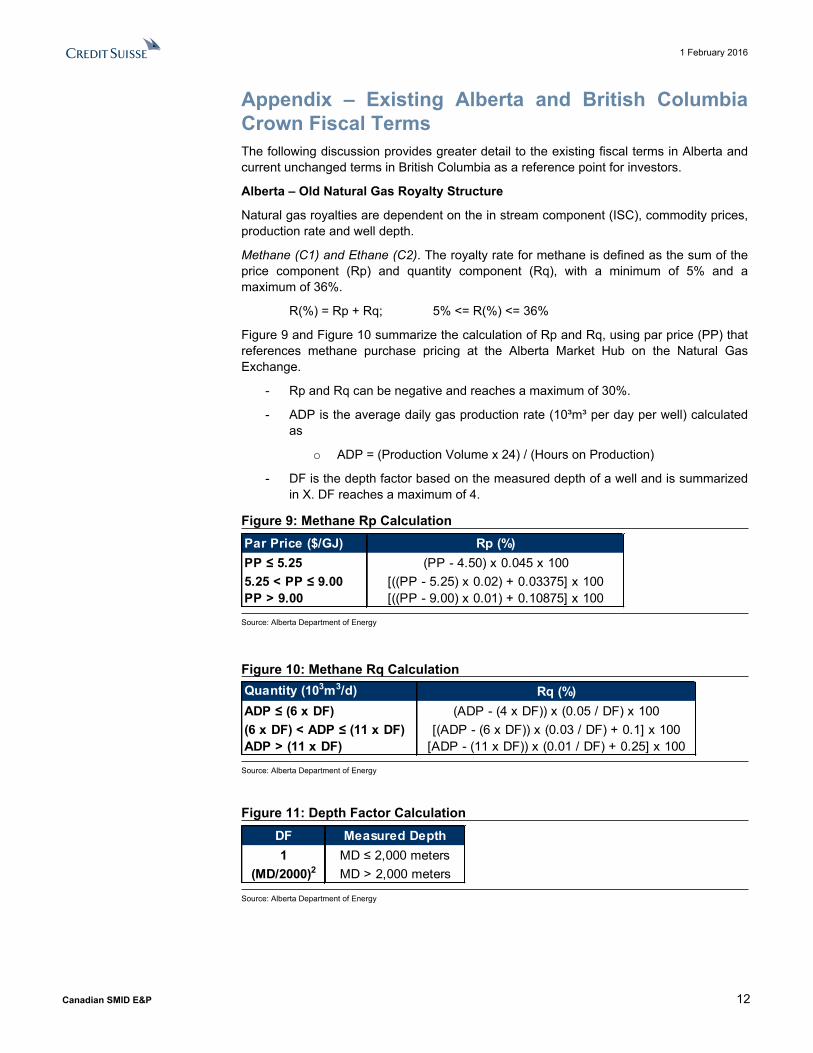
Alberta – Old Natural Gas Royalty Structure
Natural gas royalties are dependent on the in stream component (ISC), commodity prices, production rate and well depth.
Methane (C1) and Ethane (C2). The royalty rate for methane is defined as the sum of the price component (Rp) and quantity component (Rq), with a minimum of 5% and a maximum of 36%.
R(%) = Rp + Rq; 5% <= R(%) <= 36%
Figure 9 and Figure 10 summarize the calculation of Rp and Rq, using par price (PP) that references methane purchase pricing at the Alberta Market Hub on the Natural Gas Exchange.
- Rp and Rq can be negative and reaches a maximum of 30%.
- ADP is the average daily gas production rate (10³m³ per day per well) calculated as
o ADP = (Production Volume x 24) / (Hours on Production)
- DF is the depth factor based on the measured depth of a well and is summarized in X. DF reaches a maximum of 4.
Figure 9: Methane Rp CalculationPar Price ($/GJ) Rp (%)PP ≤ 5.25 (PP - 4.50) x 0.045 x 1005.25 < PP ≤ 9.00 [((PP - 5.25) x 0.02) + 0.03375] x 100PP > 9.00 [((PP - 9.00) x 0.01) + 0.10875] x 100
Source: Alberta Department of Energy
Figure 10: Methane Rq CalculationQuantity (103m3/d) Rq (%)ADP ≤ (6 x DF) (ADP - (4 x DF)) x (0.05 / DF) x 100(6 x DF) < ADP ≤ (11 x DF) [(ADP - (6 x DF)) x (0.03 / DF) + 0.1] x 100ADP > (11 x DF) [ADP - (11 x DF)) x (0.01 / DF) + 0.25] x 100
Source: Alberta Department of Energy
Figure 11: Depth Factor CalculationDF Measured Depth1 MD ≤ 2,000 meters
(MD/2000)2 MD > 2,000 meters
Source: Alberta Department of Energy
1 February 2016
Canadian SMID E&P 13
Propane (C3) and Butane (C4). The royalty rate for propane and butane is 30%.
Pentanes Plus (C5+). The royalty rate for pentanes plus is 40%.
In addition to the royalties set forth above, there are royalty adjustments applicable to wells that meet certain criteria. These adjustments include the "New Well Royalty Rate", "Natural Gas Deep Drilling Program (NGDDP)".
New Well Royalty Rate. New gas wells and some wells recommencing production have a maximum royalty rate of 5% for all products, for the first 12 months of production and subject to a volume cap of 500 mmcf. Qualifying criteria include, among others:
- Spud on or after April 1, 2009
- Classified as an oil, gas or crude bitumen well when it begins or recommences production
- Well production is subject to royalty payments under the Petroleum Royalty Regulation, 2009, the Natural Gas Royalty Regulation, 2009 or section 27 of the Oil Sands Royalty Regulation, 2009
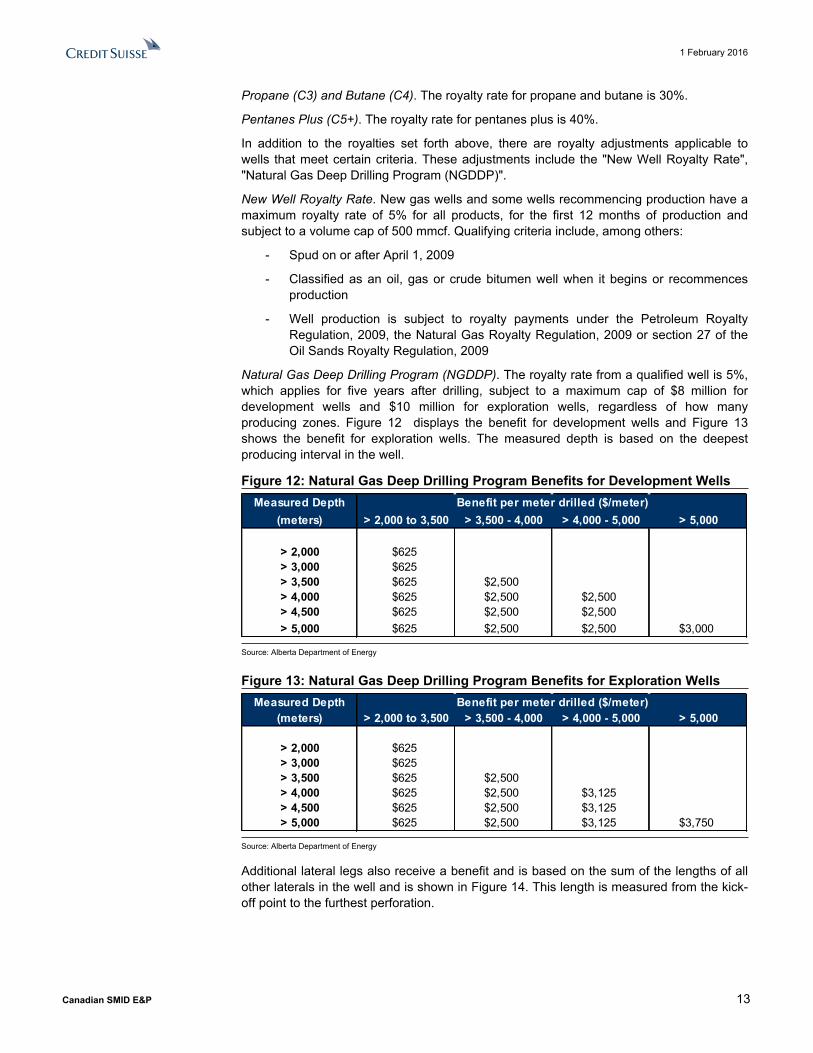
Natural Gas Deep Drilling Program (NGDDP). The royalty rate from a qualified well is 5%, which applies for five years after drilling, subject to a maximum cap of $8 million for development wells and $10 million for exploration wells, regardless of how many producing zones. Figure 12 displays the benefit for development wells and Figure 13 shows the benefit for exploration wells. The measured depth is based on the deepest producing interval in the well.
Figure 12: Natural Gas Deep Drilling Program Benefits for Development WellsMeasured Depth
(meters) > 2,000 to 3,500 > 3,500 - 4,000 > 4,000 - 5,000 > 5,000
> 2,000 $625> 3,000 $625> 3,500 $625 $2,500> 4,000 $625 $2,500 $2,500> 4,500 $625 $2,500 $2,500> 5,000 $625 $2,500 $2,500 $3,000
Benefit per meter drilled ($/meter)
Source: Alberta Department of Energy
Figure 13: Natural Gas Deep Drilling Program Benefits for Exploration WellsMeasured Depth
(meters) > 2,000 to 3,500 > 3,500 - 4,000 > 4,000 - 5,000 > 5,000
> 2,000 $625> 3,000 $625> 3,500 $625 $2,500> 4,000 $625 $2,500 $3,125> 4,500 $625 $2,500 $3,125> 5,000 $625 $2,500 $3,125 $3,750
Benefit per meter drilled ($/meter)
Source: Alberta Department of Energy
Additional lateral legs also receive a benefit and is based on the sum of the lengths of all other laterals in the well and is shown in Figure 14. This length is measured from the kick-off point to the furthest perforation.
1 February 2016
Canadian SMID E&P 14
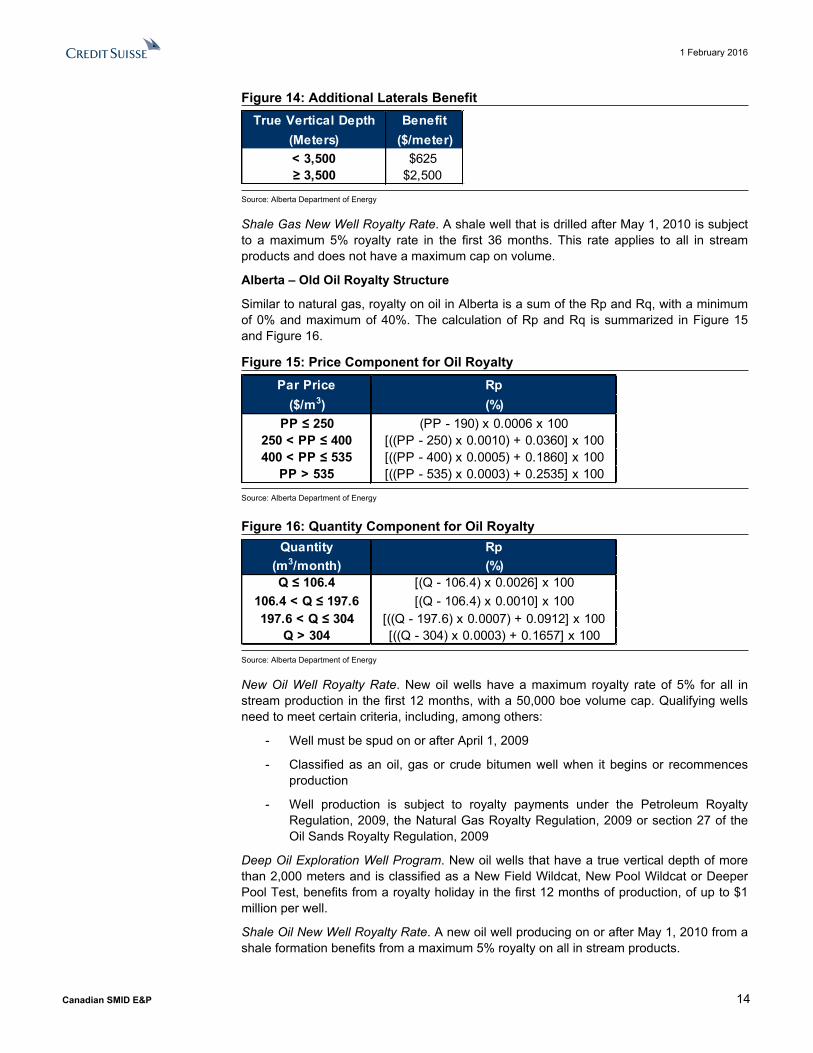
Figure 14: Additional Laterals BenefitTrue Vertical Depth Benefit
(Meters) ($/meter)< 3,500 $625≥ 3,500 $2,500
Source: Alberta Department of Energy
Shale Gas New Well Royalty Rate. A shale well that is drilled after May 1, 2010 is subject to a maximum 5% royalty rate in the first 36 months. This rate applies to all in stream products and does not have a maximum cap on volume.
Alberta – Old Oil Royalty Structure
Similar to natural gas, royalty on oil in Alberta is a sum of the Rp and Rq, with a minimum of 0% and maximum of 40%. The calculation of Rp and Rq is summarized in Figure 15 and Figure 16.
Figure 15: Price Component for Oil RoyaltyPar Price Rp
($/m3) (%)PP ≤ 250 (PP - 190) x 0.0006 x 100
250 < PP ≤ 400 [((PP - 250) x 0.0010) + 0.0360] x 100400 < PP ≤ 535 [((PP - 400) x 0.0005) + 0.1860] x 100
PP > 535 [((PP - 535) x 0.0003) + 0.2535] x 100
Source: Alberta Department of Energy
Figure 16: Quantity Component for Oil RoyaltyQuantity Rp
(m3/month) (%)Q ≤ 106.4 [(Q - 106.4) x 0.0026] x 100
106.4 < Q ≤ 197.6 [(Q - 106.4) x 0.0010] x 100197.6 < Q ≤ 304 [((Q - 197.6) x 0.0007) + 0.0912] x 100
Q > 304 [((Q - 304) x 0.0003) + 0.1657] x 100
Source: Alberta Department of Energy
New Oil Well Royalty Rate. New oil wells have a maximum royalty rate of 5% for all in stream production in the first 12 months, with a 50,000 boe volume cap. Qualifying wells need to meet certain criteria, including, among others:
- Well must be spud on or after April 1, 2009
- Classified as an oil, gas or crude bitumen well when it begins or recommences production
- Well production is subject to royalty payments under the Petroleum Royalty Regulation, 2009, the Natural Gas Royalty Regulation, 2009 or section 27 of the Oil Sands Royalty Regulation, 2009
Deep Oil Exploration Well Program. New oil wells that have a true vertical depth of more than 2,000 meters and is classified as a New Field Wildcat, New Pool Wildcat or Deeper Pool Test, benefits from a royalty holiday in the first 12 months of production, of up to $1 million per well.
Shale Oil New Well Royalty Rate. A new oil well producing on or after May 1, 2010 from a shale formation benefits from a maximum 5% royalty on all in stream products.
1 February 2016
Canadian SMID E&P 15
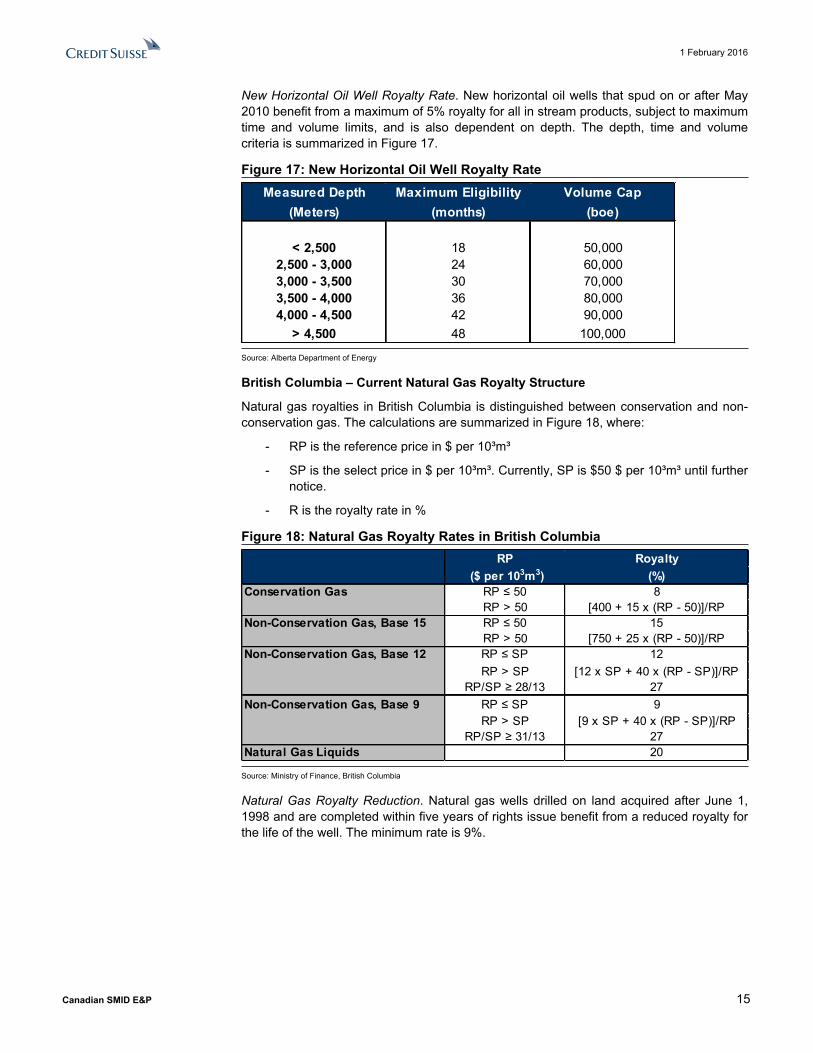
New Horizontal Oil Well Royalty Rate. New horizontal oil wells that spud on or after May 2010 benefit from a maximum of 5% royalty for all in stream products, subject to maximum time and volume limits, and is also dependent on depth. The depth, time and volume criteria is summarized in Figure 17.
Figure 17: New Horizontal Oil Well Royalty RateMeasured Depth Maximum Eligibility Volume Cap
(Meters) (months) (boe)
< 2,500 18 50,0002,500 - 3,000 24 60,0003,000 - 3,500 30 70,0003,500 - 4,000 36 80,0004,000 - 4,500 42 90,000
> 4,500 48 100,000
Source: Alberta Department of Energy
British Columbia – Current Natural Gas Royalty Structure
Natural gas royalties in British Columbia is distinguished between conservation and non-conservation gas. The calculations are summarized in Figure 18, where:
- RP is the reference price in $ per 10³m³
- SP is the select price in $ per 10³m³. Currently, SP is $50 $ per 10³m³ until further notice.
- R is the royalty rate in %
Figure 18: Natural Gas Royalty Rates in British ColumbiaRP Royalty
($ per 103m3) (%)Conservation Gas RP ≤ 50 8
RP > 50 [400 + 15 x (RP - 50)]/RPNon-Conservation Gas, Base 15 RP ≤ 50 15
RP > 50 [750 + 25 x (RP - 50)]/RPNon-Conservation Gas, Base 12 RP ≤ SP 12
RP > SP [12 x SP + 40 x (RP - SP)]/RPRP/SP ≥ 28/13 27
Non-Conservation Gas, Base 9 RP ≤ SP 9RP > SP [9 x SP + 40 x (RP - SP)]/RP
RP/SP ≥ 31/13 27Natural Gas Liquids 20
Source: Ministry of Finance, British Columbia
Natural Gas Royalty Reduction. Natural gas wells drilled on land acquired after June 1, 1998 and are completed within five years of rights issue benefit from a reduced royalty for the life of the well. The minimum rate is 9%.
1 February 2016
Canadian SMID E&P 16
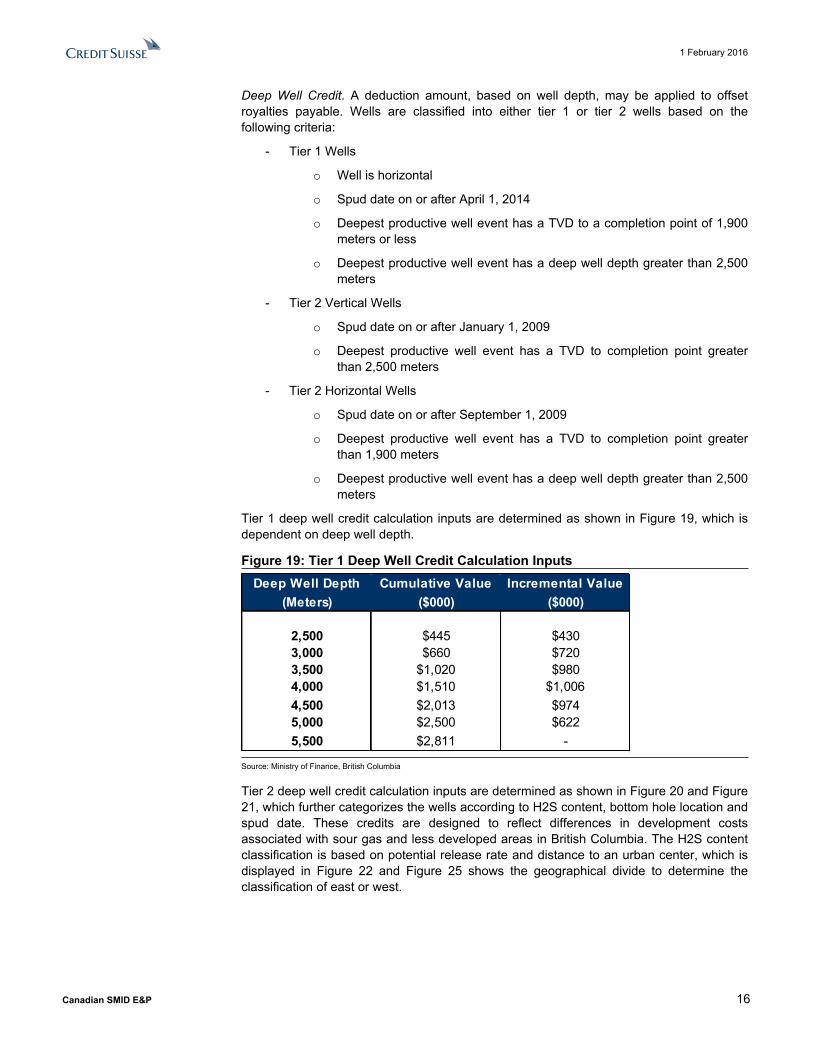
Deep Well Credit. A deduction amount, based on well depth, may be applied to offset royalties payable. Wells are classified into either tier 1 or tier 2 wells based on the following criteria:
- Tier 1 Wells
o Well is horizontal
o Spud date on or after April 1, 2014
o Deepest productive well event has a TVD to a completion point of 1,900 meters or less
o Deepest productive well event has a deep well depth greater than 2,500 meters
- Tier 2 Vertical Wells
o Spud date on or after January 1, 2009
o Deepest productive well event has a TVD to completion point greater than 2,500 meters
- Tier 2 Horizontal Wells
o Spud date on or after September 1, 2009
o Deepest productive well event has a TVD to completion point greater than 1,900 meters
o Deepest productive well event has a deep well depth greater than 2,500 meters
Tier 1 deep well credit calculation inputs are determined as shown in Figure 19, which is dependent on deep well depth.
Figure 19: Tier 1 Deep Well Credit Calculation InputsDeep Well Depth Cumulative Value Incremental Value
(Meters) ($000) ($000)
2,500 $445 $4303,000 $660 $7203,500 $1,020 $9804,000 $1,510 $1,0064,500 $2,013 $9745,000 $2,500 $6225,500 $2,811 -
Source: Ministry of Finance, British Columbia
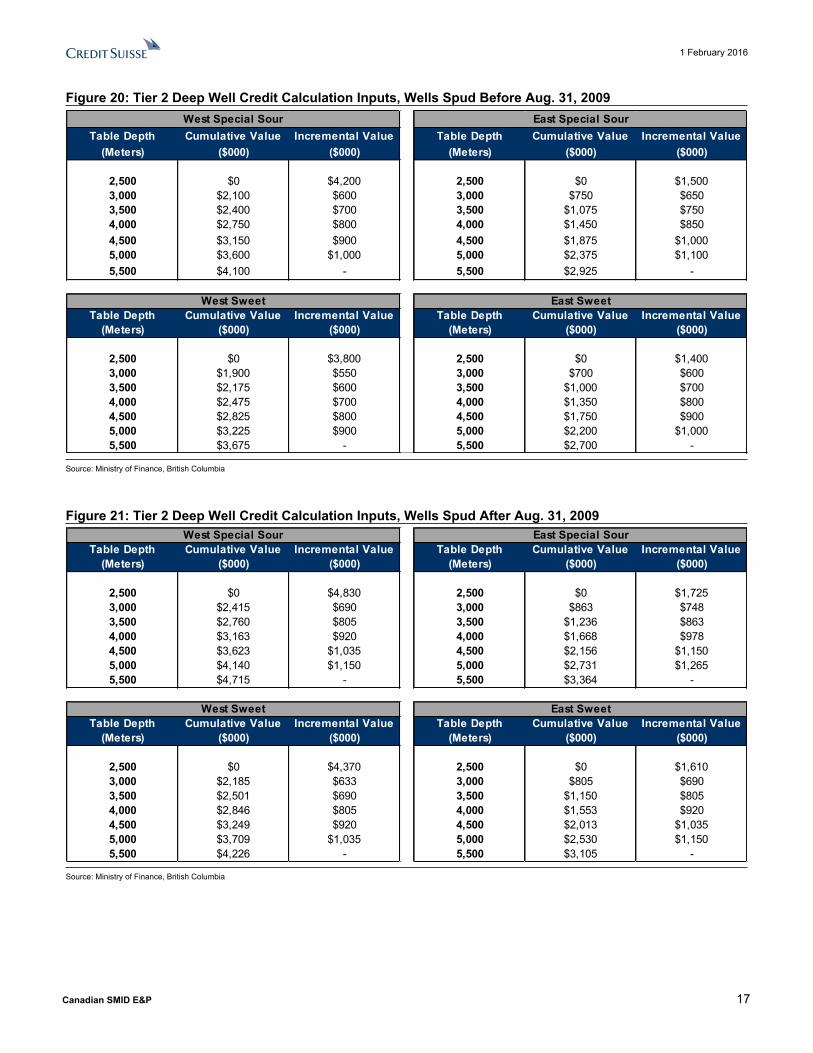
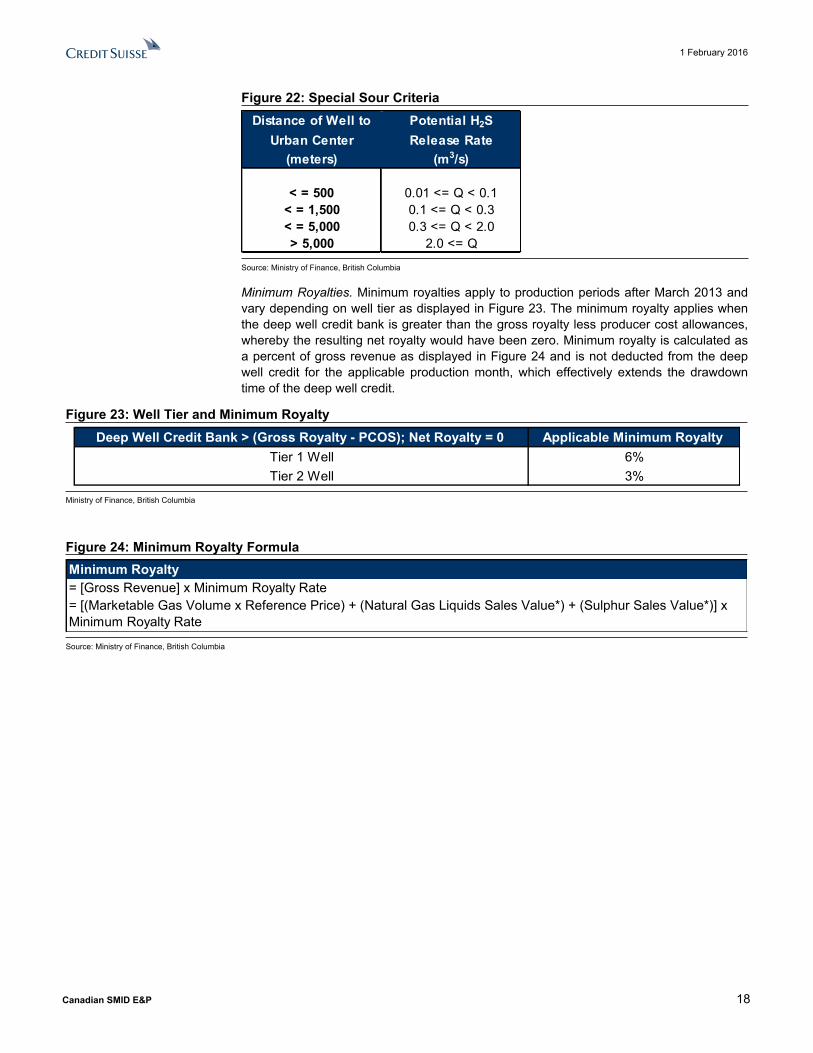
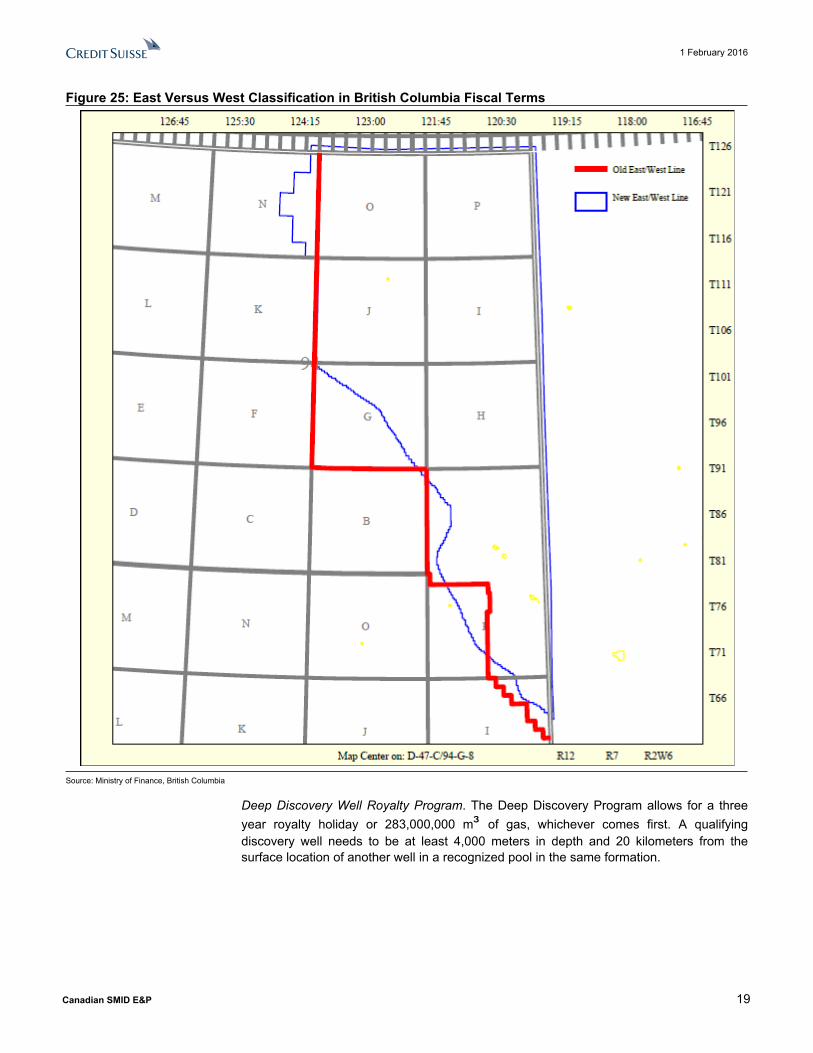
Tier 2 deep well credit calculation inputs are determined as shown in Figure 20 and Figure 21, which further categorizes the wells according to H2S content, bottom hole location and spud date. These credits are designed to reflect differences in development costs associated with sour gas and less developed areas in British Columbia. The H2S content classification is based on potential release rate and distance to an urban center, which is displayed in Figure 22 and Figure 25 shows the geographical divide to determine the classification of east or west.
1 February 2016
Canadian SMID E&P 17
Figure 20: Tier 2 Deep Well Credit Calculation Inputs, Wells Spud Before Aug. 31, 2009West Special Sour East Special Sour
Table Depth Cumulative Value Incremental Value Table Depth Cumulative Value Incremental Value(Meters) ($000) ($000) (Meters) ($000) ($000)
2,500 $0 $4,200 2,500 $0 $1,5003,000 $2,100 $600 3,000 $750 $6503,500 $2,400 $700 3,500 $1,075 $7504,000 $2,750 $800 4,000 $1,450 $8504,500 $3,150 $900 4,500 $1,875 $1,0005,000 $3,600 $1,000 5,000 $2,375 $1,1005,500 $4,100 - 5,500 $2,925 -
West Sweet East SweetTable Depth Cumulative Value Incremental Value Table Depth Cumulative Value Incremental Value
(Meters) ($000) ($000) (Meters) ($000) ($000)
2,500 $0 $3,800 2,500 $0 $1,4003,000 $1,900 $550 3,000 $700 $6003,500 $2,175 $600 3,500 $1,000 $7004,000 $2,475 $700 4,000 $1,350 $8004,500 $2,825 $800 4,500 $1,750 $9005,000 $3,225 $900 5,000 $2,200 $1,0005,500 $3,675 - 5,500 $2,700 -
Source: Ministry of Finance, British Columbia
Figure 21: Tier 2 Deep Well Credit Calculation Inputs, Wells Spud After Aug. 31, 2009West Special Sour East Special Sour
Table Depth Cumulative Value Incremental Value Table Depth Cumulative Value Incremental Value(Meters) ($000) ($000) (Meters) ($000) ($000)
2,500 $0 $4,830 2,500 $0 $1,7253,000 $2,415 $690 3,000 $863 $7483,500 $2,760 $805 3,500 $1,236 $8634,000 $3,163 $920 4,000 $1,668 $9784,500 $3,623 $1,035 4,500 $2,156 $1,1505,000 $4,140 $1,150 5,000 $2,731 $1,2655,500 $4,715 - 5,500 $3,364 -
West Sweet East SweetTable Depth Cumulative Value Incremental Value Table Depth Cumulative Value Incremental Value
(Meters) ($000) ($000) (Meters) ($000) ($000)
2,500 $0 $4,370 2,500 $0 $1,6103,000 $2,185 $633 3,000 $805 $6903,500 $2,501 $690 3,500 $1,150 $8054,000 $2,846 $805 4,000 $1,553 $9204,500 $3,249 $920 4,500 $2,013 $1,0355,000 $3,709 $1,035 5,000 $2,530 $1,1505,500 $4,226 - 5,500 $3,105 -
Source: Ministry of Finance, British Columbia
1 February 2016
Canadian SMID E&P 18
Figure 22: Special Sour CriteriaDistance of Well to Potential H2S
Urban Center Release Rate(meters) (m3/s)
< = 500 0.01 <= Q < 0.1< = 1,500 0.1 <= Q < 0.3< = 5,000 0.3 <= Q < 2.0> 5,000 2.0 <= Q
Source: Ministry of Finance, British Columbia
Minimum Royalties. Minimum royalties apply to production periods after March 2013 and vary depending on well tier as displayed in Figure 23. The minimum royalty applies when the deep well credit bank is greater than the gross royalty less producer cost allowances, whereby the resulting net royalty would have been zero. Minimum royalty is calculated as a percent of gross revenue as displayed in Figure 24 and is not deducted from the deep well credit for the applicable production month, which effectively extends the drawdown time of the deep well credit.
Figure 23: Well Tier and Minimum RoyaltyDeep Well Credit Bank > (Gross Royalty - PCOS); Net Royalty = 0 Applicable Minimum Royalty
Tier 1 Well 6%Tier 2 Well 3%
Ministry of Finance, British Columbia
Figure 24: Minimum Royalty FormulaMinimum Royalty= [Gross Revenue] x Minimum Royalty Rate= [(Marketable Gas Volume x Reference Price) + (Natural Gas Liquids Sales Value*) + (Sulphur Sales Value*)] x Minimum Royalty Rate
Source: Ministry of Finance, British Columbia
1 February 2016
Canadian SMID E&P 19
Figure 25: East Versus West Classification in British Columbia Fiscal Terms
Source: Ministry of Finance, British Columbia
Deep Discovery Well Royalty Program. The Deep Discovery Program allows for a three year royalty holiday or 283,000,000 m³ of gas, whichever comes first. A qualifying discovery well needs to be at least 4,000 meters in depth and 20 kilometers from the surface location of another well in a recognized pool in the same formation.

1 February 2016
Canadian SMID E&P 20
British Columbia – Oil Royalties
For the purposes of calculating oil royalties in British Columbia, oil is classified into the categories of:
- Old Oil
- New Oil -
- Third Tier Oil
- Heavy Oil
Figure 26 summarizes the royalty calculation for each oil category while Figure 27 provides greater detail on the input parameters. These parameters include:
- Q, production in m³ per month
- C, production threshold in m³ per month
- WP, wellhead price in m³ per month
- TP, threshold price in $ per m³Figure 26: British Columbia Oil Royalty Calculation
Royalty ConditionOld Oil and New Oil (Q / K) x 100 Q >= C
[(A + B x (Q - C)) / Q] Q > CThird Tier Oil P x (Q / K) x 100 Q <= C
P x [(A + B x (Q - C)) / Q] x 100 Q > CHeavy Oil nil Q < 20
P x [(Q - 20)2 / (A x Q)] x 100 20 < Q <= 200P x [(B x (Q - 200) + K) / Q] x 100 Q > 200
Source: Ministry of Finance, British Columbia
Figure 27: British Columbia Oil Royalty InputsDate K A B C P TP WP
Old Oil Pre-Nov. 1975 792 11.4 40% 95New Oil Post-Oct. 1975 1,058 23.9 30% 159Third Tier Oil Post-Dec. 1999 2,645 9.56 12% 159 Lesser of [1 + 3.5 x (WP - TP)]/WP or 2 125 Greater of TP or avg. at wellheadHeavy Oil Not Date Sensitive 14 24 11% - [1 + 2.5 x (WP - TP)] / WP 110 Greater of TP or avg. at wellhead
Company data
Discovery Oil Royalty Holiday. Oil produced from a new pool discovery well benefits from a royalty holiday over 36 months.

1 February 2016
Canadian SMID E&P 21
Companies Mentioned (Price as of 31-Jan-2016)ARC Resources Ltd. (ARX.TO, C$18.83)Advantage Oil & Gas (AAV.TO, C$7.65)Bellatrix Exploration Ltd (BXE.TO, C$1.72)Birchcliff Energy (BIR.TO, C$5.03)Bonavista Energy Corporation (BNP.TO, C$1.92)Crew Energy Inc (CR.TO, C$3.86)Kelt Exploration Ltd (KEL.TO, C$3.88)NuVista Energy (NVA.TO, C$4.5)Painted Pony Petroleum Ltd (PPY.TO, C$4.2)Paramount Resources Ltd (POU.TO, C$4.6)Peyto Exploration & Development Corp. (PEY.TO, C$30.13)Seven Generations Energy Ltd. (VII.TO, C$15.76)Tourmaline Oil Corp (TOU.TO, C$27.93)Trilogy Energy Corp (TET.TO, C$3.54)
Disclosure AppendixImportant Global Disclosures I, David Phung, certify that (1) the views expressed in this report accurately reflect my personal views about all of the subject companies and securities and (2) no part of my compensation was, is or will be directly or indirectly related to the specific recommendations or views expressed in this report.The analyst(s) responsible for preparing this research report received Compensation that is based upon various factors including Credit Suisse's total revenues, a portion of which are generated by Credit Suisse's investment banking activitiesAs of December 10, 2012 Analysts’ stock rating are defined as follows:Outperform (O) : The stock’s total return is expected to outperform the relevant benchmark* over the next 12 months.Neutral (N) : The stock’s total return is expected to be in line with the relevant benchmark* over the next 12 months.Underperform (U) : The stock’s total return is expected to underperform the relevant benchmark* over the next 12 months. *Relevant benchmark by region: As of 10th December 2012, Japanese ratings are based on a stock’s total return relative to the analyst's coverage universe which consists of all companies covered by the analyst within the relevant sector, with Outperforms representing the most attractive, Neutrals the less attractive, and Underperforms the least attractive investment opportunities. As of 2nd October 2012, U.S. and Canadian as well as European ratings are based on a stock’s total return relative to the analyst's coverage universe which consists of all companies covered by the analyst within the relevant sector, with Outperforms representing the most attractive, Neutrals the less attractive, and Underperforms the least attractive investment opportunities. For Latin American and non-Japan Asia stocks, ratings are based on a stock’s total return relative to the average total return of the relevant country or regional benchmark; prior to 2nd October 2012 U.S. and Canadian ratings were based on (1) a stock’s absolute total return potential to its current share price and (2) the relative attractiveness of a stock’s total return potential within an analyst’s coverage universe. For Australian and New Zealand stocks, the expected total return (ETR) calculation includes 12-month rolling dividend yield. An Outperform rating is assigned where an ETR is greater than or equal to 7.5%; Underperform where an ETR less than or equal to 5%. A Neutral may be assigned where the ETR is between -5% and 15%. The overlapping rating range allows analysts to assign a rating that puts ETR in the context of associated risks. Prior to 18 May 2015, ETR ranges for Outperform and Underperform ratings did not overlap with Neutral thresholds between 15% and 7.5%, which was in operation from 7 July 2011.Restricted (R) : In certain circumstances, Credit Suisse policy and/or applicable law and regulations preclude certain types of communications, including an investment recommendation, during the course of Credit Suisse's engagement in an investment banking transaction and in certain other circumstances.Volatility Indicator [V] : A stock is defined as volatile if the stock price has moved up or down by 20% or more in a month in at least 8 of the past 24 months or the analyst expects significant volatility going forward.Analysts’ sector weightings are distinct from analysts’ stock ratings and are based on the analyst’s expectations for the fundamentals and/or valuation of the sector* relative to the group’s historic fundamentals and/or valuation:Overweight : The analyst’s expectation for the sector’s fundamentals and/or valuation is favorable over the next 12 months.Market Weight : The analyst’s expectation for the sector’s fundamentals and/or valuation is neutral over the next 12 months.Underweight : The analyst’s expectation for the sector’s fundamentals and/or valuation is cautious over the next 12 months. *An analyst’s coverage sector consists of all companies covered by the analyst within the relevant sector. An analyst may cover multiple sectors.
Credit Suisse's distribution of stock ratings (and banking clients) is:
Global Ratings DistributionRating Versus universe (%) Of which banking clients (%)Outperform/Buy* 56% (36% banking clients)Neutral/Hold* 31% (29% banking clients)Underperform/Sell* 12% (42% banking clients)Restricted 1%*For purposes of the NYSE and NASD ratings distribution disclosure requirements, our stock ratings of Outperform, Neutral, and Underperform most closely correspond to Buy, Hold, and Sell, respectively; however, the meanings are not the same, as our stock ratings are determined on a relative basis. (Please refer to definitions above.) An investor's decision to buy or sell a security should be based on investment objectives, current holdings, and other individual factors.
Credit Suisse’s policy is to update research reports as it deems appropriate, based on developments with the subject company, the sector or the market that may have a material impact on the research views or opinions stated herein. Credit Suisse's policy is only to publish investment research that is impartial, independent, clear, fair and not misleading. For more detail please refer to Credit Suisse's Policies for Managing Conflicts of Interest in connection with Investment Research: http://www.csfb.com/research-and-analytics/disclaimer/managing_conflicts_disclaimer.htmlCredit Suisse does not provide any tax advice. Any statement herein regarding any US federal tax is not intended or written to be used, and cannot be used, by any taxpayer for the purposes of avoiding any penalties.
1 February 2016
Canadian SMID E&P 22
See the Companies Mentioned section for full company names The subject company (BNP.TO, CR.TO, TET.TO, BXE.TO, POU.TO, KEL.TO, NVA.TO, VII.TO) currently is, or was during the 12-month period preceding the date of distribution of this report, a client of Credit Suisse.Credit Suisse provided investment banking services to the subject company (KEL.TO, VII.TO) within the past 12 months.Credit Suisse provided non-investment banking services to the subject company (VII.TO) within the past 12 monthsCredit Suisse has managed or co-managed a public offering of securities for the subject company (KEL.TO, VII.TO) within the past 12 months.Credit Suisse has received investment banking related compensation from the subject company (KEL.TO, VII.TO) within the past 12 monthsCredit Suisse expects to receive or intends to seek investment banking related compensation from the subject company (BNP.TO, BIR.TO, AAV.TO, CR.TO, PEY.TO, PPY.TO, TET.TO, BXE.TO, POU.TO, KEL.TO, NVA.TO, VII.TO) within the next 3 months.Credit Suisse has received compensation for products and services other than investment banking services from the subject company (VII.TO) within the past 12 monthsFor other important disclosures concerning companies featured in this report, including price charts, please visit the website at https://rave.credit-suisse.com/disclosures or call +1 (877) 291-2683. Important Regional Disclosures Singapore recipients should contact Credit Suisse AG, Singapore Branch for any matters arising from this research report.The analyst(s) involved in the preparation of this report may participate in events hosted by the subject company, including site visits. Credit Suisse does not accept or permit analysts to accept payment or reimbursement for travel expenses associated with these events.Restrictions on certain Canadian securities are indicated by the following abbreviations: NVS--Non-Voting shares; RVS--Restricted Voting Shares; SVS--Subordinate Voting Shares.Individuals receiving this report from a Canadian investment dealer that is not affiliated with Credit Suisse should be advised that this report may not contain regulatory disclosures the non-affiliated Canadian investment dealer would be required to make if this were its own report.For Credit Suisse Securities (Canada), Inc.'s policies and procedures regarding the dissemination of equity research, please visit https://www.credit-suisse.com/sites/disclaimers-ib/en/canada-research-policy.html.Credit Suisse has acted as lead manager or syndicate member in a public offering of securities for the subject company (KEL.TO, VII.TO) within the past 3 years.As of the date of this report, Credit Suisse acts as a market maker or liquidity provider in the equities securities that are the subject of this report.Principal is not guaranteed in the case of equities because equity prices are variable.Commission is the commission rate or the amount agreed with a customer when setting up an account or at any time after that.To the extent this is a report authored in whole or in part by a non-U.S. analyst and is made available in the U.S., the following are important disclosures regarding any non-U.S. analyst contributors: The non-U.S. research analysts listed below (if any) are not registered/qualified as research analysts with FINRA. The non-U.S. research analysts listed below may not be associated persons of CSSU and therefore may not be subject to the NASD Rule 2711 and NYSE Rule 472 restrictions on communications with a subject company, public appearances and trading securities held by a research analyst account.Credit Suisse Securities (Canada), Inc. ...................................................................................................................David Phung ; Robert LoebachFor Credit Suisse disclosure information on other companies mentioned in this report, please visit the website at https://rave.credit-suisse.com/disclosures or call +1 (877) 291-2683.

1 February 2016
Canadian SMID E&P 23
References in this report to Credit Suisse include all of the subsidiaries and affiliates of Credit Suisse operating under its investment banking division. For more information on our structure, please use the following link: https://www.credit-suisse.com/who-we-are This report may contain material that is not directed to, or intended for distribution to or use by, any person or entity who is a citizen or resident of or located in any locality, state, country or other jurisdiction where such distribution, publication, availability or use would be contrary to law or regulation or which would subject Credit Suisse AG or its affiliates ("CS") to any registration or licensing requirement within such jurisdiction. All material presented in this report, unless specifically indicated otherwise, is under copyright to CS. None of the material, nor its content, nor any copy of it, may be altered in any way, transmitted to, copied or distributed to any other party, without the prior express written permission of CS. All trademarks, service marks and logos used in this report are trademarks or service marks or registered trademarks or service marks of CS or its affiliates. The information, tools and material presented in this report are provided to you for information purposes only and are not to be used or considered as an offer or the solicitation of an offer to sell or to buy or subscribe for securities or other financial instruments. CS may not have taken any steps to ensure that the securities referred to in this report are suitable for any particular investor. CS will not treat recipients of this report as its customers by virtue of their receiving this report. The investments and services contained or referred to in this report may not be suitable for you and it is recommended that you consult an independent investment advisor if you are in doubt about such investments or investment services. Nothing in this report constitutes investment, legal, accounting or tax advice, or a representation that any investment or strategy is suitable or appropriate to your individual circumstances, or otherwise constitutes a personal recommendation to you. CS does not advise on the tax consequences of investments and you are advised to contact an independent tax adviser. Please note in particular that the bases and levels of taxation may change. Information and opinions presented in this report have been obtained or derived from sources believed by CS to be reliable, but CS makes no representation as to their accuracy or completeness. CS accepts no liability for loss arising from the use of the material presented in this report, except that this exclusion of liability does not apply to the extent that such liability arises under specific statutes or regulations applicable to CS. This report is not to be relied upon in substitution for the exercise of independent judgment. CS may have issued, and may in the future issue, other communications that are inconsistent with, and reach different conclusions from, the information presented in this report. Those communications reflect the different assumptions, views and analytical methods of the analysts who prepared them and CS is under no obligation to ensure that such other communications are brought to the attention of any recipient of this report. Some investments referred to in this report will be offered solely by a single entity and in the case of some investments solely by CS, or an associate of CS or CS may be the only market maker in such investments. Past performance should not be taken as an indication or guarantee of future performance, and no representation or warranty, express or implied, is made regarding future performance. Information, opinions and estimates contained in this report reflect a judgment at its original date of publication by CS and are subject to change without notice. The price, value of and income from any of the securities or financial instruments mentioned in this report can fall as well as rise. The value of securities and financial instruments is subject to exchange rate fluctuation that may have a positive or adverse effect on the price or income of such securities or financial instruments. Investors in securities such as ADR's, the values of which are influenced by currency volatility, effectively assume this risk. Structured securities are complex instruments, typically involve a high degree of risk and are intended for sale only to sophisticated investors who are capable of understanding and assuming the risks involved. The market value of any structured security may be affected by changes in economic, financial and political factors (including, but not limited to, spot and forward interest and exchange rates), time to maturity, market conditions and volatility, and the credit quality of any issuer or reference issuer. Any investor interested in purchasing a structured product should conduct their own investigation and analysis of the product and consult with their own professional advisers as to the risks involved in making such a purchase. Some investments discussed in this report may have a high level of volatility. High volatility investments may experience sudden and large falls in their value causing losses when that investment is realised. Those losses may equal your original investment. Indeed, in the case of some investments the potential losses may exceed the amount of initial investment and, in such circumstances, you may be required to pay more money to support those losses. Income yields from investments may fluctuate and, in consequence, initial capital paid to make the investment may be used as part of that income yield. Some investments may not be readily realisable and it may be difficult to sell or realise those investments, similarly it may prove difficult for you to obtain reliable information about the value, or risks, to which such an investment is exposed. This report may provide the addresses of, or contain hyperlinks to, websites. Except to the extent to which the report refers to website material of CS, CS has not reviewed any such site and takes no responsibility for the content contained therein. Such address or hyperlink (including addresses or hyperlinks to CS's own website material) is provided solely for your convenience and information and the content of any such website does not in any way form part of this document. Accessing such website or following such link through this report or CS's website shall be at your own risk. This report is issued and distributed in Europe (except Switzerland) by Credit Suisse Securities (Europe) Limited, One Cabot Square, London E14 4QJ, England, which is authorised by the Prudential Regulation Authority and regulated by the Financial Conduct Authority and the Prudential Regulation Authority. This report is issued and distributed in Europe (except Switzerland) by Credit Suisse International, One Cabot Square, London E14 4QJ, England, which is authorised by the Prudential Regulation Authority and regulated by the Financial Conduct Authority and the Prudential Regulation Authority. This report is being distributed in Germany by Credit Suisse Securities (Europe) Limited Niederlassung Frankfurt am Main regulated by the Bundesanstalt fuer Finanzdienstleistungsaufsicht ("BaFin"). This report is being distributed in the United States and Canada by Credit Suisse Securities (USA) LLC; in Switzerland by Credit Suisse AG; in Brazil by Banco de Investimentos Credit Suisse (Brasil) S.A or its affiliates; in Mexico by Banco Credit Suisse (México), S.A. (transactions related to the securities mentioned in this report will only be effected in compliance with applicable regulation); in Japan by Credit Suisse Securities (Japan) Limited, Financial Instruments Firm, Director-General of Kanto Local Finance Bureau (Kinsho) No. 66, a member of Japan Securities Dealers Association, The Financial Futures Association of Japan, Japan Investment Advisers Association, Type II Financial Instruments Firms Association; elsewhere in Asia/ Pacific by whichever of the following is the appropriately authorised entity in the relevant jurisdiction: Credit Suisse (Hong Kong) Limited, Credit Suisse Equities (Australia) Limited, Credit Suisse Securities (Thailand) Limited, regulated by the Office of the Securities and Exchange Commission, Thailand, having registered address at 990 Abdulrahim Place, 27th Floor, Unit 2701, Rama IV Road, Silom, Bangrak, Bangkok 10500, Thailand, Tel. +66 2614 6000, Credit Suisse Securities (Malaysia) Sdn Bhd, Credit Suisse AG, Singapore Branch, Credit Suisse Securities (India) Private Limited (CIN no. U67120MH1996PTC104392) regulated by the Securities and Exchange Board of India as Research Analyst (registration no. INH 000001030) and as Stock Broker (registration no. INB230970637; INF230970637; INB010970631; INF010970631), having registered address at 9th Floor, Ceejay House, Dr.A.B. Road, Worli, Mumbai - 18, India, T- +91-22 6777 3777, Credit Suisse Securities (Europe) Limited, Seoul Branch, Credit Suisse AG, Taipei Securities Branch, PT Credit Suisse Securities Indonesia, Credit Suisse Securities (Philippines ) Inc., and elsewhere in the world by the relevant authorised affiliate of the above. Research on Taiwanese securities produced by Credit Suisse AG, Taipei Securities Branch has been prepared by a registered Senior Business Person. Research provided to residents of Malaysia is authorised by the Head of Research for Credit Suisse Securities (Malaysia) Sdn Bhd, to whom they should direct any queries on +603 2723 2020. This report has been prepared and issued for distribution in Singapore to institutional investors, accredited investors and expert investors (each as defined under the Financial Advisers Regulations) only, and is also distributed by Credit Suisse AG, Singapore branch to overseas investors (as defined under the Financial Advisers Regulations). By virtue of your status as an institutional investor, accredited investor, expert investor or overseas investor, Credit Suisse AG, Singapore branch is exempted from complying with certain compliance requirements under the Financial Advisers Act, Chapter 110 of Singapore (the "FAA"), the Financial Advisers Regulations and the relevant Notices and Guidelines issued thereunder, in respect of any financial advisory service which Credit Suisse AG, Singapore branch may provide to you. This information is being distributed by Credit Suisse AG (DIFC Branch), duly licensed and regulated by the Dubai Financial Services Authority (“DFSA”). Related financial services or products are only made available to Professional Clients or Market Counterparties, as defined by the DFSA, and are not intended for any other persons. Credit Suisse AG (DIFC Branch) is located on Level 9 East, The Gate Building, DIFC, Dubai, United Arab Emirates. This research may not conform to Canadian disclosure requirements. In jurisdictions where CS is not already registered or licensed to trade in securities, transactions will only be effected in accordance with applicable securities legislation, which will vary from jurisdiction to jurisdiction and may require that the trade be made in accordance with applicable exemptions from registration or licensing requirements. Non-U.S. customers wishing to effect a transaction should contact a CS entity in their local jurisdiction unless governing law permits otherwise. U.S. customers wishing to effect a transaction should do so only by contacting a representative at Credit Suisse Securities (USA) LLC in the U.S. Please note that this research was originally prepared and issued by CS for distribution to their market professional and institutional investor customers. Recipients who are not market professional or institutional investor customers of CS should seek the advice of their independent financial advisor prior to taking any investment decision based on this report or for any necessary explanation of its contents. This research may relate to investments or services of a person outside of the UK or to other matters which are not authorised by the Prudential Regulation Authority and regulated by the Financial Conduct Authority and the Prudential Regulation Authority or in respect of which the protections of the Prudential Regulation Authority and Financial Conduct Authority for private customers and/or the UK compensation scheme may not be available, and further details as to where this may be the case are available upon request in respect of this report. CS may provide various services to US municipal entities or obligated persons ("municipalities"), including suggesting individual transactions or trades and entering into such transactions. Any services CS provides to municipalities are not viewed as "advice" within the meaning of Section 975 of the Dodd-Frank Wall Street Reform and Consumer Protection Act. CS is providing any such services and related information solely on an arm's length basis and not as an advisor or fiduciary to the municipality. In connection with the provision of the any such services, there is no agreement, direct or indirect, between any municipality (including the officials, management, employees or agents thereof) and CS for CS to provide advice to the municipality. Municipalities should consult with their financial, accounting and legal advisors regarding any such services provided by CS. In addition, CS is not acting for direct or indirect compensation to solicit the municipality on behalf of an unaffiliated broker, dealer, municipal securities dealer, municipal advisor, or investment adviser for the purpose of obtaining or retaining an engagement by the municipality for or in connection with Municipal Financial Products, the issuance of municipal securities, or of an investment adviser to provide investment advisory services to or on behalf of the municipality. If this report is being distributed by a financial institution other than Credit Suisse AG, or its affiliates, that financial institution is solely responsible for distribution. Clients of that institution should contact that institution to effect a transaction in the securities mentioned in this report or require further information. This report does not constitute investment advice by Credit Suisse to the clients of the distributing financial institution, and neither Credit Suisse AG, its affiliates, and their respective officers, directors and employees accept any liability whatsoever for any direct or consequential loss arising from their use of this report or its content. Principal is not guaranteed. Commission is the commission rate or the amount agreed with a customer when setting up an account or at any time after that.Copyright © 2016 CREDIT SUISSE AG and/or its affiliates. All rights reserved. Investment principal on bonds can be eroded depending on sale price or market price. In addition, there are bonds on which investment principal can be eroded due to changes in redemption amounts. Care is required when investing in such instruments. When you purchase non-listed Japanese fixed income securities (Japanese government bonds, Japanese municipal bonds, Japanese government guaranteed bonds, Japanese corporate bonds) from CS as a seller, you will be requested to pay the purchase price only.