1 getting powerpoint right. 2 the views normal slide sorter slide show
TRANSCRIPT

1
Getting PowerPoint Right
Getting PowerPoint Right

2
The ViewsThe Views
• Normal
• Slide Sorter
• Slide Show
3
Toolbars & Commands You Need:Toolbars & Commands You Need:
• Picture Toolbar
• Group/Ungroup/Regroup
• Order
• Duplicate
• Shadows
• Arial Font

4
Reasons to hate PowerPointReasons to hate PowerPoint
1. The corny clip art that never quite says what you want 2. The same tasteless design templates that everyone
else uses 3. The predictable slide layouts 4. The endless sequences of bullet points 5. The distracting animations and transitions 6. The confusing charts full of chart junk 7. The patronizing visualization of simple concepts 8. The logos, headers and footers on every slide 9. The monotonous uniformity 10. The excessive use of text

5
Do you need a slide show?Do you need a slide show?
• If you don’t need visual aids to make your point, don’t bother.
• Use visual aids where they enhance your presentation.
• Use PowerPoint for your audience’s benefit, not yours.

6
Why do you need a slide show?Why do you need a slide show?
• To inform.
• To teach.
• To sell.
• To entertain.

7
NothingNothingWhen interacting with the audience.When visuals would not aid understanding.

8
TextTextWhen quoting someone.When making a precise statement.When making a reference that the audience might like to note down.
9
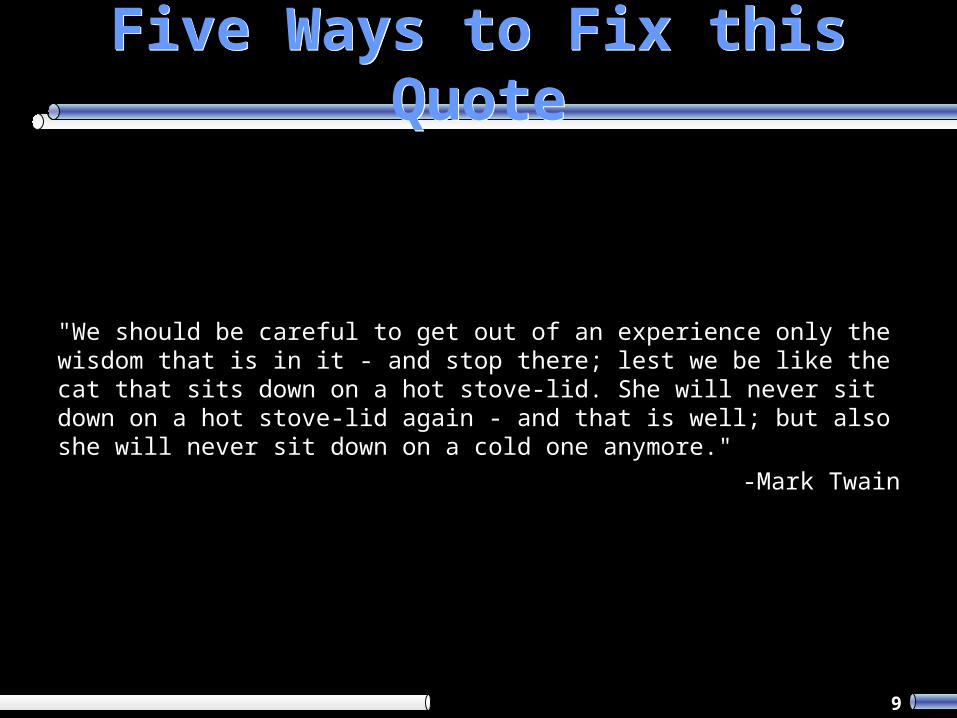
Five Ways to Fix this QuoteFive Ways to Fix this Quote
"We should be careful to get out of an experience only the wisdom that is in it - and stop there; lest we be like the cat that sits down on a hot stove-lid. She will never sit down on a hot stove-lid again - and that is well; but also she will never sit down on a cold one anymore."
-Mark Twain

10
BulletsBulletsWhen stepping through a number of related points (as bullets).When stepping through a sequence (as a numbered list).

11

12
TableTableWhen presenting two-dimensional data.When summarizing a procedure.

13

14
ChartChartTo explain relationships between numbers (comparisons, trends, etc.).

15
16
DiagramDiagramTo depict layouts and structures.To depict the relationship between concepts.

17
Reproduce this Drawing (Hard Way)Reproduce this Drawing (Hard Way)
The Eclipse of Mars

18
Reproduce this Drawing (Easy Way)Reproduce this Drawing (Easy Way)

19
PicturePictureAs a simple representation or facsimile (photographs and illustrations).

20
Ten Ways to Change this Picture:Ten Ways to Change this Picture:

21
Advanced Picture StuffAdvanced Picture Stuff

22
AnimationAnimationWhen depicting abstract relationships over time (processes, how things work, etc.).To attract attention or entertain.To simulate reality (as with 3D graphics).

23
AnimationsAnimations
1.Text- Wipe from Left
2.Cylinder- Stretch from Bottom
3.Heart- Zoom in
4.Head- Bounce

24
Advanced Animation StuffAdvanced Animation Stuff

25
AudioAudioTo add music or sound effects.When presenting to users what someone or something sounds like.

26
A Cinderella StoryA Cinderella Story

27
VideoVideoWhen presenting real-life events.

28