1 hbd run7 report t.k. hemmick for the hbd crew phenix collaboration meeting, boulder, july 12, 2007
TRANSCRIPT

1
HBD Run7 Report
T.K. Hemmick for the HBD crew
PHENIX Collaboration Meeting, Boulder, July 12, 2007

2
The 3 main properties of the HBD
1. As expected
2. OK.
3. Encouraging. Needs more work.
2. Electron detection efficiency
1. Electron - hadron separation
3. N0 or single/double electron separation

3
Outline
Detector operation HV problem Electronics Photocathodes Recirculation gas system Gas transmission monitor system
Detector performance Position resolution Gain e-h separation Electron detection efficiency Single vs. double electron separation
New GEM production

4
Operation
5
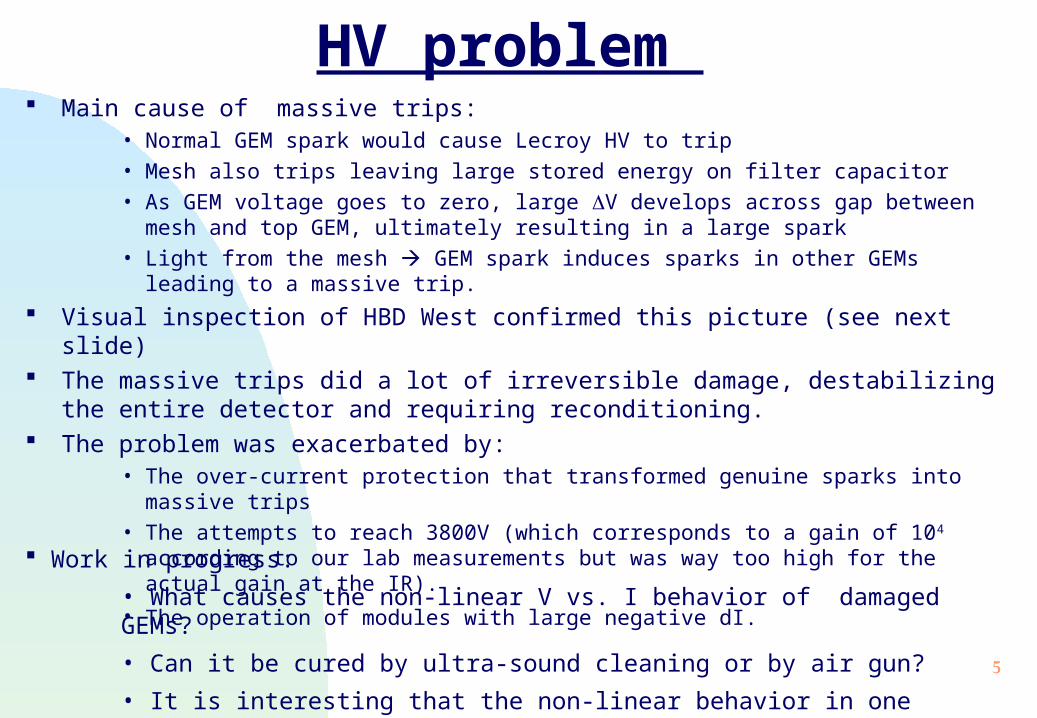
HV problem Main cause of massive trips:
• Normal GEM spark would cause Lecroy HV to trip• Mesh also trips leaving large stored energy on filter capacitor• As GEM voltage goes to zero, large V develops across gap between mesh and top GEM,
ultimately resulting in a large spark• Light from the mesh GEM spark induces sparks in other GEMs leading to a massive trip.
Visual inspection of HBD West confirmed this picture (see next slide) The massive trips did a lot of irreversible damage, destabilizing the entire detector and
requiring reconditioning. The problem was exacerbated by:
• The over-current protection that transformed genuine sparks into massive trips• The attempts to reach 3800V (which corresponds to a gain of 104 according to our lab
measurements but was way too high for the actual gain at the IR).
• The operation of modules with large negative dI.
Work in progress:
• What causes the non-linear V vs. I behavior of damaged GEMs?
• Can it be cured by ultra-sound cleaning or by air gun?
• It is interesting that the non-linear behavior in one GEM disappeared when dismounting it from the vessel for inspection.

6
Visual Inspection
“Pock Marks”:• Four patches (one per quadrant).• These match locations of GEM-mesh sparks.• These DO draw the non-linear currents.

7
MeshGEM sparks solutions Good Solution Better Solution
During the run: Install resistors in the mesh chain to provide a path to ground for the stored charge to go in case of trip.
Other (better?) solutions under consideration:
install Zener diodes to limit the voltage between the mesh and the top GEM to less than 300V.
Use a CAEN PS, as used during the entire R&D period at the WI, that provides a path to ground whenever a trip condition occurs.
8
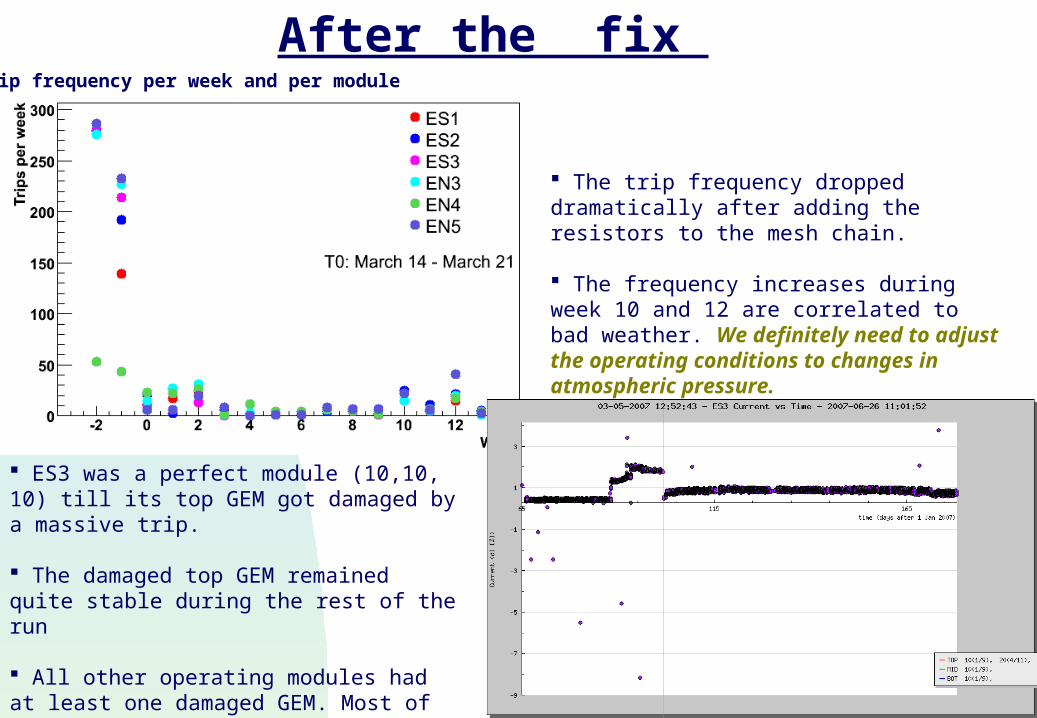
After the fix
The trip frequency dropped dramatically after adding the resistors to the mesh chain.
The frequency increases during week 10 and 12 are correlated to bad weather. We definitely need to adjust the operating conditions to changes in atmospheric pressure.
Trip frequency per week and per module
ES3 was a perfect module (10,10, 10) till its top GEM got damaged by a massive trip.
The damaged top GEM remained quite stable during the rest of the run
All other operating modules had at least one damaged GEM. Most of them remained stable till the end of the run.

9
Readout, noise and event size The entire readout chain worked reliably and
smoothly during the entire duration of the run.
Electronic noise was excellent in all modules. Typically = 1.5 ADC counts corresponding to 0.15 fC or 0.2 p.e. at a gain of 5000.
During the run, 2 modules (WN1 and WS3) developed an anomalous high noise at HV greater than ~3000 V
Simple zero suppression was implemented early in the run:
sample(8) – sample(0) > n. However, event size remained large due to
the scintillation light that generates genuine signals.
A new readout scheme was developed and implemented around mid-May that reduced the event size by a factor of 2 without any loss of information.
Normal module
One of the two noisy modules

10
Photocathodes
Relative QE scan of three top GEMs removed from HBD West.
They show full QE on all three modules (like brand new!!) and no evidence of any QE change, in spite of the relatively high levels of water in the detector for several months.
The flash lamp monitoring at the IR showed these three GEMs as having 100%, 25% and 150% of the expected QE, respectively.

11
Recirculation gas system
The recirculation gas system worked very well.
The H2O degassing/diffusion rate was too high. To reduce absorption it was necessary to increase the flow rate through the detector. With small changes it was possible to increase the gas flow by a factor of 2 above the design value.
With a flow of 5 lpm, the absorption is estimated to be 10-15%.
Modifications of the gas system are planned to allow increase of the gas flow by at least another factor of 2 in run8.
For several months we had a large disagreement between the the H2O sensor of the Panametrics monitor (giving readings of about 10 ppm ) and the transmission measurements (corresponding to about 80 ppm of water). Explanation: the Panametrics sensor is damaged by CF4, leading to too low ppm values of water.
A new sensor, installed toward the end of the run, showed also signs of getting damaged (a decrease of the ppm reading not corroborated by the transmission monitor).
Panametrics is studying the case.
A Kahn hygrometer, supposedly more robust with aggressive gases like CF4, has been ordered.

12
Gas transmission monitor system
Typical transmission measurement at a flow of 5 lpm
Gas in W in bypass HBD-E out

13
Gas transmission summary
• With a flow of 5 lpm we still loose some 10-15% of the p.e..
• We plan to further increase the gas flow in run8 to reduce the losses.

14
Detector Performance
(So far looked at “peripheral” events with up to 50 tracks in the central arms)

15
Tracking & position resolution
Run 226502 ES4 at 3600V FB
• Position resolution:
z ≈ ≈ 1 cm
Dictated by pad size: hexagon a = 1.55 cm(2a/√12 = 0.9 cm)
Hadrons selected in central arm:
Vertex +/- 20 cm< 50 tracks3 matching to PC3 and EMCaln0 < 0EMC energy < 0.5
Projected onto HBD:Z in HBD +/- 2 cm in HBD +/- 25 mrad
16
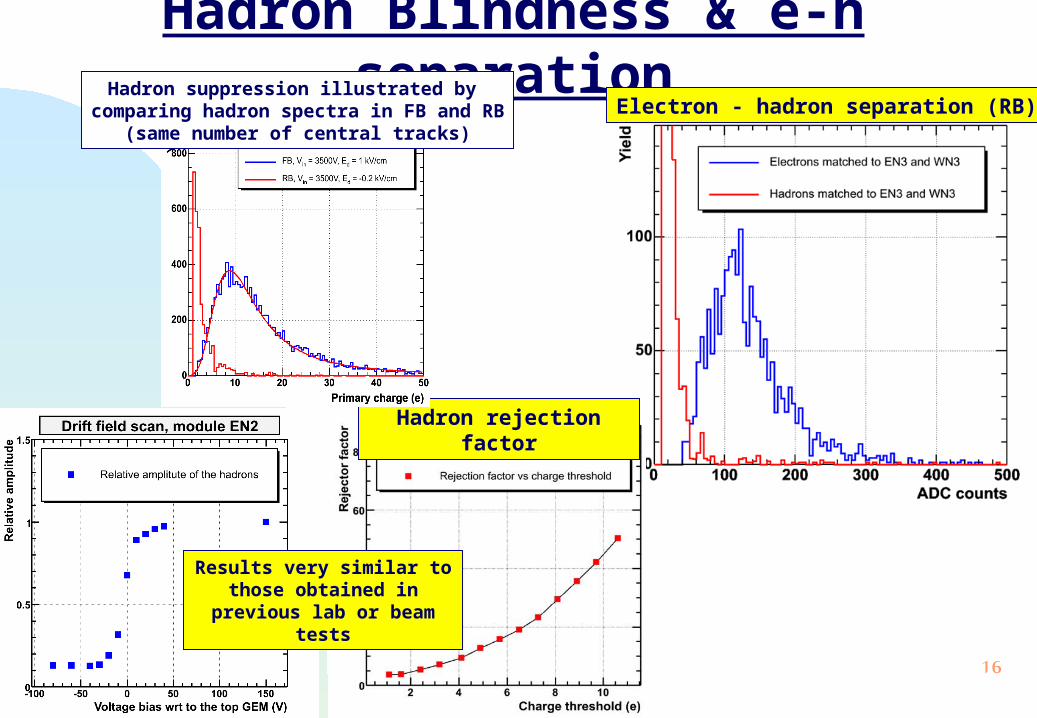
Hadron Blindness & e-h separationElectron - hadron separation (RB)
Hadron rejection factor
Hadron suppression illustrated by comparing hadron spectra in FB and RB
(same number of central tracks)
Results very similar to those obtained in previous lab or
beam tests

17
Electron detection efficiency Identify e in central arm using RICH and EMCal Project central arm track to HBD Relative e-detection efficiency in HBD obtained by varying
the charge threshold of the closest (matched) pad
EN3 G ≈ 3300
(several runs at “nominal” voltage)
All modules <G> ≈ 6600
(Run 237092 “nominal” voltage + 100V)
~4 p.e. ~4 p.e.
Start to loose efficiency at pad threshold larger than about 4p.e. Is it a real efficiency loss or are we loosing efficiency for electrons converted in the gas near the GEMs? Needs further study.
19
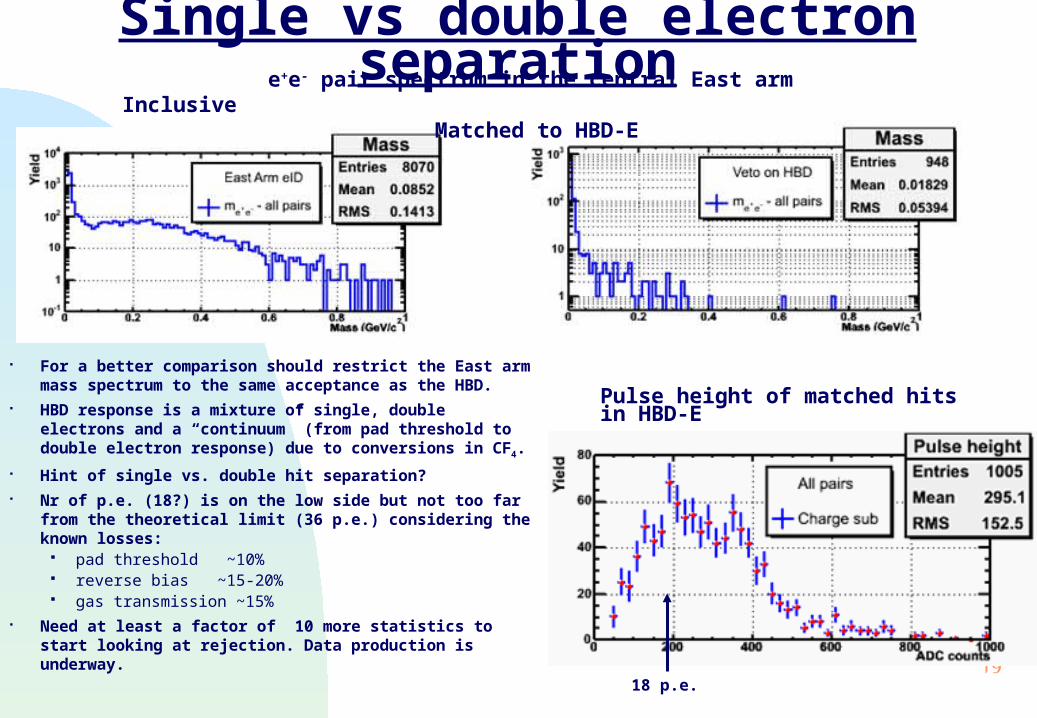
Single vs double electron separation
For a better comparison should restrict the East arm mass spectrum to the same acceptance as the HBD.
HBD response is a mixture of single, double electrons and a “continuum” (from pad threshold to double electron response) due to conversions in CF4.
Hint of single vs. double hit separation? Nr of p.e. (18?) is on the low side but not too far from
the theoretical limit (36 p.e.) considering the known losses: pad threshold ~10% reverse bias ~15-20% gas transmission ~15%
Need at least a factor of 10 more statistics to start looking at rejection. Data production is underway.
e+e- pair spectrum in the central East armInclusive Matched to HBD-E
Pulse height of matched hits in HBD-E
18 p.e.

20
Various means…
Expected separation between single and double electron hits for various npe values: includes Poisson statistics with mean = npe
each photo-electron has been smeared with an exponential of mean one.
30 25 20
15 10 5
Npe=

21
Revisiting the single p.e. detection efficiency
Is electron attachment in CF4 affecting the single p.e. detection efficiency?
Width of 55Fe peaks in CF4 (/mean = 15%) are consistent with statistics of 109 e’s convoluted with exponential gain of each e.
0.01
0.1
1
10
100
0.01 0.1 1 10 100
Electron energy e (eV)
(
10-1
6 cm
2 )
Ar - - - - CF4 ——
m
exc
ion
ion
n 4n 3
m
a
n ind
d
Electron scattering cross-sections in Ar and CF4: elastic momentum transfer (σm), vibrational excitation (σν4, σν3, σνind ), electron attachment (σa), dissociation (σd), excitation (σexc), and ionization (σion).
Detection efficiency reaches saturation at VGEM1 > 480V and Etrans > 2.7 kV/cm. The absolute detection efficiency in CH4 was measured to be ~1 at a gain of 20. Do the similar rates measured with CF4 provide a proof of full detection efficiency also in CF4?

22
Gain
23
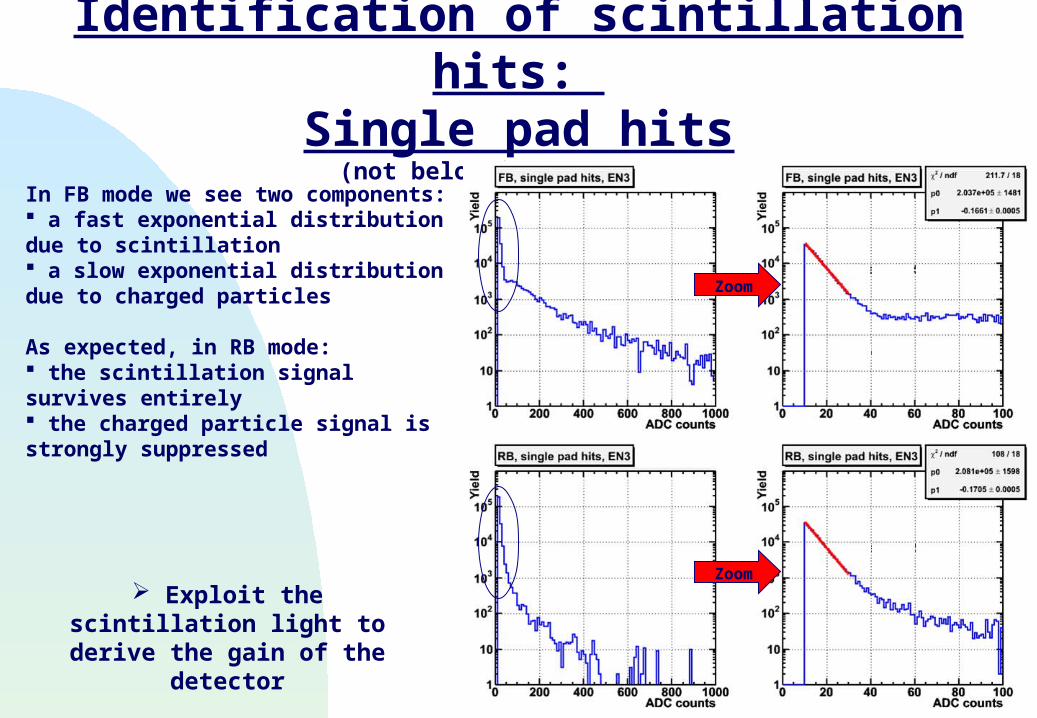
Identification of scintillation hits: Single pad hits
(not belonging to tracks)
Exploit the scintillation light to derive the gain of the detector
In FB mode we see two components: a fast exponential distribution due to scintillation a slow exponential distribution due to charged particles
As expected, in RB mode: the scintillation signal survives entirely the charged particle signal is strongly suppressed
Zoom
Zoom
24
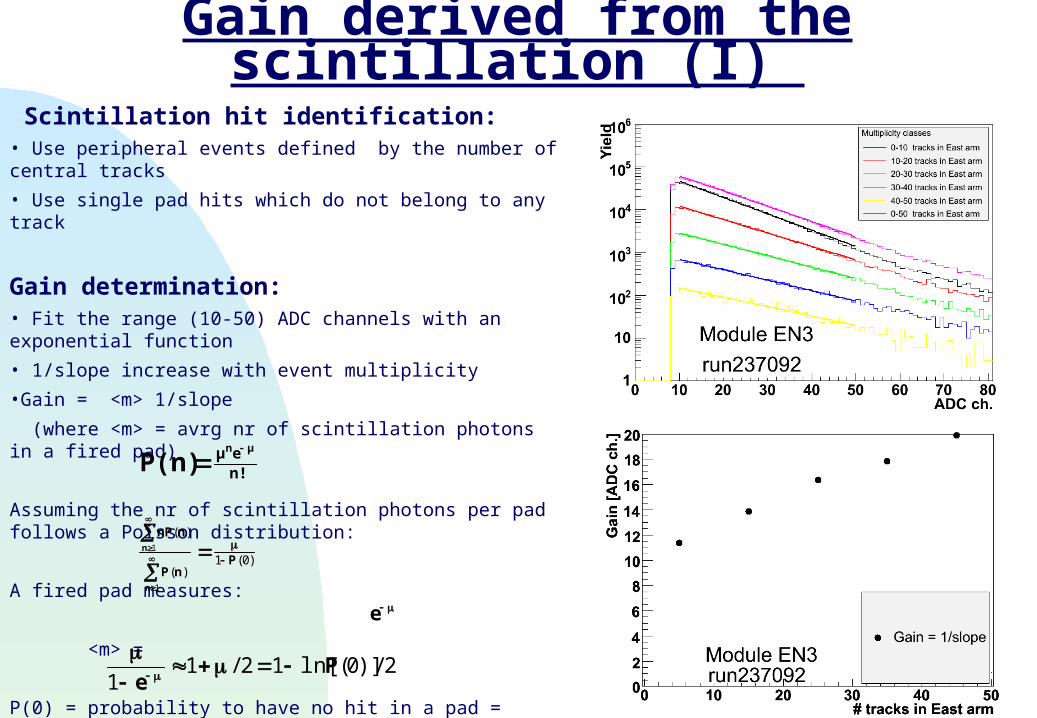
Gain derived from the scintillation (I)
Scintillation hit identification:• Use peripheral events defined by the number of central tracks
• Use single pad hits which do not belong to any track
Gain determination:• Fit the range (10-50) ADC channels with an exponential function
• 1/slope increase with event multiplicity
•Gain = <m> 1/slope
(where <m> = avrg nr of scintillation photons in a fired pad)
Assuming the nr of scintillation photons per pad follows a Poisson distribution:
A fired pad measures:
<m> =
P(0) = probability to have no hit in a pad =
<m> =
)0(1)(
)(
1
1
PnP
nnP
n
n
n!eμ μn
P(n)
e
2/)]0(ln[12/11
Pe

25
Gain derived from the scintillation (II)
P(0) is not measured
Determine the probability P(0,th) of not firing a pad for a given threshold and extrapolate to zero threshold
P(0,th) = 1 – [nr of fired pads (A>th)] / [total nr of pads]*
* The large pads are excluded in this analysis i.e. the total nr of pads = 93 or 94.

26
It does work for all modules…
Run 230661 HV: nominal
… and different HV setting
<G> = 5.9 <G> = 5.7
Run 237092 HV: nominal +100
<G> = 9.5<G> = 10.9 <G> = 10.9
<G> = 5.3
27
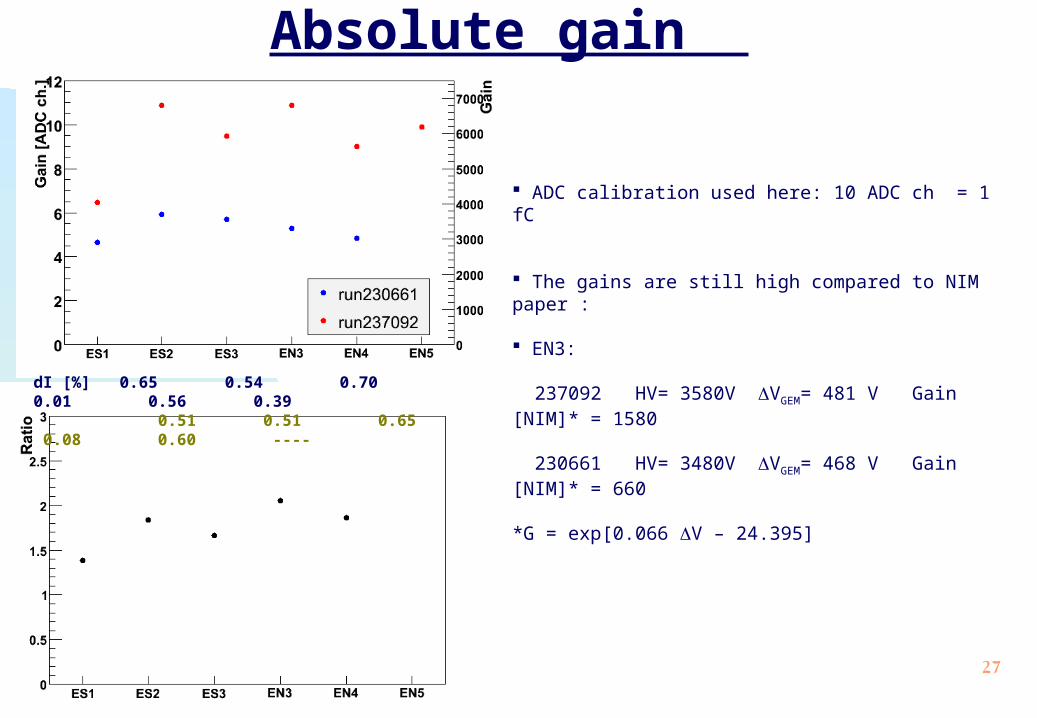
Absolute gain
ADC calibration used here: 10 ADC ch = 1 fC
The gains are still high compared to NIM paper :
EN3:
237092 HV= 3580V VGEM= 481 V Gain [NIM]* = 1580
230661 HV= 3480V VGEM= 468 V Gain [NIM]* = 660
*G = exp[0.066 V – 24.395]
dI [%] 0.65 0.54 0.70 0.01 0.56 0.39 0.51 0.51 0.65 0.08 0.60 ----

28
Gain derived from mip signal (I)
Procedure: Runs 230665 (“nominal” voltage) and run 237095 (“nominal” + 100V) Events with less than 50 tracks in the E arm Select hadrons tracks in the E arm
Vertex +/- 20 cm < 50 tracksmatching to PC3 and EMCaln0 < 0EMC energy < 0.5
Project & match to HBD = ±0.03 rad z = ± 2 cm Subtract random matching Fit pulse height with Landau distribution (in the range ADC > 30 and 75
for the two runs). Use the mean of the fit to define the gain

29
Gain derived from mip signal (II)
Red: all cluster sizesBlue: single pad cluster
Filled symbols: high gain run 237095Open symbols: low gain run 230665

30
mip absolute gain derived assuming a primary charge of 18e in a 1.5 mm drift gap (as measured in KEK).
The gain derived from scintillation is very reliable.
The gain values derived from scintillation and mip signal are consistent within 30%
but the gains measured at the IR are a factor of ~4 higher than measured in the lab.
The origin of this puzzle is not understood.
Long term effect of gain saturation in the GEMs?
Comparison of gain derived from mip and scintillation signal

31
More on scintillation
Shades in PISA: height 2.5cm, spacing 2.5cm x 2.5cm
The scintillation hits provide a very convenient and reliable mean to determine the detector gain.
However, it seems that we see much more scintillation hits than expected, primarily due to tracks crossing the detector and not originating from the vertex (not yet fully quantified).
As a consequence, the occupancy in central Au-Au collisions is high and affects the pattern recognition (clusters are huge).
Double approach:
Install shades to reduce the scintillation light. MC studies underway to optimize the geometry and quantify the reduction of scintillation light seen by the CsI photocathode as well as the loss of Cherenkov light.
develop a new cluster algorithm to cope with the scintillation background.

32
New GEM productionTowards run8

33
Status of GEM production at WIS
25 Au plated and 30 standard GEMs were ordered from CERN A first batch of 20 GEMs (10 standard + 10 Au plated) was received at WI on May
15. A second and final shipment completing the order was received at the end of June.
Production proceeds at a nominal rate of 1 GEM per day and an average of 5 GEMs per week.
Priority is given to the production of Au plated GEMs. The production includes the following quality tests (same tests as last year):
1. 100V test in air (clean room) of the foil before framing
2. 100V test after framing
3. 100V test after soldering SMD resistors
4. 550V test in CF4 in the lab
5. Gain mapping in Ar/CO2 at 484V
So far 18 GEMs have been fully tested and are in the database. A box with 24 GEMs -15 standard (12 from last year spares + 3 from this year) and
9 Au plated (3 + 6)- has already been shipped to SB. A second box should be ready by the end of July.
34
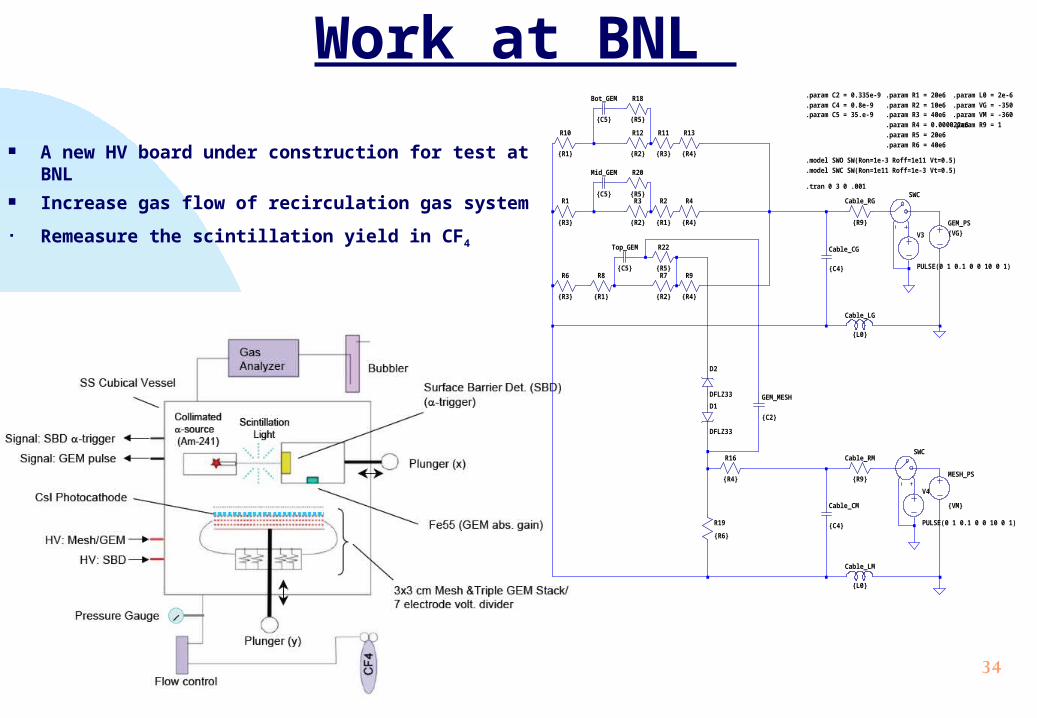
Work at BNL
A new HV board under construction for test at BNL
Increase gas flow of recirculation gas system
Remeasure the scintillation yield in CF4
R10
{R1}
R11
{R3}
R12
{R2}
R13
{R4}
R1
{R3}
R2
{R1}
R3
{R2}
R4
{R4}
R6
{R3}
R7
{R2}
R8
{R1}
R9
{R4}
R16
{R4}
{VG}GEM_PS
MESH_PS
{VM}
SWC
V3
PULSE(0 1 0.1 0 0 10 0 1)
Bot_GEM
{C5}
R18
{R5}
Mid_GEM
{C5}
R20
{R5}
Top_GEM
{C5}
R22
{R5}
Cable_CG
{C4}
Cable_LG
{L0}
Cable_RG
{R9}
Cable_CM
{C4}
Cable_LM
{L0}
Cable_RM
{R9}
SWC
V4
PULSE(0 1 0.1 0 0 10 0 1)R19
{R6}
GEM_MESH
{C2}D1
DFLZ33
D2
DFLZ33
.param R1 = 20e6
.param R2 = 10e6
.param R3 = 40e6
.param R4 = 0.000022e6
.param R5 = 20e6
.param R6 = 40e6
.tran 0 3 0 .001
.param C2 = 0.335e-9
.param C4 = 0.8e-9
.param C5 = 35.e-9
.model SWO SW(Ron=1e-3 Roff=1e11 Vt=0.5)
.model SWC SW(Ron=1e11 Roff=1e-3 Vt=0.5)
.param L0 = 2e-6
.param VG = -350
.param VM = -360
.param R9 = 1

35
Cleaning the glovebox and the HBD vessel is top priority before production starts
Laminar table (ONLY place where GEMs are handled in air) is better than class 1.
The tent is quite clean w/ typically class 100-200.
Glovebox should be better than class 100 as it was before. This requires: Opening it; Clean everything; Close it. New HEPA filters? (probably a good idea) Test empty Test Full Added additional filtering…tested yesterday at Class 20 and falling.
HBD vessel should be clean at least at the same level. The preferred solution: empty it and keep the GEMs in HVAC to preserve QE. Allows interior of HBD to be cleaned as well. Still allows later testing with old GEMs. Allows tests of things like Ultrasound cleaning of Cu GEMs that draw non-linear currents. Allows test fits of Blinds

36
Production at SB
Sequence of operations and tests foreseen during the production at SB:
Full HV operation in CF4 of each triple stack inside the test box before assembly into the HBD vessel.
Assembly inside HBD W vessel
Close HBD W vessel once a few modules (3 to 4) are installed and perform full HV operation in CF4. This is a time consuming step. Requires closing the HBD, flushing gas for several days before doing the test and reopening the vessel to complete the module assembly. But it is considered to be a crucial test.
Complete module installation inside the vessel.
Close HBD W, take out of glove box, flush with CF4 and perform a full detector HV test before shipping to BNL.
Repeat same sequence on HBD E.
Production ready to start

37
Things are ready at Stony Brook
• Evaporator working. Test shot done recently.• QE measurement system working• LEGS gas system up and running in recirculation mode with increase flow and safety system• Many new students arriving: Thomas Videbaek, Leila Makdisi, Cristina Chu, …