1 introduction, scope, context terminology, high-level approach methodology, inputs, assumptions...
TRANSCRIPT

1
Introduction, scope, context Terminology, high-level approach
• Methodology, Inputs, Assumptions– Portfolio development– Discounted core– Environmental scoring– PV assessment– Transmission sizing– Timing assessment
• Results
• Next steps for analysis
• Schedule, Summary
Agenda

2
Transmission Bundles (review)
Resources in CREZs are aggregated into transmission bundles in the following order:
1. Existing transmission bundle
2. Minor upgrade bundle
3. New transmission bundle
Discounted core projects given first priority to fill each transmission bundle
Non-core Commercial projects given next priority to fill the New Transmission bundle
Any remaining transmission capacity in the bundle is allocated to the lowest-scoring generic projects
Up to 3000 MW of new transmission allowed for each CREZ

3
Examples of Transmission Capacity Allocation (review)
300
600
1500
400 361
1000
0
200
400
600
800
1000
1200
1400
1600
(1)
Ex
isti
ng
Tra
ns
mis
sio
n
(2)
Inc
rem
en
tal
Up
gra
de
(3)
Ne
wT
ran
sm
iss
ion
(1)
Ex
isti
ng
Tra
ns
mis
sio
n
(2)
Inc
rem
en
tal
Up
gra
de
(3)
Ne
wT
ran
sm
iss
ion
Example Buildup 1 Example Buildup 2
Av
aila
ble
Ca
pa
cit
y (
MW
)
Discounted Core Commercial Projects Theoretical Projects

4
Transmission sizing and cost
• Weakness of previous study: assumed no capacity on existing transmission system; upgrades essentially all single or double circuit 500kV lines “trunklines”
• Updates:– ISO high-level assessment of capacity from various CREZs 1.)
over existing system; 2.) over relatively minor new upgrades
– Additional lines on case-by-case basis: 500kV for large and out-of-state zones, smaller lines for smaller zones close to loads. Cost = function of length and capacity
– Incorporation of RETI work has been difficult – many CREZs tied to single line segments; many line segments tied to single CREZs; but additional detail would help in cost and timing review

5
Transmission sizing and cost
• See:– California ISO assessment of capacity over existing system and
minor upgrades
– Zaininger Engineering assessment of capacity over RETI lines
• Available here:
http://www.cpuc.ca.gov/PUC/energy/Procurement/LTPP/ltpp_history.htm

6
Introduction, scope, context Terminology, high-level approach
• Methodology, Inputs, Assumptions– Portfolio development– Discounted core– Environmental scoring– PV assessment– Transmission sizing– Timing assessment
• Results
• Next steps for analysis
• Schedule, Summary
Agenda

7
33% RPS Implementation Analysis
• Timelines created for the 33% Reference Case – not for any of other 3 cases– Timeline 1: Historical experience, reforms/risk
– Timeline 2: Reforms, no risks
– Timeline 3: Reforms + external risks
• Goal: Better understand the tradeoffs between cost, risk, and time associated with particular procurement strategies
• Identify market and regulatory barriers to renewable development
• Identify solutions and their impacts on achievement of a 33% RPS

8
Example – Aspen Environmental Group research into generation timelines

9
Example – Research into transmission timelines

10
33% RPS Reference Case – Timeline 3

11
Timeline Tool
• Black & Veatch tool under development to automate timing considerations, create scenario timelines and supply curves
• Generic generation scheduling factors according to: – Technology– Project size– Land type– Location
• Generic transmission schedules for several types of lines
• User has ability to change/define inputs and timing assumptions; change default schedules and MW counts based on technology and other factors, etc.
12
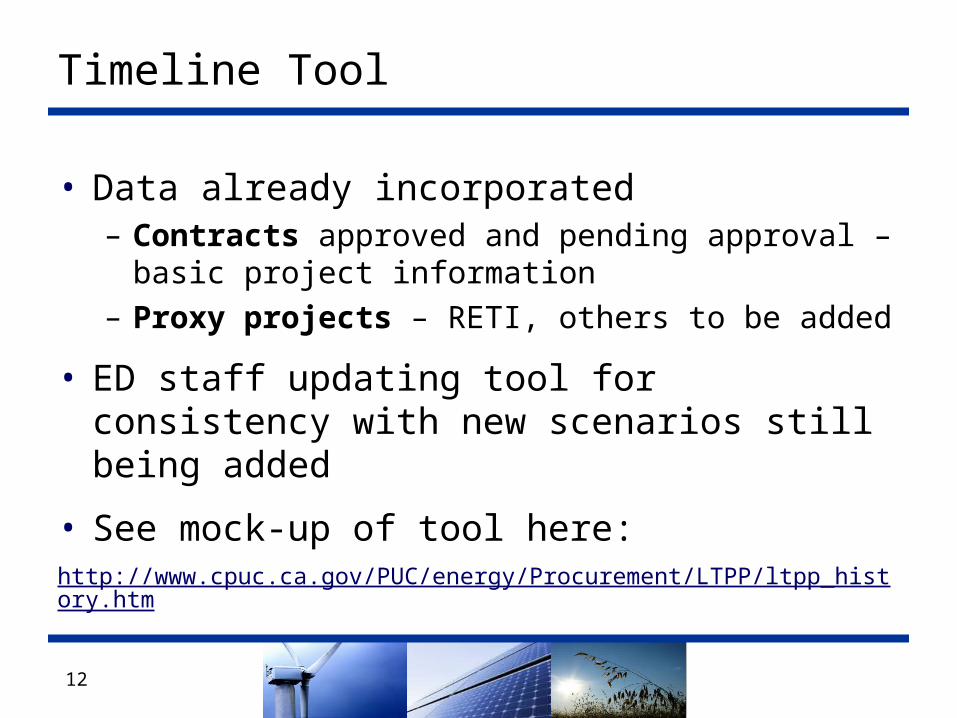
Timeline Tool
• Data already incorporated– Contracts approved and pending approval – basic
project information– Proxy projects – RETI, others to be added
• ED staff updating tool for consistency with new scenarios still being added
• See mock-up of tool here:http://www.cpuc.ca.gov/PUC/energy/Procurement/LTPP/ltpp_history.htm
13
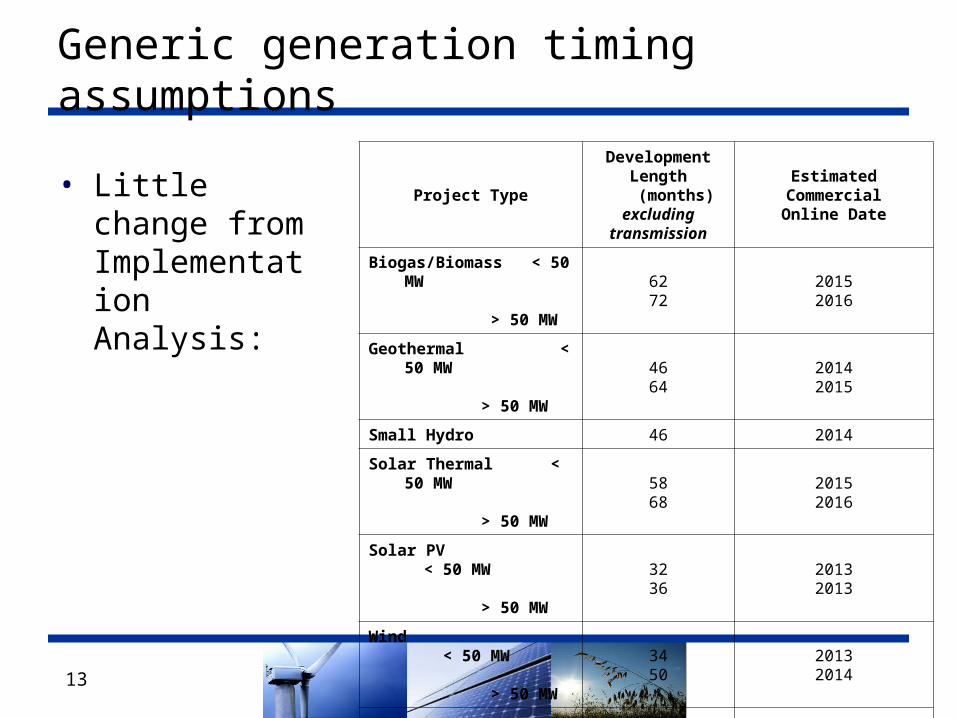
Generic generation timing assumptions
• Little change from Implementation Analysis:
Project Type
DevelopmentLength (months)
excludingtransmission
EstimatedCommercialOnline Date
Biogas/Biomass < 50 MW > 50 MW
6272
20152016
Geothermal < 50 MW > 50 MW
4664
20142015
Small Hydro 46 2014
Solar Thermal < 50 MW > 50 MW
5868
20152016
Solar PV < 50 MW > 50 MW
3236
20132013
Wind < 50 MW > 50 MW
3450
20132014
ED Database projects– Filed/approved by
CPUC (public)– Under negotiation
(confidential)
- Per public contract information
- Per generic estimates above

14
Transmission timing assumptions
Transmission ScheduleType
TransmissionPlanning by
CAISO/ POU/WECC(months)
ProjectDescription
Prep byUtility
CEQA/NEPA Review
ByCPUC/POU/
Feds
Final Reviewand Approval
by CPUC/POU/Feds
Final DesignAnd
Construction byUtilities
Total
Existing / Distributed 0 0 0 0 0 0
Typical 18 12 24 4 24 82
Typical - Short 12 6 12 3 18 51
Typical - Long 24 18 24 4 30 100
Long-Distance 24 18 24 6 30 102
Tehachapi 1-3 0 0 0 0 0 0
Tehachapi 4-11 0 0 0 0 24 24
Sunrise 0 0 0 0 24 24
Devers - CO River 0 0 0 0 30 30

15
Building scenario timelines
• Each zone and transmission bundle/increment is assigned to a transmission schedule→ no generation in that bundle is available before transmission
• Non-CREZ, distributed resources, and resources accessing existing capacity not reliant on transmission→ available per contract or generic generation schedule
• Each scenario is assigned an “online date” according to the availability of the last generation resource chosen for that scenario
• No “bottlenecks” considered now; what assumptions are appropriate?

16
Timeline Tool – Features to Come
• Aggregated portfolios for alternative cases presented with summary timelines and yearly generation charts
• Timelines for individual projects available for review
• Project development phases are broken out
Example Only
17
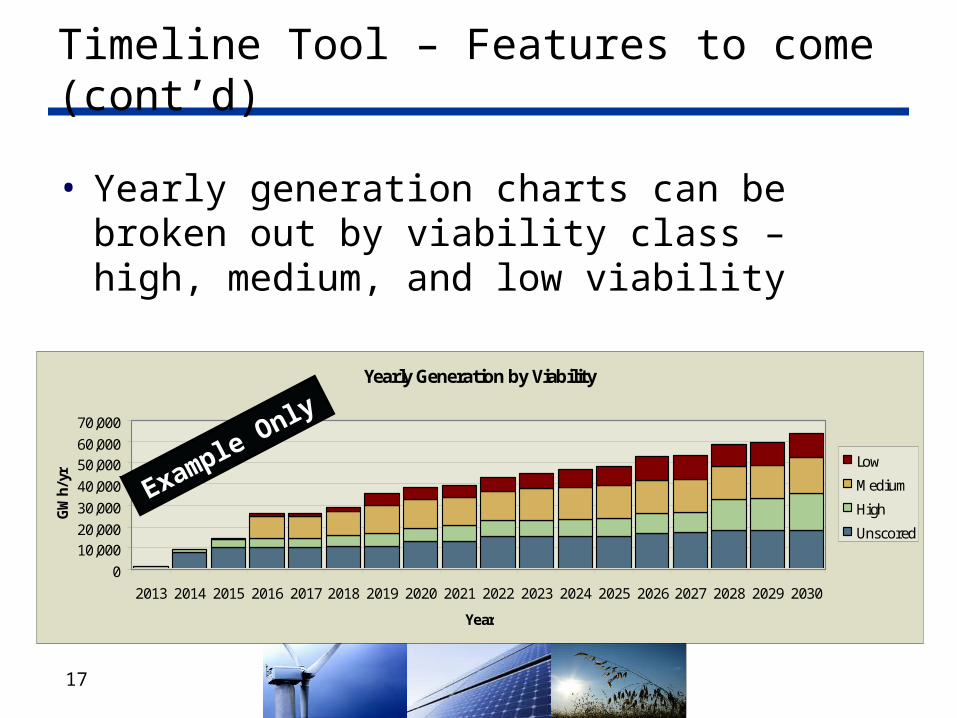
Timeline Tool – Features to come (cont’d)
• Yearly generation charts can be broken out by viability class – high, medium, and low viability
Yearly Generation by Viability
010,00020,00030,00040,00050,00060,00070,000
2013 2014 2015 2016 2017 2018 2019 2020 2021 2022 2023 2024 2025 2026 2027 2028 2029 2030
Year
GW
h/yr
Low
Medium
High
Unscored
Example Only

18
Introduction, scope, context Terminology, high-level approach Methodology, Inputs, Assumptions
– Portfolio development– Discounted core– Environmental scoring– PV assessment– Transmission sizing– Timing assessment
• Results
• Next steps for analysis
• Schedule, Summary
Agenda

19
Preliminary Results

20
Environmental Score
-
10
20
30
40
50
60
70
Cost-Constrained
Environmentally-
Constrained
FastestTimeline
Trajectory Case
Commercial Interest Score
-
10
20
30
40
50
60
70
Cost-Constrained
Environmentally-
Constrained
FastestTimeline
Trajectory Case
Cost Score
-
10
20
30
40
50
60
70
Cost-Constrained
Environmentally-
Constrained
FastestTimeline
Trajectory Case
Timeline Score
-
10
20
30
40
50
60
70
Cost-Constrained
Environmentally-
Constrained
FastestTimeline
Trajectory Case
21
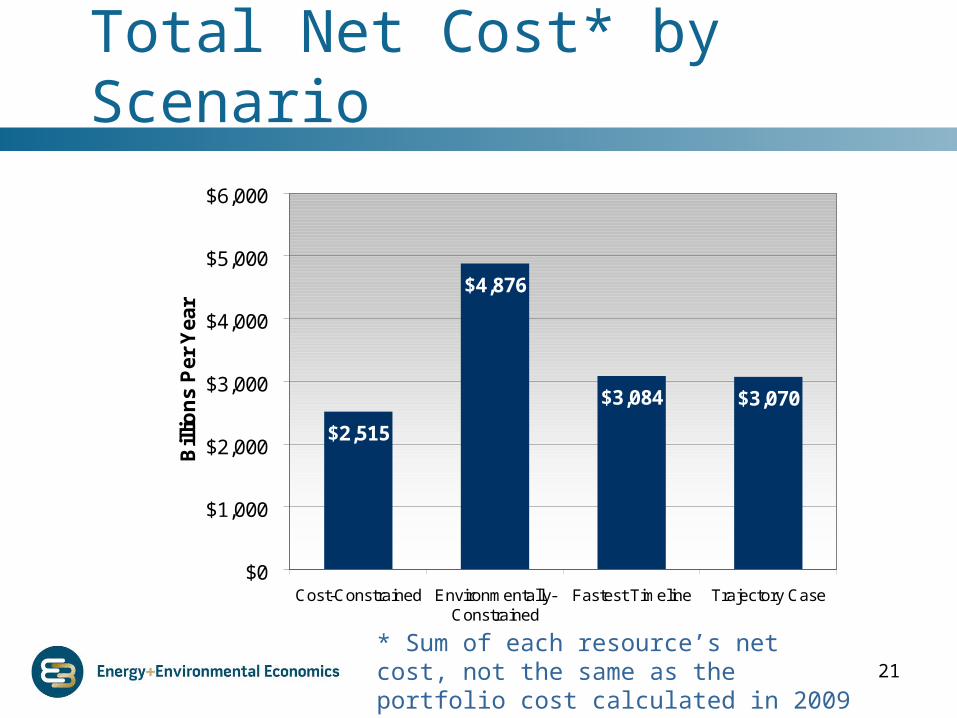
Total Net Cost* by Scenario
* Sum of each resource’s net cost, not the same as the portfolio cost calculated in 2009
$2,515
$4,876
$3,084 $3,070
$0
$1,000
$2,000
$3,000
$4,000
$5,000
$6,000
Cost-Constrained Environmentally-Constrained
Fastest Timeline Trajectory Case
Bill
ion
s P
er
Ye
ar

22
Cost-Constrained Case: Resources by Type
In-State Out-of-State TotalBiogas 1,271 0 1,271Biomass 938 2,812 3,750Geothermal 8,617 5,022 13,639Hydro 0 48 48Large Scale Solar PV 7,454 864 8,317Small Solar PV 2,027 0 2,027Solar Thermal 2,202 935 3,137Wind 12,808 9,262 22,070Total 35,317 18,942 54,259Out-of-State Share of 33% Target: 25%
All Resources (GWh)
In-State Out-of-State TotalBiogas 181 0 181Biomass 126 378 503Geothermal 1,159 713 1,872Hydro 0 16 16Large Scale Solar PV 3,115 340 3,455Small Solar PV 1,052 0 1,052Solar Thermal 933 400 1,333Wind 4,339 3,354 7,693Total 10,905 5,200 16,105
All Resources (MW)
Project Status GWh MWDiscounted Core 21,213 8,073Commercial Non-Core 15,153 4,529Theoretical 17,894 3,503Total 54,259 16,105
Cost-Constrained Case Score RankCost Score 16 1 Environmental Score 27 4 Commercial Interest Score 33 2 Timing Score 45 2 Total Net Cost 2,515$ 1

23
Cost-Constrained Case: Resources by Location
Resources Selected (GWh)
Average REC Cost
($/MWh)Total (GWh and $Billions) 54,259 $ 2,515 Wyoming RECs 345 27.29$ New Mexico RECs 238 29.27$ Round Mountain 378 31.45$ Palm Springs 537 33.46$ British Columbia RECs 12 35.12$ Nevada N RECs 2,912 35.33$ Solano 995 35.42$ Tehachapi 12,216 38.49$ Imperial 6,733 38.98$ San Bernardino - Lucerne 785 42.58$ NonCREZ 5,557 42.79$ San Diego South 1,449 43.16$ Colorado RECs 3,705 43.81$ Carrizo South 2,092 47.13$ Arizona RECs 737 48.61$ Montana RECs 820 49.73$ Northwest RECs 5,543 50.26$ Nevada C RECs 2,873 53.61$ Utah-Southern Idaho RECs 528 54.11$ Riverside East 2,547 73.69$ Distributed Solar - PG&E 970 75.59$ Alberta RECs 1,230 76.85$ Distributed Solar - SCE 958 102.41$ Distributed Solar - SDGE 99 113.67$
Delivery Type GWh MWExisting Transmisssion 26,035 8,822Minor Upgrades 9,282 2,083New Corridors 0 0Out-of-State RECs 18,942 5,200Total 54,259 16,105
Key Indicators:
Total Solar MW: 5,800
Out-of-State RECs: 25%
Earliest compliance year: 2021
Much less solar than other cases

24
Cost-Constrained Supply Curve
Discounted Core 2020 RPS Net Short
0
5
10
15
20
25
30
35
40
45
0 8 16 24 32 40 48 56 64 72 80 88 96
Cumulative TWh
Ran
kin
g S
core
Biogas Biomass Bundled Transmission Geothermal
Small Hydro Incremental Upgrade Small Solar PV Large Scale Solar PV
Solar Thermal Wind

25
Environmentally-Constrained Case: Resources by Location
Delivery Type GWh MWExisting Transmisssion 25,052 11,020Minor Upgrades 3,046 1,400New Corridors 20,296 8,666Out-of-State RECs 5,865 2,256Total 54,259 23,342
Environmental Case Score RankCost Score 31 4 Environmental Score 18 1 Commercial Interest Score 56 3 Timing Score 52 3 Total Net Cost 4,876$ 4
Resources Selected (GWh)
Environmental Score (0-100)
Total (GWh and Average Score) 54,259 17.83 Distributed Solar - Other 2,852 1.77 Distributed Solar - SDGE 785 3.62 Distributed Solar - SCE 4,596 4.54 Distributed Solar - PG&E 3,280 5.79 Westlands 7,163 10.53 Riverside East 11,192 20.65 Pisgah 7,260 21.22 Remote DG - SCE 348 21.62 Remote DG - Other 283 21.62 Remote DG - PG&E 929 21.62 Remote DG - SDGE 40 21.62 Tehachapi 5,516 23.46 Arizona RECs 737 24.10 Carrizo South 2,092 25.08 Alberta RECs 1,230 26.76 Northwest RECs 1,376 26.76 Montana RECs 820 26.76 Utah-Southern Idaho RECs 191 28.02 Palm Springs 222 29.14 San Bernardino - Lucerne 121 31.91 NonCREZ 1,333 33.71 San Diego South 156 34.08 Nevada N RECs 212 35.26 Round Mountain 226 35.37 New Mexico RECs 238 36.70 Nevada C RECs 1,062 40.79
26
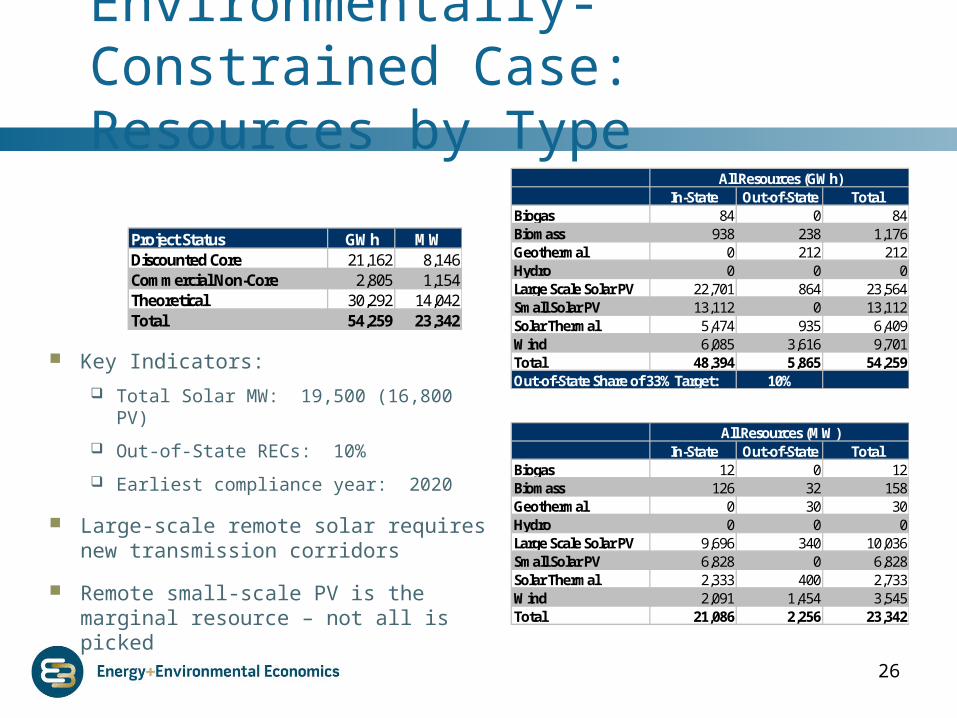
Environmentally-Constrained Case: Resources by Type
In-State Out-of-State TotalBiogas 84 0 84Biomass 938 238 1,176Geothermal 0 212 212Hydro 0 0 0Large Scale Solar PV 22,701 864 23,564Small Solar PV 13,112 0 13,112Solar Thermal 5,474 935 6,409Wind 6,085 3,616 9,701Total 48,394 5,865 54,259Out-of-State Share of 33% Target: 10%
All Resources (GWh)
In-State Out-of-State TotalBiogas 12 0 12Biomass 126 32 158Geothermal 0 30 30Hydro 0 0 0Large Scale Solar PV 9,696 340 10,036Small Solar PV 6,828 0 6,828Solar Thermal 2,333 400 2,733Wind 2,091 1,454 3,545Total 21,086 2,256 23,342
All Resources (MW)
Project Status GWh MWDiscounted Core 21,162 8,146Commercial Non-Core 2,805 1,154Theoretical 30,292 14,042Total 54,259 23,342
Key Indicators:
Total Solar MW: 19,500 (16,800 PV)
Out-of-State RECs: 10%
Earliest compliance year: 2020
Large-scale remote solar requires new transmission corridors
Remote small-scale PV is the marginal resource – not all is picked
27
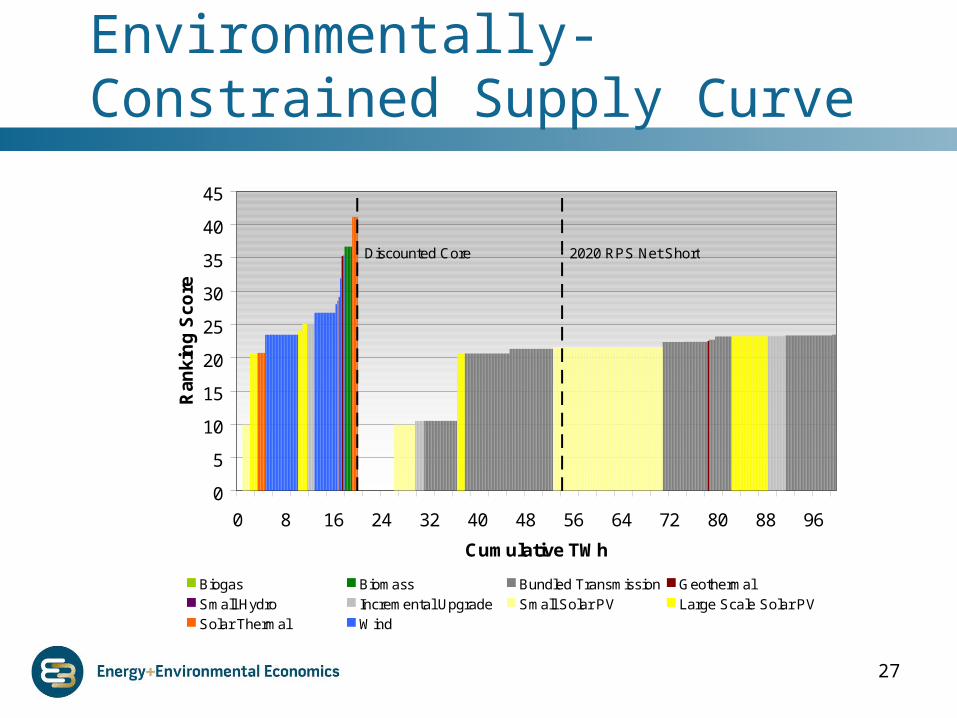
Environmentally-Constrained Supply Curve
Discounted Core 2020 RPS Net Short
0
5
10
15
20
25
30
35
40
45
0 8 16 24 32 40 48 56 64 72 80 88 96
Cumulative TWh
Ran
kin
g S
core
Biogas Biomass Bundled Transmission Geothermal
Small Hydro Incremental Upgrade Small Solar PV Large Scale Solar PV
Solar Thermal Wind

28
Time-Constrained Case: Resources by Location
Time-Constrained Case Score RankCost Score 20 3 Environmental Score 25 2 Commercial Interest Score 37 3 Timing Score 31 1 Total Net Cost 3,084$ 3
Delivery Type GWh MWExisting Transmisssion 24,224 9,140Minor Upgrades 4,338 1,725New Corridors 0 0Out-of-State RECs 25,697 9,079Total 54,259 19,944
Total (GWh and Average Score) 54,259 30.86 San Diego South 156 9.09 Round Mountain 226 9.09 NonCREZ 3,789 19.73 San Bernardino - Lucerne 710 22.62 Utah-Southern Idaho RECs 528 25.85 Palm Springs 537 27.03 Tehachapi 11,365 27.27 Imperial 2,945 28.15 Nevada N RECs 1,202 28.35 Montana RECs 1,923 28.61 Distributed Solar - PG&E 1,236 29.97 Alberta RECs 2,422 30.21 Distributed Solar - SDGE 173 31.16 Carrizo South 2,092 31.50 Distributed Solar - SCE 1,345 31.78 Northwest RECs 5,694 32.59 Riverside East 3,666 34.27 Wyoming RECs 345 36.36 New Mexico RECs 238 36.36 Colorado RECs 9,837 36.36 Distributed Solar - Other 322 36.37 Nevada C RECs 2,772 39.80 Arizona RECs 737 45.45

29
Time-Constrained Case: Resources by Type
Key Indicators:
Total Solar MW: 8,600 MW
Out-of-State RECs: 33%
Earliest compliance year: 2015
Largest proportion of out-of-state resources
Out-of-state wind is a good resource if time is the only driver
Project Status GWh MWDiscounted Core 21,103 8,035Commercial Non-Core 13,192 4,572Theoretical 19,964 7,336Total 54,259 19,944
In-State Out-of-State TotalBiogas 202 0 202Biomass 938 238 1,176Geothermal 2,048 3,363 5,412Hydro 79 0 79Large Scale Solar PV 13,515 864 14,378Small Solar PV 3,076 0 3,076Solar Thermal 2,202 935 3,137Wind 6,502 20,297 26,799Total 28,562 25,697 54,259Out-of-State Share of 33% Target: 33%
All Resources (GWh)
In-State Out-of-State TotalBiogas 29 0 29Biomass 126 32 158Geothermal 290 475 765Hydro 26 0 26Large Scale Solar PV 5,630 340 5,970Small Solar PV 1,604 0 1,604Solar Thermal 933 400 1,333Wind 2,228 7,832 10,061Total 10,865 9,079 19,944
All Resources (MW)

30
Time-Constrained Supply Curve
Discounted Core 2020 RPS Net Short
0
10
20
30
40
50
60
70
80
90
0 8 16 24 32 40 48 56 64 72 80 88 96
Cumulative TWh
Ran
kin
g S
core
Biogas Biomass Bundled Transmission Geothermal
Small Hydro Incremental Upgrade Small Solar PV Large Scale Solar PV
Solar Thermal Wind

31
Trajectory Case: Resources by Location
Trajectory Case Score RankCost Score 19 2 Environmental Score 26 2 Commercial Interest Score 0 1 Timing Score 57 4 Total Net Cost 3,070$ 2
Delivery Type GWh MWExisting Transmisssion 25,667 8,839Minor Upgrades 7,786 2,025New Corridors 6,606 1,593Out-of-State RECs 14,201 5,201Total 54,259 17,659
Resources Selected (GWh)
Commercial Interest Score
(0-100)Total (GWh and Average Score) 54,259 0.21 Arizona RECs 737 0.00 Riverside East 2,547 0.00 New Mexico RECs 238 0.00 Pisgah 218 0.00 Alberta RECs 2,422 0.00 Round Mountain 226 0.00 Palm Springs 222 0.00 NonCREZ 6,502 0.00 Nevada C RECs 1,415 0.00 Nevada N RECs 212 0.00 San Bernardino - Lucerne 170 0.00 Tehachapi 12,024 0.00 Distributed Solar - PG&E 970 0.00 Montana RECs 820 0.00 Imperial 11,903 0.00 Northwest RECs 5,742 0.00 Solano 878 0.00 Colorado RECs 1,301 0.00 Utah-Southern Idaho RECs 528 0.00 San Diego South 1,250 0.00 Distributed Solar - SCE 958 0.00 British Columbia RECs 442 0.00 Wyoming RECs 345 0.00 Distributed Solar - SDGE 99 0.00 Carrizo South 2,092 5.34

32
Trajectory Case: Resources by Type
In-State Out-of-State TotalBiogas 1,292 0 1,292Biomass 938 250 1,188Geothermal 10,564 864 11,428Hydro 79 478 557Large Scale Solar PV 7,897 864 8,760Small Solar PV 2,027 0 2,027Solar Thermal 4,232 935 5,167Wind 13,029 10,810 23,839Total 40,059 14,201 54,259Out-of-State Share of 33% Target: 20%
All Resources (GWh)
In-State Out-of-State TotalBiogas 184 0 184Biomass 126 34 159Geothermal 1,496 122 1,618Hydro 26 156 182Large Scale Solar PV 3,289 340 3,629Small Solar PV 1,052 0 1,052Solar Thermal 1,800 400 2,200Wind 4,485 4,149 8,634Total 12,458 5,201 17,659
All Resources (MW)
Project Status GWh MWDiscounted Core 22,395 8,494Commercial Non-Core 31,753 9,114Theoretical 112 51Total 54,259 17,659
Key Indicators:
Total Solar MW: 6,800 MW
Out-of-State RECs: 20%
Earliest compliance year: 2019
Most balanced scenario
Very few generic projects

33
Trajectory Case Supply Curve
Discounted Core
2020 RPS Net Short
0
10
20
30
40
50
60
70
0 8 16 24 32 40 48 56 64 72 80 88 96
Cumulative TWh
Ran
kin
g S
core
Biogas Biomass Bundled Transmission Geothermal
Small Hydro Incremental Upgrade Small Solar PV Large Scale Solar PV
Solar Thermal Wind

34
Introduction, scope, context Terminology, high-level approach Methodology, Inputs, Assumptions
– Portfolio development– Discounted core– Environmental scoring– PV assessment– Transmission sizing– Timing assessment
Results
• Next steps for analysis
• Schedule, Summary
Agenda
35
IOU-specific allocations
• To provide direct input into 2010 LTPP, statewide portfolios will need to be “allocated” each IOU.
• Proposed approach:– Remove any POU resources from each portfolio;– Allocate public ED database projects to the IOUs with which
those projects have signed contracts (PUBLIC);– Allocate confidential ED database projects to the IOUs with
which those projects are negotiating contracts (CONF.);– Allocate generic projects to load on a pro-rata basis for each
resource type in each zone (PUBLIC);– Aggregate each IOU’s contracted, short-listed and generic
project allocations to generate IOU-specific RPS portfolios (PUBLIC, provided the aggregation sufficiently masks the confidential data).

36
Integration assessment
• California ISO developing model that estimates integration needs and costs associated with 33% Reference Case from 2009 Implementation Analysis
• PG%E has developed Renewable Integration Model (RIM) tool – not as analytically comprehensive, but simpler and spreadsheet-based.
• Tools may be introduced into LTPP proceeding later this year. Possible next steps:– Parties vet methodologies and results– Models are re-run to estimate integration needs of final RPS
scenarios adopted in Scoping Memo– Results inform Commission consideration of the amount and
types of resources to authorize in 2010 LTPP

37
Capacity Credit for Solar Resources

38
Overview
PG&E and CAISO integration studies are considering capital costs of resources needed for intermittent renewable resource integration in addition to variable costs of increased operating reserves
Capital costs driven by assumptions about how much capacity would already have been online during the planning year
Online capacity is a function of Planning Reserve Margin
For intermittent renewables, Net Qualifying Capacity (NQC) is used to estimate contribution toward meeting peak demand
Issue: Capacity credit of intermittent renewables, particularly solar, depends on how much is online

39
California Peak Load Hours
In California, peak loads occur during summer days when there are high air conditioning loads
Solar has been considered to have a high capacity credit because maximum output occurs during the hot day-time hours when load is highest The figure above shows the CAISO
load profile on June 20, 2008 which includes the annual system peak hour, 3-4 PM
0
5,000
10,000
15,000
20,000
25,000
30,000
35,000
40,000
45,000
50,000
1 3 5 7 9 11 13 15 17 19 21 23
Hour Ending (HE)
Load
(M
W)
CAISO Load June 20, 2008

40
Peak Load Day (June 20, 2008) with High Solar Penetration
“Must Run Gen” is an approximation of nuclear, coal, and minimum hydro
Solar resources are simulated fixed-tilt utility-scale PV and solar through with no storage at high penetration for June 20, 2008
High penetration of solar generation moves the “net peak” load hour, when load must be met from dispatchable generation, into the nighttime
0
5,000
10,000
15,000
20,000
25,000
30,000
35,000
40,000
45,000
50,000
1 3 5 7 9 11 13 15 17 19 21 23
PV
Must Run GenLoad
Net Load
0
5,000
10,000
15,000
20,000
25,000
30,000
35,000
40,000
45,000
50,000
1 3 5 7 9 11 13 15 17 19 21 23
CSP
Must Run GenLoad
Net Load
Load
(M
W)
Load
(M
W)
HEHE

41
Top 500 Net Load Hours under high PV Penetration Levels
0
2,000
4,000
6,000
8,000
10,000
27,000
31,000
35,000
39,000
43,000
47,000
0 100 200 300 400 500
Night Hours
Top 500 Net Load Hours with 0 MW PV
Top 500 Net Load Hours with 2,000 MW PV
Top 500 Net Load Hours with 4,000 MW PV
Top 500 Net Load Hours with 6,000 MW PV
Average PV Output Top 100 Hours with 6,000 MW PV
Average PV Output Top 100 Hours with 4,000 MW PV
Average PV Output Top 100 Hours with 2,000 MW PV
Average PV Output Top 100 Hours with 0 MW PV
Net
Loa
d (M
W)
Ranked Net Load Hour
Average P
V O
utput in Top 100 H
ours (MW
)
As PV penetration increases, the net load hours are re-sorted from highest to lowest and more nighttime hours are among the top 500 net load hours
42
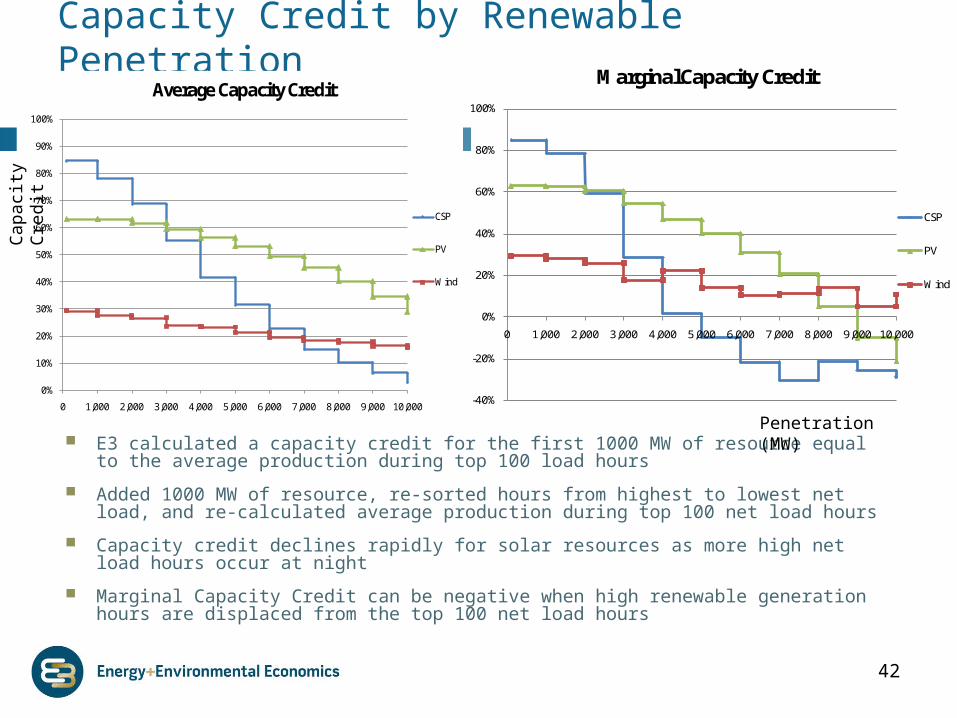
Capacity Credit by Renewable Penetration
-40%
-20%
0%
20%
40%
60%
80%
100%
0 1,000 2,000 3,000 4,000 5,000 6,000 7,000 8,000 9,000 10,000
Marginal Capacity Credit
CSP
PV
Wind
0%
10%
20%
30%
40%
50%
60%
70%
80%
90%
100%
0 1,000 2,000 3,000 4,000 5,000 6,000 7,000 8,000 9,000 10,000
Average Capacity Credit
CSP
PV
Wind
E3 calculated a capacity credit for the first 1000 MW of resource equal to the average production during top 100 load hours
Added 1000 MW of resource, re-sorted hours from highest to lowest net load, and re-calculated average production during top 100 net load hours
Capacity credit declines rapidly for solar resources as more high net load hours occur at night
Marginal Capacity Credit can be negative when high renewable generation hours are displaced from the top 100 net load hours
Cap
acity
Cre
dit
Penetration (MW)

43
Capacity Credit Depends on the Resource Mix
The previous slides assumed penetration of only one technology The figures above assume a diversified portfolio with 8 MW Wind to every 3 MW PV
and 3 MW CSP Combined portfolio receives average capacity credit of 31% at 10,000 MW of
penetration, higher than any of the three individual technologies
0%
5%
10%
15%
20%
25%
30%
35%
40%
45%
0
1,00
0
2,00
0
3,00
0
4,00
0
5,00
0
6,00
0
7,00
0
8,00
0
9,00
0
10,0
00
11,0
00
12,0
00
13,0
00
14,0
00
Average Capacity Credit
0%
5%
10%
15%
20%
25%
30%
35%
40%
45%
0
1,00
0
2,00
0
3,00
0
4,00
0
5,00
0
6,00
0
7,00
0
8,00
0
9,00
0
10,0
00
11,0
00
12,0
00
13,0
00
14,0
00
Marginal Capacity Credit
Cap
acity
Cre
dit
Penetration (MW)

44
• CPUC and California ISO signed MOU on May 13, 2010 (http://www.caiso.com/2799/2799bf542ee60.pdf)– Agrees on certain elements of the ISO’s new proposed annual
Transmission Planning Process
– Commits to closer coordination between resource and transmission planning – ISO planning process considers scenarios provided by CPUC, CPUC gives substantial weight in the permitting process to projects consistent with ISO plan
• Umbrella LTPP proceeding considers EE, demand response, distributed generation, utility-scale renewables, fossil retirements, when determining overall system need– CPUC must consider these same things when assessing the need for
individual transmission projects, pursuant to statute
Transmission Assessment
44

45
Transmission assessment (cont’d)
“The CPUC and the ISO will review the results of the California Transmission Planning Group modeling phases and evaluate their implications for the transmission needs of the CPUC's Long Term Procurement Plan renewable resource scenarios. The ISO will subsequently seek, within the time and human resource constraints of Phase 2 of the transmission planning process, to provide the CPUC and other stakeholders with a formal assessment of the transmission planning needs within the ISO balancing authority area for the Long Term Procurement Plan renewable resource scenarios.”
- May 13, 2020 MOU between California ISO and CPUC

46
Introduction, scope, context Terminology, high-level approach Methodology, Inputs, Assumptions
– Portfolio development– Discounted core– Environmental scoring– PV assessment– Transmission sizing– Timing assessment
Results Next steps for analysis
• Schedule, Summary
Agenda

47
Schedule
• Comments due July 9
• Reply comments due July 16
– Ruling next week will request feedback on specific questions – please attempt to address these, in addition to your general comments