1. ir saut p hutagalung, m.sc (dirjen p2hp kkp)
TRANSCRIPT

BLUE ECONOMY IN MARINE AND FISHERIES
INDUSTRIALIZATION
By:Ir. Saut P. Hutagalung, M.Sc
Director General of Fisheries Products Processing and Marketing
MINISTRY OF MARINE AFFAIRS AND FISHERIESREPUBLIC INDONESIA
Presented at :The 1st International Symposium on Aquatic Products Processing
Bogor, 13 November 2013
1

OUTLINE
1. Background
2. Challenges
3. Marine and Fisheries Industrialization
4. Blue Economy Implementation
OUTLINE
2
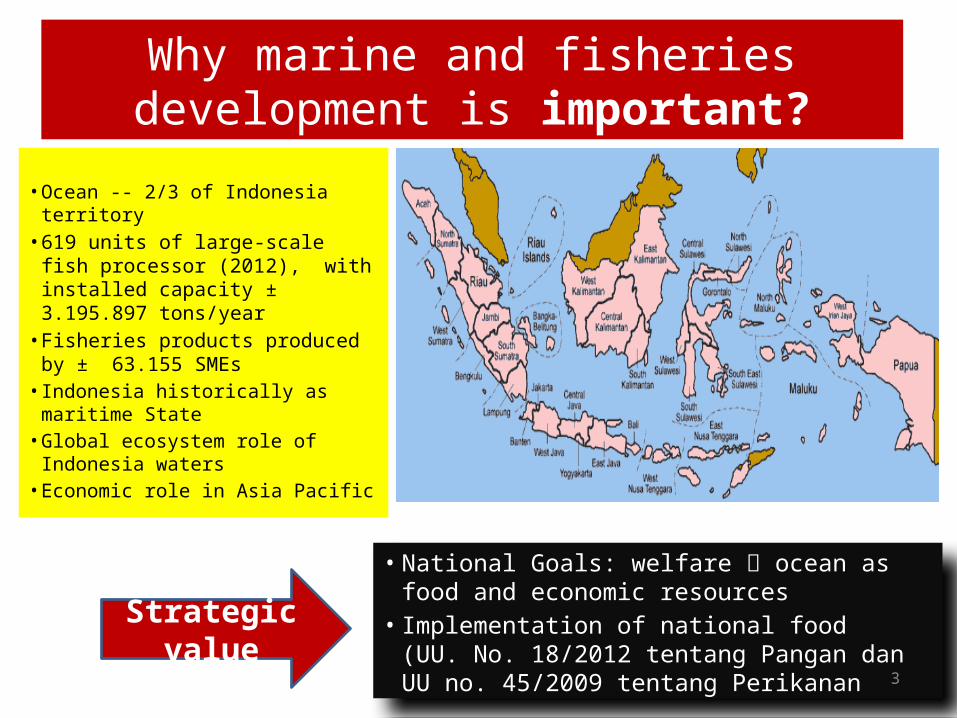
• Ocean -- 2/3 of Indonesia territory• 619 units of large-scale fish
processor (2012), with installed capacity ± 3.195.897 tons/year
• Fisheries products produced by ± 63.155 SMEs
• Indonesia historically as maritime State
• Global ecosystem role of Indonesia waters
• Economic role in Asia Pacific
• National Goals: welfare ocean as food and economic resources
• Implementation of national food (UU. No. 18/2012 tentang Pangan dan UU no. 45/2009 tentang Perikanan
Strategic value3
Why marine and fisheries development is important?

Potency of Marine and Fisheries
Rp 48,8 trillion from fish
US$12000/km2
US$ 31,78 million
Sea transportation Gas and oil
recreation
US$ 40 million bio-pharmacyCreative industry
4

1. Ccompetitiveness and income level of SMEs processing and
marketing operators;
2. Value added marine and fisheries products;
3. Asean Economic Community (AEC) started by 2015
4. Business continuity;
5. Distribution of fish for consumption and raw materials;
6. Distribution of fish to meet protein source .
CHALLENGES
5

Nasional
Capture Fisheries70 Trillion
Aquaculture75 Trillion
Processing, marketing & Distribution115 Trillion
Bappenas, 2012
6

TARGETACHIEVED
INDUSTRIALIZATION POLICY
PRODUCTION
TARGET 2014
CAPTURE FISHERIES
5,6 MIL TONNES
AQUACULTURE
16,9 MIL TONNES
STRATEGY
2. INDUSTRIALIZATI
ON
3. COMMUNITY EMPOWERMENT
1. MARKET STRENGTHENING
INDUSTRIALIZATION POLICY
Changes in upstream and downstream production systems to increase the added value, competitiveness, productivity, and marine production scale and fisheries resources, through modernization supported by integrated macroeconomic policy, infrastructure development, business and investment systems, science and technology and human resources for people welfare
1. Processed product production
2. Fish consumption
3. Export value
4. Non-edible product value
5. Investment value
7

IMPLEMENTATION OF BLUE ECONOMY
ON INDUSTRIALIZATION
1. Strengthen industrialization
2. Better environmental quality
3. Increase in value added
4. Increase competitiveness
8

1. NATURE’S EFFICIENCY2. ZERO WASTE
3. MULTIPLE REVENUE4. INCREASED IN INCOME
5. JOB CREATION
PRODUCTION CENTER
USH1
USH2
INTEGRATION OF BLUE ECONOMY, INDUSTRIALIZATION, AND MINAPOLITAN
UPSTREAM INDUSTRIALIZATION (MODERNIZATION)
DOWNSTREAM INDUSTRILIZATION
MARKETING
MINAPOLITAN:ZONE BASE: CENTER OF GROWTH
BLUE ECONOMY
Compe
titive
and
Sus
taina
ble M
arine
and
Fisher
ies D
evelo
pmen
t for
the
People
welf
are
INDUSTRIALIZATION: ACCELERATION
9

• Learning from nature – using the logic of ecosystems: applying system thinking
• Changing the way of doing business: Redefining core business: core business is defined by core competence, endless innovation: innovation creates opportunities, driven by vision and creativity
• Blue Economy is not simply Ocean-based Economy, but Ocean-based Economy may be developed based upon the Principles of Blue Economy
• The principles of Blue Economy seem to be the most suitable to apply in promoting sustainable marine and fisheries development.
SHIFTING PARADIGM
GREEN ECONOMY
BLUE ECONOMY
10Source: Gunter Pauli “The Blue Economy : 10 years, 100 innovations, 100 million jobs”

THE BLUE ECONOMY PRINCIPLES
• Nature’s efficiency• Zero waste: leave nothing to waste – waste for one is a
food for another - waste from one process is raw material for the other:
• Social inclusiveness: self-sufficiency for all – social equity, more jobs, more opportunities for the poor
• Generation to regeneration and balancing production & consumption
• Innovation and adaptation: the principles of the law of physics & continuous natural adaptation
• Multiple Economic Effects/benefits
11

............The green economy and the blue economy have been gaining ground in
recent years. They are not contradictory; they are complementary.
Blue economy is an integral part of the green economy, which is our common objective. They are very much part of our sustainable future.........
The blue economy, therefore, is of enormous importance to Indonesia........
For me, blue economy is our next frontier. Indonesia is ready to advance it in view of our geographic circumstances.............
PRESIDENT SUSILO BAMBANG YUDHOYONO :About GREEN AND BLUE ECONOMY
“LEADERS VALUING NATURE” President speech on HIGH-LEVEL LEADERSHIP PLATFORM AT RIO+20: COMMITMENTS TO THE
GREEN/BLUE ECONOMYRIO, de Janeiro Brazil, 21 JUNE 2012
12

BLUE ECONOMY MODEL OF BUSINESS AND INVESTMENT (innovation and creativity)
1. MULTIPLE REVENUE
2. EFFICIENT AND MORE BUSINESS OPPORTUNITY:
1) LESS RAW MATERIALS AND ENERGY (reduce cost)
2) MORE GOODS AND SERVICES (more products/services, money and job)
3) HIGH PRODUCTIVITY-the principles efficiency (more money)
4) FOCUS ON ADDED-VALUE PRODUCTS (more money)
5) HIGH QUALITY PRODUCTS (more money)
6) NO WASTE: LEAVE NOTHING TO WASTE: WASTE ONE IS RAW MATERIALS FOR OTHERS/NEW PRODUCTS (more money and job)
3. INCREASING INCOME (+)
4. CREATING JOB (+)
5. REDUCING ENVIRONMENTAL RISK (reduce cost and tax)
6. IMPROVING BUSINESSES AND PROTECTING THE ENVIRONMENT (+)13

BLUE ECONOMY INDUSTRIALIZATION
Needs :
• Technology: transforming waste into by-products
• Increasing the role of private sector and market
14

A WAY MOVING FORWARD
• To continue the policy of industrialization and
Blue Economy
• To guide national development
policies/program 2015-2019 (RPJM 2015-
2019)
15

VARIOUS FISHERIES PRODUCTS WITHOUT WASTE, AND SUSTAINABLE
16
Capture Fisheries
Aquaculture
Tuna & Pangasiu
s
Non-consumptio
n
Consumption
Fresh
CollagenShrimp
Capture Fisheries
Aquaculture
Fish meal
Consumption
Non-consumption
Non-consumptio
n
Consumption
Aquaculture
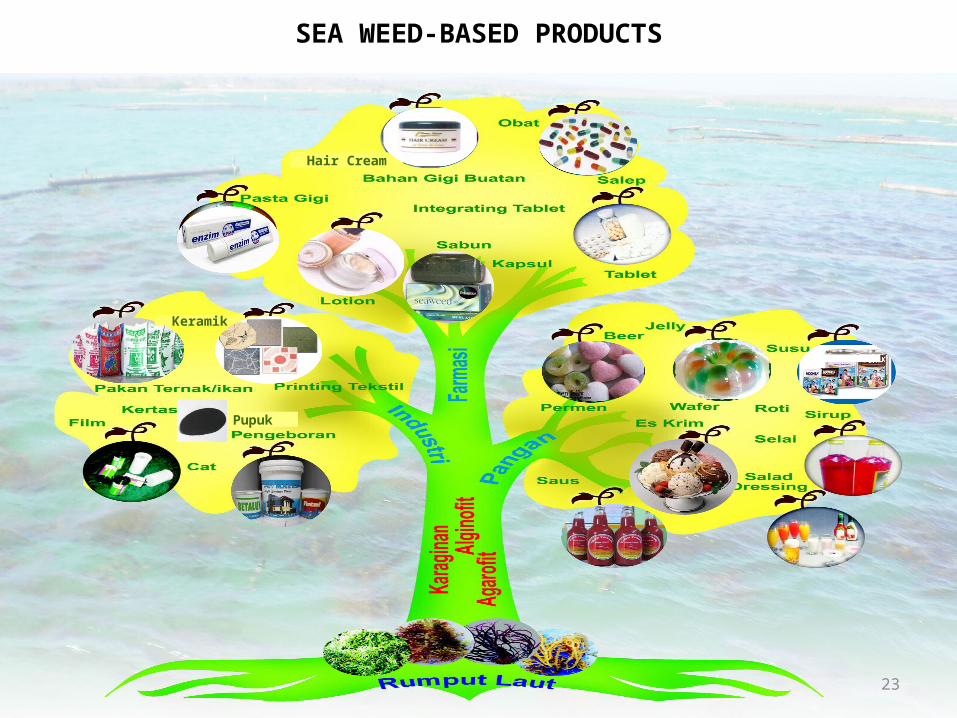
Seaweed
Fish oil
Other processed products
Jelly, Milk, Bread, Jam, Sauce, Ice
cream, wafer, salad, syrup, candy
and dodolPharmacy/Cosmetic:
• Lotion•
Shampoo
• Soap• Hair
cream• Capsule• PillsIndustry:
• Paint raw material
• Ceramics
• Paper• Feed• Textile• Air
freshener
Fertilizer
Fresh
Other processed products
Fat blocker,
Cosmetic, Pharmacy
Shrimp meal

SHRIMP-BASED PRODUCTS DEVELOPMENT
Value added
17
Shrimp’s head meal
HEAD
MEAT
SHELLS
17

Agriculture (Fertilizer, fungicide,
baktericida, nematocides)
Chitin
Medical Grade (ointment, pharmacy, and
surgery materials)
Chitosan
Industrial Grade(Water purification, paper,
material for metal deionization)
Food Grade(Preservative material,
fat blocker, taste additive, anti cholesterol)
WASTE AND HIGH VALUED PRODUCTSOF SHRIMP AND CRUSTACEA
SKIN OF SHRIMP AND
CRUSTACEA
18

TUNA-BASED PRODUCTS
Tuna Loin Tuna Sushi Tuna meat-floss Canned Tuna Pastel Tuna
Tofu Tuna
Smoked Tuna
Tuna meat ballSausage TunaOtak-otak Tuna
“Dragon leg” Tuna
Tuna Sauce Ekado TunaKekian Tuna
Pre Cooked Tuna
19
19

WASTEHEADEYE
Omega 3
BONE Fertilizer
GelatinFood, cosmetic and Pharmacy
CollagenCosmetic and Pharmacy
MEATFish meal
Fish Jelly Products
OilFish Oil
MEATMEAT
Fish Jelly Product
Fish meal
OILOil
SKINCollagen
Cosmetic and Pharmacy
GelatinFood, cosmetic and Pharmacy
BONEFISH MEALFish Meal
COLAGENPharmacy
GELATINCosmetic and Pharmacy
GillFISH MEALFertilizer
WASTEFish Protein Concentrate
FOOD SECURITY MULTIPLE REVENUEJOBS
MAIN PRODUCTS: FRESH, LOINAND CANNED FISH
TUNA
DERIVATIVE PRODUCTS OF TUNA
20

21
PANGASIUS-BASED PRODUCTS

WASTEHeadBones
Fertilizer
GelatinFood, Cosmetic and Pharmacy
CollagenCosmetic and Pharmacy
MeatFish meal for pellet
Fish Jelly Product
MeatMeat
Fish Jelly Product
Fish meal for pellet
OilFish meal
SkinCollagen
Cosmetic and Pharmacy
GelatinFood, Cosmetic and Pharmacy
BonesFish mealFertilizer
CollagenCosmetics and Pharmacy
GelatinFood, Cosmetic and Pharmacy
GillFish mealFertilizer
Limbah CairFish Protein Concentrate
PANGASIUS
Main products (fresh, fillet, and other value added products)
DERIVATIVE PRODUCTS OF PANGASIUS
22
Hair Cream
Pupuk
Keramik
SEA WEED-BASED PRODUCTS
23

Directorate General of Fisheries Products Processing and MarketingMinistry of Marine Affairs and Fisheries The Republic of IndonesiaJl. Medan Merdeka Timur No.16 JakartaINDONESIA
24
THANK YOU

25
CAPAIAN 2010-2012 DAN TARGET 2013-2014PERTUMBUHAN PDB PERIKANAN
2010 2011 2012 2013 * 2014 *0
1
2
3
4
5
6
7
8
6.04
6.966.48
7 7.25
Pertanian Perikanan Nasional
pers
en
* Angka target hanya untuk PDB Perikanan
Pertumbunan PDB Perikanan tahun 2011-2012 mencapai 6,48%
Meskipun pertumbuhan PDB Perikanan tahun 2012 lebih lambat dari tahun 2011, namun secara nominal terjadi kenaikan yakni dari Rp. 54,18 triliun pada tahun 2011 menjadi Rp. 57,69 triliun pada tahun 2012
Sumber : BPS

26
CAPAIAN 2010-2012 DAN TARGET 2013-2014TINGKAT KONSUMSI IKAN
2010 2011 2012 2013 *
2014 *
30.00
31.00
32.00
33.00
34.00
35.00
36.00
37.00
38.00
39.00
30.48
32.25
33.89
35.14
38.00
Kg/k
apita
* Angka target
• Tingkat konsumsi ikan 2010-2012 rata-rata naik sebesar 5,44% per tahun
• Tingkat konsumsi ikan belum merata di setiap daerah, sehingga perlu terus memasyarakatkan Gemarikan

27
CAPAIAN 2010-2012 DAN TARGET 2013-2014PRODUKSI PERIKANAN
2010 2011 2012 2013 * 2014 *0.00
5.00
10.00
15.00
20.00
25.00
5.38 5.41 5.81 5.47 5.50
6.286.98
9.45
13.02
16.89
11.66 12.39
15.26
18.49
22.39
Perikanan Tangkap Perikana BudidayaTotal Produksi Perikanan
Juta
ton
* Angka target
Produksi perikanan tangkap, termasuk produksi penangkapan di perairan umum daratan dan laut lepas
Produksi perikanan budidaya meningkat lebih tinggi dibandingkan dengan produksi perikanan tangkap
Peningkatan produksi perikanan harus diikuti dengan pengembangan pasar domestik dan internasional
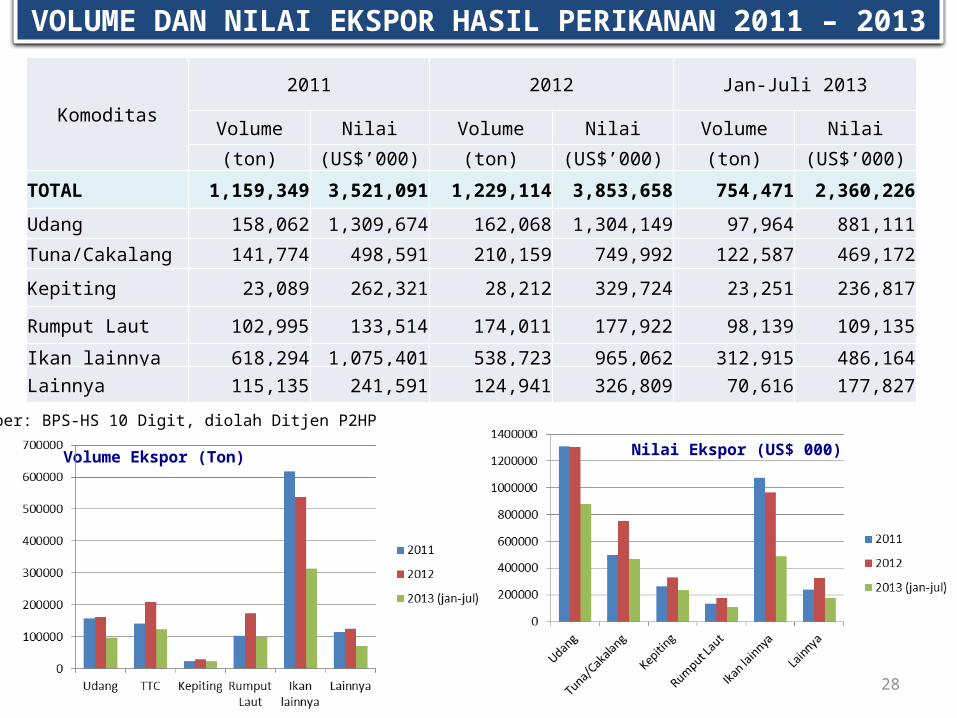
VOLUME DAN NILAI EKSPOR HASIL PERIKANAN 2011 – 2013
Sumber: BPS-HS 10 Digit, diolah Ditjen P2HP
Komoditas
2011 2012 Jan-Juli 2013
Volume Nilai Volume Nilai Volume Nilai
(ton) (US$’000) (ton) (US$’000) (ton) (US$’000)
TOTAL 1,159,349 3,521,091 1,229,114 3,853,658 754,471 2,360,226
Udang 158,062 1,309,674 162,068 1,304,149 97,964 881,111
Tuna/Cakalang 141,774 498,591 210,159 749,992 122,587 469,172
Kepiting 23,089 262,321 28,212 329,724 23,251 236,817
Rumput Laut 102,995 133,514 174,011 177,922 98,139 109,135
Ikan lainnya 618,294 1,075,401 538,723 965,062 312,915 486,164
Lainnya 115,135 241,591 124,941 326,809 70,616 177,827
Volume Ekspor (Ton) Nilai Ekspor (US$ 000)
28

VOLUME IMPOR HASIL PERIKANANTahun 2011, 2012 dan 2013 (per Juni)
• Volume impor hasil perikanan mengalami penurunan dibandingkan dengan tahun sebelumnya
Tahun 2011 : 431,8 ribu ton Tahun 2012 : 337,4 ribu ton Tahun 2013 (s.d Juni) : 155,9 ribut ton
• Telah terjadi penurunan volume impor untuk tepung ikan, agar-agar, dan ikan segar/beku.
• Impor masih dilakukan terhadap produk yang tidak dapat diproduksi di dalam negeri untuk kebutuhan horeka dan bahan baku pengolahan untuk tujuan ekspor
KOMODITAS UTAMA VOLUME (Kg) NILAI (US$)
2011 2012 2013 (SAMPAI JUNI) 2011 2012 2013 (SAMPAI JUNI)
1. Tepung Ikan 63.545.475 51.837.136 19.782.410 44.536.396 60.416.331 24.864.280
2. Makanan Udang 2.421.902 2.065.381 2.257.377 2.280.324 2.250.900 2.075.540
3. Tepung Udang/lainnya 100.720.167 211.417 31.804 112.105.142 2.012.661 222.201
4. Agar - agar 903.860 714.037 208.760 3.742.545 964.238 365.598
5. Ikan Segar/beku 212.534.714 143.222.374 71.465.870 177.879.296 137.339.001 70.880.565
6. Ikan kering/Asin 8.235.746 8.049 16.739 8.668.438 78.082 111.670
7. Ikan Dalam Kaleng 3.177.886 2.895.049 1.740.771 7.631.475 7.486.375 3.876.529
8. Lemak dan Minyak Ikan 11.087.381 12.380.555 3.280.702 28.061.739 23.880.883 8.759.225
9. Hasil perikanan Lainnya 29.243.464 124.026.022 57.112.903 103.445.943 177.933.794 85.471.152
431.870.595 337.360.020 155.897.336 488.351.298 412.362.265 196.626.760
29

DEVELOPMENT OF NATIONAL FISH LOGISTIC SYSTEM (SLIN) SUPPORTING NATIONAL PRIORITY PROGRAM
Medan
Pakanbaru
Palembang
Lampung
JakartaSurabaya Makasar
Kendari
Banggai
Ambon
BitungTernate
SorongBalikpapan
Toli-Toli
BanyuwangiJember
Semarang
Tasikmalaya
Serang
LamonganBandung
SukabumiBogor
Bau-BauButon
Aceh
LIN UP4BMP3EI
MINAPOLITAN, MP3KI-PENINGKATAN KEHIDUPAN NELAYAN
EXCELLENT PRODUCTS
& ZONE BASE
Ket : 20132014Tahap selanjutnya
Timika
Merauke
30

NATIONAL FISH LOGISTIC SYSTEM DEVELOPMENT
31

IMPLEMENTATION SLIN CONCEPT FASE IKENDARI-BANGGAI & MALUKU CORRIDOR, 2013
Koridor Banggai Kepulauan*)Kondisi Intervensi Fasilitas
Komoditas unggulan: Pelagis Kecil (Layang, Sardine)
Ada komitmen Pemda mengelola rantai pasok
• Pabrik es• ABF• Gudang Dingin• Kendaraan angkut es• Kendaraan berinsulasi*) hasil FGD
Koridor Kendari (PPS Kendari) *)Kondisi Intervensi Fasilitas*)
Komoditas: Pelagis Kecil (Layang, Sardine,) , Tuna, Tongkol, Cakalang
Masalah: BBM , rumpon, armada dan sarana pendngin
Ada komitmen Pemda mengelola rantai pasok
• Pengembangan dermaga (jetty)
• Pembangunan Pabrik es, gudang dingin 500 ton & ABF
• Kendaraan angkut es• Kendaraan berinsulasi*) hasil FGD
Surabaya-BrondongKondisi Pengembangan
Tersedia fasilitas PPDI Brondong
Pabrik es &ABFGudang DinginKendaraan
berinsulasi
Jakarta (PPS Nizam Zachman)Kondisi Pengembangan
• Serapan pasar tradisional dan modern tinggi
• Fasilitas logistik perikanan relatif lengkap
Gudang Dingin 4.000 ton
Kendaraan berinsulasi
Koridor Ambon (PPN Ambon) *)Kondisi Intervensi Fasilitas
Integrasi dengan Program LIN (Lumbung Ikan Nasional)
Komoditas unggulan tun, tongkol, cakalang
Pabrik esABFGudang DinginKendaraan angkut esKendaraan berinsulasi*) hasil FGD
Sentra produksi ikan
Sentra produksi/distribusi ikan
Banggai
Ambon
Surabaya
Jakarta
Kendari
32