1 measuring global interactions global participation -...
TRANSCRIPT

Global participation011 Measuring global interactions
GlobalisationWhat is globalisation?The word globalisation was not in common usage until about 1960. In 1961
Webster became the fi rst major dictionary to give a defi nition of globalisation.
However, the word was not recognised as academically signifi cant until the
early to mid 1980s. Since then its use has increased dramatically. Some see the
concept of globalisation as the key idea by which we understand the transition
of human society into the third millennium. Figure 1 shows how the number of
articles mentioning ‘globalisation’ in The Economist changed between 1979 and
2009. There was a dramatic rise in the mid 1990s compared with the
earlier period.
The International Baccalaureate (IB) syllabus uses the International Monetary
Fund (IMF) defi nition of globalisation, which is: ‘The growing interdependence
of countries worldwide through the increasing volume and variety of cross-
border transactions in goods and services and of international capital fl ows,
and through the more rapid and widespread diffusion of technology.’ The IB
is an example of educational globalisation, with schools from a large number
of countries following its courses. Almost 3000 schools in over 130 countries
now offer IB programmes. The photo below shows a leading IB school in Basle,
Switzerland, which has hosted international conferences about the IB.
KEY QUESTIONS• What is globalisation?• What are the merits and
limitations of the main globalisation indices?
• How can these indices be represented spatially?
1.1p
McDonald’s in Beijing – McDonald’s is perhaps the most well-known symbol of globalisation.
1
A leading IB school in Basle, Switzerland.
www.cambridge.org© in this web service Cambridge University Press
Cambridge University Press978-0-521-14732-3 - Geography for the IB Diploma Global InteractionsPaul GuinnessExcerptMore information

1 Measuring global interactions2
Globalisation is a very controversial process. Some see it as
a generally positive process, but there are others who are
very concerned about the ways in which globalisation is
operating (Figure 2). Critics see it as justifying the spread
of Western culture and capitalism. To counter this a
formidable anti-capitalism movement has developed in
recent decades.
The global economyFigure 3 shows Peter Dicken’s view of the global
economy. Transnational corporations (TNCs) and
nation-states are the two major shapers of the global
economy. They are embedded within a triangular nexus
of interactions consisting of fi rm–fi rm, state–state and
fi rm–state relationships. The impact of such relationships
is evident at all scales: local, national and global. Advances
in technology have been vital in establishing and
strengthening such relationships.
Nation-states individually and collectively set the rules for
the global economy but the bulk of investment is through
TNCs, which are the main drivers of global shift. It is this
process that has resulted in the emergence of an increasing
160
140
120
100
80
60
40
20
0
Num
ber
Year
19
79
19
80
19
81
19
82
19
83
19
84
19
85
19
86
19
87
19
88
19
89
19
90
19
91
19
92
19
93
19
94
19
95
19
96
19
97
19
98
19
99
20
00
20
01
20
02
20
03
20
04
20
05
20
06
20
07
20
08
20
09
Figure 1 Articles in The Economist that mention ‘globalisation’.
‘Globalisation has the potential to bring major improvements in productivity, innovation and creativity. But it’s being overshadowed by a corporate-led plan for economic integration which threatens to undermine the whole project. Instead of helping build a better world for all, the current free-market model is eroding both democracy and equity.’
W. Ellwood, The No-Nonsense Guide to Globalisation
‘Globalisation is a myth due to economic illiteracy. It comes down to mass ignorance.’
Alan Rugman, Oxford University management scholar
‘The world’s corporate and political leadership is undertaking a restructuring of global politics and economics that may prove as historically signifi cant as any event since the Industrial Revolution. This restructuring is happening at tremendous speed, with little public disclosure of its profound consequences aff ecting democracy, human welfare, local economics, and the natural world.’
The International Forum on Globalisation
‘Although there are undoubtedly globalising forces at work we do not have a fully globalised world economy.’
Peter Dicken, Global Shift
‘Globalisation does not necessarily imply homogenisation or integration. It merely implies greater connectedness and de-territorialisation.’
Malcolm Waters, Globalisation
Figure 2 Some views on globalisation.
There is a wide variety of defi nitions of globalisation as this is a concept that spans so many subjects and aff ects virtually every country in the world to some degree. Defi nitions can be considerably infl uenced by the perspective of the writer. On what basis can we choose between competing defi nitions and why might it be important to do so?
There is a w
Theory of Knowledge
Look at a variety of magazines covering a range of subjects in your school library. How many articles are there covering some aspect of globalisation? Make a list and discuss it in class.
Look at a variety of magazines covering a
Research idea
www.cambridge.org© in this web service Cambridge University Press
Cambridge University Press978-0-521-14732-3 - Geography for the IB Diploma Global InteractionsPaul GuinnessExcerptMore information

301 Global participation
number of newly industrialised countries (NICs) since
the 1960s. Under this process, manufacturing industries
at fi rst and more recently services have relocated in
signifi cant numbers from developed countries to selected
developing countries.
In Asia four generations of NIC can be recognised in terms
of the timing of industrial development and their current
economic characteristics. Within this region, only Japan is at
a higher economic level than the NICs (Table 1) because it is
a long-standing developed country, but there are a number
of countries at much lower levels of economic development.
The latter form the poorest nations in the region.
Nowhere else in the world is the fi lter-down concept of
industrial location better illustrated than in Asia. When
Japanese companies fi rst decided to locate abroad in the
quest for cheap labour, they looked to the most developed
of their neighbouring countries, particularly South Korea
and Taiwan.
What were the reasons for the phenomenal rates of
economic growth recorded in South Korea, Taiwan, Hong
Kong and Singapore from the 1960s? What was it that
set this group of ‘Asian tigers’ apart from so many others?
From the vast literature that has appeared on the subject
the following factors are usually given prominence:
• A good initial level of hard and soft infrastructure provided
the preconditions for structural economic change.
• As in Japan previously, the land-poor NICs stressed
people as their greatest resource, particularly
through the expansion of primary and secondary
education but also through specialised programmes to
develop scientifi c, engineering and technical skills.
THE NATIONALECONOMY
THE GLOBALECONOMY
Global shifts in the production of goods and services; the emergence of new centres of production; intensification of global competition.
Cultural, social, political structures and institutions. The economic system; firm structures, institutional and regulatory frameworks. 'Natural' and created comparative advantage (resources, skills, knowledge base, infrastructure), etc.
Emergence of 'new' global financial system generating unprecedented flows and transactions across national boundaries.
Transnational corporationsProliferation, spread and restructuring of transnational corporations involving more diverse network forms of organisation; strategies of globalisation/ localisation.
Nation-statesMacroeconomic, trade, industry and investment policies of nation states; trade conflicts; regional economic integration.
THE LOCALECONOMY
The place-specific assemblage of cultural, social, political and economic attributes. Local economic structure; knowledge and skill base; the local institutional structure; quality of infrastructure, etc.
TechnologyThe volatile technological environment; incremental and revolutionary technological change; new generic technologies; space-shrinking technologies; new flexible processes of production and organisation.
Figure 3 The globalising process as a system of interconnected elements and scales.
Level Countries GNP per capita 2005 ($)
1 Japan: a developed country
38 984
2 First generation NICs, e.g. Taiwan
16 764
3 Second generation NICs, e.g. Malaysia
4 963
4 Third generation NICs, e.g. China
1 735
5 Fourth generation NICs, e.g. Vietnam
623
6 Poorest countries, e.g. Mongolia
380
Table 1 Countries at diff erent levels of economic development.
Beijing street market: China is a third generation NIC.
www.cambridge.org© in this web service Cambridge University Press
Cambridge University Press978-0-521-14732-3 - Geography for the IB Diploma Global InteractionsPaul GuinnessExcerptMore information

1 Measuring global interactions4
• Cultural traditions in these countries revere education
and achievement.
• The Asian NICs became globally integrated at a
‘moment of opportunity’ in the structure of the world
system, distinguished by the geostrategic and economic
interests of core capitalist countries (especially the USA
and Japan) in extending their infl uence in East and
South-east Asia.
• All four countries had distinct advantages in terms
of geographical location. Singapore is strategically
situated to funnel trade fl ows between the Indian and
Pacifi c Oceans and its central location in the region
has facilitated its development as a major fi nancial,
commercial and administrative/managerial centre.
Hong Kong has benefi ted from its position astride the
trade routes between North-east and South-east Asia,
as well as acting as the main link to the outside world
for south-east China. South Korea and Taiwan were
ideally located to expand trade and other ties with
Japan.
• The ready availability of bank loans, often extended
at government behest and at attractive interest rates,
allowed South Korea’s chaebol in particular to pursue
market share and to expand into new fi elds.
Most other countries in the region lacked the physical
infrastructure and skill levels required by Japanese
companies. Companies from elsewhere in the developed
world, especially the USA, also recognised the advantages
of locating branch plants in such countries. As the
economies of the fi rst generation NICs developed, the level
of wages increased, resulting in:
• Japanese and Western TNCs seeking locations in
second generation NICs where improvements in
physical and human infrastructures now satisfi ed their
demands but where wages were still low
• indigenous companies from the fi rst generation NICs
also moving routine tasks to their cheaper labour
neighbours such as Malaysia and Thailand.
With time, the process also included the third generation
NICs, a signifi cant factor in the recent very high growth
rates in China and India. The least developed countries in
the region, nearly all hindered by confl ict of one sort or
another at some time in recent decades, are now beginning
to be drawn into the system. The recent high level of
investment into Vietnam makes it reasonable to think
of the country as an example of a fourth generation
Asian NIC.
As their industrialisation processes have matured, the NICs
have occupied a more intermediate position in the regional
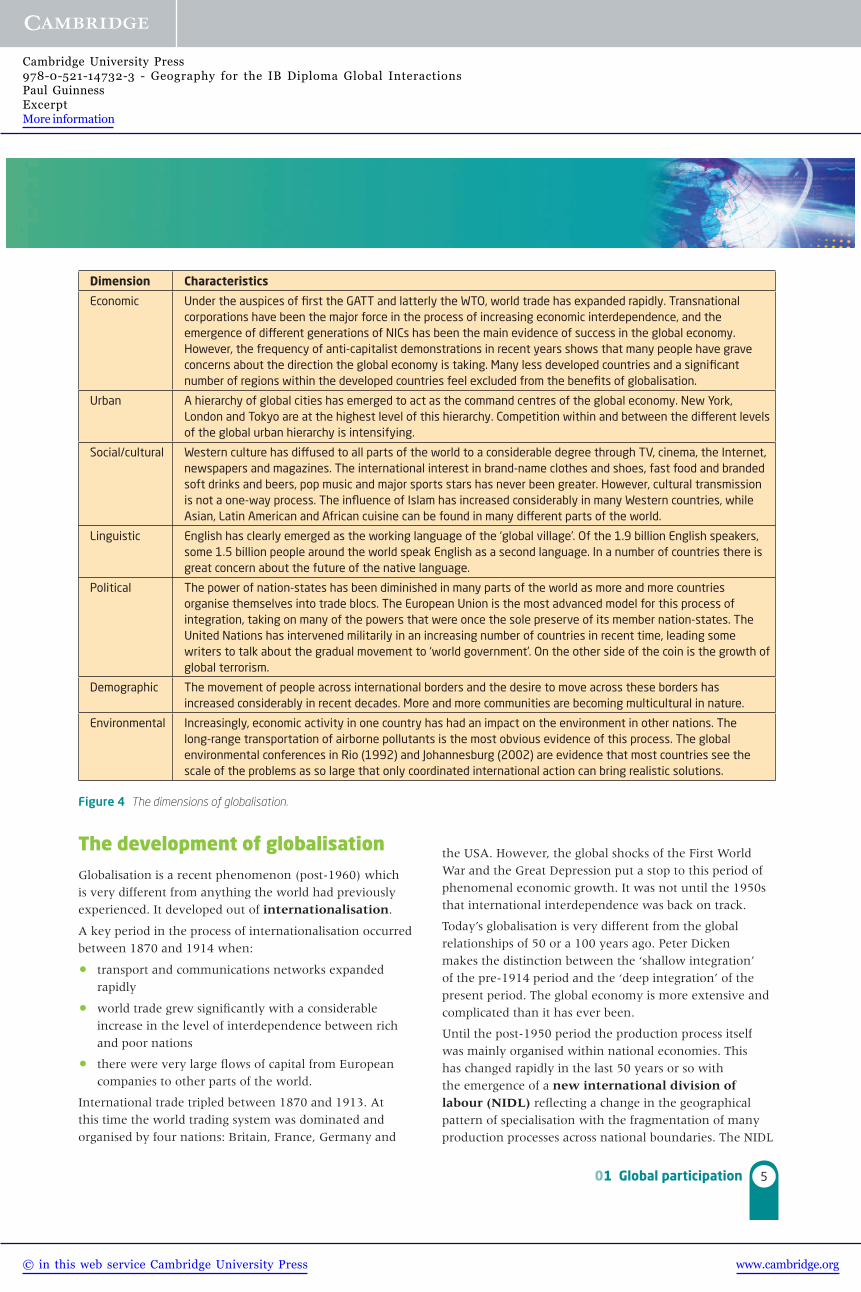
The dimensions of globalisationThe ties that bind the world together are, fi rst, the
economic ones (Figure 4) of trade, investment and
migration. The movement of goods, money and people
around the globe brings far-off places closer together. The
World Trade Organisation – the successor of the General
Agreement on Tariffs and Trade (GATT) – has played a vital
(and controversial) role in the increase in world trade.
Relationships are also political. The increasing role played
by the United Nations (UN) around the world epitomises
the developing cooperation between nations even if the
outcome of peacekeeping operations sometimes fails to
match the original objective. The period after the Second
World War has also witnessed the rapid development of
trade blocs. Most countries are now in some sort of trade
agreement with their regional neighbours. The European
Union is the most advanced model of this important
phenomenon.
Taking water home from a well – rural Mongolia, one of the poorest countries in Asia.
Geographical skill
Look at Figure 4. If you are in a classroom with others, divide into groups, with each group discussing one dimension of globalisation. From the existing knowledge of each group, try to elaborate on the information given in the chart. Report back on your conclusions.
division of labour between Japan and other less developed
Asian countries.
www.cambridge.org© in this web service Cambridge University Press
Cambridge University Press978-0-521-14732-3 - Geography for the IB Diploma Global InteractionsPaul GuinnessExcerptMore information
501 Global participation
The development of globalisationGlobalisation is a recent phenomenon (post-1960) which
is very different from anything the world had previously
experienced. It developed out of internationalisation.
A key period in the process of internationalisation occurred
between 1870 and 1914 when:
• transport and communications networks expanded
rapidly
• world trade grew signifi cantly with a considerable
increase in the level of interdependence between rich
and poor nations
• there were very large fl ows of capital from European
companies to other parts of the world.
International trade tripled between 1870 and 1913. At
this time the world trading system was dominated and
organised by four nations: Britain, France, Germany and
the USA. However, the global shocks of the First World
War and the Great Depression put a stop to this period of
phenomenal economic growth. It was not until the 1950s
that international interdependence was back on track.
Today’s globalisation is very different from the global
relationships of 50 or a 100 years ago. Peter Dicken
makes the distinction between the ‘shallow integration’
of the pre-1914 period and the ‘deep integration’ of the
present period. The global economy is more extensive and
complicated than it has ever been.
Until the post-1950 period the production process itself
was mainly organised within national economies. This
has changed rapidly in the last 50 years or so with
the emergence of a new international division of labour (NIDL) refl ecting a change in the geographical
pattern of specialisation with the fragmentation of many
production processes across national boundaries. The NIDL
Figure 4 The dimensions of globalisation.
Dimension Characteristics
Economic Under the auspices of fi rst the GATT and latterly the WTO, world trade has expanded rapidly. Transnational corporations have been the major force in the process of increasing economic interdependence, and the emergence of diff erent generations of NICs has been the main evidence of success in the global economy. However, the frequency of anti-capitalist demonstrations in recent years shows that many people have grave concerns about the direction the global economy is taking. Many less developed countries and a signifi cant number of regions within the developed countries feel excluded from the benefi ts of globalisation.
Urban A hierarchy of global cities has emerged to act as the command centres of the global economy. New York, London and Tokyo are at the highest level of this hierarchy. Competition within and between the diff erent levels of the global urban hierarchy is intensifying.
Social/cultural Western culture has diff used to all parts of the world to a considerable degree through TV, cinema, the Internet, newspapers and magazines. The international interest in brand-name clothes and shoes, fast food and branded soft drinks and beers, pop music and major sports stars has never been greater. However, cultural transmission is not a one-way process. The infl uence of Islam has increased considerably in many Western countries, while Asian, Latin American and African cuisine can be found in many diff erent parts of the world.
Linguistic English has clearly emerged as the working language of the ‘global village’. Of the 1.9 billion English speakers, some 1.5 billion people around the world speak English as a second language. In a number of countries there is great concern about the future of the native language.
Political The power of nation-states has been diminished in many parts of the world as more and more countries organise themselves into trade blocs. The European Union is the most advanced model for this process of integration, taking on many of the powers that were once the sole preserve of its member nation-states. The United Nations has intervened militarily in an increasing number of countries in recent time, leading some writers to talk about the gradual movement to ‘world government’. On the other side of the coin is the growth of global terrorism.
Demographic The movement of people across international borders and the desire to move across these borders has increased considerably in recent decades. More and more communities are becoming multicultural in nature.
Environmental Increasingly, economic activity in one country has had an impact on the environment in other nations. The long-range transportation of airborne pollutants is the most obvious evidence of this process. The global environmental conferences in Rio (1992) and Johannesburg (2002) are evidence that most countries see the scale of the problems as so large that only coordinated international action can bring realistic solutions.
www.cambridge.org© in this web service Cambridge University Press
Cambridge University Press978-0-521-14732-3 - Geography for the IB Diploma Global InteractionsPaul GuinnessExcerptMore information
1 Measuring global interactions6
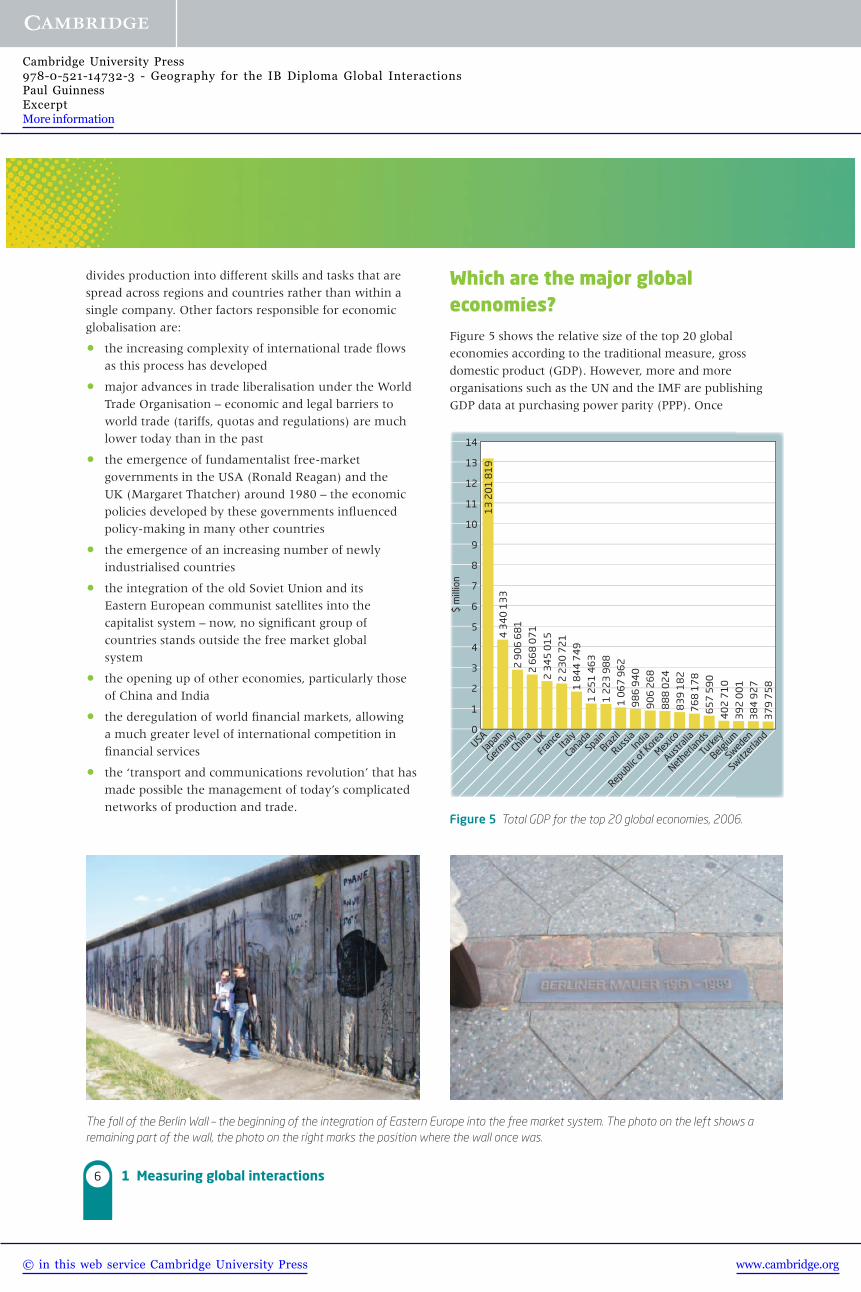
Which are the major global economies?Figure 5 shows the relative size of the top 20 global
economies according to the traditional measure, gross
domestic product (GDP). However, more and more
organisations such as the UN and the IMF are publishing
GDP data at purchasing power parity (PPP). Once
divides production into different skills and tasks that are
spread across regions and countries rather than within a
single company. Other factors responsible for economic
globalisation are:
• the increasing complexity of international trade fl ows
as this process has developed
• major advances in trade liberalisation under the World
Trade Organisation – economic and legal barriers to
world trade (tariffs, quotas and regulations) are much
lower today than in the past
• the emergence of fundamentalist free-market
governments in the USA (Ronald Reagan) and the
UK (Margaret Thatcher) around 1980 – the economic
policies developed by these governments infl uenced
policy-making in many other countries
• the emergence of an increasing number of newly
industrialised countries
• the integration of the old Soviet Union and its
Eastern European communist satellites into the
capitalist system – now, no signifi cant group of
countries stands outside the free market global
system
• the opening up of other economies, particularly those
of China and India
• the deregulation of world fi nancial markets, allowing
a much greater level of international competition in
fi nancial services
• the ‘transport and communications revolution’ that has
made possible the management of today’s complicated
networks of production and trade.
The fall of the Berlin Wall – the beginning of the integration of Eastern Europe into the free market system. The photo on the left shows a remaining part of the wall, the photo on the right marks the position where the wall once was.
14
13
12
11
10
9
8
7
6
5
4
3
2
1
0
$ m
illio
n
USAJap
an
German
yChina UK
France
Italy
Canad
aSpain
Brazil
Russia
India
Republic of K
orea
Mexico
Australi
a
Netherla
nds
Turkey
Belgium
Sweden
Switzerla
nd
13
20
1 8
19
4 3
40
13
3
2 9
06
68
1
2 6
68
07
1
2 3
45
01
5
2 2
30
72
1
1 8
44
74
9
1 2
51
46
3
1 2
23
98
8
1 0
67
96
2
98
6 9
40
90
6 2
68
88
8 0
24
83
9 1
82
76
8 1
78
65
7 5
90
40
2 7
10
39
2 0
01
38
4 9
27
37
9 7
58
Figure 5 Total GDP for the top 20 global economies, 2006.
www.cambridge.org© in this web service Cambridge University Press
Cambridge University Press978-0-521-14732-3 - Geography for the IB Diploma Global InteractionsPaul GuinnessExcerptMore information

701 Global participation
The KOF Index of GlobalisationThe KOF Index of Globalisation measures globalisation
on economic, social and political dimensions. It was fi rst
published in 2002. The KOF Index defi nes globalisation as:
the process of creating networks of connections among
actors at multi-continental distances, mediated through
a variety of fl ows including people, information and
ideas, capital and goods. Globalisation is conceptualised
as a process that erodes national boundaries, integrates
national economies, cultures, technologies and
governance and produces complex relations of mutual
interdependence.
The KOF Index measures globalisation on a scale of 1 to
100 with the underlying variables entered in percentiles.
Higher values denote greater globalisation. The weightings
for calculating the sub-indices are determined using
principal components analysis. Under this method the
impact of extreme data points is reduced, also ensuring
fewer fl uctuations over time.
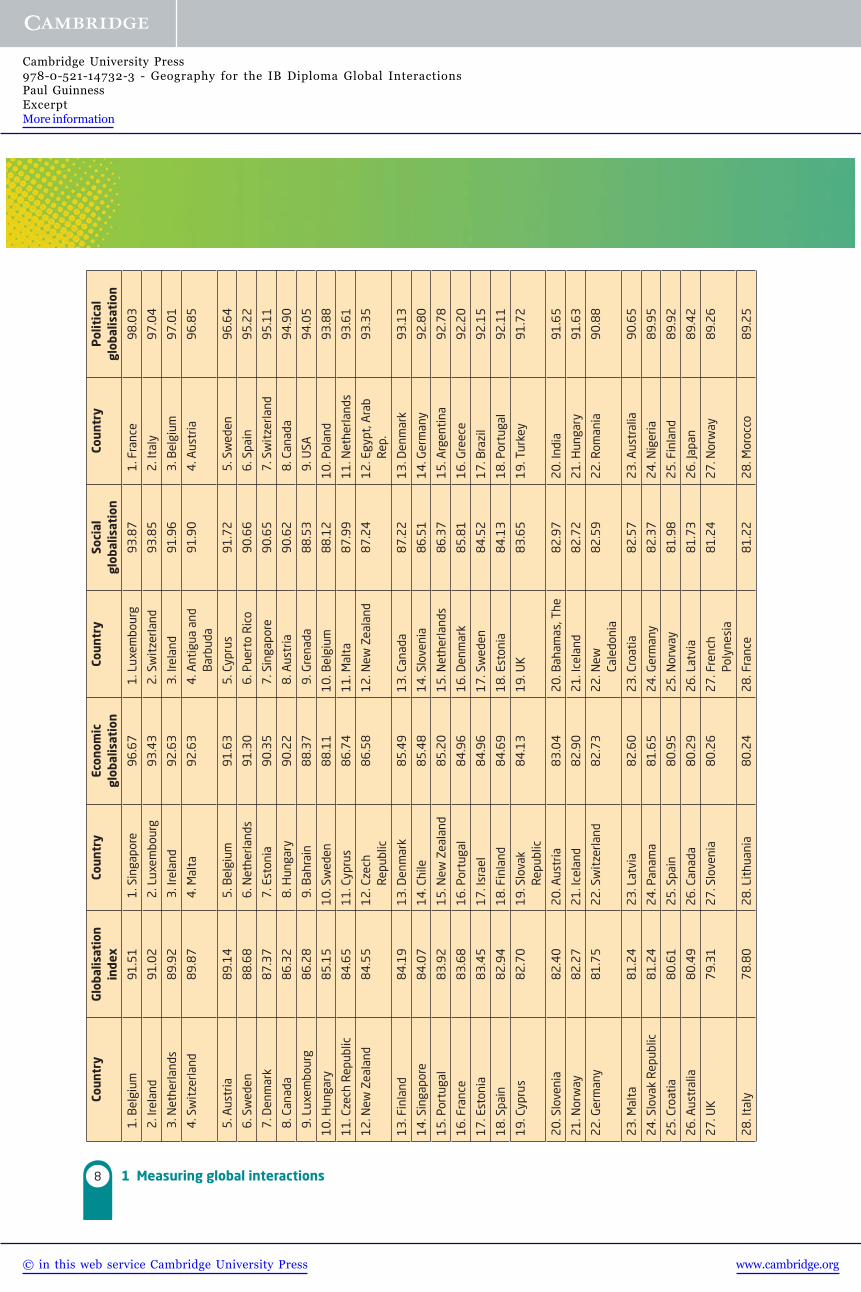
Table 2 (on pages 8–9) shows the rankings of the top 50
countries for 2009 which are based on 2006 data. The second
column shows the fi gures for the total globalisation index,
What is the diff erence between the phases of internationalisation and of globalisation?What is the diff erence between the phases of
Discussion point
1 Defi ne the term ‘globalisation’. 2 a Describe the data presented in Figure 1. b Suggest reasons for the changes indicated in Figure 1. 3 Defi ne the terms: a ‘capitalism’ b ‘anti-capitalism’. 4 Comment briefl y on the views of globalisation
presented in Figure 2. 5 Study Figure 3. a List the main components of the global economy. b Briefl y comment on the relationships between them. 6 Defi ne the terms: a ‘transnational corporation’ b ‘global shift’. 7 a What are newly industrialised countries (NICs)? b Describe and explain the diff erent generations of
newly industrialised country shown in Table 1. 8 Explain the ‘new international division of labour’ (NIDL). 9 Briefl y discuss the factors responsible for economic
globalisation.10 a Describe the data presented in Figure 5. b Why do the amounts and rankings in Figure 6 diff er
from those in Figure 5?
1 Define the term ‘globalisati
Activities
14
13
12
11
10
9
8
7
6
5
4
3
2
1
0
$ m
illio
n
USAChina
IndiaJap
an
German
y UK
France
ItalyBraz
il
RussiaSpain
Mexico
Republic of K
orea
Canad
a
Indonesia
Australi
a
Turkey
Argentin
a
Thailan
d
Netherla
nds
13
20
1 8
19
10
0 0
48
02
64
24
7 3
61
4 1
31
19
5
2 6
16
04
4
2 1
11
58
12
03
9 1
71
1 7
95
43
7
1 7
08
43
4
1 7
04
75
61
24
3 4
40
1 2
01
83
8
1 1
52
35
6
1 1
40
44
59
21
24
1
72
8 3
40
66
1 7
36
61
7 9
10
60
3 9
37
59
2 9
58
Figure 6 Purchasing power parity (PPP) GDP for the top 20 global economies, 2006.
differences in the local purchasing power of currencies are
taken into account, China’s economy moves fi rmly into
second place behind the USA (Figure 6). The other major
emerging economy whose relative importance increases
signifi cantly once output is measured on a PPP basis is India.
Globalisation indicesThere are a number of ways of measuring globalisation.
Two of the most prominent methods are the KOF Index
provided by the KOF Swiss Institute of Technology Zurich
and the A.T. Kearney index published in Foreign Affairs
magazine, a US publication. Another interesting analysis is
produced by the Centre for the Study of Globalisation and
Regionalisation (CSGR), based at the University of Warwick.
www.cambridge.org© in this web service Cambridge University Press
Cambridge University Press978-0-521-14732-3 - Geography for the IB Diploma Global InteractionsPaul GuinnessExcerptMore information
1 Measuring global interactions8
Coun
try
Glo
balis
atio
n in
dex
Coun
try
Econ
omic
gl
obal
isat
ion
Coun
try
Soci
al
glob
alis
atio
nCo
untr
yP
olit
ical
gl
obal
isat
ion
1
. Bel
gium
91
.51
1
. Sin
gapo
re9
6.6
7
1. L
uxem
bour
g9
3.8
7
1. F
ranc
e9
8.0
3
2
. Ire
land
91
.02
2
. Lux
embo
urg
93
.43
2
. Sw
itze
rland
93
.85
2
. Ita
ly9
7.0
4
3
. Net
herla
nds
89
.92
3
. Ire
land
92
.63
3
. Ire
land
9
1.9
6
3. B
elgi
um9
7.0
1
4
. Sw
itze
rland
89
.87
4
. Mal
ta9
2.6
3
4. A
ntig
ua a
nd
Bar
buda
91
.90
4
. Aus
tria
96
.85
5
. Aus
tria
89
.14
5
. Bel
gium
91
.63
5
. Cyp
rus
91
.72
5
. Sw
eden
96
.64
6
. Sw
eden
88
.68
6
. Net
herla
nds
91
.30
6
. Pue
rto
Ric
o9
0.6
6
6. S
pain
95
.22
7
. Den
mar
k8
7.3
7
7. E
ston
ia9
0.3
5
7. S
inga
pore
90
.65
7
. Sw
itze
rland
95
.11
8
. Can
ada
86
.32
8
. Hun
gary
90
.22
8
. Aus
tria
90
.62
8
. Can
ada
94
.90
9
. Lux
embo
urg
86
.28
9
. Bah
rain
88
.37
9
. Gre
nada
88
.53
9
. USA
94
.05
10
. Hun
gary
85
.15
10
. Sw
eden
88
.11
10
. Bel
gium
88
.12
10
. Pol
and
93
.88
11
. Cze
ch R
epub
lic8
4.6
5
11
. Cyp
rus
86
.74
11
. Mal
ta8
7.9
91
1. N
ethe
rland
s9
3.6
1
12
. New
Zea
land
84
.55
12
. Cze
ch
Rep
ublic
86
.58
12
. New
Zea
land
87
.24
12
. Egy
pt, A
rab
Rep
.9
3.3
5
13
. Fin
land
84
.19
13
. Den
mar
k8
5.4
91
3. C
anad
a8
7.2
21
3. D
enm
ark
93
.13
14
. Sin
gapo
re8
4.0
71
4. C
hile
85
.48
14
. Slo
veni
a8
6.5
11
4. G
erm
any
92
.80
15
. Por
tuga
l8
3.9
21
5. N
ew Z
eala
nd8
5.2
01
5. N
ethe
rland
s8
6.3
71
5. A
rgen
tina
92
.78
16
. Fra
nce
83
.68
16
. Por
tuga
l8
4.9
61
6. D
enm
ark
85
.81
16
. Gre
ece
92
.20
17
. Est
onia
83
.45
17
. Isr
ael
84
.96
17
. Sw
eden
84
.52
17
. Bra
zil
92
.15
18
. Spa
in8
2.9
41
8. F
inla
nd8
4.6
91
8. E
ston
ia8
4.1
31
8. P
ortu
gal
92
.11
19
. Cyp
rus
82
.70
19
. Slo
vak
Rep
ublic
84
.13
19
. UK
83
.65
19
. Tur
key
91
.72
20
. Slo
veni
a8
2.4
02
0. A
ustr
ia8
3.0
42
0. B
aham
as, T
he8
2.9
72
0. I
ndia
91
.65
21
. Nor
way
82
.27
21
. Ice
land
82
.90
21
. Ice
land
82
.72
21
. Hun
gary
91
.63
22
. Ger
man
y8
1.7
52
2. S
wit
zerla
nd8
2.7
32
2. N
ew
Cale
doni
a8
2.5
92
2. R
oman
ia9
0.8
8
23
. Mal
ta8
1.2
42
3. L
atvi
a8
2.6
02
3. C
roat
ia8
2.5
72
3. A
ustr
alia
90
.65
24
. Slo
vak
Rep
ublic
81
.24
24
. Pan
ama
81
.65
24
. Ger
man
y8
2.3
72
4. N
iger
ia8
9.9
5
25
. Cro
atia
80
.61
25
. Spa
in8
0.9
52
5. N
orw
ay8
1.9
82
5. F
inla
nd8
9.9
2
26
. Aus
tral
ia8
0.4
92
6. C
anad
a8
0.2
92
6. L
atvi
a8
1.7
32
6. J
apan
89
.42
27
. UK
79
.31
27
. Slo
veni
a8
0.2
62
7. F
renc
h Po
lyne
sia
81
.24
27
. Nor
way
89
.26
28
. Ita
ly7
8.8
02
8. L
ithu
ania
80
.24
28
. Fra
nce
81
.22
28
. Mor
occo
89
.25
www.cambridge.org© in this web service Cambridge University Press
Cambridge University Press978-0-521-14732-3 - Geography for the IB Diploma Global InteractionsPaul GuinnessExcerptMore information

901 Global participation
29
. Leb
anon
78
.56
29
. UK
79
.30
29
. Cze
ch
Rep
ublic
80
.43
29
. Pak
ista
n8
8.8
1
30
. Pol
and
77
.96
30
. Jam
aica
78
.51
30
. Fin
land
80
.29
30
. Cze
ch
Rep
ublic
88
.53
31
. Lit
huan
ia7
7.2
43
1. N
orw
ay7
8.3
73
1. U
nite
d A
rab
Emira
tes
79
.80
31
. Chi
le8
7.2
3
32
. Gre
ece
77
.00
32
. Cro
atia
78
.28
32
. Leb
anon
78
.49
32
. Bul
garia
87
.16
33
. Mal
aysi
a7
6.2
43
3. A
ustr
alia
78
.04
33
. Por
tuga
l7
8.0
33
3. S
eneg
al8
7.0
9
34
. Lat
via
76
.14
34
. Mal
aysi
a7
8.0
33
4. S
pain
77
.62
34
. Tun
isia
87
.00
35
. Ice
land
76
.12
35
. Fra
nce
77
.57
35
. Slo
vak
Rep
ublic
77
.44
35
. Sou
th A
fric
a8
6.9
0
36
. Jor
dan
75
.51
36
. Bul
garia
76
.08
36
. Sey
chel
les
77
.16
36
. Ire
land
86
.72
37
. Chi
le7
4.9
93
7. P
olan
d7
4.9
33
7. A
ustr
alia
76
.89
37
. Kor
ea, R
ep.
86
.64
38
. USA
74
.93
38
. Ger
man
y7
4.5
03
8. B
rune
i D
arus
sala
m7
6.5
33
8. C
hina
86
.36
39
. Bul
garia
74
.85
39
. Ita
ly7
4.3
73
9. S
amoa
76
.46
39
. Jor
dan
85
.50
40
. Isr
ael
74
.69
40
. Kaz
akhs
tan
73
.98
40
. Hun
gary
76
.27
40
. Per
u8
5.2
8
41
. Bah
rain
72
.89
41
. Gre
ece
73
.54
41
. Lit
huan
ia7
6.1
34
1. A
lger
ia8
5.2
8
42
. Pan
ama
70
.88
42
. Jor
dan
73
.25
42
. Bar
bado
s7
5.9
84
2. K
enya
84
.60
43
. Bos
nia
and
Her
zego
vina
70
.81
43
. Trin
idad
and
To
bago
72
.71
43
. Mal
dive
s7
5.9
44
3. R
ussi
an
Fede
rati
on8
4.6
0
44
. Rom
ania
70
.58
44
. Om
an7
2.3
04
4. K
uwai
t7
5.7
24
4. I
ndon
esia
84
.59
45
. Ant
igua
and
B
arbu
da7
0.5
24
5. M
oldo
va7
1.3
14
5. Q
atar
75
.69
45
. Uru
guay
84
.52
46
. Jam
aica
69
.76
46
. Bot
swan
a7
0.5
74
6. M
aurit
ius
75
.64
46
. Phi
lippi
nes
84
.17
47
. Ukr
aine
69
.30
47
. Bos
nia
and
Her
zego
vina
70
.50
47
. Mac
ao, C
hina
74
.40
47
. Mal
aysi
a8
3.7
3
48
. Uni
ted
Ara
b Em
irate
s6
9.2
64
8. U
rugu
ay6
9.9
34
8. B
ahra
in7
4.3
14
8. G
hana
83
.30
49
. Mau
ritiu
s6
9.2
64
9. C
osta
Ric
a6
9.6
44
9. M
aced
onia
, FY
R7
4.0
34
9. U
krai
ne8
3.1
4
50
. Uru
guay
69
.14
50
. Tha
iland
69
.43
50
. Ita
ly7
2.3
85
0. S
lova
k R
epub
lic8
2.8
1
Tabl
e 2
200
9 KO
F In
dex
of G
loba
lisat
ion
– top
50
coun
trie
s.
Sour
ce: K
OF
Inde
x of
Glo
balis
atio
n 20
09
www.cambridge.org© in this web service Cambridge University Press
Cambridge University Press978-0-521-14732-3 - Geography for the IB Diploma Global InteractionsPaul GuinnessExcerptMore information

1 Measuring global interactions10
with the fi rst fi ve positions occupied by Belgium, Ireland,
Netherlands, Switzerland and Austria. The fi rst countries
of signifi cant population size to appear in the ranking are
France in 16th position and Germany in 22nd place.
The remaining columns of Table 2 give the top 50 positions
for economic, social and political globalisation which are
combined to arrive at the overall Index of Globalisation.
All countries in the top 50 have an index of over 69.0 for
the overall index. Indonesia, which is ranked 100th, and
Nepal, 150th, have respective fi gures of 57.66 and 39.65.
The bottom fi ve ranking countries in order of lowest fi rst
are Myanmar, Democratic Republic of the Congo, Burundi,
Niger and Rwanda. Figure 7 contrasts the 15 most and
least globalised countries in the world. The graphs show
the relative contributions of the three measures of
globalisation.
There are signifi cant variations between the columns.
Singapore is in 14th position on the overall globalisation
index, but ranks fi rst for economic globalisation, 7th
for social globalisation and only 125th for political
globalisation. The UK ranks 27th on the overall index,
29th for economic, 19th for social and 77th for political.
For both Singapore and the UK, their political rankings are
very different from their other rankings. In contrast, the
European Parliament building, Brussels: Belgium is the most globalised country in the world according to the KOF Index.
100908070605040302010
0
Inde
x
Belgium
5040302010
0
Inde
x
Myanmar
Irelan
d
Congo, Dem. R
ep.
Netherla
nds
Burundi
Switzerla
nd
Niger
Austria
Rwanda
Sweden
Central A
frica
n Republic
Denmark
Tajik
istan
Canad
a
Sudan
Luxe
mbourg
Nepal
Hungary
Banglad
esh
Czech
Republic
Sierra Le
one
New Zealand
Tanza
nia
Finland
Guinea-Biss
au
Singapore
Iran, Is
lamic
Rep.
Portugal
Yemen, R
ep.
a Most globalised
b Least globalised
Political
Missing data
Economic
Social
Figure 7 The world’s 15 most globalised and 15 least globalised countries.
USA ranks 9th for political globalisation, 56th for social
globalisation and 59th for economic globalisation. This gives
the USA an overall globalisation index ranking of 38th.
The lowest levels of globalisation under the KOF Index
are in Africa, the Middle East, South and South-east Asia,
and Latin America (with the exceptions of Chile and
Argentina).
Table 3 shows the indices and variables used to assess the
three dimensions of globalisation. Economic globalisation
is characterised as long-distance fl ows of goods, capital
and services, as well as information and perceptions that
accompany market exchanges. Economic globalisation is
subdivided into
• actual fl ows
• restrictions.
Actual economic fl ows include data on trade, foreign direct investment (FDI) and portfolio investment. Each
measure is given a weighting according to its perceived
importance. Economic restrictions on trade and capital
include hidden import barriers, mean tariff rate, taxes
on international trade and an index of capital controls.
For example, a country with higher tariffs than another
country is less globalised.
Social globalisation is expressed as the spread of ideas,
information, images and people. Three categories are
employed here:
• personal contacts
• information fl ows
• cultural proximity.
www.cambridge.org© in this web service Cambridge University Press
Cambridge University Press978-0-521-14732-3 - Geography for the IB Diploma Global InteractionsPaul GuinnessExcerptMore information

1101 Global participation
The personal contacts category attempts to capture direct
interaction among people living in different countries. It
includes international telecoms traffi c, the incoming and
outgoing tourism of a country, transfer payments between
countries, the foreign population as a percentage of total
population, and the number of international letters sent
and received.
The information fl ows category attempts to measure
the potential fl ow of ideas and images. It includes the
proportion of Internet users, the number of households
with a television set and volume of international
newspapers traded. Together, these variables illustrate
people’s potential for receiving news from other countries
which contributes to the global spread of ideas.
The concept of cultural proximity is more diffi cult to
calculate. It is important to use measures for which data is
widely available. Thus the indicators used by KOF are:
• the number of McDonald’s restaurants located in a
country per capita; this major US brand has become
synonymous with the process of globalisation
• the number of IKEA outlets per capita, with the same
rationale as for McDonald’s
• imported and exported books relative to GDP; this is
used as an indicator of the extent to which beliefs and
values move across national borders.
Political globalisation is characterised by the diffusion
of government policies. Membership of international
organisations is considered the most important of the
four measures used in this aspect of globalisation. This
is followed by the number of embassies in a country
because of the importance of face-to-face contact between
Table 3 2009 KOF Index – indices and variables.
Indices and variables Weights (%)
A Economic globalisation 37
i Actual fl ows 50
Trade (% of GDP) 19
Foreign direct investment, fl ows (% of GDP)
20
Foreign direct investment, stocks (% of GDP)
24
Portfolio investment (% of GDP) 17
Income payments to foreign nationals (% of GDP)
20
ii Restrictions 50
Hidden import barriers 22
Mean tariff rate 28
Taxes on international trade (% of current revenue)
27
Capital account restrictions 22
B Social globalisation 39
i Data on personal contact 33
Telecoms traffi c 26
Transfers (% of GDP) 3
International tourism 26
Foreign population (% of total population)
20
International letters per capita 25
ii Data on information fl ows 36
Internet users per 1000 people 36
Television per 1000 people 36
Trade in newspapers (% of GDP) 28
iii Data on cultural proximity 31
Number of McDonald’s restaurants per capita
43
Number of IKEA outlets per capita 44
Trade in books (% of GDP) 12
C Political globalisation 25
Membership in international organisations
25
Embassies in country 28
Participation in UN Security Council Missions
22
International treaties 25
Shoppers outside on IKEA store in Beijing.
www.cambridge.org© in this web service Cambridge University Press
Cambridge University Press978-0-521-14732-3 - Geography for the IB Diploma Global InteractionsPaul GuinnessExcerptMore information
1 Measuring global interactions12
government offi cials of different countries. Also included
are participation in UN Security Council Missions and the
number of international treaties signed by a country.
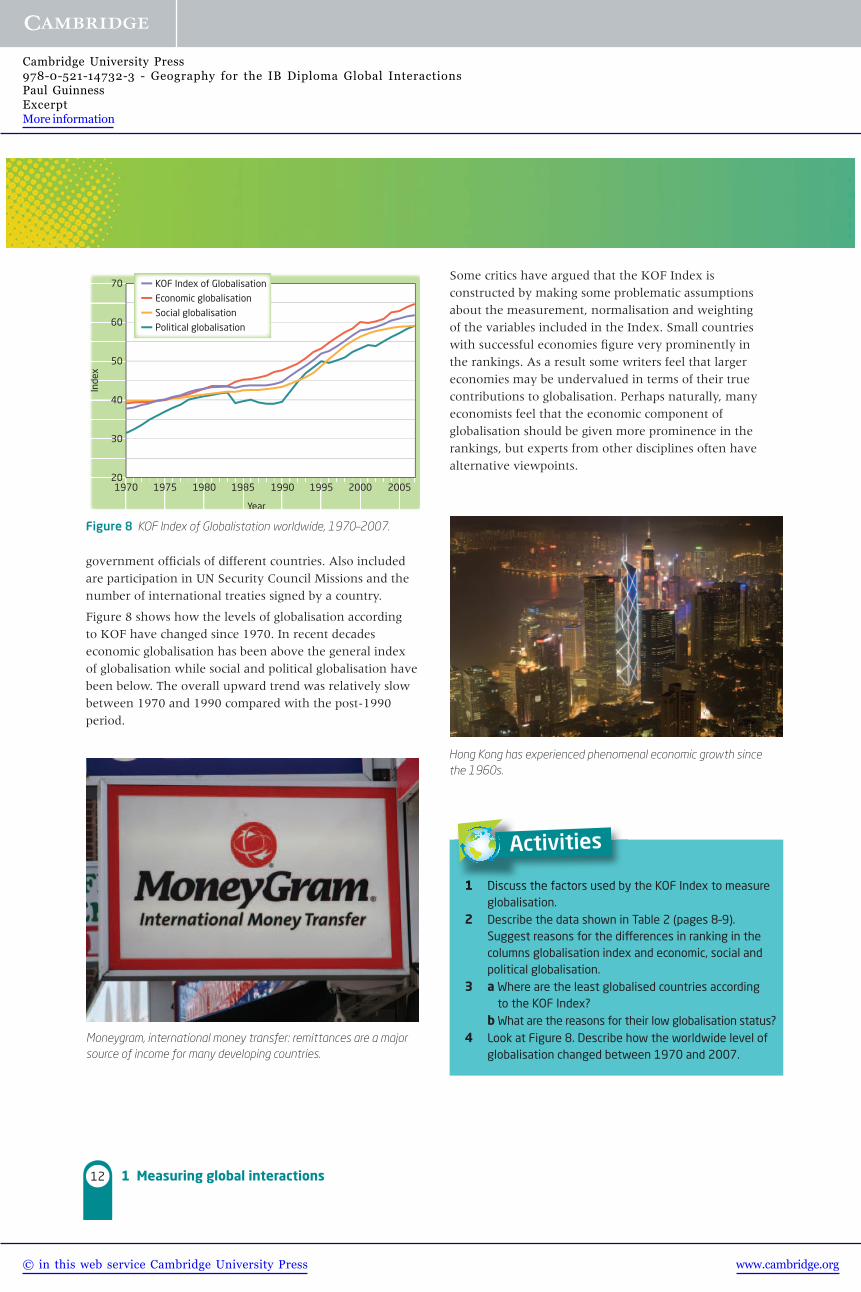
Figure 8 shows how the levels of globalisation according
to KOF have changed since 1970. In recent decades
economic globalisation has been above the general index
of globalisation while social and political globalisation have
been below. The overall upward trend was relatively slow
between 1970 and 1990 compared with the post-1990
period.
1 Discuss the factors used by the KOF Index to measure globalisation.
2 Describe the data shown in Table 2 (pages 8–9). Suggest reasons for the diff erences in ranking in the columns globalisation index and economic, social and political globalisation.
3 a Where are the least globalised countries according to the KOF Index?
b What are the reasons for their low globalisation status?4 Look at Figure 8. Describe how the worldwide level of
globalisation changed between 1970 and 2007.
1 Discuss the factors used by
Activities
Hong Kong has experienced phenomenal economic growth since the 1960s.
Figure 8 KOF Index of Globalistation worldwide, 1970–2007.
70
60
50
40
30
20
Inde
x
200520001990 19951985
Year
198019751970
KOF Index of Globalisation
Economic globalisation
Social globalisation
Political globalisation
Some critics have argued that the KOF Index is
constructed by making some problematic assumptions
about the measurement, normalisation and weighting
of the variables included in the Index. Small countries
with successful economies fi gure very prominently in
the rankings. As a result some writers feel that larger
economies may be undervalued in terms of their true
contributions to globalisation. Perhaps naturally, many
economists feel that the economic component of
globalisation should be given more prominence in the
rankings, but experts from other disciplines often have
alternative viewpoints.
Moneygram, international money transfer: remittances are a major source of income for many developing countries.
www.cambridge.org© in this web service Cambridge University Press
Cambridge University Press978-0-521-14732-3 - Geography for the IB Diploma Global InteractionsPaul GuinnessExcerptMore information

Key termsGlobalisation the growing interdependence of
countries worldwide through the increasing volume
and variety of cross-border transactions in goods
and services and of international capital fl ows, and
through the more rapid and widespread diffusion of
technology.
Capitalism the social and economic system which
relies on the market mechanism to distribute the
factors of production (land, labour and capital) in the
most effi cient way.
Anti-capitalism a broad term which can cover any
challenge to capitalism as the best or only way to
organise the world. It was given media prominence
during the 1999 WTO summit in Seattle where a
wide range of organisations protested against the
workings of the international economic system.
Transnational corporation (TNC) a fi rm that owns
or controls productive operations in more than one
country through foreign direct investment.
Global shift the large-scale fi lter-down of economic
activity from developed countries to NICs and
developing countries.
Newly industrialised countries (NICs) nations
that have undergone rapid and successful
industrialisation since the 1960s.
Internationalisation the extension of economic
activities across national boundaries. It is essentially
a quantitative process which leads to a more
extensive geographical pattern of economic activity.
The phase preceding globalisation.
New international division of labour (NIDL) this
divides production into different skills and tasks that
are spread across regions and countries rather than
within a single country.
Foreign direct investment (FDI) overseas
investments in physical capital by transnational
corporations.
01 Global participation 13
ReviewExamination–style question
1 a Describe how one prominent index measures
global interaction.
b How effective is this measure in comparing
the level of global interaction of different
countries?
Websiteswww.atkearney.comA.T. Kearney global management consultants
www.ifg.orgInternational Forum on Globalization
www.worldbank.orgWorld Bank
www.oecd.orgOrganisation for Economic Cooperation and Development
www.opendemocracy.netOpen Democracy
www.freetheworld.orgEconomic Freedom Network
www.cambridge.org© in this web service Cambridge University Press
Cambridge University Press978-0-521-14732-3 - Geography for the IB Diploma Global InteractionsPaul GuinnessExcerptMore information