1 nadine schubert instituto de ciencias del mar y limnología de la unam unidad de sistemas...
TRANSCRIPT
1Nadine SchubertInstituto de Ciencias del Mar y Limnología de la UNAM Unidad de Sistemas Arrecifales, Puerto Morelos, México
Part 2:Part 2: Photoacclimation and -adaptation Photoacclimation and -adaptation
PHOTOBIOLOGY PHOTOBIOLOGY
2
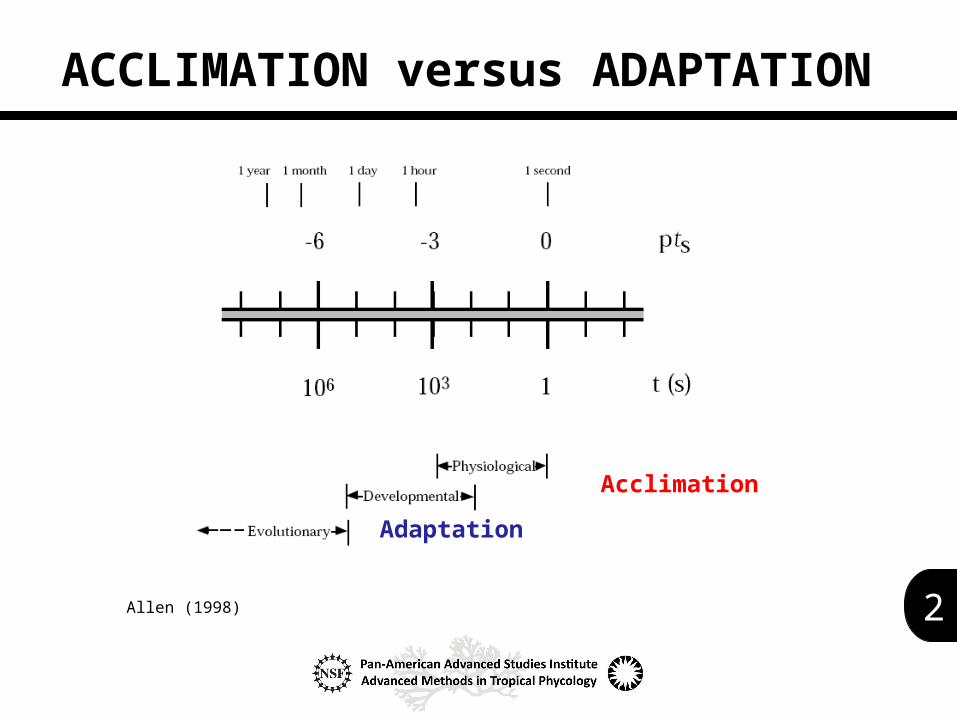
ACCLIMATION versus ADAPTATION
Allen (1998)
Acclimation
Adaptation
3
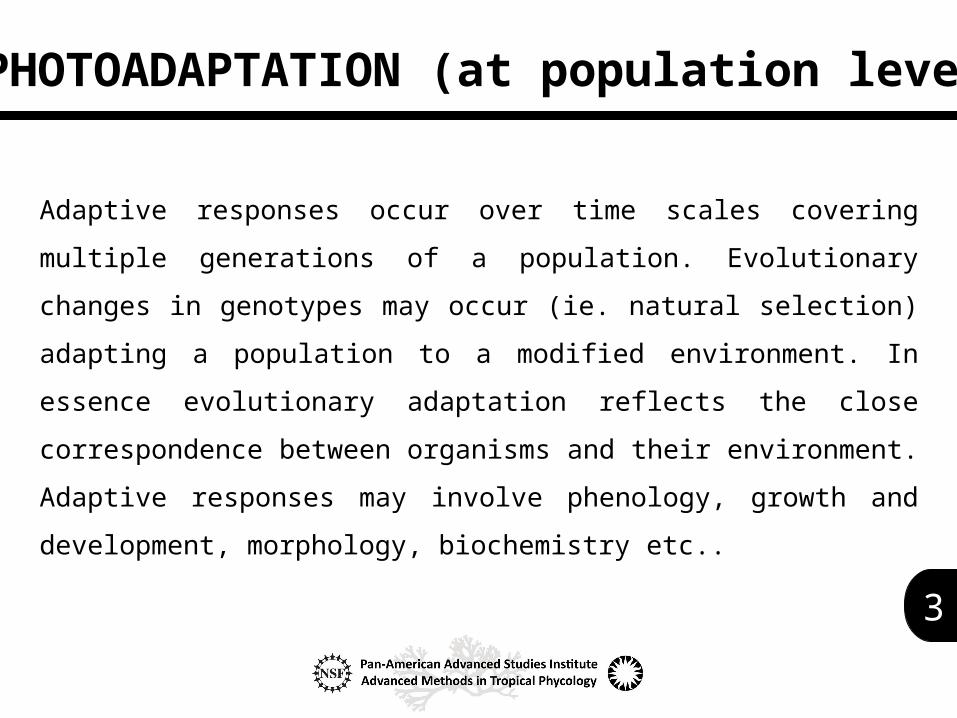
PHOTOADAPTATION (at population level)
Adaptive responses occur over time scales covering multiple generations
of a population. Evolutionary changes in genotypes may occur (ie. natural
selection) adapting a population to a modified environment. In essence
evolutionary adaptation reflects the close correspondence between
organisms and their environment.
Adaptive responses may involve phenology, growth and development,
morphology, biochemistry etc..
4
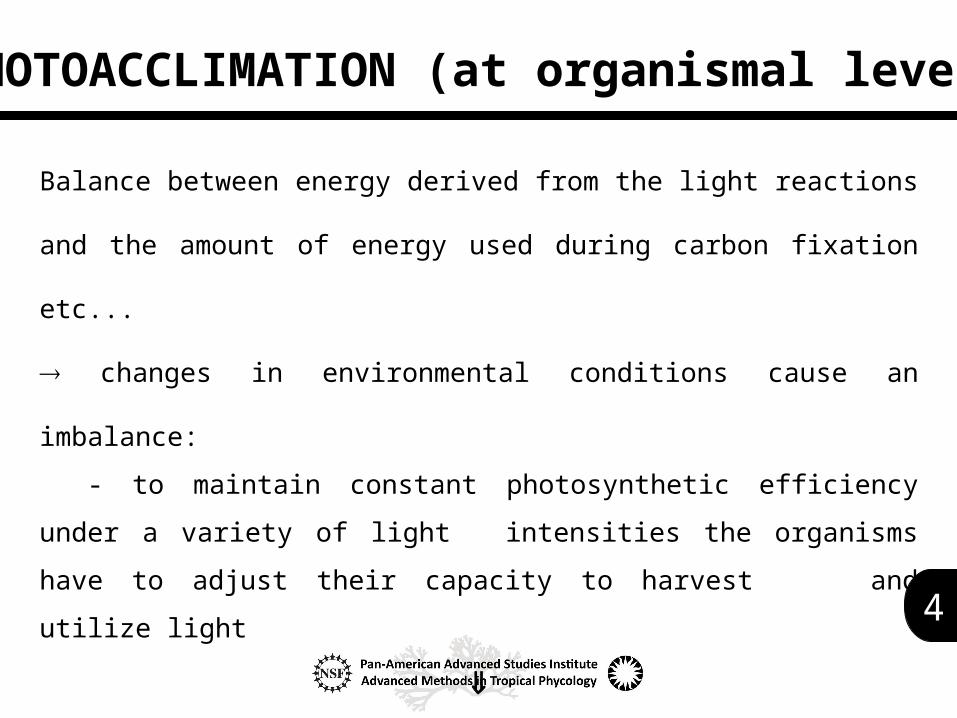
Balance between energy derived from the light reactions and the amount
of energy used during carbon fixation etc...
changes in environmental conditions cause an imbalance:
- to maintain constant photosynthetic efficiency under a variety of light
intensities the organisms have to adjust their capacity to harvest
and utilize light
Photoacclimation
(complex light response that changes cellular activities on many time scales)
PHOTOACCLIMATION (at organismal level)

5
PHOTOACCLIMATION = at the organismal level
Short-term photoacclimation (sec-min): responses to environmental changes that
are easily reversible, involving preexisting components within a biochemical pathway
(e.g. increases in enzyme activity within the Calvin cycle in response to temperature
increase)
Long-term photoacclimation (hours-days):
-changes in enzyme activity/concentration and gene expression (alterations of the
concentration of photosynthetic complexes, changes in antenna composition and
photosystem stoichiometry)
-morphological change (not immediately reversible) that lead to the development of
a visually different phenotype (e.g. larger blades of algae growing in shade)
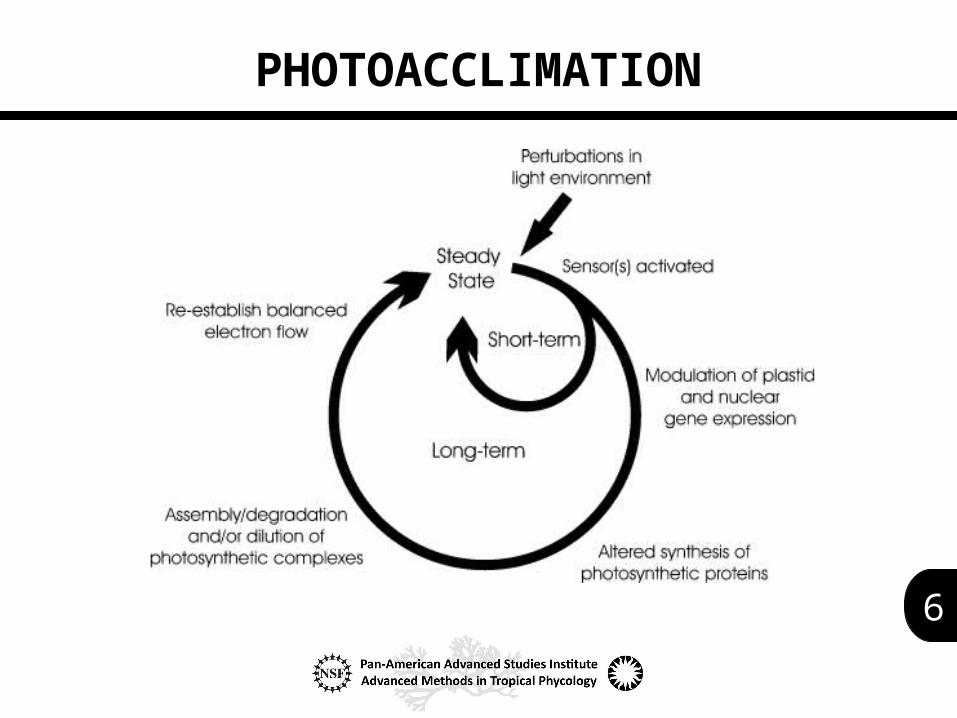
6
PHOTOACCLIMATION
7
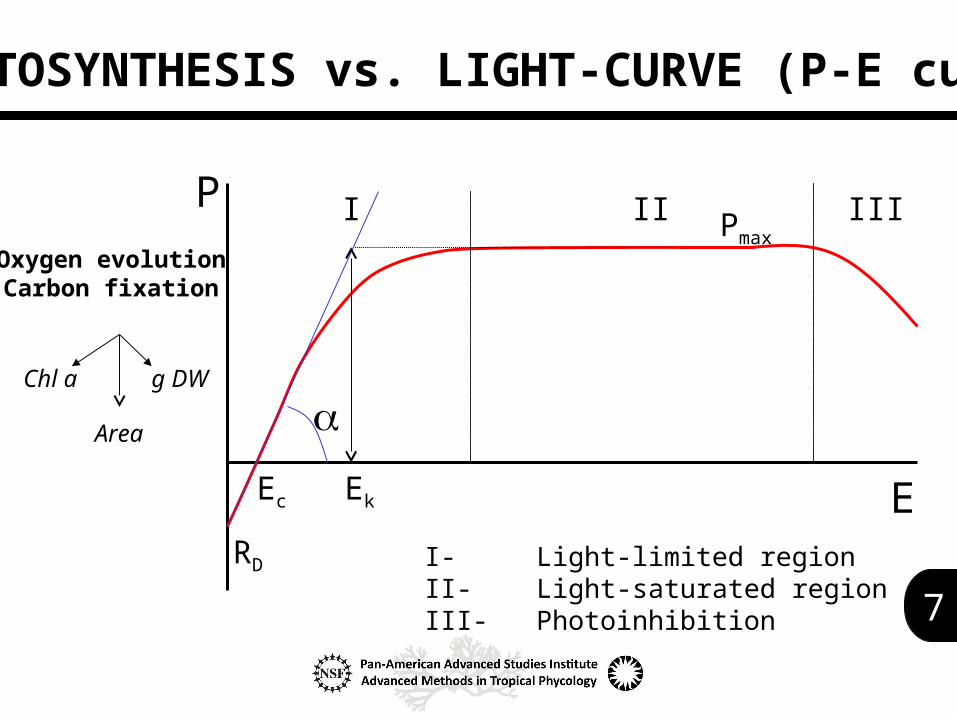
PHOTOSYNTHESIS vs. LIGHT-CURVE (P-E curve)
E
P
Chl a g DW
Oxygen evolutionCarbon fixation
II III
I- Light-limited regionII- Light-saturated regionIII- Photoinhibition
Ec Ek
Pmax
RD
I
Area
8
Irradiance
Ph
oto
syn
the
sis
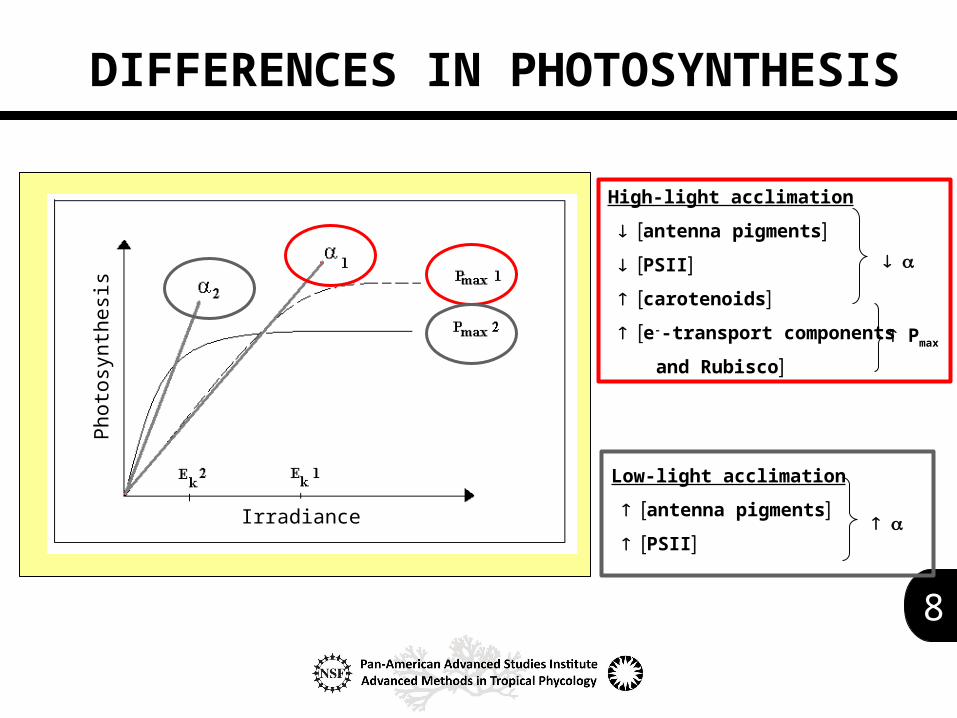
High-light acclimation
antenna pigments
PSII
carotenoids
e--transport components
and Rubisco
Pmax
DIFFERENCES IN PHOTOSYNTHESIS
Low-light acclimation
antenna pigments
PSII

9
Irradiance
Ph
oto
syn
the
sis
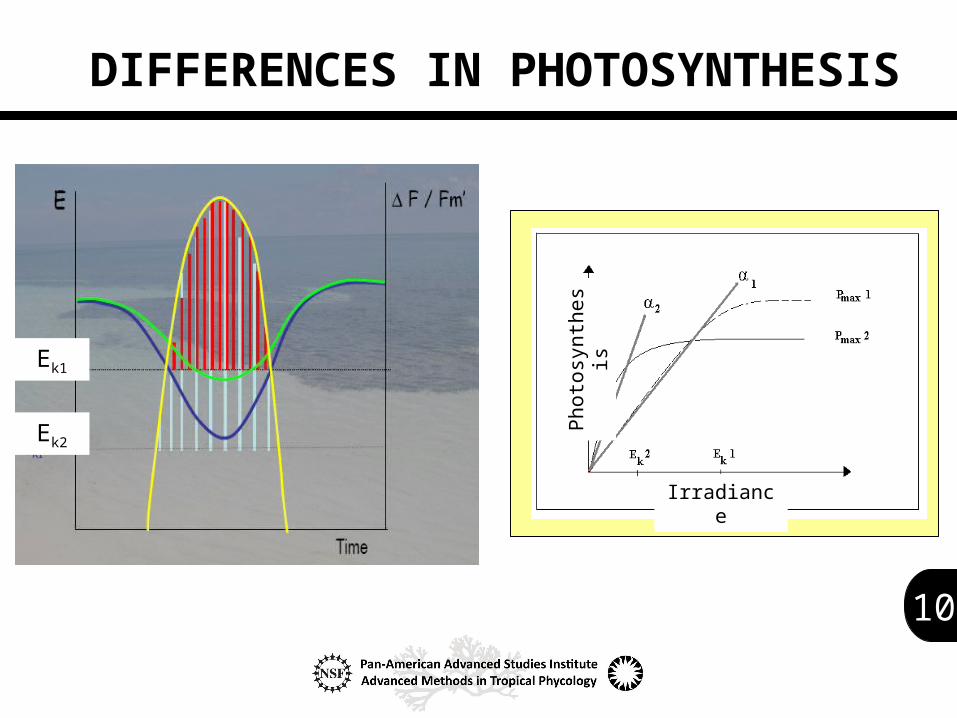
Ek1
Ek2
DIFFERENCES IN PHOTOSYNTHESIS
10
Irradiance
Ph
oto
syn
the
sis
Ek1
Ek2
DIFFERENCES IN PHOTOSYNTHESIS
11
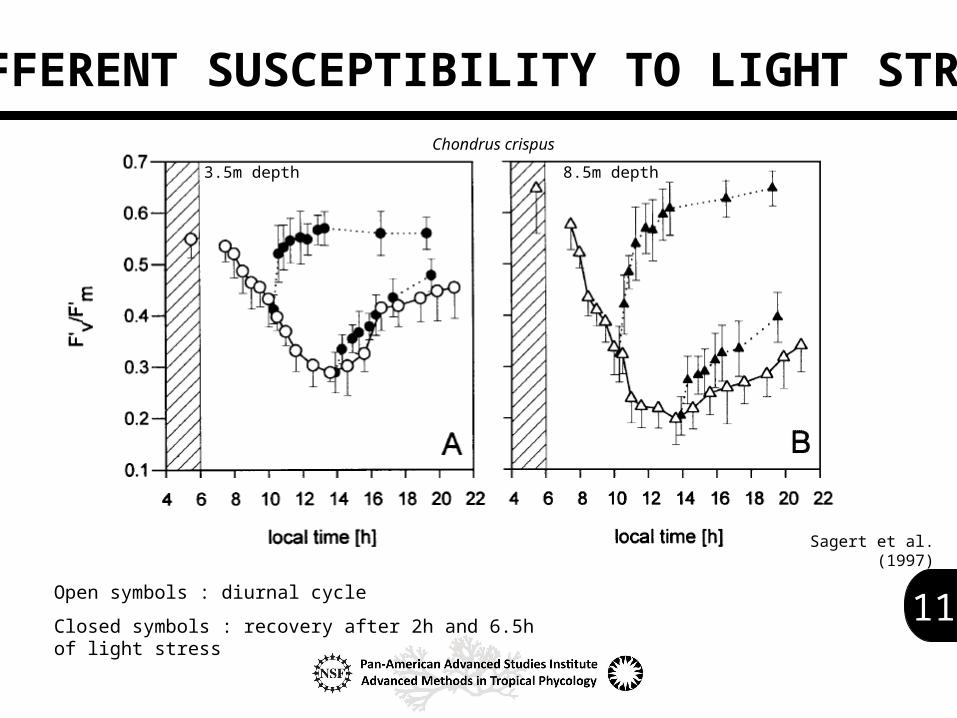
Sagert et al. (1997)
Chondrus crispus
3.5m depth 8.5m depth
Open symbols : diurnal cycle
Closed symbols : recovery after 2h and 6.5h of light stress
DIFFERENT SUSCEPTIBILITY TO LIGHT STRESS
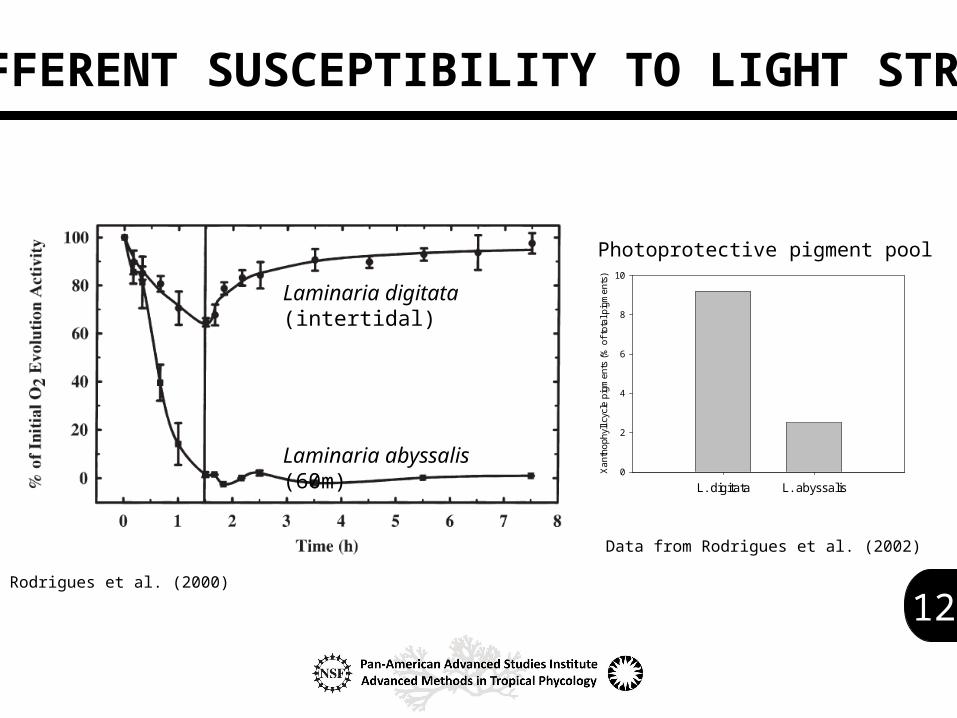
12Rodrigues et al. (2000)
Laminaria digitata (intertidal)
Laminaria abyssalis (60m)
DIFFERENT SUSCEPTIBILITY TO LIGHT STRESS
Data from Rodrigues et al. (2002)
L. digitata L. abyssalis
Xan
thop
hyll
cycl
e pi
gmen
ts (
% o
f to
tal p
igm
ents
)
0
2
4
6
8
10
Photoprotective pigment pool

13X Data
PHOTOACCLIMATIVE CAPACITY
Irradiance
Ph
oto
syn
the
sis
The higher the photosynthetic plasticity (acclimative capacity) of an organisms the higher its distribution range.
Low light condition
High light condition
14
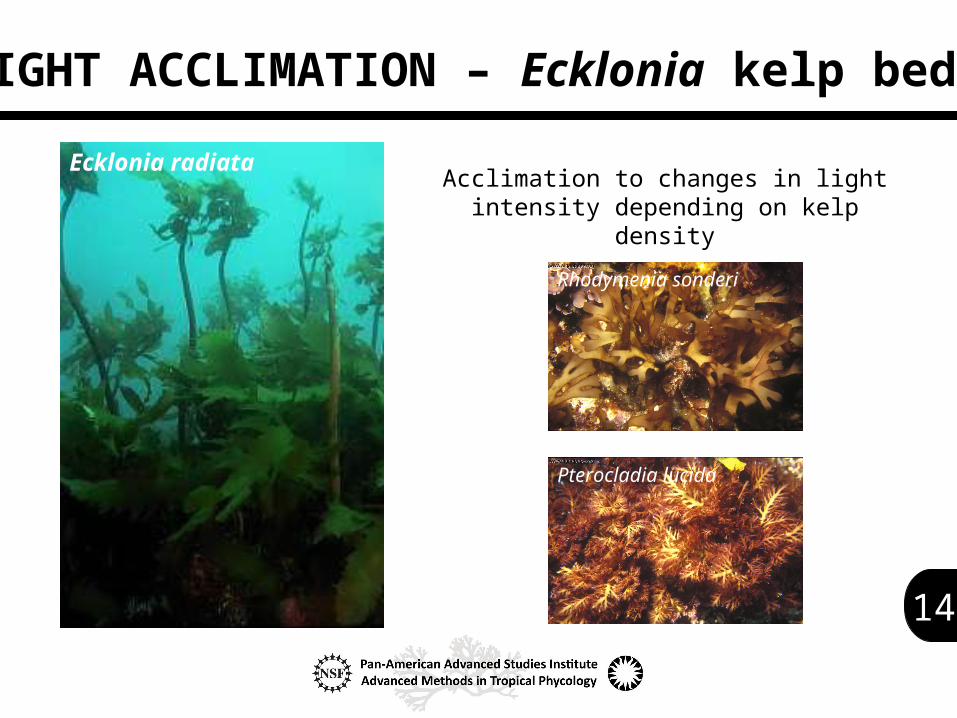
LIGHT ACCLIMATION – Ecklonia kelp bed
Ecklonia radiata
Pterocladia lucida
Rhodymenia sonderi
Acclimation to changes in light intensity depending on kelp density
15
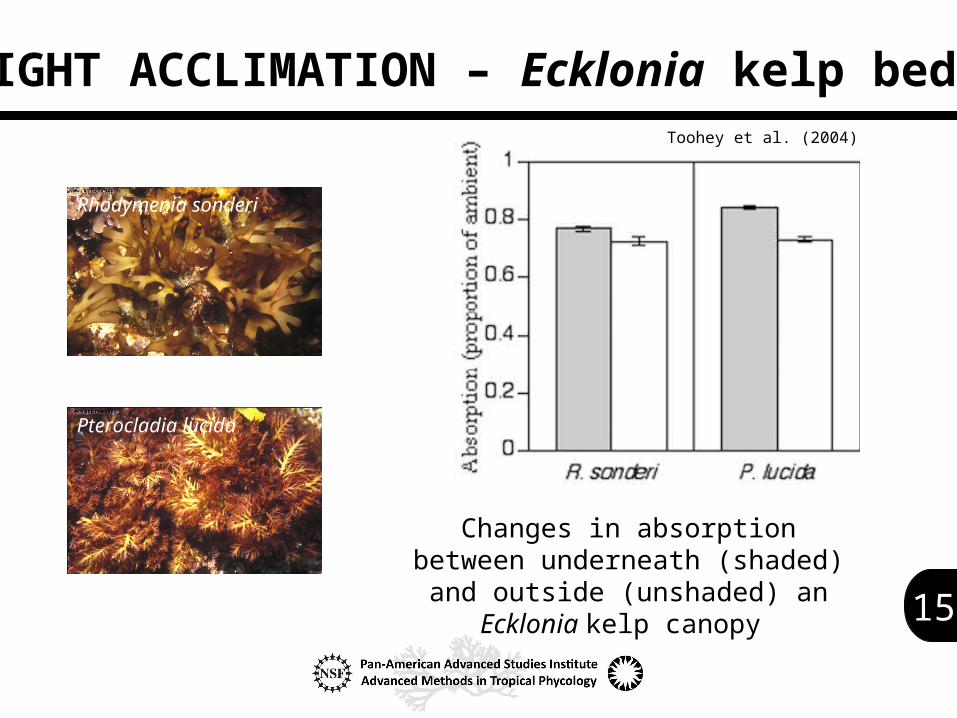
Pterocladia lucida
Rhodymenia sonderi
LIGHT ACCLIMATION – Ecklonia kelp bed
Changes in absorption between underneath (shaded) and outside
(unshaded) an Ecklonia kelp canopy
Toohey et al. (2004)
16
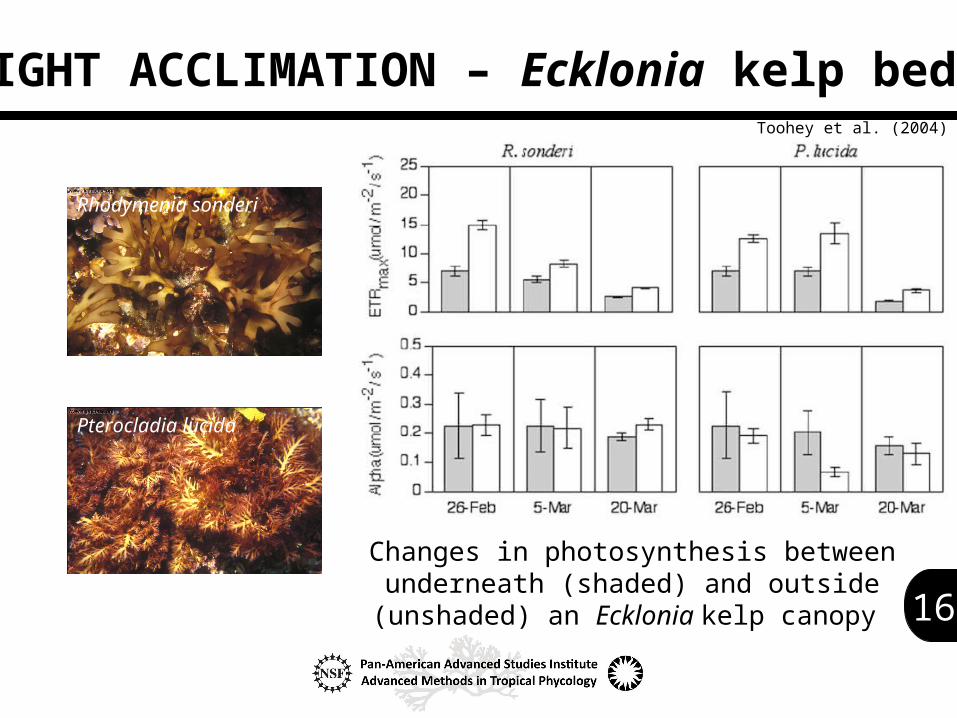
Toohey et al. (2004)
Pterocladia lucida
Rhodymenia sonderi
LIGHT ACCLIMATION – Ecklonia kelp bed
Changes in photosynthesis between underneath (shaded) and outside (unshaded) an Ecklonia
kelp canopy

17
100% incident light
1% incident light(13m, Dean 1985)
DIFFERENCES IN LIGHT ACCLIMATION (INTRASPECIFIC)
M. pyrifera
Wavelength (nm)
Re
lativ
e A
bso
rba
nce
Data from Colombo-Pallotta (2007)
Differences in absorption

18
Pigment concentration ( of canopy value)
0 50 100 150 200 250
De
pth
(m
)
0
5
10
15
20
Chl a+cFucoxanthinZeaxanthin
100% incident light
1% incident light(13m, Dean 1985)
DIFFERENCES IN LIGHT ACCLIMATION (INTRASPECIFIC)
M. pyrifera
Data from Colombo-Pallotta (2007)
Differences in pigment concentration
sun
shade
Ant
enna
pig
men
t con
cent
ratio
n
Photoprotective pigm
ents
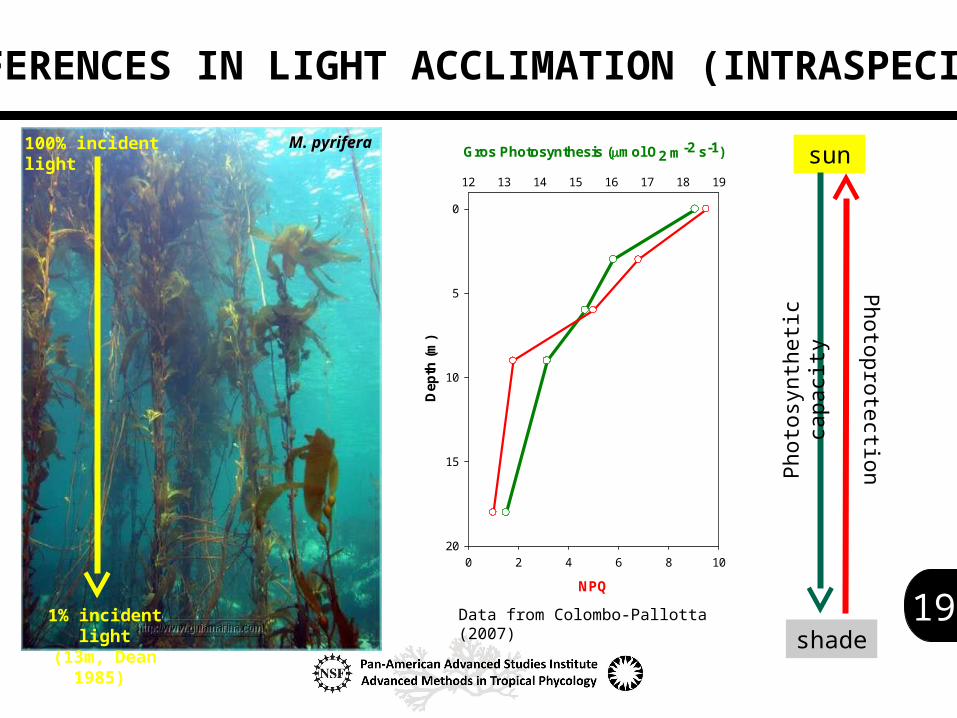
19
Gros Photosynthesis (mol O2 m-2 s-1)
12 13 14 15 16 17 18 19
Dep
th (
m)
0
5
10
15
20
Data from Colombo-Pallotta (2007)
Gros Photosynthesis (mol O2 m-2 s-1)
12 13 14 15 16 17 18 19
Dep
th (
m)
0
5
10
15
20
NPQ
0 2 4 6 8 10
100% incident light
1% incident light(13m, Dean 1985)
DIFFERENCES IN LIGHT ACCLIMATION (INTRASPECIFIC)
M. pyriferasun
shade
Pho
tosy
nthe
tic c
apac
ity
Photoprotection
20
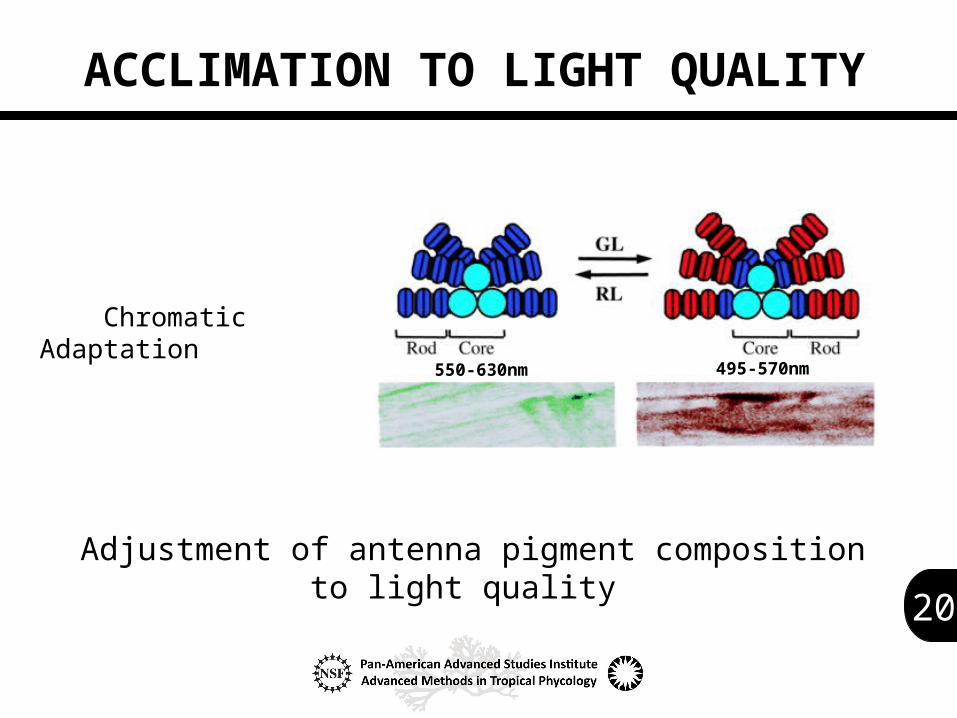
Chromatic Adaptation
550-630nm 495-570nm
Adjustment of antenna pigment composition to light quality
ACCLIMATION TO LIGHT QUALITY
21
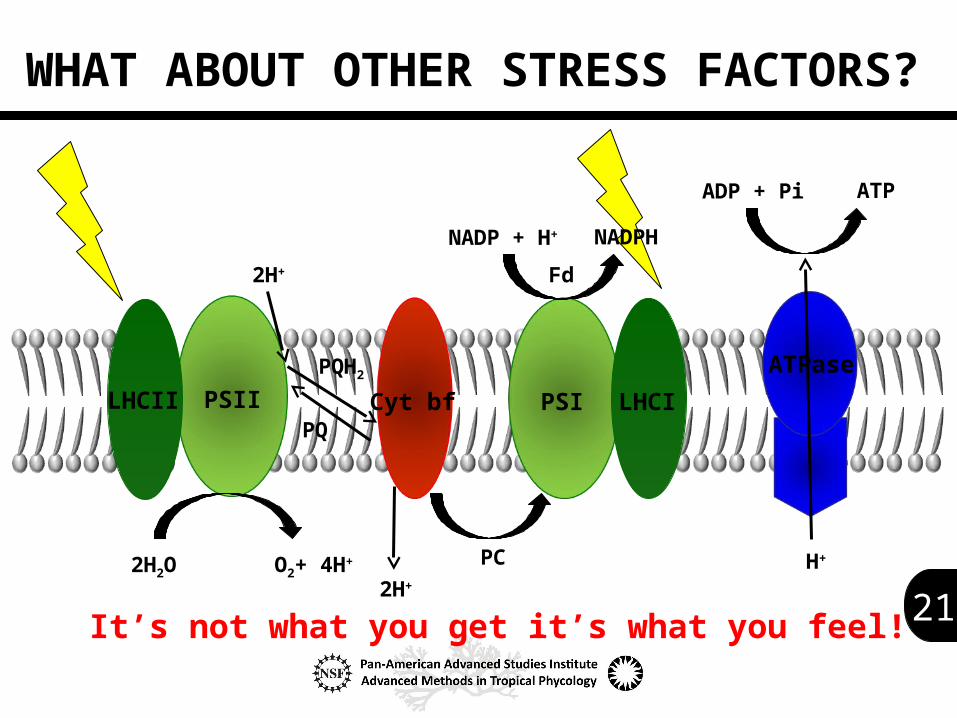
PSIILHCII Cyt bf PSI LHCI
2H2O O2+ 4H+
2H+
PQ
PQH2
2H+
PC
Fd
NADP + H+ NADPH
H+
ATPase
ADP + Pi ATP
WHAT ABOUT OTHER STRESS FACTORS?
It’s not what you get it’s what you feel!