photoacclimation and nutrient-based model of light ... · totrophic carbon fixation supported by a...
TRANSCRIPT

MARINE ECOLOGY PROGRESS SERIESMar Ecol Prog Ser
Vol. 228: 103–117, 2002 Published March 6
INTRODUCTION
Photosynthesis is a fundamental process of nearly allknown ecosystems, such that the level of photoau-totrophic carbon fixation supported by a given envi-ronment broadly dictates the local biomass of subse-quent trophic levels and the biogeochemical exchangeof elements between systems. Models of biosphericprimary production have been greatly aided by global-scale satellite observations (Field et al. 1998), but con-version of measured plant biomass to net photosynthe-
sis has remained problematic. Whereas terrestrial pro-ductivity models suffer from a lack of observationaldata for parameterization and testing (Field et al.1998), high-sensitivity measurements of net primaryproduction in aquatic systems have been routine sincethe introduction of the 14C method by SteemannNielsen (1952).
Analyses of vertical profiles of phytoplankton photo-synthesis revealed early on that, when normalizedto depth-specific chlorophyll concentrations, primaryproduction can be modeled to first order simply as afunction of subsurface irradiance (Ryther 1956, Ryther& Yentsch 1957, Talling 1957). A variety of analyticalexpressions have consequently been developed de-
© Inter-Research 2002 · www.int-res.com
*E-mail: [email protected]
Photoacclimation and nutrient-based model oflight-saturated photosynthesis for quantifying
oceanic primary production
Michael J. Behrenfeld1,*, Emilio Marañón2, David A. Siegel3, Stanford B. Hooker1
1National Aeronautics and Space Administration, Goddard Space Flight Center, Code 971, Building 33, Greenbelt,Maryland 20771, USA
2Departamento de Ecología y Biología Animal, Universidad de Vigo, 36200 Vigo, Spain3Institute for Computational Earth System Science, University of California Santa Barbara, Santa Barbara,
California 93106-3060, USA
ABSTRACT: Availability of remotely sensed phytoplankton biomass fields has greatly advanced pri-mary production modeling efforts. However, conversion of near-surface chlorophyll concentrations tocarbon fixation rates has been hindered by uncertainties in modeling light-saturated photosynthesis(Pb
max). Here, we introduce a physiologically-based model for Pbmax that focuses on the effects of
photoacclimation and nutrient limitation on relative changes in cellular chlorophyll and CO2 fixationcapacities. This ‘PhotoAcc’ model describes Pb
max as a function of light level at the bottom of themixed layer or at the depth of interest below the mixed layer. Nutrient status is assessed from therelationship between mixed layer and nutricline depths. Temperature is assumed to have no directinfluence on Pb
max above 5°C. The PhotoAcc model was parameterized using photosynthesis-irradiance observations made from extended transects across the Atlantic Ocean. Model perfor-mance was validated independently using time-series observations from the Sargasso Sea. ThePhotoAcc model accounted for 70 to 80% of the variance in light-saturated photosynthesis. Previouslydescribed temperature-dependent models did not account for a significant fraction of the variance inPb
max for our test data sets.
KEY WORDS: Photosynthesis · Modeling · Primary production
Resale or republication not permitted without written consent of the publisher
Mar Ecol Prog Ser 228: 103–117, 2002
scribing this relationship between vertical light attenu-ation and chlorophyll-normalized carbon fixation(reviewed by Platt & Sathyendranath 1993, Behrenfeld& Falkowski 1997b). Such models can account for mostof the observed variance in depth-integrated photo-synthesis (∑PP), particularly when measurementsencompass a wide phytoplankton biomass range, pro-vided model input includes measured values for:(1) the vertical distribution of chlorophyll, (2) thedownwelling attenuation coefficient (Kd) for photosyn-thetically active radiation (PAR), and (3) the maximumcarbon fixation rate per unit of chlorophyll (Pb
opt)(Behrenfeld & Falkowski 1997a,b).
For over 40 yr, developments in phytoplankton pri-mary production models have focused on refining char-acterizations of the above 3 critical water-column fea-tures, with clearly the greatest achievements realizedin the description of the underwater light field (e.g.Platt & Sathyendranath 1988, Morel 1991, Antoine et al.1996). Progress has also been made in predicting verti-cal profiles of chlorophyll (Platt & Sathyendranath 1988,Morel & Berthon 1989), but models of Pb
opt have re-mained rudimentary and inconsistent (Behrenfeld &Falkowski 1997b). The importance of accurate Pb
opt
estimates cannot be overstated, especially when modelperformance is evaluated by comparison with point-source field observations. For globally representativedata sets, phytoplankton biomass alone accounts for<40% of ∑PP variability, while inclusion of measuredPb
opt values can account for >80% of the variance in∑PP (Balch & Byrne 1994, Behrenfeld & Falkowski1997a). In oligotrophic regions where the range inchlorophyll concentration is further constrained, accu-rate estimates of Pb
opt are even more critical (Banse &Yong 1990, Siegel et al. 2000).
The function of Pbopt models is to capture spatial and
temporal changes in assimilation efficiencies (i.e. car-bon fixed per unit of chlorophyll) resulting from phy-siological acclimation to environmental variability.Currently, the 2 principal approaches for estimatingPb
opt in regional- to global-scale models are: (1) toassign fixed, climatological values to biogeographicalprovinces (Longhurst 1995, Longhurst et al. 1995), and(2) to define predictive relationships between Pb
opt and1 or more environmental variables (e.g. temperature,nutrient concentration) (Megard 1972, Balch et al.1992, Antoine et al. 1996, Behrenfeld & Falkowski1997a). Both techniques have advantages, but differin their intended application. For example, the firstapproach furnishes broad-scale average values fordesignated regions and is not intended to accuratelyreproduce the much finer scale physiological variabil-ity in 14C-uptake rates corresponding to a given day,depth and location. As for the second approach, aneffective model should, ideally, provide Pb
opt estimates
comparable at this point-source scale of field measure-ments, but a successful model of this genre has not yetbeen described.
Here we introduce a model, belonging to this sec-ond category, that captures Pb
opt variability in naturalphytoplankton assemblages. The model largely fo-cuses on changes in Pb
opt resulting from photoaccli-mation and is thus referred to as the ‘PhotoAccModel’, although a nutrient-dependence is also pre-scribed. In the following section, we describe the-conceptual basis and underlying equations of thePhotoAcc model, the field data used for model para-meterization and testing, and our approach to assess-ing nutrient status and photoacclimation irradiances.Model limitations, directions for expansion, and po-tential avenues for global implementation are ad-dressed in the section ‘Discussion’.
METHODS
The PhotoAcc model is intended to provide esti-mates of both Pb
opt and Pbmax that are robust to varia-
tions in environmental conditions and taxonomiccomposition. Pb
opt is measured under ambient lightconditions during ~6 to 24 h in situ or simulated insitu incubations, and is defined as the maximumchlorophyll-normalized carbon fixation in a water col-umn (the superscript ‘b’ denotes normalization tochlorophyll) divided by the incubation light period(Wright 1959, Behrenfeld & Falkowski 1997a). Nat-ural fluctuations in sunlight cause photosynthesis tovary during such incubations, particularly in light-limited samples deep within the water column. Pb
opt,however, is generally observed near the surfacewhere light levels are sufficient to maintain photo-synthesis near the light-saturated rate, Pb
max. Thus,unless photoinhibition is excessive or ambient PAR isvery low, modeling Pb
opt is synonymous with model-ing near-surface Pb
max.The longer-term incubations described above treat
the water column as a compound photosynthetic unitand yield a single Pb
opt value for each vertical profile.In contrast, short-term (~0.5 to 2 h) photosynthesis-irradiance (PI) measurements provide unique relation-ships between light and carbon fixation for each popu-lation sampled within a water column. This techniqueinvolves exposing phytoplankton from a given depthto a range of constant light intensities. PI measure-ments provide critical information on depth-dependentchanges in Pb
max.PhotoAcc model. The light-saturated rate of photo-
synthesis is constrained by the capacity of the Calvincycle reactions (Pmax), which fix CO2 into carbohy-drates (Stitt 1986, Sukenik et al. 1987, Orellana & Perry
104
Behrenfeld et al.: Modeling phytoplankton photosynthesis
1992). If chlorophyll (chl) concentration is assumedproportional to light absorption, then Pb
max is the ratioof the Calvin cycle capacity to light-harvesting (i.e.Pb
max = Pmax × chl–1). Light absorption and electrontransport by the photosynthetic light reactions functionprimarily to supply ATP and NADPH to the Calvincycle. Thus, parallel changes in chlorophyll and theCalvin cycle can occur without a change in Pb
max.Variations in Pb
max result when acclimation to anew growth condition requires a shift in the balancebetween light harvesting and carbon fixation. Thus,the essential requirement for an effective Pb
max modelis a description of how specific environmental factorscause Pmax and chlorophyll to change relative to eachother.
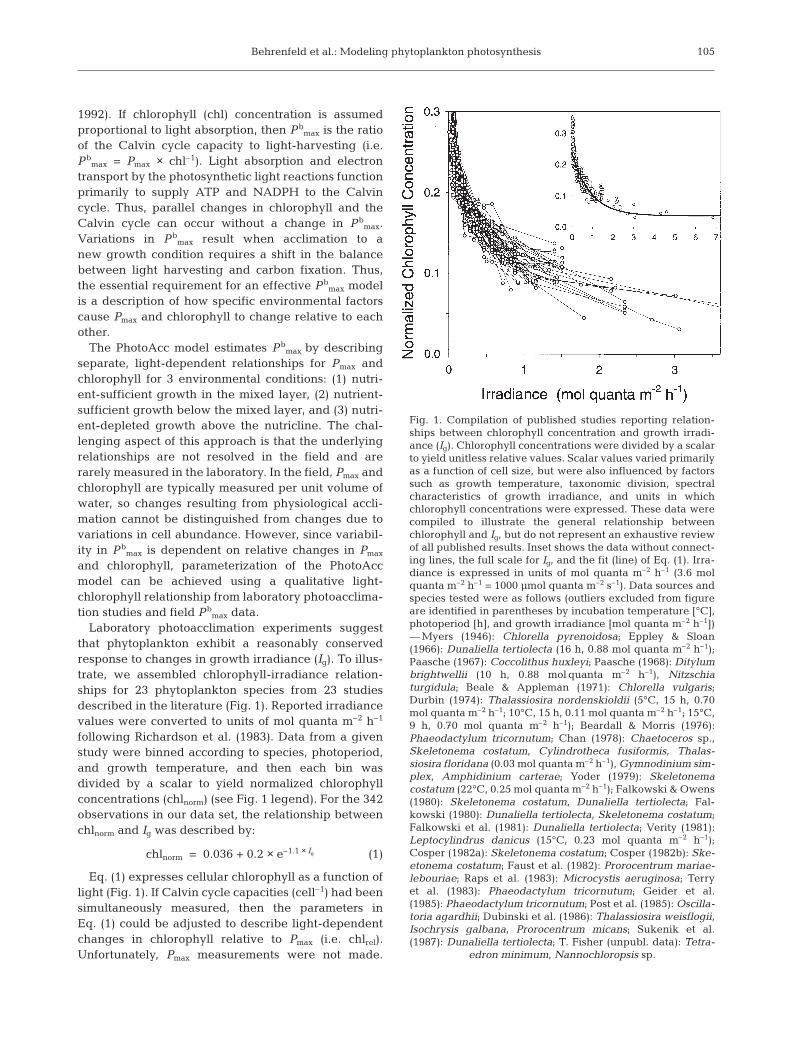
The PhotoAcc model estimates Pbmax by describing
separate, light-dependent relationships for Pmax andchlorophyll for 3 environmental conditions: (1) nutri-ent-sufficient growth in the mixed layer, (2) nutrient-sufficient growth below the mixed layer, and (3) nutri-ent-depleted growth above the nutricline. The chal-lenging aspect of this approach is that the underlyingrelationships are not resolved in the field and arerarely measured in the laboratory. In the field, Pmax andchlorophyll are typically measured per unit volume ofwater, so changes resulting from physiological accli-mation cannot be distinguished from changes due tovariations in cell abundance. However, since variabil-ity in Pb
max is dependent on relative changes in Pmax
and chlorophyll, parameterization of the PhotoAccmodel can be achieved using a qualitative light-chlorophyll relationship from laboratory photoacclima-tion studies and field Pb
max data.Laboratory photoacclimation experiments suggest
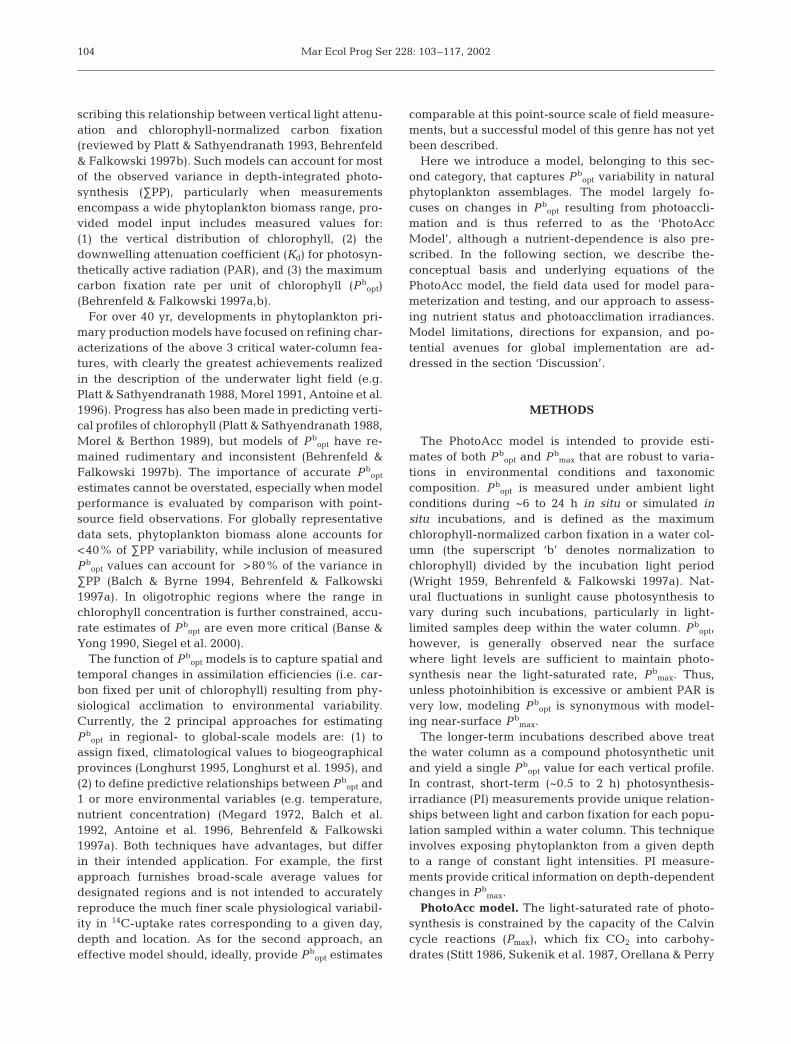
that phytoplankton exhibit a reasonably conservedresponse to changes in growth irradiance (Ig). To illus-trate, we assembled chlorophyll-irradiance relation-ships for 23 phytoplankton species from 23 studiesdescribed in the literature (Fig. 1). Reported irradiancevalues were converted to units of mol quanta m–2 h–1
following Richardson et al. (1983). Data from a givenstudy were binned according to species, photoperiod,and growth temperature, and then each bin wasdivided by a scalar to yield normalized chlorophyllconcentrations (chlnorm) (see Fig. 1 legend). For the 342observations in our data set, the relationship betweenchlnorm and Ig was described by:
chlnorm = 0.036 + 0.2 × e–1.1 × Ig (1)
Eq. (1) expresses cellular chlorophyll as a function oflight (Fig. 1). If Calvin cycle capacities (cell–1) had beensimultaneously measured, then the parameters inEq. (1) could be adjusted to describe light-dependentchanges in chlorophyll relative to Pmax (i.e. chlrel).Unfortunately, Pmax measurements were not made.
105
Fig. 1. Compilation of published studies reporting relation-ships between chlorophyll concentration and growth irradi-ance (Ig). Chlorophyll concentrations were divided by a scalarto yield unitless relative values. Scalar values varied primarilyas a function of cell size, but were also influenced by factorssuch as growth temperature, taxonomic division, spectralcharacteristics of growth irradiance, and units in whichchlorophyll concentrations were expressed. These data werecompiled to illustrate the general relationship betweenchlorophyll and Ig, but do not represent an exhaustive reviewof all published results. Inset shows the data without connect-ing lines, the full scale for Ig, and the fit (line) of Eq. (1). Irra-diance is expressed in units of mol quanta m–2 h–1 (3.6 molquanta m–2 h–1 = 1000 µmol quanta m–2 s–1). Data sources andspecies tested were as follows (outliers excluded from figureare identified in parentheses by incubation temperature [°C],photoperiod [h], and growth irradiance [mol quanta m–2 h–1])— Myers (1946): Chlorella pyrenoidosa; Eppley & Sloan(1966): Dunaliella tertiolecta (16 h, 0.88 mol quanta m–2 h–1);Paasche (1967): Coccolithus huxleyi; Paasche (1968): Ditylumbrightwellii (10 h, 0.88 mol quanta m–2 h–1), Nitzschiaturgidula; Beale & Appleman (1971): Chlorella vulgaris;Durbin (1974): Thalassiosira nordenskioldii (5°C, 15 h, 0.70mol quanta m–2 h–1; 10°C, 15 h, 0.11 mol quanta m–2 h–1; 15°C,9 h, 0.70 mol quanta m–2 h–1); Beardall & Morris (1976):Phaeodactylum tricornutum; Chan (1978): Chaetoceros sp.,Skeletonema costatum, Cylindrotheca fusiformis, Thalas-siosira floridana (0.03 mol quanta m–2 h–1), Gymnodinium sim-plex, Amphidinium carterae; Yoder (1979): Skeletonemacostatum (22°C, 0.25 mol quanta m–2 h–1); Falkowski & Owens(1980): Skeletonema costatum, Dunaliella tertiolecta; Fal-kowski (1980): Dunaliella tertiolecta, Skeletonema costatum;Falkowski et al. (1981): Dunaliella tertiolecta; Verity (1981):Leptocylindrus danicus (15°C, 0.23 mol quanta m–2 h–1);Cosper (1982a): Skeletonema costatum; Cosper (1982b): Ske-etonema costatum; Faust et al. (1982): Prorocentrum mariae-lebouriae; Raps et al. (1983): Microcystis aeruginosa; Terryet al. (1983): Phaeodactylum tricornutum; Geider et al.(1985): Phaeodactylum tricornutum; Post et al. (1985): Oscilla-toria agardhii; Dubinski et al. (1986): Thalassiosira weisflogii,Isochrysis galbana, Prorocentrum micans; Sukenik et al.(1987): Dunaliella tertiolecta; T. Fisher (unpubl. data): Tetra-
edron minimum, Nannochloropsis sp.

Mar Ecol Prog Ser 228: 103–117, 2002
However, if Pmax exhibits a monotonic dependence onIg, then chlrel should still follow the relationship:
chlrel = a + b × e–c × Ig (2)
For the PhotoAcc model, we assumed that Eq. (2) pro-vides an adequate description of chlrel. We thenderived values for the parameters (a, b, c) using fieldmeasurements of Pb
max.For mixed layer, nutrient-sufficient phytoplankton
(Condition 1), the PhotoAcc model attributes variabil-ity in Pb
max solely to changes in Ig. Since chlorophyll isexpressed relative to the Calvin cycle capacity, Pmax
was simply assigned an irradiance-independent valueof 1 mgC m–3 h–1 (Fig. 2a). Light-dependent changesin chlrel were then determined by fitting Eq. (2) to the inverse of measured Pb
max as a function of Ig (i.e.chlrel = Pmax × Pb
max–1 = 1/Pb
max), where Ig was taken asthe average daily PAR at the bottom of the activemixed layer.
For nutrient-sufficient phytoplankton below themixed layer (Condition 2), Ig was calculated as theaverage daily PAR at the depth of interest and chlrel
was assigned the same relationship with Ig as deter-mined for the mixed layer. Relative to Condition 1, Pmax
was assumed to decrease at very low light below themixed layer (Fig. 2a: inset) because a high Calvin cyclecapacity is unnecessary in chronically light-limitedphytoplankton deep within a stratified water column(Geider et al. 1986, Orellana & Perry 1992). This light-dependent change in Pmax was described by:
Pmax = d + f × (1 – hn × Ig) (3)
where n has inverse units of Ig to yield a dimensionlessexponent. Parameter values (d, f, h, n) were derived byfitting Eq. (3) to the product of chlrel and measuredPb
max as a function of Ig.Few laboratory studies have specifically investigated
nutrient-dependent changes in the relative abundanceof light harvesting and Calvin cycle components. Weassumed that Pb
max would be lower under nutrient-de-pleted conditions because associated increases in theenergetic cost of extracting nutrients from the environ-ment would favor the use of light reaction products forATP generation rather than carbon fixation. This shift inthe balance between light harvesting and carbon fixa-tion was effectuated in the PhotoAcc model by assum-ing the same light-chlrel relationship as under nutrient-sufficient conditions, but a lower, light-independentvalue for Pmax in the mixed layer (Fig. 2b). This nutrient-depleted Pmax value was determined by multiplyingmeasured Pb
max and calculated chlrel values and takingthe median of these products. Between the mixed layerand nutricline, Pmax was further reduced as a function oflight following the light-dependent relationship de-rived for nutrient-sufficient cells below the mixed layer
(Fig. 2b: inset). Below the nutricline, Pbmax was esti-
mated using the nutrient-sufficient equations (Fig. 2a).Parameterizing the PhotoAcc model with field data
required an environmental index of nutrient status andan assessment of surface mixing depths. Our approachto these issues and the field data employed are de-tailed in the 3 subsections that follow the brief modelsummary below.
To recapitulate: the PhotoAcc model describes light-dependent changes in chlorophyll and Pmax for 3 envi-ronmental conditions (Fig. 2). For each condition,changes in Pmax and chlrel are expressed relative tothe Pmax value of 1 mg C m–3 h–1 assigned to nutrient-sufficient, mixed-layer phytoplankton. Chlrel is assumedto vary with light in a similar manner as chlorophyll percell, which has been repeatedly measured in the labo-ratory (Fig. 1). Calvin cycle capacities are not directlymeasured in the field, so the model is parameterized ina stepwise manner using measurements of Pb
max. Thefirst step is to fit the light-chlrel relationship (Eq. 2) toinverse Pb
max values observed in the mixed layer undernutrient-sufficient conditions. Applying this samelight-chlrel relationship to the other 2 conditions allowsthe remaining Pmax equations to be solved. Specifically,the light-dependent change in Pmax below the mixedlayer (Fig. 2: insets) is determined by fitting Eq. (3) tothe product of chlrel and measured Pb
max values frombelow the mixed layer. The lower Pmax value for nutrient-depleted conditions (Fig. 2b) is determined as themean of the products, chlrel × Pb
max (where Pbmax values
are measured in nutrient-depleted waters).Field data. The PhotoAcc model was parameterized
using Atlantic Meridional Transect (AMT) data. EachAMT field campaign involves a suite of complimentaryphysical, chemical, and biological observations froma diversity of oceanographic regimes. We employedresults from 2 of these program transects, AMT-2 (22April to 22 May 1996) and AMT-3 (16 September to25 October 1996) each spanning an 11 000 km regionbetween the United Kingdom and the FalklandIslands. In addition to encompassing 5 of the majorbiogeochemical provinces defined by Longhurst et al.(1995), these AMT studies were also ideal for modelparameterization because they exhibited significantlydivergent latitudinal patterns in Pb
max despite beingnearly identical geographical transects (Marañón &Holligan 1999, Marañón et al. 2000).
Protocols employed for optical and biological mea-surements during AMT-2 and AMT-3 have been previ-ously reported (Robins et al. 1996, Marañón & Holligan1999, Marañón et al. 2000). Optical measurementswere conducted using the SeaWiFs Optical ProfilingSystem (SeaOPS) with a set of 7-channel light sensors(Robins et al. 1996). Optical measurements with theSeaOPS have a characteristic uncertainty of 3.4%,
106
Behrenfeld et al.: Modeling phytoplankton photosynthesis
with 1.5% of this from ship-shadow contamination(Hooker & Maritorena 2000). Photosynthesis-irradiancemeasurements were conducted on samples collected ateach station from 7 m, near the base of the mixed layer,and near the chlorophyll maximum (Marañón & Holli-gan 1999). This sampling strategy provided Pb
max
values from within and below the mixed layer. Datacollected between 40 and 49° N during AMT-2 (3 sta-tions) were not used in our analysis because of in-consistencies in parallel chlorophyll measurements(specifically, the 2 records had similar patterns, butwere juxtaposed by 1 station), nor did we use theAMT-3 data from 60 m at 38° S because of a large dis-crepancy between chlorophyll concentration and spec-tral attenuation coefficients (Kdλ).
Performance of the PhotoAcc model was additionallytested using a 6 yr record of light and primary productionfrom the US-JGOFS Bermuda Atlantic Time Series(BATS) program and Bermuda BioOptics Program(BBOP). BATS and BBOP measurement protocols havebeen described previously (Knap et al. 1993, Michaels& Knap 1996, Siegel et al. 1995a,b, 2000). Chlorophyll-normalized rates of primary production (Pb) were basedon light-dark in situ 14C-uptake measurements con-ducted from sunrise to sunset and HPLC determinationsof phytoplankton pigment. Each vertical profile ofPb wasvisually inspected to extract the appropriate value forPb
opt. With few exceptions, Pbopt was taken as the Pb
value measured at 20 m. Above this depth, a slight pho-toinhibitory effect was common, while Pb values below
20 m generally decreased due to longer periods of light-limited photosynthesis. On a few occasions, the Pb valueat 20 m greatly exceeded values immediately above andbelow this depth, in which case the second highest Pb
value was taken as Pbopt. Mixed-layer primary produc-
tion is phosphate-limited at the BATS site during thesummer months (Michaels et al. 1994, 1996).
Nutrient limitation index. An environmental indexwas required to discriminate between nutrient-sufficientand nutrient-depleted water masses. The dissolvedconcentration of nutrients does not provide an effec-tive index because, over a majority of the open ocean,the daily allocation of resources available for growth islargely determined by food-web recycling rates. Wetherefore used the relationship between the physicalmixed layer depth (ZM) and the nitracline depth (ZN) asa first-order index of nutrient status. The basis for thisindex is that when physical forcing (e.g. a storm) deep-ens the mixed layer such that mixing penetrates thenutricline, the upper water column becomes ‘charged’with nutrients and either a close correspondence existsbetween ZM and ZN or nutrients are elevated through-out the water column. When stratification follows, themixed layer shoals, and ZM separates from ZN. Simulta-neously, recycling inefficiencies export nutrients out ofthe active biological pool and into particulate refrac-tory and deep-ocean pools (Eppley & Peterson 1979). Ifthe time scale of these 2 events is similar, then the sep-aration of ZN and ZM should function as a correlate toincreasing nutrient stress.
107
Fig. 2. PhotoAcc model relationships between growth irradiance (Ig) and chlorophyll concentration, Calvin cycle capacity (Pmax),and chlorophyll-normalized light-saturated photosynthesis (Pb
max). (a) Nutrient-sufficient conditions; (b) nutrient-depleted con-ditions. Inset in (a): light-dependent decrease in Pmax for nutrient-sufficient growth below the mixed layer; inset in (b): light-dependent decrease in Pmax for nutrient-depleted phytoplankton between nitracline and bottom of mixed layer. The light-chlorophyll relationship is the same for all growth conditions and is normalized here to a value of 1 at Ig = 0 molquanta m–2 h–1.Pmax is expressed relative to a value of 1 mgC m–3 h–1 for mixed-layer, nutrient-sufficient conditions; Pb
max is expressed relative to nutrient-sufficient, high-light conditions

Mar Ecol Prog Ser 228: 103–117, 2002
Clearly, conditions will exist when ZN > ZM, yet recy-cling is sufficient to transiently maintain phytoplanktonin a nutrient-sufficient physiological state. The relation-ship between ZN and ZM was thus treated as a first-orderindex to separate nutrient-sufficient from nutrient-de-pleted data. For this analysis, ZM was evaluated fromvertical profiles of density (σt) and ZN was assigned the
depth at which NO3– was first detected. For nearly the
entire AMT-3 transect, either a close correspondence ex-isted between ZM and ZN, or NO3
– was detectable to thesurface (Fig. 3a). The AMT-3 data were thus used to pa-rameterize the nutrient-sufficient PhotoAcc equations(Fig. 2a). During AMT-2, a general separation betweenZM and ZN was observed from 30° N to 42° S (Fig. 3b).
108
Fig. 3. Results for the Atlantic Meridional Transect studies: (a, c, e) AMT-3 and (b, d, f) AMT-2. (a, b) Physical mixed layer (ZM: r,r) and nitracline (ZN: y) depths; gray symbols identify central section of AMT-2 transect that was treated as nutrient-depleted;ZN was taken as the depth at which NO3
– was first detectable or assigned a value of 0 m when NO3– was elevated throughout the
water column. (c–f) Measured (h) and modeled (D, D) chlorophyll-normalized light-saturated photosynthesis (Pbmax: mgC mg
chl–1 h–1); (D) Pbmax estimated using the nutrient-sufficient PhotoAcc model (Fig. 2a); (D) Pb
max estimated using the nutrient-depleted PhotoAcc model (Fig. 2b). (c, d) Mixed-layer samples collected at 7 m depth. (e, f) Mid-depth samples collected near ZM
Behrenfeld et al.: Modeling phytoplankton photosynthesis
Data from this region were used to parameterize the nu-trient-depleted model (Fig. 2b).
Photoacclimation depths. The PhotoAcc modelrequires an assessment of the mixing depth to whichsurface phytoplankton are photoacclimated (ZACCL).We determined ZACCL by visually inspecting verticalprofiles of σt, NO3
–, PO43–, and chlorophyll for each
sampling date and location, and assigned ZACCL theshallowest depth at which a vertical gradient wasobserved in any of these 4 water-column properties.Invariably, ZACCL corresponded to the depth of ZM
under nutrient-depleted conditions (Fig. 4a). Typically,σt, NO3
–, PO43–, and chlorophyll all indicated a similar
depth for ZACCL under nutrient-sufficient conditions(Fig. 4b). However, occasionally when ZM was large,nutrient and chlorophyll profiles indicated a shallowerdepth for ZACCL than σt (Fig. 4c). This infrequent condi-tion probably corresponds to a period shortly after adeep mixing event when physical forcing on the sys-tem has relinquished and the upper water column isbeginning to stratify.
RESULTS
Parameterized PhotoAcc model
The first step in model parameterization was to de-fine the light-chlrel relationship for nutrient-sufficient,mixed-layer phytoplankton (Fig. 2a). This was accom-plished by calculating Ig (mol quanta m–2 h–1) at ZACCL
(m) using measured surface PAR (mol quanta m–2 h–1)and spectral downwelling attenuation coefficients (Kdλ:m–1) and then fitting Eq. (2) to the inverse of mixedlayer Pb
max values measured during AMT-3 (r2 = 0.62).The resultant relationship was:
chlrel = 0.036 + 0.3 × e–3 × Ig (4)
where the units (from Eq. 2) are: a = mgchl m–3, b =mgchl m–3, and c = m2 h molquanta–1.
Eq. (4) was used as the light-chlrel relationship fornutrient-sufficient conditions both above and belowthe mixed layer. The light-dependent relationship forPmax below the mixed layer (Fig. 2a: inset) was para-
109
Fig. 4. Exemplary vertical profiles of photosynthetically active radiation (PAR) (——), chlorophyll concentration (F), NO3– (s),
PO43– (h), and sigma-t (σt: D) used to identify photoacclimation mixing depths (ZACCL: ). (a) Nutrient-depleted water column
where NO3– and PO4
3– concentrations are exhausted well below the mixing depth, indicated by σt; in this case, ZACCL was takenas the inflection depth in the σt profile. (b) Typical nutrient ‘charged’ water column where all profiles indicate a similar depth forZACCL. (c) Example of infrequent condition where σt was vertically uniform but NO3
– and chlorophyll profiles indicated shallowermixing; in this case, ZACCL was set to the depth indicated by the NO3
– profile. These exemplary profiles were extracted from the BATS data set (31° 50’ N, 64° 10’ W) on (a) 14 October 1992, (b) 17 May 1994, and (c) 12 December 1996

Mar Ecol Prog Ser 228: 103–117, 2002
meterized by multiplying Pbmax values measured be-
low ZACCL during AMT-3 by calculated chlrel valuesand then fitting Eq. (3) to these products as a functionof Ig (r2 = 0.72), where Ig is the average daily PAR ateach sampling depth. The resultant relationship was:
Pmax = 0.1 + 0.9 × [1 – (5 × 10⁻⁹)Ig] (5)
where the units (from Eq. 3) are: d and f = mgC m–3 h–1,h = dimensionless, and n = 1 m2 h molquanta–1.
For nutrient-depleted conditions, Eq. (4) was againused to describe light-dependent changes in chlrel.Mixed-layer Pb
max values measured during AMT-2between 30° N and 42° S (Fig. 3b) were then multipliedby corresponding values of chlrel. The median of theseproducts gave a nutrient-depleted value for Pmax of0.40 mgC m–3 h–1 (SD = 0.15 mgC m–3 h–1). The addi-tional, light-dependent decrease in Pmax between themixed layer and nutricline (Fig. 2b: inset) was calcu-lated by multiplying 0.40 mgC m–3 h–1 by Eq. (5).
In Eqs. (4) & (5), parameter values were chosen thathad the least number of significant digits yet provideda fit to the observational data that was not significantlydifferent from least-squares-derived values. Pb
max iscalculated with the PhotoAcc model as the inverse ofEq. (4) for mixed-layer, nutrient-sufficient conditions.Below the mixed layer, Pb
max is calculated as Eq. (5)divided by Eq. (4). Under nutrient-depleted conditions,Pb
max in the mixed layer is calculated as 0.40 mgC m–3
h–1 divided by Eq. (4), and Pbmax between the mixed
layer and nutricline is calculated by multiplying 0.40mgC m–3 h–1 by Eq. (5), then dividing by Eq. (4).
Model performance
Comparison of modeled and measured Pbmax values
for nutrient-sufficient regions of the AMT transects(black symbols in Fig. 3) indicated that an effectiverepresentation of spatial variability in Pb
max (r2 = 0.72,n = 79) was achieved both above (e.g. Fig. 3c,d) andbelow (e.g. Fig. 3e,f) ZACCL. Likewise, the nutrient-depleted model captured spatial variability in Pb
max
observed above the nitracline during AMT-2 between30° N and 42° S (gray symbols in Fig. 3d,f) (r2 = 0.71, n = 41). Overall, the PhotoAcc model accounted for76% of the variance in measured Pb
max for AMT-2 andAMT-3 (n = 120).
A level of agreement between PhotoAcc estimatesof Pb
max and values measured during the AMT stud-ies was anticipated, since the AMT data were usedfor model parameterization. Performance of the Pho-toAcc model was therefore further tested using theindependent, 6 yr BATS/BBOP data set (Fig. 5). Forthese data, a single Pb
opt value was extracted fromeach monthly profile of Pz. The near-surface location
of Pbopt (~20 m) and minimal photoinhibition ensured
that light-saturated photosynthesis (Pbmax) was main-
tained during each measurement over most of thephotoperiod. Pb
max was calculated for each monthusing both the nutrient-sufficient and nutrient-depleted models. The nutrient-sufficient model pro-vided the best estimates of Pb
opt during and shortlyfollowing the seasonal deep mixing events (blacksymbols in Fig. 5a), which were evidenced in the pro-files of ZM and ZN (Fig. 5b). These winter mixingevents were followed each year by a period ofincreasing stratification, whereby ZM gradually sepa-rated from ZN (Fig. 5b). Accordingly, the nutrient-depleted model generally provided the best estimatesof Pb
opt during the stratified periods (gray symbols inFig. 5a). Overall, the PhotoAcc model accounted for83% of the variance in Pb
opt for the BATS data set(n = 79).
As discussed above in the ‘Methods’ (subsection‘Nutrient limitation index’), the relationship betweenZM and ZN simply provides a first-order index of nutri-ent status. Our model results for the BATS time series(Fig. 5a) clearly indicate that conditions can existwhere ZM and ZN are separated, yet Pb
max exhibitsvalues consistent with the nutrient-sufficient model.Alternative, physiologically-based indices of nutrientstatus should therefore be investigated. For example,photochemical quantum efficiencies (Fv/Fm) could pro-vide a useful index and can now be routinely mea-sured using stimulated fluorescence techniques (Kol-ber & Falkowski 1993, Falkowski & Kolber 1995).
Comparison with temperature-dependent P bopt
models
Most regional- and global-scale models for Pbopt are
simple functions of sea surface temperature (excep-tions by: Balch & Byrne 1994, Longhurst 1995), withconsiderable variability between models (Behrenfeld &Falkowski 1997b). The AMT and BATS studies encom-passed a wide range of sea surface temperatures (5° to28°C) and thus provided an opportunity to comparethe PhotoAcc model with the temperature-dependentmodels of Megard (1972), Balch et al. (1992), Antoineet al. (1996) and Behrenfeld & Falkowski (1997a)(Fig. 6). None of these earlier models accounted formore than 9% of the variance in P b
max and P bopt
observed during the AMT and BATS studies (n = 199;Fig. 6a–d). In contrast, the PhotoAcc model accountedfor 70% of the variance when switching between thenutrient-sufficient and nutrient-depleted equationswas strictly based on the correspondence between ZM
and ZN (Fig. 6e). Performance of the PhotoAcc modelwas improved by 10% when the best-fit estimates
110

Behrenfeld et al.: Modeling phytoplankton photosynthesis
were chosen (Fig. 6f). We conclude from this compari-son that: (1) the PhotoAcc model addresses significantsources of variability in Pb
max and Pbopt that are not ade-
quately captured by simple temperature-dependentfunctions, and (2) optimal performance of the PhotoAccmodel requires replacing our first-order index of nutri-ent stress with a more quantitative physiological index.
DISCUSSION
The importance of effectively modeling light-saturated photosynthesis at the difficult local scale ofdaily primary production measurements has been rec-ognized for over 40 yr (Ryther 1956, Ryther & Yentsch1957). The most common approach to this problem hasbeen to describe Pb
opt as a function of temperature.Such models capture only a fraction of the observedvariability in Pb
opt, because temperature is weakly cor-
related with causative environmental forcing factors. Incontrast, the PhotoAcc model attempts to explicitly de-scribe primary causative relationships at the level ofchlorophyll synthesis and changes in the Calvin cyclecapacity. With this approach, the model effectively re-produced spatial and temporal variability in light-satu-rated photosynthesis for the AMT and BATS studies.These field programs do not, however, fully encompassglobal nutrient, light, and temperature conditions. Inthe following sections, we evaluate the predictions andhypotheses of the PhotoAcc model, discuss potential al-terations to account for additional growth constraints,and propose avenues for global implementation.
Maximum light-saturated photosynthesis
The PhotoAcc model predicts a maximum photosyn-thetic rate of Pb
max = 1/0.036 = 27.5 mgchl m–3 (Eq. 4),
111
Fig. 5. PhotoAcc results for the 6 yr Bermuda Atlantic Time-Series (BATS) record. (a) Measured (h) and modeled (D, D) optimalchlorophyll-normalized carbon fixation (Pb
opt: mgC mgchl–1 h–1) (r2 = 0.83); Pbopt was equated to Pb
max value estimated with thePhotoAcc model; (D) Pb
max estimated using nutrient-sufficient PhotoAcc model (Fig. 2a); (D) Pbmax estimated using nutrient-
depleted PhotoAcc model (Fig. 2b). (b) Relationship between physical mixed-layer depth (ZM: f, f) and depth of the nutricline(ZN: y); ZN was taken as the depth at which NO3
– was first detected or assigned a value of 0 m when NO3– was elevated through-
out the water column; NO3– was chosen as an index of nutrient-sufficient or nutrient-depleted conditions rather than PO4
3–
because the later was often undetectable even when ZM was very large; (f) sampling dates when nutrient-sufficient PhotoAcc model yielded best results; (f) sampling dates when nutrient-depleted PhotoAcc model yielded best results

Mar Ecol Prog Ser 228: 103–117, 2002
corresponding to nutrient-sufficient, high light condi-tions. Falkowski (1981) proposed a maximum value of25 mgC mgchl–1 h–1 by assuming a minimum photo-synthetic unit (PSUO2
) size of 2000 chlorophyll mole-cules per O2 evolved and a PSUO2
turnover time (τ) of1 ms. Choosing a lower PSUO2
or τ value would yield ahigher maximum for Pb
max. Laboratory measurements
suggest that PSUO2can range from 300 to 5000 (Fal-
kowski et al. 1981), while τ may vary from ≥5 ms toslightly less than 2 ms (Falkowski et al. 1981, Behren-feld et al. 1998) depending on the excess capacity ofthe photosystems (Kok 1956, Weinbaum et al. 1979,Heber et al. 1988, Leverenz et al. 1990, Behrenfeld etal. 1998). Thus, a potential exists for Pb
max to exceed25 mgC mgchl–1 h–1, although values>20 mgC mg chl–1 h–1 are rarely ob-served in the laboratory (e.g. Glover1980 reported values between 1.6 and21 mgC mgchl–1 h–1 for 11 species]. Inthe field, Pb
max (or Pbopt) values in excess
of 20 mgC mgchl–1 h–1 are occasionallyreported that exhibit well-defined di-urnal patterns (e.g. Malone et al. 1980,Hood et al. 1991). Thus, the PhotoAccmaximum for Pb
max of 27.5 mgC mgchl–1
h–1 is (1) close to the theoretical maxi-mum value proposed by Falkowski(1981), (2) well within the range of vari-ability suggested by laboratory mea-surements of PSUO2
and τ, and (3) consis-tent with the maximum Pb
max valuesreported from previous field studies.
Temperature revisited
We consider temperature to have anegligible direct influence on Pb
max
above 5°C for the following reasons: (1) Laboratory studies with phyto-
plankton monocultures indicate a cleartemperature-dependence for maximumalgal growth rates (Eppley 1972), but avariable, species-dependent influence onPb
max (e.g. Steemann Nielsen & Hansen1959, Steemann Nielsen & Jørgensen1968, Harris 1978, Morris 1981, Post etal. 1985). Enzymatic temperature optimadiffer between species according to theambient temperature from which theywere isolated. Thus, in field sampleswith taxonomically diverse phytoplank-ton assemblages acclimated to theirambient conditions, temperature-depen-dence of Pb
max is likely to be minimal.(2) Although the activity of Calvin
cycle enzymes, such as ribulose-1-5-bisphosphate carboxylase (RuBisCO),exhibits classic Arrhenius temperature-dependence, any decreases in activity atlower temperatures may be offset byincreasing enzyme concentrations (Stee-
112
Fig. 6. Measured Pbmax and Pb
opt values (n = 199) versus modeled values fromtemperature-dependent functions of (a) Megard (1972) (r2 = 0.08), (b) Balch etal. (1992) (r2 = 0.04), (c) Antoine et al. (1996) (r2 = 0.09), and (d) Behrenfeld &Falkowski (1997a) (r2 = 0.01) and the PhotoAcc model when (e) switchingbetween the nutrient-depleted and nutrient-sufficient models was objec-tively based on the relationship between mixed-layer and nutricline depths (r2 = 0.70) and (f) the best fit from either model was chosen (r2 = 0.80). Observa-tional data are from the Atlantic Meridional Transect studies (AMT-2, AMT-3)and Bermuda Atlantic Time-Series study (BATS). Dashed line indicates 1:1 rela-tionship. Equations for each of the temperature-dependent functions are given
in Behrenfeld & Falkowski (1997b)

Behrenfeld et al.: Modeling phytoplankton photosynthesis
mann Nielsen & Hansen 1959, Steemann Nielsen &Jørgensen 1968, Geider et al. 1985, Geider 1987). Inother words, sensitivity of Pb
max to temperature may bediminished if increases in enzyme concentration keeppace with decreasing activities at lower temperatures.
(3) Temperature-dependent changes in the Calvincycle capacity may be paralleled by changes in chloro-phyll (e.g. Durbin 1974, Yoder 1979, Verity 1981,Lapointe et al. 1984), such that normalization of Pmax
to chlorophyll masks temperature dependence.Below 5°C, the physiological adjustments described
above may not be sufficient to eliminate temperatureeffects on Pb
max. Currently, the minimum mixed-layerPb
max value predicted by the PhotoAcc model is 3 mgCmgchl–1 h–1. This value is near the maximum Pb
opt
value (<0.5 to ~3 mgC mgchl–1 h–1) reported byDierssen et al. (2000) for Antarctic phytoplankton sam-pled from –2 to 2°C waters. Low Pb
opt values measuredin the Southern Ocean partly result from prolongedperiods of subsaturated photosynthesis causing aweaker relationship between Pb
max and Pbopt. Never-
theless, a direct temperature effect is likely, and couldbe accounted for in the PhotoAcc model by treatingPmax as a temperature-dependent variable in the nutri-ent-sufficient model. For example, the following rela-tion (where T = temperature):
Pmax = 0.4 + 0.6 × [1 – exp–0.6 × (T + 6)]50 (6)
would provide a temperature-dependent decrease inPb
max below 5°C while essentially leaving modeled val-ues above 5°C unaltered.
Acclimation irradiance (Ig)
Modeling photoacclimation as a function of light atthe bottom of the mixed layer is the simplest formula-tion mathematically, but its physiological representa-tion is dependent on the kinetic balance betweenresponses to low and high light. Specifically, if photo-acclimation follows first-order kinetics with similar rateconstants for both high and low light, Pb
max will vary asa function of the average light in the mixed layer(Falkowski & Wirick 1981, Lewis et al. 1984, Cullen &Lewis 1988). Likewise, Pb
max will scale to an irradianceless than the average if responses to low light arestronger (Cullen & Lewis 1988) and to higher thanaverage light if high-light effects dominate (Vincent etal. 1994, Geider et al. 1996).
Photoacclimation rate constants are typically derivedfrom laboratory ‘light-shift’ experiments, where cellsacclimated for multiple generations to a given irradi-ance are transferred to much higher or lower light (e.g.Lewis et al. 1984). Riper et al. (1979) suggested thatdecreases in cellular chlorophyll following a shift to
high light result from (1) dilution by coincident celldivision and cessation of chlorophyll synthesis, (2)photooxidation, and (3) enzymatic breakdown. If these3 processes combine to yield a kinetic response of sim-ilar magnitude and opposite sign as a shift to low light(Lewis et al. 1984), then phytoplankton acclimate tothe average light in the mixed layer by continuouslysynthesizing and degrading chlorophyll at time scalesof <1 h as they transit between the surface and ZACCL.
Light-shift experiments, however, do not mimic nat-ural conditions well, since mixed-layer phytoplanktonare preconditioned to periodic high-light exposuresand thus are physiologically poised to effectively dissi-pate excess excitation energy (Behrenfeld et al. 1998).Goericke & Welschmeyer (1992) demonstrated thatchlorophyll turnover is independent of light level inpreconditioned cells, and concluded that photooxida-tion and enzymatic degradation of chlorophyll areartifacts of light-shift experiments. Chlorophyll syn-thesis at subsaturating light (Escoubas et al. 1995)should thus dominate over the dilution effect of celldivision, causing photoacclimation to scale to a lowerthan average light level. This conclusion implies thatcellular chlorophyll changes at the longer time scaleof mixed-layer deepening and shoaling. Additionalanalyses with mixed-layer phytoplankton are clearlyneeded to better resolve photoacclimation strategiesin nature.
Nutrient limitation
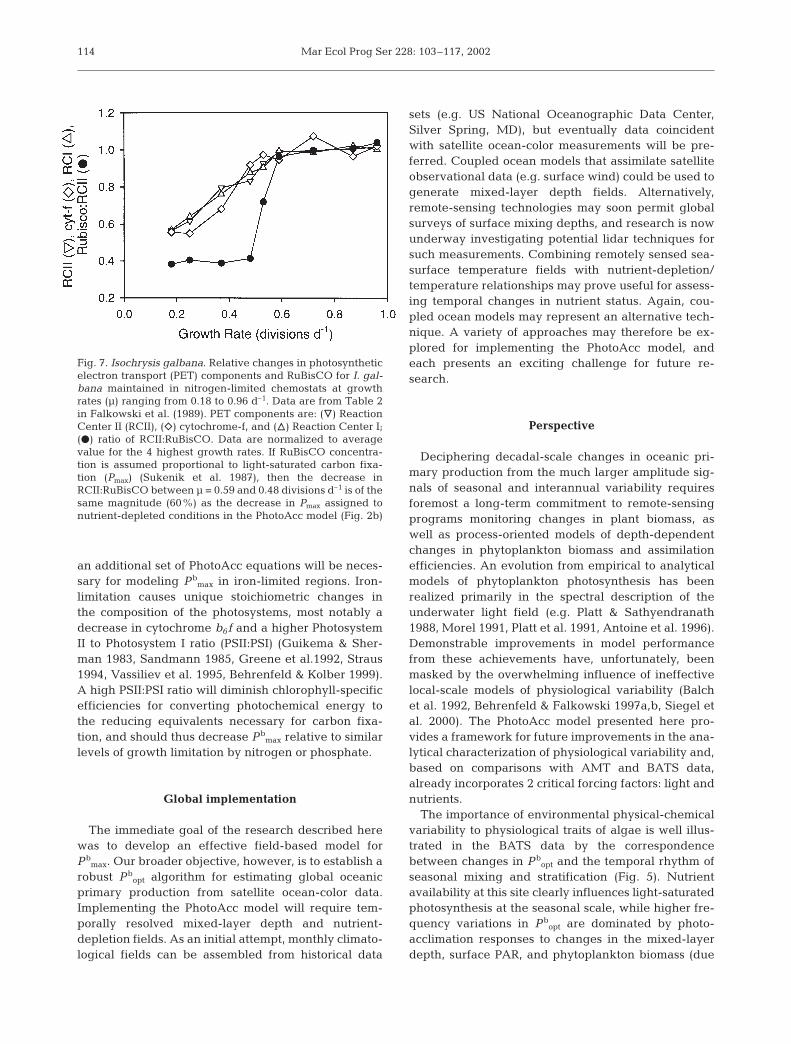
The PhotoAcc model simply switches between nutri-ent-sufficient and nutrient-depleted equations ratherthan employing a more gradual transition as a functionof nutrient stress. Falkowski et al. (1989) reported asimilar switch in the ratio of photosynthetic electrontransport (PET) components and RuBisCO for Isochry-sis galbana grown under 9 different levels of nitrogenlimitation in chemostats. Increasing nutrient stress(i.e. decreasing growth rates) decreased cellular con-centrations of all measured components, with a con-stant stoichiometry for growth rates between 0.59 and0.96 d–1. At growth rates <0.59 d–1, the relationshipbetween PET components and RuBisCO abruptlychanged by 60% to a new equilibrium (Fig. 7). Themagnitude of this shift is the same as the decrease inPmax used in the nutrient-depleted PhotoAcc model.We are unaware of any physiological explanation forwhy such an abrupt change occurs, and few laboratorystudies have specifically addressed this problem.
Nutrient conditions represented by the AMT andBATS studies included nutrient-sufficient, phosphate-depleted (BATS) (Michaels et al. 1994, 1996), and pos-sibly nitrogen-depleted (AMT-2). We anticipate that
113
Mar Ecol Prog Ser 228: 103–117, 2002
an additional set of PhotoAcc equations will be neces-sary for modeling Pb
max in iron-limited regions. Iron-limitation causes unique stoichiometric changes inthe composition of the photosystems, most notably adecrease in cytochrome b6f and a higher PhotosystemII to Photosystem I ratio (PSII:PSI) (Guikema & Sher-man 1983, Sandmann 1985, Greene et al.1992, Straus1994, Vassiliev et al. 1995, Behrenfeld & Kolber 1999).A high PSII:PSI ratio will diminish chlorophyll-specificefficiencies for converting photochemical energy tothe reducing equivalents necessary for carbon fixa-tion, and should thus decrease Pb
max relative to similarlevels of growth limitation by nitrogen or phosphate.
Global implementation
The immediate goal of the research described herewas to develop an effective field-based model forPb
max. Our broader objective, however, is to establish arobust Pb
opt algorithm for estimating global oceanicprimary production from satellite ocean-color data.Implementing the PhotoAcc model will require tem-porally resolved mixed-layer depth and nutrient-depletion fields. As an initial attempt, monthly climato-logical fields can be assembled from historical data
sets (e.g. US National Oceanographic Data Center,Silver Spring, MD), but eventually data coincidentwith satellite ocean-color measurements will be pre-ferred. Coupled ocean models that assimilate satelliteobservational data (e.g. surface wind) could be used togenerate mixed-layer depth fields. Alternatively,remote-sensing technologies may soon permit globalsurveys of surface mixing depths, and research is nowunderway investigating potential lidar techniques forsuch measurements. Combining remotely sensed sea-surface temperature fields with nutrient-depletion/temperature relationships may prove useful for assess-ing temporal changes in nutrient status. Again, cou-pled ocean models may represent an alternative tech-nique. A variety of approaches may therefore be ex-plored for implementing the PhotoAcc model, andeach presents an exciting challenge for future re-search.
Perspective
Deciphering decadal-scale changes in oceanic pri-mary production from the much larger amplitude sig-nals of seasonal and interannual variability requiresforemost a long-term commitment to remote-sensingprograms monitoring changes in plant biomass, aswell as process-oriented models of depth-dependentchanges in phytoplankton biomass and assimilationefficiencies. An evolution from empirical to analyticalmodels of phytoplankton photosynthesis has beenrealized primarily in the spectral description of theunderwater light field (e.g. Platt & Sathyendranath1988, Morel 1991, Platt et al. 1991, Antoine et al. 1996).Demonstrable improvements in model performancefrom these achievements have, unfortunately, beenmasked by the overwhelming influence of ineffectivelocal-scale models of physiological variability (Balchet al. 1992, Behrenfeld & Falkowski 1997a,b, Siegel etal. 2000). The PhotoAcc model presented here pro-vides a framework for future improvements in the ana-lytical characterization of physiological variability and,based on comparisons with AMT and BATS data,already incorporates 2 critical forcing factors: light andnutrients.
The importance of environmental physical-chemicalvariability to physiological traits of algae is well illus-trated in the BATS data by the correspondencebetween changes in Pb
opt and the temporal rhythm ofseasonal mixing and stratification (Fig. 5). Nutrientavailability at this site clearly influences light-saturatedphotosynthesis at the seasonal scale, while higher fre-quency variations in Pb
opt are dominated by photo-acclimation responses to changes in the mixed-layerdepth, surface PAR, and phytoplankton biomass (due
114
Fig. 7. Isochrysis galbana. Relative changes in photosyntheticelectron transport (PET) components and RuBisCO for I. gal-bana maintained in nitrogen-limited chemostats at growthrates (µ) ranging from 0.18 to 0.96 d–1. Data are from Table 2in Falkowski et al. (1989). PET components are: (y) ReactionCenter II (RCII), (e) cytochrome-f, and (n) Reaction Center I;(D) ratio of RCII:RuBisCO. Data are normalized to averagevalue for the 4 highest growth rates. If RuBisCO concentra-tion is assumed proportional to light-saturated carbon fixa-tion (Pmax) (Sukenik et al. 1987), then the decrease inRCII:RuBisCO between µ = 0.59 and 0.48 divisions d–1 is of thesame magnitude (60%) as the decrease in Pmax assigned tonutrient-depleted conditions in the PhotoAcc model (Fig. 2b)

Behrenfeld et al.: Modeling phytoplankton photosynthesis
to associated changes in vertical light attenuation).The BATS data also suggest a significance in therecent history of a water column, as occasional mid-summer switches between nutrient-depleted and nutri-ent-sufficient Pb
opt values conceivably reflect the pass-ing of a mesoscale eddy with a significantly differenthistory than the water masses sampled the monthbefore and the month after.
The conceptual basis of our PhotoAcc model entails avariety of hypotheses regarding sources of variabilityin light-saturated, chlorophyll-normalized photosyn-thesis. These include a dominant kinetic responseto low-light over high-light exposure, an irradiance-dependence of the Calvin cycle capacity under chroniclow-light conditions, a nutrient-dependent switch inthe stoichiometric balance between light-harvestingand Calvin cycle components, and a temperature-independence of Pb
max above 5°C in natural phyto-plankton assemblages. Additional field and laboratorystudies will be necessary to test these hypotheses andto expand the PhotoAcc model to encompass iron-limiting conditions, temperature effects at <5°C, andpossibly species-dependent variability in phytoplank-ton pigment composition.
Acknowledgements. M.J.B. thanks John Chapman, RicardoLetelier, Paul Falkowski, Richard Geider, and Zbigniew Kol-ber for helpful discussions and inspiration, Elizabeth Stanleyfor encouragement, and the US National Aeronautics andSpace Administration (NASA) (Grant UPN161-35-05- 08) forits continued support. BATS data were assembled by TobyWestberry and Margaret O’Brien. The US JGOFS BATS pro-gram is supported by the US National Science Foundation. D.A.S’s contributions were supported by NASA. E.M. thanksManuel Varela and Beatriz Mouriño for assistance during theAMT studies and Alan Pomroy, Colin Griffiths and MalcolmWoodward for providing nutrient data. S.B.H. thanks J.Brown, C. Dempsey, S. Maritorena, and G. Moore for AMTsupport and J. Aiken for his diligence and commitment tosupporting high-quality AMT optical data.
LITERATURE CITED
Antoine D, André JM, Morel A (1996) Oceanic primary pro-duction 2. Estimation at global scale from satellite (coastalzone color scanner) chlorophyll. Global BiogeochemCycles 10:57–69
Balch WM, Byrne CF (1994) Factors affecting the estimate ofprimary production from space. J Geophys Res 99(C4):7555–7570
Balch W, Evans R, Brown J, Feldman G, McClain C, Esaias W(1992) The remote sensing of ocean primary productivity:use of new data compilation to test satellite models. J Geo-phys Res 97(C2):2279–2293
Banse K, Yong M (1990) Sources of variability in satellite-derived estimates of phytoplankton production in theEastern Tropical Pacific. J Geophys Res 95(C5):7201–7215
Beale SI, Appleman D (1971) Chlorophyll synthesis in Chlo-rella: regulation by degree of light limitation of growth.Plant Physiol (Wash DC) 47:230–235
Beardall J, Morris I (1976) The concept of light intensity adap-tation in marine phytoplankton: some experiments withPhaeodactylum tricornutum. Mar Biol 37:377–387
Behrenfeld MJ, Falkowski PG (1997a) Photosynthetic ratesderived from satellite-based chlorophyll concentration.Limnol Oceanogr 42:1–20
Behrenfeld MJ, Falkowski PG (1997b) A consumer’s guideto phytoplankton primary productivity models. LimnolOceanogr 42:1479–1491
Behrenfeld MJ, Kolber ZS (1999) Widespread iron limitationof phytoplankton in the south Pacific Ocean. Science 283:840–843
Behrenfeld MJ, Prasil O, Kolber ZS, Babin M, Falkowski PG(1998) Compensatory changes in photosystem II electronturnover rates protect photosynthesis from photoinhibi-tion. Photosynth Res 58:259–268
Chan AT (1978) Comparative physiological study of marinediatoms and dinoflagellates in relation to irradiance andcell size. I. Growth under continuous light. J Phycol 14:396–402
Cosper E (1982a) Effects of variations in light intensity on theefficiency of growth of Skeletonema costatum (Bacillario-phyceae) in a cyclostat. J Phycol 18:360–368
Cosper E (1982b) Influence of light intensity on diel variationin rates of growth, respiration, and organic release of amarine diatom: comparison of diurnally constant and fluc-tuating light. J Plankton Res 4:705–724
Cullen JJ, Lewis MR (1988) The kinetics of algal photoaccli-mation in the context of vertical mixing. J Plankton Res 10:1039–1063
Dierssen HM, Vernet M, Smith RC (2000) Optimizing modelsfor remotely estimating primary production in Antarcticcoastal waters. Antarct Sci 12:20–32
Dubinsky Z, Falkowski PG, Wyman K (1986) Light harvestingand utilization by phytoplankton. Plant Cell Physiol 27:1335–1349
Durbin EG (1974) Studies on the autecology of the marinediatom Thalassiosira nordenskiöldii Cleve: I. The influ-ence of daylength, light intensity, and temperature ongrowth. J Phycol 10:220–225
Eppley RW (1972) Temperature and phytoplankton growth inthe sea. Fish Bull 70:1063–1085
Eppley RW, Peterson BJ (1979) Particulate organic matter fluxand planktonic new production in the deep ocean. Nature282:677–680
Eppley RW, Sloan PR (1966) Growth rate of marine phyto-plankton: correlations with light absorption by cell chloro-phyll. Physiol Plant 19:47–59
Escoubas JM, Lomas M, LaRoche J, Falkowski PG (1995)Light intensity regulation of cab gene transcription is sig-naled by the redox state of the plastoquinone pool. ProcNatl Acad Sci USA 92:10237–10241
Falkowski PG (1980) Light-shade adaptation in marine phyto-plankton. In: Falkowski PG (ed) Primary production in thesea. Plenum Publising Corporation, New York, p 99–119
Falkowski PG (1981) Light-shade adaptation and assimilationnumbers. J Plankton Res 3:203–216
Falkowski PG, Kolber Z (1995) Variations in chlorophyllfluorescence yields in phytoplankton in the world oceans.Aust J Plant Physiol 22:341–355
Falkowski PG, Owens TG (1980) Light-shade adaptation.Plant Physiol 66:592–595
Falkowski PG, Wirick CD (1981) A simulation model of theeffects of vertical mixing on primary production. Mar Biol65:69–75
Falkowski PG, Owens TG, Ley AC, Mauzerall DC (1981)Effects of growth irradiance levels on the ratio of reaction
115
Mar Ecol Prog Ser 228: 103–117, 2002
centers in two species of marine phytoplankton. PlantPhysiol 68:969–973
Falkowski PG, Sukenik A, Herzig R (1989) Nitrogen limita-tion in Isochrysis galbana (Haptophyceae). II. Relativeabundance of chloroplast proteins. J Phycol 25:471–478
Faust MA, Sager JC, Meeson BW (1982) Response of Proro-centrum mariae-lebouriae (Dinophyceae) to light of differ-ent spectral qualities and irradiances: growth and pig-mentation. J Phycol 18:349–356
Field CB, Behrenfeld MJ, Randerson JT, Falkowski PG (1998)Primary production of the biosphere: integrating terres-trial and oceanic components. Science 281:237–240
Geider RJ (1987) Light and temperature dependence of thecarbon to chlorophyll ratio in microalgae and cyanobacte-ria: implications for physiology and growth of phytoplank-ton. New Phytol 106:1–34
Geider RJ, Osborne BA, Raven JA (1985) Light dependence ofgrowth and photosynthesis in Phaeodactylum tricornutum(Bacillariophyceae). J Phycol 21:609–619
Geider RJ, Osborne BA, Raven JA (1986) Growth, photosyn-thesis and maintenance metabolic cost in the diatom Phaeo-dactylum tricornutum at very low light levels. J Phycol 22:39–48
Geider RJ, MacIntyre HL, Kana TM (1996) A dynamic modelof photoadaptation in phytoplankton. Limnol Oceanogr41:1–15
Glover HE (1980) Assimilation numbers in cultures of marinephytoplankton. J Plankton Res 2:69–79
Goericke R, Welschmeyer NA (1992) Pigment turnover inthe marine diatom Thalassiosira weisflogii. I. The 14CO2-labeling kinetics of chlorophyll. J Phycol 28:498–507
Greene RM, Geider RJ, Kolber Z, Falkowski PG (1992) Iron-induced changes in light harvesting and photochemicalenergy conversion processes in eukaryotic marine algae.Plant Physiol 100:565–575
Guikema JA, Sherman LA (1983) Organization and functionof chlorophyll in membranes of cyanobacteria during ironstarvation. Plant Physiol 73:250–256
Harris GP (1978) Photosynthesis, productivity, and growth:the physiological ecology of phytoplankton. Arch Hydro-biol Spec Issues (Ergeb Limnol) 10:1–171
Heber U, Neimanis S, Dietz KJ (1988) Fractional control ofphotosynthesis by the QB protein, the cytochrome f/b6
complex and other components of the photosyntheticapparatus. Planta (Berlin) 173:267–274
Hood RR, Abbott MR, Huyer A (1991) Phytoplankton andphotosynthetic light response in the coastal transition zoneof northern California in June 1987. J Geophys Res 96:14769–14780
Hooker SB, Maritorena S (2000) An evaluation of oceano-graphic optical instruments and deployment methodolo-gies. J Atmos Oceanic Techol 17:811–830
Knap AH and 11 others (1993) BATS methods — March 1993,BATS method manual, version 3. US JGOFS Planning andCoordination Office, Woods Hole, MA
Kok B (1956) On the inhibition of photosynthesis by intenselight. Biochim Biophys Acta 21:234–244
Kolber Z, Falkowski PG (1993) Use of active fluorescenceto estimate phytoplankton photosynthesis in situ. LimnolOceanogr 38:1646–1665
Lapointe BE, Dawes CJ, Tenore KR (1984) Interactions be-tween light and temperature on the physiological eco-logy of Gracilaria tikvahiae (Gigartinales: Rhodophyta). II.Nitrate uptake and levels of pigments and chemical con-stituents. Mar Biol 80:171–178
Leverenz JW, Falk S, Pilström CM, Samuelsson G (1990)The effects of photoinhibition on the photosynthetic light-
response curve of green plant cells (Chlamydomonas rein-hardtii). Planta 182:161–168
Lewis MR, Cullen JJ, Platt T (1984) Relationship betweenvertical mixing and photoadaptation of phytoplankton:similarity criteria. Mar Ecol Prog Ser 15:141–149
Longhurst A (1995) Seasonal cycles of pelagic production andconsumption. Prog Oceanogr 36:77–167
Longhurst A, Sathyendranath S, Platt T, Caverhill C (1995) Anestimate of global primary production in the ocean fromsatellite radiometer data. J Plankton Res 17:1245–1271
Malone TC, Garside C, Neale PJ (1980) Effects of silicatedepletion on photosynthesis by diatoms in the plume ofthe Hudson River. Mar Biol 58:197–204
Marañón E, Holligan PM (1999) Photosynthetic parameters ofphytoplankton from 50° N to 50° S in the Atlantic Ocean.Mar Ecol Prog Ser 176:191–203
Marañón E, Holligan PM, Varela M, Mouriño B, Bale A (2000)Basin-scale variability of phytoplankton biomass, produc-tion, and growth in the Atlantic Ocean. Deep-Sea Res Part I47:825–857
Megard RO (1972) Phytoplankton, photosynthesis, and phos-phorus in Lake Minnetonka, Minnesota. Limnol Oceanogr17:68–87
Michaels AF, Knap AH (1996) Overview of the U.S. JGOFSBermuda Atlantic time-series study and the HydrostationS program. Deep-Sea Res Part II 43:157–198
Michaels AF, Knap AH, Dow RL, Gundersen K and 8 others(1994) Seasonal patterns of ocean biogeochemistry at theUnited States JGOFS Bermuda Atlantic time-series studysite. Deep-Sea Res Part I 41:1013–1038
Michaels AF, Olson D, Sarmiento JL, Ammerman JW and 5others (1996) Inputs, losses, and transformations of nitro-gen and phosphorous in the pelagic north Atlantic Ocean.Biogeochemistry 35:181–226
Morel A (1991) Light and marine photosynthesis: a spectralmodel with geochemical and climatological implications.Prog Oceanogr 26:263–306
Morel A, Berthon JF (1989) Surface pigments, algal biomassprofiles, and potential production of the euphotic layer:relationships reinvestigated in view of remote-sensingapplications. Limnol Oceanogr 34:1545–1562
Morris I (1981) Photosynthetic products, physiological state,and phytoplankton growth. Can Bull Fish Aquat Sci 210:83–102
Myers J (1946) Culture conditions and the development of thephotosynthetic mechanism. J Gen Physiol 29:419–427
Orellana MV, Perry MJ (1992) An immunoprobe to measureRubisco concentrations and maximal photosynthetic ratesof individual phytoplankton cells. Limnol Oceanogr 37:478–490
Paasche E (1967) Marine plankton algae grown with light-dark cycles. I. Coccolithus huxleyi. Physiol Plant 20:946–956
Paasche E (1968) Marine plankton algae grown with light-dark cycles. II. Ditylum brightwellii and Nitzschiaturgidula. Physiol Plant 21:66–77
Platt T, Sathyendranath S (1988) Oceanic primary production:estimation by remote sensing at local and regional scales.Science 241:1613–1620
Platt T, Sathyendranath S (1993) Estimators of primary pro-duction for interpretation of remotely sensed data onocean color. J Geophys Res 98:14561–14567
Platt T, Caverhill C, Sathyendranath S (1991) Basin-scale esti-mates of oceanic primary production by remote sensing:the North Atlantic. J Geophys Res 96:15147–15159
Post AF, deWit R, Mur LR (1985) Interaction between temper-ature and light intensity on growth and photosynthesis of
116

Behrenfeld et al.: Modeling phytoplankton photosynthesis
the cyanobacterium Oscillatoria agardhii. J Plankton Res7:487–495
Raps S, Wyman K, Siegelman HW, Falkowski PG (1983)Adaptation of the cyanobacterium Microcystis aeruginosato light intensity. Plant Physiol 72:829–832
Richardson K, Beardall J, Raven JA (1983) Adaptation of uni-cellular algae to irradiance: an analysis of strategies. NewPhytol 93:157–191
Riper DM, Owens TG, Falkowski PG (1979) Chlorophyll turn-over in Skeletonema costatum, a marine plankton diatom.Plant Physiol 64:49–54
Robins DB, Bale AJ, Moore GF, Rees NW and 6 others (1996)AMT-1 cruise report and preliminary results. In: HookerSB, Firestone ER (eds) NASA Tech Memo 104566, Vol 35.NASA Goddard Space Flight Center, Greenbelt, MD
Ryther JH (1956) Photosynthesis in the ocean as a function oflight intensity. Limnol Oceanogr 1:61–70
Ryther JH, Yentsch CS (1957) The estimation of phytoplank-ton production in the ocean from chlorophyll and lightdata. Limnol Oceanogr 2:281–286
Sandmann G (1985) Consequences of iron deficiency onphotosynthetic and respiratory electron transport in blue-green algae. Photosynth Res 6:261–271
Siegel DA, Michaels AF, Sørensen J, O’Brien MC, HammerMA (1995a) Seasonal variability of light availability andits utilization in the Sargasso Sea. J Geophys Res 100:8695–8713
Siegel DA, O’Brien MC, Sørensen JC, Konnoff D, Fields E(1995b) BBOP data processing and sampling procedures.US JGOFS Planning Rep No 19, US JGOFS Planning andCoordination Office, Woods Hole, MA
Siegel DA, Westberry TK, O’Brien MC, Nelson NB and 10others (2000) Bio-optical modeling of primary productionon regional scales: the Bermuda biooptics project. Deep-Sea Res Part II 48:1865–1896
Steemann Nielsen E (1952) The use of radio-active carbon(C14) for measuring organic production in the sea. J ConsInt Explor Mer 18:117–140
Steemann Nielsen E, Hansen VK (1959) Light adaptation inmarine phytoplankton populations and its interrelationwith temperature. Physiol Plant 12:353–370
Steemann Nielsen E, Jørgensen EG (1968) The adaptation ofplankton algae. I. General part. Physiol Plant 21:401–413
Stitt M (1986) Limitation of photosynthesis by carbon metabo-lism, I. Evidence for excess electron transport capacity inleaves carrying out photosynthesis in saturating light andCO2. Plant Physiol 81:1115–1122
Straus NA (1994) Iron deprivation: physiology and generegulation. In: Bryant DA (ed) The molecular biology ofcyanobacteria. Kluwer Academic, New York, p 731–750
Sukenik A, Bennett J, Falkowski PG (1987) Light-saturatedphotosynthesis-limitation by electron transport or carbonfixation? Biochim Biophys Acta 891:205–215
Talling JF (1957) The phytoplankton population as a com-pound photosynthetic system. New Phytol 56:133–149
Terry KL, Hirata J, Laws EA (1983) Light-limited growth oftwo strains of the marine diatom Phaeodactylum tricornu-tum Bohlin: chemical composition, carbon partitioning,and the diel periodicity of physiological processes. J ExpMar Biol Ecol 68:209–227
Vassiliev IR, Kolber Z, Wyman KD, Mauzerall D, Shukla VK,Falkowski PG (1995) Effects of iron limitation on photo-system II composition and light utilization in Dunaliellatertiolecta. Plant Physiol 109:963–972
Verity PG (1981) Effects of temperature, irradiance, and day-length on the marine diatom Leptocylindrus danicusCleve: I. Photosynthesis and cellular composition. J ExpMar Biol Ecol 55:79–91
Vincent WF, Bertrand N, Frenette JF (1994) Photoadaptationin intermittent light across the St. Lawrence estuary fresh-water-saltwater transition zone. Mar Ecol Prog Ser 110:283–292
Weinbaum SA, Gressel J, Reisfeld A, Edelman M (1979)Characterization of the 32,000 Dalton chloroplast mem-brane protein: probing its biological function in Spirodela.Plant Physiol 64:828–832
Wright JC (1959) Limnology of Canyon Ferry Reservoir: phyto-plankton standing crop and primary production. LimnolOceanogr 4:235–245
Yoder JA (1979) Effect of temperature on light-limited growthand chemical composition of Skeletonema costatum (Bacil-lariophyceae). J Phycol 15:362–370
117
Editorial responsibility: Otto Kinne (Editor),Oldendorf/Luhe, Germany
Submitted: October 24, 2000; Accepted: May 10, 2001Proofs received from author(s): February 12, 2002