1 purity analysis and impurities determination by · pdf filepurity analysis and impurities...
TRANSCRIPT

1
1 Purity Analysis and Impurities Determination by Reversed-Phase High-Performance Liquid Chromatography
Hagen Cramer, Kevin J. Finn, and Eric HerzbergGirindus America, Inc.Cincinnati, Ohio
1.1 IntroductIon
The increasing significance of oligonucleotides as therapeutic agents necessitates a high level of quality control. In such protocols, chromatographic analysis of crude and final active pharmaceu-tical ingredients (API) is necessary to ensure the detection of contaminants at concentration lev-els down to trace amounts relative to the drug. A combination of chromatographic techniques, in particular reverse-phased high-performance liquid chromatography (RP-HPLC), anion-exchange (AEX) HPLC (Chapter 2), and mass spectrometry (Chapters 4 and 5), is needed for the identification and structural elucidation of by-products and degradation products resulting from the production
contents
1.1 Introduction ..............................................................................................................................11.2 Historical Aspects .....................................................................................................................21.3 Reverse-Phased High-Performance Liquid Chromatography Columns...................................21.4 Stationary Phases ......................................................................................................................71.5 Mobile Phases ......................................................................................................................... 101.6 Retention Time and Separation Selectivity Prediction Models .............................................. 141.7 Selected Practical Examples of IP-HPLC .............................................................................. 17
1.7.1 Column Influence on Chromatography ...................................................................... 171.7.2 Mobile Phase Influence on Chromatography .............................................................241.7.3 HPLC versus UPLC ....................................................................................................251.7.4 Temperature Influences of Chromatography ..............................................................271.7.5 Sample Preparation .....................................................................................................28
1.7.5.1 Salt Effects ...................................................................................................281.7.5.2 Addition of Buffer ........................................................................................341.7.5.3 Concentration and Injection Volume ........................................................... 35
1.7.6 Analysis of Oligonucleotides Containing Phosphorothioate versus Phosphate Backbones ...................................................................................................................36
1.7.7 Denaturing versus Nondenaturing Ion-Pairing Methods ........................................... 391.8 Summary ................................................................................................................................ 41Acknowledgments ............................................................................................................................ 42References ........................................................................................................................................ 42
K11050_C001.indd 1 11/15/2010 6:28:54 PM
2 Handbook of Analysis of Oligonucleotides and Related Products
process. In clinical studies employing oligonucleotides, high sensitivity and low sample requirement for analytical methods are requisite for the identification of metabolites (Chapter 8).
1.2 HIstorIcal aspects
Reversed-phase HPLC (RP-HPLC) is one of the most important techniques for the characteriza-tion of oligonucleotides. Over the years, the ability to resolve impurities from the main product peak has increased dramatically by introduction of smaller chromatographic particle sizes. Another advantage of RP-HPLC is that mobile phases that work well for separating impurities and at the same time are compatible with electrospray ionization mass spectrometry (ESI-MS) are available (see Chapter 4).
Just 10–15 years ago, the typical particle size used for analytical reversed-phase columns was 5 μm. To achieve good separations on 5 μm particle-size columns, fairly long columns were needed (up to 250 mm), resulting in long run times. Typically, these columns had a diameter of 4.6 mm. In the late nineties, the first columns with 3.5-μm particle size useful for oligonucleotide analysis came to market. With the smaller particle-size beads, it now was possible to achieve better separations with shorter columns, reducing typical column length to 50 mm (up to 150 mm maximum). This resulted in shorter run times as well. In addition, more accurate HPLC pumps allowed reduction of the column diameter to 2.1 mm, thereby further decreasing buffer consumption. Modern HPLC systems could also tolerate the attendant increased pressure associated with media having smaller particle sizes.
Recently, even smaller particle sizes were introduced with the smallest ones useful for oligo-nucleotide analysis being 1.7 μm. Particle sizes of below 1.7 μm, while useful for small molecule analytes, result in degradation of the oligonucleotide during analysis owing to the increased shear-ing forces present at these high back pressures. As it is, 1.7 μm particle-size sorbents generate back pressures of over 400 bar (ca. 6000 psi), making them incompatible with traditional HPLC systems. To achieve similar column plates without increasing back pressures, fused-core (also called core-shell) particle technology was introduced by Joseph J. Kirkland in 20071,2 based on his earlier work with poroshell silicas.3,4 Thereby, the all-porous particle typically used is replaced with a nonporous core surrounded by a porous shell.
While polystyrene-based columns have proven successful on the preparative scale owing to their increased chemical stability, the analytical reversed-phase HPLC market is dominated by silica gel or silica-based resins.
1.3 reverse-pHased HIgH-performance lIquId cHromatograpHy columns
There are multiple companies that offer reversed-phase HPLC columns. Table 1.1 lists commer-cially available silica-based reversed-phase HPLC columns. Columns most widely used in oligo-nucleotide separations are available from Agilent (Zorbax), Phenomenex (Clarity), and Waters (X-Terra®, X-Bridge™, Acquity BEH).
Typical particle sizes for columns from all manufacturers used to be 5 μm for many years until about 10–15 years ago. In the mid to late 1990s, smaller particle-size columns were introduced and recently sub-2 μm particles have started gaining in popularity. However, not all column manufac-turers made the switch to sub-2 μm particle-size resins. The use of sub-2 μm particle sizes allows the use of much shorter columns without losing separation power because theoretical plates can be maintained.5,6 A reduction of the particle diameter by 50% results approximately in a doubling of the plate count. Therefore, fast and efficient separations can be achieved because separation time is proportional to column length. A shorter column run at the same velocity as a longer column also uses less solvent. However, the small particle sizes result in high back pressure a traditional HPLC system cannot withstand. New ultra-high pressure systems had to be developed. These new systems are called U-HPLCs or UPLCs and at this time only a handful of companies are offering
K11050_C001.indd 2 11/15/2010 6:28:54 PM

Purity Analysis and Impurities Determination 3
such systems, which are listed in Table 1.2. Systems are being improved continuously because requirements on components due to the increased pressure are much more rigorous in comparison to traditional HPLC systems.
Silica-based bead chemistry has traditionally been the state of the art because of its good mechanical strength, spherical shape and high chromatographic efficiency, and compatibility with a host of organic solvents. Two chief problems associated with the use of silica-based cores are resolu-tion of basic analytes and stability of the bonded phase toward low- and particularly high-pH mobile phases. Several modifications to the silica-bonded phase have been implemented in order to address these issues,7 including incorporation of polar functional groups,8 sterically hindered silanes, biden-tate, or hybrid organic–inorganic stationary phases.9
The XTerra column, first introduced in 1999 by Waters (Milford, MA), uses patented hybrid particle technology (HPT) to overcome traditional silica’s instability to high pH. The core bead is composed of a methylpolyethoxysilane (MPEOS) monomer synthesized by condensation of tetraethoxysilane (TEOS) and methyltriethoxysilane (MTEOS). XTerra’s stationary phase demonstrates equivalent efficiency to state of the art silica-based C18 columns while addressing the problem of pH instability. Hybrid particle technology, so named because it combines inorganic (silica) with organic (polymeric) bead chemistry, describes the replacement of one of every three silyl groups with a methyl group.
taBle 1.1Hplc column manufacturers
manufacturer Brand name sub-2 μm particles
Advanced Chromatography Technologies ACE No (3 μm minimum)
Agilent Zorbax Eclipse Plus & Extend Yes
Azko-Nobel Kromasil No (2.5 μm minimum)
Bischoff ProntoPEARL Yes
Grace/Alltech Alltime, Vydac, VisionHT Yes
Beckman-Coulter Ultrasphere ODS No (5 μm minimum)
EMD/Merck LiChrospher No (5 μm minimum)
GL Sciences Intersil No (2 μm minimum)
Interchim Uptisphere No (5 μm minimum)
Macherey-Nagel Nucleosil, Nucleodur Yes
Phenomenex Gemini, Luna & Clarity No (3 μm minimum)
Resek Allure, Ultra, Pinnacle Yes
Sepax GP series Yes
Shimadzu/Shant Pathfinder Yes
Supelco Ascentis No (3 μm minimum)
Thermo Hypersil Gold Yes
Waters X-Terra, X-Bridge & Acquity BEH Yes
YMC Several Yes
taBle 1.2uplc systems
manufacturer name of system pressure limit, Bar
Agilent 1200 Series1290 Infinity LC
6001200
Hitachi LaChrom ULTRA L-2160U 600
Thermo Accela 1000
Waters Acquity 1000
K11050_C001.indd 3 11/15/2010 6:28:54 PM
4 Handbook of Analysis of Oligonucleotides and Related Products
The substitution of the methyl for the more polar silanol dramatically increases the hydrophobicity of the core structure of the particle backbone. The introduction of the hybrid particle offers increased robustness and improved resolution of basic compounds. In 2005, Waters launched a second genera-tion hybrid column called XBridge with bridged ethyl hybrid (BEH) technology. The polyethoxysi-lane core marketed as BEH technology relies on cross-linking TEOS with bis(triethoxysilyl)ethane (BTEE). The result was a material of much greater mechanical stability owing to the increased level of crosslinking while maintaining the superior pH stability of hybrid columns. Those features make the BEH technology also very attractive for ultra performance liquid chromatography instrument (UPLC) applications, where the increased pressures necessitate increased stability of the beads. BEH columns are available in a variety of particle sizes from 1.7 to 10 µm, which allows the BEH technol-ogy to be adapted to both HPLC and UPLC applications. BEH technology based UPLC columns are called Acquity UPLC columns and were introduced shortly after the XBridge HPLC columns. The recommended operating pH range for BEH-based columns is from 1 to 12.
Column lifetime is dramatically impacted by pH, leading to partial hydrolysis of the bonded phase, and resulting in variable retention times and inconsistent performance. The prevailing use of BEH-based columns is mainly due to its robustness toward wide range of pH, stability toward dimethyl sulfoxide (DMSO) (important for analysis of crude RNA), and high mass loading capac-ity. The separation quality is comparable to capillary gel electrophoresis without compromising yield. The BEH-based columns are advantageous for the analysis of dye or lipidoyl labeled oligos because the added hydrophobicity increases separation efficiency. The BEH-based columns are available in variety of phases (C18, C8, Phenyl, and Shield RP18) and also boast long column life-time (>1000 injections) at elevated temperatures (60°C).
Zorbax Eclipse Plus columns were introduced by Agilent (Santa Clara, CA) in 2006 and are offered at particle sizes of 1.8, 3, and 5 μm to accommodate a wide range of analytical HPLC appli-cations. Eclipse Plus columns are available at multiple selectivity choices (C18, C8, and Phenyl) for optimized resolution of all sample types and provide high resolution and excellent peak shape of all types of compounds at pH 2–9. Eclipse Plus columns achieve superior performance through extra dense bonding and a precise double-endcapping process. Agilent also offers columns espe-cially developed for low- and high-pH applications. Zorbax SB (StableBond) columns are made using bulky, unique silanes that sterically protect the siloxane bond not including any acid-labile endcapping. The result is vastly improved column life and extraordinary chemical and temperature stability in the pH 1–6 range for a wide variety of phases (SB-C3, SB-CN, SB-Phenyl, SB-C8, and SB-C18). Zorbax Extend-C18 columns incorporate a unique bidentate ring structure, having a pro-pylene bridge in combination with the bulky C18 group, thereby shielding the silica support from dissolution. Such bonded silanes, combined with a double-endcapping process, protect the silica from dissolution at high pH—up to pH 11.5.
Porous outer layer
Solid core
0.35 μm
0.35 μm
1.9 μm 2.6 μm
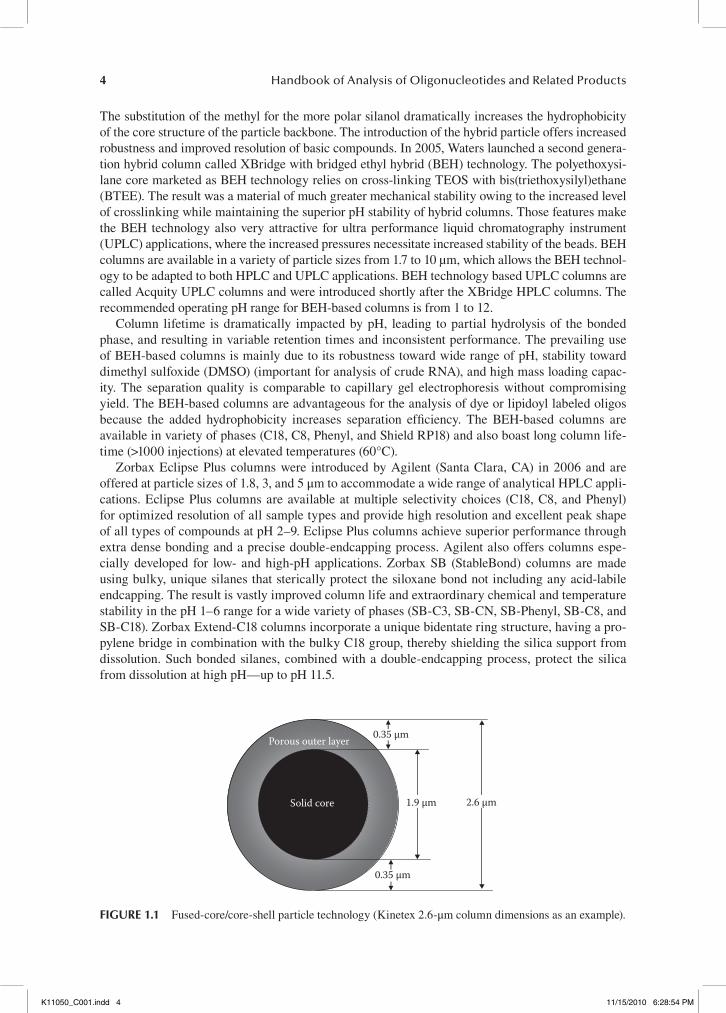
fIgure 1.1 Fused-core/core-shell particle technology (Kinetex 2.6-μm column dimensions as an example).
K11050_C001.indd 4 11/15/2010 6:28:54 PM

Purity Analysis and Impurities Determination 5
Silica-based sorbents of RP-HPLC column used for oligonucleotide analysis typically have pore sizes of about 100 Å. For the three examples given above, the pore sizes are 120 Å for the XTerra, 135 Å for the XBridge, and 95 Å for the Zorbax Eclipse Plus. However, for larger oligonucleotides, for example aptamers, 300 Å pore size columns tend to yield better results.
Fused-core or shell-core technology provides an elegant way around the pressure limits of tradi-tional HPLC-systems. Particles with a solid core and porous shell behave in regards to pressure like an equivalently sized fully porous particle while theoretical plate numbers are similar to a sub-2 μm particle column (see Figure 1.1). Originally developed by F. F. Kirkland (Advanced Materials Technology, Wilmington, DE),1,2,10 such columns are now available from several different compa-nies (see Table 1.3) and are comparable in performance to sub-2 μm columns.11 Kinetix columns are available as C18 and pentafluorophenyl (PFP) for a variety of separation applications.
The key feature of the fused-core technology is a spherical porous shell grown on the surface of a solid silica-based bead. It addresses two of the most critical effects of column performance—the eddy diffusion (also known as the multipath effect) and resistance to mass transfer.12 Shown in Figure 1.2 is a Van Deemter plot13—a graphical description of the three parameters that most con-tribute to band broadening: (1) the eddy diffusion or “A term,” governed by the particle size, (2) the longitudinal diffusion or “B term,” and finally (3) the “C term,” which is related to the kinetics of resistance to mass transfer. By controlling the particle-size distribution, the band broadening effect of eddy diffusion is dramatically diminished. The A term, in accordance with the Van Deempter plot, is independent of mobile phase velocity and is related solely to average diameter of the particle. The C term is also dependent on particle size.
The distribution of analyte molecules in the stationary phase and the mobile phase is governed by the kinetics of diffusion between the two phases for the analyte. By introducing a semi-porous (rather than fully porous shell), the analyte spends less time diffusing in and out of pore on the
taBle 1.3fused-core/shell-core Hplc columns
manufacturer Brand name particle size (core/outer layer), μm
Agilent Poroshell 120 2.7 (1.7/2 × 0.5)
MAC-MOD Analytical Halo 2.7 (1.7/2 × 0.5)
Phenomenex Kinetex 2.6 (1.9/2 × 0.35)1.7 (1.25/2 × 0.23)
Supelco Ascentis Express 2.7 (1.7/2 × 0.5)
H = A · dparticle + B/μ + C · de2 · μ
Mobile phase velocity (μ)
Plat
e hei
ght (H
)
B
C
A
fIgure 1.2 Van Deempter plot and equation of plate height (H) vs. mobile phase velocity (μ); A: eddy diffusion; B: longitudinal diffusion; C: kinetics of resistance to mass transfer; dparticle: particle diameter; de: effective particle size. de represents the effective particle size and is equal to the particle diameter in the case of fully porous particles.
K11050_C001.indd 5 11/15/2010 6:28:54 PM

6 Handbook of Analysis of Oligonucleotides and Related Products
stationary phase, thus reducing the dispersive effect known as resistance to mass transfer. Figure 1.3 depicts a typical Van Deempter plot. The resistance to mass transfer, or C term, is carried by the square of the effective particle size and varies sharply at high flow rates.
By minimizing the particle size, the Eddy diffusion A term and mass transfer C terms are mini-mized and the result is an ability to carry out separation at higher mobile phase flow rates without sacrificing plate height. Figure 1.4 represents a more optimized Van Deempter plot resulting from the use of smaller particle size.
Silica-based resins have dominated the analytical HPLC market of microparticulate sorbents since the inception of HPLC almost 40 years ago. While polystyrene-based particles are widely used in larger-scale purifications, there are only a few reports on their use in analytical HPLC. The PRP-1 column from Hamilton, NV, was introduced in the early 1980s and has since then been employed for preparative,14–16 as well as analytical oligonucleotide separations.17,18 The PRP col-umns are polymeric reversed-phase column and are composed out of a copolymers of styrene and divinylbenzene (PS-DVB) and are available at particle sizes of 5–20 μm and at pore sizes of 100 (PRP-1) and 300 Å (PRP-3). The ruggedness of the PS-DVB particles make such columns an attrac-tive choice for high-pH applications or when the analyte or crude sample is contaminated with other aggressive chemicals not compatible with silica (e.g., RNA purifications).
Over the years others have reported the use of PS-DVB columns for the analysis and purification of oligonucleotides as well. Huber et al. reported good resolution of phosphorylated from dephos-phorylated oligonucleotides when using columns filled with PS-DVB acquired from Riedel-de Haën (Seelze, Germany) and adding poly(vinyl alcohol) during polymerization.19,20 Gelhaus et al. was
Optimumvelocity
Mobile phase velocity (μ)
Minimum H
Plat
e hei
ght (H
)
B CA
fIgure 1.4 The effect of smaller particle size on the Van Deempter plot.
Optimumvelocity
Mobile phase velocity (μ)
A
CB
Minimum H
Plat
e hei
ght (H
)
fIgure 1.3 Typical Van Deempter plot of plate height (H) vs. mobile phase velocity (μ).
K11050_C001.indd 6 11/15/2010 6:28:55 PM
Purity Analysis and Impurities Determination 7
able to achieve separation of 18-mers of the same base sequence but with differing alkyl modifica-tions with a OligoSep column (Transgenomics, Omaha, NE) comprised of nonporous, C18 modified polystyrene-divinylbenzene (PS-DVB).21
Lloyd et al. reported good resolution for long oligonucleotides and double-stranded DNA ladders using PLRP-S columns (Polymer Laboratories, UK). These columns are based on rigid macropo-rous reversed-phase poly(styrene–divinylbenzene)–based sorbents and come at many different pore sizes of 100 to 4000 Å.22
For more than 40 years, columns packed with microparticulate sorbents have been successfully used in high-performance liquid chromatography (HPLC). Despite many advantages, HPLC col-umns packed with microparticulate, porous stationary phases have some limitations, such as the relatively large void volume between the packed particles and the slow diffusional mass transfer of solutes into and out of the stagnant mobile phase present in the pores of the separation medium.23 One approach to diminish the problem of restricted mass transfer and interparticle void volume is the use of monolithic chromatographic beds, in which the separation medium consists of a continu-ous rod of a rigid, porous polymer that has no interstitial volume but only internal porosity. Because of the absence of interparticle volume, all of the mobile phase is forced to flow through the pores of the separation medium.24 According to theory, mass transport is enhanced by such convection and enhances chromatographic efficiency.25 Monolithic chromatographic beds are usually prepared by polymerization of suitable monomers and porogens in a stainless steel or fused silica tube that acts as a mold.26 The porous structure is achieved as a result of the phase separation that occurs during the polymerization of a monomer or a mixture of both a cross-linking monomer and a porogenic solvent.27
Huber and coworkers have demonstrated that the chromatographic separation performance of cross-linked, norbornene-based, monolithic capillary columns prepared via ring-opening metath-esis polymerization (ROMP) indicates good separation capabilities for single- and double-stranded nucleic acids.28 Such monolithic columns were able to separate diastereoisomers of short phospho-rothioate oligonucleotides. Longer PS oligomers coalesced into a single peak, where peak widths decreased with increasing length of the oligonucleotides. Four homologous oligodeoxynucleotides, ranging in length from 24 to 27 nucleotides, could be baseline separated within 7 min using a tri-ethylammonium acetate buffer and an acetonitrile gradient. Over the years, Huber and others have published extensively on the analysis of oligonucleotide and nucleic acids using monolithic capillary columns.29–42
Further, Huber and coworkers proposed a new model for predicting the retention time of oligonucleotides.43,44 Their model is based on support vector regression using features derived from base sequence and predicted secondary structure of oligonucleotides. Because of the secondary structure information, their model is applicable even at relatively low temperatures where the sec-ondary structure is not suppressed by thermal denaturing.
1.4 statIonary pHases
The most commonly used stationary phase in reversed-phase HPLC is based on octadecylsilane (ODS) or C18 groups. There are several reasons for this, but one of the strongest is tradition. Early column packings were based on C18 because C18-based silanes were readily available at that time and reasonable in cost. Another reason for the popularity of C18 is the relatively high organic con-tent that can be reacted onto silica supports. In addition the long-chain C18 ligand shows greater stability at both low and higher pH, compared to shorter chain ligands resulting in better separation reproducibility. However, there are some disadvantages to C18 bonded phases packings. Column packings with shorter functional groups can reequilibrate more rapidly after a gradient elution separation. Densely bonded C18 packings can also exhibit phase collapse when mobile phases contain a high aqueous content.45 Often, the starting concentration of organic modifier must be less than 5% for adequate separation of very polar compounds. When exposed to high concentration of
K11050_C001.indd 7 11/15/2010 6:28:55 PM
8 Handbook of Analysis of Oligonucleotides and Related Products
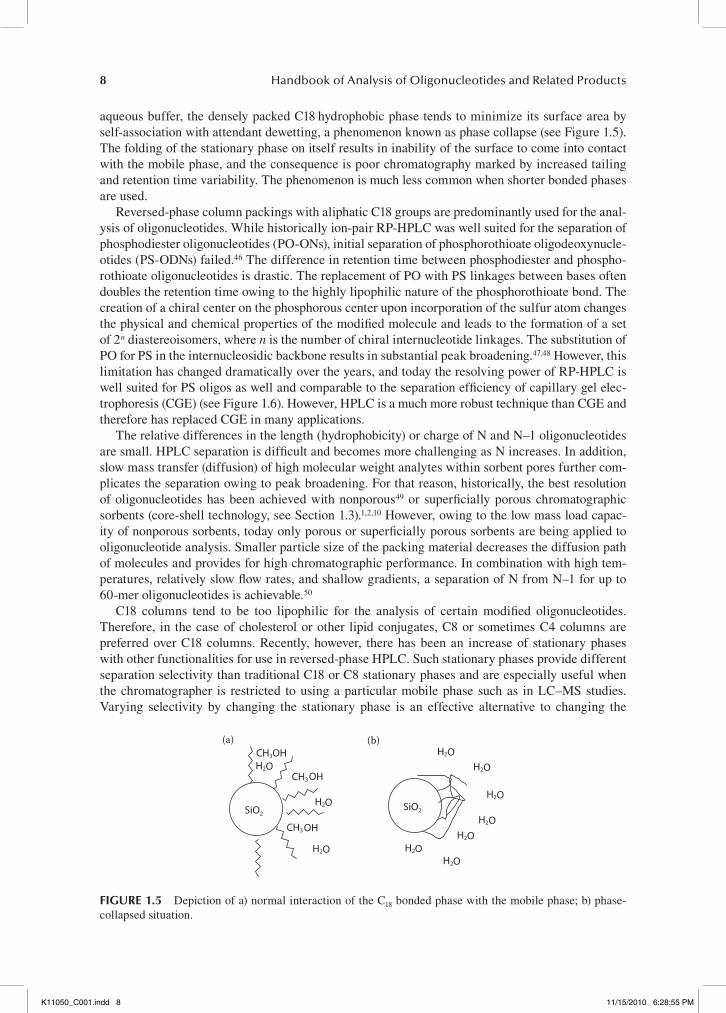
aqueous buffer, the densely packed C18 hydrophobic phase tends to minimize its surface area by self-association with attendant dewetting, a phenomenon known as phase collapse (see Figure 1.5). The folding of the stationary phase on itself results in inability of the surface to come into contact with the mobile phase, and the consequence is poor chromatography marked by increased tailing and retention time variability. The phenomenon is much less common when shorter bonded phases are used.
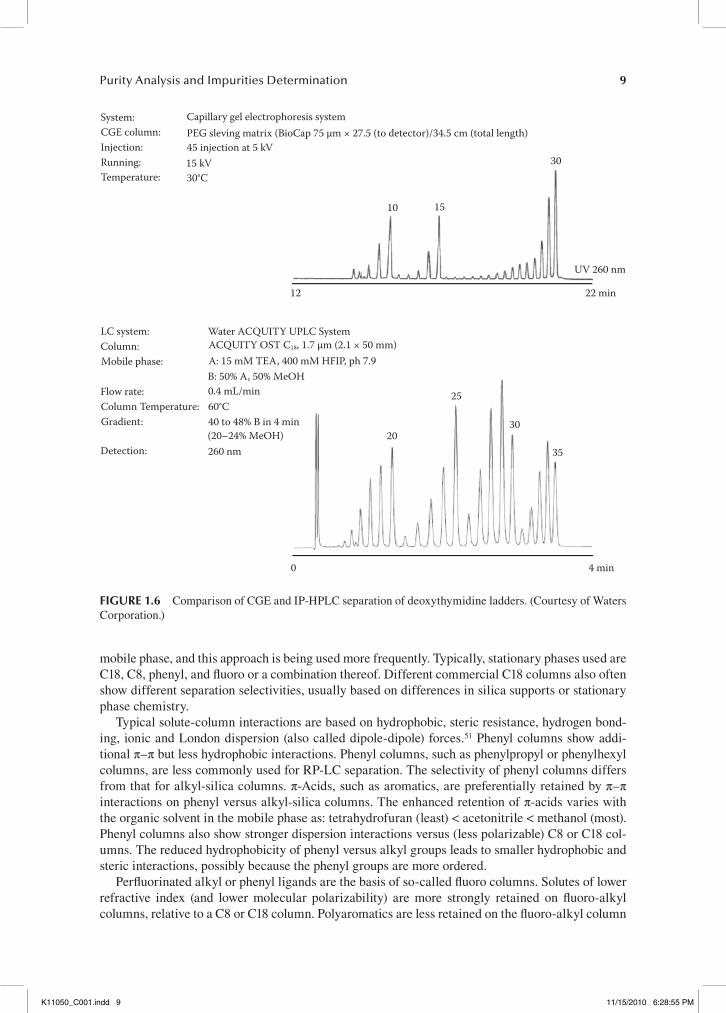
Reversed-phase column packings with aliphatic C18 groups are predominantly used for the anal-ysis of oligonucleotides. While historically ion-pair RP-HPLC was well suited for the separation of phosphodiester oligonucleotides (PO-ONs), initial separation of phosphorothioate oligodeoxynucle-otides (PS-ODNs) failed.46 The difference in retention time between phosphodiester and phospho-rothioate oligonucleotides is drastic. The replacement of PO with PS linkages between bases often doubles the retention time owing to the highly lipophilic nature of the phosphorothioate bond. The creation of a chiral center on the phosphorous center upon incorporation of the sulfur atom changes the physical and chemical properties of the modified molecule and leads to the formation of a set of 2n diastereoisomers, where n is the number of chiral internucleotide linkages. The substitution of PO for PS in the internucleosidic backbone results in substantial peak broadening.47,48 However, this limitation has changed dramatically over the years, and today the resolving power of RP-HPLC is well suited for PS oligos as well and comparable to the separation efficiency of capillary gel elec-trophoresis (CGE) (see Figure 1.6). However, HPLC is a much more robust technique than CGE and therefore has replaced CGE in many applications.
The relative differences in the length (hydrophobicity) or charge of N and N–1 oligonucleotides are small. HPLC separation is difficult and becomes more challenging as N increases. In addition, slow mass transfer (diffusion) of high molecular weight analytes within sorbent pores further com-plicates the separation owing to peak broadening. For that reason, historically, the best resolution of oligonucleotides has been achieved with nonporous49 or superficially porous chromatographic sorbents (core-shell technology, see Section 1.3).1,2,10 However, owing to the low mass load capac-ity of nonporous sorbents, today only porous or superficially porous sorbents are being applied to oligo nucleotide analysis. Smaller particle size of the packing material decreases the diffusion path of molecules and provides for high chromatographic performance. In combination with high tem-peratures, relatively slow flow rates, and shallow gradients, a separation of N from N–1 for up to 60-mer oligonucleotides is achievable.50
C18 columns tend to be too lipophilic for the analysis of certain modified oligonucleotides. Therefore, in the case of cholesterol or other lipid conjugates, C8 or sometimes C4 columns are preferred over C18 columns. Recently, however, there has been an increase of stationary phases with other functionalities for use in reversed-phase HPLC. Such stationary phases provide different separation selectivity than traditional C18 or C8 stationary phases and are especially useful when the chromatographer is restricted to using a particular mobile phase such as in LC–MS studies. Varying selectivity by changing the stationary phase is an effective alternative to changing the
(a)CH3OHH2O
CH3OH
H2O
CH3OH
H2O
SiO2
(b)H2O
H2O
H2O
H2OH2O
H2OH2O
SiO2
fIgure 1.5 Depiction of a) normal interaction of the C18 bonded phase with the mobile phase; b) phase-collapsed situation.
K11050_C001.indd 8 11/15/2010 6:28:55 PM
Purity Analysis and Impurities Determination 9
mobile phase, and this approach is being used more frequently. Typically, stationary phases used are C18, C8, phenyl, and fluoro or a combination thereof. Different commercial C18 columns also often show different separation selectivities, usually based on differences in silica supports or stationary phase chemistry.
Typical solute-column interactions are based on hydrophobic, steric resistance, hydrogen bond-ing, ionic and London dispersion (also called dipole-dipole) forces.51 Phenyl columns show addi-tional π–π but less hydrophobic interactions. Phenyl columns, such as phenylpropyl or phenylhexyl columns, are less commonly used for RP-LC separation. The selectivity of phenyl columns differs from that for alkyl-silica columns. π-Acids, such as aromatics, are preferentially retained by π–π interactions on phenyl versus alkyl-silica columns. The enhanced retention of π-acids varies with the organic solvent in the mobile phase as: tetrahydrofuran (least) < acetonitrile < methanol (most). Phenyl columns also show stronger dispersion interactions versus (less polarizable) C8 or C18 col-umns. The reduced hydrophobicity of phenyl versus alkyl groups leads to smaller hydrophobic and steric interactions, possibly because the phenyl groups are more ordered.
Perfluorinated alkyl or phenyl ligands are the basis of so-called fluoro columns. Solutes of lower refractive index (and lower molecular polarizability) are more strongly retained on fluoro-alkyl columns, relative to a C8 or C18 column. Polyaromatics are less retained on the fluoro-alkyl column
System:CGE column:Injection:Running:Temperature:
Capillary gel electrophoresis systemPEG sleving matrix (BioCap 75 μm × 27.5 (to detector)/34.5 cm (total length)45 injection at 5 kV15 kV30°C
10 15
30
UV 260 nm
22 min12
LC system:Column:Mobile phase:
Flow rate:Column Temperature:Gradient:
Detection:
Water ACQUITY UPLC SystemACQUITY OST C18, 1.7 μm (2.1 × 50 mm)A: 15 mM TEA, 400 mM HFIP, ph 7.9B: 50% A, 50% MeOH0.4 mL/min60°C40 to 48% B in 4 min(20–24% MeOH)260 nm
20
25
30
35
0 4 min
fIgure 1.6 Comparison of CGE and IP-HPLC separation of deoxythymidine ladders. (Courtesy of Waters Corporation.)
K11050_C001.indd 9 11/15/2010 6:28:55 PM
10 Handbook of Analysis of Oligonucleotides and Related Products
than substituted benzenes, while aliphatic solutes are more retained. Fluoro-substituted aromatics show even larger retention factor on fluoro columns. This behavior has been attributed to differ-ences in solute–column dispersion interactions for fluoro-alkyl columns, as a result of the much lower polarizability of fluoro-alkyl columns.51
1.5 moBIle pHases
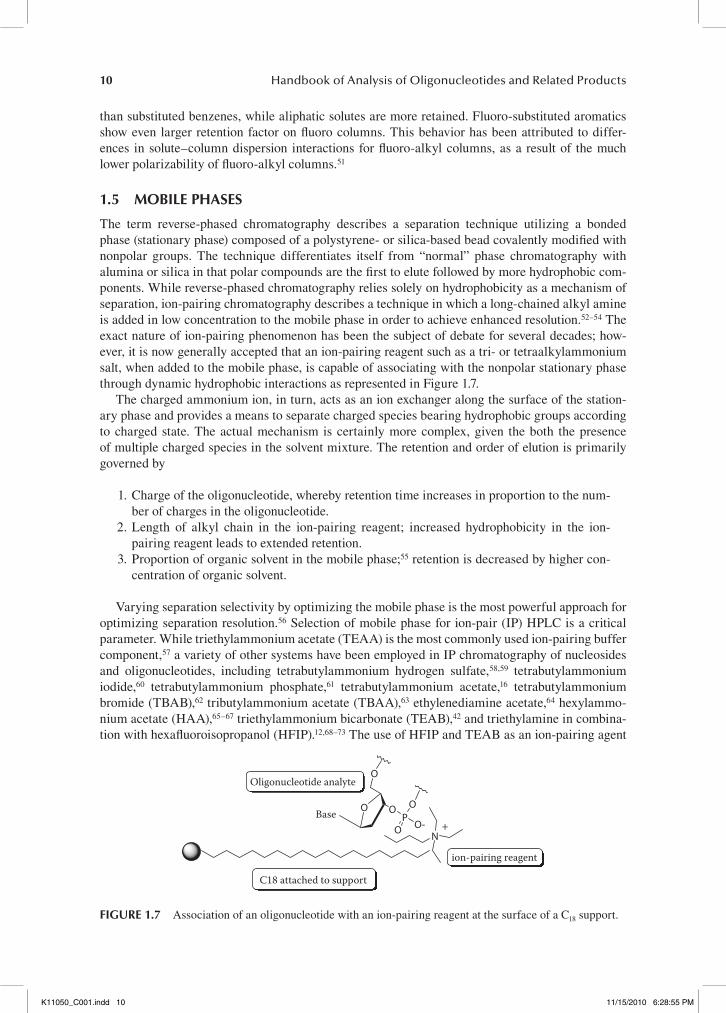
The term reverse-phased chromatography describes a separation technique utilizing a bonded phase (stationary phase) composed of a polystyrene- or silica-based bead covalently modified with non polar groups. The technique differentiates itself from “normal” phase chromatography with alumina or silica in that polar compounds are the first to elute followed by more hydrophobic com-ponents. While reverse-phased chromatography relies solely on hydrophobicity as a mechanism of separation, ion-pairing chromatography describes a technique in which a long-chained alkyl amine is added in low concentration to the mobile phase in order to achieve enhanced resolution.52–54 The exact nature of ion-pairing phenomenon has been the subject of debate for several decades; how-ever, it is now generally accepted that an ion-pairing reagent such as a tri- or tetraalkylammonium salt, when added to the mobile phase, is capable of associating with the nonpolar stationary phase through dynamic hydrophobic interactions as represented in Figure 1.7.
The charged ammonium ion, in turn, acts as an ion exchanger along the surface of the station-ary phase and provides a means to separate charged species bearing hydrophobic groups according to charged state. The actual mechanism is certainly more complex, given the both the presence of multiple charged species in the solvent mixture. The retention and order of elution is primarily governed by
1. Charge of the oligonucleotide, whereby retention time increases in proportion to the num-ber of charges in the oligonucleotide.
2. Length of alkyl chain in the ion-pairing reagent; increased hydrophobicity in the ion- pairing reagent leads to extended retention.
3. Proportion of organic solvent in the mobile phase;55 retention is decreased by higher con-centration of organic solvent.
Varying separation selectivity by optimizing the mobile phase is the most powerful approach for optimizing separation resolution.56 Selection of mobile phase for ion-pair (IP) HPLC is a critical parameter. While triethylammonium acetate (TEAA) is the most commonly used ion-pairing buffer component,57 a variety of other systems have been employed in IP chromatography of nucleosides and oligonucleotides, including tetrabutylammonium hydrogen sulfate,58,59 tetrabutylammonium iodide,60 tetrabutylammonium phosphate,61 tetrabutylammonium acetate,16 tetrabutylammonium bromide (TBAB),62 tributylammonium acetate (TBAA),63 ethylenediamine acetate,64 hexylammo-nium acetate (HAA),65–67 triethylammonium bicarbonate (TEAB),42 and triethylamine in combina-tion with hexafluoroisopropanol (HFIP).12,68–73 The use of HFIP and TEAB as an ion-pairing agent
Oligonucleotide analyte
Base
C18 attached to support
ion-pairing reagent
O
OOO
O O-P
N+
fIgure 1.7 Association of an oligonucleotide with an ion-pairing reagent at the surface of a C18 support.
K11050_C001.indd 10 11/15/2010 6:28:55 PM

Purity Analysis and Impurities Determination 11
is particularly attractive because it is compatible with MS coupling to HPLC (refer to Chapter 4) and often provides excellent separation. Once only used for LC/MS separations, HFIP is now used as widely as TEAA because of its unique ion-pairing ability. Gilar et al. found that in hetero-oligonu-cleotide ladders, oligonucleotides one nucleotide apart could overlap or even reverse retention order when using a TEAA-based buffer system for the separation due to the different hydrophobicity of the different bases (see Figure 1.8) (hydrophobicity increases in the following order: C < G < A < T).12 Buffer systems based on TEA-HFIP show a less pronounced dependence of the hydrophobicity of the bases and an overlap of two oligonucleotides one nucleotide apart typically does not occur.
The ion suppression that plagued the early analysis of oligonucleotides using LC/MS with high concentrations (normally greater or equal to 100 mM) of TEA can be avoided by simply switching to an HFIP-based ion-pairing mobile phase, where only small concentrations of TEA are being
11 12 13 14 15 16+17
18+19
20
21 22 23
25
30
2429
28
(a)
10.0 15.5 21.0 26.5 32.0
11 12 13 14 15 1617 18
19
21 22 23
24
25
2627
28
29
30(b)
0.0 4.5 11.0 16.5 22.0
0.0 7.5 15.0 22.5 30.0
11T
12G
13A A T
14 15 16 17T G T
18
19C
C20
21 22 23
24
C TT
A
G25
T30
G29
2827
26
GG
C
(c)
Minutes
UV
260
nm
20
fIgure 1.8 Separation of a 10-30mer hetero-oligonucleotide ladder using three separation ion-pairing buf-fer systems. (a) 0.1 M TEAA, pH 7, ion-pairing system. Mobile phase A: 5% acetonitrile in 100 mM TEAA; mobile phase B: 15% acetonitrile in 100 mM TEAA; gradient begins from 5% acetonitrile at a gradient slope of 0.25% acetonitrile/min. (b) 100 mM HFIP ion-pairing buffer, pH 8.2. Mobile phase A: 10% methanol in 4.1 mM TEA/100 mM HFIP; mobile phase B: 40% methanol in 4.1 mM TEA/100 mM HFIP; gradient begins with 10% methanol at gradient slope of 0.25% methanol/min. (c) 16.3 mM TEA/400 mM HFIP pH 7.9 ion-pairing buffer. Mobile A: 10% methanol in 16.3 mM TEA/400 mM HFIP; mobile phase B: 40% methanol in 16.3 mM TEA/400 mM HFIP; gradient begins at 16% methanol at gradient slope 0.23%. All separations utilized an XTerra MS C18, 2.5 µm, 50 mm × 4.6 mm column (courtesy of Waters Corporation).
K11050_C001.indd 11 11/15/2010 6:28:56 PM

12 Handbook of Analysis of Oligonucleotides and Related Products
added. HFIP or other organic polyfluorinated alcohols, also called additives or organic modifiers, can be added to either polar or nonpolar mobile phases. The use of such organic modifiers leads not just to improvements in separation but also to the extension of silica-based column lifetimes.74
McCarthy et al. compared several ion-pairing systems for their usefulness in the separation of a homo-oligonucleotide and hetero-oligonucleotide ladder.75 For their investigation they included TEAA, TEA/HFIP, dimethylbutylammonium acetate (DMBAA), tripropylammonium ace-tate (TPAA), TBAA, and HAA as ion-pairing reagents. Resolution of the homo-oligonucleotide ladder improved with increasing concentration and hydrophobicity (alkyl chain length) of the ion-pairing reagent. Separation efficiency (or peak capacity) decreased with oligonucleotide length and more hydrophobic ion-pairing reagents such as HAA started to outperform TEA/HFIP system in resolution of longer oligonucleotides (30- to 35-mers). In the separation of hetero-oligonucleotide ladders ion-pairing systems performed better, which separated based predominantly by a charge-based mechanism. Separation improved from TEAA < DMBAA < TPAA < TEA/HFIP ~ HAA.
McKeown et al. looked into the effect of several different parameters on the retention behavior of a series of poly dT oligonucleotides (5- to 18-mer) under isocratic conditions using RP IP-HPLC.62 They study the effects of temperature, pH, eluent ionic strength, percentage organic modifier, con-centration, and alkyl chain length of the ion-pairing reagent using a Kromasil C18, 100 Å, 5 μm particle-size column (250 mm × 4.6 mm). Reversed-phase chromatography using a 100 mM ammo-nium acetate buffer resulted in broad co-eluting peaks and incomplete resolution of the individual oligonucleotides from the poly dT mixture, confirming the need of ion-pairing reagents for an effec-tive resolution of oligonucleotides, which was also shown by others.67 The effect of the hydrophobic-ity of the alkylammonium ion-pair reagent on retention of the oligonucleotides was investigated for five different ion-pairing reagents: tetramethyl- (TMAB), tetraethyl- (TEAB), tetrapropyl- (TPAB), tetrabutyl- (TBAB), and tetrahexyl- (THAB) ammonium bromide. The retention of the oligonucle-otides was directly related to the alkyl chain length of the ion-pairing reagent. With the shortest alkyl chain length ion-pair reagent (TMAB) the analytes were all unretained, but complete reten-tion of all the analytes was observed with the longest alkyl chain length (THAB). The percentage acetonitrile in the mobile phase was observed to be of critical importance in the optimization of the separation.76–78
McKeown et al. was able to show that an increase in column temperature caused a decrease in the retention of oligonucleotides, with longer chain length oligonucleotides being more affected by changes in temperature than smaller chain lengths. From pH 4.8 to 6.8, he found a decrease in the retention of all oligonucleotides. This retention time shift was unexpected because the charged back-bone is comprised of strong acids with a pKa value of about 1.79 Over the entire pH range studied, the phosphodiester groups are therefore fully ionized. He therefore concluded that the proportion of ionized silanol groups was reduced at lower mobile phase pH, resulting in a reduction of nega-tive charge on the surface of the silica-based packing material thereby influencing the separations. Such unreacted acidic silanols are known to be present on most reversed-phase silica materials with a wide variety of pKa values being reported.80 Depending on the sorbent, only about 25% of total alkylammonium ions perform ion-pair functions with the other 75% interacting and electrostati-cally neutralizing residual silanol groups.81
McKeown et al. found that increasing the concentration of TBAB from 1.5 to 10 mM resulted in an increase in retention for all the oligonucleotides. At higher concentration, sorbent surface might become saturated with the ion-pairing reagent or micelles are being formed in solution, which can lead to a reduced availability of adsorption sites and hence decreased retention. However, because of TBAB’s solubility limit of 10 mM in water, McKeown et al. was not able to extend his studies into higher buffer concentrations using this particular ion-pairing buffer.
An efficient oligonucleotide separation is dependent on the concentration of both triethylamine (TEA) and hexafluoroisopropanol (HFIP).70 The role of the triethylammonium cation, the active ion-pairing agent, is well understood. An increase in TEA concentration improves ion-pairing effi-ciency and, consequently, the separation selectivity. A more efficient ion-pairing mechanism also
K11050_C001.indd 12 11/15/2010 6:28:56 PM
Purity Analysis and Impurities Determination 13
results into an increase in retention time. Because the pKa of TEA is 10.7, a side effect of an increased TEA concentration is a rise of mobile phase pH, which may reduce the lifetime of silica- based columns. However, the hybrid organic–inorganic silica of BEH-based columns is highly stable up to a pH of 12.
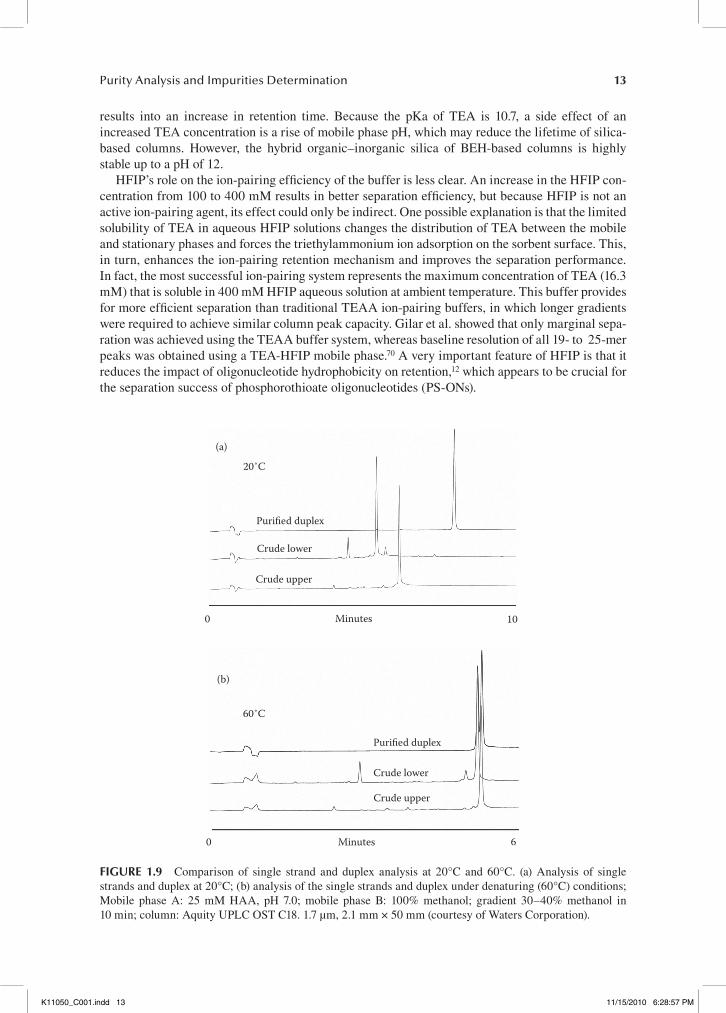
HFIP’s role on the ion-pairing efficiency of the buffer is less clear. An increase in the HFIP con-centration from 100 to 400 mM results in better separation efficiency, but because HFIP is not an active ion-pairing agent, its effect could only be indirect. One possible explanation is that the limited solubility of TEA in aqueous HFIP solutions changes the distribution of TEA between the mobile and stationary phases and forces the triethylammonium ion adsorption on the sorbent surface. This, in turn, enhances the ion-pairing retention mechanism and improves the separation performance. In fact, the most successful ion-pairing system represents the maximum concentration of TEA (16.3 mM) that is soluble in 400 mM HFIP aqueous solution at ambient temperature. This buffer provides for more efficient separation than traditional TEAA ion-pairing buffers, in which longer gradients were required to achieve similar column peak capacity. Gilar et al. showed that only marginal sepa-ration was achieved using the TEAA buffer system, whereas baseline resolution of all 19- to 25-mer peaks was obtained using a TEA-HFIP mobile phase.70 A very important feature of HFIP is that it reduces the impact of oligonucleotide hydrophobicity on retention,12 which appears to be crucial for the separation success of phosphorothioate oligonucleotides (PS-ONs).
(a)
20˚C
Purified duplex
Crude lower
Crude upper
0 Minutes 10
(b)
60˚C
Purified duplex
Crude lower
Crude upper
Minutes0 6
fIgure 1.9 Comparison of single strand and duplex analysis at 20°C and 60°C. (a) Analysis of single strands and duplex at 20°C; (b) analysis of the single strands and duplex under denaturing (60°C) conditions; Mobile phase A: 25 mM HAA, pH 7.0; mobile phase B: 100% methanol; gradient 30–40% methanol in 10 min; column: Aquity UPLC OST C18. 1.7 µm, 2.1 mm × 50 mm (courtesy of Waters Corporation).
K11050_C001.indd 13 11/15/2010 6:28:57 PM

14 Handbook of Analysis of Oligonucleotides and Related Products
The mobile phase requirements for the analysis of double-stranded oligonucleotides are some-what different. While there are reports of using the TEA-HFIP ion-pairing system for the analysis of siRNA duplexes,82,83 because of HFIP denaturing properties, McCarthy et al. relied on TEAA (100 mM) and HAA (25 mM) buffer systems for the analysis and purification of double-stranded RNA and DNA to increase the stability of the duplexes under IP-HPLC conditions.67 Approaching the melting temperature, dramatic peak broadening occurs, indicating on-column duplex melting. Duplex melting is accompanied by an appearance of complementary oligonucleotides. For this rea-son, 20°C was selected as a generic separation temperature. While it is well established that reten-tion times of single stranded oligonucleotides are strongly sequence dependent,12,43,44,50,84 McCarthy et al. found that the retention time of all three double-stranded oligodeoxynucleotides (19-mer dsDNA) used for their investigation were sequence independent. He concluded that IP-HPLC reten-tion of double-stranded oligonucleotides is predominantly driven by charge-to-charge interaction and that dsDNA or siRNA are therefore more retained by the RP-column than their corresponding single strands, making RP IP-HPLC useful for the purification of on-column annealed siRNA. See Figure 1.9 for analytical traces of the crude single strands and the purified duplex at 20°C (non-denaturing conditions; duplex intact) and 60°C (denaturing conditions, duplex elutes as two single strands) using a BEH-based Acquity UPLC OST C18 column (2.1 × 50 mm, 1.7 μm particle size) and a 25 mM HAA buffer system with an acetonitrile gradient.
1.6 retentIon tIme and separatIon selectIvIty predIctIon models
In HPLC, retention time (RT) is the most important parameter governing the separation of solutes and is often used for the qualitative identification of oligonucleotides. The study of the relationship between the retention time and the sequence of an oligonucleotide can be a useful tool to optimize the conditions for the separation of a particular oligonucleotides mixture.85
The commonly used method, linear free energy relationship (LFER) describing the behavior of solute molecules at the liquid–solid interface, models retention time as a sum of individual energy contributions (dispersion, dipole–dipole, π–π, proton donor–acceptor interactions, etc.).86 However, this prediction model becomes inaccurate when modeling more complex molecules such as oligo-nucleotides because their relevant parameters are difficult to determine. Alternatively, quantitative structure retention relationship (QSRR) provides a promising method for retention time predictions. Gilar et al. developed models by simple summation of the retention contributions of the individual nucleotides obtained from experimentally determined homo-oligonucleotides.12 Their model was based only on oligonucleotide length and base composition. Huber and coworkers used support vector regression (SVR) to develop their model, which included oligonucleotides having a length of 15–48 over a wide temperature range. The model took into consideration information of length, sequence, and predicted secondary structure43,44
A different approach to retention time prediction was taken by Lei et al.84 Base sequence auto-correlation (BSA) features for oligonucleotides were calculated by weighting constitutional, topo-logical, geometrical, electrostatic, and quantum-chemical features of the four bases (A, T, C, and G) obtained from CODESSA.87 By having these features calculated based only on sequence, all the oligonucleotides could be represented in numerical form and optimum models were obtained by employing multiple linear regression (MLR) combined with genetic algorithm (GA) feature selec-tion. The derived linear models showed equally good performance compared to works by Huber and coworkers,43,44 but without the need of secondary structure prediction. A novel strategy to pre-dict the retention time at any temperature was also proposed.
Gilar et al. developed a separation selectivity (or peak capacity) model for oligonucleotides and compared it to empirical data derived from IP-HPLC analyses of oligonucleotide ladders using a BEH- based Acquity UPLC column (50 mm × 2.1 mm, 1.7 μm) and TEAA or TEA/HFIP buffer systems.71 They showed that the overall sample peak capacity is nothing but the sum (or the inte-gral) of the resolutions in the HPLC chromatogram. The position of the peak capacity maximum
K11050_C001.indd 14 11/15/2010 6:28:57 PM
Purity Analysis and Impurities Determination 15
is rather insensitive to the molecular weight of the oligonucleotide. The peak capacity model was developed for homo-oligonucleotides. Separation of hetero-oligonucleotides partially depends on their sequence. Also, peak capacity cannot be reliably calculated for oligonucleotides with strong secondary structure.
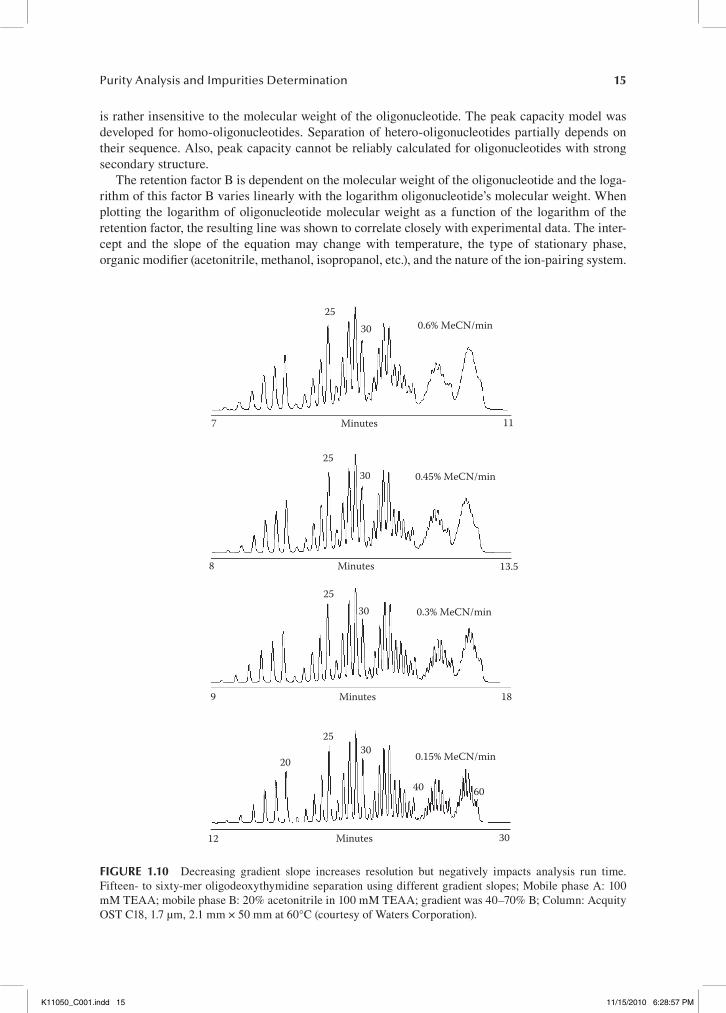
The retention factor B is dependent on the molecular weight of the oligonucleotide and the loga-rithm of this factor B varies linearly with the logarithm oligonucleotide’s molecular weight. When plotting the logarithm of oligonucleotide molecular weight as a function of the logarithm of the retention factor, the resulting line was shown to correlate closely with experimental data. The inter-cept and the slope of the equation may change with temperature, the type of stationary phase, organic modifier (acetonitrile, methanol, isopropanol, etc.), and the nature of the ion-pairing system.
2530 0.6% MeCN/min
7 Minutes 11
8
2530 0.45% MeCN/min
Minutes 13.5
Minutes
2530
9
3025
20
40 60
30
0.3% MeCN/min
18
0.15% MeCN/min
12 Minutes
fIgure 1.10 Decreasing gradient slope increases resolution but negatively impacts analysis run time. Fifteen- to sixty-mer oligodeoxythymidine separation using different gradient slopes; Mobile phase A: 100 mM TEAA; mobile phase B: 20% acetonitrile in 100 mM TEAA; gradient was 40–70% B; Column: Acquity OST C18, 1.7 µm, 2.1 mm × 50 mm at 60°C (courtesy of Waters Corporation).
K11050_C001.indd 15 11/15/2010 6:28:57 PM

16 Handbook of Analysis of Oligonucleotides and Related Products
It was shown theoretically and experimentally that the slope is much steeper for the TEA/HFIP than with the TEAA ion-pairing system, which means that TEA/HFIP is a more efficient system for the separation of oligonucleotides than TEAA.12,50,71
Gilar et al. investigated the impact of sorbent particle size, column length, and gradient time on the retention factor and compared theoretical to experimental data.71 Not surprisingly, the best peak capacity was obtained for the column packed with the smallest particle size sorbent. Intriguingly, gains in resolution for longer columns are not as pronounced as one might expect. At constant gra-dient run time the gradient slope is proportionally shallower for shorter columns. In other words, the peak capacity of longer columns is reduced by proportionally sharper gradient, which tends to
Constant gradient slope (volume)3.9% ACN in 5.2 mL
2530
1.8 Minutes 6.6
0.8 mL/min6.5 min gradient0.6% MeCN/min
2530
3.0 Minutes 11.5
0.4 mL/min13 min gradient0.3% MeCN/min
2530 0.2 mL/min
26 min gradient0.15% MeCN/min
6.0 Minutes 23.0
0.1 mL/min52 min gradient0.075% MeCN/min
2530
20
40 50 60
44.010.0 Minutes
fIgure 1.11 Maintaining most of the resolution while decreasing analysis time by increasing the flow rate and proportionally reducing the gradient time. Fifteen- to sixty-mer oligodeoxythymidine separation using different gradient slopes; Mobile phase A: 100 mM TEAA; mobile phase B: 20% acetonitrile in 100 mM TEAA; gradient was 40–70% B; Column: Acquity OST C18, 1.7 µm, 2.1 mm × 50 mm at 60°C (courtesy of Waters Corporation).
K11050_C001.indd 16 11/15/2010 6:28:57 PM

Purity Analysis and Impurities Determination 17
reduce or eliminate the positive impact of higher column efficiency. The full benefits of longer col-umns in a gradient separation are only realized when changing the gradient duration in proportion with the column volume (length).
IP RP-HPLC analysis of oligonucleotides is typically performed with shallow gradients. Decreasing gradient slope increases resolution, but negatively impacts analysis throughput by increasing run time (see Figure 1.10).
While an increase in the flow rate decreases the separation efficiency, the resulting loss in peak capacity is less detrimental compared to using sharper gradients. Therefore, for the fast analysis of oligonucleotides it is more practical to maintain a relatively shallow gradient and reduce the analysis time by increasing the flow rate and gradient time proportionally thereby maintaining a constant gradient slope. The number of column volumes remains constant. The separation selectiv-ity remains unchanged with only some loss of resolution (see Figure 1.11).
1.7 selected practIcal examples of Ip-Hplc
The choice of column, mobile phase composition, temperature, instrument, and the method of sam-ple preparation are all critical parameters for an effective purity analysis of oligonucleotides. In the following section, the authors have attempted to compile a broad range of spectral data from their own work to demonstrate the use of IP-HPLC as a powerful tool for the analysis of oligonucleotides. These examples aptly illustrate the uniqueness of each oligonucleotide sequence. In our experience, there is no “one size fits all” approach to separation and analysis of oligonucleotides, and this is demonstrated by the necessity of screening a series of columns and mobile phases for use with each sequence of interest.
In the course of our work, we routinely synthesize and characterize sequences belonging to a broad range of oligonucleotide subclasses, such as antisense, immunostimulatory oligonucleotides, aptamers, small interfering RNA (siRNA), microRNA (miRNA), decoys, and splice modulators. The following list gives a brief overview of the kind of modifications that are routinely incor-porated into oligonucleotides when making the above mentioned subclasses: phosphodiester and phosphorothioate DNA, duplex and single strand RNA, 2′-modified RNA, LNA, gapmers, chimeric sequences, conjugates, aptamers, PEGylated oligonucleotides, backbone modified sequences, and sequences containing modified or unnatural nucleoside bases. The analysis of modified oligonucle-otides, particularly ones bearing lipophilic groups such as cholesterol or long chain fatty acid esters, sometimes require the use of C4 or C8 columns instead of the standard C18 reverse phased column. For the synthesis of duplex RNA, denaturing as well as nondenaturing methods must be available for characterization of the duplex. Large-scale manufacturing of oligonucleotides typically relies on preparative anion exchange purification for several reasons. Preparative anion exchange (AEX) chromatography is generally more efficient than preparative IP RP-HPLC; it converts the oligo-nucleotide into the sodium form during purification, and it can be performed using low-pressure HPLC equipment. However, the purified oligonucleotide elutes under high salt conditions. Pools or fractions containing high salt levels are sometimes difficult to analyze and require sample prepara-tion prior to IP-HPLC analysis. Some techniques for improved chromatography of high-salt samples are included below. While it is understood that method optimization will be essential for each new sequence, the following sections should be helpful in the selection of parameters that one must con-sider at the initial stages of IP-HPLC method development.
1.7.1 Column InfluenCe on Chromatography
The delivery of therapeutic oligonucleotides to their desired target is an enormous challenge being addressed in a number of different ways. Increasing the lipophilicity of highly negatively charged oligonucleotides to pass through densely hydrophobic cell membranes, thereby improving their phar-macokinetic properties can be accomplished by attachment of a lipophilic group to either terminus
K11050_C001.indd 17 11/15/2010 6:28:57 PM

18 Handbook of Analysis of Oligonucleotides and Related Products
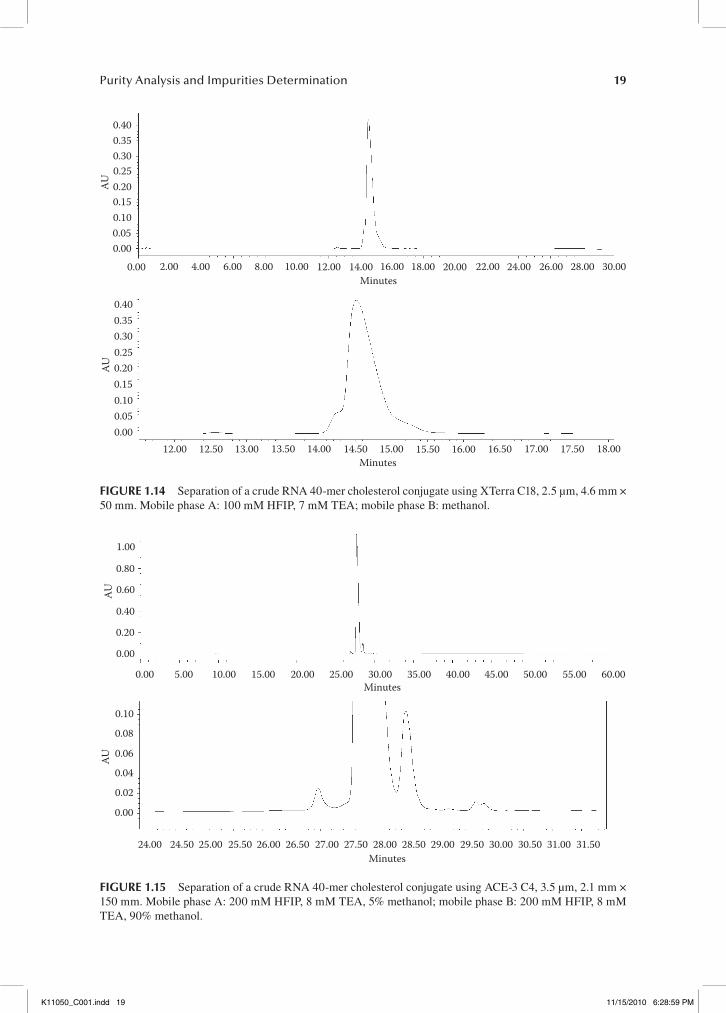
of the oligonucleotide to form a so-called conjugate. The following example highlights the marked difference in chromatography of a 40-mer RNA/2′-O-methyl/2′-fluoro RNA oligonucleotide bear-ing a cholesterol group at the 5′-terminus compared to the 39-mer prior to conjugation. Increased lipophilicity associated with the cholesterol moiety caused the oligonucleotide to be highly retained on a C18 stationary phase, resulting in extremely poor separation. Lipophilic conjugates particu-larly in combination with longer sequences often show largely increased retention on RP columns mandating the use of shorter carbon chain stationary phases, such as C4, C8, or C12 columns. C18 columns, however, are better suited to separate a broad range of oligonucleotides prior to the con-jugation step. Shown in Figures 1.12 and 1.13 is a comparison of the chromatography of a 39-mer RNA oligonucleotide before and after conjugation with cholesterol.
Note the improved peak shape and resolution of the impurities and full length product (FLP) in the separation using the XTerra C18 column (Figure 1.12) compared to the ACE-3 C4 column (Figure 1.13), indicating the superiority of the C18 column for the separation of the unconjugated 39-mer oligonucleotide. After the conjugation step, however, the C4 column is much better suited for the HPLC analysis of the conjugated oligonucleotide when compared to the C18 column (see Figure 1.14).
Figure 1.14 exemplifies the difficulties encountered when analyzing conjugated oligonucleotides. Failure sequences are not well resolved from the main peak and peak broadening occurs. The chro-matography of the conjugate using the C4 column shows a much improved separation. The impurity peaks are well resolved from the main peak (see Figure 1.15).
A C18 column is more effective in separating an unconjugated oligonucleotide in comparison to a C4 or C8 column. When selecting a C18 column, there are a wide variety of columns that can be
0.30
0.25
0.20
0.15
0.10
0.05
0.00
−0.056.50 7.00 7.50 8.00 8.50 9.00 9.50 10.00 10.50 11.00 11.50 12.00 12.50
Minutes
AU
fIgure 1.13 Separation of a crude RNA 39-mer using ACE-3 C4, 3.5 µm, 2.1 mm × 150 mm. Mobile phase A: 200 mM HFIP, 8 mM TEA, 5% methanol; mobile phase B: 200 mM HFIP, 8 mM TEA, 90% methanol.
0.350.300.250.200.150.100.050.00
−0.056.50 7.00 7.50 8.00 8.50 9.00 9.50 10.00 10.50 11.00 11.50
Minutes
AU
fIgure 1.12 Separation of a crude RNA 39-mer using XTerra C18, 2.5 µm, 4.6 mm × 50 mm. Mobile phase A: 100 mM HFIP, 7 mM TEA; mobile phase B: methanol.
K11050_C001.indd 18 11/15/2010 6:28:58 PM
Purity Analysis and Impurities Determination 19
0.400.350.300.250.200.150.100.050.00
0.00 2.00 4.00 6.00 8.00 10.00 12.00 14.00 16.00 18.00 20.00 22.00 24.00 26.00 28.00 30.00
0.400.350.300.250.200.150.100.050.00
12.00 12.50 13.00 13.50 14.00 14.50 15.00 15.50 16.00 16.50 17.00 17.50 18.00
Minutes
AU
Minutes
AU
fIgure 1.14 Separation of a crude RNA 40-mer cholesterol conjugate using XTerra C18, 2.5 µm, 4.6 mm × 50 mm. Mobile phase A: 100 mM HFIP, 7 mM TEA; mobile phase B: methanol.
1.00
0.80
0.60
0.40
0.20
0.00
0.00 5.00 10.00 15.00 20.00 25.00 30.00 35.00 40.00 45.00 50.00 55.00 60.00Minutes
AU
0.10
0.08
0.06
0.04
0.02
0.00
24.00 24.50 25.00 25.50 26.00 26.50 27.00 27.50 28.00 28.50 29.00 29.50 30.00 30.50 31.00 31.50
AU
Minutes
fIgure 1.15 Separation of a crude RNA 40-mer cholesterol conjugate using ACE-3 C4, 3.5 µm, 2.1 mm × 150 mm. Mobile phase A: 200 mM HFIP, 8 mM TEA, 5% methanol; mobile phase B: 200 mM HFIP, 8 mM TEA, 90% methanol.
K11050_C001.indd 19 11/15/2010 6:28:59 PM

20 Handbook of Analysis of Oligonucleotides and Related Products
chosen from (see Section 1.3). In addition to varying column dimensions and particle sizes, many column manufacturers have introduced modifications to their sorbents that can result in an altered separation of the oligonucleotide of interest. The following examples will demonstrate how using columns of varying dimensions and sorbent modifications for the analysis of a 2′-O-methyl phos-phorothioate RNA 20-mer can produce drastically different results. In each example, the mobile phase and gradient were adjusted to optimize the separation of the failure sequences from the full length product. (Note: In order to verify impurity resolution, the reference sample used for this investigation was spiked with approximately 3% of the (N–2), (N–1), and (N+1) failure sequences to produce a second reference sample. By overlaying the chromatograms from the reference and spiked sample the quality of the separation was then verified.)
The following chromatograms were generated using a Waters XTerra C18 2.5 µm, 4.6 mm × 50 mm column (100 mM HFIP, 7 mM TEA, ACN gradient). The N–3 impurity is only partially resolved from the main peak, while the N–2, N–1, and N+1 failure sequences fall under the main peak. Owing to this co-elution, the overall purity of the FLP cannot be accurately quantitated. The sorbent particle size and column dimensions of the Waters Xterra column are insufficient to achieve the theoretical plates needed for separating all impurities from the full length product (see Figure 1.16).
In an attempt to improve the resolution of the failure sequences, the Xterra column was replaced with a Waters XBridge OST C18 2.5 µm, 2.1 mm × 50 mm column, which also had a reduced inter-nal diameter, while the buffer conditions (100 mM HFIP, 7mM TEA) were maintained. The change of the column improved the overall chromatography of the sequence, now completely resolving the N–3 and partially resolving the N–2 and N+1 failure sequences (see Figure 1.17).
While the Waters XBridge OST C18 2.5 µm, 2.1 mm × 50 mm improved the overall resolution of this particular sequence when compared to the Waters Xterra C18 2.5 µm, 4.6 mm × 50 mm, the calculated purity was still not completely accurate due to the partial resolution of the N–2 and N+1 peaks and co-elution of the N–1 with the full length product.
0.900.800.700.600.500.400.300.200.100.00
0.00 2.00 4.00 6.00 8.00 10.00 12.00 14.00 16.00 18.00 20.00 22.00 24.00 26.00 28.00 30.00 32.00 34.00 36.00 38.00 40.00
AU
Minutes
0.0160.0140.0120.0100.0080.0060.0040.0020.000
−0.00221.60 21.80 22.20 22.40 22.60 22.80 23.00 23.20 23.40 23.60 23.80 24.20 24.40 24.60 24.80 25.00 25.20 25.40 25.60 25.80 26.00 26.20 26.40 26.60 26.80 27.00 27.20
Minutes
AU
N–3 N–2, N–1, FLP, N+1
24.0022.00
fIgure 1.16 Chromatography of a 2′-O-methyl phosphorothioate RNA 20-mer using a Waters Xterra C18 column (with expansion). Mobile phase A: 400 mM HFIP, 15 mM TEA; mobile phase B: acetonitrile.
K11050_C001.indd 20 11/15/2010 6:28:59 PM

Purity Analysis and Impurities Determination 21
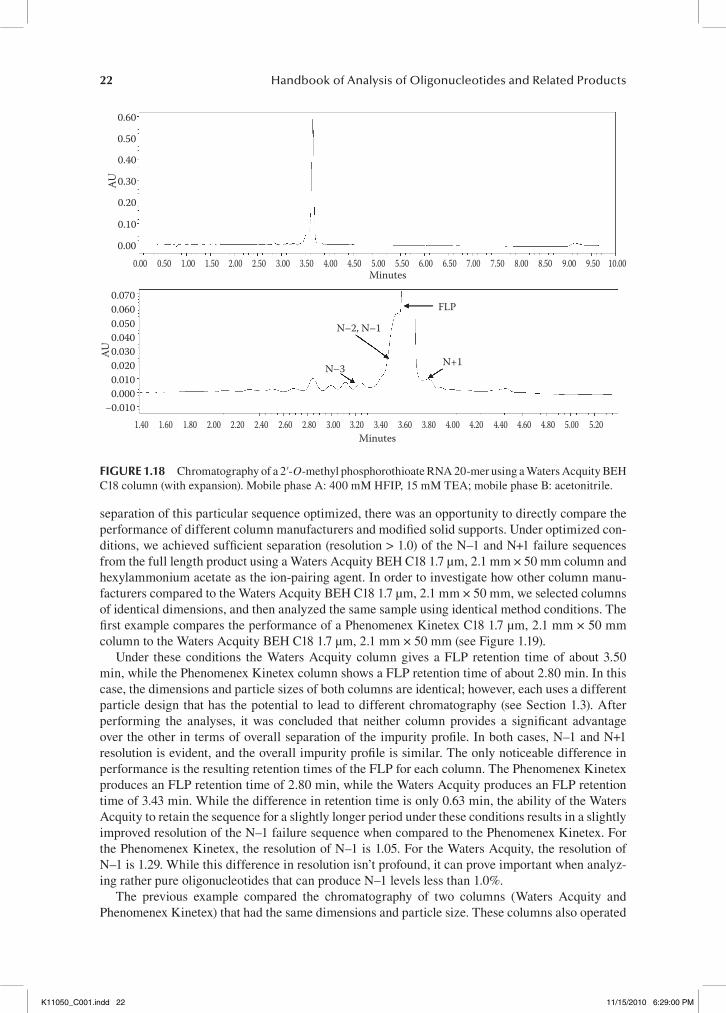
In an attempt to continue the trend of increasing impurity resolution, the particle size of the sorbent was reduced resulting in an increase of theoretical plates (see Section 1.3). Unfortunately, when using columns of particle sizes less than 2.5 µm, the back pressure on the column tends to exceed the pressure capabilities of a standard HPLC instrument. Typically, when running a flow rate of approximately 0.3 mL/min on a 1.7 µm column, the back pressure is between 4000 and 5500 psi (pressure is dependent on the column temperature and mobile phase being used). A standard HPLC instrument is not capable of handling back pressures of this intensity. Therefore, columns with par-ticle sizes less than 2 µm need to be run on an ultra performance liquid chromatography instrument (UPLC), which is capable of handling back pressures up to 15,000 psi. The following chromato-grams were taken from an analysis using a Waters Acquity BEH C18 1.7 µm, 2.1 mm × 50 mm and a UPLC system (100 mM HFIP, 7 mM TEA) (see Figure 1.18).
In this case, the N–1 and N+1 impurities are beginning to resolve from the main peak, thus allowing a more accurate calculation of the main peak purity. While not completely resolved from the main peak, the resolution of N–1 and N+1 in this profile is again superior to the previous example that used a column of increased particle size. These examples demonstrate how chang-ing the column type and reducing the internal diameter and particle size of a column can lead to a more efficient separation of the failure sequences from the full length product of a nonconjugated oligonucleotide.
In addition to comparing the effects of column dimensions and particle sizes on the analysis of a particular compound, it can also be useful to compare the performance of different column manufacturers and their various solid support modifications. The following examples demonstrate that while different column manufacturers can produce columns of identical dimension and particle size, their resultant chromatography can be different enough to justify superiority between them.
The following analyses were performed under optimized conditions, which lead to resolution of N–1 and N+1 failures of a 20-mer 2′-O-methyl phosphorothioate RNA sequence. With the
1.000.900.800.700.600.500.400.300.200.100.00
0.00 2.00 4.00 6.00 8.00 10.00 12.00 14.00 16.00 18.00 20.00 22.00 24.00 26.00 28.00 30.00 32.00 34.00 36.00 38.00 40.00
0.300.250.200.150.100.050.00
19.80 20.00 20.20 20.40 20.60 20.80 21.00 21.20 21.40 21.60 21.80 22.20 22.40 22.60 22.80 23.00 23.20 23.40 23.60 23.80 24.00 24.20 24.40 24.60 24.80Minutes
AUAU
N–3
N–2
FLP, N–1
N+1
22.00
fIgure 1.17 Chromatography of a 2′-O-methyl phosphorothioate RNA 20-mer using a Waters XBridge OST C18 column (with expansion). Mobile phase A: 100 mM HFIP, 7 mM TEA; mobile phase B: acetonitrile.
K11050_C001.indd 21 11/15/2010 6:28:59 PM
22 Handbook of Analysis of Oligonucleotides and Related Products
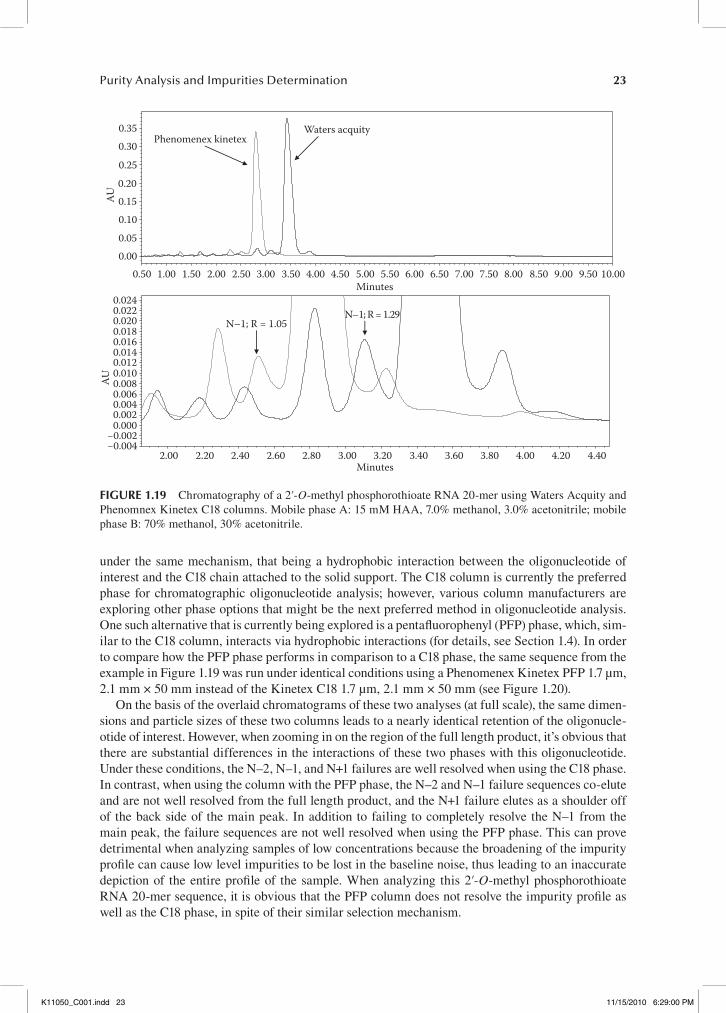
separation of this particular sequence optimized, there was an opportunity to directly compare the performance of different column manufacturers and modified solid supports. Under optimized con-ditions, we achieved sufficient separation (resolution > 1.0) of the N–1 and N+1 failure sequences from the full length product using a Waters Acquity BEH C18 1.7 µm, 2.1 mm × 50 mm column and hexyl ammonium acetate as the ion-pairing agent. In order to investigate how other column manu-facturers compared to the Waters Acquity BEH C18 1.7 µm, 2.1 mm × 50 mm, we selected columns of identical dimensions, and then analyzed the same sample using identical method conditions. The first example compares the performance of a Phenomenex Kinetex C18 1.7 µm, 2.1 mm × 50 mm column to the Waters Acquity BEH C18 1.7 µm, 2.1 mm × 50 mm (see Figure 1.19).
Under these conditions the Waters Acquity column gives a FLP retention time of about 3.50 min, while the Phenomenex Kinetex column shows a FLP retention time of about 2.80 min. In this case, the dimensions and particle sizes of both columns are identical; however, each uses a different particle design that has the potential to lead to different chromatography (see Section 1.3). After performing the analyses, it was concluded that neither column provides a significant advantage over the other in terms of overall separation of the impurity profile. In both cases, N–1 and N+1 resolution is evident, and the overall impurity profile is similar. The only noticeable difference in performance is the resulting retention times of the FLP for each column. The Phenomenex Kinetex produces an FLP retention time of 2.80 min, while the Waters Acquity produces an FLP retention time of 3.43 min. While the difference in retention time is only 0.63 min, the ability of the Waters Acquity to retain the sequence for a slightly longer period under these conditions results in a slightly improved resolution of the N–1 failure sequence when compared to the Phenomenex Kinetex. For the Phenomenex Kinetex, the resolution of N–1 is 1.05. For the Waters Acquity, the resolution of N–1 is 1.29. While this difference in resolution isn’t profound, it can prove important when analyz-ing rather pure oligonucleotides that can produce N–1 levels less than 1.0%.
The previous example compared the chromatography of two columns (Waters Acquity and Phenomenex Kinetex) that had the same dimensions and particle size. These columns also operated
0.60
0.50
0.40
0.30
0.20
0.10
0.000.00 0.50 1.00 1.50 2.00 2.50 3.00 3.50 4.00 4.50 5.00 5.50 6.00 6.50 7.00 7.50 8.00 8.50 9.00 9.50 10.00
Minutes
AU
0.0700.0600.0500.0400.0300.0200.0100.000
−0.0101.40 1.60 1.80 2.00 2.20 2.40 2.60 2.80 3.00 3.20 3.40 3.60 3.80 4.00 4.20 4.40 4.60 4.80 5.00 5.20
Minutes
AU
N–2, N–1
FLP
N–3 N+1
fIgure 1.18 Chromatography of a 2′-O-methyl phosphorothioate RNA 20-mer using a Waters Acquity BEH C18 column (with expansion). Mobile phase A: 400 mM HFIP, 15 mM TEA; mobile phase B: acetonitrile.
K11050_C001.indd 22 11/15/2010 6:29:00 PM
Purity Analysis and Impurities Determination 23
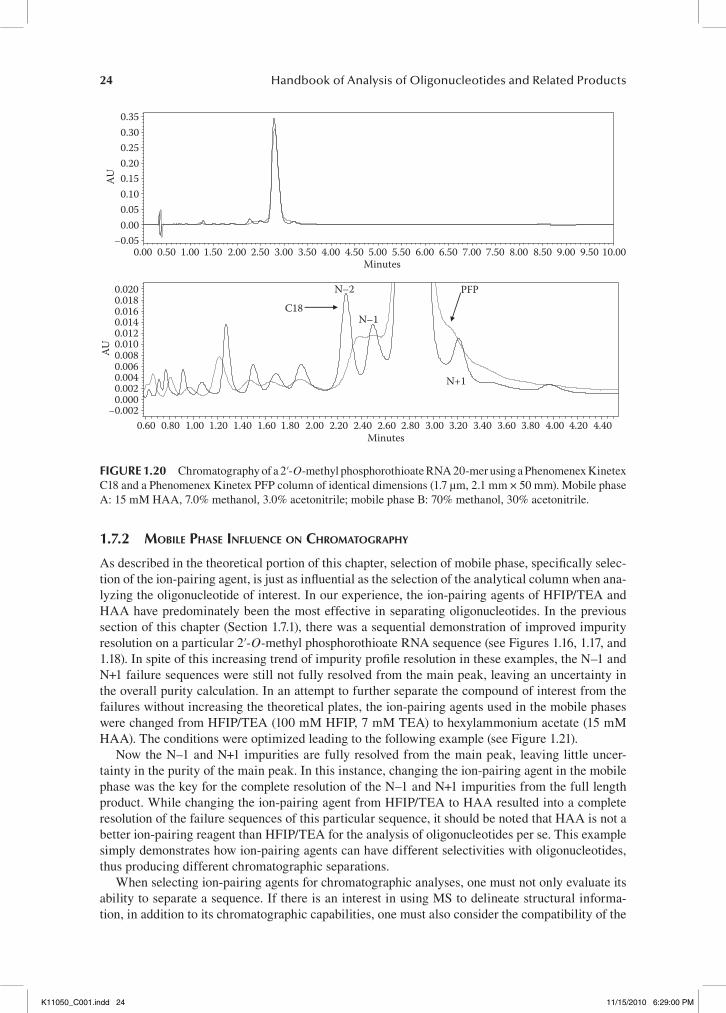
under the same mechanism, that being a hydrophobic interaction between the oligonucleotide of interest and the C18 chain attached to the solid support. The C18 column is currently the preferred phase for chromatographic oligonucleotide analysis; however, various column manufacturers are exploring other phase options that might be the next preferred method in oligonucleotide analysis. One such alternative that is currently being explored is a pentafluorophenyl (PFP) phase, which, sim-ilar to the C18 column, interacts via hydrophobic interactions (for details, see Section 1.4). In order to compare how the PFP phase performs in comparison to a C18 phase, the same sequence from the example in Figure 1.19 was run under identical conditions using a Phenomenex Kinetex PFP 1.7 µm, 2.1 mm × 50 mm instead of the Kinetex C18 1.7 µm, 2.1 mm × 50 mm (see Figure 1.20).
On the basis of the overlaid chromatograms of these two analyses (at full scale), the same dimen-sions and particle sizes of these two columns leads to a nearly identical retention of the oligonucle-otide of interest. However, when zooming in on the region of the full length product, it’s obvious that there are substantial differences in the interactions of these two phases with this oligonucleotide. Under these conditions, the N–2, N–1, and N+1 failures are well resolved when using the C18 phase. In contrast, when using the column with the PFP phase, the N–2 and N–1 failure sequences co-elute and are not well resolved from the full length product, and the N+1 failure elutes as a shoulder off of the back side of the main peak. In addition to failing to completely resolve the N–1 from the main peak, the failure sequences are not well resolved when using the PFP phase. This can prove detrimental when analyzing samples of low concentrations because the broadening of the impurity profile can cause low level impurities to be lost in the baseline noise, thus leading to an inaccurate depiction of the entire profile of the sample. When analyzing this 2′-O-methyl phosphorothioate RNA 20-mer sequence, it is obvious that the PFP column does not resolve the impurity profile as well as the C18 phase, in spite of their similar selection mechanism.
Phenomenex kinetexWaters acquity0.35
0.300.250.200.150.100.050.00
0.50 1.00 1.50 2.00 2.50 3.00 3.50 4.00 4.50 5.00 5.50 6.00 6.50 7.00 7.50 8.00 8.50 9.00 9.50 10.00
0.0240.0220.0200.0180.0160.0140.0120.0100.0080.0060.0040.0020.000
−0.002−0.004
2.00 2.20 2.40 2.60 2.80 3.203.00 3.40 3.60 3.80 4.00 4.20 4.40
N–1; R = 1.05N–1; R = 1.29
Minutes
Minutes
AUAU
fIgure 1.19 Chromatography of a 2′-O-methyl phosphorothioate RNA 20-mer using Waters Acquity and Phenomnex Kinetex C18 columns. Mobile phase A: 15 mM HAA, 7.0% methanol, 3.0% acetonitrile; mobile phase B: 70% methanol, 30% acetonitrile.
K11050_C001.indd 23 11/15/2010 6:29:00 PM
24 Handbook of Analysis of Oligonucleotides and Related Products
1.7.2 mobIle phase InfluenCe on Chromatography
As described in the theoretical portion of this chapter, selection of mobile phase, specifically selec-tion of the ion-pairing agent, is just as influential as the selection of the analytical column when ana-lyzing the oligonucleotide of interest. In our experience, the ion-pairing agents of HFIP/TEA and HAA have predominately been the most effective in separating oligonucleotides. In the previous section of this chapter (Section 1.7.1), there was a sequential demonstration of improved impurity resolution on a particular 2′-O-methyl phosphorothioate RNA sequence (see Figures 1.16, 1.17, and 1.18). In spite of this increasing trend of impurity profile resolution in these examples, the N–1 and N+1 failure sequences were still not fully resolved from the main peak, leaving an uncertainty in the overall purity calculation. In an attempt to further separate the compound of interest from the failures without increasing the theoretical plates, the ion-pairing agents used in the mobile phases were changed from HFIP/TEA (100 mM HFIP, 7 mM TEA) to hexylammonium acetate (15 mM HAA). The conditions were optimized leading to the following example (see Figure 1.21).
Now the N–1 and N+1 impurities are fully resolved from the main peak, leaving little uncer-tainty in the purity of the main peak. In this instance, changing the ion-pairing agent in the mobile phase was the key for the complete resolution of the N–1 and N+1 impurities from the full length product. While changing the ion-pairing agent from HFIP/TEA to HAA resulted into a complete resolution of the failure sequences of this particular sequence, it should be noted that HAA is not a better ion-pairing reagent than HFIP/TEA for the analysis of oligonucleotides per se. This example simply demonstrates how ion-pairing agents can have different selectivities with oligonucleotides, thus producing different chromatographic separations.
When selecting ion-pairing agents for chromatographic analyses, one must not only evaluate its ability to separate a sequence. If there is an interest in using MS to delineate structural informa-tion, in addition to its chromatographic capabilities, one must also consider the compatibility of the
0.350.300.250.200.150.100.050.00
−0.050.00 0.50 1.00 1.50 2.00 2.50 3.00 3.50 4.00 4.50 5.00 5.50 6.00 6.50 7.00 7.50 8.00 8.50 9.00 9.50 10.00
Minutes
AU
0.0200.0180.0160.0140.0120.0100.008AU
0.0060.0040.0020.000
−0.0020.60 0.80 1.00 1.20 1.40 1.60 1.80 2.00 2.20 2.40 2.60
Minutes2.80 3.00 3.20 3.40 3.60 3.80 4.00 4.20 4.40
C18
N–2
N–1
N+1
PFP
fIgure 1.20 Chromatography of a 2′-O-methyl phosphorothioate RNA 20-mer using a Phenomenex Kinetex C18 and a Phenomenex Kinetex PFP column of identical dimensions (1.7 µm, 2.1 mm × 50 mm). Mobile phase A: 15 mM HAA, 7.0% methanol, 3.0% acetonitrile; mobile phase B: 70% methanol, 30% acetonitrile.
K11050_C001.indd 24 11/15/2010 6:29:00 PM

Purity Analysis and Impurities Determination 25
selected mobile phase with mass spectrometry. Mass spectrometry plays an important role in the process development of an oligonucleotide owing to its ability to identify any impurities or failure sequences that are produced during a synthetic process. When coupled with HPLC (or UPLC), mass spectrometry allows the analyst to directly correlate a chromatographic peak with its atomic mass, thus allowing quantitation and identification of impurities in a sample’s profile. Selection of the ion-pairing agent is important when using mass spectrometry. Ion-pairing agents suppress or help ionization of the analyte to different extends resulting into different intensities of the mass signal in the mass spectrometer. In the previous example (see Figure 1.21), when hexylammonium acetate was used, it led to a complete resolution of all impurities for this RNA sequence. However, when this method was transferred to LC/MS, mass identification of low-level impurities was greatly dimin-ished owing to this suppression at the typical column loads of 10 pmol/μL. However, when analyzing the same sequence using an HFIP/TEA buffer system, all low-level impurities were easily detectable. The phenomenon of ion suppression needs to be taken into consideration when selecting an analyti-cal HPLC method and is discussed in greater detail in the mass spectrometry chapter (see Chapter 4). While a particular ion-pairing agent may lead to improved resolution of an oligonucleotide’s UV profile, it may decrease the resolution of mass signal in the total ion count (TIC), thus preventing the analyst from learning valuable information about his or her sample and synthetic process.
1.7.3 hplC versus uplC
As a result of the continual evolution of therapeutic oligonucleotides in the pharmaceutical industry, demands for the production and impurity characterization of oligonucleotides continues to increase. While the typical HPLC system is capable of adequately analyzing a majority of oligonucleotides,
0.220.200.180.160.140.120.100.080.060.040.020.00
−0.02−0.04
0.00 0.50 1.00 1.50 2.00 2.50 3.00 3.50 4.00 4.50 5.00 5.50 6.00 6.50 7.00 7.50 8.00 8.50 9.00 9.50 10.00Minutes
AUAU
0.025
0.020
0.015
0.010
0.005
0.000
−0.005
0.60 0.80 1.00 1.20 1.40 1.60 1.80 2.00 2.20 2.40 2.60 2.80 3.00 3.20Minutes
3.40 3.60 3.80 4.00 4.20 4.40 4.60 4.80 5.00 5.20 5.40
N–2 N–1
FLP
N+1
fIgure 1.21 Chromatography of a 2′-O-methyl phosphorothioate RNA 20-mer using a Waters Acquity BEH UPLC C18 column. Mobile phase A: 15 mM HAA, 7.0% methanol, 3.0% acetonitrile; mobile phase B: 70% methanol, 30% acetonitrile.
K11050_C001.indd 25 11/15/2010 6:29:01 PM
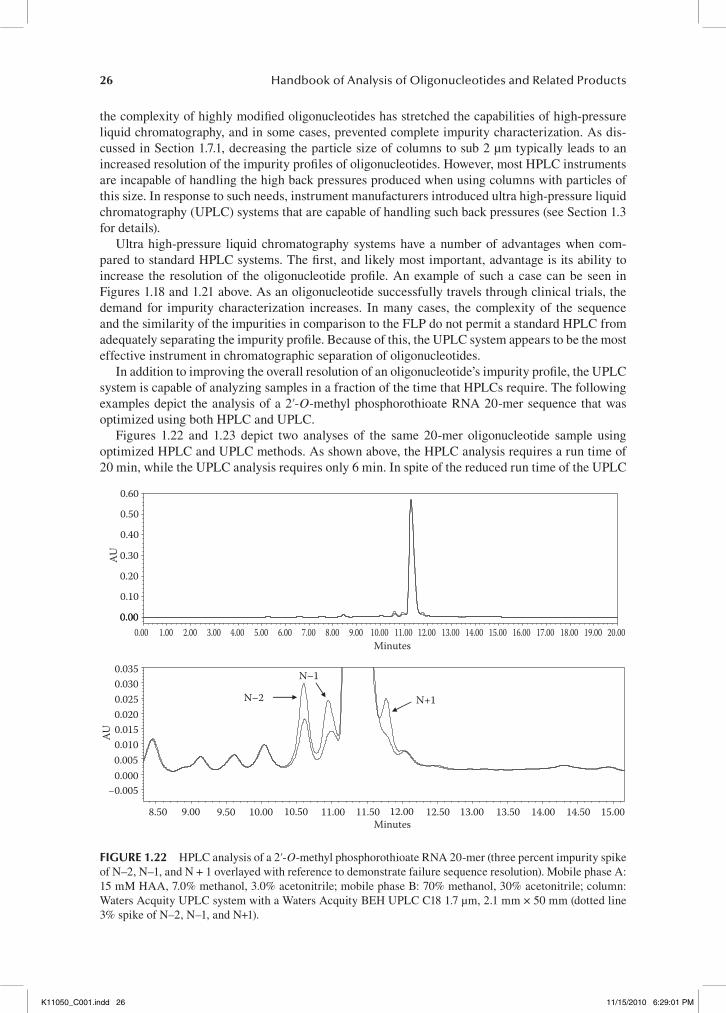
26 Handbook of Analysis of Oligonucleotides and Related Products
the complexity of highly modified oligonucleotides has stretched the capabilities of high-pressure liquid chromatography, and in some cases, prevented complete impurity characterization. As dis-cussed in Section 1.7.1, decreasing the particle size of columns to sub 2 µm typically leads to an increased resolution of the impurity profiles of oligonucleotides. However, most HPLC instruments are incapable of handling the high back pressures produced when using columns with particles of this size. In response to such needs, instrument manufacturers introduced ultra high-pressure liquid chromatography (UPLC) systems that are capable of handling such back pressures (see Section 1.3 for details).
Ultra high-pressure liquid chromatography systems have a number of advantages when com-pared to standard HPLC systems. The first, and likely most important, advantage is its ability to increase the resolution of the oligonucleotide profile. An example of such a case can be seen in Figures 1.18 and 1.21 above. As an oligonucleotide successfully travels through clinical trials, the demand for impurity characterization increases. In many cases, the complexity of the sequence and the similarity of the impurities in comparison to the FLP do not permit a standard HPLC from adequately separating the impurity profile. Because of this, the UPLC system appears to be the most effective instrument in chromatographic separation of oligonucleotides.
In addition to improving the overall resolution of an oligonucleotide’s impurity profile, the UPLC system is capable of analyzing samples in a fraction of the time that HPLCs require. The following examples depict the analysis of a 2′-O-methyl phosphorothioate RNA 20-mer sequence that was optimized using both HPLC and UPLC.
Figures 1.22 and 1.23 depict two analyses of the same 20-mer oligonucleotide sample using optimized HPLC and UPLC methods. As shown above, the HPLC analysis requires a run time of 20 min, while the UPLC analysis requires only 6 min. In spite of the reduced run time of the UPLC
0.60
0.50
0.40
0.30AU
0.20
0.10
0.000.00 1.00 2.00 3.00 4.00 5.00 6.00
0.007.00 8.00 9.00 10.00 11.00
Minutes12.00 13.00 14.00 15.00 16.00 17.00 18.00 19.00 20.00
0.0350.0300.0250.0200.015AU
0.0100.0050.000
−0.005
8.50 9.00 9.50 10.00 10.50 11.00 11.50 12.00Minutes
12.50 13.00 13.50 14.00 14.50 15.00
N–2
N–1
N+1
fIgure 1.22 HPLC analysis of a 2′-O-methyl phosphorothioate RNA 20-mer (three percent impurity spike of N–2, N–1, and N + 1 overlayed with reference to demonstrate failure sequence resolution). Mobile phase A: 15 mM HAA, 7.0% methanol, 3.0% acetonitrile; mobile phase B: 70% methanol, 30% acetonitrile; column: Waters Acquity UPLC system with a Waters Acquity BEH UPLC C18 1.7 µm, 2.1 mm × 50 mm (dotted line 3% spike of N–2, N–1, and N+1).
K11050_C001.indd 26 11/15/2010 6:29:01 PM

Purity Analysis and Impurities Determination 27
method, impurity resolution of the N–1 and N+1 failure sequences is maintained. The reduced run times of the UPLC system can prove invaluable when analyzing in process samples that require short turnaround times such as deprotection and stability indicating samples. In addition, at times of high sample volumes, such as during fraction analysis following purification, a fast analytical method is of great importance to increase turnaround time. A UPLC’s ability to reduce run times to as little as 10% of a typical HPLC method improves the overall efficiency of both synthesis and analytical laboratories.
In addition to the previous two advantages that UPLC analyses have over HPLC analyses, a third advantage is the flow rate of typical UPLC methods. A majority of the UPLC methods used to analyze oligonucleotides run in the range of 0.2–0.4 mL/min. When compared to reversed-phase HPLC methods that typically run at a range of 0.5–0.75 mL/min, mobile phase consumption can be reduced to approximately 25% when using UPLC. This flow rate reduction not only reduces the amount of ion-pairing agent and solvent that needs to be purchased, but it also reduces the amount of waste that is produced.
1.7.4 temperature InfluenCes of Chromatography
The retention of oligonucleotides is often greatly affected by temperature. It has been suggested that column temperature will dictate the extent to which the ion-pairing reagent is adsorbed to the stationary phase and thus will impact the electrostatic interaction of the oligonucleotide with its surface.62 Additionally, increasing the temperature is expected to impact the peak shape. As was discussed in Section 1.3, increasing the temperature will typically improve mass transfer properties. The example shown in Figure 1.24 demonstrates the impact of temperature on the retention time and peak shape of a 16-mer phosphorothioate LNA (locked nucleic acid)/DNA mixed sequence. Buffers were composed of 100 mM HFIP spiked with 7 mM triethylamine in water (mobile phase A) and methanol (mobile phase B). The retention time was shifted by as much as 27% on increasing the column temperature from 30° to 60°C.
Shown in Figure 1.24 is an overlay of four separations carried out on a 16-mer mixed LNA/DNA sequence at four column temperatures using an XTerra MS-C18 column (2.5 µm, 4.6 mm × 50 mm). The temperature also had a pronounced effect on the peak shape, as seen in the expansions below. The sharpness of the peak correlates with an increase in column temperature.
Another phenomenon related to peak shape was uncovered on further expansion of the spectra (see Figure 1.25): splitting of the main peak into leading and tailing shoulders. At low temperature, e.g., 30°C, a shoulder appears at the early retention time relative to the apex. At high temperature (60°C), the shoulder appears at longer retention time compared to the center of the peak. This shoul-dering effect, when pronounced, presents an obstacle to consistent integration of the full length
0.80
0.60
0.40AU
0.20
0.00
0.00 0.20 0.40 0.60 0.80 1.00 1.20 1.40 1.60 1.80 2.00 2.20 2.40 2.60 2.80 3.00 3.20Minutes
3.40 3.60 3.80 4.00 4.20 4.40 4.60 4.80 5.00 5.20 5.40 5.60 5.80 6.00
fIgure 1.23 UPLC analysis of a 2′-O-methyl phosphorothioate RNA 20-mer. Mobile phase A: 15 mM HAA, 7.0% methanol, 3.0% acetonitrile; mobile phase B: 70% methanol, 30% acetonitrile; column: Waters Acquity UPLC system with a Waters Acquity BEH UPLC C18 1.7 µm, 2.1 mm × 50 mm.
K11050_C001.indd 27 11/15/2010 6:29:01 PM
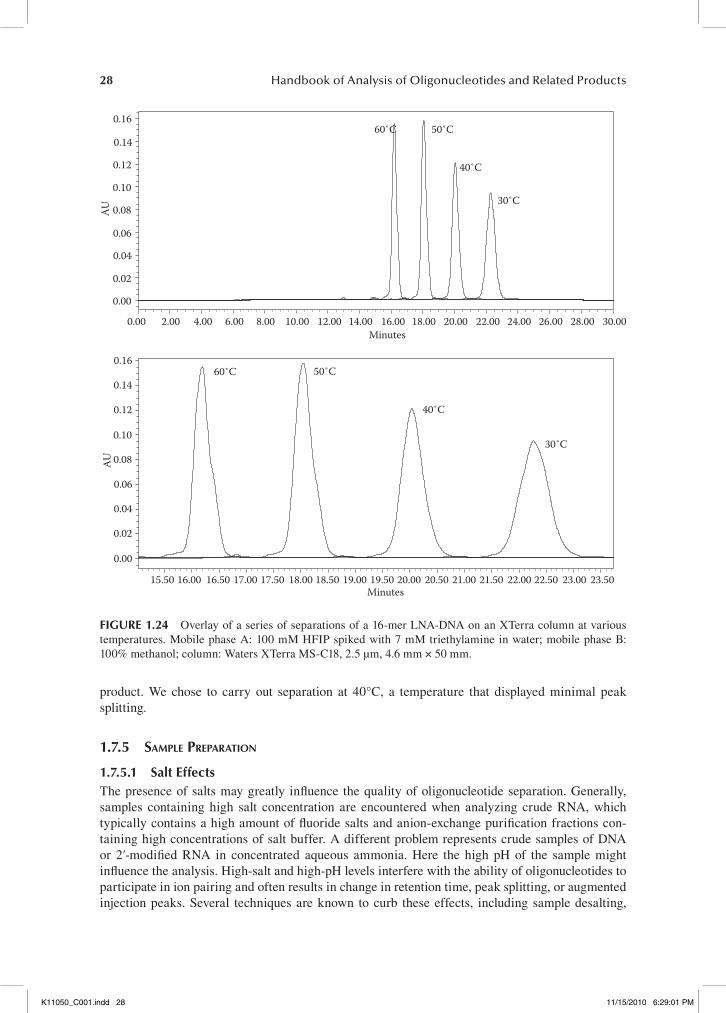
28 Handbook of Analysis of Oligonucleotides and Related Products
product. We chose to carry out separation at 40°C, a temperature that displayed minimal peak splitting.
1.7.5 sample preparatIon
1.7.5.1 salt effectsThe presence of salts may greatly influence the quality of oligonucleotide separation. Generally, samples containing high salt concentration are encountered when analyzing crude RNA, which typically contains a high amount of fluoride salts and anion-exchange purification fractions con-taining high concentrations of salt buffer. A different problem represents crude samples of DNA or 2′-modified RNA in concentrated aqueous ammonia. Here the high pH of the sample might influence the analysis. High-salt and high-pH levels interfere with the ability of oligonucleotides to participate in ion pairing and often results in change in retention time, peak splitting, or augmented injection peaks. Several techniques are known to curb these effects, including sample desalting,
0.16
0.14
0.12
0.10
0.08AU
0.06
0.04
0.02
0.00
0.00 2.00 4.00 6.00 8.00 10.00 12.00 14.00Minutes
16.00 18.00 20.00 22.00 24.00 26.00 28.00 30.00
60˚C 50˚C
40˚C
60˚C 50˚C
40˚C
30˚C
0.16
0.14
0.12
0.10
0.08AU
0.06
0.04
0.02
0.00
15.50 16.00 16.50 17.00 17.50 18.00 18.50 19.00 19.50Minutes
20.00 20.50 21.00 21.50 22.00 22.50 23.00 23.50
30˚C
fIgure 1.24 Overlay of a series of separations of a 16-mer LNA-DNA on an XTerra column at various temperatures. Mobile phase A: 100 mM HFIP spiked with 7 mM triethylamine in water; mobile phase B: 100% methanol; column: Waters XTerra MS-C18, 2.5 µm, 4.6 mm × 50 mm.
K11050_C001.indd 28 11/15/2010 6:29:01 PM

Purity Analysis and Impurities Determination 29
0.0900.0800.0700.0600.0500.0400.030
AU
0.0200.0100.000
21.00 21.20 21.40 21.60 21.80 22.00 22.20 22.40Minutes
22.60 22.80 23.00 23.20 23.40 23.60
30˚C
0.12
0.10
0.08
0.06
0.04
AU
0.02
0.0018.90 19.00 19.10 19.20 19.30 19.40 19.50 19.60 19.70 19.80 19.90 20.00 20.10
Minutes20.20 20.30 20.40 20.50 20.60 20.70 20.80 20.90 21.00 21.10 21.20 21.30 21.40
40˚C
50˚C0.160.140.120.100.080.06
AU
0.040.020.00
16.60 16.80 17.0017.00 17.20 17.40 17.60 17.80 18.00Minutes
18.20 18.40 18.60 18.80 19.00 19.20 19.40 19.60
0.160.140.120.100.080.06
AU
0.040.020.00
15.10 15.20 15.30 15.40 15.50 15.60 15.70 15.80 15.90 16.00 16.10 16.20 16.30Minutes
16.40 16.50 16.60 16.70 16.80 16.90 17.00 17.10 17.20 17.30 17.40 17.50
60˚C
fIgure 1.25 Peak shape and shouldering at various temperatures of a 16-mer LNA-DNA oligonucleotide. Mobile phase A: 100 mM HFIP spiked with 7 mM triethylamine in water; mobile phase B: 100% methanol; column: Waters XTerra MS-C18, 2.5 µm, 4.6 mm × 50 mm.
K11050_C001.indd 29 11/15/2010 6:29:02 PM
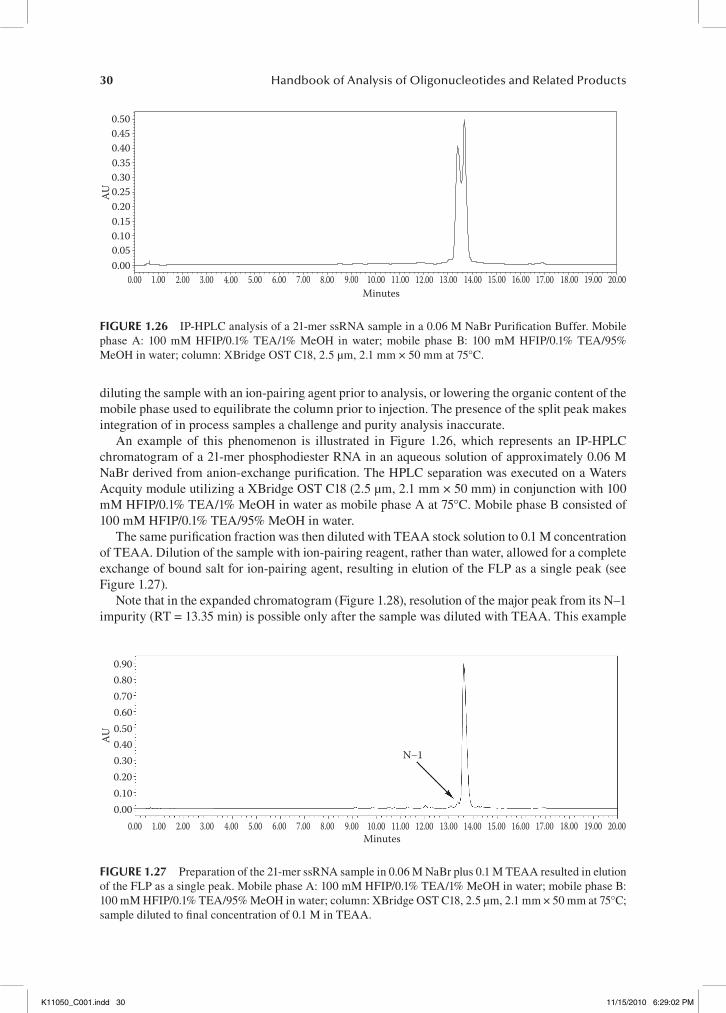
30 Handbook of Analysis of Oligonucleotides and Related Products
diluting the sample with an ion-pairing agent prior to analysis, or lowering the organic content of the mobile phase used to equilibrate the column prior to injection. The presence of the split peak makes integration of in process samples a challenge and purity analysis inaccurate.
An example of this phenomenon is illustrated in Figure 1.26, which represents an IP-HPLC chromatogram of a 21-mer phosphodiester RNA in an aqueous solution of approximately 0.06 M NaBr derived from anion-exchange purification. The HPLC separation was executed on a Waters Acquity module utilizing a XBridge OST C18 (2.5 µm, 2.1 mm × 50 mm) in conjunction with 100 mM HFIP/0.1% TEA/1% MeOH in water as mobile phase A at 75°C. Mobile phase B consisted of 100 mM HFIP/0.1% TEA/95% MeOH in water.
The same purification fraction was then diluted with TEAA stock solution to 0.1 M concentration of TEAA. Dilution of the sample with ion-pairing reagent, rather than water, allowed for a complete exchange of bound salt for ion-pairing agent, resulting in elution of the FLP as a single peak (see Figure 1.27).
Note that in the expanded chromatogram (Figure 1.28), resolution of the major peak from its N–1 impurity (RT = 13.35 min) is possible only after the sample was diluted with TEAA. This example
0.900.800.700.600.50
AU 0.400.300.200.100.00
0.00 1.00 2.00 3.00 4.00 5.00 6.00 7.00 8.00 9.00 10.00Minutes
11.00 12.00 13.00 14.00 15.00 16.00 17.00 18.00 19.00 20.00
N–1
fIgure 1.27 Preparation of the 21-mer ssRNA sample in 0.06 M NaBr plus 0.1 M TEAA resulted in elution of the FLP as a single peak. Mobile phase A: 100 mM HFIP/0.1% TEA/1% MeOH in water; mobile phase B: 100 mM HFIP/0.1% TEA/95% MeOH in water; column: XBridge OST C18, 2.5 µm, 2.1 mm × 50 mm at 75°C; sample diluted to final concentration of 0.1 M in TEAA.
0.500.450.400.350.300.250.200.150.100.050.00
0.00 1.00 2.00 3.00 4.00 5.00 6.00 7.00 8.00 9.00 10.00Minutes
11.00 12.00 13.00 14.00 15.00 16.00 17.00 18.00 19.00 20.00
AU
fIgure 1.26 IP-HPLC analysis of a 21-mer ssRNA sample in a 0.06 M NaBr Purification Buffer. Mobile phase A: 100 mM HFIP/0.1% TEA/1% MeOH in water; mobile phase B: 100 mM HFIP/0.1% TEA/95% MeOH in water; column: XBridge OST C18, 2.5 µm, 2.1 mm × 50 mm at 75°C.
K11050_C001.indd 30 11/15/2010 6:29:02 PM

Purity Analysis and Impurities Determination 31
shows that purification fractions containing high salt concentrations could be analyzed effectively by diluting analytical samples with a stock solution of TEAA instead of water.
Another common problem encountered in either the analysis of crude samples in ammonia or the purification fractions in high salt buffer is the presence of a dominant injection peak. Figure 1.29 displays such a chromatogram in which the major oligonucleotide peak is dwarfed by the injection peak at RT = 0.7 min. The sample, a 24-mer phosphorothioate DNA sequence, was obtained from a large-scale manufacturing purification using a buffer composition of 20 mM sodium hydroxide (mobile phase A) and 20 mM sodium hydroxide in 3 M NaCl (mobile phase B). The sample was ana-lyzed on a Waters UPLC system with a Waters OST C18 column (1.7 µm, 2.1 mm × 50 mm) utilizing 100 mM HFIP/0.1% TEA in water as mobile phase A and 100% MeOH as mobile phase B.
A dominant injection peak is particularly undesirable for crude samples because shorter failure sequences often co-elute with the injection peak, resulting in an artificially high percent purity of
0.90
0.80
0.70
0.60
0.50
0.40AU
0.30
0.20
0.10
0.00
12.50 12.60 12.70 12.80 12.90 13.00 13.10 13.20 13.30 13.40 13.50Minutes
13.60 13.70 13.80 13.90 14.00 14.10 14.20 14.30 14.40 14.50
fIgure 1.28 Expanded overlay of the chromatograms from Figures 1.26 and 1.27 before and after dilu-tion with TEAA. Mobile phase A: 100 mM HFIP/0.1% TEA/1% MeOH in water; mobile phase B: 100 mM HFIP/0.1% TEA/95% MeOH in water; column: XBridge OST C18, 2.5 µm, 2.1 mm × 50 mm at 75°C.
1.301.201.101.000.900.800.700.60AU
0.500.400.300.200.100.00
0.00 0.50 1.00 1.50 2.00 2.50 3.00 3.50 4.00 4.50 5.00 5.50Minutes6.00 6.50 7.00 7.50 8.00 8.50 9.00 9.50 10.00 10.50 11.00 11.50 12.00
fIgure 1.29 An overriding injection peak leads to complete loss of resolution in the analysis of a 24-mer phosphorothioate DNA sample in a NaCl buffer. Mobile phase A: 100 mM HFIP/0.1% TEA in water; mobile phase B: 70% MeOH/30% ACN; column: Waters Acquity UPLC system with an Acquity BEH UPLC C18 column 1.7 µm, 2.1 mm × 50 mm 55°C.
K11050_C001.indd 31 11/15/2010 6:29:02 PM

32 Handbook of Analysis of Oligonucleotides and Related Products
the major peak by area integration. The 24-mer phosphorothioate DNA product shown in Figure 1.29 was diluted to 0.1 M TEAA and reanalyzed to give the spectrum shown in Figure 1.30. Again, the resolution of the main peak from the major impurity is dramatically improved.
Figure 1.31 depicts the chromatography of a 20-mer 2′-O-methyl phosphorothioate RNA whose sample was prepared in water. The sample is representative of a selected pool of purification frac-tions from AEX purification and therefore containing high salt concentration. The chromatography was carried out on UPLC, Waters Acquity column, 1.7 µm, 2.1 mm × 50 mm (45–55% mobile phase B over 8 min) at 60°C. Mobile phase A was composed of 15 mM HAA in water, and mobile phase B consisted of methanol in acetonitrile.
The typical broadening of the main peak and characteristic injection peak was attributed to high salt content of the pooled purification fractions. The importance of matching the ion-pairing reagent used for dilution with the ion-pairing reagent in the mobile phase was demonstrated by diluting the sample to 0.01 M in TEAA and analyzing the sample with the HAA method described above. The resulting chromatogram is displayed in Figure 1.32.
The spectrum, shown in detail in the lower chromatogram of Figure 1.32, still shows significant peak splitting as well as an attendant injection peak. It is thought that the triethylammonium cation binds strongly to the oligonucleotide and does not allow for effective exchange between the TEAA (used for sample preparation) and HAA used for elution. The split peak can be understood in terms of a sample mixture consisting of TEAA and HAA bound to the oligonucleotide; each having a
1.20
1.00
0.80
0.60AU
0.40
0.20
0.000.00 0.50 1.00 1.50 2.00 2.50 3.00 3.50 4.00 4.50
Minutes5.00 5.50 6.00 6.50 7.00 7.50 8.00 8.50 9.00 9.50 10.00
fIgure 1.31 IP-UPLC chromatography of a 20-mer 2′-O-methyl phosphorothioate RNA from AEX purifi-cation diluted in water. Mobile phase A: 15 mM HAA in water; mobile phase B: MeOH/ACN; column: Waters Acquity UPLC system with an Acquity BEH UPLC C18 column 1.7 µm, 2.1 mm × 50 mm 60°C.
0.400.350.300.250.20
AU
0.150.100.050.00
0.00 0.50 1.00 1.50 2.502.00 3.00 3.50 4.00 4.50 5.00 5.50Minutes
6.00 6.50 7.00 7.50 8.00 8.50 9.00 9.50 10.00 10.50 11.00 11.50 12.00
fIgure 1.30 Dilution of the high salt sample to 0.1 M TEAA permits analysis of the 24-mer phosphoro-thioate DNA sample. Mobile phase A: 100 mM HFIP/0.1% TEA in water; mobile phase B: 70% MeOH/30% ACN; column: Waters Acquity UPLC system with an Acquity BEH UPLC C18 column 1.7 µm, 2.1 mm × 50 mm 55°C; sample prepared in 0.1 M TEAA.
K11050_C001.indd 32 11/15/2010 6:29:03 PM
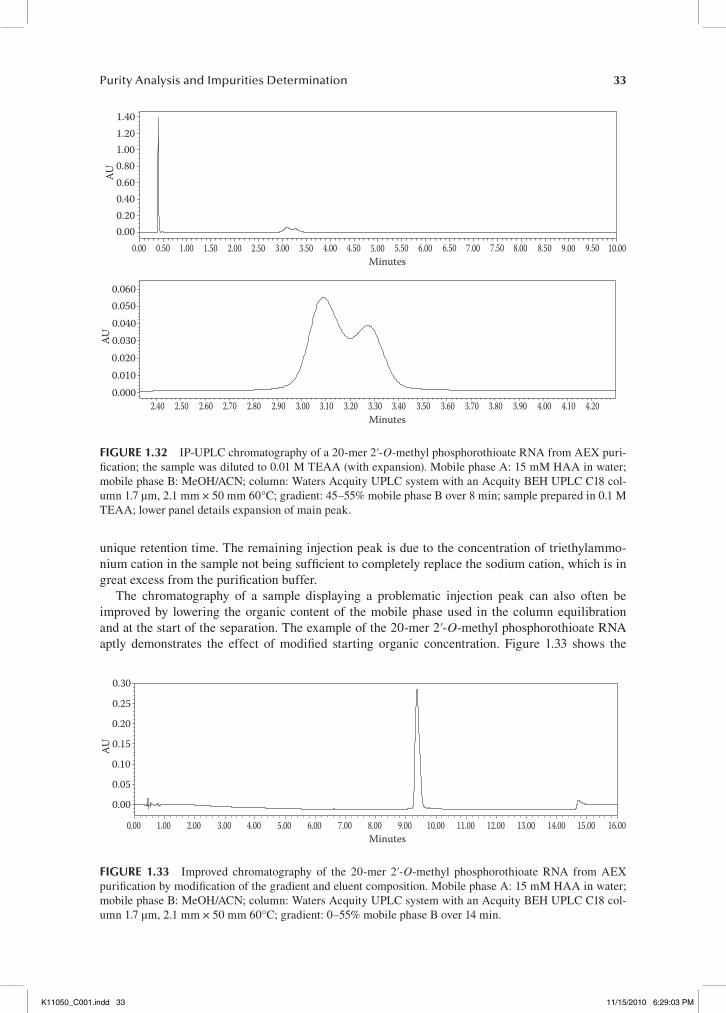
Purity Analysis and Impurities Determination 33
unique retention time. The remaining injection peak is due to the concentration of triethylammo-nium cation in the sample not being sufficient to completely replace the sodium cation, which is in great excess from the purification buffer.
The chromatography of a sample displaying a problematic injection peak can also often be improved by lowering the organic content of the mobile phase used in the column equilibration and at the start of the separation. The example of the 20-mer 2′-O-methyl phosphorothioate RNA aptly demonstrates the effect of modified starting organic concentration. Figure 1.33 shows the
1.401.201.000.800.60AU
0.400.200.00
0.00 0.50 1.00 1.50 2.00 2.50 3.00 3.50 4.00 4.50Minutes
Minutes
5.00 5.50 6.00 6.50 7.00 7.50 8.00 8.50 9.00 9.50 10.00
0.0600.0500.0400.030AU
0.0200.0100.000
2.40 2.50 2.60 2.70 2.80 2.90 3.00 3.10 3.20 3.30 3.40 3.50 3.60 3.70 3.80 3.90 4.00 4.10 4.20
fIgure 1.32 IP-UPLC chromatography of a 20-mer 2′-O-methyl phosphorothioate RNA from AEX puri-fication; the sample was diluted to 0.01 M TEAA (with expansion). Mobile phase A: 15 mM HAA in water; mobile phase B: MeOH/ACN; column: Waters Acquity UPLC system with an Acquity BEH UPLC C18 col-umn 1.7 µm, 2.1 mm × 50 mm 60°C; gradient: 45–55% mobile phase B over 8 min; sample prepared in 0.1 M TEAA; lower panel details expansion of main peak.
0.30
0.25
0.20
0.15AU
0.10
0.05
0.00
0.00 1.00 2.00 3.00 4.00 5.00 6.00 7.00 8.00Minutes
9.00 10.00 11.00 12.00 13.00 14.00 15.00 16.00
fIgure 1.33 Improved chromatography of the 20-mer 2′-O-methyl phosphorothioate RNA from AEX purification by modification of the gradient and eluent composition. Mobile phase A: 15 mM HAA in water; mobile phase B: MeOH/ACN; column: Waters Acquity UPLC system with an Acquity BEH UPLC C18 col-umn 1.7 µm, 2.1 mm × 50 mm 60°C; gradient: 0–55% mobile phase B over 14 min.
K11050_C001.indd 33 11/15/2010 6:29:03 PM

34 Handbook of Analysis of Oligonucleotides and Related Products
chromatography of the 20-mer 2′-O-methyl oligonucleotide on the same system using a gradient of 0–55% B over 14 min instead of 45–55% mobile phase B over 8 min.
Preparation of the sample in 0.1 M HAA allows adequate exchange between bound salt and the ion-pairing buffer. The importance of using the same buffer for dilution as the ion-pairing buffer used for the gradient is highlighted in Figure 1.34.
If dilution of the sample with ion-pairing buffer fails to eliminate the injection peak, the sample may be a candidate for desalting. In this case, a NAP-5TM G-25 Sephadex cartridge (GE Healthcare) was used for rapid sample desalting. The resulting chromatogram is presented in Figure 1.35.
The overall purity of the main component in the desalted sample compared to the sample ana-lyzed after gradient modification is nearly identical: 96.11% FLP in both cases. A comparison of the expanded chromatograms is presented in Figure 1.36.
1.7.5.2 addition of BufferSection 1.7.7 highlights the challenges in the analysis of duplex RNA, specifically the determination of strand excess for the titration of a mixed sequence of RNA and 2′-O-methyl RNA. The analysis of duplex RNA is often difficult because many suitable analytical methods for analysis of single strands require high-pH or high-temperature conditions known to cause duplex RNA to denature. Even the use of methods described as “nondenaturing,” generally characterized by neutral pH and low temperature, are sufficiently denaturing to bring about partial denaturation of RNA duplexes owing to the content of organic solvent and ion-pairing reagent of the eluent composition alone. It should be noted that the tendency of the duplex to undergo denaturation is a function of the melt-ing temperature and is highly sequence dependent. The addition of buffering solutions may be
0.140.120.100.080.060.04AU
0.020.00
−0.02−0.04
0.00 0.50 1.00 1.50 2.00 2.50 3.00 3.50 4.00 4.50 5.00Minutes
Minutes
5.50 6.00 6.50 7.00 7.50 8.00 8.50 9.00 9.50 10.00
0.140.120.100.080.060.04AU
0.020.00
−0.02−0.04
0.00 0.50 1.00 1.50 2.00 2.50 3.00 3.50 4.00 4.50 5.00 5.50 6.00 6.50 7.00 7.50 8.00 8.50 9.00 9.50 10.00
fIgure 1.34 The preparation of a sample of the 20-mer 2′-O-methyl phosphorothioate RNA from AEX purification in 0.1 M HAA eliminates the injection peak and peak splitting. Water blank is shown in the lower panel. Mobile phase A: 15 mM HAA in water; mobile phase B: MeOH/ACN; column: Waters Acquity UPLC system with an Acquity BEH UPLC C18 column 1.7 µm, 2.1 mm × 50 mm 60°C; gradient: 45–55% mobile phase B over 8 min; sample prepared in 0.1 M HAA.
K11050_C001.indd 34 11/15/2010 6:29:03 PM

Purity Analysis and Impurities Determination 35
necessary to curb the denaturing effects of the IP-HPLC conditions when analyzing duplex RNA. The resulting IP-HPLC chromatograms show mostly duplex with attendant sense and antisense single- strand components separated. The chromatograms shown in Figure 1.37 correspond to a sample prepared in the presence and absence of phosphate-buffered saline (PBS) using a Waters XBridge C18 column and 100 mM HFIP/16 mM TEAA in water/methanol 99:1 as mobile phase A and 100 mM HFIP/16 mM TEAA in water/methanol 5:95 as mobile phase B. The analysis tem-perature was 20°C for both runs. The first chromatogram (Figure 1.37), representing the sample prepared without PBS buffer, indicates a slight excess of antisense (8.7 min RT) relative to the sense strand (10.9 min RT). However, the presence of both single strands present at the same time indicates that this is not a fully nondenaturing method, which is also called a partially denaturing method. The second chromatogram, showing the analysis of the same sample prepared with PBS, still indicates an excess of antisense strand; however, this time there is only one strand in excess (the antisense strand), indicating that the method is fully nondenaturing, thus all complementary single strand is present in the form of a duplex. Both methods clearly show an excess of antisense strand; however, only when adding buffer to the sample a completely nondenaturing method can be obtained. While a partial denaturing method can be used for determining the excess of a single strand in a duplex, the interpretation of a fully nondenaturing method is easier.
1.7.5.3 concentration and Injection volumeThe appropriate sample concentration range is necessary for optimum purity analysis. Among the analytical techniques routinely used for oligonucleotide characterization (AEX-HPLC, IP-HPLC,
0.600.500.400.30AU
0.200.100.00
0.00 0.50 1.00 1.50 2.00 2.50 3.00 3.50 4.00 4.50Minutes
Minutes
5.00 5.50 6.00 6.50 7.00 7.50 8.00 8.50 9.00 9.50 10.00
0.0180.0160.0140.0120.0100.008AU 0.0060.0040.0020.000
−0.002
0.60 0.80 1.00 1.20 1.40 1.60 1.80 2.00 2.20 2.40 2.60 2.80 3.00 3.20 3.40 3.60 3.80 4.00 4.20 4.40 4.60 4.80 5.00
fIgure 1.35 IP-UPLC chromatography of the 20-mer 2′-O-methyl phosphorothioate RNA sample from purification; the sample was desalted prior to analysis. The expanded chromatogram of 20-mer 2′-O-methyl phosphorothioate RNA sample is displayed in the lower panel. Mobile phase A: 15 mM HAA in water; mobile phase B: MeOH/ACN; column: Waters Acquity UPLC system with an Acquity BEH UPLC C18 column 1.7 µm, 2.1 mm × 50 mm 60°C; gradient: 45–55% mobile phase B over 8 min; lower panel details expansion of main peak; sample was desalted using Sephadex cartridge before analysis.
K11050_C001.indd 35 11/15/2010 6:29:04 PM
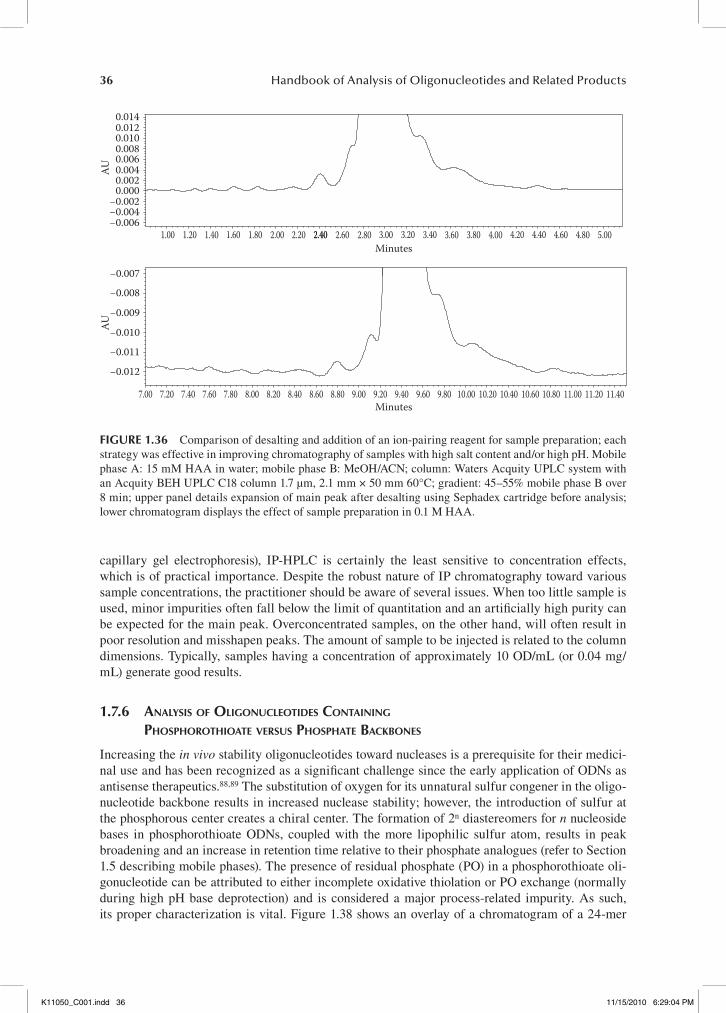
36 Handbook of Analysis of Oligonucleotides and Related Products
capillary gel electrophoresis), IP-HPLC is certainly the least sensitive to concentration effects, which is of practical importance. Despite the robust nature of IP chromatography toward various sample concentrations, the practitioner should be aware of several issues. When too little sample is used, minor impurities often fall below the limit of quantitation and an artificially high purity can be expected for the main peak. Overconcentrated samples, on the other hand, will often result in poor resolution and misshapen peaks. The amount of sample to be injected is related to the column dimensions. Typically, samples having a concentration of approximately 10 OD/mL (or 0.04 mg/mL) generate good results.
1.7.6 analysIs of olIgonuCleotIdes ContaInIng phosphorothIoate versus phosphate baCkbones
Increasing the in vivo stability oligonucleotides toward nucleases is a prerequisite for their medici-nal use and has been recognized as a significant challenge since the early application of ODNs as antisense therapeutics.88,89 The substitution of oxygen for its unnatural sulfur congener in the oligo-nucleotide backbone results in increased nuclease stability; however, the introduction of sulfur at the phosphorous center creates a chiral center. The formation of 2n diastereomers for n nucleoside bases in phosphorothioate ODNs, coupled with the more lipophilic sulfur atom, results in peak broadening and an increase in retention time relative to their phosphate analogues (refer to Section 1.5 describing mobile phases). The presence of residual phosphate (PO) in a phosphorothioate oli-gonucleotide can be attributed to either incomplete oxidative thiolation or PO exchange (normally during high pH base deprotection) and is considered a major process-related impurity. As such, its proper characterization is vital. Figure 1.38 shows an overlay of a chromatogram of a 24-mer
0.0140.0120.0100.0080.0060.0040.002
AU
0.000−0.002−0.004−0.006
1.00 1.20 1.40 1.60 1.80 2.00 2.20 2.40 2.60 2.80 3.002.40Minutes
Minutes
3.20 3.40 3.60 3.80 4.00 4.20 4.40 4.60 4.80 5.00
−0.007
−0.008
−0.009
AU−0.010
−0.011
−0.012
7.00 7.20 7.40 7.60 7.80 8.00 8.20 8.40 8.60 8.80 9.00 9.20 9.40 9.60 9.80 10.00 10.20 10.40 10.60 10.80 11.00 11.20 11.40
fIgure 1.36 Comparison of desalting and addition of an ion-pairing reagent for sample preparation; each strategy was effective in improving chromatography of samples with high salt content and/or high pH. Mobile phase A: 15 mM HAA in water; mobile phase B: MeOH/ACN; column: Waters Acquity UPLC system with an Acquity BEH UPLC C18 column 1.7 µm, 2.1 mm × 50 mm 60°C; gradient: 45–55% mobile phase B over 8 min; upper panel details expansion of main peak after desalting using Sephadex cartridge before analysis; lower chromatogram displays the effect of sample preparation in 0.1 M HAA.
K11050_C001.indd 36 11/15/2010 6:29:04 PM

Purity Analysis and Impurities Determination 37
phosphorothioate DNA oligonucleotide, and its monophosphodiester analogue. Immediately, one notices the shift toward lower retention time for the oligonucleotide containing a single PO linkage (RT = 5.88 min) relative to its phosphorothioate congener (RT = 5.94 min). The method utilized UPLC separation technology as described in the previous section (Waters UPLC, Waters OST C18 column, 1.7 µm, 2.1 mm × 50 mm) HFIP as the ion-pairing agent.
0.35
0.30
0.25
0.20
0.15
0.10
0.05
0.005.50 5.55 5.60 5.65 5.70 5.75 5.80 5.85 5.90 5.95 6.00 6.05 6.10 6.15 6.20 6.25 6.30 6.35 6.40 6.45 6.50
24-mer phosphorothioate
DNA with a single
phosphodiester linkage
RT= 5.88 min
24-mer phosphorothioate DNA
RT= 5.94 min
AU
Minutes
fIgure 1.38 Phosphorothioate DNA 24-mer and its monophosphodiester analogue. Mobile phase A: 100 mM HFIP/0.1% TEA in water; mobile phase B: 70% MeOH/30% ACN; column: Waters Acquity UPLC sys-tem with an Acquity BEH UPLC C18 column 1.7 µm, 2.1 mm × 50 mm 55°C.
0.600.500.40
AU 0.300.200.100.00
0.00 1.00 2.00 3.00 4.00 5.00 6.00 7.00 8.00 9.00Minutes
Minutes
10.00 11.00 12.00 13.00 14.00 15.00 16.00 17.00 18.00 19.00 20.00
0.600.500.40
AU 0.300.200.100.00
0.00 1.00 2.00 3.00 4.00 5.00 6.00 7.00 8.00 9.00 10.00 11.00 12.00 13.00 14.00 15.00 16.00 17.00 18.00 19.00 20.00
Duplex
Antisense strand
Antisense strand
Sense strand
Duplex
fIgure 1.37 Samples of duplex siRNA prepared without (top) and with (bottom) PBS buffer. Mobile phase A: 100 mM HFIP/16 mM TEAA in water/methanol 99:1; mobile phase B: 100 mM HFIP/16 mM TEAA in water/methanol 5:95; Waters Acquity UPLC system with a Waters XBridge OST C18, 2.5 µm, 2.1 mm × 50 mm; 23°C; upper panel highlights the denaturing of the duplex in the absence of PBS buffer (antisense, 13.74%; sense, 10.61%; duplex, 75.65); lower panel shows chromatography after preparing the sample with PBS buffer; (antisense, 2.55%; duplex, 97.35).
K11050_C001.indd 37 11/15/2010 6:29:05 PM
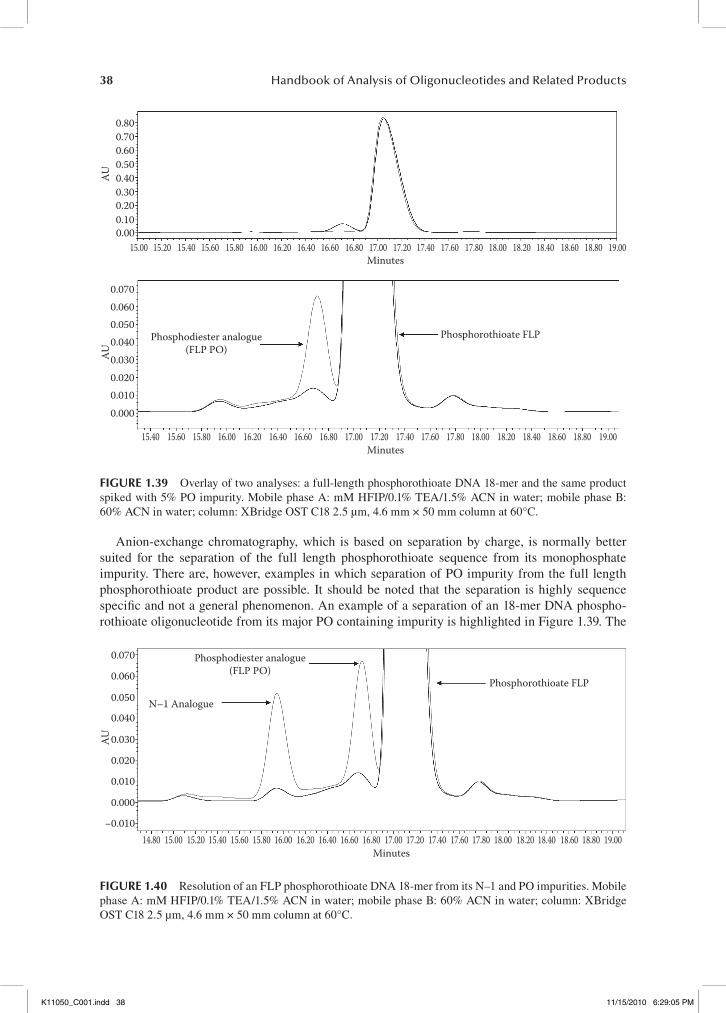
38 Handbook of Analysis of Oligonucleotides and Related Products
Anion-exchange chromatography, which is based on separation by charge, is normally better suited for the separation of the full length phosphorothioate sequence from its monophosphate impurity. There are, however, examples in which separation of PO impurity from the full length phosphorothioate product are possible. It should be noted that the separation is highly sequence specific and not a general phenomenon. An example of a separation of an 18-mer DNA phospho-rothioate oligonucleotide from its major PO containing impurity is highlighted in Figure 1.39. The
0.800.700.600.500.40AU
0.300.200.100.00
15.00 15.20 15.40 15.60 15.80 16.00 16.20 16.40 16.60 16.80Minutes
Minutes
17.00 17.20 17.40 17.60 17.80 18.00 18.20 18.40 18.60 18.80 19.00
0.0700.0600.0500.040
AU 0.0300.0200.0100.000
15.40 15.60 15.80 16.00 16.20 16.40 16.60 16.80 17.00 17.20 17.40 17.60 17.80 18.2018.00 18.40 18.60 18.80 19.00
Phosphodiester analogue(FLP PO)
Phosphorothioate FLP
fIgure 1.39 Overlay of two analyses: a full-length phosphorothioate DNA 18-mer and the same product spiked with 5% PO impurity. Mobile phase A: mM HFIP/0.1% TEA/1.5% ACN in water; mobile phase B: 60% ACN in water; column: XBridge OST C18 2.5 µm, 4.6 mm × 50 mm column at 60°C.
0.070
0.060
0.050
0.040
AU 0.030
0.020
0.010
0.000
−0.01014.80 15.00 15.20 15.40 15.60 15.80 16.00 16.20 16.40 16.60 16.80
Minutes17.00 17.20 17.40 17.60 17.80 18.00 18.20 18.40 18.60 18.80 19.00
Phosphodiester analogue(FLP PO)
N–1 Analogue
Phosphorothioate FLP
fIgure 1.40 Resolution of an FLP phosphorothioate DNA 18-mer from its N–1 and PO impurities. Mobile phase A: mM HFIP/0.1% TEA/1.5% ACN in water; mobile phase B: 60% ACN in water; column: XBridge OST C18 2.5 µm, 4.6 mm × 50 mm column at 60°C.
K11050_C001.indd 38 11/15/2010 6:29:05 PM

Purity Analysis and Impurities Determination 39
separation was carried out on a Waters HPLC system using 100 mM HFIP/0.1% TEA/1.5% ACN in water (mobile phase A) and 60% ACN in water (mobile phase B) an XBridge OST C18 2.5 µm, 4.6 mm × 50 mm column at 60°C.
A spiking experiment highlighting the ability of an IP-HPLC method to separate the FLP (PO) impurity from N–1 and the full-length phosphorothioate product is shown in Figure 1.40.
1.7.7 denaturIng versus nondenaturIng Ion-paIrIng methods
The advent of siRNA as therapeutics has spurred the development of robust methods for analysis of single strands and the corresponding duplexes. Small interfering RNA is typically manufactured using the following steps: (1) synthesis of both single strands, (2) purification of each single strand separately, (3) desalting of each single strand, and, finally, (4) duplex formation by titration and annealing. Titration describes the process by which the duplex is formed through mixing the sense and antisense single strands in an appropriate ratio, ideally forming the “perfect duplex.” The mix-ture is then heated to break up aggregation of single strands and slowly cooled to allow annealing of the complimentary single strands to yield the duplex. Often the titration ratio is difficult to calculate even with prior knowledge of each component’s extinction coefficient. The presence of impurities, particularly shortmers closely related to the full length product (especially N–1), will participate in formation of mismatched duplexes and complicate the process of titration. The necessity of a good analytical method for determination of excess single strand is essential in siRNA manufac-turing and the challenges associated with these methods have been recognized.90 In other words, formation of the perfect duplex is only as perfect as the analytical method. Many HPLC methods, however, require high temperature, high pH, or other conditions that denature, or cause the duplex to lose its secondary and tertiary structure. While these methods may be valuable for purity deter-mination of single-strand components, denaturing of the duplex prohibits accurate measurement of duplex to single strand excess. Instead, a nondenaturing IP-HPLC method needs to be run at low temperature, about neutral pH, and preferably using ion-pairing reagents with less of a tendency to denature. For this reason, McCarthy et al. used HAA buffer in favor of HFIP/TEA for their analyses of siRNA duplex.67 Sample preparation might also be required for achieving fully nondenaturing conditions. It is typically through the combined use of size exclusion chromatography and nondena-turing anion-exchange and/or nondenaturing IP-HPLC that one may determine single-strand excess (see Chapters 2 and 3).
The following example describes the empirical determination of an endpoint for titration of sense and antisense strands to form the corresponding duplex by using a nondenaturing IP-HPLC method. The sense and antisense strands represent typical 21-mer siRNA single strands, composed of RNA and 2′-O-methyl RNA linked by a phosphodiester backbone and having a 2-base phosphorothioate deoxythymidine (dT) overhang. Initially, a broad series of titration ratios were analyzed by varying the relative absorbance-derived OD ratios of sense and antisense strands in 5% increments during a process called microtitration. The samples containing the appropriate ratio of sense to antisense strands were heated to 80°C for a period of 10 min in order to break up any potential self-compli-mentary secondary structure formed by the individual single strands. After cooling the mixtures, samples were analyzed by denaturing and nondenaturing IP-HPLC (see Figures 1.41 and 1.42 and Table 1.4). Several observations follow from analysis of the data. First of all, the expected OD ratios do not correlate with the percent excess single strands found for sense and antisense using the two parallel methods. It is important to note that the perfect titration ratio is seldom a 1:1 mixture by ODs, even if the extinction coefficient has accurately been determined. This phenomenon is gener-ally due to differences in the impurity profile and tendency to form imperfect duplexes. To further illustrate this point, the OD ratios were adjusted on the basis of calculated extinction coefficients of each strand calculated from the nearest neighbor model. One can see that the experimentally deter-mined titration ratio in this example does not at all correlate to the predicted ratio using extinction coefficients derived from the nearest neighbor model (see Table 1.4).
K11050_C001.indd 39 11/15/2010 6:29:05 PM

40 Handbook of Analysis of Oligonucleotides and Related Products
0.14
0.12
0.10
0.08
0.06AU
0.04
0.02
0.000.00 1.00 2.00 3.00 4.00 5.00 6.00 7.00 8.00 9.00 10.00 11.00 12.00
Minutes13.00 14.00 15.00 16.00 17.00 18.00 19.00 20.00 21.00 22.00 23.00 24.00 25.00
SenseRT = 10.22 minArea = 49.68%
AntisenseRT = 14.24 minArea = 50.32%
fIgure 1.42 Denaturing IP-HPLC of the duplex (titration endpoint) from Figure 1.41. A representative separation of the duplex into its complimentary strands by means of a nondenaturing method. In this case, the nondenaturing method is carried out on a Waters XBridge OST C18 column at 75ºC using 100 mM HFIP/7 mM TEA in 1% MeOH and 100 mM HFIP/7 mM TEA in 95% MeOH as mobile phase A and B, respectively. The buffer composition is identical to that used for the nondenaturing conditions. The chief difference in the method is the execution of a shallower gradient at significantly higher (75°C) temperature. Area percentages of both main peaks were set to 100% and are not adjusted for extinction coefficients. Results from the denaturing method show antisense strand in slight excess, which is in agreement with results found from the nondenatur-ing method depicted in Figure 1.41.
0.80
0.70
0.60
0.50
0.40AU
0.30
0.20
0.10
0.000.00 1.00 2.00 3.00 4.00 5.00 6.00 7.00 8.00
Minutes9.00 10.00 11.00 12.00 13.00 14.00 15.00 16.00
1 3 5 79
Titrationendpoint (7)
Antisense, 7.5 min
Sense, 9.3 min
Duplex, 11.8 min
fIgure 1.41 Overlay of a series of titrations of a 21-mer siRNA showing: (1) excess antisense strand: 7.5 min RT; (2) excess sense strand: 9.3 min RT; (3) duplex: 11.8 min RT. Overlay of six titrations analyzed by non-denaturing IP-HPLC. The endpoint of the titration, represented by Titration 4, indicates a slight (~0.5–1.0%) excess of antisense strand. Mobile phase A: 100 mM HFIP/16 mM TEAA in water/methanol 99:1; mobile phase B: 100 mM HFIP/16 mM TEAA in water/methanol 5:95; Waters Acquity UPLC system with a Waters XBridge OST C18, 2.5 µm, 2.1 mm × 50 mm; 23°C.
K11050_C001.indd 40 11/15/2010 6:29:06 PM
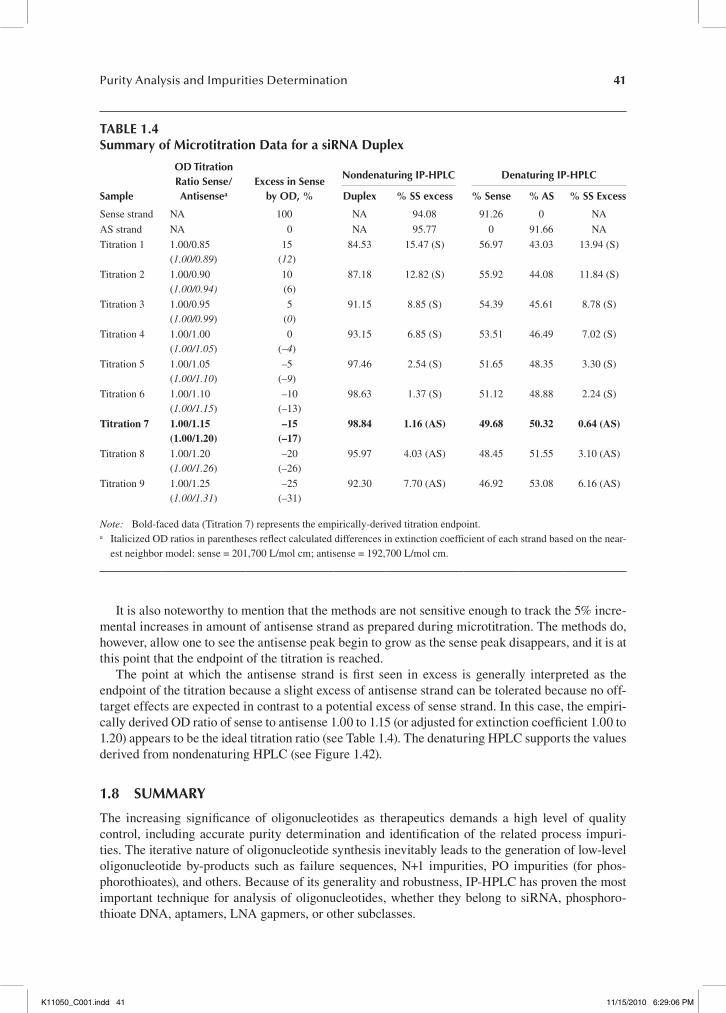
Purity Analysis and Impurities Determination 41
It is also noteworthy to mention that the methods are not sensitive enough to track the 5% incre-mental increases in amount of antisense strand as prepared during microtitration. The methods do, however, allow one to see the antisense peak begin to grow as the sense peak disappears, and it is at this point that the endpoint of the titration is reached.
The point at which the antisense strand is first seen in excess is generally interpreted as the endpoint of the titration because a slight excess of antisense strand can be tolerated because no off-target effects are expected in contrast to a potential excess of sense strand. In this case, the empiri-cally derived OD ratio of sense to antisense 1.00 to 1.15 (or adjusted for extinction coefficient 1.00 to 1.20) appears to be the ideal titration ratio (see Table 1.4). The denaturing HPLC supports the values derived from nondenaturing HPLC (see Figure 1.42).
1.8 summary
The increasing significance of oligonucleotides as therapeutics demands a high level of quality control, including accurate purity determination and identification of the related process impuri-ties. The iterative nature of oligonucleotide synthesis inevitably leads to the generation of low-level oligonucleotide by-products such as failure sequences, N+1 impurities, PO impurities (for phos-phorothioates), and others. Because of its generality and robustness, IP-HPLC has proven the most important technique for analysis of oligonucleotides, whether they belong to siRNA, phosphoro-thioate DNA, aptamers, LNA gapmers, or other subclasses.
taBle 1.4summary of microtitration data for a sirna duplex
sample
od titration ratio sense/antisensea
excess in sense by od, %
nondenaturing Ip-Hplc denaturing Ip-Hplc
duplex % ss excess % sense % as % ss excess
Sense strand NA 100 NA 94.08 91.26 0 NA
AS strand NA 0 NA 95.77 0 91.66 NA
Titration 1 1.00/0.85(1.00/0.89)
15(12)
84.53 15.47 (S) 56.97 43.03 13.94 (S)
Titration 2 1.00/0.90(1.00/0.94)
10(6)
87.18 12.82 (S) 55.92 44.08 11.84 (S)
Titration 3 1.00/0.95(1.00/0.99)
5(0)
91.15 8.85 (S) 54.39 45.61 8.78 (S)
Titration 4 1.00/1.00(1.00/1.05)
0(–4)
93.15 6.85 (S) 53.51 46.49 7.02 (S)
Titration 5 1.00/1.05(1.00/1.10)
–5(–9)
97.46 2.54 (S) 51.65 48.35 3.30 (S)
Titration 6 1.00/1.10(1.00/1.15)
–10(–13)
98.63 1.37 (S) 51.12 48.88 2.24 (S)
Titration 7 1.00/1.15(1.00/1.20)
–15(–17)
98.84 1.16 (AS) 49.68 50.32 0.64 (AS)
Titration 8 1.00/1.20(1.00/1.26)
–20(–26)
95.97 4.03 (AS) 48.45 51.55 3.10 (AS)
Titration 9 1.00/1.25(1.00/1.31)
–25(–31)
92.30 7.70 (AS) 46.92 53.08 6.16 (AS)
Note: Bold-faced data (Titration 7) represents the empirically-derived titration endpoint.a Italicized OD ratios in parentheses reflect calculated differences in extinction coefficient of each strand based on the near-
est neighbor model: sense = 201,700 L/mol cm; antisense = 192,700 L/mol cm.
K11050_C001.indd 41 11/15/2010 6:29:06 PM
42 Handbook of Analysis of Oligonucleotides and Related Products
CGE, AEX, and IP-HPLC are the most widely used analytical tools for the separation of impu-rities from the full length oligonucleotide. In contrast to AEX-HPLC and CGE we have been wit-nessing tremendous improvements of resolution in IP-HPLC over the past two decades by moving to smaller particle size sorbents. Also, IP-HPLC tends to be the most robust method of the three in terms of sample concentration, buffer, and instrument requirements. An additional advantage of IP-HPLC is that it can be directly coupled to an ESI-MS instrument, thereby making it feasible to identify each individual peak, which is not easily possible with CGE or AEX-HPLC.
As with any technique, there are many variables affecting the outcome of the separation and the critical parameters and attendant theory are discussed briefly in the introductory section. Drawing from our broad experience in manufacturing and analyzing a host of oligonucleotide subclasses, we present a selection of valuable examples for the practitioner in the experimental section. Though certainly not comprehensive, Section 1.7 provides guidance in column selection, separation of the main peak from its most commonly observed impurities, techniques to curb salt influences, analysis of oligonucleotide small-molecule conjugates, and others.
acknowledgments
We thank Ananya Dubey, Sean McCarthy, and Martin Gilar from Waters Corporation for giving us access to RP-HPLC relevant journal articles and application notes including figures.
references
1. Cunliffe, J. M., and T. D. Maloney. 2007. Fused-core particle technology as an alternative to sub-2- microm particles to achieve high separation efficiency with low backpressure. Journal of Separation Science 30: 3104–3109.
2. Destefano, J. J., T. J. Langlois, and J. J. Kirkland. 2008. Characteristics of superficially-porous silica particles for fast HPLC: some performance comparisons with sub-2-microm particles. Journal of Chromatographic Science 46: 254–260.
3. Kirkland, J. J. 2000. Ultrafast reversed-phase high-performance liquid chromatographic separations: an overview. Journal of Chromatographic Science 38: 535–544.
4. Kirkland, J. J., F. A. Truszkowski, and R. D. Ricker. 2002. Atypical silica-based column packings for high-performance liquid chromatography. J. Chromatography A 965: 25–34.
5. Svec, F. 2008. What is “hot” in column technologies for liquid chromatography. American Laboratory 40: 13–17.
6. Majors, R. E. 2006. Fast and ultrafast HPLC on sub-2 um porous particles—where do we go from here? LC-GC Europe 19: 352–362.
7. Kirkland, J. J. 2004. Development of some stationary phases for reversed-phase high-performance liquid chromatography. Journal of Chromatography A 1060: 9–21.
8. O’Gara, J. E., B. A. Alden, T. H. Walter, J. S. Peterson, C. L. Niederländer, and U. D. Neue. 1995. Simple preparation of a CS HPLC stationary phase with an internal polar functional group. Analytical Chemistry 67: 3809–3814.
9. O’Gara, J. E., and K. D. Wyndham. 2006. Porous hybrid organic-inorganic particles in reversed-phase liquid chromatography. Journal of Liquid Chromatography and Related Technologies 29: 1025–1045.
10. Kirkland, J. J., F. A. Truszkowski, C. H. Dilks, Jr., and G. S. Engel. 2000. Superficially porous sil-ica microspheres for fast high-performance liquid chromatography of macromolecules. Journal of Chromatography A 890: 3–13.
11. Abrahim, A., M. Al-Sayah, P. Skrdla, Y. Bereznitski, Y. Chen, and N. Wu. 2010. Practical comparison of 2.7 microm fused-core silica particles and porous sub-2 microm particles for fast separations in pharma-ceutical process development. Journal of Pharmaceutical and Biomedical Analysis 51: 131–137.
12. Gilar, M., K. J. Fountain, Y. Budman, et al. 2002. Ion-pair reversed-phase high-performance liquid chromatography analysis of oligonucleotides: retention prediction. Journal of Chromatography A 958: 167–182.
13. Van Deemter, J. J., F. J. Zuiderweg, and A. Klinkenberg. 1956. Longitudinal diffusion and resistance to mass transfer as causes of nonideality in chromatography. Chemical Engineering Science 5: 271–290.
K11050_C001.indd 42 11/15/2010 6:29:06 PM

Purity Analysis and Impurities Determination 43
14. Arghavani, M. B., and L. J. Romano. 1995. A method for the purification of oligonucleotides containing strong intra- or intermolecular interactions by reversed-phase high-performance liquid chromatography. Analytical Biochemistry 231: 201–209.
15. Germann, M. W., R. T. Pon, and J. H. van de Sande. 1987. A general method for the purification of synthetic oligodeoxyribonucleotides containing strong secondary structure by reversed-phase high- performance liquid chromatography on PRP-1 resin. Analytical Biochemistry 165: 399–405.
16. Swiderski, P. M., E. L. Bertrand, and B. E. Kaplan. 1994. Polystyrene reverse-phase ion-pair chromatog-raphy of chimeric ribozymes. Analytical Biochemistry 216: 83–88.
17. Johnson, J. L., W. Guo, J. Zang, et al. 2005. Quantification of raf antisense oligonucleotide (rafAON) in biological matrices by LC-MS/MS to support pharmacokinetics of a liposome-entrapped rafAON formu-lation. Biomedical Chromatography 19: 272–278.
18. Lee, D. P. 1988. Chromatographic evaluation of large-pore and non-porous polymeric reversed phases. Journal of Chromatography 443: 143–153.
19. Huber, C. G., P. J. Oefner, and G. K. Bonn. 1992. High-performance liquid chromatographic separation of detritylated oligonucleotides on highly cross-linked poly-(styrene-divinylbenzene) particles. Journal of Chromatography 599: 113–118.
20. Huber, C. G., P. J. Oefner, and G. K. Bonn. 1993. High-resolution liquid chromatography of oligo-nucleotides on nonporous alkylated styrene-divinylbenzene copolymers. Analytical Biochemistry 212: 351–358.
21. Gelhaus, S. L., and W. R. LaCourse. 2005. Separation of modified 2’-deoxyoligonucleotides using ion-pairing reversed-phase HPLC. Journal of Chromatography. B, Analytical Technologies in the Biomedical and Life Sciences 820: 157–163.
22. Lloyd, L. L., M. I. Millichip, and K. J. Mapp. 2003. Rigid polymerics: the future of oligonucleotide analysis and purification. Journal of Chromatography A 1009: 223–230.
23. Unger, K. K., ed. 1990. Packings and Stationary Phases in Chromatographic Techniques. New York: Marcel Dekker.
24. Petro, M., F. Svec, and J. M. Frechet. 1996. Molded continuous poly(styrene-co-divinylbenzene) rod as a separation medium for the very fast separation of polymers. Comparison of the chromatographic proper-ties of the monolithic rod with columns packed with porous and non-porous beads in high-performance liquid chromatography of polystyrenes. Journal of Chromatography A 752: 59–66.
25. Afeyan, N. B., N. F. Gordon, I. Mazsaroff, et al. 1990. Flow-through particles for the high- performance liquid chromatographic separation of biomolecules: perfusion chromatography. Journal of Chromatog-raphy 519: 1–29.
26. Svec, F., and J. M. J. Frechet. 1992. Continuous rods of macroporous polymer as high-performance liq-uid chromatography separation media. Analytical Chemistry 64: 820–822.
27. Svec, F., and J. M. J. Frechet. 1995. Temperature, a simple and efficient tool for the control of pore size distribution in macroporous polymers. Macromolecules 28: 7580–7582.
28. Mayr, B., G. Holzl, K. Eder, M. R. Buchmeiser, and C. G. Huber. 2002. Hydrophobic, pellicular, mono-lithic capillary columns based on cross-linked polynorbornene for biopolymer separations. Analytical Chemistry 74: 6080–6087.
29. Oberacher, H., B. Wellenzohn, and C. G. Huber. 2002. Comparative sequencing of nucleic acids by liquid chromatography-tandem mass spectrometry. Analytical Chemistry 74: 211–218.
30. Premstaller, A., H. Oberacher, W. Walcher, et al. 2001. High-performance liquid chromatography- electrospray ionization mass spectrometry using monolithic capillary columns for proteomic studies. Analytical Chemistry 73: 2390–2396.
31. Huber, C. G., P. J. Oefner, and G. K. Bonn. 1993. High-resolution liquid chromatography of oligo-nucleotides on nonporous alkylated styrene-divinylbenzene copolymers. Analytical Biochemistry 212: 351–358.
32. Huber, C. G., P. J. Oefner, and G. K. Bonn. 1992. High-performance liquid chromatographic separation of detritylated oligonucleotides on highly cross-linked poly-(styrene-divinylbenzene) particles. Journal of Chromatography 599: 113–118.
33. Oberacher, H., A. Premstaller, and C. G. Huber. 2004. Characterization of some physical and chromato-graphic properties of monolithic poly(styrene-co-divinylbenzene) columns. Journal of Chromatography A 1030: 201–208.
34. Premstaller, A., H. Oberacher, and C. G. Huber. 2000. High-performance liquid chromatography- electrospray ionization mass spectrometry of single- and double-stranded nucleic acids using monolithic capillary columns. Analytical Chemistry 72: 4386–4393.
K11050_C001.indd 43 11/15/2010 6:29:06 PM

44 Handbook of Analysis of Oligonucleotides and Related Products
35. Bisjak, C. P., L. Trojer, S. H. Lubbad, W. Wieder, and G. K. Bonn. 2007. Influence of different polymeri-sation parameters on the separation efficiency of monolithic poly(phenyl acrylate-co-1,4-phenylene dia-crylate) capillary columns. Journal of Chromatography A 1154: 269–276.
36. Wieder, W., C. P. Bisjak, C. W. Huck, R. Bakry, and G. K. Bonn. 2006. Monolithic poly(glycidyl meth-acrylate-co-divinylbenzene) capillary columns functionalized to strong anion exchangers for nucleotide and oligonucleotide separation. Journal of Separation Science 29: 2478–2484.
37. Greiderer, A., S. C. Ligon, Jr., C. W. Huck, and G. K. Bonn. 2009. Monolithic poly(1,2-bis(p-vinylphenyl)ethane) capillary columns for simultaneous separation of low- and high-molecular-weight compounds. Journal of Separation Science 32: 2510–2520.
38. Bakry, R., C. W. Huck, and G. K. Bonn. 2009. Recent applications of organic monoliths in capillary liquid chromatographic separation of biomolecules. Journal of Chromatography Science 47: 418–431.
39. Wieder, W., S. H. Lubbad, L. Trojer, C. P. Bisjak, and G. K. Bonn. 2008. Novel monolithic poly(p-meth-ylstyrene-co-bis(p-vinylbenzyl)dimethylsilane) capillary columns for biopolymer separation. Journal of Chromatography A 1191: 253–262.
40. Trojer, L., S. H. Lubbad, C. P. Bisjak, W. Wieder, and G. K. Bonn. 2007. Comparison between monolithic conventional size, microbore and capillary poly(p-methylstyrene-co-1,2-bis(p-vinylphenyl)ethane) high-performance liquid chromatography columns synthesis, application, long-term stability and reproduc-ibility. Journal of Chromatography A 1146: 216–224.
41. Holdsvendova, P., J. Suchankova, M. Buncek, V. Backovska, and P. Coufal. 2007. Hydroxymethyl methacrylate- based monolithic columns designed for separation of oligonucleotides in hydrophilic- interaction capillary liquid chromatography. Journal of Biochemical and Biophysical Methods 70: 23–29.
42. Xiong, W., J. Glick, Y. Lin, and P. Vouros. 2007. Separation and sequencing of isomeric oligonucleotide adducts using monolithic columns by ion-pair reversed-phase nano-HPLC coupled to ion trap mass spec-trometry. Analytical Chemistry 79: 5312–5321.
43. Sturm, M., S. Quinten, C. G. Huber, and O. Kohlbacher. 2007. A statistical learning approach to the mod-eling of chromatographic retention of oligonucleotides incorporating sequence and secondary structure data. Nucleic Acids Research 35: 4195–4202.
44. Kohlbacher, O., S. Quinten, M. Sturm, B. M. Mayr, and C. G. Huber. 2006. Structure-activity rela-tionships in chromatography: retention prediction of oligonucleotides with support vector regression. Angewwandte Chemie (International Edition in English) 45: 7009–7012.
45. Przybyciel, M., and R. E. Majors. 2002. Phase collapse in reversed-phase LC. LC-GC Europe 15: 652–657. 46. Agrawal, S., J. Y. Tang, and D. M. Brown. 1990. Analytical study of phosphorothioate analogues of oli-
godeoxynucleotides using high-performance liquid chromatography. Journal of Chromatography 509: 396–399.
47. Gilar, M., A. Belenky, and A. S. Cohen. 2000. Polymer solutions as a pseudostationary phase for capil-lary electrochromatographic separation of DNA diastereomers. Electrophoresis 21: 2999–3009.
48. Metelev, V., and S. Agrawal. 1992. Ion-exchange high-performance liquid chromatography analysis of oligodeoxyribonucleotide phosphorothioates. Analytical Biochemistry 200: 342–346.
49. Huber, C. G. 1998. Micropellicular stationary phases for high-performance liquid chromatography of double-stranded DNA. Journal of Chromatography A 806: 3–30.
50. Gilar, M. 2001. Analysis and purification of synthetic oligonucleotides by reversed-phase high- performance liquid chromatography with photodiode array and mass spectrometry detection. Analytical Biochemistry 298: 196–206.
51. Snyder, L. R., J. W. Dolan, and P. W. Carr. 2004. The hydrophobic-subtraction model of reversed-phase column selectivity. Journal of Chromatography A 1060: 77–116.
52. Bidlingmeyer, B. A., S. N. Deming, W. P. Price, Jr., B. Sachok, and M. Petrusek. 1979. Retention mecha-nism for reversed-phase ion-pair liquid chromatography. Journal of Chromatography 186: 419–445.
53. Melander, W. R., and C. Horvath. 1980. Mechanistic study on ion-pair reversed-phase chromatography. Journal of Chromatography 201: 211–224.
54. Cecchi, T. 2008. Ion pairing chromatography. Critical Reviews in Analytical Chemistry 38: 161–214. 55. Jost, W., K. Unger, and G. Schill. 1982. Reverse-phase ion-pair chromatography of polyvalent ions using
oligonucleotides as model substances. Analytical Biochemistry 119: 214–224. 56. Snyder, L. R., J. J. Kirkland, and J. W. Dolan. 2010. Introduction to Modern Liquid Chromatography. 3rd
ed. Hoboken, N.J.: John Wiley. 57. Andrus, A., and R. G. Kuimelis. 2001. Analysis and purification of synthetic nucleic acids using HPLC.
Current Protocols in Nucleic Acid Chemistry Chapter 10: Unit 10.5.
K11050_C001.indd 44 11/15/2010 6:29:06 PM

Purity Analysis and Impurities Determination 45
58. Haupt, W. P., and A. Pingoud. 1983. Comparison of several high-performance liquid chromatography techniques for the separation of oligodeoxynucleotides according to their chain lengths. Journal of Chromatography 260: 419–428.
59. Hoffman, N. E., and J. C. Liao. 1977. Reversed phase high performance liquid chromatographic separa-tions of nucleotides in the presence of solvophobic ions. Analytical Chemistry 49: 2231–2234.
60. Crowther, J. B., R. Jones, and R. A. Hartwick. 1981. High-performance liquid chromatography of the oligonucleotides. Journal of Chromatography 217: 479–490.
61. Makino, K., H. Ozaki, T. Matsumoto, H. Imaishia, T. Takeuchi, and T. Fukui. 1987. Reversed-phase ion-pair chromatography of oligodeoxyribonucleotides. Journal of Chromatography A 400:271–277.
62. McKeown, A. P., P. N. Shaw, and D. A. Barrett. 2002. Retention behaviour of an homologous series of oligodeoxythymidilic acids using reversed-phase ion-pair chromatography. Chromatographia 55: 271–277.
63. Kurata, C., D. C. Capaldi, Z. Wang, N. Luu, and H. Gaus. 2006. Methods for detection, identification and quantification of impurities. US Patent 2009/0095896, filed on Mar. 31, 2006.
64. Ikuta, S., R. Chattopadhyaya, and R. E. Dickerson. 1984. Reverse-phase polystyrene column for purifica-tion and analysis of DNA oligomers. Analytical Chemistry 56: 2253–2257.
65. McCarthy, S. M., and M. Gilar. 2010. Hexylammonium acetate as an ion-pairing agent for IP-RP LC analysis of oligonucleotides. Waters Application Note 720003361EN.
66. Gjerde, D. T., L. Hoang, and D. Hornby. 2009. RNA Purification and Analysis: Sample Preparation, Extraction, Chromatography. Weinheim: Wiley-VCH.
67. McCarthy, S. M., M. Gilar, and J. Gebler. 2009. Reversed-phase ion-pair liquid chromatography analysis and purification of small interfering RNA. Analytical Biochemistry 390: 181–188.
68. Apffel, A., J. A. Chakel, S. Fischer, K. Lichtenwalter, and W. S. Hancock. 1997. New procedure for the use of high-performance liquid chromatography–electrospray ionization mass spectrometry for the analysis of nucleotides and oligonucleotides. Journal of Chromatography A 777: 3–21.
69. Apffel, A., J. A. Chakel, S. Fischer, K. Lichtenwalter, and W. S. Hancock. 1997. Analysis of oligonucle-otides by HPLC-electrospray ionization mass spectrometry. Analytical Chemistry 69: 1320–1325.
70. Gilar, M., K. J. Fountain, Y. Budman, J. L. Holyoke, H. Davoudi, and J. C. Gebler. 2003. Characterization of therapeutic oligonucleotides using liquid chromatography with on-line mass spectrometry detection. Oligonucleotides 13: 229–243.
71. Gilar, M., and U. D. Neue. 2007. Peak capacity in gradient reversed-phase liquid chromatography of biopolymers. Theoretical and practical implications for the separation of oligonucleotides. Journal of Chromatography A 1169: 139–150.
72. Gaus, H. J., S. R. Owens, M. Winniman, S. Cooper, and L. L. Cummins. 1997. On-line HPLC elec-trospray mass spectrometry of phosphorothioate oligonucleotide metabolites. Analytical Chemistry 69: 313–319.
73. Griffey, R. H., M. J. Greig, H. J. Gaus, et al. 1997. Characterization of oligonucleotide metabolism in vivo via liquid chromatography/electrospray tandem mass spectrometry with a quadrupole ion trap mass spectrometer. Journal of Mass Spectrometry 32: 305–313.
74. Bidlingmeyer, B., and Q. Wang. 2006. Additives for reversed-phase HPLC mobile phases. US Patent 7125492, filed July 17, 2003 and issued Jan. 2005.
75. McCarthy, S. M., W. J. Warren, A. Dubey, and M. Gilar. 2008. Ion-pairing systems for reversed-phase chromatography separation of oligonucleotides, paper presented at TIDES Conference in Las Vegas, Nevada.
76. Bartha, Á., and J. Ståhlberg. 1994. Electrostatic retention model of reversed-phase ion-pair chromatogra-phy. Journal of Chromatography A 668: 255–284.
77. Cruz, E., M. R. Euerby, C. M. Johnson, and C. A. Hackett. 1997. Chromatographic classification of com-mercially available reverse-phase HPLC columns. Chromatographia 44: 151–161.
78. Bidlingmeyer, B. A. 1980. Separation of ionic compounds by reversed-phase liquid chromatography: an update of ion-pairing techniques. J. Chromatogr. Sci. 18: 525–539.
79. Cantor, C. R., and P. R. Schimmel. 1980. The Conformation of Biological Macromolecules. Part 1. Their Biophysical Chemistry. San Francisco: W. H. Freeman.
80. Nawrocki, J. 1997. The silanol group and its role in liquid chromatography. Journal of Chromatography A 779: 29–71.
81. Daignault, L. G., and D. P. Rillema. 1992. Ion-interaction chromatography: a study of the distribution of n-alkylammonium ions on an ODS-2 column. Journal of Chromatography A 602: 3–8.
K11050_C001.indd 45 11/15/2010 6:29:06 PM

46 Handbook of Analysis of Oligonucleotides and Related Products
82. Zou, Y., P. Tiller, I. W. Chen, M. Beverly, and J. Hochman. 2008. Metabolite identification of small interfering RNA duplex by high-resolution accurate mass spectrometry. Rapid Communications in Mass Spectrometry 22: 1871–1881.
83. Beverly, M., K. Hartsough, and L. Machemer. 2005. Liquid chromatography/electrospray mass spec-trometric analysis of metabolites from an inhibitory RNA duplex. Rapid Communications in Mass Spectrometry 19: 1675–1682.
84. Lei, B., S. Li, L. Xi, J. Li, H. Liu, and X. Yao. 2009. Novel approaches for retention time prediction of oligonucleotides in ion-pair reversed-phase high-performance liquid chromatography. Journal of Chromatography A 1216: 4434–4439.
85. Gelhaus, S. L., W. R. LaCourse, N. A. Hagan, G. K. Amarasinghe, and D. Fabris. 2003. Rapid purifica-tion of RNA secondary structures. Nucleic Acids Research 31: e135.
86. Tan, L. C., P. W. Carr, and M. H. Abraham. 1996. Study of retention in reversed-phase liquid chromatog-raphy using linear solvation energy relationships I. The stationary phase. Journal of Chromatography A 752: 1–18.
87. Katritzky, A. R., S. Perumal, R. Petrukhin, and E. Kleinpeter. 2001. Codessa-based theoretical QSPR model for hydantoin HPLC-RT lipophilicities. Journal of Chemical Information Computer Sciences 41: 569–574.
88. Uhlmann, E., and A. Peyman. 1990. Antisense oligonucleotides: a new therapeutic principle. Chemical Reviews 90: 543–584.
89. Dias, N., and C. A. Stein. 2002. Antisense oligonucleotides: basic concepts and mechanisms. Molecular Cancer Therapeutics 1: 347–355.
90. Kreuzian, T. B. 2009. Analysis of duplexes. Paper presented at EuroTides Conference, Dec. 2–3, in Amsterdam, Netherlands.
K11050_C001.indd 46 11/15/2010 6:29:06 PM