12.3 land use - boprc
TRANSCRIPT

© Crown Copyright 2010 331 Contract Report No. 2075
12.3 Land use
Spatial Pattern
Catchment size: 36,930 ha.
Catchment location: North and east across the Whakamarama and Mamaku
plateaus from Hiwiroa to Tauranga Harbour.
Predominant land uses (account for 97% of catchment):
- Indigenous forest covers 20,909 ha (56.6%) of catchment, primarily on plateau
country in the upper and middle catchments and along the steeps sides of gullies
in the middle reaches of all catchments.
- Pasture grassland covers 9,905 ha (26.6% of catchment), primarily in the lower
and middle catchments on land of low to moderate relief.
- Exotic plantation forest covers 4,605 ha (12.4%) on plateau country in middle
catchments.
Urban landforms: 82 ha (0.2% of catchment)
Wetlands: 28.7 ha (0.07% of catchment), primarily herbaceous saline wetlands
along the Wairoa estuary margins.
Most modified: The lower parts of the Wairoa catchment have been heavily
modified by conversion of forests to pasture grassland, orcharding and urban land
uses.
Least modified: The upper catchment retains indigenous vegetation on flats and in
gullies of the dissected Whakamarama plateau, though this has been modified by
logging during the late 19th
and early 20th
centuries, and clearfelling of broadleaf
forest on the plateau and replacement with pine plantations during the late
20th
century.
Table 12.2: Land use within the Wairoa catchment.
LCDB2 Classification Area (ha) % of
Catchment
Broadleaved indigenous hardwoods 127.0
Indigenous forest 20,908.7
Manuka and/or kanuka 219.4
Indigenous Forest 21,255.1 57.6%
Coastal sand and gravel
Estuarine open water 0.5
Herbaceous freshwater vegetation
Herbaceous saline vegetation 28.2
Lake and pond 44.3
Mangrove
River 85.9
Wetland Systems 158.9 0.4%
Afforestation (imaged, post LCDB 1) 42.1

© Crown Copyright 2010 332 Contract Report No. 2075
LCDB2 Classification Area (ha) % of
Catchment
Afforestation (not imaged)
Forest harvested 160.1
Other exotic forest 311.9
Pine forest - closed canopy 3,845.2
Pine forest - open canopy 159.8
Exotic Plantation Forest 4,518.9 12.2%
Orchard and other perennial crops 699.8
Short-rotation cropland
Orchards and Crops 699.8 1.9%
High producing exotic grassland 9,838.0
Low producing grassland 67.1
Pastoral Lands 9,905.2 26.8%
Deciduous hardwoods 22.4
Major shelterbelts 55.2
Mixed exotic shrubland
Gorse and broom 231.4
Other Exotic Vegetation 309.0 0.8%
Built-up area 68.9
Transport infrastructure 1.9
Urban parkland/Open space 11.0
Urban Landforms 81.8 0.2%
Not Classified 0.3 ,0.1%
Grand Total 36,930.3 100.0%
Legal Protection
This section provides an overview of the areas protected by legal statute and
covenants, for the purpose of biodiversity protection.
Department of Conservation
The Department of Conservation administers ha within the Wairoa catchment for
conservation purposes.
Reserves to protect indigenous ecosystems, vegetation, habitats, or species
comprises 13,559.4 ha (99.1%).
Reserves that have other primary aims, which could conflict with protection of
natural values, comprises 121.9ha (0.9%).
Table 12.3: Department of Conservation administered lands within the Wairoa
catchment.
Reserve Type (DOC Legal Description) Area (ha)
Conservation Park - S.19 Conservation Act 1987 10,248.9
Fixed Marginal Strip - S.24(3) Conservation Act 1987 23.7
Local Purpose Reserve - S.23 Reserves Act 1977 96.8
Recreation Reserve - S.17 Reserves Act 1977 1.4
Scenic Reserve - S.19(1)(a) Reserves Act 1977 49.6
Stewardship Area - S.25 Conservation Act 1987 3,260.9
Grand Total 13,681.3

© Crown Copyright 2010 333 Contract Report No. 2075
The upper Wairoa catchment includes 1,902 ha of the Opuiaki Ecological Area,
168 ha of the Mangapapa Ecological Area, and 1,741 ha of the Waiteariki Ecological
Area.
Nga Whenua Rahui
There are no Nga Whenua Rahui kawenata within the Wairoa catchment.
QEII
There are seventeen QEII covenants totalling 110.6 ha within the Wairoa catchment.
Table 12.4: QEII covenants within the Wairoa catchment.
Covenant Area (ha)
5/03/020 7.0
5/03/021 28.0
5/03/021B 0.5
5/03/125 4.8
5/03/151 8.4
5/03/160 6.0
5/03/250B 0.0
5/03/288.1 8.2
5/03/288.2 1.3
5/03/288.3 0.9
5/03/322 0.0
5/03/332.1 2.0
5/03/332.2 1.2
5/03/332.3 0.6
5/03/332.4 0.9
5/03/375 33.5
5/03/379 7.4
Grand Total 110.6
(0.3%)
Western Bay of Plenty District Council Covenants
Within the Wairoa catchment there are 21 Western Bay of Plenty Covenants, with a
total area of 155.7 ha (1.2%).
Table 12.5: Western Bay of Plenty District Council Covenants within the Wairoa
catchment.
WBOP Covenants Area (ha)
Cov6309 3.89
Cov6395 12.09
Cov6910 1.73
Cov6985 23.49
Cov7068 13.15
Cov7351 25.87
Cov7433 4.16
Cov7532 2.55
Cov7675 22.79
Cov8584 17.19

© Crown Copyright 2010 334 Contract Report No. 2075
WBOP Covenants Area (ha)
Cov9276 80.44
Cov9622 5.56
Cov9729 6.69
CovFE313 746.51
Grand Total 966.1
(2.6%)
12.4 Indigenous vegetation and flora
Vegetation Pattern
Approximately two-thirds (65%) of the 20,909 ha of indigenous forest is dominated
by tawa, either in combination with rimu and/or beeches. Just under one-quarter
(23%) of forest is highland and steepland softwoods-hardwoods. Unlogged rimu-
tawa forest occurs within the Opuiaki Ecological Area, along with dense podocarp
stands on alluvial terraces.
Table 12.6: Indigenous forest types within Wairoa catchment.
Forest Type Area (ha)
Beeches 96.2
General hardwoods 704.2
Highland and steepland softwoods-hardwoods 4,897.7
Kauri-softwoods-hardwoods 59.7
Rimu-tawa 4,049.1
Rimu-tawa-beeches 258.4
Softwoods 171.6
Tawa 8,876.3
Tawa-beeches 349.3
Unclassified 1,446.2
Total 20,908.7
Species Lists
There are at least 10 lists of vascular plants within the catchment.
Rare or Threatened Species
The Department of Conservation Bioweb database includes the following records:
Brachyglottis kirkii var. kirkii (At Risk-Declining)
Hymenophyllum atrovirens (At Risk-Naturally Uncommon)
Olearia cheesemanii (At Risk-Naturally Uncommon)
Peraxilla tetrapetala (At Risk-Declining)
Pimelea tomentosa (Threatened, Nationally Vulnerable)
Pittosporum kirkii (At Risk-Declining)
Syzygium maire

© Crown Copyright 2010 335 Contract Report No. 2075
12.5 Pest plants
Plant Pest RPMS Status Wairoa
Wild kiwifruit Total control present
Banana passionfruit Progressive control present
Boneseed Progressive control present
Bushy asparagus Progressive control present
Cathedral bells Progressive control present
Heather Progressive control present
Lantana Progressive control present
Old man's beard Progressive control present
Wild ginger Progressive control present
Woolly nightshade Progressive control present
Yellow flag iris Progressive control present
The EBOP RPMS provides lists of species in the following categories: ‗Eradication‘,
‗Total and Progressive Control‘, ‗Boundary Control‘, and ‗Regional Surveillance‘.
Explanations for each category are given below:
Eradication pest plants (10 species) - pests of low incidence but with a high threat
of spread or seriousness of adverse effects. The objective of this category is to
eradicate all known populations by 2020 and immediate eradication of any new
occurrences.
Total control pest plants (1 species) - pests of low incidence but with high threat
of spread or seriousness of adverse effects. The objective is the protection of
indigenous biodiversity and production values by controlling currently known
populations and immediate destruction of new occurrences.
Progressive control pest plants (15 species) - Pest of high incidence in parts of the
region, and with high threat of spread or seriousness of adverse effect. The
objective is to reduce density and/or distribution with priority given to controlling
isolated or satellite populations.
Boundary control pest plants (3 species) - Pests of high incidence over the region,
and with serious effects. The objective is protection of production values by
controlling effects.
Surveillance pest plants (23 species) - Plants of known threat of adverse effects,
which may be established in parts of the region, but about which there is
uncertainty of distribution, and/or threat of spread and/or feasibility of control.
There are two objectives for these pests. The first is to increase understanding of
the distributions, impacts and control options, the second is to have them
voluntarily controlled by land occupiers with assistance from EBOP programmes
(EBOP 2003).
EBOP also maintains a database of 123 pest plant species that are of interest or under
active management in the Tauranga Harbour catchment. For more information refer
to Environment Bay of Plenty‘s Regional Pest Management Strategy, or to their
excellent pest plant resources on the internet at http://www.envbop.govt.nz/
Environment/Pest-Plants-and-Weeds. aspx

© Crown Copyright 2010 336 Contract Report No. 2075
The Department of Conservation also maintains a pest plant database and this
includes the following records for the Wairoa catchment:
Agapanthus praecox
Berberis glaucocarpa
Buddleja davidii
Celastrus orbiculatus
Cortaderia selloana
Crocosmia x crocosmiiflora
Cupressus lusitanica
Cytisus scoparius
Eucalyptus spp.
Gladiolus carneus
Hedychium gardnerianum
Hydrangea macrophylla
Jasminum polyanthum
Leycesteria formosa
Pinus spp.
Pueraria montana
Rosa spp.
Rubus fruticosus agg.
Selaginella kraussiana
Senecio mikanioides
Spartina alterniflora
Tradescantia fluminensis
Ulex europaeus
Vitis vinifera
12.6 Pest animals
Species Affecting Vegetation Affecting
Indigenous Fauna Control Underway
Possum
Goat
Red deer
Fallow deer
Feral pig
Ship rat
Norway rat
Mustelids
Cats
Mice
Hedgehog
Wasps
Pest fish
State of the Vegetation
There is a network of foliar browse index lines in the catchment.
Foliar Browse Index vegetation monitoring (Willems 2001; Woods 2008) suggests
that the overall condition of vegetation not subject to pest control is moderate.
Kamahi was found to be in generally poor condition in both surveys, and browse
values on the less-preferred mahoe had increased between 2001 and 2008. There is
evidence of sustained impacts on possum-preferred species, and vegetation condition
is probably in slow decline.
Understorey condition on the northern Mamaku plateau, including Opuiaki, is among
the best in the North Island. The cobalt deficient soils appear to be incapable of
supporting large populations of ungulates.

© Crown Copyright 2010 337 Contract Report No. 2075
12.7 Indigenous fauna
Avifauna
A suite a common indigenous forest species is present, including kereru, robin, and
tomtit. Opuiaki Ecological Area includes a notable suite of threatened species,
including kokako, kākā, falcon, kākāriki, long-tailed cuckoo, rifleman, and kiwi.
Karearea breed within Opuiaki Ecological Area.
Bats
Long-tailed bat and short-tailed bat are present at Opuiaki.
Lizards
Copper skink have been recorded in the catchment. Whitaker (2000) has described
the results of a survey at Opuiaki.
Other Notable Species
Kākā are likely to be breeding in Opuiaki. Individual blue duck are occasionally
sighted in the Opuiaki River, but an effective breeding population is unlikely to
remain.
Bittern in wetlands in lower Wairoa River.
State of Terrestrial Indigenous Fauna
Pest animal control within the Opuiaki Ecological Area has facilitated an increase in
the kokako population.
Beyond management areas, the states of bird and invertebrate populations are
probably comparable with those of other mainland forests not subject to pest control.
Fish Species
Thirteen (13) indigenous freshwater fish species are known to occur within the
Wairoa catchment (compared to 20 different species for the wider Kaimai
catchment)
Three (3) indigenous species are considered to be in Gradual Decline.
Four (4) introduced fish species have been recorded within Wairoa catchment
(compared with nine introduced species for the wider Kaimai catchment). Rudd is
a Noxious species (under Freshwater Fisheries Regulations, 1983).

© Crown Copyright 2010 338 Contract Report No. 2075
There are various barriers to fish passage into the upper catchment, including a
hydro dam in the lower catchment, and large waterfalls on major tributaries
(Ngatuhoa Falls on the Ngatuhoa Stream; Te Rereioturu Falls on the Opuiaki
River).
Table 12.7: Fish species recorded within the Wairoa catchment.
Scientific Name Common Name Threat Status
Indigenous
Aldrichetta forsteri Yelloweye mullet Not threatened
Anguilla australis Shortfin eel Not threatened
Anguilla dieffenbachii Longfin eel Gradual decline
Galaxias argenteus Giant kokopu Gradual decline
Galaxias fasciatus Banded kokopu Not threatened
Galaxias maculatus Inanga Not threatened
Galaxias postvectis Shortjaw kokopu Sparse
Gobiomorphus cotidianus Common bully Not threatened
Gobiomorphus gobioides Giant bully Not threatened
Gobiomorphus huttoni Redfin bully Not threatened
Grahamina Estuarine triplefin Not threatened
Mugil cephalus Grey mullet Not threatened
Paranephrops planifrons Koura (Invertebrate) Gradual decline
Retropinna retropinna Common smelt Not threatened
Exotic
Oncorhynchus mykiss Rainbow trout Introduced
Salmo trutta Brown trout Introduced
Scardinius erythrophthalmus Rudd Introduced
Tinca tinca Tench Introduced
Notable Aquatic Habitats
Estuarine marshland and other good quality habitat are present in the lower reaches of
the Wairoa River.
12.8 Recreational use
The Wairoa River is heavily utilised for flat-water rowing and kayaking in the lower
reaches.
Lake McLaren is used for walking, kayaking, and picnicking. Rudd and tench are
present in the lake.
Ngatuhoa Youth Lodge is heavily used by school and youth groups, and other interest
groups.
There is a network of walking tracks centred on Ngatuhoa Lodge.

© Crown Copyright 2010 339 Contract Report No. 2075
12.9 Current management
Department of Conservation
Monitoring
- Seven foliar browse index lines in the catchment, and three more on the
catchment boundary (with Upper Waihou).
- Kokako monitoring.
- Rare plants.
- Weeds.
- Pest animals: possums, rats, goats, stoats.
Pest plant control
- Various control operations.
Pest animal control
- Goat control as required.
- Possum control in Opuiaki core area, 1,130 ha, 2003, 2004, 2005, 2006, 2007,
2008.
- Possum control in Opuiaki canopy area, 4,470 ha, 2006.
Recreation
- Extensive network of tracks in the vicinity of Ngatuhoa Lodge.
Regional Council
- Natural heritage
Environment Bay of Plenty provides technical advice, expertise, logistic and
financial support to conservation on private land through its Environmental
Programmes. Fencing is one component of EBOP‘s Environmental Programmes,
43.650 m of fencing has been erected, and is monitored by EBOP, within the
Wairoa catchment under Environmental Programmes. Riparian planting,
conservation planting, biodiversity protection and support for land use change are
other components of tools available to assist landowners to protect and enhance
environmental areas and values in the catchment.
District Council
Tauranga City Council (TCC) is undertaking a considerable amount of restoration
planting in the lower Kopurererua catchment. TCC also has a comprehensive
network of monitoring sites in the natural areas.
The Western Bay of Plenty District Plan contains a schedule of Significant Natural
Areas and provisions relating to protection of indigenous vegetation, including the use
of Protection Lots and Transferrable Development Rights (TDR) to protect
indigenous vegetation when subdivisions are undertaken.

© Crown Copyright 2010 340 Contract Report No. 2075
Community Projects
Ngamuwahine
Kaimai Landcare
Ngatuhoa Lodge
Positive Aspects of Management
Opuiaki Ecological Area Management Area. Intensive possum, rodent, stoat
control over 1,130 hectares within the Opuiaki Core Area (2003-2008) to recover
kokako population and provide general forest protection
Survey and ‗hotspot‘ hunting is undertaken in parts of the catchment to keep the
Opuiaki Ecological Area goat-free.
Large areas of indigenous forest in upper catchment in Kaimai Forest Park. Large
contiguous block of unlogged forest in upper catchment largely unmodified by
ungulates. Very low deer, goat, and pig numbers.
Lowland forest remnants in headwaters of Ohourere Stream, and middle reaches
of Ngamuwahine river and Opuiaki River.
Aspects that Need to be Addressed
Erosion and sedimentation associated with waterways.
Impacts of pest plants in vegetation remnants in lower catchment.
Threats posed by pest animals in areas not subject to active management over
most indigenous vegetation within the catchment.
Large scale recent exotic plantation forestry-to-dairy conversions in the upper
catchment around Omanawa. Impacts on water quality and loss of wildlife
corridors.

© Crown Copyright 2010 341 Contract Report No. 2075
13. OMANAWA
13.1 Waterways
Description
Waterways in the Omanawa catchment occur roughly equally in low gradient,
medium gradient, and high gradient systems. Low gradient streams occur in the
lower catchment and stream gradient increases towards catchment headwaters.
The predominant soil type in the Omanawa catchment is volcanic soils. Some
alluvial soils are present in lower catchments.
Just under half the land cover adjoining streams is pastoral grassland (45%), and
slightly more than one third is indigenous vegetation (41%).
Almost half the length of low gradient streams (47%) and high gradient streams
(45%) flows through pasture.
Table 13.1: Summary of stream length, soil types, and land cover within the
Omanawa catchment.
Geology
Landcover
Valley Landform
Length in km
Low Gradient
(km)
Medium Gradient
(km)
High Gradient
(km)
Alluvium Urban 2.9 (3%) 2.9 (1%)
Miscellaneous Urban 1.7 (2%) 1.7 (0.6%)
Volcanic acidic
Exotic forest 6.7 (8%) 16.0 (21%) 11.8 (13%) 34.5 (14%)
Indigenous forest
23.0 (27%) 28.5 (38%) 38.8 (41%) 90.2 (35%)
Pastoral 40.0 (47%) 30.2 (40%) 43.6 (46%) 113.7 (45%)
Urban 10.6 (12%) 10.6 (4%)
Total 84.9 (34%) 74.7 (29%) 94.1 (37%) 253.7
Rivers and Streams Within the Catchment
The main streams are the Omanawa (which flows into the Wairoa River) and the
Kopurererua (which flows directly into Tauranga Harbour, via Tauriko).
Omanawa
- Upokokotio
- Hukunui
Kopurererua
- Tautau

© Crown Copyright 2010 342 Contract Report No. 2075
Water Quality
Kopurererua and the Omanawa rivers at SH29 have consistently lower clarity than
other rivers within the Tauranga Harbour catchment, being consistently lower than
2 m, possibly due to local geology and erosion products (Taylor and Park 2001).
Cold water springs may explain the (relatively) high total nitrogen levels in the
Kopurererua Stream and Omanawa Rivers.
Nitrate Nitrogen in the Kopurererua (at SH29) and the Omanawa (at SH29) are
consistently higher than in other Tauranga Harbour catchments, and the latter in
particular is trending upward (Taylor and Parks 2001).
Overall water quality in the Omanawa River has trended downward during the
1990s (Taylor and Parks 2001).
13.2 Land use capability
Steep gullies associated with watercourses have little versatility, being Land Classes 7
and 8. Alluvial flats and terraces in lower catchments are arable, highly versatile
being Land Classes 3 through 4. Terraces in upper catchments are non-arable but still
versatile, predominantly Land Class 6. All land classes have erosion as the primary
limitation on use.
LUC Class Area (ha) % of Catchment
1 0.0 0.0
2 419.0 2.4
3 4,045.6 23.3
4 2,415.0 13.9
5 0.0 0.0
6 4,506.7 26.0
7 942.5 5.4
8 3,756.2 21.7
Town 1,202.4 6.9
TOTAL 17,330.0 100.0

© Crown Copyright 2010 343 Contract Report No. 2075
Omanawa LUC and Land Cover
0
500
1000
1500
2000
2500
3000
3500
4000
4500
5000
1 2 3 4 5 6 7 8
LUC Class
Are
a (
ha)
Other
Pasture & Crop
Exotic Forest & Scrub
Indigenous Forest & Scrub
`
LUC Classes Omanawa Sub-Catchment
Class 3
23.3%
Class 4 13.9%
Class 5
Class 6 26.0%
Class 7 5.4%
Class 8 21.7%
Other 6.9%
Class 2 2.4%

© Crown Copyright 2010 344 Contract Report No. 2075
Figure 13.1: Omanawa catchment - land cover and land use.

© Crown Copyright 2010 345 Contract Report No. 2075
13.3 Land use
Spatial Pattern
Catchment size: 17,330 ha.
Catchment location: north from a line between Ngawaro Road and Otanewainuku,
to the Tauranga harbour.
Predominant land uses: accounts for 92% of catchment:
- pasture grassland 5,263 ha (30.4% of catchment), lower, middle and upper
catchments, mostly on land of low to moderate relief.
- indigenous forest 6,531 ha (37.7% of catchment), upper catchments on land of
low to moderate relief, and along the steeps sides of gullies along main
inflowing streams.
- Exotic plantation forest 2,776 ha (16%), primarily on elevated plateau.
- orchards and crops 855 ha (7% of catchment), warmer lower flat terrain near
sea level.
Urban landforms: 1,587 ha (4.9% of catchment), in Tauranga City.
Wetlands: 50.2 ha (0.3% of catchment), primarily saline wetlands along the
Omanawa and Kopurererua estuary margins.
Most modified: The lower parts of the Omanawa catchment have been heavily
modified by conversion to pastoral orcharding and urban land uses.
Least modified: The upper catchment retains indigenous vegetation on flats and in
gullies of the dissected northern Mamaku plateau, though this has been modified
by logging during the late 19th
and early 20th
centuries.
Table 13.2. Land Use within the Omanawa catchment.
LCDB2 Classification Area (ha) % of
Catchment
Broadleaved indigenous hardwoods 117.2
Indigenous forest 6,531.8
Manuka and/or kanuka 140.7
Indigenous Forest 6,789.7 39.2%
Coastal sand and gravel
Estuarine open water 3.5
Herbaceous freshwater vegetation 2.0
Herbaceous saline vegetation 44.8
Mangrove 0.1
Wetland Systems 50.5 0.3%
Afforestation (imaged, post LCDB 1) 31.0
Afforestation (not imaged) 10.4
Forest harvested 166.1
Other exotic forest 88.1
Pine forest - closed canopy 2,312.1
Pine forest - open canopy 82.4
Exotic Plantation Forest 2,690.2 15.5%

© Crown Copyright 2010 346 Contract Report No. 2075
LCDB2 Classification Area (ha) % of
Catchment
Orchard and other perennial crops 836.5
Short-rotation cropland 18.2
Orchards and Crops 854.7 4.9%
High producing exotic grassland 5,196.8
Low producing grassland 66.6
Pastoral Lands 5,263.3 30.4%
Deciduous hardwoods 14.9
Major shelterbelts 17.0
Mixed exotic shrubland
Gorse and broom 45.6
Other Exotic Vegetation 77.5 0.4%
Surface mine 9.5
Surface Mine 9.5 0.1%
Built-up area 1,276.6
Transport infrastructure 52.3
Urban parkland/Open space 258.7
Urban Landforms 1,587.6 9.2%
Not classified 6.9 <0.1%
Grand Total 17,330.0 100.0%
Legal Protection
This section provides an overview of the areas protected by legal statute and
covenants, for the purpose of biodiversity protection.
Department of Conservation
The Department of Conservation administers 3,415 ha within the Omanawa
catchment for conservation purposes.
Reserves to protect indigenous ecosystems, vegetation, habitats, or species
comprises 5,029 ha (99.7%).
Other reserves comprise 15 ha (0.3%).
Table 13.3: Department of Conservation-administered lands within the Omanawa
catchment.
Reserve Type (DOC Legal Description) Area (ha)
Fixed Marginal Strip - S.24(3) Conservation Act 1987 23.9
Local Purpose Reserve - S.23 Reserves Act 1977 29.6
Recreation Reserve - S.17 Reserves Act 1977 164.3
Scenic Reserve - S.19(1)(a) Reserves Act 1977 570.9
Stewardship Area - S.25 Conservation Act 1987 2,626.2
Grand Total 3,414.9
Nga Whenua Rahui
There are no Nga Whenua Rahui kawenata within the Omanawa catchment.

© Crown Copyright 2010 347 Contract Report No. 2075
QEII
There are 16 QEII covenants comprising 92 ha.
Table 13.4: QEII covenants within the Omanawa catchment.
Covenant Area (ha)
5/03/182 4.9
5/03/234 35.2
5/03/250A 8.3
5/03/250B 3.1
5/03/260 15.3
5/03/322 3.1
5/03/350.1 1.3
5/03/350.2 2.7
5/03/350.3 1.1
5/03/350.4 1.6
5/03/362 5.5
5/03/433 1.6
5/03/504 0.5
5/03/596 2.6
5/03/630 2.0
5/03/631 3.5
Grand Total 92.2
(0.5%)
Western Bay of Plenty District Council Covenants
There are 21 Western Bay of Plenty Covenants, with a total area of 155.7 ha (1.2%)
within the Omanawa catchment
Table 13.5: Western Bay of Plenty District Council Covenants within the Omanawa
catchment.
WBOP covenants Area (ha)
Cov6357 1.2
Cov6660 2.4
Cov6848 6.6
Cov7049 1.8
Cov7187 2.0
Cov7536 15.7
Cov7737 10.0
Cov7786 13.3
Cov7870 14.6
Cov7941 11.3
Cov7961 23.5
Cov8343 28.2
Cov8359 41.7
Cov8375 21.2
Cov8894 15.0
Cov8909 3.9
Cov9008 41.8
Cov9542 2.7
Cov9926 2.1
N.T. 1.6
Total 260.5
(1.5%)

© Crown Copyright 2010 348 Contract Report No. 2075
13.4 Indigenous vegetation and flora
Vegetation Pattern
More than a third of the 6,531.8 ha of indigenous forest is tawa forest (2,437 ha),
another 20% (1,363 ha) is rimu-tawa forest, both of which occur in the large gullies
associated with middle and lower reaches of Omanawa and Kopurererua rivers.
Table 13.6: Indigenous forest types within the Omanawa catchment. Forest Type Area (ha)
Beeches 147.3
General hardwoods 567.7
Highland and steepland softwoods-hardwoods 719.0
Rimu-tawa 1,363.3
Rimu-tawa-beeches 215.3
Tawa 2,437.5
Tawa-beeches 58.8
Unclassified 1,022.9
Total 6,531.8
Species Lists
There are at least nine lists of vascular plants within the catchment.
Rare or Threatened Species
The Department of Conservation Bioweb database contains the following records:
Dactylanthus taylorii (Threatened-Nationally Vulnerable)
Tupeia antarctica (At Risk-Declining)
13.5 Pest plants
Plant Pest RPMS Status Omanawa
Wild kiwifruit Total control present
Banana passionfruit Progressive control present
Bushy asparagus Progressive control present
Cathedral bells Progressive control present
Heather Progressive control present
Lantana Progressive control present
Old man's beard Progressive control present
Wild ginger Progressive control present
Woolly nightshade Progressive control present
Yellow flag iris Progressive control present
The EBOP RPMS provides lists of species in the following categories: ‗Eradication‘,
‗Total and Progressive Control‘, ‗Boundary Control‘, and ‗Regional Surveillance‘.
Explanations for each category are given below:

© Crown Copyright 2010 349 Contract Report No. 2075
Eradication pest plants (10 species) - pests of low incidence but with a high threat
of spread or seriousness of adverse effects. The objective of this category is to
eradicate all known populations by 2020 and immediate eradication of any new
occurrences.
Total control pest plants (1 species) - pests of low incidence but with high threat
of spread or seriousness of adverse effects. The objective is the protection of
indigenous biodiversity and production values by controlling currently known
populations and immediate destruction of new occurrences.
Progressive control pest plants (15 species) - Pest of high incidence in parts of the
region, and with high threat of spread or seriousness of adverse effect. The
objective is to reduce density and/or distribution with priority given to controlling
isolated or satellite populations.
Boundary control pest plants (3 species) - Pests of high incidence over the region,
and with serious effects. The objective is protection of production values by
controlling effects.
Surveillance pest plants (23 species) - Plants of known threat of adverse effects,
which may be established in parts of the region, but about which there is
uncertainty of distribution, and/or threat of spread and/or feasibility of control.
There are two objectives for these pests. The first is to increase understanding of
the distributions, impacts and control options, the second is to have them
voluntarily controlled by land occupiers with assistance from EBOP programmes
(EBOP 2003).
EBOP also maintains a database of 123 pest plant species that are of interest or under
active management in the Tauranga Harbour catchment. For more information refer
to Environment Bay of Plenty‘s Regional Pest Management Strategy, or to their
excellent pest plant resources on the internet at http://www.envbop.govt.nz/
Environment/Pest-Plants-and-Weeds. aspx
The Department of Conservation also maintains a pest plant database and this
includes the following records for the Omanawa catchment:
Actinidia deliciosa
Asparagus aethiopicus
Berberis glaucocarpa
Bougainvillea glabra
Calluna vulgaris
Clematis vitalba
Cobaea scandens
Crocosmia x crocosmiiflora
Dahlia excelsa
Erythrina ×sykesii
Hedera helix
Hedychium gardnerianum
Humulus lupulus
Jasminum polyanthum
Leycesteria formosa
Ligustrum sinense
Lonicera japonica
Paraserianthes lophantha
Passiflora tripartita
Paulownia tomentosa
Pinus radiata
Prunus serrulata
Robinia pseudacacia
Rubus fruticosus agg.
Salix cinerea
Ulex europaeus
Vinca major
Watsonia bulbillifera

© Crown Copyright 2010 350 Contract Report No. 2075
13.6 Pest animals
Species Affecting Vegetation Affecting
Indigenous Fauna Control Underway
Possum
Goat
Red deer
Fallow deer *
Feral pig
Ship rat
Norway rat
Mustelids
Cats
Mice
Hedgehog
Wasps
Pest fish
* Long-standing recreational hunting.
State of the Vegetation
There is no vegetation monitoring undertaken within the catchment, but there is an
extensive network of FBI lines in the adjacent Otanewainuku and Otawa Blocks, in
similar vegetation types.
Foliar Browse Index vegetation monitoring (Willems 2001, Woods 2008) indicates
that the overall condition of vegetation is moderate. However, there is evidence of
sustained impacts on possum-preferred species, and vegetation condition is probably
in slow decline.
13.7 Indigenous fauna
A suite of typical forest birds is present, including kereru, whitehead, and tomtit.
Falcon and kākā are likely to be itinerant visitors, and long-tailed cuckoo, robin, and
kākāriki are known from the area.
Lizards
There is a record of striped skink (Oligosoma striatum).
Other Notable Species
Long-tailed bat is likely to be present.
State of Terrestrial Indigenous Fauna
No information on the state of terrestrial indigenous fauna is available for most of the
Omanawa catchment. Bird, lizard, bat, and invertebrate populations are probably
comparable with those of other mainland forests not subject to intensive predator pest
control.

© Crown Copyright 2010 351 Contract Report No. 2075
Fish Species
Thirteen (13) indigenous species are known to occur within the Omanawa
catchment (compared to 20 different species for the wider Kaimai catchment)
Three (3) indigenous species are considered to be in Gradual Decline.
No introduced fish species have been recorded within Omanawa catchment
(compared with nine introduced species for the wider Kaimai catchment).
Gambusia (Mosquito fish) is present, and is classed as an Unwanted Organism.
Table 13.7: Fish species recorded within the Omanawa catchment.
Scientific Name Common Name Threat Status
Indigenous
Anguilla dieffenbachii Longfin eel Gradual decline
Paranephrops planifrons Koura (Invertebrate) Gradual decline
Galaxias argenteus Giant kokopu Gradual decline
Gobiomorphus huttoni Redfin bully Not threatened
Retropinna retropinna Common smelt Not threatened
Mugil cephalus Grey mullet Not threatened
Galaxias fasciatus Banded kokopu Not threatened
Anguilla australis Shortfin eel Not threatened
Galaxias maculatus Inanga Not threatened
Gobiomorphus cotidianus Common bully Not threatened
Gobiomorphus gobioides Giant bully Not threatened
Aldrichetta forsteri Yelloweye mullet Not threatened
Rhombosolea retiaria Black flounder Not threatened
Exotic
Oncorhynchus mykiss Rainbow trout Introduced
Salmo trutta Brown trout Introduced
Gambusia affinis Gambusia Introduced
Notable Aquatic Habitats
Wetlands in the lower Kopurererua catchment (which are subject to restoration
effort). Saltmarsh communities on the margins of Tauranga Harbour.
13.8 Recreational use
Recreational hunting.
13.9 Current management
Department of Conservation
Monitoring
- None. FBI lines in adjacent forest blocks.
Pest plant control
- None.

© Crown Copyright 2010 352 Contract Report No. 2075
Pest animal control
- None.
Recreation
- Management of recreational hunting on Department of Conservation-
administered land.
Regional Council
- Natural heritage
Environment Bay of Plenty provides technical advice, expertise, logistic and
financial support to conservation on private land through its Environmental
Programmes. Fencing is one component of EBOP‘s Environmental Programmes,
40,185 m of fencing has been erected, and is monitored by EBOP, within the
Omanawa catchment under Environmental Programmes. Riparian planting,
conservation planting, biodiversity protection and support for land use change are
also available to assist landowners to protect and enhance environmental features
and values in the catchment.
District Council(s)
Tauranga City Council (TCC) is undertaking a considerable amount of restoration
planting in the lower Kopurererua catchment. TCC also has a comprehensive
network of monitoring sites in the natural areas.
The Western Bay of Plenty District Plan contains a schedule of Significant Natural
Areas and provisions relating to protection of indigenous vegetation, including the use
of Protection Lots and Transferrable Development Rights (TDR) to protect
indigenous vegetation when subdivisions are undertaken.
Community Projects
One care group operates in Matahora Gully in the suburb of Brookfield in
Tauranga City.
One care group operates on the edge of the Kopurererua catchment, at Castlewold
Drive in Cambridge Heights.
Positive Aspects of Management
Lowland forest remnants in large gullies associated with Kopurererua and
Omanawa Rivers.
High level of enthusiasm for conservation management within community living
in lower catchments, as shown by active Care groups.
Close proximity to large urban area.
Large areas of indigenous forest in upper catchment are contiguous with the
Kaimai Mamaku Forest Park, and Otanewainuku Forest.

© Crown Copyright 2010 353 Contract Report No. 2075
Aspects that Need to be Addressed
Erosion and sedimentation associated with waterways.
Impacts of pest plants in vegetation remnants in lower catchments.
Threats posed by pest animals in areas not subject to active management.
Water quality in Kopurererua and Omanawa Rivers.
Recent forestry-to-dairy conversions in upper catchment around Ngawaro, leading
to impacts on water quality and fragmentation of wildlife corridors.

© Crown Copyright 2010 354 Contract Report No. 2075
14. WAIMAPU
14.1 Waterways
Description
Waterways in the Waimapu catchment are slightly biased toward high gradient
landforms. Low gradient streams occur in the lower catchment, stream gradient
increases progressively toward catchment headwaters.
The predominant soil type surrounding steams in Waimapu catchment is volcanic
acidic soils. Some alluvial soils occur in lower catchments.
Just under half the land cover adjoining streams is pastoral grassland (45%),
slightly more than one third is indigenous vegetation (41%).
Almost half the length of low gradient streams (47%) and high gradient streams
(45%) flows through pasture.
Table 14.1: Summary of stream length and adjacent soil types and land cover
within Waimapu catchment.
Geology
Landcover
Valley Landform
Length in Kilometres
Low Gradient
(km)
Medium Gradient (km)
High Gradient
(km)
Volcanic acidic
Exotic forest 3.0 (4.2%) 0.2 (0.3%) 3.2 (1.5%)
Indigenous forest
13.5 (19.3%) 16.2 (30.9%) 16.8 (19.0%) 46.5 (22.1%)
Pastoral 44.2 (63.2%) 35.6 (67.6%) 71.2 (80.7%) 150.8 (71.6%)
Urban 9.3 (13.3%) 0.7 (1.4%) 10.0 (4.8%)
Grand Total 70.0 (4.9%) 52.2 (6.4%) 88.3 (5.6%) 210.6
Rivers and Streams Within the Catchment
Waimapu and Kaitemako are the main streams, and the Waimapu has the following
tributaries:
Waiorohi
Pukekonui
Toropeke
Mangarewarewa
Kirikiri
Water Quality
Total nitrogen, measured for the Waimapu until 1995, showed levels equivalent to
the relatively high values found in the Kopurererua and Omanawa Rivers. Total
nitrogen levels in both Kopurererua and Omanawa rivers have trended upward
since 1995 (Taylor and Park 2001).

© Crown Copyright 2010 355 Contract Report No. 2075
Between 1990 and 1995 the Waimapu had consistently high levels of E. coli and
Enterococci, among the highest within the Tauranga Harbour catchment (Taylor
and Park 2001).
Overall water quality in the Waimapu River has trended slightly downward during
the 1990s and was rated moderate-good in 1997 (Taylor and Parks 2001).
14.2 Land use capability
Alluvial flats and terraces in lower and middle Waiorohi are all arable lands, in
Classes 3 or 4. Steep gullies associated with the Waiorohi watercourse have little
versatility, being Land Classes 7 and 8. Terraces and rolling hill country within the
Waimapu catchment are less arable than those of the Waiorohi with middle and upper
catchments dominated by LUC 6, with areas of arable land associated with broad flat
ridges distributed throughout the catchment. All land classes have erosion as the
primary limitation on use, with the exception of a small area above the estuary of the
Waimapu that has a wetness limitation.
LUC Class Area (ha) % of Catchment
1 0.0 0.0
2 321.6 2.5
3 1,420.2 10.9
4 2,264.7 17.4
5 0.0 0.0
6 6,532.6 50.1
7 1,288.9 9.9
8 173.5 1.3
Town 889.1 6.8
N/C 138.7 1.1
TOTAL 13,029.4 100.0

© Crown Copyright 2010 356 Contract Report No. 2075
Waimapu LUC and Land Cover
0
1000
2000
3000
4000
5000
6000
7000
1 2 3 4 5 6 7 8
LUC Class
Are
a (
ha)
Other
Pasture & Crop
Exotic Forest & Scrub
Indigenous Forest & Scrub
`
LUC Classes Waimapu Sub-Catchment
Class 3 10.9%
Class 4 17.4%
Class 6 50.1%
Class 7 9.9%
Class 8 1.3%
Other 7.9%
Class 2 2.5%

© Crown Copyright 2010 357 Contract Report No. 2075
Figure 14.1: Waimapu catchment - land cover and land use.

© Crown Copyright 2010 358 Contract Report No. 2075
14.3 Land use
Spatial Pattern
Catchment size: 13,029 ha.
Catchment location: North from a line between Ngawaro Road and
Otanewainuku, to the Tauranga harbour.
Predominant land uses (account for 88% of catchment):
- pasture grassland 6,021 ha (46.2% of catchment), lower, middle and upper
catchments, mostly on land of low to moderate relief
- indigenous forest 3,574 ha (27.4% of catchment).
- exotic plantation Forest 980 ha (7.5%), primarily on elevated plateau.
- orchards and crops 655 ha (5% of catchment), warmer lower flat terrain near sea
level.
Urban land use: 1,292 ha (9.9% of catchment, Tauranga City).
Wetlands: 60.0 ha (0.5% of catchment), primarily herbaceous saline wetlands
along the Waimapu and Waitao estuary margins.
Most modified: The lower parts of the Waimapu catchment have been heavily
modified by conversion to pastoral orcharding and urban land uses.
Least modified: The upper catchment retains indigenous vegetation on flats and in
gullies of the dissected Whakamarama plateau, though this has been modified by
logging during the late 19th
and early 20th
centuries.
Table 14.2: Land use within the Waimapu catchment.
LCDB2 Classification Area (ha) % of
Catchment
Broadleaved indigenous hardwoods 201.0
Indigenous forest 3,574.2
Manuka and/or kanuka 221.8
Indigenous Forest 3,996.9 30.7%
Coastal sand and gravel
Estuarine open water 13.2
Herbaceous freshwater vegetation
Herbaceous saline vegetation 45.1
Lake and pond 1.1
Mangrove 1.7
Wetland Systems 61.1 0.5%
Afforestation (imaged, post LCDB 1) 19.3
Afforestation (not imaged)
Forest harvested 10.6
Other exotic forest 89.7
Pine forest - closed canopy 499.1
Pine forest - open canopy 180.0
Exotic Plantation Forest 798.7 6.1%

© Crown Copyright 2010 359 Contract Report No. 2075
LCDB2 Classification Area (ha) % of
Catchment
Orchard and other perennial crops 653.2
Short-rotation cropland 2.1
Vineyard 17.7
Orchards and Crops 673.0 5.1%
High producing exotic grassland 6,000.0
Low producing grassland 20.5
Pastoral Lands 6,020.5 46.2%
Deciduous hardwoods 23.2
Major shelterbelts 13.4
Mixed exotic shrubland
Gorse and broom 123.4
Other Exotic Vegetation 160.0 1.2%
Surface mine 15.8
Surface Mine 15.8 0.1%
Built-up area 1,165.3
Transport infrastructure 5.8
Urban parkland/Open space 121.3
Urban Landforms 1,292.5 9.9%
Not Classified 11.0 0.1%
Grand Total 13,029.4 100.0%
Legal Protection
This section provides an overview of the areas protected by legal statute and
covenants, for the purpose of biodiversity protection.
Department of Conservation
The Department of Conservation administers 403 ha within the Waimapu
catchment for conservation purposes.
Reserves to protect indigenous ecosystems, vegetation, habitats, or species
comprises 194.9 ha (48.4%).
Reserves with other primary aims comprise 208 ha (41.6.3%).
Table 14.3: Department of Conservation-administered lands within the Waimapu
catchment.
Reserve Type (DOC Legal Description) Area (ha)
Fixed Marginal Strip - S.24(3) Conservation Act 1987 6.3
Government Purpose Reserve - S.22 Reserves Act 1977 0.2
Historic Reserve - S.18 Reserves Act 1977 2.6
Local Purpose Reserve - S.23 Reserves Act 1977 149.3
Recreation Reserve - S.17 Reserves Act 1977 56.1
Stewardship Area - S.25 Conservation Act 1987 188.6
Grand Total 403.0
Nga Whenua Rahui
There is part of one Nga Whenua Rahui kawenata within the Waimapu catchment,
49.4 ha of the Otanewainuku block crosses into the upper Kaitemako stream.
© Crown Copyright 2010 360 Contract Report No. 2075
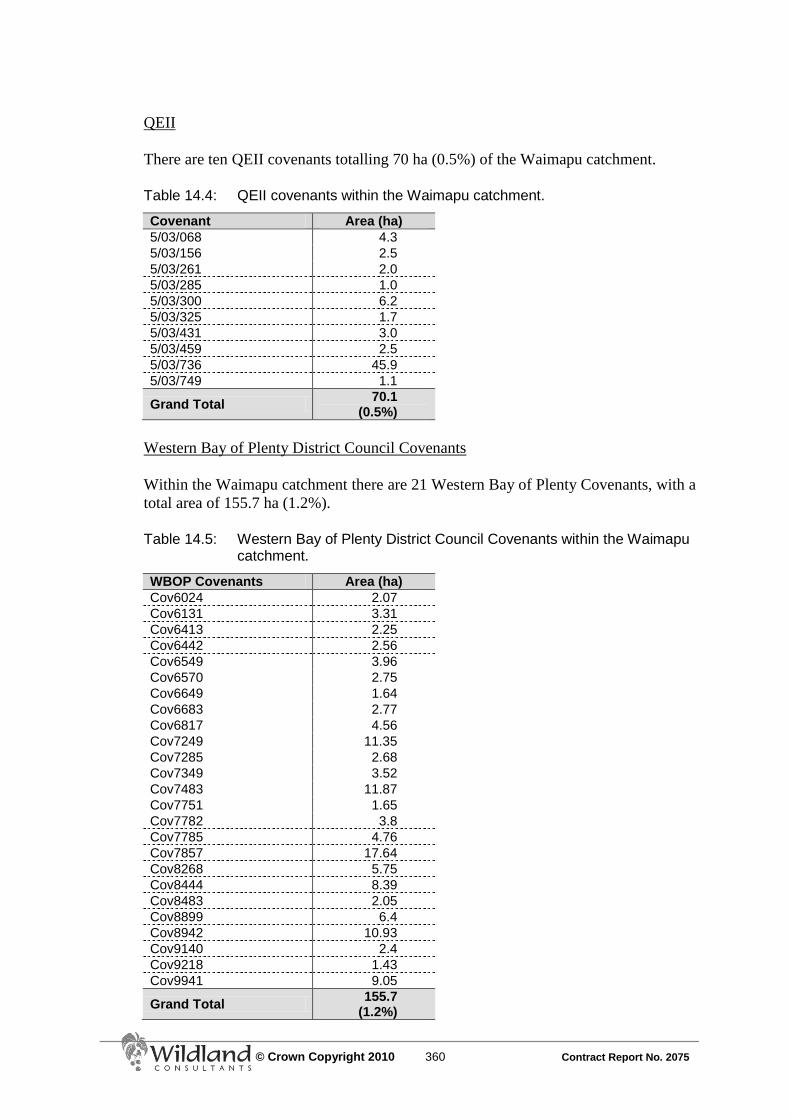
QEII
There are ten QEII covenants totalling 70 ha (0.5%) of the Waimapu catchment.
Table 14.4: QEII covenants within the Waimapu catchment.
Covenant Area (ha)
5/03/068 4.3
5/03/156 2.5
5/03/261 2.0
5/03/285 1.0
5/03/300 6.2
5/03/325 1.7
5/03/431 3.0
5/03/459 2.5
5/03/736 45.9
5/03/749 1.1
Grand Total 70.1
(0.5%)
Western Bay of Plenty District Council Covenants
Within the Waimapu catchment there are 21 Western Bay of Plenty Covenants, with a
total area of 155.7 ha (1.2%).
Table 14.5: Western Bay of Plenty District Council Covenants within the Waimapu
catchment.
WBOP Covenants Area (ha)
Cov6024 2.07
Cov6131 3.31
Cov6413 2.25
Cov6442 2.56
Cov6549 3.96
Cov6570 2.75
Cov6649 1.64
Cov6683 2.77
Cov6817 4.56
Cov7249 11.35
Cov7285 2.68
Cov7349 3.52
Cov7483 11.87
Cov7751 1.65
Cov7782 3.8
Cov7785 4.76
Cov7857 17.64
Cov8268 5.75
Cov8444 8.39
Cov8483 2.05
Cov8899 6.4
Cov8942 10.93
Cov9140 2.4
Cov9218 1.43
Cov9941 9.05
Grand Total 155.7
(1.2%)

© Crown Copyright 2010 361 Contract Report No. 2075
14.4 Indigenous vegetation and flora
Vegetation Pattern
Most (77%) of the indigenous forest is tawa-dominant (2,576 ha). Unlogged rimu-
tawa forest occurs in the vicinity of Otanewainuku, in the headwaters of the Waiorohi
Stream.
Table 14.6: Indigenous forest types within the Waimapu catchment.
Forest Type Area (ha)
General hardwoods 48.0
Highland and steepland softwoods-hardwoods 0.7
Rimu-tawa 140.9
Rimu-tawa-beeches 5.7
Tawa 2,609.5
Unclassified 769.4
Total 3,574.2
Species Lists
There are at least seven lists of vascular plants within the catchment.
Rare or Threatened Species
The Department of Conservation Bioweb database includes the following records:
Ileostylus micranthus
Myriophyllum robustum (At Risk-Declining)
Tetragonia tetragonioides (At Risk-Naturally Uncommon)
14.5 Pest plants
Plant Pest RPMS Status Waimapu
Wild kiwifruit Total control present
Banana passionfruit Progressive control present
Boneseed Progressive control present
Bushy asparagus Progressive control present
Cathedral bells Progressive control present
Climbing spindleberry Progressive control 1 site
Heather Progressive control present
Lantana Progressive control present
Old man's beard Progressive control present
Wild ginger Progressive control present
Woolly nightshade Progressive control present
The EBOP RPMS provides lists of species in the following categories: ‗Eradication‘,
‗Total and Progressive Control‘, ‗Boundary Control‘, and ‗Regional Surveillance‘.
Explanations for each category are given below:

© Crown Copyright 2010 362 Contract Report No. 2075
Eradication pest plants (10 species) - pests of low incidence but with a high threat
of spread or seriousness of adverse effects. The objective of this category is to
eradicate all known populations by 2020 and immediate eradication of any new
occurrences.
Total control pest plants (1 species) - pests of low incidence but with high threat
of spread or seriousness of adverse effects. The objective is the protection of
indigenous biodiversity and production values by controlling currently known
populations and immediate destruction of new occurrences.
Progressive control pest plants (15 species) - Pest of high incidence in parts of the
region, and with high threat of spread or seriousness of adverse effect. The
objective is to reduce density and/or distribution with priority given to controlling
isolated or satellite populations.
Boundary control pest plants (3 species) - Pests of high incidence over the region,
and with serious effects. The objective is protection of production values by
controlling effects.
Surveillance pest plants (23 species) - Plants of known threat of adverse effects,
which may be established in parts of the region, but about which there is
uncertainty of distribution, and/or threat of spread and/or feasibility of control.
There are two objectives for these pests. The first is to increase understanding of
the distributions, impacts and control options, the second is to have them
voluntarily controlled by land occupiers with assistance from EBOP programmes
(EBOP 2003).
EBOP also maintains a database of 123 pest plant species that are of interest or under
active management in the Tauranga Harbour catchment. For more information refer
to Environment Bay of Plenty‘s Regional Pest Management Strategy, or to their
excellent pest plant resources on the internet at http://www.envbop.govt.nz/
Environment/Pest-Plants-and-Weeds. aspx
The Department of Conservation also maintains a pest plant database and this
includes the following records for the Waimapu catchment:
Actinidia deliciosa
Akebia quinata
Alocasia brisbanensis
Berberis glaucocarpa
Cortaderia selloana
Crocosmia x crocosmiiflora
Galeobdolon luteum
Hedychium gardnerianum
Hypericum androsaemum
Impatiens sodenii
Jasminum polyanthum
Lilium tigrinum
Lonicera japonica
Pinus spp.
Rhamnus alaternus
Salix fragilis
Setaria palmifolia
Solanum mauritianum
Spartina alterniflora
Tradescantia fluminensis

© Crown Copyright 2010 363 Contract Report No. 2075
14.6 Pest animals
Species Affecting Vegetation Affecting
Indigenous Fauna Control Underway
Possum
Goat
Red deer
Fallow deer
Feral pig
Ship rat
Norway rat
Mustelids
Cats
Mice
Hedgehog
Wasps
Pest fish
State of the Vegetation
TCC has monitoring in place for natural areas within Tauranga City.
There is no vegetation monitoring within the upper Waimapu catchment, but
monitoring in adjacent catchments is directly relevant to this area.
Vegetation monitoring within the Otanewainuku Conservation Area (Willem 2000)
found that kohekohe and pate foliar cover was recovering to 1994 levels or better as a
result of possum control during the mid to late 1990s. Qualitative observation of
vegetation within the Otanewainuku Kiwi Project‘s management area suggests
possum-preferred canopy species such as kohekohe and northern rata are recovering,
and the vegetation condition is improving through time. Northern rata within the
management area flowered heavily in summer of 2008/2009.
Foliar Browse Index vegetation monitoring in Otawa/Oropi Forests (Willems 2000)
observed browse on every possum-preferred species monitored. All (100%) of
raukawa, 70% of kohekohe, 57% of mangeao, and 39% of mahoe exhibited evidence
of browse. The survey noted that overall the forest exhibited moderate to high damage
from possums, and the appearance of localised areas of possum-induced canopy
death. These monitoring results suggest that, beyond management areas, the overall
condition of vegetation is moderate but there is evidence of severe impacts on
possum-preferred species, and vegetation condition is in decline.
14.7 Indigenous fauna
Other Notable Species
There were ten kiwi within the Otanewainuku Kiwi Project management area
(Otanewainuku Conservation Area) around Otanewainuku mountain in 2007.
Robin numbers have recovered since the commencement of pest management in
2002. At least one kokako remains on the flanks of Otanewainuku mountain. A
kokako release into the management area is planned for 2010.

© Crown Copyright 2010 364 Contract Report No. 2075
State of Terrestrial Indigenous Fauna
No information is available on the state of terrestrial indigenous fauna for the
Waimapu catchment, although there is evidence indicating the recent local extinction
of at least one threatened bird species, and another had been reduced to the point of
local extinction. Outside the boundaries of the Otanewainuku Kiwi Project, bird, bat,
lizard, and invertebrate populations are probably comparable with those of other
mainland forests not subject to intensive predator control.
Fish Species
Seven (7) indigenous species are known to occur within Waimapu catchment
(compared to 20 different species for the wider Kaimai catchment)
Two (2) indigenous species are considered to be in Gradual Decline.
No introduced fish species have been recorded within Waimapu catchment
(compared with nine introduced species for the wider Kaimai catchment).
Table 14.7: Fish species recorded within the Waimapu catchment.
Scientific Name Common Name Threat Status
Indigenous
Anguilla australis Shortfin eel Not threatened
Anguilla dieffenbachii Longfin eel Gradual decline
Galaxias maculatus Inanga Not threatened
Gobiomorphus basalis Giant bully Not threatened
Gobiomorphus cotidianus Common bully Not threatened
Gobiomorphus huttoni Redfin bully Not threatened
Paranephrops planifrons Koura (Invertebrate) Gradual decline
Retropinna retropinna Common smelt Not threatened
Notable Aquatic Habitats
Wetlands on the margins of Tauranga Harbour.
14.8 Recreational use
Otawa forest contains fallow deer population popular with recreational hunters.
Track to Otanewainuku mountain summit, which can be accessed from Mountain
road.
14.9 Current management
Department of Conservation
Monitoring
- None.

© Crown Copyright 2010 365 Contract Report No. 2075
Pest plant control
- None.
Pest animal control
- Goat control.
- Recreational hunting management.
Recreation
- Otanewainuku Mountain track.
Regional Council
- Natural heritage
Environment Bay of Plenty provides technical advice, expertise, logistic and
financial support to conservation on private land through its Environmental
Programmes. Fencing is one component of EBOP‘s Environmental Programmes,
44,810 m of fencing has been erected, and is monitored by EBOP, within the
Waimapu catchment under Environmental Programmes. Riparian planting,
conservation planting, biodiversity protection and support for land use change are
other components of tools available to assist landowners to protect and enhance
environmental areas and values in the catchment.
District Council(s)
TCC manages Mauao (in conjunction with iwi) and other coastal reserves.
The Western Bay of Plenty District Plan contains a schedule of Significant Natural
Areas and provisions relating to protection of indigenous vegetation, including the use
of Protection Lots and Transferrable Development Rights (TDR) to protect
indigenous vegetation when subdivisions are undertaken.
Community
Team Kaitemako undertakes general habitat protection works, including weed
removal, revegetation planting, and pest control
Waimapu Estuary Managers aims to maintain clean open water enhance
indigenous estuarine biodiversity through habitat improvement. in Waimapu
Estuary by controlling mangroves, monitoring birds, sediment and benthic fauna,
pest plant and pest animal control, pest plant and indigenous vegetation planting
to enhance riparian margins and public reserves to increase presence of
indigenous fauna.
Mills-Maungatapu aim to protect indigenous birds by controlling rodents on the
Maungatapu Peninsula.
Fraser Street Reserve care group is working towards eradication of invasive pest
species; especially pampas, wattle, gorse and blackberry within the reserve.
Scantlebury Street Reserve care group
© Crown Copyright 2010 366 Contract Report No. 2075
Lagoon Place care group.
Argyll Reserve care group works to weed and maintain a series of indigenous
plantings throughout the reserve.
Rotary Park Reserve care group.
Taipari Street Gully Reserve care group.
Moiri Place Reserve care group.
Positive Aspects of Management
Part of Otanewainuku Kiwi Trust‘s management area extends into the upper
Waimapu catchment.
Tauranga city council/Environment BOP funded goat and possum control within
city council water supply forested area
Close proximity to large urban area.
High level of enthusiasm for conservation management within community living
in lower catchments, as shown by active care groups (10) in and around Tauranga
City.
Large areas of indigenous forest in upper catchment in Otawa-Otanewainuku
Forest.
Aspects that Need to be Addressed
Erosion and sedimentation associated with waterways.
Impacts of pest plants in vegetation remnants in all catchments.
On going dumping of organic and inorganic rubbish throughout the catchments
from road access. Some of this leading to ongoing plant pest spread.
Threats posed by pest animals in areas not subject to active management over
most indigenous vegetation within the catchment.

© Crown Copyright 2010 367 Contract Report No. 2075
15. OTAWA
15.1 Waterways
Description
Half of the waterways in the Otawa catchment are low gradient systems, and just
over one-third are high gradient streams (in the upper catchment).
The predominant soil type is volcanic soils. Some alluvial and soft sediment soils
occur in lower catchments, with sandy soils adjacent to the coast.
Sixty-one percent (61.4%) of the land cover adjoining streams is pastoral
grassland,
Nearly one-fifth (18.9%) of streams occur in urban landcover.
Eighteen percent (18.3%) of streams flow through indigenous forest.
Table 15.1: Summary of stream length and soil types and land cover within Otawa
catchment.
Geology
Landcover
Valley Landform Length in
Kilometres Low
Gradient (km)
Medium Gradient (km)
High Gradient
(km)
Alluvium
Pastoral 5.2 (4.2%) 5.2 (4.2%)
Urban 18.7 (15.0%) 18.7 (15.0%)
Miscellaneous Urban 0.3 (0.2%) 0.1 (0.08%)
Soft Sedimentary
Exotic forest 1.8 (4.0%) 1.8 (1.4%)
Indigenous forest
0.2 (0.2%) 1.1 (2.4%) 1.2 (1.0%)
Pastoral 2.0 (1.6%) 2.3 (5.1%) 4.3 (3.5%)
Volcanic acidic
Exotic forest 0.1 (0.1%) 0.1 (0.08%)
Indigenous forest
2.2 (1.8%) 6.3 (37.7%) 12.9 (28.5%) 21.5 (17.3%)
Pastoral 29.6 (23.8%) 9.8 (58.6%) 27.0 (59.7%) 66.5 (53.4%)
Urban 4.2 (3.4%) 0.7 (4.2%) 4.9 (3.9%)
62.6 (50.2%) 16.9 (13.4%) 45.2 (36.3%) 124.6
Rivers and Streams Within the Catchment
The main streams are the Waitao and Kaitemako.
Waitao
- Kaiate
- Owairoa
- Otawera
- Arateka
- Rerekawau
Kaitemako

© Crown Copyright 2010 368 Contract Report No. 2075
Water Quality
Total nitrogen and nitrate nitrogen for the Waitao were high, but may have been
declining since 1997 (Taylor and Park 2001).
Ammonium levels within the Waitao are the higher than other streams within the
Tauranga catchment.
Between 1990 and 1995 the Otawa had consistently high levels of E. coli and
Enterococci, among the highest within the Tauranga Harbour catchment (Taylor
and Park 2001).
Between 1991 and 2000 the Waitao consistently recorded the highest levels of
faecal coliforms among streams flowing into the Tauranga Harbour.
The Waitao stream shows an increasing trend and increasing variation in colour.
Overall water quality in the Waitao River was moderate to good but declining in
2000 (Taylor and Parks 2001).
15.2 Land use capability
Most soils within the Otawa catchment have limited versatility, being Land Classes 6,
7, and 8. Soils on flats around Tauranga Harbour have higher versatility, being Land
Classes 2, 3, and 4. All land classes have erosion as the primary limitation on use.
LUC Class Area (ha) % of Catchment
1 0.0 0.0
2 407.4 4.1
3 1,184.9 12.0
4 1,928.5 19.6
5 0.0 0.0
6 2,639.6 26.8
7 2,198.7 22.3
8 447.6 4.5
Town 966.9 9.8
N/C 88.9 0.9
TOTAL 9,862.5 100.0

© Crown Copyright 2010 369 Contract Report No. 2075
Otawa LUC and Land Cover
0
500
1000
1500
2000
2500
3000
1 2 3 4 5 6 7 8 LUC Class
Are
a (
ha)
Other Pasture & Crop Exotic Forest & Scrub Indigenous Forest & Scrub
`
LUC Classes Otawa Sub-Catchment
Class 3 12.0%
Class 4 19.6%
Class 5 0%
Class 6 26.8%
Class 7 22.3%
Class 8 4.5%
Other 10.7%
Class 2 4.1%

© Crown Copyright 2010 370 Contract Report No. 2075
Figure 15.1: Otawa catchment - Land cover and land use.

© Crown Copyright 2010 371 Contract Report No. 2075
15.3 Land use
Spatial Pattern
Catchment size: 9,862 ha.
Catchment location: north from a line between Ngawaro Road and Otanewainuku,
to the Tauranga harbour and the coast at Mt Maunganui and Papamoa.
Predominant land uses (account for 88% of catchment):
- pasture grassland 6,021 ha (46.2% of catchment), lower, middle and upper
catchments, mostly on land of low to moderate relief
- indigenous forest 1,432 ha (14.5% of catchment), upper catchments on land of
moderate relief, and along the steeps sides of the middle Waitao river gully.
- Exotic plantation forest 1,350 ha (13.4%) on moderate and steep slopes in the
middle catchment.
- Urban areas 2,088 ha (20.7%), on highly versatile soils in low relief landforms
in lower catchment.
- orchards and crops 599 ha (5.5% of catchment), warmer lower flat terrain near
sea level.
Urban landforms: 2,088 ha (20.7% of catchment), in Tauranga City.
Wetlands: 60.0 ha (0.5% of catchment), primarily herbaceous saline wetlands
associated with estuary margins.
Most modified: The lower parts of the Otawa catchment have been heavily
modified by conversion to pasture grassland, orcharding, and urban land uses.
Least modified: The upper catchment retains indigenous vegetation on the Otawa-
Otanewainuku ridge stream, although much has been modified by logging.
Table 15.2: Land use within the Otawa catchment.
LCDB2 Classification Area (ha) % of
Catchment
Broadleaved Indigenous Hardwoods 120.4
Indigenous Forest 1,431.9
Manuka and or Kanuka 197.1
Indigenous Forest 1,749.3 17.7%
Coastal Sand and Gravel 16.9
Estuarine Open Water
Herbaceous Freshwater Vegetation 8.6
Herbaceous Saline Vegetation 68.5
Lake and pond 24.3
Mangrove 3.5
Wetland Systems 121.8 1.2%
Afforestation (imaged, post LCDB 1) 5.8
Afforestation (not imaged)
Forest Harvested 42.5
Other Exotic Forest 31.8

© Crown Copyright 2010 372 Contract Report No. 2075
LCDB2 Classification Area (ha) % of
Catchment
Pine Forest - Closed Canopy 793.5
Pine Forest - Open Canopy 361.8
Exotic Plantation Forest 1,235.4 12.5%
Orchard and Other Perennial Crops 464.0
Short-rotation Cropland 95.6
Orchards and Crops 559.6 5.7%
High Producing Exotic Grassland 3,729.0
Low Producing Grassland 166.3
Pastoral Lands 3,895.3 39.5%
Deciduous Hardwoods 17.4
Major Shelterbelts 17.2
Mixed Exotic Shrubland 23.1
Gorse and Broom 88.9
Other Exotic Vegetation 146.6 1.5%
Surface mine 43.8
Surface Mine 43.8 0.4%
Built-up Area 1,616.6
Transport Infrastructure 1.5
Urban Parkland/ Open Space 470.3
Urban Landforms 2,088.4 21.2%
Not Classified 22.1 0.2%
Grand Total 9,862.5 100.0%
Legal Protection
This section provides an overview of the areas protected by legal statute and
covenants, for the purpose of biodiversity protection.
Department of Conservation
The Department of Conservation administers 399 ha within the Otawa catchment
for conservation purposes.
Reserves to protect indigenous ecosystems, vegetation, habitats, or species
comprises 196.1 ha (49.2%).
Other reserves (e.g. Recreation) comprise 202.7 ha (50.8%).
Table 15.3: Department of Conservation administered lands within the Otawa
catchment.
Reserve Type (DOC Legal Description) Area (ha)
Fixed Marginal Strip - S.24(3) Conservation Act 1987 4.4
Historic Reserve - S.18 Reserves Act 1977 74.8
Local Purpose Reserve - S.23 Reserves Act 1977 1.4
Recreation Reserve - S.17 Reserves Act 1977 126.5
Scenic Reserve - S.19(1)(a) Reserves Act 1977 12.5
Stewardship Area - S.25 Conservation Act 1987 179.2
Grand Total 398.8
© Crown Copyright 2010 373 Contract Report No. 2075
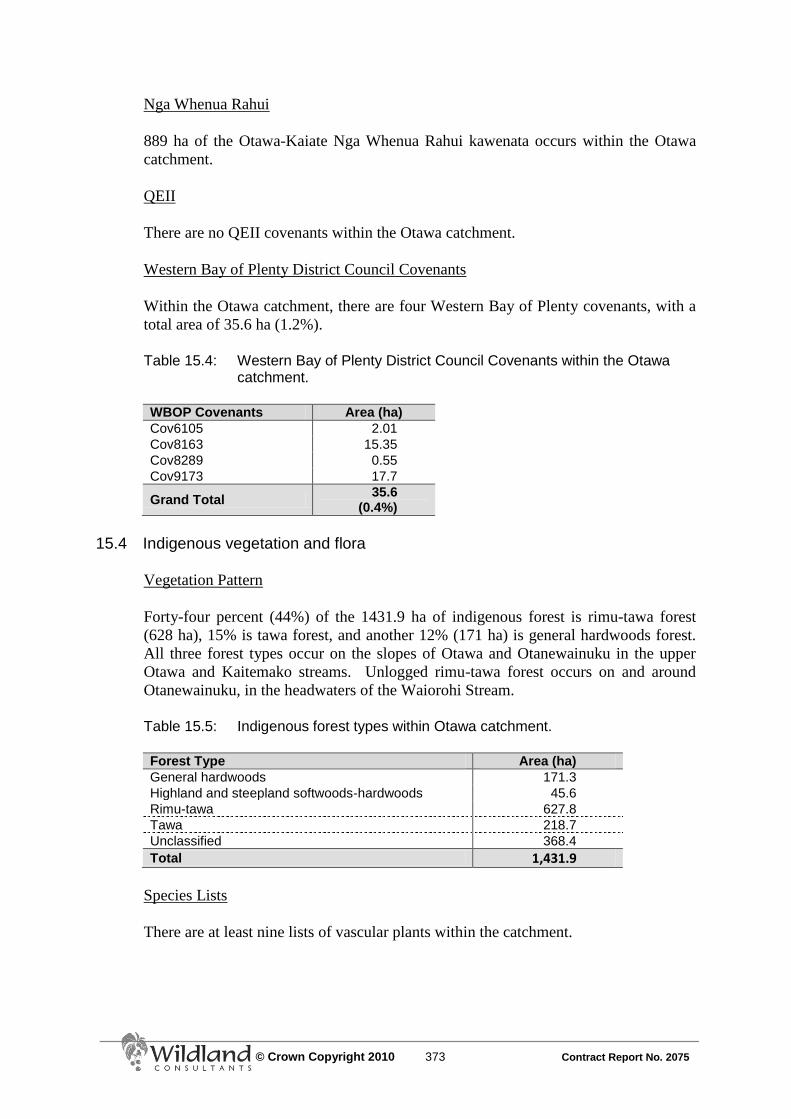
Nga Whenua Rahui
889 ha of the Otawa-Kaiate Nga Whenua Rahui kawenata occurs within the Otawa
catchment.
QEII
There are no QEII covenants within the Otawa catchment.
Western Bay of Plenty District Council Covenants
Within the Otawa catchment, there are four Western Bay of Plenty covenants, with a
total area of 35.6 ha (1.2%).
Table 15.4: Western Bay of Plenty District Council Covenants within the Otawa
catchment.
WBOP Covenants Area (ha)
Cov6105 2.01
Cov8163 15.35
Cov8289 0.55
Cov9173 17.7
Grand Total 35.6
(0.4%)
15.4 Indigenous vegetation and flora
Vegetation Pattern
Forty-four percent (44%) of the 1431.9 ha of indigenous forest is rimu-tawa forest
(628 ha), 15% is tawa forest, and another 12% (171 ha) is general hardwoods forest.
All three forest types occur on the slopes of Otawa and Otanewainuku in the upper
Otawa and Kaitemako streams. Unlogged rimu-tawa forest occurs on and around
Otanewainuku, in the headwaters of the Waiorohi Stream.
Table 15.5: Indigenous forest types within Otawa catchment.
Forest Type Area (ha)
General hardwoods 171.3
Highland and steepland softwoods-hardwoods 45.6
Rimu-tawa 627.8
Tawa 218.7
Unclassified 368.4
Total 1,431.9
Species Lists
There are at least nine lists of vascular plants within the catchment.

© Crown Copyright 2010 374 Contract Report No. 2075
Rare or Threatened Species
Pimelea tomentosa occurs on Mauao. Atriplex hollowayi was recorded at Mount
Maunganui in 1890, and Lepidium oleraceum (Cook‘s Scurvy Grass, nau) was
recorded in 1942 from Mauao.
The Department of Conservation Bioweb database includes the following records:
Desmoschoenus spiralis (At Risk-Relict)
Pimelea arenaria (At Risk-Declining)
Pimelea tomentosa (At Risk-Nationally Vulnerable)
15.5 Pest plants
Plant Pest RPMS Status Ōtawa
Alligator weed Eradication 1 site
White-edged nightshade Eradication ?
Wild kiwifruit Total control present
Apple of Sodom Progressive control 1 site
Banana passionfruit Progressive control present
Boneseed Progressive control present
Bushy asparagus Progressive control present
Cathedral bells Progressive control present
Heather Progressive control present
Lantana Progressive control present
Old man's beard Progressive control present
Wild ginger Progressive control present
Woolly nightshade Progressive control present
The EBOP RPMS provides lists of species in the following categories: ‗Eradication‘,
‗Total and Progressive Control‘, ‗Boundary Control‘, and ‗Regional Surveillance‘.
Explanations for each category are given below:
Eradication pest plants (10 species) - pests of low incidence but with a high threat
of spread or seriousness of adverse effects. The objective of this category is to
eradicate all known populations by 2020 and immediate eradication of any new
occurrences.
Total control pest plants (1 species) - pests of low incidence but with high threat
of spread or seriousness of adverse effects. The objective is the protection of
indigenous biodiversity and production values by controlling currently known
populations and immediate destruction of new occurrences.
Progressive control pest plants (15 species) - Pest of high incidence in parts of the
region, and with high threat of spread or seriousness of adverse effect. The
objective is to reduce density and/or distribution with priority given to controlling
isolated or satellite populations.
Boundary control pest plants (3 species) - Pests of high incidence over the region,
and with serious effects. The objective is protection of production values by
controlling effects.
© Crown Copyright 2010 375 Contract Report No. 2075
Surveillance pest plants (23 species) - Plants of known threat of adverse effects,
which may be established in parts of the region, but about which there is
uncertainty of distribution, and/or threat of spread and/or feasibility of control.
There are two objectives for these pests. The first is to increase understanding of
the distributions, impacts and control options, the second is to have them
voluntarily controlled by land occupiers with assistance from EBOP programmes
(EBOP 2003).
EBOP also maintains a database of 123 pest plant species that are of interest or under
active management in the Tauranga Harbour catchment. For more information refer
to Environment Bay of Plenty‘s Regional Pest Management Strategy, or to their
excellent pest plant resources on the internet at http://www.envbop.govt.nz/
Environment/Pest-Plants-and-Weeds. aspx
The Department of Conservation also maintains a pest plant database and this
includes the following records for the Otawa catchment:
Chrysanthemoides monilifera subsp. monilifera
Erigeron karvinskianus
Houttuynia cordata
Lonicera japonica
Paspalum vaginatum
Spartina alterniflora
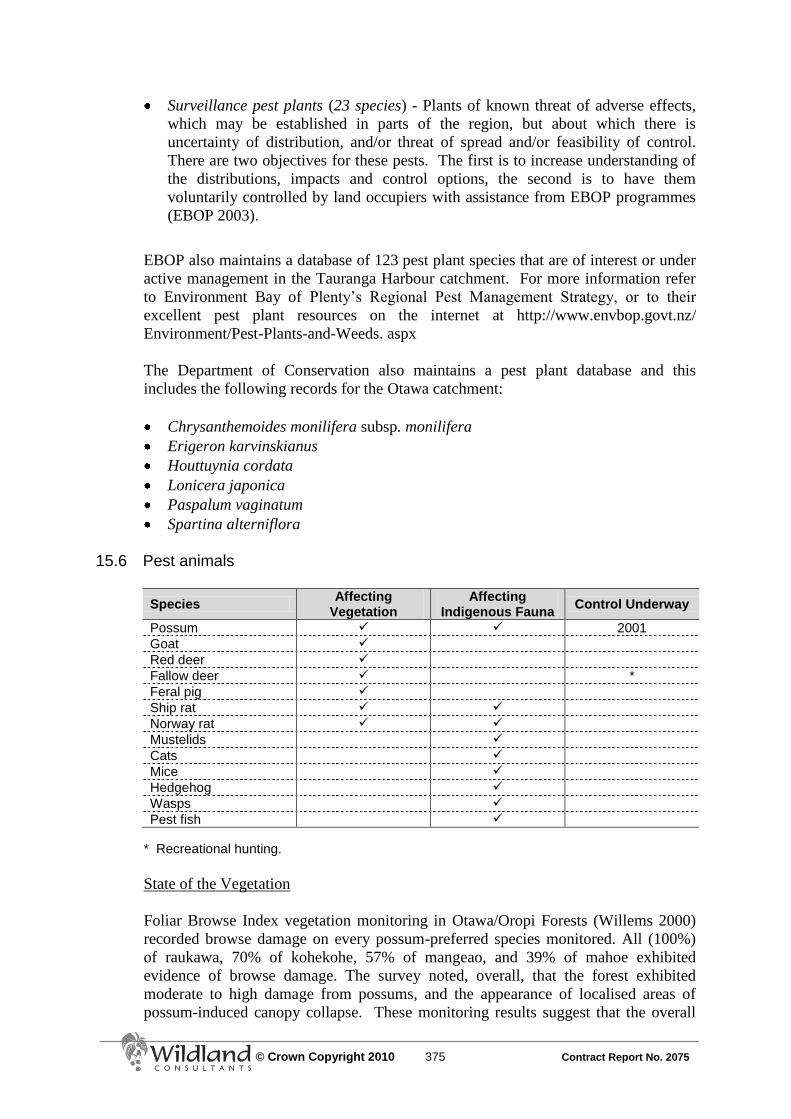
15.6 Pest animals
Species Affecting
Vegetation Affecting
Indigenous Fauna Control Underway
Possum 2001
Goat
Red deer
Fallow deer *
Feral pig
Ship rat
Norway rat
Mustelids
Cats
Mice
Hedgehog
Wasps
Pest fish
* Recreational hunting.
State of the Vegetation
Foliar Browse Index vegetation monitoring in Otawa/Oropi Forests (Willems 2000)
recorded browse damage on every possum-preferred species monitored. All (100%)
of raukawa, 70% of kohekohe, 57% of mangeao, and 39% of mahoe exhibited
evidence of browse damage. The survey noted, overall, that the forest exhibited
moderate to high damage from possums, and the appearance of localised areas of
possum-induced canopy collapse. These monitoring results suggest that the overall

© Crown Copyright 2010 376 Contract Report No. 2075
condition of vegetation in the Otawa catchment is moderate, with some evidence of
severe impacts on possum-preferred species, and vegetation condition is in decline.
15.7 Indigenous fauna
A suite of typical forest birds is present, including kereru. Falcon and kākā are likely
to be itinerant visitors. Kiwi are present (in low numbers) to the south at
Otanewainuku, and there are old records from Otawa. Kokako were present in the
1980s (Beadel 1985) and single birds could still be present (Smuts-Kennedy 2002).
Lizards
There is a record of the common copper skink (Cyclodina aenea).
Bats
Long-tailed bats could be present.
Other Notable Species
Hochstetter‘s frogs are present in streams on the southern slopes of Otawa forest,
and though a search of the upper Waitao on northern slopes in 2002 failed to
locate any individuals, it is not impossible that frogs occur there (Smuts-Kennedy
2002).
More than 100 pairs of grey-faced petrels nest on the northern flanks of Mauao.
Thirty chicks were transferred from Motutau in November 1999, thirteen fledged,
of which three have returned to breed (Miskelly et al. 2009). The grey-faced
petrel colony on Mauao is one of the few remaining colonies on the New Zealand
mainland (Taylor 2000).
Little Blue Penguin nest around Mauao and along the coast in general.
State of Terrestrial Indigenous Fauna
No information on the state of terrestrial indigenous fauna is available for most of the
Otawa catchment, although there is evidence indicating the recent probable local
extinction of kokako which were recorded around Otawa trig in the early 1980s
(Forest and Bird 1983).
Bird, lizard, and invertebrate populations are probably comparable with those of other
mainland forests not subject to pest control.
Fish Species
Ten (10) indigenous freshwater fish species are known to occur within Otawa
catchment (compared to 20 different species for the wider Kaimai catchment)
Two (2) indigenous species are considered to be in Gradual Decline.

© Crown Copyright 2010 377 Contract Report No. 2075
One introduced fish species (Gambusia) has been recorded within Otawa
catchment (compared with nine introduced species for the wider Kaimai
catchment).
Gambusia (Mosquito fish) is an Unwanted Organism.
Table 15.6: Fish species recorded within Otawa catchment.
Scientific Name Common Name Threat Status
Indigenous
Anguilla dieffenbachii Longfin eel Gradual decline
Paranephrops planifrons Koura (Invertebrate) Gradual decline
Gobiomorphus huttoni Redfin bully Not threatened
Anguilla australis Shortfin eel Not threatened
Galaxias maculatus Inanga Not threatened
Retropinna retropinna Common smelt Not threatened
Galaxias fasciatus Banded kokopu Not threatened
Gobiomorphus gobioides Giant bully Not threatened
Gobiomorphus cotidianus Common bully Not threatened
Gobiomorphus basalis Crans bully Not threatened
Mugil cephalus Grey mullet Not threatened
Exotic
Gambusia affinis Gambusia Introduced
Notable Aquatic Habitats
None present.
15.8 Recreational use
Otawa forest contains a fallow deer herd that is popular with recreational hunters.
15.9 Current management
Department of Conservation
Monitoring
- At least two FBI lines on the main ridge, north and south of Otawa trig.
- No other monitoring infrastructure.
Pest plant control
- None.
Pest animal control
- Goat control (ongoing, as required).
- Possum control, 2001, 830 ha treatment area.
- Recreational hunting management.
Recreation
- Otanewainuku Mountain track.
- Track to Otawa trig.

© Crown Copyright 2010 378 Contract Report No. 2075
Regional Council
- Natural heritage
Environment Bay of Plenty provides technical advice, expertise, logistic and
financial support to conservation on private land through its Environmental
Programmes. Fencing is one component of EBOP‘s Environmental Programmes,
9,747 m of fencing has been erected, and is monitored by EBOP, within the
Otawa catchment under Environmental Programmes. Riparian planting,
conservation planting, biodiversity protection and support for land use change are
other components of tools available to assist landowners to protect and enhance
environmental areas and values in the catchment.
District Council(s)
TCC manages Mauao (in conjunction with iwi) and other coastal reserves.
The Western Bay of Plenty District Plan contains a schedule of Significant Natural
Areas and provisions relating to protection of indigenous vegetation, including the use
of Protection Lots and Transferrable Development Rights (TDR) to protect
indigenous vegetation when subdivisions are undertaken.
Community Projects
Te Awa O Waitao Stream restoration project aims to restore the locally significant
Waitao Stream and wider catchment with a combination of western science and
traditional Māori knowledge. It is a joint NIWA, Tangata Whenua and NZ Landcare
Trust project. The stream, its mouth and surroundings are very significant culturally
and historically to tangata whenua: Nga Potiki, Ngati He, Ngai Tukairangi, Ngati
Kuku, Ngati Tapu (‗Ngaiterangi‘), Ngai Te Ahi and Ngati Pukenga. The project is
being supported by Tauranga City Council, Western Bay of Plenty District Council,
Environment Bay of Plenty, Department of Conservation, Nga Whenua Rahui, local
community, and hapu.
Positive Aspects of Management
High level of enthusiasm for conservation management within community living
in lower catchments, evidenced by active care groups in and around Tauranga
City.
Close proximity to large urban area.
There are large areas of indigenous forest in upper catchment contiguous with the
Otawa-Otanewainuku Forest.
Aspects that Need to be Addressed
Erosion and sedimentation associated with waterways.
Fragmented habitats in lower catchments; need for ecological restoration and
creation of linkages along streams.
Water quality in Waitao stream.

© Crown Copyright 2010 379 Contract Report No. 2075
Impacts of pest plants in vegetation remnants in lower catchments.
Threats posed by pest animals in areas not subject to active management over
most indigenous vegetation within the catchment.