150 +22% -25% 130 +37%
TRANSCRIPT

DISCLOSURE APPENDIX AT THE BACK OF THIS REPORT CONTAINS IMPORTANT DISCLOSURES, ANALYST CERTIFICATIONS, AND THE STATUS OF NON-US ANALYSTS. US Disclosure: Credit Suisse does and seeks to do business with companies covered in its research reports. As a result, investors should be aware that the Firm may have a conflict of interest that could affect the objectivity of this report. Investors should consider this report as only a single factor in making their investment decision.
CREDIT SUISSE SECURITIES RESEARCH & ANALYTICS BEYOND INFORMATION®
Client-Driven Solutions, Insights, and Access
01 December 2015
Asia Pacific
Equity Research
Investment Strategy
Asia Pacific Equity Strategy STRATEGY
2016 Outlook: A year of positive returns?
Figure 1: MSCI Asia ex-Japan performance around Fed tightening
70
90
110
130
150
170
190
-9m -6m -3m 0m +3m +6m +9m +12m
Feb-94 Jun-04 May-13 current
MXASJ
-25%
-14%
-21%
-20%
+22%
+15%
+37%
Source: MSCI. We are assuming Dec 2015 is the first Fed rate hike.
■ Three reasons why 2016 could be a year of positive returns. With MSCI
Asia ex-Japan up just 1% in 2014 and down 10% in 2015, we highlight three
reasons why 2016 could be a year of positive returns. One, Figure 1
highlights that while MSCI Asia ex-Japan has historically corrected in the
run-up to the first Fed tightening in 1994 and 2004 and during the 2013 Fed
taper, MXASJ has historically rallied in the six months after. Two, Figure 2
highlights that MXASJ P/B has dropped to 1.37x. This is the lowest P/B start
since 2008-09. Three, MXASJ ROE appears to be bottoming at 11%.
■ Key risks to our call. With the Fed tightening against a weaker macro
backdrop globally and particularly so in China and 2004 (the episode with
the 37% return for MXASJ) associated with NJA ROE rising from 10% to
15%, the key question is whether these differences are big enough to negate
history. The other risk is whether global policy divergences (Fed tightening
versus ECB and BOJ easing) mean the DXY does not fall as it did in prior
episodes. We believe a modest 10% return though is still likely.
■ Overweight Cheapest 4. While past performance is not necessarily a good
guide to the future, the Cheapest 4 outperformed the Expensive 4 by 7%
YTD in 2015. We continue to Overweight the Cheapest 4, which are Korea,
MSCI China, Taiwan and Singapore.
Research Analysts
Sakthi Siva
65 6212 3027
Kin Nang Chik
Analyst Team (Market Strategy) Asia Pacific
Sakthi Siva
Australia Hasan Tevfik
China / Hong Kong Vincent Chan / Li Chen
India Neelkanth Mishra / Prateek Singh
Indonesia Jahanzeb Naseer
Japan
Daisuke Takato
Malaysia
Tan Ting Min
Pakistan
Farhan Rizvi, CFA / Fahd Niaz, CFA
Philippines
Alvin Arogo
Singapore
Gerald Wong
South Korea
Gil Kim
Taiwan
Chung Hsu
Thailand Dan Fineman
Vietnam Dan Fineman / Chate Benchavitvilai
Analyst Team (Sector) Autos and Auto Components
Jatin Chawla / Bin Wang
Banks
Sanjay Jain
Basic Materials
Trina Chen
Chemicals, and Oil Refining/Marketing
Kenneth Whee
Consumer
Kevin Yin / Arnab Mitra / A-Hyung Cho
Environment
Trina Chen
Gaming
Kenneth Fong
Industrials
Edmond Huang / Tim Ross / MinSeok Sinn / Henry Kwon / Lokesh Garg / Baiding Rong /HaYoung Chung
Insurance
Arjan van Veen
Oil & Gas
Thomas Wong
Technology
Manish Nigam
Telecoms
Colin McCallum
Transportation
Tim Ross / Muzhafar Mukhtar / Christopher Siow
Utilities and Renewable Energy
Dave Dai

01 December 2015
Asia Pacific Equity Strategy 2
Focus charts
Figure 2: MSCI Asia ex-Japan price-to-book
0.5
1.0
1.5
2.0
2.5
3.0
Dec-95 Dec-97 Dec-99 Dec-01 Dec-03 Dec-05 Dec-07 Dec-09 Dec-11 Dec-13 Dec-15
Asia ex-JP - Trailing PB
1.37x now
1.23x in Feb 091.19x in Sep 01
0.94x in Aug 98
1.47x in Jan 141.22x in
Mar 031.28x on
24 Aug
Source: MSCI
Figure 3: Asia ex-Japan ROE
10%
11%
12%
13%
14%
Dec-09 Dec-10 Dec-11 Dec-12 Dec-13 Dec-14 Dec-15
Asia ex Japan ROE
High 14% Nov 2010
11.0%11.3% Dec 2014
Source: Company data, Credit Suisse estimates
Figure 4: CS country tilts Figure 5: CS sector tilts
Aust / NZ
India
Malaysia
Thailand
Philippines
Indonesia
Japan
Singapore
China
Hong Kong
Taiwan
Korea
-5% -4% -3% -2% -1% 0% 1% 2% 3% 4%
Tilt sizeUnderweight Overweight
Health Care
Industrials
Telcos
Consumer Staples
Materials
Utilities
Energy
Discretionary
Real estate
Information Technology
Financials (ex-Real Est.)
-10% -5% 0% 5% 10% 15%
Tilt sizeUnderweight Overweight
Source: MSCI Source: MSCI
MSCI Asia ex-Japan P/B of
1.37x is the lowest P/B start
since 2008-09
We believe a big driver of
NJA's underperformance
over the past five years has
been slowing ROE; we
believe it is now bottoming
at 11%
01 December 2015
Asia Pacific Equity Strategy 3
Table of contents Top picks: Countries and sectors 4
Country Sections 32 Australia 33 China 36 China A-share Market Strategy 39 Hong Kong 42 India 44 Indonesia 48 Japan 51 Malaysia 54 Pakistan 58 Philippines 62 Singapore 67 South Korea 70 Taiwan 74 Thailand 77 Vietnam 80
Sector Sections 83 Autos and Components 84 Banks 86 Basic Materials 88 Chemicals and Oil Refining/Marketing 90 Consumer 92 Environment 94 Gaming 96 Industrials 98 Insurance 100 Oil & Gas 102 Technology 104 Telecoms 106 Transportation 108 Utilities and renewable energy 110

01 December 2015
Asia Pacific Equity Strategy 4
Top picks: Countries and sectors Figure 6: Best Outperform ideas—by country (picked by our country strategists)
Mkt Yield P/B ROE Net debt/
Target cap P/E (x) (%) (x) (%) equity (x)
Company RIC Rating Curr. Price price (mn) FY14A FY15E FY16E FY16E FY16E FY16E FY16E
Australia
Rio Tinto Ord RIO.AX N AUD 47.1 53 61,433 6.8 11.9 20.0 6.3% 1.5 7.5% 33.7% AGL Energy Ord AGL.AX O AUD 16.8 18.4 8,197 15.9 17.4 15.8 4.6% 1.2 7.4% 28.1% Carsales.com Lim Ord CAR.AX O AUD 10.3 11.3 1,792 25.7 24.7 21.8 3.7% 9.6 44.1% 63.3% Lend Lease Group Unt LLC.AX O AUD 12.6 16.6 5,292 8.8 11.8 10.7 4.9% 1.4 13.2% 25.8%
China
China Pacific (H) 2601.HK O HKD 32.3 50 38,141 21.8 13.0 12.6 3.2% 1.7 13.4% Net cash Hikvision 002415.SZ O CNY 36.1 41.6 22,995 31.0 23.1 17.7 1.7% 5.9 33.0% Net cash Goldwind (H) 2208.HK O HKD 13.2 26.3 6,632 16.9 9.5 8.3 6.0% 1.5 18.5% 35.8% Alibaba BABA.N O USD 81.7 98 205,290 44.3 37.5 31.9 0.0% 5.9 18.5% Net cash Geely 0175.HK O HKD 4.2 5.7 4,770 21.3 10.5 7.4 1.6% 1.3 17.5% Net cash Kweichow Moutai 600519.SS O CNY 213.0 270 41,884 15.8 16.1 14.2 2.1% 3.4 24.1% Net cash
China A-share Market Strategy
Midea 000333.SZ O CNY 28.63 41 148,156 11.5 9.8 9.0 4.5% 2.1 25.9% Net cash Wanda Cinema 002739.SZ O CNY 104.81 122 142,405 65.4 95.3 52.8 0.2% 19.0 43.0% Net cash Hengrui Medicine 600276.SS O CNY 50.54 57 119,956 50.2 46.9 40.4 0.3% 8.2 22.4% Net cash GeorTek 002241.SZ O CNY 33.2 41.8 61,479 30.5 36.7 27.9 0.4% 4.5 17.5% Net cash
Hong Kong
AIA Group 1299.HK O HKD 47.7 57.5 74,075 21.5 21.6 16.8 1.5% 2.1 12.4% 5.1% Galaxy 0027.HK O HKD 23.6 37.6 12,967 9.8 21.5 14.0 2.2% 2.2 16.2% Net cash CKH 0001.HK O HKD 103.6 142 51,593 6.6 12.4 11.5 3.1% 1.0 8.5% 18.3% Samsonite 1910.HK O HKD 23.5 27.7 4,275 22.9 21.7 18.0 2.6% 2.8 15.8% Net cash
India
Tech Mahindra TEML.BO O INR 538 700 7,818 20 17 14 1.7% 3 24% -0.3 Hindustan Unilever HLL.BO O INR 811 920 26,420 41 40 34 2.2% 36 113% -1.0 Ultratech Cement ULTC.BO O INR 2,778 3,525 11,470 36 30 19 0.7% 3 18% 0.2 Tata Motors TAMO.BO O INR 401 490 17,424 9 11 8 0.6% 1 20% 0.5
Indonesia
Astra International ASII.JK O IDR 6,175 7,600 18,267 12.8 14.5 12.4 4.1% 2.3 18.6% 40.4% Gudang Garam GGRM.JK O IDR 50,400 61,500 7,086 18.1 18.1 16.1 2.1% 2.4 14.9% 34.6% XL Axiata EXCL.JK O IDR 3,770 5,150 2,351 -35.8 228.2 17.5 3.1% 2.2 12.4% 151.7% Summarecon SMRA.JK O IDR 1,580 1,960 1,666 16.5 17.8 15.0 1.6% 3.0 20.0% 42.6%
Japan
Aisin Seiki Ord 7259 O JPY 4,955 6,000 11,413 15.5 18.1 14.3 2.1% 1.1 8.0% 9.1% Kose Ord 4922 O JPY 12,830 14,500 5,965 65.7 60.7 34.4 0.6% 4.7 13.6% Net cash Ono Pharm Ord 4528 O JPY 19,525 23,000 16,871 101.7 159.5 129.4 0.9% 4.4 3.4% Net cash Sony Ord 6758 O JPY 3,245 4,200 33,354 -29.7 -30.1 21.2 0.8% 1.7 8.1% Net cash
Korea
Sam. Elec. 005930.KS O W 1,299,000 1,785,000 167,372 8.2 8.6 7.1 2.3 0.9 12.8 -6.1 Mobis 012330.KS O W 247,000 280,000 21,032 7.0 7.7 7.0 2.0 0.8 12.5 -26.0 Sam. Life 032830.KS O W 108,000 135,000 18,894 15.3 17.7 16.3 1.5 0.8 4.8 n.a. Shinhan FG 055550.KS O W 42,300 60,000 17,546 10.2 9.3 8.2 3.2 0.7 9.0 n.a. Shinsegae 004170.KS O W 251,000 330,000 2,162 15.8 6.2 12.9 0.5 0.8 6.1 44.6
Malaysia
Genting GENT MK O MYR 7.33 10.30 27,438 18.2 17.2 14.1 0.5% 0.9 6.6% (0.0) Gamuda GAM MK O MYR 4.56 6.00 10,971 14.8 15.6 13.7 2.0% 1.3 10.7% 0.3 Gent Plant GENP MK O MYR 10.24 11.50 7,983 20.6 35.9 23.2 0.8% 1.8 7.7% 0.0 Alliance FG AFG MK O MYR 3.58 3.97 5,542 10.3 10.4 10.1 5.1% 1.1 11.1% (0.8)
Pakistan
United Bank Limited UBL.KA O PRs 164 218 1,904 7.9 7.1 1.3 18.0 Pakistan Oilfields PKOL.KA O PRs 310 425 696 8.7 10.2 2.2 21.7 DG Khan Cement DGKH.KA O PRs 136 175 567 7.8 6.9 0.8 11.1 K-Electric KELE.KA O PRs 7.6 10.5 1,993 13.6 8.3 1.3 15.5 Engro Corporation EGCH.KA O PRs 283 368 1,405 8.5 7.2 1.8 24.3
Philippines
Metrobank MBT.PS O PHP 81.0 101.1 5,481 11.3 12.2 10.8 1.2% 1.2 11.0% Net cash Metro Pacific MPI.PS O PHP 5.3 6.211 3,163 16.3 14.7 13.7 1.3% 1.2 8.9% 20.6% ICTSI ICT.PS O PHP 73.1 117 3,163 20.7 24.5 22.5 1.2% 2.6 16.0% 70.1% EDC EDC.PS O PHP 6.3 9.8 2,506 13.3 12.6 10.1 3.5% 2.1 20.7% 75.0% Bloomberry BLOOM.PS O PHP 5.3 8.4 1,247 13.9 -35.8 39.0 1.0% 2.3 5.9% 82.6%
Singapore
CDL CTDM.SI O SGD 7.44 12.00 4,816 14.9 13.4 9.6 2.2 0.7 7.8 19.8 SingTel STEL.SI O SGD 3.80 4.40 43,128 16.6 16.0 15.2 4.8 2.4 16.0 34.1 DBS DBSM.SI O SGD 16.72 22.00 29,931 10.8 9.7 8.7 3.6 0.9 11.6 n.m.

01 December 2015
Asia Pacific Equity Strategy 5
Mkt Yield P/B ROE Net debt/
Target cap P/E (x) (%) (x) (%) equity (x)
Company RIC Rating Curr. Price price (mn) FY14A FY15E FY16E FY16E FY16E FY16E FY16E
Taiwan
SPIL 2325.TW O TWD 45.0 52.0 4,325 12.0 12.2 11.7 6.4 1.22 16.4 3.0 Delta 2308.TW O TWD 158.5 196.0 12,592 18.7 22.5 19.4 3.6 3.60 25.2 0.5 Hon Hai 2317.TW O TWD 84.3 108.0 39,791 9.5 9.0 8.9 5.7 1.91 13.9 -35.1 E.Sun 2884.TW O TWD 19.9 23.0 4,803 11.9 11.0 9.9 2.0 0.45 12.7 n/m Uni-President 1216.TW O TWD 54.2 64.0 9,441 26.6 19.3 16.8 3.6 1.23 18.1 46.6
Thailand
AIS ADVANC.BK O THB 205.0 280 17,087 16.9 15.5 14.5 6.9% 13.0 90.1% 232.7% BTS Group Holdings BTS.BK O THB 9.4 12.2 3,144 54.7 42.3 56.7 7.1% 2.3 4.1% 36.9% Thai Union TU.BK O THB 18.5 22.5 2,475 15.5 17.1 13.7 3.6% 1.8 13.1% 63.7% STECON STEC.BK O THB 24.6 30 1,052 24.7 29.2 24.1 1.9% 3.9 16.0% Net cash C.P. ALL CPALL.BK O THB 48.5 60 12,214 44.6 31.7 25.4 2.8% 10.0 39.2% 358.8%
Vietnam
Vinamilk VNM.HM O VND 125,000 140,000 19.7 17.5 3.3 5.7 32.6
Vingroup VIC.HM O VND 43,400 52,000 23.9 12.2 - 2.2 17.8
Masan Group MSN.HM N VND 70,500 80,000 29.0 21.9 - 1.9 12.3
Note: Priced as of 25 November 2015. Source: Company data, Thomson Reuters, Credit Suisse estimates
Figure 7: Best relative Underperformers—by country (picked by our country strategists)
Mkt Yield P/B ROE Net debt/
Target cap P/E (x) (%) (x) (%) equity (x)
Company RIC Rating Curr. Price price (mn) FY14A FY15E FY16E FY16E FY16E FY16E FY16E
Australia
Brambles ord BXB.AX U AUD 10.8 8.7 12,361 21.0 21.0 20.1 2.6% 4.2 20.8% 97.1%
Medibank private ord MPL.AX U AUD 2.3 2.2 4,512 24.1 21.3 20.6 3.6% 4.2 20.3% Net cash
India
Bharti Airtel BRTI.BO U INR 341 285 20,527 26 21 21 0.9% 2 9% 1.1
SBI SBI.BO N INR 242 247 28,210 14 11 9 2.4% 1 13% n.m.
Indonesia
Bank Central Asia BBCA.JK U IDR 13,500 11,500 24,322 20.1 19.3 18.7 1.2% 3.2 17.2% Net cash
Ace ACES.JK N IDR 790 600 990 24.4 23.9 21.9 1.6% 4.3 19.7% Net cash
Korea
LG Display 034220.KS N W 24,900 25,600 7,794 9.9 7.9 10.6 2.0 0.7 6.5 3.0
Malaysia
CIMB CIMB MK U MYR 4.60 4.06 39,225 12.0 11.9 9.9 4.4% 0.9 9.3% (1.2)
Msia Airports MAHB MK U MYR 5.21 4.80 8,644 27.8 42.8 29.7 1.4% 1.2 4.0% 0.4
Philippines
Manila Water MWC.PS U PHP 24.8 19.9 1,062 9.2 9.7 9.8 3.3% 1.2 12.6% 60.6%
Singapore
StarHub STAR.SI U SGD 3.68 3.10 4,531 17.1 16.5 17.5 5.4 30.7 183.2 119.4
SUNT SUNT.SI U SGD 1.53 1.54 2,743 16.6 14.3 13.6 6.4 0.7 5.2 55.5
M1 MONE.SI U SGD 2.85 2.35 1,901 15.1 14.9 15.4 6.5 6.7 43.6 75.8
Taiwan
HTC 2498.TW U TWD 85.3 57.0 2,175 48.0 -5.0 215.6 0.1 1.94 0.5 -65.9
Thailand
True Corp TRUE.BK U THB 8.5 3.3 5,864 106.7 53.2 524.4 0.0% 2.8 0.5% 96.2%
Note: Priced as of 25 November 2015. Source: Company data, Thomson Reuters, Credit Suisse estimates

01 December 2015
Asia Pacific Equity Strategy 6
Figure 8: Best Outperform ideas—by sector (picked by our sector heads) Mkt Yield P/B ROE Net debt/
Target cap P/E (x) (%) (x) (%) equity (x)
Company RIC Rating Curr. Price price (mn) FY14A FY15E FY16E FY16E FY16E FY16E FY16E
Autos and Components
Geely 0175.HK O HKD 4.2 5.7 4,770 21.3 10.5 7.4 1.6% 1.3 17.5% Net cash Tata Motors* TAMO.BO O INR 401.1 490 17,449 9.2 11.3 8.3 0.6% 1.5 18.0% 50.6% Maruti Suzuki* MRTI.BO O INR 4,640.5 5,200 21,125 37.8 24.6 17.1 1.1% 4.1 23.8% Net cash Mobis 012330.KS O KRW 247,000 280,000 21,032 7.0 7.7 7.0 2.0% 0.8 11.8% Net cash Astra International ASII.JK O IDR 6175 7,600 18,267 12.8 14.5 12.4 4.1% 2.3 18.6% 40.4%
Banks
HDFC Bank HDBK.BO O INR 1,063.9 1,360 40,414 30.1 25.2 21.5 1.0% 3.7 17.4% Net cash IndusInd Bank INBK.BO O INR 919.6 1,080 8,216 34.2 27.0 21.2 0.8% 3.2 14.1% Net cash SKS SKSM.BO O INR 427.4 520 817 66.0 28.6 20.0 0.0% 4.1 20.5% Net cash SFG 055550.KS O KRW 42,300 60,000 17,546 10.2 9.3 8.2 3.2% 0.6 7.6% Net cash
Basic Materials
Conch 0914.HK O HK$ 21.95 30.00 14,913 8.7 12.5 13.9 3.8 1.3 9.6 4.2 Lee&Man 2314.HK O HK$ 4.62 6.60 2,782 11.4 9.8 8.5 8.5 1.0 12.8 52.9 POSCO 005490.KS O W 171,000 240,000 11,922 21.8 n.a. 9.0 4.7 0.3 3.6 45.5
Chemicals and Oil Refining/Marketing
Lotte Chemical 011170.KS O W 246,500 410,000 7,364 7.2 6.3 1.0 1.0 16.2 15.0 Formosa Plastics 1301.TW O NT$ 76.5 94.0 14,998 16.4 16.3 3.1 2.0 12.9 5.8 Mitsubishi Chem Hldg 4188 O ¥ 830 1,030 9,975 20.0 16.4 1.7 1.2 7.5 71.9
Consumer
JD.com JD.OQ O USD 30 40 41,482 2.2* 1.5* 1.0* 0.0% 6.9 1.1% Net cash Hindustan Unilever HLL.BO O INR 811 920 26,459 45.4 40.7 40.2 1.9% 41.3 102.7% Net cash Amorepacific 090430.KS O KRW 408,500 440,000 20,889 63.0 39.9 30.1 0.3% 5.7 19.0% Net cash Indofood CBP ICBP.JK O IDR 12,600 15,100 5,369 28.2 22.2 18.3 2.2% 4.0 21.8% Net cash
Environment
Dongjiang 0895.HK O HK$ 13.0 23.0 2,615 36.4 28.5 19.0 1.1 3.0 16.7 73.4 BEW 0371.HK O HK$ 6.1 8.0 6,899 29.5 23.7 18.9 2.0 2.8 15.6 115.4 CEI 0257.HK O HK$ 11.8 18.5 6,838 31.1 22.0 15.2 1.9 2.5 17.8 32.8 SIIC SIIC.SI O S$ 0.78 1.50 1,229 24.6 19.3 12.6 0 1.4 11.6 32.0
Gaming
Galaxy 0027.HK O HKD 23.6 37.6 12,967 9.8 21.5 14.0 2.2% 2.2 16.2% Net cash MGM China 2282.HK O HKD 10.3 20 5,031 6.8 11.6 12.1 5.0% 4.3 35.9% 124.5% Kangwon Land 035250.KS O KRW 37,750 54,000 7,065 21.3 17.4 15.2 3.2% 2.6 16.1% Net cash Bloomberry BLOOM.PS O PHP 5.32 8.3 1,247 13.9 -35.8 39.0 1.0% 2.3 5.9% 82.6% Genting Singapore GENS.SI O SGD 0.775 1 6,669 20.6 32.5 22.7 1.3% 1.2 5.4% Net cash Genting Bhd GENT.KL O MYR 7.3 10.3 6,514 18.2 17.2 14.1 0.7% 0.9 6.6% Net cash
Industrials
Goldwind 2208.HK O HKD 13.3 26.3 6.5 17.0 9.6 8.4 5.9 1.6 19.5 35.8 Singapore Air SIAL.SI O SGD 10.47 14.00 8.9 36.3 14.6 12.0 5.0 0.9 8.0 Net cash Voltas VOLT.BO O INR 283.20 345.00 1.4 41.9 27.7 26.9 0.9 4.0 15.6 Net cash Hyundai Mipo 010620.KS O KRW 63,800 90,100 1.1 -2.0 19.1 14.7 0.0 0.7 4.6 125.6 Hyundai Dev 012630.KS O KRW 41,850 70,000 2.7 44.7 12.8 10.0 1.2 1.2 12.2 19.3
Insurance
AMP ORD AMP.AX N AUD 5.7 6.35 12,135 17.5 16.2 15.6 5.1% 2.0 11.9% 145.1% AIA Group 1299.HK O HKD 47.7 57.5 74,075 21.5 21.6 16.8 1.5% 2.1 12.4% 5.1% PICC P&C 2328.HK O HKD 17.3 21.5 33,100 13.4 9.3 10.8 2.3% 1.7 16.0% Net cash
Oil & Gas
CNOOC 0883.HK O HKD 8.75 10.70 50,505 5.4 15.6 12.0 3.3% 0.86 7.2% 21% Reliance Industries RELI.BO O INR 968 1,040 47,183 13.9 13.3 13.1 1.5% 1.32 10.1% 50% PTT PTT.BK O THB 270 321 21,596 13.8 26.3 9.0 4.4% 1.02 11.3% 28%
Technology
Alibaba BABA O USD 81.71 98.00 205,290 37.5 31.9 24.7 0.0 4.9 19.8 (50.7) Baidu Inc BIDU O USD 201.80 210.00 70,934 32.1 37.8 30.9 0.0 5.6 18.2 (73.2) Lenovo Group Ltd 0992.HK O HKD 8.64 11.00 12,384 14.5 (33.4) 10.8 1.9 3.5 32.4 (5.2) Samsung Electronics 005930.KS O KRW 1,299,000 1,785,000 167,372 8.2 8.6 7.1 2.3 0.9 12.1 (6.1) Siliconware Precision 2325.TW O TWD 45.00 52.00 4,315 12.0 12.2 11.7 6.4 1.9 16.1 3.0 Tech Mahindra Limited TEML.BO O INR 537.55 700.00 7,830 20.1 17.4 13.9 1.7 3.0 21.9 (27.8)
Telecoms
Link Net LINK.JK O IDR 3,750 8,450 834 20.4 17.5 11.8 1.7% 2.6 21.7% Net cash China Telecom 0728.HK O HKD 3.9 7.93 40,517 14.6 15.5 11.2 3.6% 0.8 7.4% 36.2% DTAC DTAC.BK O THB 49.0 93 3,253 10.8 19.1 14.9 6.7% 3.6 23.8% 169.1% XL Axiata EXCL.JK O IDR 3,770 5,150 2,351 -35.8 228.2 17.5 3.1% 2.2 12.4% 151.7%
Transportation
JAL 9201.T O JPY 4,371 6,800 12,914 4.6 9.9 8.9 2.8% 1.7 19.5% Net cash AirAsia AIRA.KL O MYR 1.4 1.9 925 7.8 5.0 5.4 3.1% 0.9 16.1% 226.3% SIA SIAL.SI O SGD 10.6 14 9,071 43.3 36.9 14.8 4.3% 1.0 6.7% Net cash

01 December 2015
Asia Pacific Equity Strategy 7
Mkt Yield P/B ROE Net debt/
Target cap P/E (x) (%) (x) (%) equity (x)
Company RIC Rating Curr. Price price (mn) FY14A FY15E FY16E FY16E FY16E FY16E FY16E
Utilities and renewable energy
HNR 0958.HK O HKD 2.3 4.4 2,925 15.5 9.7 6.9 2.9% 0.9 13.7% 309.4% NTPC NTPC.BO O INR 131.2 160 16,296 11.3 12.4 11.9 4.4% 1.3 10.6% 133.4% KEPCO 015760.KS O KRW 49,100 64,000 27,572 6.5 2.6 6.3 2.0% 0.4 7.1% 73.2% EDC EDC.PS O PHP 6.28 9.8 2,506 13.3 12.6 10.1 3.5% 2.1 20.7% 75.0%
Note: Priced as of 25 November 2015. Source: Company data, Thomson Reuters, Credit Suisse estimates
Figure 9: Best relative Underperformers—by sector (picked by our sector heads) Mkt Yield P/B ROE Net debt/
Target cap P/E (x) (%) (x) (%) equity (x)
Company RIC Rating Curr. Price price (mn) FY14A FY15E FY16E FY16E FY16E FY16E FY16E
Autos and Components
Weichai Power (H) 2338.HK U HKD 8.3 6 5,929 5.5 16.3 11.2 4.5% 0.8 7.1% Net cash
Banks
SBI SBI.BO N INR 241.5 247 28,251 15.6 13.8 11.3 1.9% 1.3 10.9% Net cash Maybank MBBM.KL U MYR 8.4 6.8 19,491 11.7 12.7 13.1 5.8% 1.4 10.4% Net cash
Basic Materials
Yanzhou 1171.HK U HK$ 3.63 3.00 2,289 19.2 n.a. n.a. n.a. 0.4 -5.6 135.6 Tata TISC.BO U RS 224.35 180.00 3,320 6.1 n.a. 8.8 3.6 0.7 7.8 238.1
Chemicals and Oil Refining/Marketing
FCFC 1326.TW N NT$ 73.8 76.0 13,322 17.2 16.5 2.9 2.0 12.8 9.2 FPCC 6505.TW N NT$ 77.7 84.0 22,795 17.3 20.9 4.0 2.6 12.7 30.0
Consumer
Sa Sa 0178.HK U HKD 2.81 1.75 1,031 8.6 9.5 18.2 6.4% 3.5 19.8% Net cash Siam Global GLOBAL.BK U THB 10.8 8.8 1,055 53.6 39.6 31.8 0.2% 3.2 10.0% 22.4%
Environment
BJC 600008.SS U Rmb 11.1 8.7 4,203 40.2 38.7 34.1 1.7 3.0 8.9 127.0
Industrials
SEG 2727.HK U HKD 4.81 2.20 19.2 21.0 28.9 25.5 1.2 1.2 4.9 Net cash Evergreen 2603.TW U TWD 13.05 13.00 1.4 -30.9 -21.6 22.9 1.3 0.8 3.6 58.0 BHEL BHEL.BO U INR 173.35 155.00 6.4 29.9 21.2 16.4 1.3 1.1 7.1 Net cash
Insurance
Bangkok Life BLA.BK U THB 54.25 39.25 2,591 34.5 25.3 19.6 1.1% 2.9 15.1% n.a. MEDIBANK PRIVATE ORD MPL.AX U AUD 2.26 2.2 4,512 24.1 21.3 20.6 3.6% 4.2 20.3% Net cash
Oil & Gas
Anton Oil 3337.HK U HKD 0.98 0.80 280 -9.0 -11.2 -12.4 - 1.02 -8.2% 100% Sinopec SSC - H 1033.HK U HKD 2.30 1.90 18,531 11.9 -11.6 -51.0 - 1.22 -2.4% 45%
Technology
LG Electronics Inc 066570.KS N KRW 56,100 46,200 8,031 13.5 23.0 18.4 0.8 0.7 3.6 51.0 MediaTek Inc. 2454.TW N TWD 262.50 250.00 14,480 8.8 14.8 16.7 4.9 1.6 9.7 (63.3) Pegatron 4938.TW N TWD 84.60 93.00 6,776 13.6 9.0 9.0 6.8 1.4 15.6 (36.7) Quanta Computer 2382.TW U TWD 52.00 46.00 6,180 10.6 11.6 11.2 6.7 1.7 14.8 (10.4)
Telecoms
True Corp TRUE.BK U THB 8.5 3.3 5,864 106.7 53.2 524.4 0.0% 2.8 0.5% 96.2% Idea Cellular IDEA.BO U INR 139.9 115 7,587 23.6 15.7 17.2 0.7% 2.0 11.4% 160.1%
Transportation
EMC 2603.TW U TWD 12.6 13.0 1,363 -29.8 -20.9 22.1 1.3% 0.8 3.5% 58.0% Westports WPHB.KL U MYR 4.25 3.75 3,441 28.3 29.4 23.5 3.2% 7.1 30.3% 38.7%
Utilities and renewable energy
CLP 0002.HK U HKD 66 62 21,515 14.9 15.6 15.3 4.2% 1.7 11.4% 63.0% EA EAm.BK U THB 24.4 20 2,551 56.6 33.5 19.1 0.2% 6.9 36.4% 99.2%
Source: Company data, Thomson Reuters, Credit Suisse estimates

01 December 2015
Asia Pacific Equity Strategy 8
2016 Outlook: A year of positive returns?
Three reasons why 2016 could be a year of positive returns. With MSCI Asia ex-Japan
up just 1% in 2014 and down 10% in 2015, we highlight three reasons why 2016 could be
a year of positive returns.
One, Figure 1 highlights that while MSCI Asia ex-Japan has historically corrected in the
run-up to the first Fed tightening in 1994 and 2004 and during the 2013 Fed taper, MXASJ
has historically rallied in the six months after.
Two, Figure 2 highlights that MXASJ P/B has dropped to 1.37x. This is the lowest P/B start
since 2008-09.
Three, MXASJ ROE appears to be bottoming at 11%.
Key risks to our call. With the Fed tightening against a weaker macro backdrop globally
and particularly so in China and 2004 (the episode with the 37% return for MXASJ)
associated with NJA ROE rising from 10% to 15%, the key question is whether these
differences are big enough to negate history. The other risk is whether global policy
divergences (Fed tightening versus ECB and BOJ easing) mean the DXY does not fall as
it did in prior episodes. We believe a modest 10% return though is still likely.
Overweight Cheapest 4. While past performance is not necessarily a good guide to the
future, the Cheapest 4 outperformed the Expensive 4 by 7% YTD in 2015. We continue to
Overweight the Cheapest 4 which are Korea, MSCI China, Taiwan and Singapore. We
also continue to Underweight the Expensive 4, which are the Philippines, India, Indonesia
and Malaysia.
History suggests MXASJ rallies after the first Fed
tightening
While history is not always a good guide to the future, the performance of MXASJ in the
current episode in the lead-up to the first Fed tightening (which we expect in December
2015) appears to suggest history is repeating itself. Figure 1 highlights that MXASJ has
corrected by 20% in the current episode. The 20% correction from the highs is fairly similar
to the corrections ranging from 14% at the Fed taper episode to 21% in the 2004 Fed
tightening and to 25% in the 1994 Fed tightening.
Figure 10: MSCI World performance around Fed tightening
85
90
95
100
105
110
115
120
125
130
135
-9m -6m -3m 0m +3m +6m +9m +12m
Feb-94 Jun-04 May-13 current
MXWD
-8.2%
-8.7%
-8.8%-8%
+17%
+9%
+18%
Source: MSCI. We are assuming Dec 2015 is the first Fed rate hike.
Three reasons why 2016
could be a year of positive
returns for MSCI Asia ex-
Japan
History suggests MXASJ
rallies after the first Fed
tightening
For MSCI World, corrections
are smaller (than MXASJ) in
the run-up to Fed tightening,
and rallies after the first Fed
tightening are also smaller

01 December 2015
Asia Pacific Equity Strategy 9
Figure 1 also highlights that MXASJ bottomed one month prior to the start of Fed
tightening in the 2004 episode versus one month after the start in the 1994 and 2013
episodes. The rally in MXASJ from those lows to the six months after the first Fed
tightening ranged from 15% in the 2013 episode to 22% in the 1994 episode to 37% in the
2004 episode.
For MSCI World, Figure 6 highlights that the corrections are much smaller than for MXASJ
at around 8% to 9%. Similarly, the rally from the lows to the highs about six months later
also seems to be smaller at between 9% and 18%.
We believe history is supported by valuations, with MXASJ P/B dropping to 1.37x in the
current episode. Figure 7 highlights that the current 1.37x P/B is lower than the lows of
1.47x in the 2013 episode, 1.62x in the 2004 episode and 2.13x in the 1994 episode.
Figure 11: MSCI Asia ex-Japan price-to-book around Fed tightening
1.0
1.5
2.0
2.5
3.0
-9m -6m -3m 0m +3m +6m +9m +12m
Feb-94 Jun-04 May-13 current
MXASJ - Trailing PB
1.37x nowLow 1.47x
Low 1.62x
Low 2.13x
Source: MSCI. We are assuming Dec 2015 is the first Fed rate hike.
For MSCI World, Figure 8 highlights that the current P/B of 2.07x is right in the middle of
the range of previous Fed tightening episodes.
Figure 12: MSCI World price-to-book around Fed tightening
1.6
1.8
2.0
2.2
2.4
2.6
-9m -6m -3m 0m +3m +6m +9m +12m
Feb-94 Jun-04 May-13 current
MXWD - Trailing PB
2.07x now
Low 2.32x
Low 2.03x
Low 1.85x
Source: MSCI. We are assuming Dec 2015 is the first Fed rate hike.
We believe history is
supported by valuations with
MXASJ P/B of 1.37x below
the lows seen at the start of
previous rallies
For MSCI World, the current
P/B of 2.07x is right in the
middle of the range seen
during previous Fed
tightening episodes
01 December 2015
Asia Pacific Equity Strategy 10
The current 2.07x P/ B is similar to the lows of 2.03x seen in the 1994 episode, but higher
than the 1.85x seen during the Fed taper episode of 2013.
Apart from valuations, another potentially supportive factor for a rally is the fact that the
pace of Fed tightening in 2016 is likely to be somewhat slower and smaller than that seen
in either 1994 and 2004.
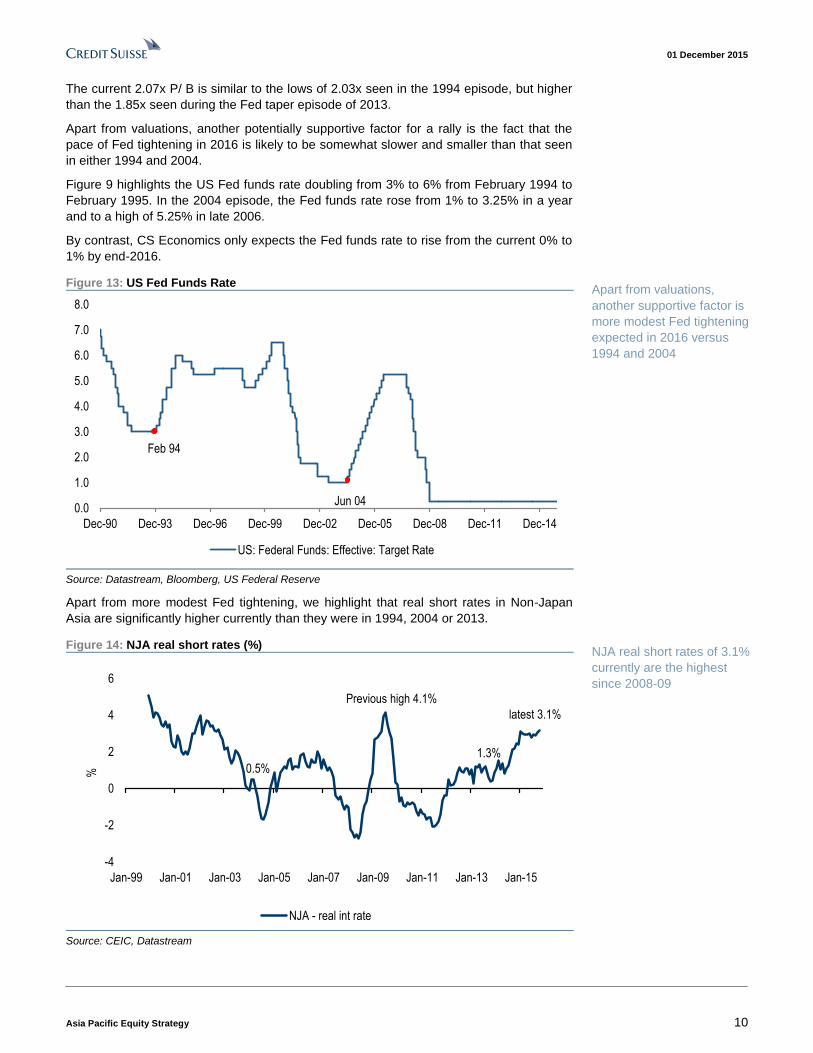
Figure 9 highlights the US Fed funds rate doubling from 3% to 6% from February 1994 to
February 1995. In the 2004 episode, the Fed funds rate rose from 1% to 3.25% in a year
and to a high of 5.25% in late 2006.
By contrast, CS Economics only expects the Fed funds rate to rise from the current 0% to
1% by end-2016.
Figure 13: US Fed Funds Rate
0.0
1.0
2.0
3.0
4.0
5.0
6.0
7.0
8.0
Dec-90 Dec-93 Dec-96 Dec-99 Dec-02 Dec-05 Dec-08 Dec-11 Dec-14
US: Federal Funds: Effective: Target Rate
Feb 94
Jun 04
Source: Datastream, Bloomberg, US Federal Reserve
Apart from more modest Fed tightening, we highlight that real short rates in Non-Japan
Asia are significantly higher currently than they were in 1994, 2004 or 2013.
Figure 14: NJA real short rates (%)
-4
-2
0
2
4
6
Jan-99 Jan-01 Jan-03 Jan-05 Jan-07 Jan-09 Jan-11 Jan-13 Jan-15
%
NJA - real int rate
latest 3.1%
Previous high 4.1%
1.3%
0.5%
Source: CEIC, Datastream
Apart from valuations,
another supportive factor is
more modest Fed tightening
expected in 2016 versus
1994 and 2004
NJA real short rates of 3.1%
currently are the highest
since 2008-09

01 December 2015
Asia Pacific Equity Strategy 11
So we do not expect Asian economies to follow the Fed in tightening. We think the bias
still remains for countries to ease, particularly if forex pressures eases.
Figure 10 highlights that real short rates in NJA (weighted by GDP) are currently 3.1%.
These are the highest real short rates since 2008-09. The current 3.1% compares
favourably with 1.3% in 2013 and just 0.5% in 2004. We use real short rates as a rough
proxy for the stance of monetary policy with higher real short rates suggesting more room
for central banks to cut rates. While India continues to have the highest real short rates if
rates are deflated by the WPI (Wholesale Price Index), China's RRR of 17% still provides
the PBOC with plenty of room to ease policy.
Figure 15: US Fed Funds Rate versus US real GDP growth (YoY %)
-4.0
-3.0
-2.0
-1.0
0.0
1.0
2.0
3.0
4.0
5.0
6.0
0.0
1.0
2.0
3.0
4.0
5.0
6.0
7.0
Dec-93 Dec-96 Dec-99 Dec-02 Dec-05 Dec-08 Dec-11 Dec-14
Rea
l GD
P Y
oY%
Fed
fund
s ta
rget
rat
e (%
)
US: Federal Funds: Effective: Target Rate US Real GDP YoY%
4% in 1994
3.8% in 2004
2.2% in 2013
2.6% in 20152.8% in 2016
Source: Consensus Economics, CEIC, Datastream, Bloomberg, US Federal Reserve
While lower price-to-book coupled with significantly higher real short rates in NJA support
our case for a rally in MXASJ once the Fed tightens, there are some differences that may
be considered more negative for Asian returns.
Figure 16: US Fed funds rate versus China real GDP growth (YoY %)
6.0
7.0
8.0
9.0
10.0
11.0
12.0
13.0
14.0
15.0
0.0
1.0
2.0
3.0
4.0
5.0
6.0
7.0
Dec-93 Dec-96 Dec-99 Dec-02 Dec-05 Dec-08 Dec-11 Dec-14
Rea
l GD
P Y
oY%
Fed
fund
s ta
rget
rat
e (%
)
US: Federal Funds: Effective: Target Rate China Real GDP YoY%
6.8% in 20156.5% in 2016
7.7% in 2013
10.1% in 2004
13.1% in 1994
Source: Consensus Economics, CEIC, Datastream, Bloomberg, US Federal Reserve
In the past Fed tightening
cycles, US real GDP growth
was stronger than is
expected in 2016E
China's real GDP growth in
2016E much weaker than
1994 and 2004

01 December 2015
Asia Pacific Equity Strategy 12
In past cycles when the Fed was tightening, US and global growth was significantly
stronger and this provided a lot of impetus to Asian exports, growth and ROE more
generally. Figure 11 highlights that US real GDP grew by 4% in 1994 and 3.8% in 2004
when the Fed was tightening back then. This compares with a less robust 2.8% growth
expected in 2016E.
More so than US real GDP growth, Figure 12 highlights the much weaker macro backdrop
from China. Consensus Economics expects China's real GDP growth to be only 6.5% in
2016E versus 7.7% in 2013, 10.1% in 2004 and 13.1% in 1994. As a result of this global
growth divergence, CS Economics expects the ECB and the BOJ as being likely to ease
further rather than following the Fed in tightening as in previous cycles. Please see 2016
Global Outlook report of 12 November for more details. The question then is whether we
are likely to see falls in the DXY (trade-weighted US dollar) as occurred in 1994, 2004 and
2013 after the first Fed tightening, given this policy divergence.
Figure 17: DXY (trade-weighted US dollar) around Fed tightening
85
90
95
100
105
110
-9m -6m -3m 0m +3m +6m +9m +12m
Feb-94 Jun-04 May-13 current
DXY Index
11% fall in 1994
6% fall in 2013
12% fall in 2004
Source: Bloomberg, Datastream
Figure 13 highlights the 6% to 12% falls in the DXY following the first Fed tightening in 1994,
2004 and 2013, which were about 30% to 40% of the return from MXASJ during the rallies.
Figure 18: NJA ROE around Fed tightening
8
9
10
11
12
13
14
15
16
-9m -6m -3m 0m +3m +6m +9m +12m
Feb-94 Jun-04 May-13 current
Asia ex-JP - ROE (%)
11%
Source: Company data, Credit Suisse estimates. We are assuming Dec 2015 is the first Fed rate hike.
Historically, the DXY has
fallen after the Fed first
tightens; the question is
whether this time is different
NJA ROE in 2004 very
different to current episode
rising from a low of 10% to a
high of nearly 15%
But current ROE is similar to
2013 and above 1994

01 December 2015
Asia Pacific Equity Strategy 13
We do emphasise though that NJA is more of a commodity importer (with only Malaysia and
Indonesia being exceptions) and that weaker commodity prices, which may follow DXY
strength (if this time is different) actually benefit NJA, compared with Latin America or EMEA.
The next question for investors is whether given the weaker Asia, and particularly China
backdrop, Asian ROEs are lower today than they were in 1994, 2004 and 2013. Figure 14
highlights that only in 2004 was there a significant difference in ROE with NJA ROE rising
from a low of 10% to a high of nearly 15%. In 2013, NJA ROE was around 12.2% when
the Fed started its taper and ROE slowed marginally to 11.8% in the 12 months after. In
the 1994 episode, NJA ROE was lower at around 9% when the Fed started to tighten.
At the country level, it appears that markets that corrected less in the run-up to Fed
tightening like Japan and Taiwan have historically had smaller rallies thereafter and vice
versa. But Figure 18 highlights some differences in the current episode versus prior
episodes such as Taiwan's ROE being significantly higher currently than it was in the prior
three Fed tightening episodes.
Figure 19: MSCI Japan around Fed tightening Figure 20: MSCI Japan P/B around Fed tightening
80
90
100
110
120
130
140
-9m -6m -3m 0m +3m +6m +9m +12m
Feb-94 Jun-04 May-13 current
MSCI Japan
-24.5%
-5.7%
-18.6% -12%
+36.6%
+24%
+15%
0.8
1.0
1.2
1.4
1.6
1.8
2.0
2.2
2.4
2.6
-9m -6m -3m 0m +3m +6m +9m +12m
Feb-94 Jun-04 May-13 current
MSCI Japan - Trailing PB
1.38x now
1.88x
1.65x
1.23x
Source: MSCI. We are assuming Dec 2015 is the first Fed rate hike. Source: MSCI. We are assuming Dec 2015 is the first Fed rate hike.
Figure 21: MSCI Taiwan around Fed tightening Figure 22: Taiwan ROE around Fed tightening
70
90
110
130
150
170
190
-9m -6m -3m 0m +3m +6m +9m +12m
Feb-94 Jun-04 May-13 current
MSCI Taiwan
-20%
-11%
-27%-21.5%
+40%
+19%
+11%
4
6
8
10
12
14
16
18
-9m -6m -3m 0m +3m +6m +9m +12m
Feb-94 Jun-04 May-13 current
Taiwan - ROE (%)
14.4% now
Source: MSCI. We are assuming Dec 2015 is the first Fed rate hike. Source: Company data, Credit Suisse estimates. We are assuming
Dec 2015 is the first Fed rate hike.
Conversely, markets that corrected significantly in the run-up to Fed tightening—like India
and Indonesia—appeared to be associated with stronger rallies post the first Fed
tightening. But Figures 20 and 22 highlight significant differences though between the
current episode and the three others particularly in terms of ROE. For Indonesia ROE, the
current ROE is the second lowest ROE of the four and the episode, which had lower ROE
was associated with a sharp rise in ROE. Similarly, with India, ROE currently is close to
the lowest of the four episodes.
Countries that corrected
less in the run-up to Fed
tightening appeared to have
smaller rallies post the first
Fed tightening

01 December 2015
Asia Pacific Equity Strategy 14
Figure 23: MSCI Indonesia around Fed tightening Figure 24: Indonesia ROE around Fed tightening
60
80
100
120
140
160
180
200
-9m -6m -3m 0m +3m +6m +9m +12m
Feb-94 Jun-04 May-13 current
MSCI Indonesia
-29.5%
-24%
-35%-23%
+20.7%
+27%
+61%
8
10
12
14
16
18
20
22
24
26
28
-9m -6m -3m 0m +3m +6m +9m +12m
Feb-94 Jun-04 May-13 current
Indonesia - ROE (%)
18.2% now
Source: MSCI. We are assuming Dec 2015 is the first Fed rate hike. Source: Company data, Credit Suisse estimates.
Figure 25: MSCI India around Fed tightening Figure 26: India ROE around Fed tightening
70
90
110
130
150
170
190
210
230
-9m -6m -3m 0m +3m +6m +9m +12m
Feb-94 Jun-04 May-13 current
MSCI India
-15.6%
-27%
-29%-18%
+23.3%
+57%
+52%
8
10
12
14
16
18
20
22
24
-9m -6m -3m 0m +3m +6m +9m +12m
Feb-94 Jun-04 May-13 current
India - ROE (%)
14.1% now
Source: MSCI. We are assuming Dec 2015 is the first Fed rate hike. Source: Company data, Credit Suisse estimates.
MXASJ P/B of 1.37x, lowest start since 2008-09
Figure 23 highlights that MXASJ price-to-book has dropped to 1.37x. This is the lowest
start since 2008-09.
Figure 27: MSCI Asia ex-Japan price-to-book
0.5
1.0
1.5
2.0
2.5
3.0
Dec-95 Dec-97 Dec-99 Dec-01 Dec-03 Dec-05 Dec-07 Dec-09 Dec-11 Dec-13 Dec-15
Asia ex-JP - Trailing PB
1.37x now
1.23x in Feb 091.19x in Sep 01
0.94x in Aug 98
1.47x in Jan 141.22x in
Mar 031.28x on
24 Aug
Source: MSCI
If we look at the price-to-book on 31 December in prior years, the current 1.37x compares
favourably with 1.50x in 2014, 1.54x in 2013, 1.63x in 2012, 1.55x in 2011, 2.11x in 2010,
2.1x in 2009 and 1.31x in 2008.
MXASJ P/B of 1.37x is just
10% above GFC lows of
1.23x

01 December 2015
Asia Pacific Equity Strategy 15
The current P/B of 1.37x is about 10% higher than the 1.23x seen at the lows in 2008-09.
Except for 1997-98, P/B at the last three lows was around 1.2x book with 1.19x in the
2001 global recession, 1.22x in the 2003 SARS episode and 1.23x in the 2008-09 GFC.
As we have highlighted previously, we do believe the current episode is very different to
1997-98 with much lower corporate net debt to equity, with forex reserves exceeding
short-term external debt, overall NJA running a current account surplus, lower capex-to-
sales and ROE currently of 11% versus just 1.7% at the 1997-98 lows.
NJA's ROE appears to be bottoming at 11%
As we have highlighted previously, a key driver of NJA's underperformance over the past
five years has been its slowing ROE. Figure 24 highlights that NJA ROE has slowed from
a high of 14% in late 2010 to 11% currently.
Figure 28: Asia ex-Japan ROE
10%
11%
12%
13%
14%
Dec-09 Dec-10 Dec-11 Dec-12 Dec-13 Dec-14 Dec-15
Asia ex Japan ROE
High 14% Nov 2010
11.0%11.3% Dec 2014
Source: Company data, Credit Suisse estimates
This slowing in NJA ROE has occurred during a period when Japan's ROE has risen from
a low of 3.4% in March 2012 to 8.4% currently.
Figure 29: Japan ROE
-4%
-2%
0%
2%
4%
6%
8%
10%
Dec-09 Dec-10 Dec-11 Dec-12 Dec-13 Dec-14 Dec-15
MSCI Japan ROE
8.4%
3.4%
Source: MSCI
NJA ROE has slowed over
the past five years from 14%
in late 2010 to 11%
currently; this, in our view,
has been a key driver of
NJA's underperformance
Particularly as NJA ROE
slowed while Japan's ROE
rose

01 December 2015
Asia Pacific Equity Strategy 16
While Japan's ROE rose, US ROE remained steady at a very high 14%. While this
explains nearly five years of underperformance, the question now for investors is whether
NJA's ROE is finally bottoming.
Figure 30: US ROE
7%
8%
9%
10%
11%
12%
13%
14%
15%
16%
Dec-09 Dec-10 Dec-11 Dec-12 Dec-13 Dec-14 Dec-15
MSCI USA ROE
13.8%
Source: MSCI
If we look at the ROE data, ROE has been between 11% and 11.3% for NJA over much of
the past year. We believe our view that ROE is bottoming is also supported by the fact that
Korea's ROE has risen from a low of 7.9% in December 2014 to 9.5% currently. While
Korea's ROE has been rising over much of the past year, the key question is how
sustainable is the pick-up.
Figure 31: Korea ROE
4%
6%
8%
10%
12%
14%
16%
18%
Dec-00 Dec-02 Dec-04 Dec-06 Dec-08 Dec-10 Dec-12 Dec-14
Korea - ROE
9.5% now
low 7.9%in Dec 14
low 7.6% in 2009
Source: Company data, Credit Suisse estimates
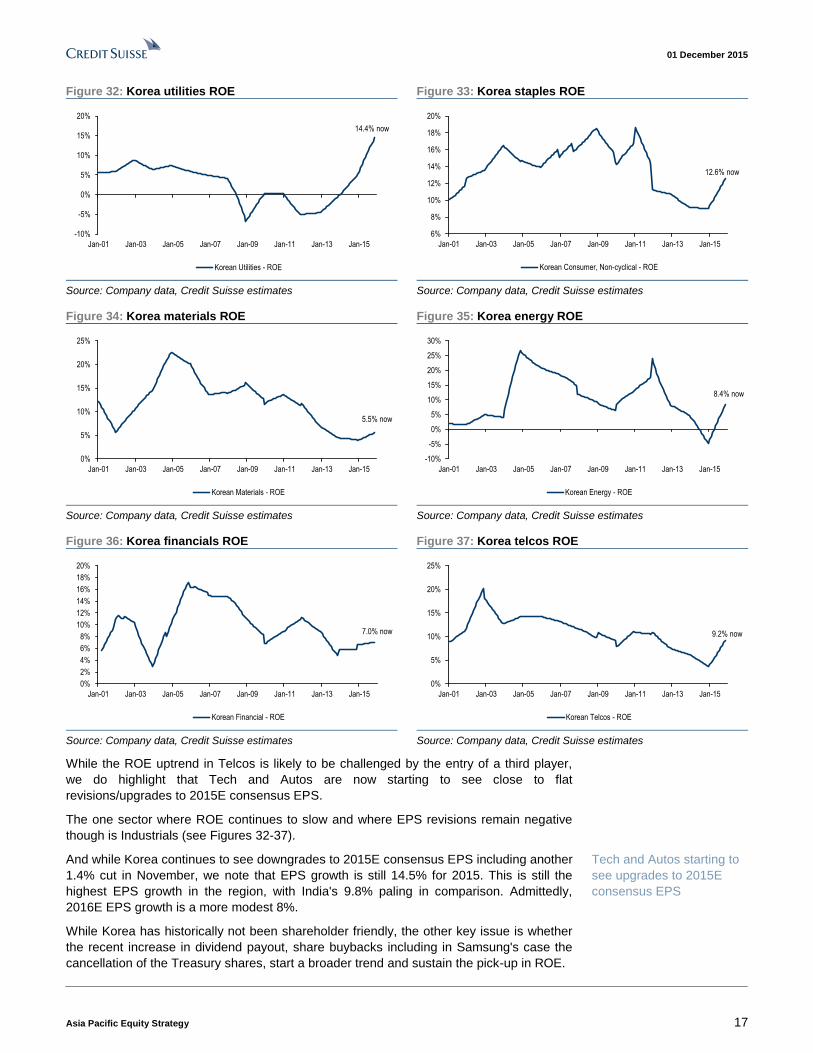
We believe this is sustainable as six of the nine sectors in Korea are associated with rising
ROE. These six sectors are Utilities, Consumer Staples, Materials, Financials, Energy and
Telcos.
NJA's ROE slowed while US
ROE remained stable at a
high 14% plus
Key question now is
whether NJA's ROE is
bottoming supported by the
rise in Korea's ROE
Figure 27 shows Korea's
ROE rising from a low of
7.9% in Dec 2014 to 9.5%
currently
Six of nine sectors
associated with rising ROE
in Korea
01 December 2015
Asia Pacific Equity Strategy 17
Figure 32: Korea utilities ROE Figure 33: Korea staples ROE
-10%
-5%
0%
5%
10%
15%
20%
Jan-01 Jan-03 Jan-05 Jan-07 Jan-09 Jan-11 Jan-13 Jan-15
Korean Utilities - ROE
14.4% now
6%
8%
10%
12%
14%
16%
18%
20%
Jan-01 Jan-03 Jan-05 Jan-07 Jan-09 Jan-11 Jan-13 Jan-15
Korean Consumer, Non-cyclical - ROE
12.6% now
Source: Company data, Credit Suisse estimates Source: Company data, Credit Suisse estimates
Figure 34: Korea materials ROE Figure 35: Korea energy ROE
0%
5%
10%
15%
20%
25%
Jan-01 Jan-03 Jan-05 Jan-07 Jan-09 Jan-11 Jan-13 Jan-15
Korean Materials - ROE
5.5% now
-10%
-5%
0%
5%
10%
15%
20%
25%
30%
Jan-01 Jan-03 Jan-05 Jan-07 Jan-09 Jan-11 Jan-13 Jan-15
Korean Energy - ROE
8.4% now
Source: Company data, Credit Suisse estimates Source: Company data, Credit Suisse estimates
Figure 36: Korea financials ROE Figure 37: Korea telcos ROE
0%
2%
4%
6%
8%
10%
12%
14%
16%
18%
20%
Jan-01 Jan-03 Jan-05 Jan-07 Jan-09 Jan-11 Jan-13 Jan-15
Korean Financial - ROE
7.0% now
0%
5%
10%
15%
20%
25%
Jan-01 Jan-03 Jan-05 Jan-07 Jan-09 Jan-11 Jan-13 Jan-15
Korean Telcos - ROE
9.2% now
Source: Company data, Credit Suisse estimates Source: Company data, Credit Suisse estimates
While the ROE uptrend in Telcos is likely to be challenged by the entry of a third player,
we do highlight that Tech and Autos are now starting to see close to flat
revisions/upgrades to 2015E consensus EPS.
The one sector where ROE continues to slow and where EPS revisions remain negative
though is Industrials (see Figures 32-37).
And while Korea continues to see downgrades to 2015E consensus EPS including another
1.4% cut in November, we note that EPS growth is still 14.5% for 2015. This is still the
highest EPS growth in the region, with India's 9.8% paling in comparison. Admittedly,
2016E EPS growth is a more modest 8%.
While Korea has historically not been shareholder friendly, the other key issue is whether
the recent increase in dividend payout, share buybacks including in Samsung's case the
cancellation of the Treasury shares, start a broader trend and sustain the pick-up in ROE.
Tech and Autos starting to
see upgrades to 2015E
consensus EPS

01 December 2015
Asia Pacific Equity Strategy 18
Figure 38: Korea tech ROE Figure 39: Korea consumer cyclicals ROE
-5%
0%
5%
10%
15%
20%
25%
30%
35%
Jan-01 Jan-03 Jan-05 Jan-07 Jan-09 Jan-11 Jan-13 Jan-15
Korean Tech - ROE
12.4% now
0%
2%
4%
6%
8%
10%
12%
14%
16%
Jan-01 Jan-03 Jan-05 Jan-07 Jan-09 Jan-11 Jan-13 Jan-15
Korean Consumer, Cyclical - ROE
10.3% now
Source: Company data, Credit Suisse estimates Source: Company data, Credit Suisse estimates
Figure 40: Korea tech 2015E consensus EPS Figure 41: Kia Motors 2015E consensus EPS
60
65
70
75
80
85
90
95
100
105
Dec-13 Mar-14 Jun-14 Sep-14 Dec-14 Mar-15 Jun-15 Sep-15
Korea Information Technology - EPS 15E
-0.6% in Nov-15
7000
7500
8000
8500
9000
9500
10000
10500
11000
Jan-14 Apr-14 Jul-14 Oct-14 Jan-15 Apr-15 Jul-15 Oct-15
Kia Motors - EPS 2015E
Source: IBES Source: IBES
Apart from the breadth of the ROE recovery, we believe Korea's nominal GDP growth of
4% to 4.5% in 2015-16 (up from a low of 3% in 2012) also supports our view that Korea's
ROE rise is sustainable.
Figure 42: Korea ROE versus Korea Nominal GDP Growth (YoY %)
2%
4%
6%
8%
10%
12%
2%
4%
6%
8%
10%
12%
14%
16%
18%
2000 2002 2004 2006 2008 2010 2012 2014 2016E
Nom
inal
GD
P Y
oY%
RO
E (
non-
finan
cial
s)
Korea - ROE Korea - nominal GDP (YoY%)
4-4.5%
Source: Datastream, Consensus Economics, company data, Credit Suisse estimates
Apart from Korea's nominal GDP growth, we believe Consensus Economics forecast that
US nominal GDP growth will rise from 3.6% in 2015E to 4.5% in 2016E supports our view
on the sustainability of Korea's ROE pick-up.
Korea's nominal GDP
growth of 4-4.5% in 2015-16
is up from lows of 3% in
2012

01 December 2015
Asia Pacific Equity Strategy 19
Figure 43: Korea ROE versus US nominal GDP growth (YoY %)
-3%
-1%
1%
3%
5%
7%
9%
2%
4%
6%
8%
10%
12%
14%
16%
18%
2000 2002 2004 2006 2008 2010 2012 2014 2016E
Nom
inal
GD
P Y
oY%
RO
E (
non-
finan
cial
s)
Korea - ROE US nominal GDP (YoY%)
2015E: 3.6%2016E: 4.5%
Source: Datastream, CS Economics, company data, Credit Suisse estimates
While Korea's ROE bottomed in December 2014, Figure 44 highlights that Taiwan's ROE
was the first to bottom at 9% in December 2012. It has since risen from 9% to 12.4%
currently. But the key concern over Taiwan's ROE is whether it is close to peaking, given
high smartphone penetration and downgrades to 2015E consensus EPS, particularly for
Tech over the last six months.
Figure 44: Taiwan ROE
7%
8%
9%
10%
11%
12%
13%
14%
15%
Dec-09 Dec-10 Dec-11 Dec-12 Dec-13 Dec-14 Dec-15
Taiwan - ROE
High 14% Dec 2010
Low 9% Dec 2012
12.4% now
Source: Company data, Credit Suisse estimates
As with Korea, we believe drivers of Taiwan's ROE are Taiwan's nominal GDP growth and
US nominal GDP growth, and Consensus Economics is forecasting a pick-up in growth
rates for both of these in 2016E.
For Taiwan's nominal GDP growth, Consensus Economics is forecasting a pick-up from
3.4% in 2015E to 3.8% in 2016E. Figure 45 also highlights that the low in Taiwan's
nominal GDP growth was 1.4% in 2011.
Figure 46 highlights the fairly good fit between Taiwan's ROE and US nominal GDP
growth. As highlighted above, Consensus Economics is forecasting a pick-up from 3.6% in
2015E to 4.5% in 2016E.
Korea's ROE rise also
supported by Consensus
Economics suggesting US
nominal GDP growth rises
from 3.6% in 2015E to 4.5%
in 2016E
Apart from Korea, Taiwan's
ROE has also been rising;
but investors are
questioning whether it is
close to peaking

01 December 2015
Asia Pacific Equity Strategy 20
Figure 45: Taiwan ROE versus Taiwan nominal GDP
growth (% YoY)
Figure 46: Taiwan ROE versus US nominal GDP growth
(% YoY)
-4%
-2%
0%
2%
4%
6%
8%
10%
5%
7%
9%
11%
13%
15%
17%
19%
2000 2002 2004 2006 2008 2010 2012 2014 2016E
Nom
inal
GD
P Y
oY%
RO
E (
non-
finan
cial
s)
Taiwan - ROE Taiwan - nominal GDP (YoY%)
1.4% in 2011
3.4% in 2015E3.8% in 2016E
-3%
-2%
-1%
0%
1%
2%
3%
4%
5%
6%
7%
8%
5%
7%
9%
11%
13%
15%
17%
19%
2000 2002 2004 2006 2008 2010 2012 2014 2016E
Nom
inal
GD
P Y
oY%
RO
E (
non-
finan
cial
s)
Taiwan - ROE US nominal GDP (YoY%)
3.6% 2015E4.5% 2016E
Source: Datastream, Consensus Economics, Company data, Credit
Suisse estimates
Source: Datastream, Consensus Economics, Company data, Credit
Suisse estimates
Figure 47: Taiwan tech ROE Figure 48: Taiwan non-tech ROE
0%
2%
4%
6%
8%
10%
12%
14%
16%
18%
20%
Jan-01 Jan-03 Jan-05 Jan-07 Jan-09 Jan-11 Jan-13 Jan-15
Taiwan Tech - ROE
14.3% now
High 14.8%
0%
2%
4%
6%
8%
10%
12%
14%
16%
18%
20%
Jan-01 Jan-03 Jan-05 Jan-07 Jan-09 Jan-11 Jan-13 Jan-15
Taiwan non-Tech - ROE
10.8% now
Source: Company data, Credit Suisse estimates Source: Company data, Credit Suisse estimates
Figure 47 also highlights that Taiwan Tech's ROE appears to have peaked at 14.8% and
has slowed to 14.3% currently. Despite the slowdown in Taiwan Tech ROE, Taiwan's
overall ROE has continued to rise (albeit slowly) as Non-Tech ROE has continued to rise.
Within Non-Tech, five of the seven sectors are associated with rising ROE. The five are
Industrials, Financials, Energy, Materials and Real Estate. The two associated with
slowing ROE are Consumer Staples and Telcos.
Figure 49: Taiwan financials ROE Figure 50: Taiwan industrials ROE
0%
2%
4%
6%
8%
10%
12%
Jan-01 Jan-03 Jan-05 Jan-07 Jan-09 Jan-11 Jan-13 Jan-15
Taiwan Financial - ROE
11.2% now
-5%
0%
5%
10%
15%
20%
25%
Jan-01 Jan-03 Jan-05 Jan-07 Jan-09 Jan-11 Jan-13 Jan-15
Taiwan Industrial - ROE
10.6% now
Source: Company data, Credit Suisse estimates Source: Company data, Credit Suisse estimates
We believe NJA's ROE is bottoming as ROE in two of the four big markets—namely
Taiwan and Korea—is now rising. But the key question is whether the ROE rise extends
beyond Korea and Taiwan to India and possibly even MSCI China.
5 of 7 non-Tech sectors in
Taiwan are associated with
rising ROE

01 December 2015
Asia Pacific Equity Strategy 21
India's ROE has been stable at around 13.8% over the past few months. And with India
largely a domestically driven story, Figure 51 highlights the good fit between India's ROE
and its nominal GDP growth. While we are not sure whether India's nominal GDP growth
will rebound as strongly as suggested by Consensus Economics (from 11% in 2015E to
16% in 2016E), we believe a rise in India's nominal GDP growth looks likely given falling
commodity prices and rate cuts. If India's ROE does rise in 2016E, then potentially NJA's
ROE could rise for the first time since 2010.
Figure 51: India ROE versus India's nominal GDP growth (YoY %)
6%
8%
10%
12%
14%
16%
18%
20%
22%
24%
12%
14%
16%
18%
20%
22%
24%
26%
2000 2002 2004 2006 2008 2010 2012 2014 2016E
Nom
inal
GD
P Y
oY%
RO
E (
non-
finan
cial
s)
India - ROE India - nominal GDP (YoY%)
11.7%11%
16%
Source: Datastream, Consensus Economics, Company data, Credit Suisse estimates
While we do expect India's ROE to rise—from the current 13.8% towards 16%—we
estimate implied ROE though is closer to 19%. The market already appears to be pricing
in a significant ROE recovery.
With Hong Kong-listed China shares, there are few signs, if any, of ROE bottoming. Figure 53
highlights ROE has been sliding from a high of 17.6% in 2010 to just 12.8% currently.
Figure 52: India ROE Figure 53: China (HK-listed) ROE
10%
12%
14%
16%
18%
20%
22%
24%
26%
Mar-02 Mar-04 Mar-06 Mar-08 Mar-10 Mar-12 Mar-14
India - ROE
13.8% now
19.8% in Mar 06
16% in 2009
12%
13%
14%
15%
16%
17%
18%
19%
Dec-00 Dec-02 Dec-04 Dec-06 Dec-08 Dec-10 Dec-12 Dec-14
China (HK listed) - ROE
High 17.6% in 2010
12.8% now
16% in 2009
Source: Company data, Credit Suisse estimates Source: Company data, Credit Suisse estimates
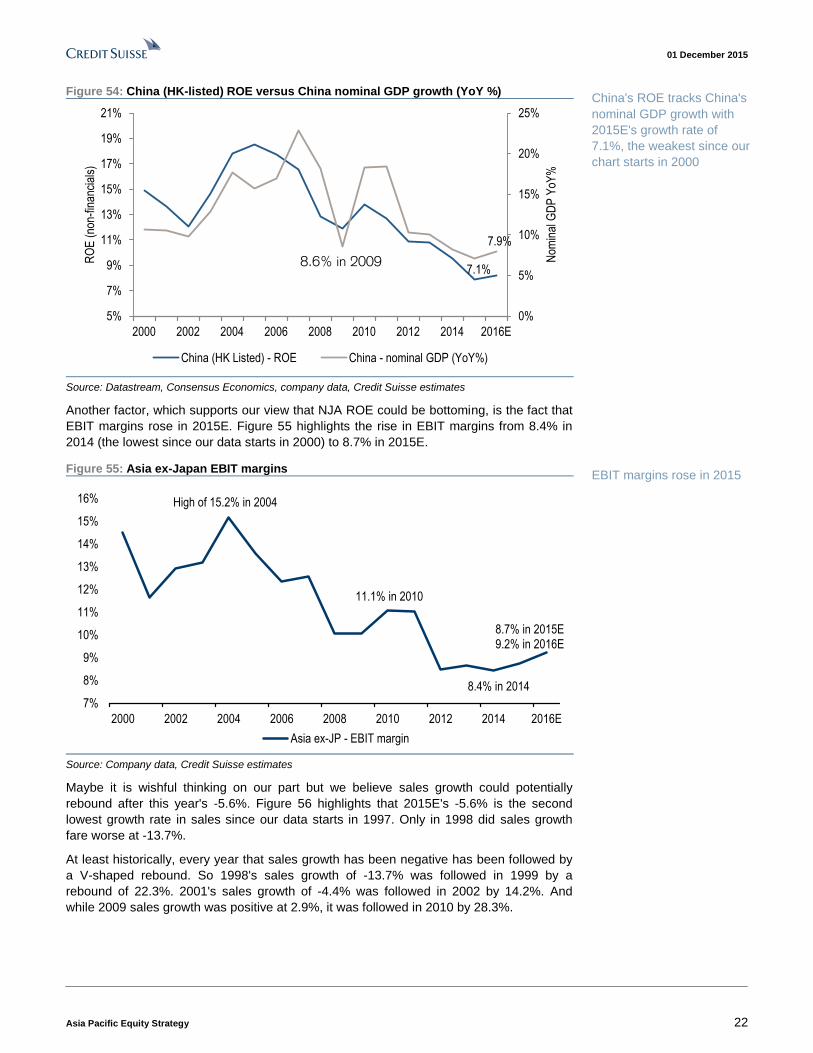
Figure 54 highlights the key reason for the slide in China's ROE is China's nominal GDP
growth in 2015E of just 7.1%. This is the lowest growth rate in China's nominal GDP since
our chart starts in 2000. It is significant that the 2015E growth rate is even lower than
2009's 8.6%. But there do appear to be some signs of stabilisation in nominal GDP
growth—PMI, services sector, property—and Consensus Economics is suggesting a
modest pick to 7.9% in 2016E.
India's ROE tracks India's
nominal GDP growth fairly
well
No signs yet of a bottoming
in China's ROE
01 December 2015
Asia Pacific Equity Strategy 22
Figure 54: China (HK-listed) ROE versus China nominal GDP growth (YoY %)
0%
5%
10%
15%
20%
25%
5%
7%
9%
11%
13%
15%
17%
19%
21%
2000 2002 2004 2006 2008 2010 2012 2014 2016E
Nom
inal
GD
P Y
oY%
RO
E (
non-
finan
cial
s)
China (HK Listed) - ROE China - nominal GDP (YoY%)
7.9%
7.1%8.6% in 2009
Source: Datastream, Consensus Economics, company data, Credit Suisse estimates
Another factor, which supports our view that NJA ROE could be bottoming, is the fact that
EBIT margins rose in 2015E. Figure 55 highlights the rise in EBIT margins from 8.4% in
2014 (the lowest since our data starts in 2000) to 8.7% in 2015E.
Figure 55: Asia ex-Japan EBIT margins
7%
8%
9%
10%
11%
12%
13%
14%
15%
16%
2000 2002 2004 2006 2008 2010 2012 2014 2016E
Asia ex-JP - EBIT margin
High of 15.2% in 2004
11.1% in 2010
8.4% in 2014
8.7% in 2015E 9.2% in 2016E
Source: Company data, Credit Suisse estimates
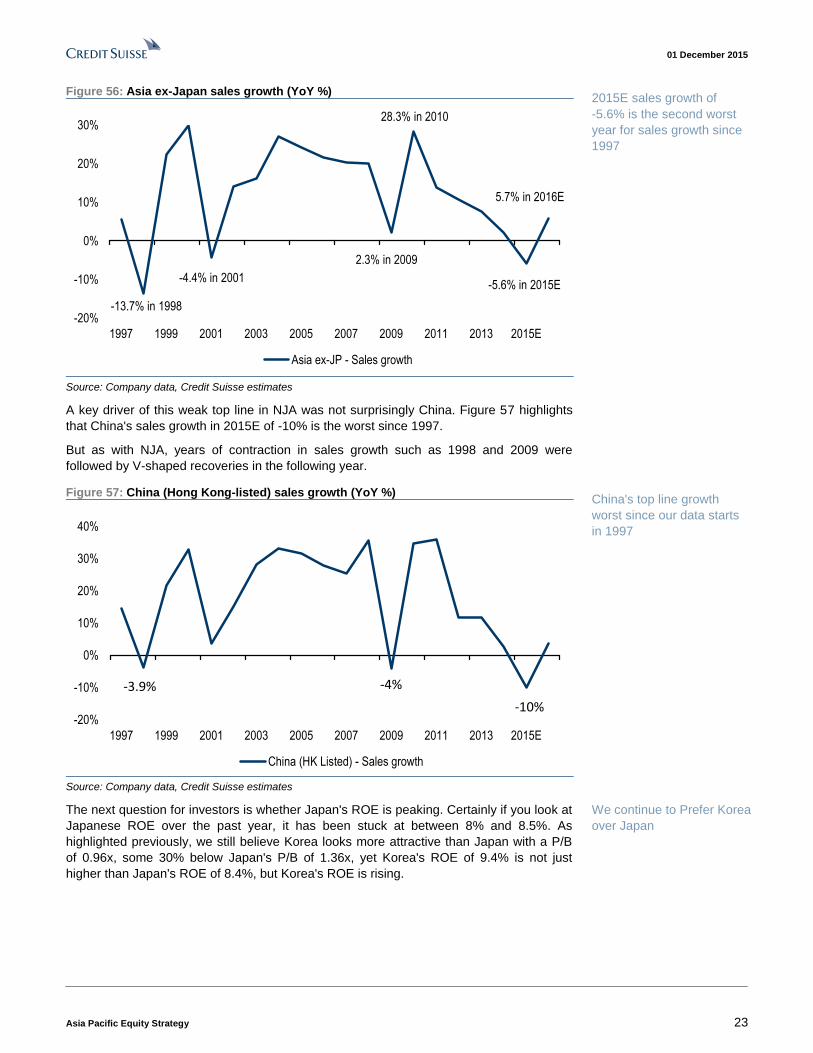
Maybe it is wishful thinking on our part but we believe sales growth could potentially
rebound after this year's -5.6%. Figure 56 highlights that 2015E's -5.6% is the second
lowest growth rate in sales since our data starts in 1997. Only in 1998 did sales growth
fare worse at -13.7%.
At least historically, every year that sales growth has been negative has been followed by
a V-shaped rebound. So 1998's sales growth of -13.7% was followed in 1999 by a
rebound of 22.3%. 2001's sales growth of -4.4% was followed in 2002 by 14.2%. And
while 2009 sales growth was positive at 2.9%, it was followed in 2010 by 28.3%.
China's ROE tracks China's
nominal GDP growth with
2015E's growth rate of
7.1%, the weakest since our
chart starts in 2000
EBIT margins rose in 2015
01 December 2015
Asia Pacific Equity Strategy 23
Figure 56: Asia ex-Japan sales growth (YoY %)
-20%
-10%
0%
10%
20%
30%
1997 1999 2001 2003 2005 2007 2009 2011 2013 2015E
Asia ex-JP - Sales growth
-4.4% in 2001
-13.7% in 1998
2.3% in 2009
28.3% in 2010
-5.6% in 2015E
5.7% in 2016E
Source: Company data, Credit Suisse estimates
A key driver of this weak top line in NJA was not surprisingly China. Figure 57 highlights
that China's sales growth in 2015E of -10% is the worst since 1997.
But as with NJA, years of contraction in sales growth such as 1998 and 2009 were
followed by V-shaped recoveries in the following year.
Figure 57: China (Hong Kong-listed) sales growth (YoY %)
-20%
-10%
0%
10%
20%
30%
40%
1997 1999 2001 2003 2005 2007 2009 2011 2013 2015E
China (HK Listed) - Sales growth
-3.9% -4%
-10%
Source: Company data, Credit Suisse estimates
The next question for investors is whether Japan's ROE is peaking. Certainly if you look at
Japanese ROE over the past year, it has been stuck at between 8% and 8.5%. As
highlighted previously, we still believe Korea looks more attractive than Japan with a P/B
of 0.96x, some 30% below Japan's P/B of 1.36x, yet Korea's ROE of 9.4% is not just
higher than Japan's ROE of 8.4%, but Korea's ROE is rising.
2015E sales growth of
-5.6% is the second worst
year for sales growth since
1997
China's top line growth
worst since our data starts
in 1997
We continue to Prefer Korea
over Japan

01 December 2015
Asia Pacific Equity Strategy 24
Figure 58: Japan versus Korea P/B Figure 59: Japan versus Korea ROE
0.96
1.36
0.0
0.5
1.0
1.5
2.0
2.5
3.0
Dec-95 Dec-98 Dec-01 Dec-04 Dec-07 Dec-10 Dec-13
Korea - PB Japan - PB
9.4%
8.4%
-5%
0%
5%
10%
15%
20%
Dec-95 Dec-98 Dec-01 Dec-04 Dec-07 Dec-10 Dec-13
Korea - ROE Japan - ROE
Source: MSCI, company data, Credit Suisse estimates Source: MSCI, company data, Credit Suisse estimates
While Japan has progressed further in terms of share buybacks and increasing dividend
payouts, we highlight that Korea's dividend yield of 1.41% is not that far below Japan's
dividend yield of 1.87%.
The other key issue is how much of the improvement in Japan's EBIT margin came from
the sharp fall in the Yen as the Yen has now stopped falling. Figure 60 suggests that forex
has definitely played a role in the doubling of Japan's EBIT margins from a low of 4% in
2009 to 8% in 2016E.
The key risk with Overweighting Korea and being Neutral Japan in an Asia-Pacific context
is a further sharp fall in the Yen, particularly if the BOJ embarks on another round of QE.
Perhaps this risk is not that high with Japanese core CPI rising by over 1% recently, and
the BOJ's balance sheet as a share of its GDP is significantly higher than the Fed's (during
QE) and the ECB's.
Figure 60: Japan EBIT margin versus Won/Yen forex rate
700
800
900
1,000
1,100
1,200
1,300
1,400
1,500
1,6004%
5%
5%
6%
6%
7%
7%
8%
8%
9%
2003 2005 2007 2009 2011 2013 2015
KR
W v
s JP
Y (
x100
)
EB
IT m
argi
n
Japan - EBIT margin KRW vs JPY (x100)
Source: Bloomberg, Datastream, company data, Credit Suisse estimates
Cheapest 4 outperformed Expensive 4 by 7% in 2015
While past performance is not necessarily a good guide to future performance, Figure 61
highlights that the Cheapest 4 basket (equally weighted) has outperformed MSCI Asia ex-
Japan (MXASJ) 87% of the time after 12 months.
Forex appears to have
played a role in Japan's
EBIT margins doubling

01 December 2015
Asia Pacific Equity Strategy 25
Figure 61: Cheapest 4- backtest results from 2000
Overweighting cheapest 4 countries 3 months 6 months 12 months
Number of episodes with outperformance 49 46 53
Number of episodes with underperformance 14 16 8
% of episodes with outperformance 78% 74% 87%
Average outperformance 2.2% 3.6% 6.1%
Source: MSCI, Company data, Credit Suisse estimates. We can provide detailed backtest results from
2000 on request.
We do emphasise that it is the basket of the Cheapest 4 that has historically outperformed
and not necessarily all four of the individual countries. We also highlight that undervalued
markets may stay undervalued for longer than we expect but eventually mean-revert and
our highest success rate is after 12 months.
2015 continues this trend of outperformance with Figure 62 highlighting that the Cheapest
4 basket (equally weighted) has so far in 2015 outperformed MXASJ by 4.3%. Three of the
four countries in the Cheapest 4 have outperformed with MSCI Hong Kong outperforming
by 10% while MSCI China and Korea have outperformed by 5% to 8%. Only Australia
within the Cheapest 4 basket has underperformed.
Figure 62: Cheapest 4—backtest results for calendar 2015
Absolute performance Relative performance
Dec-14 3 mths 6 mths since Dec-14 3 mths 6 mths since Dec-14
China -32.9% 8.1% 12.6% -6.0% 4.0% 10.6% 5.0%
Korea -28.6% 4.0% 0.1% -3.4% 0.1% -1.7% 7.9%
Hong Kong 5.7% 5.3% 10.1% -1.4% 1.3% 8.0% 10.1%
Australia 6.0% 1.8% -5.4% -15.7% -2.1% -7.1% -5.9%
Average 4.8% 4.4% -6.6% 0.8% 2.4% 4.3%
Mar-15 3 mths 6 mths since Mar-15 3 mths 6 mths since Mar-15
China -32.0% 4.2% -20.0% -13.0% 6.3% -1.1% 0.9%
Korea -13.4% -3.7% -15.2% -7.1% -1.8% 4.8% 7.8%
Hong Kong 0.4% 4.5% -13.1% -6.4% 6.6% 7.4% 8.6%
Singapore 4.7% -1.5% -21.9% -17.8% 0.5% -3.5% -4.6%
Average 0.8% -17.5% -11.1% 2.9% 1.9% 3.2%
Jun-15 3 mths since Jun-15 3 mths since Jun-15
China -24.2% -23.2% -16.5% -7.0% -5.0%
Korea -19.2% -11.9% -3.5% 6.8% 9.8%
Singapore 3.4% -20.7% -16.5% -4.0% -5.1%
Taiwan 4.5% -18.8% -16.0% -1.6% -4.5%
Average -18.6% -13.1% -1.4% -1.2%
Sep-15 QTD QTD
China -29.5% 8.7% 2.1%
Korea -18.0% 9.5% 2.8%
Hong Kong 0.8% 7.7% 1.1%
Singapore 1.6% 5.2% -1.2%
Average 7.8% 1.2%
Source: MSCI, company data, Credit Suisse estimates
While past performance is
not necessarily a good
guide to the future,
Cheapest 4 has
outperformed MXASJ 87%
of the time after 12 months
Cheapest 4 has
outperformed MXASJ by
4.3% so far in 2015

01 December 2015
Asia Pacific Equity Strategy 26
While the Cheapest 4 has outperformed MXASJ by 4.3% so far in 2015, Figure 63
highlights that the Expensive 4 has underperformed YTD by 2.7%. So the Cheapest 4 has
outperformed the Expensive 4 by 7%.
With the Expensive 4, the bulk of the underperformance YTD has come from one market
Indonesia, though Taiwan has also underperformed YTD.
But in the current quarter, we highlight the 6% to 9% underperformance of the Philippines
and India.
Figure 63: Expensive 4—Backtest results for 2015 YTD
Absolute performance Relative performance
Dec-14 3 mths 6 mths since Dec-14 3 mths 6 mths since Dec-14
Philippines 59.5% 9.2% 3.6% -7.7% 5.1% 1.6% 3.0%
India 48.0% 5.2% 0.9% -9.8% 1.2% -1.0% 0.7%
Indonesia 44.4% 2.0% -13.4% -21.4% -1.9% -15.0% -12.3%
Taiwan 27.3% 3.9% 4.2% -12.5% 0.0% 2.2% -2.3%
Average 5.1% -1.2% -12.9% 1.1% -3.0% -2.7%
Mar-15 3 mths 6 mths since Mar-15 3 mths 6 mths since Mar-15
Philippines 54.7% -5.2% -15.4% -15.5% -3.3% 4.6% -2.0%
Indonesia 45.0% -15.1% -35.8% -23.0% -13.4% -20.6% -10.6%
India 42.8% -4.1% -10.9% -14.2% -2.1% 10.0% -0.4%
Malaysia 21.6% -8.7% -25.8% -20.6% -6.8% -8.3% -7.8%
Average -8.3% -22.0% -18.3% -6.4% -3.6% -5.2%
Jun-15 3 mths since Jun-15 3 mths since Jun-15
Philippines 51.4% -10.7% -10.9% 8.1% 1.3%
India 45.0% -7.2% -10.6% 12.4% 1.7%
Indonesia 20.2% -24.3% -9.2% -8.4% 3.2%
Thailand 13.5% -18.4% -15.5% -1.2% -3.8%
Average -15.2% -11.5% 2.8% 0.6%
Sep-15 QTD QTD
Philippines 55.4% -0.2% -6.3%
India 49.8% -3.6% -9.5%
Malaysia 29.0% 7.1% 0.5%
Australia 16.9% 6.8% 0.3%
Average 2.5% -3.7%
Source: MSCI, company data, Credit Suisse estimates
So our country tilts continue to be largely driven by which markets are in the Cheapest 4
versus the Expensive 4. We continue to Overweight the Cheapest 4 which currently are
Korea, MSCI China, Taiwan and Singapore.
Expensive 4 has
underperformed MXASJ by
2.7% YTD
So Cheapest 4 has
outperformed Expensive 4
by 7% YTD
Cheapest 4 currently are
Korea, MSCI China, Taiwan
and Singapore

01 December 2015
Asia Pacific Equity Strategy 27
Figure 64: Countries ranked on our P/B vs ROE valuation model
-20%
0%
20%
40%
60%K
orea
Chi
na
Sin
gapo
re
Tai
wan
Hon
g K
ong
Tha
iland
Aus
tral
ia
Japa
n
Mal
aysi
a
Indi
a
Indo
nesi
a
Phi
lippi
nes
PB less ROE rel to Asia Pac ex-JP
Source: Company data, Credit Suisse estimates
We also continue to Underweight the Expensive 4, which are the Philippines, India,
Indonesia and Malaysia.
Sector strategy: Will cyclicals follow history in
outperforming defensives post Fed tightening?
While our country strategy is largely following valuations, our sector strategy assumes to
some degree that history repeats itself.
While we do not have MSCI data on the performance of cyclicals versus defensives during
the 1994 and 2004 Fed tightening, Figure 65 highlights that during the Fed taper in 2013,
cyclicals outperformed defensives by 19% from one month after the Fed started to tighten.
Interestingly, the underperformance of cyclicals versus defensives was 12% in the run-up
to the Fed taper in 2013 and is also 12% in the current episode.
Figure 65: MSCI Asia ex-Japan Cyclicals versus Defensives relative price performance
85
90
95
100
105
110
-9m -6m -3m 0m +3m +6m +9m +12m
May-13 current
Asia ex-JP Cyclicals vs Defensives
-12%
+18.6%
-12%+8%
Source: MSCI. We are assuming Dec 2015 is the first rate hike.
After 12%
underperformance in the
run-up to Fed tightening, will
history repeat itself with
cyclicals outperformance
once the Fed moves?

01 December 2015
Asia Pacific Equity Strategy 28
While data at the aggregate cyclicals to defensives level is only available for the 2013
episode, we do have data at the individual cyclicals level for the 2004 Fed tightening
episode. For cyclicals, we use the MSCI definition, which includes Tech, Consumer
Cyclicals, Energy, Materials and Industrials. For defensives, the MSCI definition includes
Consumer Staples, Utilities and Telcos.
Figures 66-69 highlight strong gains in both the 2004 Fed tightening and 2013 Fed taper
episode for cyclical sectors once the Fed starts to tighten. We do emphasise that we
believe 2013 maybe the more relevant comparison as 2004 was associated with strong
and rising Chinese real GDP growth, which we do not currently have.
Figure 66: MSCI Asia ex-Japan tech around Fed
tightening
Figure 67: MSCI Asia ex-Japan consumer cyclicals
around Fed tightening
70
80
90
100
110
120
130
140
150
-9m -6m -3m 0m +3m +6m +9m +12m
Jun-04 May-13 current
MXASJ Info Tech
-31%
-13%
-16.4%
+23%
+35%
70
80
90
100
110
120
130
140
150
-9m -6m -3m 0m +3m +6m +9m +12m
Jun-04 May-13 current
MXASJ Consumer Discretionary
-23%
-11%
-18.4% now
+46%
+26%
Source: MSCI Source: MSCI
Figure 68: Materials around Fed tightening Figure 69: Energy around Fed tightening
70
80
90
100
110
120
130
140
150
160
170
-9m -6m -3m 0m +3m +6m +9m +12m
Jun-04 May-13 current
MXASJ Materials
-28.5%
-25%
-23.7% now
+71%
+22%
70
90
110
130
150
170
190
-9m -6m -3m 0m +3m +6m +9m +12m
Jun-04 May-13 current
MXASJ Energy
-28%
-26%
-29.6%
+59%
+17%
Source: MSCI Source: MSCI
We believe history is supported by valuations with the P/B gap between cyclicals and
defensives still close to 2008 levels.
Figure 70 highlights that the P/B gap between cyclicals and defensives has narrowed from
a low of -0.82x in August 2015 to -0.66x currently. But the current gap of -0.66x is still 90%
of the gap of -0.74x seen at the 2008 lows.
While in 2008, ROE of the cyclicals was 8 pp below defensives, Figure 67 highlights that
the current ROE gap is zero.
We continue to Overweight Tech and Consumer Cyclicals (particularly Korean autos). We
have also reduced our Underweights in Materials and Energy.
Our least favoured defensive sector remains Consumer Staples, which are not only the
most overvalued sector on our P/B vs ROE valuation model but also associated with big
downgrades to 2015E consensus EPS.
We believe 2013 may be the
more relevant episode as
2004 was associated with
strongly rising Chinese real
GDP growth
Cyclicals to defensives P/ B
gap has narrowed from
-0.82x to -0.66x, but this is
still close to the gap seen at
2008 lows

01 December 2015
Asia Pacific Equity Strategy 29
Figure 70: Cyclicals P/B less defensives P/B Figure 71: Cyclicals ROE less defensives ROE
-0.8
-0.6
-0.4
-0.2
0.0
0.2
Dec-03 Dec-05 Dec-07 Dec-09 Dec-11 Dec-13 Dec-15
Asia ex-JP Trailing PB - Cyclicals less Defensives
-0.74 Dec 2008
-0.66x now
-0.82x
-10.0%
-8.0%
-6.0%
-4.0%
-2.0%
0.0%
2.0%
4.0%
Dec-03 Dec-05 Dec-07 Dec-09 Dec-11 Dec-13 Dec-15
Asia ex-JP ROE - Cyclicals less Defensives
0.0% now
-8.4%
Source: Company data, Credit Suisse estimates Source: Company data, Credit Suisse estimates
The key risks to our constructive stance on equities are China hard landing/systemic risk.
The other key risks are that history does not repeat itself and even after the Fed tightens,
markets continue to correct. Another risk is that ROE does not bottom as we expect.
While we are Overweight cyclicals, we continue to be cautious on "New" Economy defined
as Macau Gaming and Internet. While Macau Gaming's P/B has derated from a high of
9.3x in February 2014 to just 3.1x, we highlight that even in the month of November 2015E
consensus EPS was downgraded by a further 4.5%.
Figure 72: Macau Gaming P/B Figure 73: Macau Gaming 2015E consensus EPS
2.0
3.0
4.0
5.0
6.0
7.0
8.0
9.0
10.0
Dec-09 Dec-10 Dec-11 Dec-12 Dec-13 Dec-14 Dec-15
Macau gaming - PB
now 3.1x
average: 5.5x
high 9.3x
20
30
40
50
60
70
80
90
100
110
Dec-13 Mar-14 Jun-14 Sep-14 Dec-14 Mar-15 Jun-15 Sep-15
Macau gaming - EPS15E
-67.5% since Apr 14
-4.5% in Nov
Source: Company data, Credit Suisse estimates Source: IBES
While the downgrades are smaller for Internet, Figure 75 highlights a further 1.3% cut to
2015E consensus EPS for China Internet in the month of November. We wonder therefore
how much of the recent rally in Internet stocks has to do with just flows from MSCI
inclusion rather than improving fundamentals.
Figure 74: NJA Internet 2015E consensus EPS Figure 75: China Internet 2015E consensus EPS
70
75
80
85
90
95
100
Dec-13 Mar-14 Jun-14 Sep-14 Dec-14 Mar-15 Jun-15 Sep-15
NJA Internet - EPS15E
-0.1% in Nov
-27%
86
90
94
98
102
106
Dec-13 Mar-14 Jun-14 Sep-14 Dec-14 Mar-15 Jun-15 Sep-15 Dec-15
China Internet - EPS15E
-1.3% in Nov
-19%
Source: IBES Source: IBES
Macau Gaming P/B has de-
rated from a high of 9.3x in
February 2014 to just 3.1x
currently

01 December 2015
Asia Pacific Equity Strategy 30
Figure 76 highlights that ChiNext P/B has now risen from a recent low of 7x back to 9.67x.
This is not that far from the high of 13.4x seen at the height of the bubble in May/June
2015.
Figure 76: Chinext current P/ B versus prior bubbles
0
2
4
6
8
10
12
14
0 6 12 18 24 30 36
Tra
iling
PB
Japan TSE since Jun 88 Nasdaq Comp since Aug 98 China A since Apr 06China H since Apr 2006 China A current China H currentShenzhen SME current Chinext current US listed CN Int current
month
NASDAQ 8x at 2000 highShenzhen SME 5.46xChina A 6.9x 2006-07 high
China H 5.2x at 2007 high
China H 1.01x
China A 2.33x
high 7.03x
high 2.98x
high 1.43x
Chinext 9.67x
high 13.4x
US listed CN Internet 5.30x
high 5.47x
Source: Bloomberg, Datastream, MSCI, company data, Credit Suisse estimates
ChiNext P/B has risen to
9.67x, not far from the
height of the bubble at 13.4x

01 D
ec
em
ber 2
015
Asia
Pacific
Eq
uity
Stra
teg
y
31
CS regional model portfolio
China Hong Kong Korea Taiwan India Aust / NZ Asean Japan Total Rel.
Consumer Great Wall Motor 2.0% Hyundai Motors 2.5%
Fuji Heavy Inds 4.0% 15.0% 1.6%
Discretionary Hyundai Mobis 0.5%
Toyota 4.0%
Aisin Seiki 2.0%
Consumer
LG Household 1.0%
Kose 2.0% 4.0% -2.7%
Staples
KT&G 1.0%
Energy SK Innovation 1.0% FPCC 1.0%
2.0% -0.8%
Financials Bank of China 2.0% BOC Hong Kong 1.9% Shinhan 0.3% Cathay 0.5%
CBA 3.5% DBS 2.5% Sumitomo Mitsui 8.0% 32.2% 8.4%
(ex-Real Est.) Ping An 2.0% Dongbu Insurance 0.5% CTBC 0.5%
ANZ 2.0% Bank BRI 1.0% Dai-ichi Life 7.0%
Fubon 0.5%
Healthcare
0.0% -5.4%
Industrials Goldwind 1.5% CKH Holdings 2.0%
JAL 2.5% 9.0% -4.0%
Sumitomo Elec 3.0%
Information Alibaba 2.0% SEC 3.0% TSMC 4.0% HCL Tech 1.0%
Softbank 4.0% 19.3% 5.2%
Technology Hon Hai 2.3%
Sony 3.0%
Materials
1.0% Hindalco 0.5% Rio 2.0%
3.5% -2.5%
Real estate COLI 2.5% CK Property 4.0%
Mitsui Fudosan 4.0% 10.5% 4.5%
Telcos China Mobile 2.5%
2.5% -3.0%
Utilities Kepco 1.0% AGL Energy 1.0% 2.0% -1.2%
Total 14.5% 7.9% 11.8% 8.8% 1.5%
8.5% 3.5% 43.5% 100.0%
Rel. to MSCI AC APAC 2.0%
2.2%
3.6%
2.4%
-2.7%
-3.8%
-3.6%
-0.1% 0.0%
Source: MSCI, Credit Suisse estimates

01 December 2015
Asia Pacific Equity Strategy 32
Country Sections

01 December 2015
Asia Pacific Equity Strategy 33
Australia Alpha and the lost decade
The Australian economy seems to have already started its lost decade and the future
direction of stock indices should largely depend on how companies respond to the current
sustained period of weak growth. We anticipate that Australia Inc. will continue to cut costs,
conserve capital and consider M&A to generate returns for their shareholders.
Notwithstanding the sluggish macro backdrop, we believe the combination of lower
interest rates, a weaker AUD, rising free cash-flows and lower starting valuations should
support double digit local currency gains for the ASX 200 by the end of 2016. Investors
measured in US dollars will again have to contend with weaker returns.
Figure 77: Top stock ideas for 2016 Mkt Yield P/B ROE Net debt/
Target cap P/E (x) (%) (x) (%) equity (x)
Company RIC Rating Curr. Price price (mn) FY14A FY15E FY16E FY16E FY16E FY16E FY16E
Top outperformers
Rio Tinto Ord RIO.AX N AUD 47.1 53 61,433 6.8 11.9 20.0 6.3% 1.5 7.5% 33.7%
AGL Energy Ord AGL.AX O AUD 16.8 18.4 8,197 15.9 17.4 15.8 4.6% 1.2 7.4% 28.1%
Carsales.com Lim Ord CAR.AX O AUD 10.3 11.3 1,792 25.7 24.7 21.8 3.7% 9.6 44.1% 63.3%
Lend Lease Group Unt LLC.AX O AUD 12.6 16.6 5,292 8.8 11.8 10.7 4.9% 1.4 13.2% 25.8%
Top relative underperformers
Brambles ord BXB.AX U AUD 10.8 8.7 12,361 21.0 21.0 20.1 2.6% 4.2 20.8% 97.1%
Medibank private ord MPL.AX U AUD 2.3 2.2 4,512 24.1 21.3 20.6 3.6% 4.2 20.3% Net cash
Note: Priced as of 25 November 2015. Source: Company data, IRESS, Credit Suisse estimates
Earnings outlook
Current bottom-up expectations are for the second consecutive 12-month EPS contraction
for the Australian financial year ending June 2016. There remain a number of headwinds
to corporate profits including a sluggish economic backdrop and depressed commodity
prices. Economic activity has averaged 2.5% for the current decade since 2010; however,
real GDP grew by 3% p.a. or more during each of the previous five decades. We expect
the macro back drop to remain sluggish as the economy endures the combination of less
favourable demographics (slowing population growth and falling participation rate), de-
leveraging (household debt to GDP is at 100%) and corporate focus on distributions at the
expense of investment (mining capex is collapsing; non-mining capex/GDP is at 60-year
lows).
Meanwhile, our forecast is for the major commodity prices for Australia Inc.—iron ore and
LNG—will remain depressed in the short term. Iron ore remains in oversupply, especially
as Chinese steel intensity is expected to decline, as the economy transitions away from
investment led growth to being more consumption/services focussed. Meanwhile, LNG
contracted prices for Aussie suppliers remain some 50-60% above current spot prices.
The obvious risk here is that contracts are renegotiated. Commodity companies now make
up less than 20% of Aussie market cap.
While there remains considerable headwinds to revenues, Australia Inc. is well progressed
in managing the downside. Costs are being cut and half the companies under Credit
Suisse coverage have a cost-out programme in place. Also, we expect free cash flows to
grow, despite the obvious profits headwind, as companies restrain capex. A leaner cost
base has positioned Australia Inc. in a stronger position for when top-line begins to
recover.
Hasan Tevfik hasan.tevfik@credit-
suisse.com
+612 8205 4284

01 December 2015
Asia Pacific Equity Strategy 34
Figure 78: ASX 200 EPS growth—forecasts are from Credit Suisse analysts and IBES
-20
-15
-10
-5
0
5
10
15
20
CY 14 CY 15 CY 16 CY 17
ASX 200
Industrials 4 Banks
Commodities-28%-33%
Source: IBES, company data, Credit Suisse estimates
Valuation
Australian equities currently trade on a trailing P/E ratio of 15.5x. This is in line with the
long-term average. Meanwhile, a higher than normal payout ratio means that dividend
yields at 4.8% (before the benefit of dividend imputation for local investors) are 60 basis
points higher than the long-term average. The current payout ratio (DPS/EPS) is 75% and
the long-term average is 60%. It is clear Australia Inc. is attempting to not disappoint their
income focussed investors. Dividends have increased each year since 2009 despite profits
contracting at times. We believe the focus on cost cuts and capital conservation will
ensure further DPS increases in 2016 notwithstanding the likely contraction in EPS. We
applaud the increase in distributions. Australia Inc’s chequered history of capex and
acquisitions suggests returning money back to shareholders may be the prudent capital
allocation.
Of course Australian equity valuations look more attractive relative to fixed income assets.
The Australian earnings yield is 350 basis points higher than the ten-year government
bond yield. This is close to the highest level in the last 45 years. Meanwhile, the June
2016 free cash flow yield (operating cash-flows less total capex) is expected to be 5.1%
and 140 basis points higher than the cost of debt. Australian equities continue to appear
attractive to investors looking for an alternative to government bonds and debt financed
buyers.

01 December 2015
Asia Pacific Equity Strategy 35
Figure 79: ASX 200 12M trailing P/E ratio Figure 80: ASX 200 ex-financials FCF yield vs cost of debt
5
10
15
20
25
70 74 78 82 86 90 94 98 02 06 10 14
Average = 15.3x
0
1
2
3
4
5
6
7
8
9
10
Jun 08 Jun 10 Jun 12 Jun 14 Jun 16
Australian A-rated 3-5 Year Corp Bond Yield
ASX 200 FCF Yield
Source: Company data, Credit Suisse estimates Source: Company data, Bloomberg, Credit Suisse estimates
What could surprise in 2016?
(1) The AUD appreciates. Expectations of a falling iron ore price, weaker Chinese demand
and lower RBA rates should mean a weaker currency in 2016. We forecast 0.66 cents
against the USD by year-end. A surprise will be if the currency appreciates instead. This
may be because the US recovery falters, the global search for yield intensifies, commodity
prices rise or the RBA does not cut rates. The first RBA meeting in 2016 is on 2 February.
(2) EPS does not fall. Current expectations are for a contraction in EPS driven by a
combination of sluggish GDP growth and weak commodity prices. A rise, instead of
fall, in EPS should be consistent with higher commodity prices and potentially a
weaker AUD. More than half of Australian company earnings are sourced from
overseas. The 1H reporting season is in February.
(3) Change in corporate tax rate. The new political leadership promises to accelerate
the reform agenda and tax is one of the issues likely to be addressed. Australia
currently has one of the highest corporate tax rates in the world at 30%. We imagine a
cut in the corporate tax rate will be at least partly offset with tightening which may
involve a potential increase in consumption tax. Such a move should still be positive
for stock prices. The Federal Budget is announced in May.
Top ideas in 2016?
Idea 1. Long AGL Energy. Australia’s biggest Utility is expected to enjoy double digit EPS
growth supported by rising electricity prices. New management promises to deploy capital
conservatively, and our analysts believe excess free cash flow and little debt on the
balance sheet should ensure a larger-than-expected capital returns.
Idea 2. Long Lend Lease. Current valuations imply a rise in defaults for the Australian
development business much in advance of what has been experienced before. The
company enjoys a solid development pipeline and continues to redeploy capital
internationally where the returns are stronger. The stock is on the verge of trading on a
single-digit P/E multiple but provides double-digit EPS growth.
Idea 3. Short Brambles. The company has long operated on thin free cash flow margins
and we expect they could fall further. Capital intensity is set to rise as the company aims to
rectify previous pallet repair lapses. The stock trades on 21x 2016 EPS and is expected to
grow profits by just 5% for the next two years.

01 December 2015
Asia Pacific Equity Strategy 36
China Winter is coming
The macro outlook of China is very challenging. The huge problem of excess capacity
in the manufacturing/mining sector has limited room for industrial investment. Property
investment growth will likely turn negative in 2016 with the depressing tier 2/3 city
property market. A weak global economy also will dampen any export recovery.
Rising NPLs of the manufacturing sector are a major risk in 2016. For the old
economy sectors, the only positive factor is the continued relaxation of monetary
policy. For the new economy sectors, structural growth continues but valuation is a
major concern.
Figure 81: Top stock ideas for 2016
Mkt Yield P/B ROE Net debt/
Target cap P/E (x) (%) (x) (%) equity (x)
Company RIC Rating Curr. Price price (mn) FY14A FY15E FY16E FY16E FY16E FY16E FY16E
Top outperformers
China Pacific (H) 2601.HK O HKD 32.3 50 38,141 21.8 13.0 12.6 3.2% 1.7 13.4% Net cash
Hikvision 002415.SZ O CNY 36.1 41.6 22,995 31.0 23.1 17.7 1.7% 5.9 33.0% Net cash
Goldwind (H) 2208.HK O HKD 13.2 26.3 6,632 16.9 9.5 8.3 6.0% 1.5 18.5% 35.8%
Alibaba BABA.N O USD 81.7 98 205,290 44.3 37.5 31.9 0.0% 5.9 18.5% Net cash
Geely 0175.HK O HKD 4.2 5.7 4,770 21.3 10.5 7.4 1.6% 1.3 17.5% Net cash
Kweichow Moutai 600519.SS O CNY 213.0 270 41,884 15.8 16.1 14.2 2.1% 3.4 24.1% Net cash
Note: Priced as of 25 November 2015. Source: Company data, Thomson Reuters, Credit Suisse estimates
Earnings outlook
Earnings downgrade for the China market for 2016 will likely continue. 8.2% earnings
growth for MSCI China in 2016 seems unachievable, 5% or lower is more realistic.
The financial positions of sectors such as coal, steel and aluminium are deteriorating
rapidly, with the interest coverage of more than half of the listed A-shares in these
sectors less than one in first nine months of 2015. NPLs of these sectors are set to
rise in 2016, and this could affect the earnings of the financial sector. The new
economy sectors, such as e-commerce, should still enjoy structural earnings growth,
but recent results indicate that expectations of their earnings might already be too
high and could be subject to disappointment.
Figure 82: MSCI China—2015 and 2016 IBES EPS estimate (CNY)
6
6.5
7
7.5
8
8.5
9
Mar-13 Sep-13 Mar-14 Sep-14 Mar-15 Sep-15
2015 2016 Source:Thomson Reuters IBES, MSCI
Vincent Chan
vincent.chan@credit-
suisse.com
+852 21016568
The macro outlook of China
is very challenging
Earnings downgrade for the
China market for 2016 will
likely continue

01 December 2015
Asia Pacific Equity Strategy 37
Valuations
The P/B of the China market is definitely at the low end of the spectrum; this should
limit the downside of the market. On the other hand, with the earnings outlook
deteriorating, the forward P/E does not look very cheap. Hence, the Chinese market
in 2016 would likely be range-trading with a small upside.
Figure 83: MSCI China 12M forward P/E chart Figure 84: MSCI China trailing P/B chart
6
7
8
9
10
11
12
13
Dec-10 Dec-11 Dec-12 Dec-13 Dec-14
MSCI CHINA - 12MTH FWD P/E RTIO
1.0
1.2
1.4
1.6
1.8
2.0
2.2
2.4
2.6
Dec-10 Dec-11 Dec-12 Dec-13 Dec-14
MSCI CHINA - PRICE/BOOK RATIO
Source: Thomson Reuters IBES, MSCI Source: Thomson Reuters, MSCI
What could surprise in 2016?
NPLs of commercial banks. There is a consensus view that NPL ratios in China will
rise in 2016, although investors only expect these to rise gradually. However, with
Special Mention Loans (SMLs) rising sharply from 2.55% of total loans in mid-2014 to
3.77% in Sep-2015, there is a big risk that a meaningful amount of these SMLs could
become NPLs in 2016 with the industrial economy remaining weak. The market will
not be very happy if the NPL ratio goes up from the current 1.59% to 2.5%+ some
time in 2016.
Renminbi. It seems that the currency reform experiment was not very successful, and
the Rmb exchange rate has gone back to being very rigid, similar to the pre-reform
stage. If economic growth continues to remain weak (lower than the government
target of 6.5%) and the operating environment of corporations continues to deteriorate
in 1H15, we will see a more aggressive one-off devaluation in 2H16.
Non-bank lending. Internet finance, like P2P lending, is developing very rapidly in
the past few years. Similarly, subsidiaries of asset management companies also
create financial products which have effectively lent a significant amount of money to
companies in the past two years. Both these lending practices are under very loose
banking regulatory supervision and the companies doing them do not have a lot of
experience handling credit evaluations. There could be meaningful increase in default
risks of such loans if the economy continues to weaken further.
Chinese market in 2016
may range-trade with a
small upside
We believe rising concerns
on the NPL ratio, Rmb
depreciation and non-
banking lending could be
the three main surprises in
2016

01 December 2015
Asia Pacific Equity Strategy 38
Top ideas in 2016?
China Pacific Insurance. The premium growth of insurance companies is very
strong. In the last few months, insurance companies were not doing well due to
concerns over the A-share market. But now, with the A-share market stabilising, this
should be a lesser concern ahead.
HikVision. The rising threat of terrorism is expected to trigger more spending on
surveillance in China and other countries. With its leading position in surveillance
cameras, HikVision should be a major beneficiary of this trend.
Goldwind. The stock has corrected sharply in recent months due to the concern over
windpower tariff. However, our analysts believe that as the government needs to
continue the development of renewable energy, the drop in windpower tariff should
not be as drastic as the market expects. The current concern actually provides a very
good entry point for the stock.
Our top picks for China
2016 are China Pacific
Insurance, HikVision,
Goldwind, Alibaba, Geely
and Kweichow Moutai

01 December 2015
Asia Pacific Equity Strategy 39
China A-share Market Strategy Structural opportunities in a see-saw market
We believe the A-share market will remain range-bound in 2016, while the CSI-300 index
should fluctuate between 3,400 and 4,300.
■ Earnings growth should continue to decrease when GDP growth slows down.
Deflation could spill over from commodity to more sectors, and hurt revenue
growth/gross margins of the corporates. Therefore, ROE of industrial enterprises could
fall below 8%. Furthermore, profit growth of banks would decrease as the NPL ratio
increases—this will likely impede the earnings growth of all A-shares, since banks
usually contribute 60-70% to total profit.
■ The liquidity is still positive to the market. Institutional investors like insurers and banks
would like to increase their equity positions when bond yields decline. Retail investors
are coming to the stock market to chase the rally or to get the return on subscribing to
new shares. However, the regulator can control liquidity flushing through: (1)
controlling the expanding size of margin finance, and (2) the stock supply in IPOs and
public placements.
■ The structural opportunities are both in 'value' and 'growth'. The funds moved from the
fixed income market by insurers/WMP funds will likely favour value stocks that offer
low P/E, high dividends, and invisible growth. And such stocks could also be chased
by offshore investors if they rebuild confidence in the local equity market. At the same
time, many local investors should continue to chase the 'new economy' companies,
such as media, education, sports, internet+, travel, healthcare, new energy, because
these sectors will likely see a boom in the future, supported by policies and
demographic changes.
Figure 85: Top stock ideas for 2016
Mkt Yield P/B ROE Net debt/
Target cap P/E (x) (%) (x) (%) equity (x)
Company RIC Rating Curr. Price price (mn) FY14A FY15E FY16E FY16E FY16E FY16E FY16E
Top outperformers
Midea 000333.SZ O CNY 28.63 41 148,156 11.5 9.8 9.0 4.5% 2.1 25.9% Net cash
Wanda Cinema 002739.SZ O CNY 104.81 122 142,405 65.4 95.3 52.8 0.2% 19.0 43.0% Net cash
Hengrui Medicine 600276.SS O CNY 50.54 57 119,956 50.2 46.9 40.4 0.3% 8.2 22.4% Net cash
GeorTek 002241.SZ O CNY 33.2 41.8 61,479 30.5 36.7 27.9 0.4% 4.5 17.5% Net cash
Note: Priced as of 25 November 2015. Source: Company data, Thomson Reuters, Credit Suisse estimates
Earnings outlook
We expect 2%/0% growth for A-share companies in 2015/16, versus market consensus of
4%/0%. (1) We believe economic growth will continue to slow, and nominal GDP growth
will decelerate more due to deflation. Therefore, the revenue growth of listed companies
turned negative (-3%) in 3Q16 and fell to its 2018 level, the worst point in the past 15
years. The decrease of the asset turnover ratio is the biggest issue to the worsened ROE
(from 12% to 10%). (2) The NPL ratio of banks could increase next year, putting significant
pressure on banks’ earnings, which account for over half of all listed companies.
Li Chen
852 2101 6645

01 December 2015
Asia Pacific Equity Strategy 40
Figure 86: Shanghai A-share(China)—2015 and 2016 IBES EPS estimates
Source: IBES, Credit Suisse estimates
Valuations
We believe stock market valuations will increase slightly due to the presence of abundant
liquidity. As deflation continues, we think the ten-year treasury bond yield could go below
3%; therefore, the valuation of the big caps (e.g., the CSI-300 index, 2016 P/E) could
increase from 15x to 18x, well above the average level in the past six years. However, the
valuation of the small caps (e.g., the ChiNext board) could contract due to the increasing
stock supply possible after the IPO reform (from approval-based to registration-based).
Figure 87: China CSI-300 12M forward P/E band Figure 88: China CSI-300 trailing P/B band
Source: Bloomberg Source: Bloomberg
What could surprise in 2016?
■ RMB depreciation: Substantial funds could flow out if the RMB sees a meaningful
depreciation (>10%) in 2016 (Rmb1.4 tn had flown out during this August's RMB
depreciation). That will have a big negative impact on overall liquidity, and the equity
valuation as well.
■ Sizeable fiscal stimulus: If the government provides a sizeable stimulus to
infrastructure in early 2016, or if property sales rebound in tier 2/3 cities and that

01 December 2015
Asia Pacific Equity Strategy 41
results in an improvement in property investment, GDP growth would bottom up.
There could be upside risk to corporate earnings growth.
■ Lots of stock supply: The IPO reform will take place in 2016. If the government does
not control the time and price of IPOs, lots of new shares will come to the main
board/ChiNext board/new 3rd
board, and the upcoming strategic emerging board. New
funds to the equity market could be absorbed, and that will put pressure on the stock
market valuation.
Top ideas for 2016?
Idea 1: Midea—A value stock. It is one of the biggest home appliance producers, with 9x
2016E P/E and 4.6% dividend yield. The company will deliver 'smart' products in the future,
which could raise its ROE (26% in 2015).
Idea 2: Wanda Cinema—Growth stock. It is the biggest movie distributor which has a
15% market share in a booming industry. Profit growth will likely be above 50% in the next
three years through fast expansion, and maintain a 40% ROE.
Idea 3: Goer-Tek—Growth stock. It is one of the best medicine companies which has the
best R&D ability. The company will have a few new “heavy bomb” drugs delivered in
2016/17, which could bring significant upside to its earnings growth.
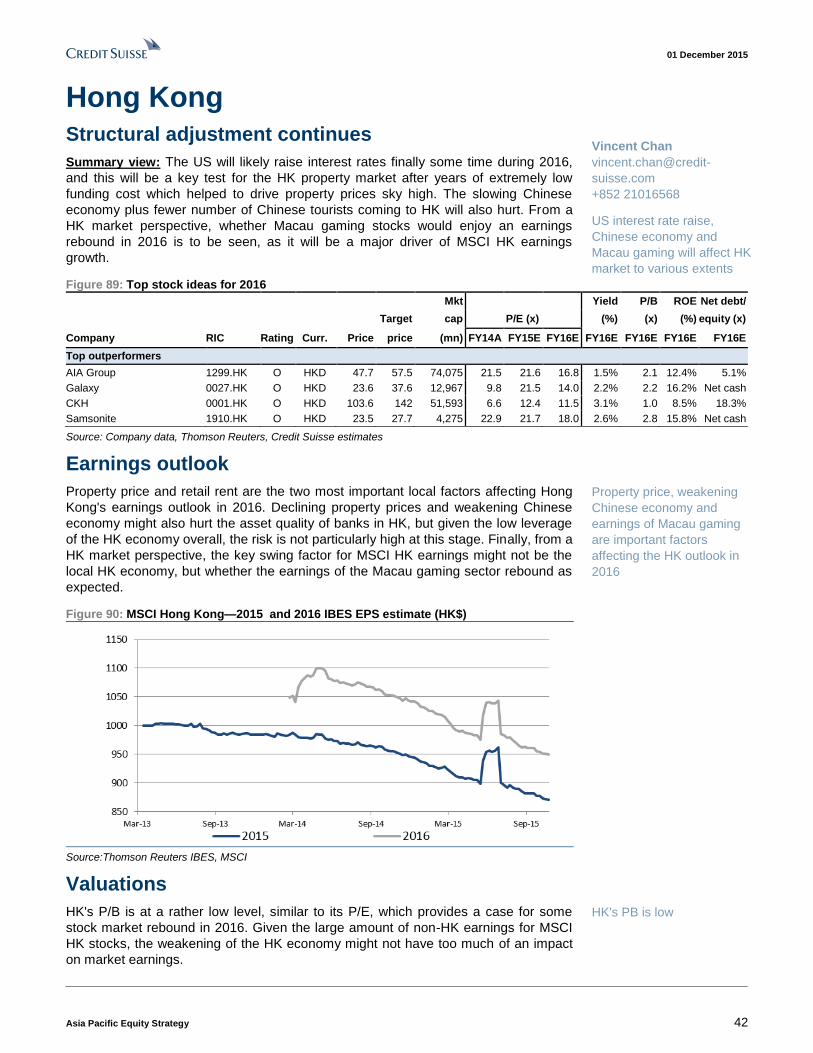
01 December 2015
Asia Pacific Equity Strategy 42
Hong Kong Structural adjustment continues
Summary view: The US will likely raise interest rates finally some time during 2016,
and this will be a key test for the HK property market after years of extremely low
funding cost which helped to drive property prices sky high. The slowing Chinese
economy plus fewer number of Chinese tourists coming to HK will also hurt. From a
HK market perspective, whether Macau gaming stocks would enjoy an earnings
rebound in 2016 is to be seen, as it will be a major driver of MSCI HK earnings
growth.
Figure 89: Top stock ideas for 2016
Mkt Yield P/B ROE Net debt/
Target cap P/E (x) (%) (x) (%) equity (x)
Company RIC Rating Curr. Price price (mn) FY14A FY15E FY16E FY16E FY16E FY16E FY16E
Top outperformers
AIA Group 1299.HK O HKD 47.7 57.5 74,075 21.5 21.6 16.8 1.5% 2.1 12.4% 5.1%
Galaxy 0027.HK O HKD 23.6 37.6 12,967 9.8 21.5 14.0 2.2% 2.2 16.2% Net cash
CKH 0001.HK O HKD 103.6 142 51,593 6.6 12.4 11.5 3.1% 1.0 8.5% 18.3%
Samsonite 1910.HK O HKD 23.5 27.7 4,275 22.9 21.7 18.0 2.6% 2.8 15.8% Net cash
Source: Company data, Thomson Reuters, Credit Suisse estimates
Earnings outlook
Property price and retail rent are the two most important local factors affecting Hong
Kong's earnings outlook in 2016. Declining property prices and weakening Chinese
economy might also hurt the asset quality of banks in HK, but given the low leverage
of the HK economy overall, the risk is not particularly high at this stage. Finally, from a
HK market perspective, the key swing factor for MSCI HK earnings might not be the
local HK economy, but whether the earnings of the Macau gaming sector rebound as
expected.
Figure 90: MSCI Hong Kong—2015 and 2016 IBES EPS estimate (HK$)
Source:Thomson Reuters IBES, MSCI
Valuations
HK's P/B is at a rather low level, similar to its P/E, which provides a case for some
stock market rebound in 2016. Given the large amount of non-HK earnings for MSCI
HK stocks, the weakening of the HK economy might not have too much of an impact
on market earnings.
Vincent Chan
vincent.chan@credit-
suisse.com
+852 21016568
US interest rate raise,
Chinese economy and
Macau gaming will affect HK
market to various extents
Property price, weakening
Chinese economy and
earnings of Macau gaming
are important factors
affecting the HK outlook in
2016
HK's PB is low

01 December 2015
Asia Pacific Equity Strategy 43
Figure 91: MSCI Hong Kong 12M fwd P/E chart Figure 92: MSCI Hong Kong trailing P/B chart
10
11
12
13
14
15
16
17
18
Dec-10 Dec-11 Dec-12 Dec-13 Dec-14
MSCI HONG KONG - 12MTH FWD P/E RTIO
1.0
1.1
1.2
1.3
1.4
1.5
1.6
1.7
1.8
1.9
Dec-10 Dec-11 Dec-12 Dec-13 Dec-14
MSCI HONG KONG - PRICE/BOOK RATIO
Source: Thomson Reuters IBES, MSCI Source: Thomson Reuters, MSCI
What could surprise in 2016?
US interest rate. Given the HKD peg with the US dollar and the importance of the
property market to SAR, the rise in interest rates in the US will definitely be a big
issue for the economy. Current expectation is that the US will have a mild interest rate
hike and HK's property sector will face some mild downward pressure. However, if the
US rate hike is faster and more aggressive than expectation, or if the HK property
market either reacts or does not react drastically to the rate hike, this could have a
meaningful impact on the share price of HK's property stocks one way or the other.
China slowdown. In the last few years, there has been significant USD borrowing by
Chinese companies in HK. If the economic slowdown is combined with the RMB
depreciation, this could create some disturbances for HK banks.
Top ideas in 2016?
Galaxy. We believe that the worst is over for the Macau gaming sector with business
starting to stabilise. Among the Macau gaming stocks, our top pick is Galaxy.
AIA. The is the premium insurance sector play in the region, with a very diversified
portfolio. Given the uncertain macro environment, the proven management track record
and diversified business geographical location of this company are a plus.
CKH. In our view, CKH not only has a steady earnings and cash flow base from its
infrastructure and retail business but also a visible earnings upgrade path in the coming
few years from: (1) continued strength from core businesses; (2) improvement in
European mobile market; (3) synergies impact from the acquisition of O2 UK and WIND
Italia; and (4) upside option from potential asset monetisation. At a 34% discount to NAV
(vs historical average of 27%), we believe CKH’s valuation looks attractive. It is our top
pick in the HK/China conglomerate space.
US interest rate and China
slowdown are the surprise
factors of the HK market in
2016
Top picks of HK market in
2016 are Galaxy, AIA and
CKH.

01 December 2015
Asia Pacific Equity Strategy 44
India Domestic pick-up visible; global stability needed for
broader market returns
Summary view: In 2016, we expect earnings cuts to continue, but the pace of earnings
downgrades to abate: (1) the quantum of decline in global commodity prices can only be
lower than in 2015; (2) "global" sectors' relative importance in indices has fallen; and (3)
the broad-based recovery visible in the domestic economy should continue into the new
year. Earnings growth could end the year at 13-15%. With MSCI India's P/E premium to
MSCI World (+6%) at Sep-13 levels, this is supportive of a 13-15% pick-up in the broader
indices. On sector preferences, we believe the market is underestimating the pace at
which credit quality deterioration will become visible, and also the impact of the Pay
Commission on consumption.
Figure 93: Top stock ideas for 2016
Mkt Yield P/B ROE Net debt/
Target cap P/E (x) (%) (x) (%) equity (x)
Company RIC Rating Curr. Price price (mn) FY15A FY16E FY17E FY17E FY17E FY17E FY17E
Top outperformers
Tech Mahindra TEML.BO O INR 538 700 7,818 20 17 14 1.7% 3 24% -0.3
Hindustan Unilever HLL.BO O INR 811 920 26,420 41 40 34 2.2% 36 113% -1.0
Ultratech Cement ULTC.BO O INR 2,778 3,525 11,470 36 30 19 0.7% 3 18% 0.2
Tata Motors TAMO.BO O INR 401 490 17,424 9 11 8 0.6% 1 20% 0.5
Top relative underperformers
Bharti Airtel BRTI.BO U INR 341 285 20,527 26 21 21 0.9% 2 9% 1.1
SBI SBI.BO N INR 242 247 28,210 14 11 9 2.4% 1 13% n.m.
Note: Priced as of 25 November 2015. Source: Company data, Thomson Reuters, Credit Suisse estimates
Earnings outlook: "global" impact should diminish
Figure 94: MSCI India—consensus 2015 and 2016 IBES EPS estimates
50
60
70
80
90
100
110
Feb-14 Apr-14 Jun-14 Aug-14 Oct-14 Dec-14 Feb-15 Apr-15 Jun-15 Aug-15 Oct-15
2014 EPS 2015 EPS 2016 EPS 2017 EPS
Source: IBES, MSCI, Credit Suisse estimates
We expect earnings downgrades to continue in 2016, though at a slower pace than in
2015. For the market what matters is the pace of cuts rather than cuts themselves: given
the 10-12% CAGR trend growth for index EPS (for most broad-based indices), the "roll-
forward" earnings growth every three months is 2.5-3%. If the pace of cuts over three
Neelkanth Mishra
neelkanth.Mishra@credit-
suisse.com
+91 22 6777 3716
Prateek Singh
prateek.Singh@credit-
suisse.com
+91 22 6777 3894

01 December 2015
Asia Pacific Equity Strategy 45
months is faster than this rate, market P/E starts to rise without any absolute increase in
prices, and this worries investors. However, a pace of 1-1.5% cuts over three months is
likely to drive upside for the broader indices.
Throughout 2015, the three-monthly pace of cuts sustained at 3.5-5%. This was largely
because of cuts to "global" earnings: nearly half of Nifty revenues are not in INR: not just
known exporters like IT Services or Pharmaceutical companies but also refiners and metal
companies whose prices are global, and also large index constituents like Tata Motors for
whom the primary earnings drivers lie outside India. As global commodity prices continued
to fall through the year, these earnings have plummeted (Figure 95).
Figure 95: Earnings cuts have come from global sectors Figure 96: Going forward, risks from Materials/PSU Banks
482 0.2 0.2 0.50.7 0.9 1.5 2.4
5.2
8.4
11.2
450
440
445
450
455
460
465
470
475
480
485
FY
16 E
PS
Ene
rgy
Tel
ecom IT
Util
ities
Sta
ples
Indu
stria
ls
Pha
rma
Fin
anci
als
Aut
os
Mat
eria
ls
FY
16 E
PS
Now
1-Ju
l-15
Largely Tata Motors
Global Linked cuts
Change in FY16 Nifty EPS since July-2015
405
13
8
6
6
5
4
2
2
2
2
0
0
-3450
400 410 420 430 440 450 460
FY15 Nifty EPS
Private Bank
Cons. Disc.
Energy
IT
PSU Bank
Health Care
Utilities
Staples
NBFC
Industrials
Real Estate
Telecom
Materials
FY16 Nifty EPS
can benefit from INR depreciation
Source: Company data, Credit Suisse estimates Source: Company data, Credit Suisse estimates
Going forward, the pace of cuts in global sectors should reduce as the pace of commodity
price decline abates (e.g. oil prices declined ~$60/bbl last year; they cannot fall as much
now). Further, with index weights of these sectors lower, impact on the broader market
should be smaller too. However, cuts are likely in Materials and in PSU banks (Figure 96).
Valuations: Still cheap on a relative basis
Figure 97: 12M fwd PE chart—unchanged over 12 months Figure 98: MSCI India premium to MSCI world still low
5
10
15
20
25
2004 2005 2006 2007 2008 2009 2010 2011 2012 2013 2014
MSCI India P/E +1 sigma -1 sigma
-60%
-40%
-20%
0%
20%
40%
60%
80%
100%
Dec-00 Dec-02 Dec-04 Dec-06 Dec-08 Dec-10 Dec-12 Dec-14
India's PE premium over MSCI World
Source: Company data, Credit Suisse estimates Source: Company data, Credit Suisse estimates

01 December 2015
Asia Pacific Equity Strategy 46
The negative market returns over the past 12 months were primarily driven by steep
earnings cuts: P/E multiples have not changed (Figure 97), even if they are now 8% below
the peak. While compared to India's own history they appear high, on a relative basis, they
have rarely been lower in the past decade (Figure 98): MSCI India P/E premium to MSCI
World is now just 6%: where it was in Sep-2013. We believe MSCI World is a better
benchmark to measure global investor preference for equities, and not MSCI EM or MSCI
AxJ. Given the large growth differential, we expect this premium to expand.
What could surprise in 2016?
Broad-based recovery to continue
While market attention is focused on corporate earnings and on big-bang reforms and
remains pessimistic, the changes are happening on different fronts: both the RBI and the
government are working towards financial inclusion (new banking licences, PMJDY,
MUDRA), and state governments competing to attract investments is leading to a
significant improvement in ease of doing business even if not in every state. Further,
productivity increase from continuing improvements in rural roads, electrification and in
mobile telephony (particularly the launch and rapid pick-up of 4G services) can be
meaningful. This is already showing up in a recovery in broad-based indicators such as oil,
power and auto demand (link).
Credit quality (negatively) and Credit growth (positively)
By now, it is well known that there is a substantial quantum of unrecognised bad corporate
loans in the system. In sectors such as metals, these are only likely to get worse. However,
what is not known is when these would get recognised or cleaned up: that would drive
earnings and stock prices. We believe as banks see that a government-owned bad bank is
less likely to come, they may start preparing to book losses on these loans. As some banks
go down this path (e.g., after creating capital buffers through asset sales), others will be
forced to as well. Negative reported surprises on asset quality are therefore likely in 2016.
At the same time, as WPI starts to move out of the deep negative territory (if the index
stays unchanged, it would be at +0.5% YoY by Feb-16 from about -4% currently), credit
growth is likely to pick up from the 9-10.5% YoY range it has been in over the past 12
months. While there is much attention paid to the poor bank balance sheets, the bigger
trouble, in our view, has been loan demand rather than supply.
Impact of Pay Commission
The recently submitted Pay Commission report is likely to get implemented by the middle
of CY16 by the central government. That is then likely to trigger similar revisions in state
governments, as well as Public Sector Units. The once-in-ten-years revision in
compensation thus affects nearly 40% of India's formal sector employment, and is a
massive transfer from one hand to another. While the numbers (Rs1.02 tn at the central
level) have been well discussed, the implications for demand of consumer products and
even tier-3/4 housing is not well appreciated.
Top ideas in 2016
Long: Hindustan Unilever. This is the best play on premiumisation in the Indian market as
the company commands a much higher share in premium segments compared to mass
segments. The company is equally well placed to capitalise on the penetration opportunity in
India, given its distribution reach and innovative rural marketing initiatives. The 7th Pay
Commission implementation, which should significantly boost consumption expenditure,
should be an additional boost. Parent Unilever’s focus globally is on personal care, which is
also the focus for HUL. The India management is empowered to take decisions and localise
go-to-market strategy to deal with regional competitors. HUL can face a gross margin
tailwind of 150-250 bp were GST to be implemented at an RNR of 20%. GST is also a
negative for unorganised players as they come under the tax net, which is positive for HUL.

01 December 2015
Asia Pacific Equity Strategy 47
Long: Tech Mahindra. Tech Mahindra is attractive from a risk-reward perspective. The
telecom business seems to have bottomed out; though the environment remains challenged,
2H will be seasonally stronger for telecom. On enterprise, management remains optimistic of
manufacturing and financial services. Margins expanded in 2Q and could improve further from
the current depressed levels. Market expectations from the stock have come down
significantly and at 14x 12-month forward P/E, valuations are accommodative.
Short: Bharti Airtel. Our negative stance on Bharti Airtel stems from two structural
concerns: (1) Repeated auctions in a spectrum-starved market could continue to drain
cash flows—especially for serious players like Bharti who cannot avoid auctions for
competitive reasons and (2) the upcoming launch of 4G services by RJio with a large-
scale nationwide network. We see both these themes (which could play out significantly in
2016) driving down returns in an industry that has failed to show any signs of agreeing on
a discipline on pricing. Our EBITDA estimates are 8-10% below consensus for FY17/FY18.
At 6.2x FY17 EV/EBITDA, we see downside to Bharti Airtel's stock and reiterate our
UNDERPERFORM rating

01 December 2015
Asia Pacific Equity Strategy 48
Indonesia Turn of the cycle
Summary view: 2016 is likely to be a year of earnings turnaround. This, we believe, could
be the first year in six where earnings see a potential upgrade cycle. These upgrades will
be driven by larger government spending and potential rate cuts. Not every sector will
benefit and stock picking will be much more important. We maintain our JCI target of 5,300
based largely on earnings growth and mild rerating, an 18% upside.
Figure 99: Top stock ideas for 2016
Mkt Yield P/B ROE Net debt/
Target cap P/E (x) (%) (x) (%) equity (x)
Company RIC Rating Curr. Price price (mn) FY14A FY15E FY16E FY16E FY16E FY16E FY16E
Top outperformers
Astra International ASII.JK O IDR 6,175 7,600 18,267 12.8 14.5 12.4 4.1% 2.3 18.6% 40.4%
Gudang Garam GGRM.JK O IDR 50,400 61,500 7,086 18.1 18.1 16.1 2.1% 2.4 14.9% 34.6%
XL Axiata EXCL.JK O IDR 3,770 5,150 2,351 -35.8 228.2 17.5 3.1% 2.2 12.4% 151.7%
Summarecon SMRA.JK O IDR 1,580 1,960 1,666 16.5 17.8 15.0 1.6% 3.0 20.0% 42.6%
Top relative underperformers
Bank Central Asia BBCA.JK U IDR 13,500 11,500 24,322 20.1 19.3 18.7 1.2% 3.2 17.2% Net cash
Ace ACES.JK N IDR 790 600 990 24.4 23.9 21.9 1.6% 4.3 19.7% Net cash
Source: Company data, Thomson Reuters, Credit Suisse estimates
Earnings outlook: bottomed!
With 12 quarters of falling economic growth now, earnings expectations have also
gone through a major transformation from rampant optimism to resigned pessimism.
We believe that 2016 could be the first year in four where earnings growth will be
faster than the previous one. We also believe that consensus numbers now are
perhaps understating the potential growth.
At the beginning of 2015, the 2016 earnings were expected to show nearly 14%
growth. This has now slipped to just barely above 10%. Interestingly, at even this
depressed level of growth it is one of the fastest earnings growth in the region.
However, we believe that there is now room for upward surprise in this number. Our
analysis of previous economic cycles shows that earnings could potentially grow 20%.
Figure 100: Consensus now expecting a 11% growth for 2016
290
340
390
440
490
540
Dec
-10
Mar
-11
Jun-
11
Sep
-11
Dec
-11
Mar
-12
Jun-
12
Sep
-12
Dec
-12
Mar
-13
Jun-
13
Sep
-13
Dec
-13
Mar
-14
Jun-
14
Sep
-14
Dec
-14
Mar
-15
Jun-
15
Sep
-15
FY11E FY12E FY13E
FY14E FY15E FY16E
-0.4% 7.8%
8.7%
-7%
11.1%
Source: IBES, MSCI, Credit Suisse estimates
Jahanzeb Naseer
jahanzeb.naseer@credit-
suisse.com
+62 21 2553 7977

01 December 2015
Asia Pacific Equity Strategy 49
What does the earnings experience in previous
cycles suggest?
In the figure below we show the relationship of earnings with the economic cycle over
the past 15 years. Once the economy bottoms, as we expect it would in 3/4Q 2015,
earnings tend to grow much faster than the nominal GDP growth over the next two
years. In fact, in the past three cycles they grew exactly twice as fast. We expect GDP
to grow about 5% and inflation to be about 5% in 2015. If the previous relationship
was to hold, against the backdrop of 10% nominal GDP growth earnings could grow
20%. This is not our base case but is not beyond reasonable.
Figure 101: In two-years following GDP bottom, earnings grow at 2x rate of nominal GDP
0%
5%
10%
15%
20%
25%
30%
35%
40%
45%
50%
Mar-02 to Jun-05 Jul-06 to Feb-08 Apr-09 to Apr-10 2015E-2016E
Avg Annual Nom GDP Avg Annual EPS growth
Source: Bloomberg, Credit Suisse estimates
Valuations
Ostensibly, Indonesia does not look cheap. Firstly, it has never been a cheap "value"
market. Secondly, if we believe we are close to an earnings trough then P/Es are
likely to look somewhat rich. In the figure below, we have shown what the P/E would
look like if the scenario that we painted above, i.e., a 10% nominal GDP growth and
20% earnings growth were to transpire. In that case the market is actually trading at
11x 2016 earnings.
Figure 102: Indonesia's 12M forward P/E falls sharply if
we take normalised 2016 earnings
Figure 103: Looks cheap on P/B relative to history
0
2
4
6
8
10
12
14
16
18
20
-80%
-60%
-40%
-20%
0%
20%
40%
Jan-
05
Sep-
05
May
-06
Jan-
07
Sep-
07
May
-08
Jan-
09
Sep-
09
May
-10
Jan-
11
Sep-
11
May
-12
Jan-
13
Sep-
13
May
-14
Jan-
15
Sep-
15
May
-16
12M Fwd EPS YoY (LHS) 12M Fwd PE (RHS)
Based on top down earningsgrowth assumption
1.4
2.4
1.0
1.5
2.0
2.5
3.0
3.5
4.0
4.5
5.0
Ma
y-0
5
No
v-0
5
Ma
y-0
6
No
v-0
6
Ma
y-0
7
No
v-0
7
Ma
y-0
8
No
v-0
8
Ma
y-0
9
No
v-0
9
Ma
y-1
0
No
v-1
0
Ma
y-1
1
No
v-1
1
Ma
y-1
2
No
v-1
2
Ma
y-1
3
No
v-1
3
Ma
y-1
4
No
v-1
4
Ma
y-1
5
No
v-1
5
P/B 10-yr avg +1 sd +2 sd -1 sd -2 sd
Source: Bloomberg, Credit Suisse estimates Source: Bloomberg

01 December 2015
Asia Pacific Equity Strategy 50
What could surprise in 2016?
There are three areas where we think we can see surprises. Two of these are positive and
one is negative.
Positive response to tax amnesty scheme. The government is in the process of
proposing a very generous scheme that allows undeclared wealth to be brought into the
system with a penalty of 3-6%. This could be a significant boost to tax revenues, and by
implication, to government spending as well as for asset values.
Rate cuts. Indonesia real rates are now running at 3% and need to be cut. BI has been
waiting to see the market response to the US rate rise before cutting rates. If the market
response is orderly, we expect BI to cut rates by about 75 bp in 2016.
Political uncertainty. After a somewhat unsteady start, President Jokowi has been able
to consolidate power and reorganise his cabinet. The next step is to try and build a
coalition in the parliaments that gives him a majority. This will also be a test for his
opponents as they will try to oppose such a move. We believe 1Q16 will be the key period
for this and could result in potential political noise.
Top ideas in 2016
Astra (OUTPERFORM): We believe that we are at a point where the industry has
bottomed and headwinds start to ease. Launches of new models are well received by the
market, alleviating industry sales and reducing discounts. 2016 could be the first year after
three years that industry volumes start to normalise; we are expecting 10-12% volume
growth. In the long term, the rising spending on infrastructure would lead to more roads
and in turn more cars. Indonesia is still one of the most underpenetrated 4W market with
penetration at 5%.
XL- Axiata (OUTPERFORM). Data consumption has proven to be more resilient than any
staple in a downturn .Fundamentally, we like this sector as for the first time in nearly five
years we are starting to see blended ASP increases as data discounts are going away.
Coupled with industry consolidation over the past few years, margins can finally improve.
In addition, 3G capex is now down, resulting in a sharp improvement in FCF. Coming from
a lower earnings base EXCL should benefit from these trends more than others. We
expect 30% earnings growth next year.
BCA (UNDERPERFORM). Credit costs in the sector have not increased despite a
weakness in the economy and increase in corporate leverage over the past few years. We
believe this is partly due to the relaxation in OJK regulations that allow more leeway for
banks. We believe that credit costs are likely to rise next year and will put pressure on
NIMs. Further loan growth is likely to be below street expectations as economic recovery
is narrow and driven by infrastructure where most listed banks don’t have exposure.
Trading at 3.6x book at 3% earnings growth, we find BCA expensive.
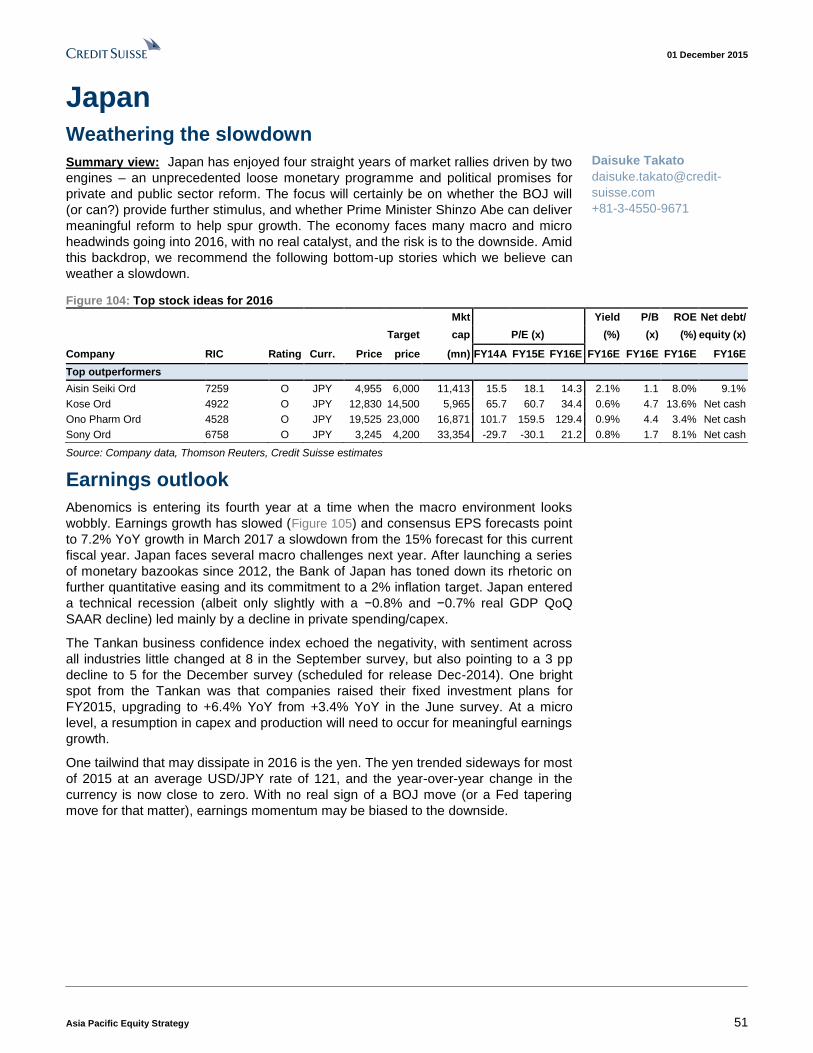
01 December 2015
Asia Pacific Equity Strategy 51
Japan Weathering the slowdown
Summary view: Japan has enjoyed four straight years of market rallies driven by two
engines – an unprecedented loose monetary programme and political promises for
private and public sector reform. The focus will certainly be on whether the BOJ will
(or can?) provide further stimulus, and whether Prime Minister Shinzo Abe can deliver
meaningful reform to help spur growth. The economy faces many macro and micro
headwinds going into 2016, with no real catalyst, and the risk is to the downside. Amid
this backdrop, we recommend the following bottom-up stories which we believe can
weather a slowdown.
Figure 104: Top stock ideas for 2016
Mkt Yield P/B ROE Net debt/
Target cap P/E (x) (%) (x) (%) equity (x)
Company RIC Rating Curr. Price price (mn) FY14A FY15E FY16E FY16E FY16E FY16E FY16E
Top outperformers
Aisin Seiki Ord 7259 O JPY 4,955 6,000 11,413 15.5 18.1 14.3 2.1% 1.1 8.0% 9.1%
Kose Ord 4922 O JPY 12,830 14,500 5,965 65.7 60.7 34.4 0.6% 4.7 13.6% Net cash
Ono Pharm Ord 4528 O JPY 19,525 23,000 16,871 101.7 159.5 129.4 0.9% 4.4 3.4% Net cash
Sony Ord 6758 O JPY 3,245 4,200 33,354 -29.7 -30.1 21.2 0.8% 1.7 8.1% Net cash
Source: Company data, Thomson Reuters, Credit Suisse estimates
Earnings outlook
Abenomics is entering its fourth year at a time when the macro environment looks
wobbly. Earnings growth has slowed (Figure 105) and consensus EPS forecasts point
to 7.2% YoY growth in March 2017 a slowdown from the 15% forecast for this current
fiscal year. Japan faces several macro challenges next year. After launching a series
of monetary bazookas since 2012, the Bank of Japan has toned down its rhetoric on
further quantitative easing and its commitment to a 2% inflation target. Japan entered
a technical recession (albeit only slightly with a −0.8% and −0.7% real GDP QoQ
SAAR decline) led mainly by a decline in private spending/capex.
The Tankan business confidence index echoed the negativity, with sentiment across
all industries little changed at 8 in the September survey, but also pointing to a 3 pp
decline to 5 for the December survey (scheduled for release Dec-2014). One bright
spot from the Tankan was that companies raised their fixed investment plans for
FY2015, upgrading to +6.4% YoY from +3.4% YoY in the June survey. At a micro
level, a resumption in capex and production will need to occur for meaningful earnings
growth.
One tailwind that may dissipate in 2016 is the yen. The yen trended sideways for most
of 2015 at an average USD/JPY rate of 121, and the year-over-year change in the
currency is now close to zero. With no real sign of a BOJ move (or a Fed tapering
move for that matter), earnings momentum may be biased to the downside.
Daisuke Takato
daisuke.takato@credit-
suisse.com
+81-3-4550-9671

01 December 2015
Asia Pacific Equity Strategy 52
Figure 105: MSCI Japan—2015 and 2016 IBES EPS estimate (JPY)
50
55
60
65
70
75
100
105
110
115
120
125
Dec-13 Mar-14 Jun-14 Sep-14 Dec-14 Mar-15 Jun-15 Sep-15
EP
S
JPY
/US
D
JPYUSD
2015 EPS
2017 EPS
+14.9%
+7.2%
2016 EPS
Source: IBES, MSCI, Credit Suisse estimates
Valuations
Valuations in Japan have recovered from the 2012 trough, and have trended around
the average 14x over the past five years, driven by higher earnings and an improved
stance on capital management. The P/B stands at 1.4x, which is slightly above the
1.2x average post-global financial crisis, but well below ten-year historical levels.
Figure 106: Japan fwd P/E: trending flat Figure 107: Trailing P/B chart
8
10
12
14
16
18
20
22
2004 2005 2006 2007 2008 2009 2010 2011 2012 2013 2014 2015
Pre-GFC avg 16.7 x Post-GFC avg 13.7x
0.8
1.0
1.2
1.4
1.6
1.8
2.0
2.2
2.4
2004 2005 2006 2007 2008 2009 2010 2011 2012 2013 2014 2015
Pre-GFC avg 1.8 x Post-GFC avg 1.2x
[Source: Company data, Credit Suisse estimates Source: Company data, Credit Suisse estimates

01 December 2015
Asia Pacific Equity Strategy 53
What could surprise in 2016?
The BOJ is done: Will it, or won’t it? Throughout the year, there was expectation that the
BOJ would provide another monetary boost, and that the Federal Reserve would begin its
tapering. The question is whether the BOJ is done, and whether it has abandoned its 2%
inflation target. Depending on this, this will impact…
...the JPY—weaker or stronger?: With no clarity on when the central banks will move,
the JPY may see periods of volatility. Our 12-month house forecast is for the yen to
weaken to 130 yen, given the rising interest rate environment (e.g. US treasuries vs JGBs).
The weaker yen should provide a boost to exporters, as it has historically done, and also
help import inflation.
The end of Abenomics: Abe’s popularity has waned, and his steam-rolling of a national
security bill was met with vehement opposition and rare civilian demonstrations in front of
the Diet. While Abe secured his premiership after being re-elected the LDP leader, further
strong-arm tactics could erode his efficacy. Key events to watch out for is the Upper
House election in July and the debate surrounding the consumption tax hike in April 2017.
Top ideas in 2016
Aisin Seiki (7259): We expect Japan’s second-largest auto parts maker to benefit from
global growth in automatic transmission demand, where it commands high market share.
We expect Aisin Seiki to be a central player in Toyota Motor’s push to consolidate its
suppliers through its TNGA (Toyota New Global Architecture) programme, which should
help boost margins and profitability. (2 Oct report)
Kose (4922): With strong brand-recognition in cosmetics, Kose has seen profits rising
driven by inbound tourist demand, but catalysts are still plentiful with the next year likely to
boost earnings from expansion of duty-free stores, cross-border e-commerce in Asia, and
improved shareholder returns. (19 Nov report)
Ono Pharmaceutical (4528): We expect the PD1 inhibitor cancer treatment Opdivo to
generate high domestic sales and overseas royalties, and believe investors have yet to
fully price in profit growth from Opdivo’s emergence as a blockbuster product. We also
believe that risks of potential reimbursement price cuts for Opdivo will likely be postponed
and have reflected that in our recent forecasts. (20 Nov report)
Sony (6758): The shift to higher-resolution cameras in smartphones will help drive
earnings, with OP growing 40% sequentially over the next two years. Increased use in
automobiles safety systems and automatic braking/parking should also be a long-term
demand catalyst, as is the PlayStation 4. (3 Sep initiation report)
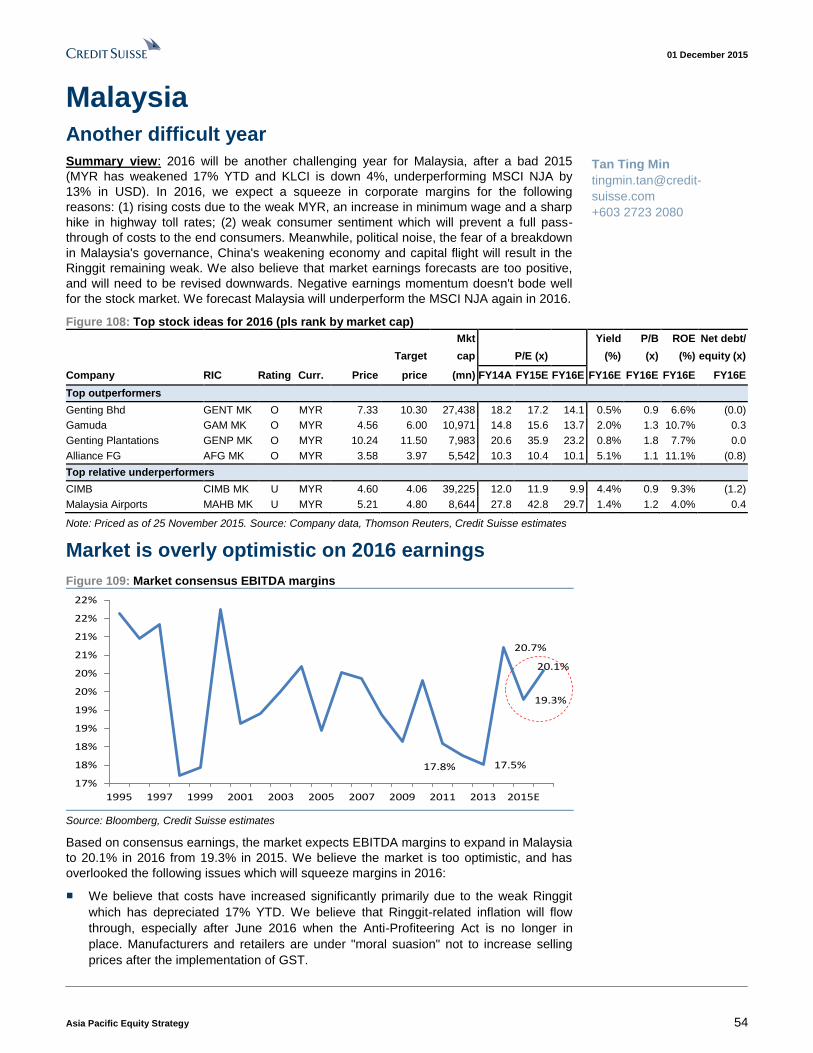
01 December 2015
Asia Pacific Equity Strategy 54
Malaysia Another difficult year
Summary view: 2016 will be another challenging year for Malaysia, after a bad 2015
(MYR has weakened 17% YTD and KLCI is down 4%, underperforming MSCI NJA by
13% in USD). In 2016, we expect a squeeze in corporate margins for the following
reasons: (1) rising costs due to the weak MYR, an increase in minimum wage and a sharp
hike in highway toll rates; (2) weak consumer sentiment which will prevent a full pass-
through of costs to the end consumers. Meanwhile, political noise, the fear of a breakdown
in Malaysia's governance, China's weakening economy and capital flight will result in the
Ringgit remaining weak. We also believe that market earnings forecasts are too positive,
and will need to be revised downwards. Negative earnings momentum doesn't bode well
for the stock market. We forecast Malaysia will underperform the MSCI NJA again in 2016.
Figure 108: Top stock ideas for 2016 (pls rank by market cap)
Mkt Yield P/B ROE Net debt/
Target cap P/E (x) (%) (x) (%) equity (x)
Company RIC Rating Curr. Price price (mn) FY14A FY15E FY16E FY16E FY16E FY16E FY16E
Top outperformers
Genting Bhd GENT MK O MYR 7.33 10.30 27,438 18.2 17.2 14.1 0.5% 0.9 6.6% (0.0)
Gamuda GAM MK O MYR 4.56 6.00 10,971 14.8 15.6 13.7 2.0% 1.3 10.7% 0.3
Genting Plantations GENP MK O MYR 10.24 11.50 7,983 20.6 35.9 23.2 0.8% 1.8 7.7% 0.0
Alliance FG AFG MK O MYR 3.58 3.97 5,542 10.3 10.4 10.1 5.1% 1.1 11.1% (0.8)
Top relative underperformers
CIMB CIMB MK U MYR 4.60 4.06 39,225 12.0 11.9 9.9 4.4% 0.9 9.3% (1.2)
Malaysia Airports MAHB MK U MYR 5.21 4.80 8,644 27.8 42.8 29.7 1.4% 1.2 4.0% 0.4
Note: Priced as of 25 November 2015. Source: Company data, Thomson Reuters, Credit Suisse estimates
Market is overly optimistic on 2016 earnings
Figure 109: Market consensus EBITDA margins
17.8% 17.5%
20.7%
19.3%
20.1%
17%
18%
18%
19%
19%
20%
20%
21%
21%
22%
22%
1995 1997 1999 2001 2003 2005 2007 2009 2011 2013 2015E
Source: Bloomberg, Credit Suisse estimates
Based on consensus earnings, the market expects EBITDA margins to expand in Malaysia
to 20.1% in 2016 from 19.3% in 2015. We believe the market is too optimistic, and has
overlooked the following issues which will squeeze margins in 2016:
■ We believe that costs have increased significantly primarily due to the weak Ringgit
which has depreciated 17% YTD. We believe that Ringgit-related inflation will flow
through, especially after June 2016 when the Anti-Profiteering Act is no longer in
place. Manufacturers and retailers are under "moral suasion" not to increase selling
prices after the implementation of GST.
Tan Ting Min
tingmin.tan@credit-
suisse.com
+603 2723 2080

01 December 2015
Asia Pacific Equity Strategy 55
■ Transportation costs have also increased from the trough following a 35 sen per litre
hike in oil price (oil subsidies have been completely removed) and a 17-100% rise in
toll rates in the Klang Valley.
■ Consumer sentiment is at record low, even weaker than the previous GFC and AFC
crises, hence higher costs cannot be fully passed on to the end consumers.
■ During the 2016 Budget, PM Najib announced an increase of minimum wage effective
from 1 July 2016. The current minimum wage of RM900 in Peninsular Malaysia will be
increased to RM1,000 per month. In 2013, when the minimum wage was first imposed,
2013 EBITDA margins fell 0.3 pp to 17.8%—the plantation, consumer cyclicals,
utilities and tech sectors saw the largest fall in margins. The new minimum wage
should have a smaller impact on margins as the proposed hike of 11% is not as high
as the estimated 5-30% hike in 2013.
Although 2016 EPS has been revised down by 12% YTD, market consensus figures are
still expecting an 8% YoY increase in profits, which we believe is just too optimistic.
Therefore, we expect Malaysia's earnings momentum to deteriorate further, which does
not bode well for the stock market.
Figure 110: MSCI Malaysia 2016 EPS growth expectations of 8.0% is too optimistic, in
our opinion
EPS growth (%) 2014 2015 2016
Dec-14 -1.7 9.2
Mar-15 -5.1 6.8 8.8
Jun-15 -5.3 2.3 10.0
Sep-15 -5.3 -2.5 10.0
Nov-15 -5.3 -2.7 8.0
Source: MSCI, Credit Suisse estimates
Figure 111: MSCI Malaysia—2015 and 2016 IBES EPS estimate (US$) has been revised
down 13% and 12% YTD, but 2016 forecasts are still too optimistic
75
80
85
90
95
100
105
1/14 3/14 5/14 7/14 9/14 11/14 1/15 3/15 5/15 7/15 9/15
EPS 15E EPS 16E
Source: IBES, MSCI, Credit Suisse estimates

01 December 2015
Asia Pacific Equity Strategy 56
Are we there yet? No
Malaysia’s P/B shows that we are close to GFC low, evident from the following charts:
■ MSCI Malaysia trailing P/B of 1.71x is only 16% above GFC’s low of 1.47x in October
2008. This is the lowest that MSCI Malaysia has hit since the GFC.
■ MSCI Malaysia forward P/B chart shows that the current 1.61x is only 16% above the
GFC low of 1.40x, and is already below one standard deviation. This is the lowest P/B
valuation since the GFC.
Although the MSCI Malaysia P/B charts look relatively attractive, they do not capture our
concerns on the Ringgit. The high foreign bond ownership of 46% puts the Ringgit in a
vulnerable position, in our view.
Figure 112: MSCI Malaysia forward P/E chart Figure 113: MSCI Malaysia trailing P/B chart
Mean, 15.4
+1 Std, 17.3
-1 Std, 13.4
10.0
12.0
14.0
16.0
18.0
20.0
22.0
Dec-04 Mar-06 Jun-07 Sep-08 Dec-09 Mar-11 Jun-12 Sep-13 Dec-14
1.4
1.7
2.0
2.3
2.6
Jan-06 Oct-06 Jul-07 Apr-08 Jan-09 Oct-09 Jul-10 Apr-11 Jan-12 Oct-12 Jul-13 Apr-14 Jan-15 Oct-15
+1SD: 2.3
-1SD: 1.8
Avg: 2.1
Source: Bloomberg, Company data, Credit Suisse estimates Source: Bloomberg, Company data, Credit Suisse estimates
The sale of the 1MDB power unit is the first step to resolving 1MDB's RM42 bn debt. The
sale of a 60% stake in Bandar Malaysia will likely be concluded by end-2015. Once all of
1MDB's assets are finally disposed of, we believe 1MDB can be wound down. This event
will inject a short-term boost to the Malaysian market, but the long-term issues that
Malaysia faces have not blown away.
Light at the end of a very long tunnel
■ The TPPA is positive for Malaysia because (1) Malaysia is very dependent on trade,
(2) TPPA will open up four new markets' access to Malaysia—the US, Canada,
Mexico and Peru; (3) first mover advantage; and (4) increased FDIs from MNCs.
Unfortunately, it will take some two years for the TPPA to be ratified. Hence,
Malaysia's entry into TPPA will only occur early 2018, in our view. Who will benefit?
Export industries such as plantations, e.g., palm oil and rubber, plywood, electronics,
textile, automotive parts and components.
■ China's "One road, one belt" aims to promote infrastructure development in Asia,
the Middle East, parts of Europe, South Asia and Southeast Asia to enable deeper
economic co-operation (via ports, railway lines and power grids). Together, this belt
and road plan covers 65 countries and 4.4 bn people. Malaysia is one of the countries
which should benefit under this plan. We are already seeing early signs of China funds
investing into Malaysia—for example, the IJM-Guangxi Beibu Gulf Port JV in Kuantan
Port, China Nuclear Power Corp buying 100% of 1MDB's power assets and a China-
based consortium in a tie-up with tycoon Tan Sri Lim Kang Hoo bidding for a 60%
stake in 1MDB's Bandar Malaysia.

01 December 2015
Asia Pacific Equity Strategy 57
What could surprise in 2016?
■ Oil? We will reverse our bearish call on Malaysia if oil price bounces back
convincingly. This is because the Malaysian government derives a significant chunk of
its revenue from oil-related activities (2014 = 30%). However, CS continues to forecast
low oil prices (Brent ~US$50 per barrel) through 1Q 2016 and a shallow recovery to
just above $60 per barrel in the second half of 2015.
■ China has a huge impact on Malaysia, as China is Malaysia's largest trading partner,
accounting for some 14% of Malaysia's trade in 2014.
■ Inflows? The Malaysian government is keen to support the Ringgit, and has put in
measures to do so; for example the government has called for government-linked
agencies to repatriate funds back to Malaysia and Valuecap has been revived with
seed capital of RM20 bn. In addition, the Chinese government has announced plans to
buy Malaysia's bonds to "stabilise the financial markets."
Top ideas in 2016
Gamuda (GAM MK, Outperform, TP RM6.00)
A Gamuda-led consortium was officially awarded the PDP role for the RM32 bn Penang
Transport Masterplan (PTM) in August. Gamuda’s construction order book backlog
currently stands at RM1 bn (excluding PDP contracts) and outstanding PDP contracts
stand close to RM11 bn. Management plans to step up efforts in expanding its order book
and is keen to participate in major construction projects such as the Southern Double
Track (up to RM10 bn), Pan Borneo Highway (RM27 bn) and works on LRT 3 (RM9 bn).
We expect progress on Gamuda's water asset sale. Management believes it will be able to
sell SPLASH at closer to RM2.5 bn book value (vs state's earlier offer of RM250 mn).
Gamuda currently trades at 16x 2016E P/E vs >20x P/E in run-up to major project wins in
the past. We expect positive news flow on project awards and water asset sale to boost
sentiment and rerate the stock. Foreign ownership is currently at a 15-year low of 22%.
GENP (GENP MK, O/P, TP RM11.50)
Genting Plantation, the purest upstream Malaysian plantation company among the bigger
caps, currently trades at EV/mature hectare of US$18.7k, only 12% above its US$16.7k
GFC low and 37% below its five-year average. Being the youngest plantation company
under our coverage, it has the strongest organic growth potential. A rising tide lifts all ships.
We take the view that palm oil prices will rally in 2016, when yields fall as a result of the
current El-Nino induced drought, which would result in an upward rerating of the plantation
sector. A more leveraged way (4.5x gearing) to play the stock would be through its
warrants, which currently trades at an attractive 1% discount despite its expiry being four
years away (June 2019).
CIMB (CIMB MK, Underperform, TP RM4.06)
CIMB has the weakest capital ratio among local peers, with a fully-loaded CET 1 ratio of
9.0-9.1% as of end-3Q15. Any decline in AFS reserves, further RM weakness and asset
quality deterioration could lead to further capital ratio erosion. Though management is so
far delivering on cost-cutting initiatives (IB restructuring and MSS), earnings outlook
remains challenging as escalating funding cost amid pressures on domestic liquidity and
rising credit cost could lead to further downgrades in street’s earnings expectations.
Impaired loan ratio has been on the rise, primarily due to the deteriorating asset quality in
Indonesia, which could be further exacerbated by worsening economic conditions, weak
commodity prices and continued currency weakness. Take note that its CET 1 ratio of 9.0-
9.1% is well below Bank Negara's indicative 11% minimum requirement. We believe there
is a risk of a cash call. While CIMB is trading at its GFC P/B low of 1x, we expect ROE in
FY2015-17 to be well below GFC levels (of 11.8-14.8%) at 8.4-10.8%.

01 December 2015
Asia Pacific Equity Strategy 58
Pakistan On the cusp of an investment boom
An uptick in public/private investment, higher domestic consumption in the midst of a low
inflationary environment and better energy availability are likely to be the key drivers of
accelerating GDP growth in 2016 (4.5-5.0%). Our recently concluded Pakistan tours have
made us more optimistic about macro tailwinds—as well as triggers at the market level—
which reinforces our expectations of healthy returns for equities in 2016. We found a high
level of positivity in corporate sentiment with sighs of relief emanating from security
improvements and political stability. Companies are actively pursuing capacity expansions
in sectors, such as autos, consumers, cement and hospitals.
China-Pakistan Economic Corridor, with a price tag of US$46 bn spread across
energy/infrastructure projects, is becoming more of a reality compared to a few months
ago. Net foreign direct investment (FDI) from China in 4M FY16 was up 53% YoY and its
share of total FDI stands at 78% (up from 39% last year). Private sector groups are
moving fast towards their financial close and tariff petitions for alternative energy projects
are being fast tracked. The construction of motorways with the aid of Chinese financing
has commenced and our discussions with Chinese representatives suggest that security
concerns are addressed to quite an extent. Meetings between the military leaderships of
both countries are also supportive.
Figure 114: List of the major early harvest CPEC projects
Project Name Sponsor Project size Amount (US$ bn) Timeline Status
Power projects
Karot Hydro Power China Three Gorges South Asia 720 MW 1.65 2020 Started 2Q15
Thar Coal Power Sindh Engro Coal Mining 660 MW 1.00 2018 Financial close 1Q16
Thar Coal Power II Shanghai Electric & Sino-Sindh 1,320 MW 2.60 2018 n.a.
Port Qasim Power Sino Hydro & Al Mirqab 1,320 MW 1.80 2017 Started 2Q15
Quaid-e-Azam Solar Park Zo Energy Co 900 MW 1.33 2016 Started 1Q15
China Power Hub Coal IPP Hubco/China Power 1,320 MW 1.80 2018 Financial close 1Q16
Mining
Thar Coal I Sino-Sindh Resources 6.5mn tpa 1.30 1H 2018 Started Mar-16
Thar Coal II Sindh Engro Coal Mining 3.8mn tpa 0.90 1H 2018 Started Mar-15
Infrastructure
KHI-LHR Motorway Gov't of Pakistan 377 km 2.60 4Q 2017 Started 3Q15
Gwadar Airport & Expressway CAA/Gwadar Port Authority n.a. 0.37 4Q 2017 Started 3Q15
Karakoram Highway II Gov't of Pakistan 120 km 0.92 2018 Started Jun-15
Source: Planning Commission of Pakistan, NEPRA, company data, Credit Suisse estimates
Potential upgrade to emerging markets a key catalyst
Pakistan's likely re-entry into the Emerging Markets (EM) category is a key catalyst for 2016.
The missing box pertaining to higher regulatory powers by the Securities and Exchange
Commission of Pakistan (SECP) is likely to be checked ahead of the MSCI review in May
2016. Given Pakistan's negligible weightage (0.15-0.20%) in the case of a possible EM
upgrade, the risk of getting lost in the mainstream has been a valid concern for investors.
Moreover, having the fourth-largest weight (9%) in the Frontier Market world, particularly as
larger peers (Nigeria and Kuwait) are struggling with low oil prices, has kept Pakistan in a
sweet spot. We view a transition to EM as a big positive, as brighter growth prospects along
with a low correlation with EMs can make Pakistan a good diversification avenue.
Companies that are expected to make the first cut include: HBL, MCB, OGDC, ENGRO,
LUCK, FFC and UBL. If we draw parallels with recent EM entrants (UAE and Qatar), we
observe the rapid expansion of earnings multiples of 40-50% in the ensuing quarters after
Farhan Rizvi, CFA
farhan.rizvi@credit-
suisse.com
+65-6212-3036
Fahd Niaz, CFA
fahd.niaz@credit-
suisse.com
+65-6212-3035

01 December 2015
Asia Pacific Equity Strategy 59
the upgrade announcement. And while this may be attributed to a host of factors, the
strong one-sided trend is encouraging.
Figure 115: CS Pakistan—top stock ideas for 2016
Reuters Company Price (PRs)
TP (PRs)
Rat. Mkt. Cap
(US$ mn)
6M ADTO
(US$ mn)
P/E
(x)
P/B
(x)
EV/EBITDA
(x)
D/Y (%)
ROE (%)
15A/E 16E 15A/E 16E 15A/E 16E 15A/E 16E 16E
Key outperformers
UBL.KA United Bank Limited 164 218 O 1,904 1.8 7.9 7.1 1.3 1.3 n.a. n.a. 7.9 8.2 18.0
PKOL.KA Pakistan Oilfields 310 425 O 696 1.1 8.7 10.2 2.3 2.2 4.0 4.5 12.9 8.7 21.7
DGKH.KA DG Khan Cement 136 175 O 567 4.7 7.8 6.9 0.8 0.8 5.8 5.1 3.7 4.0 11.1
KELE.KA K-Electric 7.6 10.5 O 1,993 1.7 13.6 8.3 1.6 1.3 8.1 6.7 0.0 1.7 15.5
EGCH.KA Engro Corporation 283 368 O 1,405 8.8 8.5 7.2 2.1 1.8 5.0 4.6 3.5 4.2 24.3
Note: Priced as of 25 November 2015. Source: Thomson Reuters, Credit Suisse estimates
11% earnings growth that is prone to upside risks
Using the CS Pakistan Universe as a proxy, we forecast earnings growth of 11% for
2016E, which rises to 16% if we exclude oil & gas. Within individual ideas, KE is expected
to see the fastest momentum (+63%) led by improving operating efficiencies and the
effects of de-leveraging. Earnings growth of 17% for Engro Corp is driven by continued
positive momentum in the foods business after market share gains in 2015 and the
improved performance of other subsidiaries. Risks to our universe earnings are more
skewed to upside led by possible pricing conversions for index-heavy E&Ps. Second,
within the banking sector, we outline three possible sources of earnings upgrades: (1) the
faster commencement of project financing; (2) the steeper recognition of capital gains on
the bond portfolio and (3) a higher-than-expected rise in interest rates in 2H16.
Figure 116: MSCI Pakistan earnings downgrades led by oil & gas
55
59
63
67
71
75
Jan-
15
Feb-
15
Mar
-15
Apr
-15
May
-15
Jun-
15
Jul-1
5
Aug
-15
Sep
-15
Oct
-15
Nov
-15
Source: IBES, MSCI
Cheap valuations both absolutely and regionally
With Pakistan heading into a stronger phase of macros, we deem it relevant to look at
multiples during the previous bull cycle of 2004-08 for comparison. Currently, P/Es at 7.9x
stand at a steep 23% discount to those levels. Besides this, an appraisal with MSCI EM
Asia has also become relevant given Pakistan's likely inclusion in the EM index. While the
discount to EM Asia has narrowed from 40% three years ago to 22% currently, we believe
this gap can reduce further due to Pakistan's superior earnings growth profile (11% vs.
8%) and higher ROEs (21% vs. 12%). Additional liquidity flows ahead of a possible EM
upgrade can drive the next leg of rerating, in our view. From a value perspective, a
dividend yield of 6-7% is fairly sustainable given rather consistent payout policies.

01 December 2015
Asia Pacific Equity Strategy 60
Figure 117: Sustained momentum in macro indicators
should allow multiples to move closer to bull cycle levels
Figure 118: Discount to MSCI EM Asia at 22% despite
Pakistan earnings growth of 11% (16% ex-oil)
2.0
4.0
6.0
8.0
10.0
12.0
14.0
Nov
-05
May
-06
Nov
-06
May
-07
Nov
-07
May
-08
Nov
-08
May
-09
Nov
-09
May
-10
Nov
-10
May
-11
Nov
-11
May
-12
Nov
-12
May
-13
Nov
-13
May
-14
Nov
-14
May
-15
Nov
-15
MSCI Pakistan P/E (x)
P/E's are still 23% lower than bull-cycle levels of 10.6x
-70%
-60%
-50%
-40%
-30%
-20%
-10%
0%
10%
20%
Nov
-05
May
-06
Nov
-06
May
-07
Nov
-07
May
-08
Nov
-08
May
-09
Nov
-09
May
-10
Nov
-10
May
-11
Nov
-11
May
-12
Nov
-12
May
-13
Nov
-13
May
-14
Nov
-14
May
-15
Nov
-15
MSCI Pakistan discount to MSCI EM Asia - P/E (x)
Source: MSCI, Credit Suisse estimates Source: MSCI, Credit Suisse estimates
What could surprise in 2016?
Inflation—lower for longer: A prolonged slump in oil prices and smooth supplies of food
items could prompt the State Bank of Pakistan (SBP) to revise down its average CPI
target of 4.5-5.5% in FY16E. Market expectations are also pegged to a rate hike in 2H16.
Unfavourable result in MSCI EM upgrade decision in May 2016. This is a clear
negative and could trigger a correction. However, the decision may be deferred to the
November 2016 review, giving policy makers more time to fulfil the remaining criteria.
Iran Pakistan (IP) gas pipeline. More active engagement with Iran post the removal of
sanctions could deliver big positives, with the restart of the IP pipeline being the main one.
The project has been on the backburner for several years, even though construction on
the Iran side has been completed. It is meant to transport 750mmcfd of gas (17% of the
existing supply), with a total capex outlay for Pakistan estimated at US$1.0-1.5 bn and can
be brought online in 12-18 months. We think it can be possible to obtain financial support
from international financial institutions for this project while Iran's proposal to finance the
project may also be explored.
Another IMF programme for the continuation of structural reforms. With the existing
facility set to expire in September 2016 and funding needs adequately covered, there is a
possibility of the government entering another programme to ensure discipline on
implementing energy/tax reforms in the medium term. The importance of International
Monetary Fund (IMF) blessings was also evident in our recent interactions with the Asian
Development Bank (ADB) and the comfort that multilateral institutions derive out of clean
chits from the IMF. Recent approvals for the disbursement of US$1.0 bn from the World
Bank and US$1.4 bn from the ADB attest to this, in our view.

01 December 2015
Asia Pacific Equity Strategy 61
Top ideas in 2016
UBL: UBL remains a top banking franchise in Pakistan and appears well positioned to
benefit from the likely uptick in the credit cycle. The bank has already demonstrated a
strong intent to focus on long-term projects, being the lead arranger for the US$250 mn
Karachi-Hyderabad motorway, consortium partner for US$500 mn Engro Thar Coal
financing and lead arranger for US$600 mn in financing for Lucky Cement's coal project.
The higher allocation to long-tenure PIB bonds (61% of total investments) and
international diversification (25% of total assets) have provided some cushion against
margin compression due to falling rates. Valuations at 1.3x 2016E P/B on an 18% ROE
remain compelling, with the bank offering the highest earnings growth of 13% within our
banking coverage in 2016.
DGKC: A prime beneficiary of an acceleration in domestic demand from aggressive
infrastructure spending and China-Pakistan Economic Corridor (CPEC) projects. Domestic
offtake has remained robust (14% growth) in 4M (Jul-Oct) FY16 with the expectation of 10-
12% growth momentum over the next 2-3 years. The 2.7 mn tonnes (60% of existing
capacity) South expansion plan remains on track and should improve efficiencies over the
long term. We see a very limited risk of breakdown in price arrangement, with capacity
utilisation expected to rise to 98% by FY18 based on current growth trends, enabling 15%
of anticipated supply additions over the next three years to be easily absorbed. Valuations
at 5,1x 2016E EV/EBITDA based on a 40% regional discount remain compelling given one
of the highest EBITDA margins regionally of 38%.
K-Electric: KE has a monopoly position catering to the energy needs of the largest city
(11% of the population) which is already a supply-deficient market (35-40%). On top of this,
demand growth of 4-5% provides an opportunity which KE is positioned to exploit.
Operating cash flows are growing stronger (a 19% CAGR) driven by higher recoveries and
a reliance on short-term borrowing easing (-21% QoQ). And while the risk of sponsor exit
could prolong the share price overhang, we downplay broader risks to the business
outlook as a sustainable, profitable model is now in place in contrast to a period of
uncertainty a few years ago. A US$400 mn investment for uplifting the transmission
network is commencing and any possible sponsorship change should not derail this.
Moreover, cheap valuations (8.3x 2016E P/E) could rerate from the possible start of a
dividend policy which would make KE a "utility company" for investors in the true sense.
The structural change in Pakistan's security landscape and law and order can also be
played via this stock, in our view.
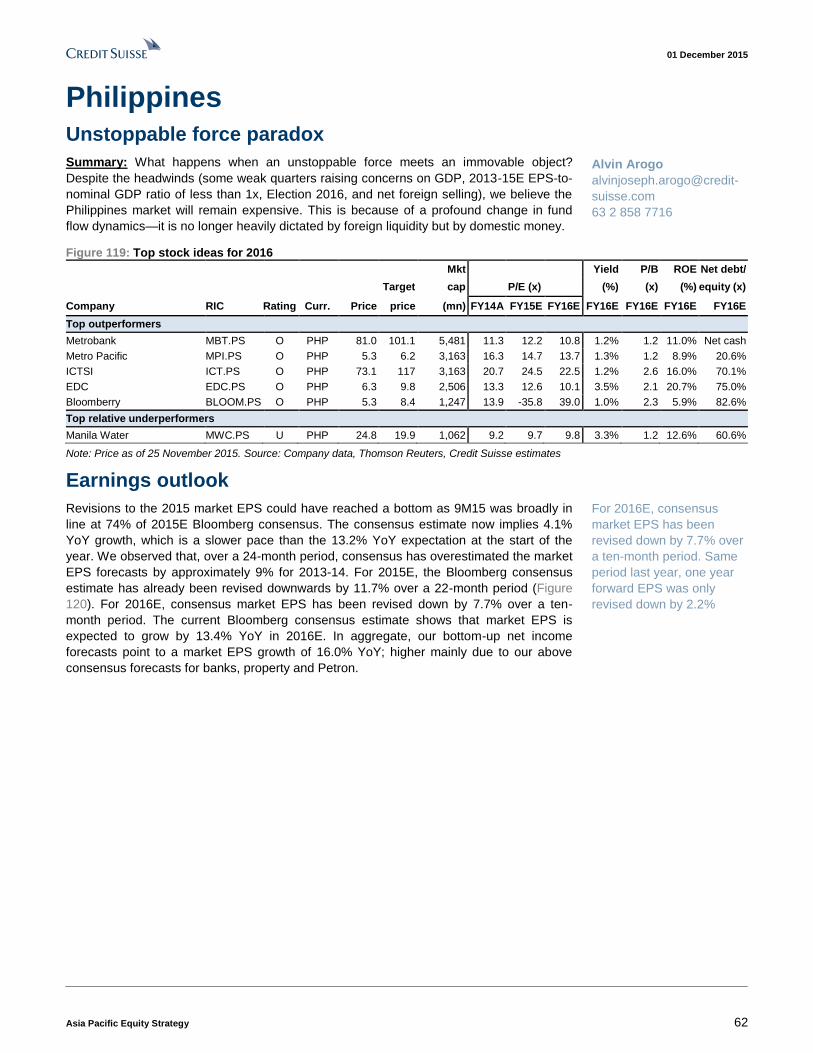
01 December 2015
Asia Pacific Equity Strategy 62
Philippines Unstoppable force paradox
Summary: What happens when an unstoppable force meets an immovable object?
Despite the headwinds (some weak quarters raising concerns on GDP, 2013-15E EPS-to-
nominal GDP ratio of less than 1x, Election 2016, and net foreign selling), we believe the
Philippines market will remain expensive. This is because of a profound change in fund
flow dynamics—it is no longer heavily dictated by foreign liquidity but by domestic money.
Figure 119: Top stock ideas for 2016
Mkt Yield P/B ROE Net debt/
Target cap P/E (x) (%) (x) (%) equity (x)
Company RIC Rating Curr. Price price (mn) FY14A FY15E FY16E FY16E FY16E FY16E FY16E
Top outperformers
Metrobank MBT.PS O PHP 81.0 101.1 5,481 11.3 12.2 10.8 1.2% 1.2 11.0% Net cash
Metro Pacific MPI.PS O PHP 5.3 6.2 3,163 16.3 14.7 13.7 1.3% 1.2 8.9% 20.6%
ICTSI ICT.PS O PHP 73.1 117 3,163 20.7 24.5 22.5 1.2% 2.6 16.0% 70.1%
EDC EDC.PS O PHP 6.3 9.8 2,506 13.3 12.6 10.1 3.5% 2.1 20.7% 75.0%
Bloomberry BLOOM.PS O PHP 5.3 8.4 1,247 13.9 -35.8 39.0 1.0% 2.3 5.9% 82.6%
Top relative underperformers
Manila Water MWC.PS U PHP 24.8 19.9 1,062 9.2 9.7 9.8 3.3% 1.2 12.6% 60.6%
Note: Price as of 25 November 2015. Source: Company data, Thomson Reuters, Credit Suisse estimates
Earnings outlook
Revisions to the 2015 market EPS could have reached a bottom as 9M15 was broadly in
line at 74% of 2015E Bloomberg consensus. The consensus estimate now implies 4.1%
YoY growth, which is a slower pace than the 13.2% YoY expectation at the start of the
year. We observed that, over a 24-month period, consensus has overestimated the market
EPS forecasts by approximately 9% for 2013-14. For 2015E, the Bloomberg consensus
estimate has already been revised downwards by 11.7% over a 22-month period (Figure
120). For 2016E, consensus market EPS has been revised down by 7.7% over a ten-
month period. The current Bloomberg consensus estimate shows that market EPS is
expected to grow by 13.4% YoY in 2016E. In aggregate, our bottom-up net income
forecasts point to a market EPS growth of 16.0% YoY; higher mainly due to our above
consensus forecasts for banks, property and Petron.
Alvin Arogo
alvinjoseph.arogo@credit-
suisse.com
63 2 858 7716
For 2016E, consensus
market EPS has been
revised down by 7.7% over
a ten-month period. Same
period last year, one year
forward EPS was only
revised down by 2.2%

01 December 2015
Asia Pacific Equity Strategy 63
Figure 120: Consensus PSEi EPS revisions over a 24-month period for 2014 to 2016
-9.8%
-11.7%
-7.7%
-14.0%
-12.0%
-10.0%
-8.0%
-6.0%
-4.0%
-2.0%
0.0%
2.0%
T-2
3
T-2
2
T-2
1
T-2
0
T-1
9
T-1
8
T-1
7
T-1
6
T-1
5
T-1
4
T-1
3
T-1
2
T-1
1
T-1
0
T-9
T-8
T-7
T-6
T-5
T-4
T-3
T-2
T-1 T
2014 2015E 2016E
Source: the BLOOMBERG PROFESSIONAL™ service, , Credit Suisse estimates
Valuations
In our Philippines outlook report for 2015 (Outlook 2015: Tale of two P/Es, 2
December), we introduced our decomposed-P/E framework as an alternative process
to analyse the Philippines market. For 2016, we have a base case target for steady-
state or "structural" P/E of 12.0x (Figure 121). This is mainly based on our estimate of
an 8.33% market cost of equity. For the 1Q13 to 3Q15 period, we estimate that
market cost of equity ranged from 7.7% to 8.7%. We have a value creation or
"sentiment" target P/E range of 6.0x to 9.0x (Figure 122). For 1Q13 to 3Q15, the range
was from 4.8x to 10.0x.
Figure 121: PSEi 12M trailing steady-state P/E from 4Q98-3Q15 (x) and CS target
Figure 122: PSEi 12M trailing value creation P/E from 4Q98-3Q15 (x) and CS targets
0
2
4
6
8
10
12
14
4Q98
4Q99
4Q00
4Q01
4Q02
4Q03
4Q04
4Q05
4Q06
4Q07
4Q08
4Q09
4Q10
4Q11
4Q12
4Q13
4Q14
4Q15
Steady-state P/E (Actual)
Steady-state P/E (Base case)
"taper tantrum"
0
2
4
6
8
10
12
14
16
18
20
4Q98
4Q99
4Q00
4Q01
4Q02
4Q03
4Q04
4Q05
4Q06
4Q07
4Q08
4Q09
4Q10
4Q11
4Q12
4Q13
4Q14
4Q15
Value creation P/E (Actual)
Value creation P/E (High)
Value creation P/E (Low)
"tapertantrum"
Source: Credit Suisse estimates Source: Credit Suisse estimates
What could surprise in 2016?
Market earnings growth. For 2016E, the current Bloomberg consensus estimate shows
that market EPS is expected to grow 13.4% YoY. This will be an improvement over the
2014A and 2015E EPS growth of 3.7% YoY and 4.1% YoY, respectively. Market EPS
grew at a 10.1% five-year CAGR ending December 2014. Our 2016E nominal GDP growth
forecast is 8.8% YoY. This implies that consensus is expecting the market EPS growth to
beat nominal GDP growth for the first time since 2012 (Figure 123). However, as we
pointed out above, consensus tends to overestimate and thus there remains a risk of
further revisions in the next few months.
We see a potential for a
"sentiment" valuation
rerating .
Consensus expectation is
for market EPS growth to
beat nominal GDP growth
for the first time since 2012.

01 December 2015
Asia Pacific Equity Strategy 64
Figure 123: PSEi EPS growth vs nominal GDP growth for 2005-16E (%)
-40%
-30%
-20%
-10%
0%
10%
20%
30%
40%
50%
2005 2006 2007 2008 2009 2010 2011 2012 2013 2014 2015E 2016E
Nominal GDP (%YoY) Market EPS (%YoY)
Source: the BLOOMBERG PROFESSIONAL™ service, CEIC, Credit Suisse estimates
Election 2016. We believe that investors are now generally sensitive to possible potholes
that could emerge during a period of change in national leadership. Political events related
to the elections have picked up sharply in the second half of 2015 and will likely continue
until the May 2016 presidential elections. We believe that most of the foundations for
macroeconomic policy are not easily reversible; however, good governance perception is
susceptible to changes and would largely depend on who will be the new President and
members of the new administration. What is certain is the low margin for error as market
P/E at election day could be highest for May 2016 (Figure 124).
Figure 124: Market P/E at election day (x)
13.7
16.0
17.2
11.0
19.1
5
7
9
11
13
15
17
19
21
23
May 1998 (Estradaelected)
Jan 2001 (Arroyo EDSA2)
May 2004 (Arroyoelected)
May 2010 (Aquinoelected)
Current
Source: BSP, the BLOOMBERG PROFESSIONAL™ service
Fund flow dynamics—the Malaysian experience could be unfolding in the
Philippines. In retrospect, it is now well known that the Malaysian market has proven
hazardous to asset allocators, as its fund flow profile is very different from that of other
markets, due to the presence of large and growing ‘captive’ domestic funds. Likewise, we
believe that the Philippines market is no longer heavily dictated by foreign liquidity but by
domestic money. From P2,255 bn or US$50 bn in December 2009, we estimate that
Philippines total AUM witnessed a CAGR of 13% to P4,097 bn or US$91 bn in December
2014. We also note during the market recovery post GFC, foreign ownership has broadly
remained stable, yet the Philippines market has been moving upwards, presumably due to
domestic buying (Figure 125). This could more than offset foreign selling, in our view.
Political events related to
the elections have picked up
sharply in the second half of
2015 and will likely continue
until May 2016
We believe that the
Philippines market is no
longer heavily dictated by
foreign liquidity but by
domestic money

01 December 2015
Asia Pacific Equity Strategy 65
Figure 125: PSEi versus foreign ownership (2001 to present)
0
1,000
2,000
3,000
4,000
5,000
6,000
7,000
8,000
9,000
20%
25%
30%
35%
40%
45%
50%
Dec-0
1
Dec-0
2
Dec-0
3
Dec-0
4
Dec-0
5
Dec-0
6
Dec-0
7
Dec-0
8
Dec-0
9
Dec-1
0
Dec-1
1
Dec-1
2
Dec-1
3
Dec-1
4
Foreign ownership level
PSEi (RHS)
Source: PSE, Credit Suisse estimates
Top ideas in 2016
Metrobank (MBT)—gradual recovery in profitability to shore up valuations. We
believe MBT's risk-reward is favourable. The short-term dilution impact on valuations
should be offset by the fact that: (1) it now has the strongest CET-1, (2) has a very
liquid/under-levered balance sheet, and (3) healthy asset quality profile. Improvement in its
ROE is critical, which should be anchored upon its steady core lending business (i.e.,
sustained loan growth and NIM recovery) and normalising credit cost.
Energy Development (EDC)—ripe for bottom fishing. Concerns on forex losses in 2015
have resulted in transient share price weakness. However, we believe that there is enough
potential upside to more than offset risks, and this is further supported by the current
undemanding valuations. 2016E P/E of 10.1x is within the stock's average minus 2
standard deviation level of 9.7x (Figure 128).
ICTSI (ICT)—long-term growth potential remains intact. Slower global trade and
currency depreciation put pressure on near-term earnings. However, we note the
defensive nature of its gateway ports: (1) able to charge for ancillary services such as
storage, packing and unpacking, and weighing, (2) relatively stable demand as they are
located close to points of consumption or production, and (3) secure pricing power as
shipping lines cannot easily transfer their business to other ports.
Among our top
OUTPERFORM-rated
stocks, we highlight MBT,
EDC, and ICT

01 December 2015
Asia Pacific Equity Strategy 66
Figure 126: PSEi—Forward P/E from Jan 2010 to current (x)
Figure 127: MBT—Forward P/E from Jan 2010 to current (x)
7.0
9.0
11.0
13.0
15.0
17.0
19.0
21.0
23.0
Jan-10 Jan-11 Jan-12 Jan-13 Jan-14 Jan-15
Fwd PER Ave-2SD Ave-1SD
Average Ave+1SD Ave+2SD
5.0
7.5
10.0
12.5
15.0
Jan-10 Jan-11 Jan-12 Jan-13 Jan-14 Jan-15
Fwd PER Ave-2SD Ave-1SDAverage Ave+1SD Ave+2SD
Source: Thomson Reuters Datastream, the BLOOMBERG
PROFESSIONAL™ service, Credit Suisse estimates
Source: Thomson Reuters Datastream, Credit Suisse estimates
Figure 128: EDC—Forward P/E from Jan 2010 to current (x)
Figure 129: ICT—Forward P/E from Jan 2010 to current (x)
7.5
10.0
12.5
15.0
17.5
20.0
22.5
25.0
Jan-10 Jan-11 Jan-12 Jan-13 Jan-14 Jan-15
Fwd PER Ave-2SD Ave-1SDAverage Ave+1SD Ave+2SD
0.0
5.0
10.0
15.0
20.0
25.0
30.0
35.0
40.0
45.0
Jan-10 Jan-11 Jan-12 Jan-13 Jan-14 Jan-15
Fwd PER Ave-2SD Ave-1SDAverage Ave+1SD Ave+2SD
Source: Thomson Reuters Datastream, Credit Suisse estimates Source: Thomson Reuters Datastream, Credit Suisse estimates

01 December 2015
Asia Pacific Equity Strategy 67
Singapore Domestic policy in focus
We expect Singapore GDP growth to remain lacklustre in 2016, reflecting a weaker growth
outlook for China and ASEAN, as well as a slower population increase. Given an uncertain
external environment, we expect the focus to be on domestic restructuring, with
government measures in the telco, property, land transport sectors closely watched. We
believe there could be downside risks to market EPS growth expectations of 5% in 2016,
vs a 2% decline in 2015. While MSCI Singapore P/B of 1.16x is close to its FY08/09 low of
1.06x, we do not see scope for a broad rerating as ROE is likely to remain depressed at
close to 9.5% (2008-09 low of 10%). We are OVERWEIGHT the real estate and
transportation sectors, and UNDERWEIGHT in the telco sector. Our top picks are DBS,
Singtel and Citydev.
Figure 130: Top stock ideas for 2016 Mkt Yield P/B ROE Net debt/
Target cap P/E (x) (%) (x) (%) equity (x)
Company RIC Rating Curr. Price Price (mn) FY14A FY15E FY16E FY16E FY16E FY16E FY16E
Top outperformers
CDL CTDM.SI O SGD 7.44 12.00 4,816 14.9 13.4 9.6 2.2 0.7 7.8 19.8
SingTel STEL.SI O SGD 3.80 4.40 43,128 16.6 16.0 15.2 4.8 2.4 16.0 34.1
DBS DBSM.SI O SGD 16.72 22.00 29,931 10.8 9.7 8.7 3.6 0.9 11.6 n.m.
Top relative underperformers
StarHub STAR.SI U SGD 3.68 3.10 4,531 17.1 16.5 17.5 5.4 30.7 183.2 119.4
SUNT SUNT.SI U SGD 1.53 1.54 2,743 16.6 14.3 13.6 6.4 0.7 5.2 55.5
M1 MONE.SI U SGD 2.85 2.35 1,901 15.1 14.9 15.4 6.5 6.7 43.6 75.8
Note: Priced as of 25 November 2015. Source: Company data, Thomson Reuters, Credit Suisse estimates
Expect more earnings cuts
Consensus 2015 and 2016 EPS were cut by 7.6% and 11.4% since January 2015,
respectively. As a result, the market now expects MSCI Singapore to see EPS growth of
5.2% in 2016, following a decline of 2.3% in 2015. The largest cuts were in consumer
discretionary, consumer staples and industrials sectors. Consumer discretionary stocks
have been impacted by weak retail sales and falling gaming revenues. Consumer staples
have been hit by a decline in commodity price, while industrial stocks have been impacted
by lower newbuild rig orders. Real estate, financials and telcos have seen relatively
resilient earnings.
Figure 131: 2015E and 2016E Singapore consensus Figure 132: MSCI Singapore EPS growth (%)
86.0
88.0
90.0
92.0
94.0
96.0
98.0
100.0
102.0
Nov
-13
Feb
-14
May
-14
Aug
-14
Nov
-14
Feb
-15
May
-15
Aug
-15
Nov
-15
Singapore - EPS15 Singapore - EPS16
-2.3
5.2 7.0
-50.0
-40.0
-30.0
-20.0
-10.0
0.0
10.0
20.0
30.0
40.0
50.0
2000
2001
2002
2003
2004
2005
2006
2007
2008
2009
2010
2011
2012
2013
2014
2015
2016
2017
MSCI SG EPS growth (%)
Source: IBES Source: MSCI
Gerald Wong
gerald.wong@credit-
suisse.com
+65 6212 3037

01 December 2015
Asia Pacific Equity Strategy 68
Attractive valuation but ROE may remain depressed
MSCI Singapore P/B of 1.16x is close to its FY08-09 low of 1.06x. The market is already
trading at a discount to P/B of 1.23x in 2001 (global recession) and 1.21x in 2003 (SARS
episode). Only during the Asian Financial Crisis of 1997-98 did P/B see much lower levels
of 0.77x. However, we do not see scope for a broad rerating as ROE is likely to remain
depressed at close to 9.5% (FY08/09 low of 10%).
Figure 133: ROE likely to decline further in 2016E Figure 134: MSCI Singapore—P/B
2%
4%
6%
8%
10%
12%
14%
16%
18%
Dec-95 Dec-97 Dec-99 Dec-01 Dec-03 Dec-05 Dec-07 Dec-09 Dec-11 Dec-13 Dec-15
MSCI Singapore - ROE
9.5% now
9.2% 2016
0.4
0.8
1.2
1.6
2.0
2.4
2.8
Dec-95 Dec-97 Dec-99 Dec-01 Dec-03 Dec-05 Dec-07 Dec-09 Dec-11 Dec-13
Singapore - Trailing PB
1.16x now
1.36x in Aug 13
1.06x in Feb 09
1.21x in Jan 03
1.23x in Sep 01
0.77x in Aug 98
1.37x in May 12
Source: MSCI, IBES Source: MSCI
What could surprise in 2016?
We expect government measures in telco, property and land transport sectors to be
closely watched.
■ Potential for a new entrant in the cellular market: We see a high probability of a
fourth cellular operator emerging from the spectrum auction in 1H16. In 2H16, we
expect cellular pricing in Singapore to come under pressure as incumbent operators
pre-empt the potential launch of services by the new player in 2017.
■ Pre-emptive recalibration of property measures: In our view, the time is ripe for an
easing of some of the measures, given that specific policy intent of these measures has
been achieved: (1) speculative activities have fallen, (2) foreign demand has been
curbed, and (3) income growth has now outpaced home prices.
■ Bus and rail restructuring in focus: With the bus government contracting model on
track to start in 3Q16, we expect continued emphasis in improving rail reliability, with a
potential transition to a similar asset light model for rail. This will be like the rail
financing framework for the Downtown Line operated by ComfortDelgro, where the
operating assets are owned directly by LTA.
Figure 135: Fourth cellular operator likely to target higher-tier data plans
25
45
65
85
105
125
145
165
185
205
225
0
50
100
150
200
250
300
350
400
450
Jun-12 Sep-15
1Gbps pricing trend
200Mbps/300Mbps pricing trend
Expected pricing trend in 10GB/12GB cellular data plans
New players in fixed BB market offeredhigh speed plans at competitive rates. It had a ripple effect reducing BB prices across the sector
We expect fourth cellular operator to follow similar strategy and offer higher-tier data packs at competitive rates, reducing sector pricing.
Past - Broadband pricing Future - Cellular data pricing
Note: Broadband (BB) and cellular data prices are on different scales; the figure is for illustrative purposes
only; Source: Company data, Credit Suisse estimates
01 December 2015
Asia Pacific Equity Strategy 69
Top ideas in 2016
CityDev (OUTPERFORM, S$7.44, TP 12.00)
■ We believe that multiple catalysts lie ahead for CDL, with further upside likely to be
driven by: (1) asset divestments to unlock portfolio value, (2) positive sales momentum
from past overseas investments, (3) a pick-up in Singapore residential sentiment in
2016, with the potential tweaking of residential policy measures, and (4) a potential re-
inclusion into the FTSE EPRA/NAREIT index.
■ We believe CDL has an underappreciated portfolio of investment properties, the value
of which could be potentially unlocked near term through an asset divestment, while
retaining long-term ownership. As at Sep-2015, CDL's investment properties are held
at S$3.1 bn vs our estimated value of S$7.6 bn.
■ With market transaction volumes at a trough, CDL will be best positioned for a
potential turnaround in sentiment in 2016, given its status as a Singapore residential
proxy.
■ We believe current valuations are attractive, at a 41% discount to RNAV (-1.4 SD from
average) and 0.79x P/B.
SingTel (OUTPERFORM, S$3.80, TP S$4.40)
■ SingTel is our top pick among the Singapore telecom stocks as the company offers a
unique combination of dividends and growth (primarily coming from associates).
Additionally, the company has the least exposure (in terms of contribution to
consolidated financials) to the Singapore cellular sector among the three Singapore
telcos.
■ We expect SingTel’s net profit to show a three-year CAGR of c4% by FY18E largely
driven by associate countries. Even though its Singapore business is likely to be under
stress from the cellular segment, the impact on consolidated earnings will not be
significant as Singapore contributes c30% (as of FY15) to consolidated net profit.
■ We believe currency movements can be a key variable in SingTel's earnings given
c70% of its earnings come from outside of Singapore which are exposed to currency
fluctuations. Based on our estimates, a 5% depreciation in the SGD vs. all group
operating currencies can lead to c3.5% decline in our FY16-17 earnings estimates.
■ We believe SingTel is trading at attractive valuations (2016E/2017E EV/EBITDA of c7x
vs c9x for M1 and StarHub) and has factored in the potential downside from the entry
of a fourth cellular operator, in our view
DBS (OUTPERFORM, S$16.72, TP S$22.00)
■ DBS benefits the most from a stronger USD and rise in short term rates. It is also the
least exposed to ASEAN asset quality risks.
■ DBS' management probably appears the most confident about the growth and asset
quality outlook for FY16E, the key difference being the lack of any meaningful onshore
exposure in ASEAN.
■ DBS has also provided more colour on key areas of concern (China/commodities
exposure) to boost confidence.
■ Key upside risks from better-than-expected NIM improvement. Key downside risks are
Singapore and China asset quality.
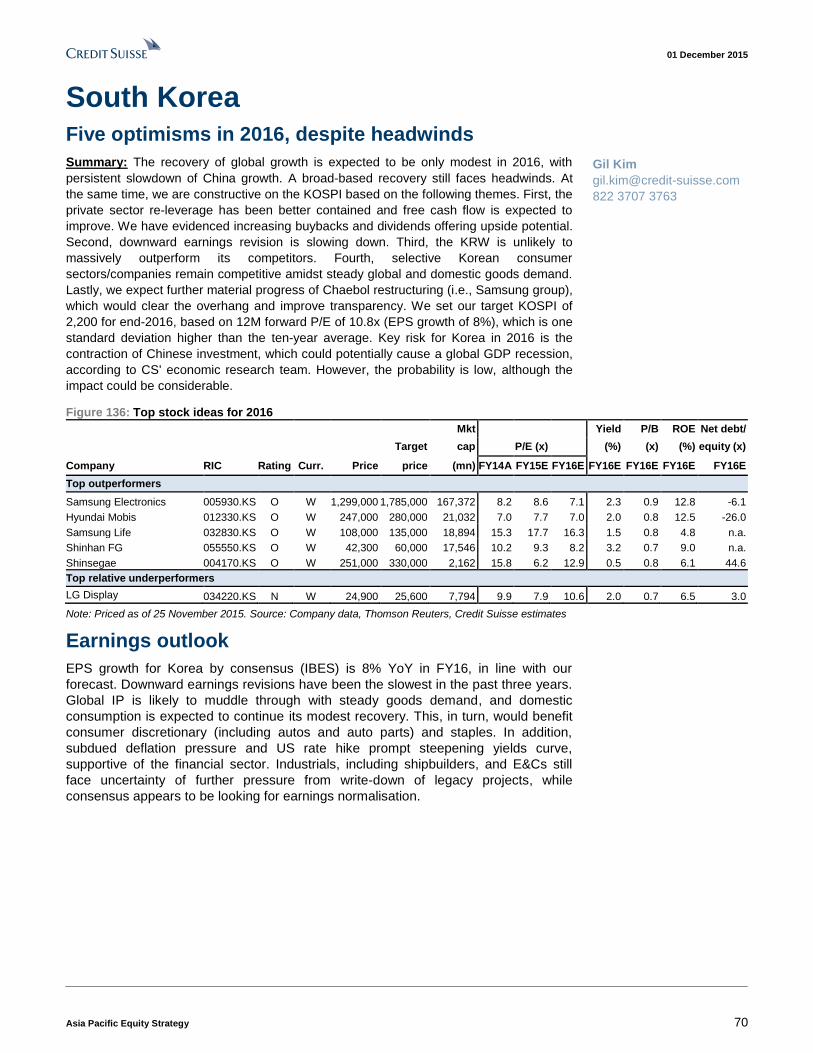
01 December 2015
Asia Pacific Equity Strategy 70
South Korea Five optimisms in 2016, despite headwinds
Summary: The recovery of global growth is expected to be only modest in 2016, with
persistent slowdown of China growth. A broad-based recovery still faces headwinds. At
the same time, we are constructive on the KOSPI based on the following themes. First, the
private sector re-leverage has been better contained and free cash flow is expected to
improve. We have evidenced increasing buybacks and dividends offering upside potential.
Second, downward earnings revision is slowing down. Third, the KRW is unlikely to
massively outperform its competitors. Fourth, selective Korean consumer
sectors/companies remain competitive amidst steady global and domestic goods demand.
Lastly, we expect further material progress of Chaebol restructuring (i.e., Samsung group),
which would clear the overhang and improve transparency. We set our target KOSPI of
2,200 for end-2016, based on 12M forward P/E of 10.8x (EPS growth of 8%), which is one
standard deviation higher than the ten-year average. Key risk for Korea in 2016 is the
contraction of Chinese investment, which could potentially cause a global GDP recession,
according to CS' economic research team. However, the probability is low, although the
impact could be considerable.
Figure 136: Top stock ideas for 2016
Mkt Yield P/B ROE Net debt/
Target cap P/E (x) (%) (x) (%) equity (x)
Company RIC Rating Curr. Price price (mn) FY14A FY15E FY16E FY16E FY16E FY16E FY16E
Top outperformers
Samsung Electronics 005930.KS O W 1,299,000 1,785,000 167,372 8.2 8.6 7.1 2.3 0.9 12.8 -6.1
Hyundai Mobis 012330.KS O W 247,000 280,000 21,032 7.0 7.7 7.0 2.0 0.8 12.5 -26.0
Samsung Life 032830.KS O W 108,000 135,000 18,894 15.3 17.7 16.3 1.5 0.8 4.8 n.a.
Shinhan FG 055550.KS O W 42,300 60,000 17,546 10.2 9.3 8.2 3.2 0.7 9.0 n.a.
Shinsegae 004170.KS O W 251,000 330,000 2,162 15.8 6.2 12.9 0.5 0.8 6.1 44.6
Top relative underperformers
LG Display 034220.KS N W 24,900 25,600 7,794 9.9 7.9 10.6 2.0 0.7 6.5 3.0
Note: Priced as of 25 November 2015. Source: Company data, Thomson Reuters, Credit Suisse estimates
Earnings outlook
EPS growth for Korea by consensus (IBES) is 8% YoY in FY16, in line with our
forecast. Downward earnings revisions have been the slowest in the past three years.
Global IP is likely to muddle through with steady goods demand, and domestic
consumption is expected to continue its modest recovery. This, in turn, would benefit
consumer discretionary (including autos and auto parts) and staples. In addition,
subdued deflation pressure and US rate hike prompt steepening yields curve,
supportive of the financial sector. Industrials, including shipbuilders, and E&Cs still
face uncertainty of further pressure from write-down of legacy projects, while
consensus appears to be looking for earnings normalisation.
Gil Kim
822 3707 3763

01 December 2015
Asia Pacific Equity Strategy 71
Figure 137: MSCI Korea—earnings estimate trend Figure 138: MSCI Korea—2016 earnings estimate trend
70
75
80
85
90
95
100
105
Jan Feb Mar Apr May Jun Jul Aug Sep Oct Nov Dec
2013 2014 2015
60
70
80
90
100
110
120
130
140
Korea
Energy
Materials
Industrials
Cons. D
isc.
Cons. S
taples
Financials
IT Telecom
Utilities
2016 Earnings Estimate Trend
J
N
M
J
O
A
S
Source: Thomson Reuters Datastream, Credit Suisse research Note: M = May, J = Jun, J = Jul, A = Aug, S = Sep, O = Oct, N = Nov
Source: Thomson Reuters Datastream, Credit Suisse research
Valuations
MSCI Korea is currently trading at 9.8x 12M forward EPS, near the ten-year average
of 9.8%. We expect to see further upside on multiples given that (1) earnings
revisions are expected to stabilise, (2) expectation on higher dividend yields or share
buy-backs, and (3) the monetary policy would remain accommodative with excessive
money supply supportive of equity market valuations. On a P/B basis, MSCI Korea is
currently trading at one standard deviation below the ten-year average since the
global financial crisis.
Figure 139: MSCI Korea 12M fwd P/E Figure 140: MSCI Korea 12M fwd P/B
6
7
8
9
10
11
12
13
14
2006
2007
2008
2009
2010
2011
2012
2013
2014
2015
12M fwd P/E (x) Avg +1 STD -1 STD
0.6
0.8
1.0
1.2
1.4
1.6
1.8
2.0
2006
2007
2008
2009
2010
2011
2012
2013
2014
2015
12M fwd P/B (x) Avg +1 STD -1 STD
Source: Thomson Reuters Datastream, Credit Suisse research Source: Thomson Reuters Datastream, Credit Suisse research
What could surprise in 2016?
Recovery of commodity prices bodes well for Korea market: Although Korea is a net
importer of commodities, we believe a recovery of commodity prices would be positive for
KOSPI considering that (1) it would be a tailwind for cyclical sectors directly (Refinery and
Materials) and indirectly (Shipbuilders and E&Cs), and (2) the emerging market economy
would improve, boding well for Korean exporters in general. CS' commodity research team
expects a trough in 1Q16 and mild recovery is expected for iron ore. However, uncertainties

01 December 2015
Asia Pacific Equity Strategy 72
still loom with fears of global economic slowdown. In case the visibility on commodities' price
improves, whether driven by supply consolidation or more preferably demand improvement,
S-Oil and Hyundai Heavy would be the key beneficiaries, in our view.
Dividend boom while excess liquidity is supportive: Driven by anticipation of modest
improvement of dividends and accommodative monetary policy, dividend yields are
expected to fall below time deposit yields for the first time in the history of Korea. In case
dividend yields rise much higher than expected, it could potentially result in more
aggressive fund inflows into the equity market by retail investors, in our view. This could
prompt a rerating of the KOSPI. In 2005, while the growth of the global economy was
lukewarm, the KOSPI has rerated from 895.9 to 1,379.4. This was largely driven by strong
domestic fund inflows on the back of the "equity instalment fund" boom. Aside from the
obvious beneficiaries of brokerage firms, high dividend yield stocks with rising EPS at
trough valuation would benefit. Based on our screening, POSCO stands out.
Currency re-denomination: In September 2015, the government of BoK said "There is
discussion about the need for re-denomination, which is aligned with my view," at the
National Assembly hearing. The statement was officially withdrawn by BoK. The finance
minister, Mr. Choi, also said "Re-denomination is not being considered for the time being."
However, we believe the current low inflation is an opportunity for re-denomination. The
benefits of re-denomination could potentially be legitimisation of underground economy if
effectively executed. This in turn would lead to greater support on fiscal policy and
recovery of domestic consumption through greater money supply. Coincidentally, the last
re-denomination was pursued by President Park, the father of the current president in
1962. The key beneficiary would be financial institutions and domestic players, both
consumers and E&Cs, in our view.
Top ideas in 2016?
Samsung Elec. (005930.KS, Outperform, Last price: W1,299,000, TP: W1,785,000)
We believe in 2016, the core investment case for Samsung Electronics will revolve around
three factors: (1) steadily rising dividend yields; (2) further upgrade in core earnings; (3) split-
up of the company into HoldCo and OpCo. Targeted annual shareholder return going
forward will be in the 30% to 50% range of previous year’s FCF generated from 2015 to end-
2017. Increasing the dividend yield will be the primary use of cash and we currently estimate
2016 and 2017 DPS will rise to W25,000 then to W30,000, implying 1.9% and 2.3% yield vs.
1.4% in 2015. We also call for core operating profit to rise 17% YoY compared to about 2%
for consensus. Key difference in view appears to be that we see low risk of DRAM profit
deterioration as investments are already being pushed out, smartphone margins remain at
10% and we have a much more optimistic outlook for OLED and System LSI recovery.
Earnings contribution has also been rebalanced between handsets and components. Finally,
with some of the major restructuring already completed at higher levels of Samsung Group,
we believe our core thesis of Samsung Electronics finally splitting up to turn into a more
efficient operating company can be realised in 2016. With core operations forecasted to
improve into 2016 and more visible capital returns now, we believe that the stock remains
severely undervalued at 0.1x forward 2016 P/B. Our TP remains at W1,785,000, which still
implies a very undemanding 1.3x 2016 P/B on increased ROE of 13%.
Hyundai Mobis (012330.KS, Outperform, Last price: W247,000, TP: W280,000)
(1) Expanding core parts (including ADAS) sales within Hyundai Motor Group. Due
to its inseparable business relationship with Hyundai Motor and Kia Motors, Mobis has
begun expanding the reach of its ADAS parts to the group’s newly launched vehicles,
including ‘Sonata’, ‘Tucson’, ‘Sportage’, and ‘K5’, as an option. Although ADAS currently
accounts for under 1% of its core parts sales, we believe the growing usage of ADAS will
boost sales of other core parts, such as braking and steering systems, and that should drive
the overall sales growth for the company. We estimate Mobis's sales/OP CAGR of 6%/6%
over 2015-18 (vs Hyundai Motor's 2% sales and 3% OP CAGR).

01 December 2015
Asia Pacific Equity Strategy 73
(2) Beneficiary of China's auto demand recovery. The recent China auto stimulus policy
should improve Mobis's overall earnings as 26% of Mobis's OP came from China in 2014.
(3) Improved shareholder returns. Mobis recently announced a 1% share buyback in
September and also guided to increase its dividend payout ratio steadily. We estimate that
the company will pay W4,000 DPS with a 12% (vs 5% in 2014) payout ratio in 2015E.
Shinsegae (004170.KS, Outperform, Last price: W251,000, TP: W330,000)
Shinsegae should benefit from the structural growth of inbound tourism and the bottoming
out of domestic consumption. Shinsegae's recent grant of the licence to operate a DFS in
downtown Seoul, upgrades Shinsegae's channel mix, given DFS is a higher growth and
higher margin business than department store channel. Also, given the new DFS will be
located at its main department store branch (1) the company is likely to be profitable with
no burden of rent expense and (2) the operational efficiency of the department store
should improve thanks to the traffic from DFS. We believe domestic consumption will
improve from a low base, and thanks to the government's focused measures to boost
domestic consumption. Shinsegae will be able to enjoy any cyclical recovery of
consumption thanks to a timely store expansion plan, increasing store space by 50% until
end-2016. The stock is trading at 13x FY16 P/E at below historical average. Stripping out
the value of the Samsung Life stake, valuation becomes even more compelling, relative to
its peers.

01 December 2015
Asia Pacific Equity Strategy 74
Taiwan Enough global health to sustain growth?
Summary view: Improving global health and US-led growth should continue to keep
Taiwan's earnings growth supported, although we estimate overall growth pace for the
market will moderate to below 5% in 2016. We do expect exporters with large USD
revenue mix to see relatively better growth and select financials to benefit from US rate
hikes while domestic and China focused business will likely stay weak. Therefore, we
maintain our slight tech overweight within Taiwan context to account for (1) better growth
(+11.8% in 2016 vs non-tech's 4.3%); (2) slightly cheaper valuation on much better ROEs;
and (3) more upside potential from further stregnth in USD.
We set our year-end 2016 TAIEX target at 9,000 (implies 7.3% potential upside) using the
same 1.5x P/B for our year-end 2015 TAIEX target that reflects moderate earnings growth.
Figure 141: Top stock ideas for 2016
Mkt Yield P/B ROE Net debt/
Target cap P/E (x) (%) (x) (%) equity (x)
Company RIC Rating Curr. Price price (mn) FY14A FY15E FY16E FY16E FY16E FY16E FY16E
Top outperformers
SPIL 2325.TW O TWD 45.0 52.0 4,325 12.0 12.2 11.7 6.4 1.22 16.4 3.0
Delta 2308.TW O TWD 158.5 196.0 12,592 18.7 22.5 19.4 3.6 3.60 25.2 0.5
Hon Hai 2317.TW O TWD 84.3 108.0 39,791 9.5 9.0 8.9 5.7 1.91 13.9 -35.1
E.Sun 2884.TW O TWD 19.9 23.0 4,803 11.9 11.0 9.9 2.0 0.45 12.7 n/m
Uni-President 1216.TW O TWD 54.2 64.0 9,441 26.6 19.3 16.8 3.6 1.23 18.1 46.6
Top relative underperformers
HTC 2498.TW U TWD 85.3 57.0 2,175 48.0 -5.0 215.6 0.1 1.94 0.5 -65.9
Note: Priced as of 25 November 2015. Source: Company data, Thomson Reuters, Credit Suisse estimates
Earnings outlook
We expect the market's earnings growth to slow to 4% in 2016 from 6% in 2015 and 23-
37% in 2013-14. The growth slowdown will be driven by (1) high earnings base with
consensus forward EPS estimates at one std dev above its long-term growth trend; (2)
more normalised (lower) capital market and FX earnings contribution; (3) weak consumer
tech demand with continuing inventory adjustment; and (4) negative impact from weak
China growth. These factors were felt more severely in 2H15 and the inventory
adjustments should run their course by 1Q16, setting up for easier compares moving
through 2016. On a YoY basis, we estimate that profits for the market will see 10-12%
decline in 1H16 before staging 16-18% YoY growth in 2H16.
Chung Hsu
chung.hsu@credit-suisse
886 2 2715 6362

01 December 2015
Asia Pacific Equity Strategy 75
Figure 142: MSCI AxJ Taiwan—2015 and 2016 IBES EPS estimates (US$)
22
23
24
25
26
27
28
29
30
Dec-13 Mar-14 Jun-14 Sep-14 Dec-14 Mar-15 Jun-15 Sep-15
2015 EPS 2016 EPS
Source: IBES, MSCI, Credit Suisse estimates
Valuations
The current 1.4x forward P/B valuation for Taiwan market is at one std dev below its long-
term cycle average, which is usually when it discounts some risk of earnings decline.
Meanwhile, the market's 12% ROE remains above mid-cycle average of 11.5%.
Figure 143: P/E of Taiwan market is almost one std dev
below LT average
Figure 144: Taiwan market's P/B is 1stdev below LT
average
5.0
10.0
15.0
20.0
25.0
30.0
Nov
-03
May
-04
Nov
-04
May
-05
Nov
-05
May
-06
Nov
-06
May
-07
Nov
-07
May
-08
Nov
-08
May
-09
Nov
-09
May
-10
Nov
-10
May
-11
Nov
-11
May
-12
Nov
-12
May
-13
Nov
-13
May
-14
Nov
-14
May
-15
Nov
-15
Forward PE Average +1std -1std +2std -2std
(X) CS Taiwan coverage P/E
1.0
1.4
1.8
2.2
2.6
Nov
-03
May
-04
Nov
-04
May
-05
Nov
-05
May
-06
Nov
-06
May
-07
Nov
-07
May
-08
Nov
-08
May
-09
Nov
-09
May
-10
Nov
-10
May
-11
Nov
-11
May
-12
Nov
-12
May
-13
Nov
-13
May
-14
Nov
-14
May
-15
Nov
-15
Forward PB Average +1std -1std +2std -2std
(X) CS Taiwan coverage P/B
Source: Company data, Credit Suisse estimates Source: Company data, Credit Suisse estimates
What could surprise in 2016?
Taiwan is likely to face a major political change in 2016 with the opposition DPP
(Democratic Progressive Party) likely to win the Presidential election and possibly with a
control of the Legislature, according to the latest polls. This could mark the first time that
the opposition DPP controls both the Executive and Legislative Branch of the Taiwan
government, and hence, should enable the new government to implement more changes.
We believe based on DPP's agenda, the most likely and visible changes under it would be
on tax and pension to raise funding to build a stronger social safety net (i.e., long-term
senior care and social housing). This means potentially higher inheritance, corporate and
capital gains tax for Taiwan in the medium term with the government also shifting resource
into SMEs from larger corporates.

01 December 2015
Asia Pacific Equity Strategy 76
We believe over the past six months, Taiwan's market has prepared for DPP to win the
Presidential election but not necessarily for DPP to also win the Legislative election, which
could imply much faster and greater policy changes for Taiwan.
Top ideas in 2016?
■ SPIL (2325.TW, OUTPERFORM, target price NT$52). We view the company as
having good support from 4Q15 potential upside and its traditional 1H high season,
which may be supplemented by the end to this year's inventory correction. In addition,
the company may also offer upside if Hon Hai or ASE exercises a bid for more control
or China shows interest in a stake for partnership to build out SPIL's advanced
packaging in Suzhou. SPIL is reasonable at 11.7x 2016 P/E and 6.4%% cash yield.
■ Delta (2308.TW, OUTPERFORM, target price NT$196). We are convinced by Delta's
strategy to improve Eltek's OPM, with cost savings from centralised procurement and
manufacturing, lower financing costs, streamlining of its sales offices, and cross-
selling opportunities. We believe Eltek's global footprint should help Delta diversify
regional mix for the branding business. We also see growing opportunities for Delta in
modularised sub-systems, given its strength in power electronics, packaging and
miniaturisation know-how. We believe its first power module product might be close to
commercialisation. Hence, we expect that further upside could come from growing
demand for modularisation, margin improvement in Eltek and stabilising IA demand.
■ E. Sun (2884.TW, OUTPERFORM, target price NT$23). We expect E Sun's strong
fee income momentum to be sustained at 2–3x of industry average on robust wealth
management fee income growth and declining opex growth rate. We believe that with
the bank's WM fee income to deposit ratio only at 0.4% versus 0.6% of other leading
banks, there is still a significant upside to E Sun's fee business in the next few years.
Also, we estimate that with overall opex growth decelerating from mid-to high-teen to
low teens in the next two to three years, the bank's PPoP growth can be maintained at
16-18% after achieving 25% growth in 2015. With the bank's tier-1 ratio above 9% and
group leverage ratio amongst the lowest, we believe that E Sun's capital position can
support growth for the next two to three years.

01 December 2015
Asia Pacific Equity Strategy 77
Thailand Another tough year
Thailand faces another tough year. While GDP growth should rise from 2015, the
improvement will likely prove weak and disappoint the market. High household debt,
sluggish exports and low capacity utilisation rates will weigh on output from a cyclical
perspective, while structural problems of bad demography and poor worker skills will
remain a drag for years. Although we forecast decent 10% EPS growth for domestic
stocks, the market P/E should derate further. The P/E still is near its ten-year average,
whereas we believe that slower growth and an ongoing shift of domestic money to
overseas equities warrant a discount. We set an end-2016 SET index target of 1,448,
implying 4.8% upside from the time of writing.
Figure 145: Top stock ideas for 2016
Mkt Yield P/B ROE Net debt/
Target cap P/E (x) (%) (x) (%) equity (x)
Company RIC Rating Curr. Price price (mn) FY14A FY15E FY16E FY16E FY16E FY16E FY16E
Top outperformers
AIS ADVANC.BK O THB 205 280 17,087 16.9 15.5 14.5 6.9% 13.0 90.1% 232.7%
BTS Group Holdings BTS.BK O THB 9.4 12.2 3,144 54.7 42.3 56.7 7.1% 2.3 4.1% 36.9%
Thai Union TU.BK O THB 18.5 22.5 2,475 15.5 17.1 13.7 3.6% 1.8 13.1% 63.7%
STECON STEC.BK O THB 24.6 30.0 1,052 24.7 29.2 24.1 1.9% 3.9 16.0% Net cash
C.P. ALL CPALL.BK O THB 48.5 60.0 12,214 44.6 31.7 25.4 2.8% 10.0 39.2% 358.8%
Top relative underperformers
True Corp TRUE.BK U THB 8.5 3.3 5,864 106.7 53.2 524.4 0.0% 2.8 0.5% 96.2%
Note: Priced as of 25 November 2015. Source: Company data, Thomson Reuters, Credit Suisse estimates
Earnings outlook
As is almost always the case in Thailand, EPS should outperform nominal GDP, but
downside risk remains. We forecast 15% growth for all stocks under our coverage and
10% for just domestic names (excluding outliers with big one-offs). As one-off stock losses
artificially depressed energy earnings in 2015, we consider the figure for domestic names
the better barometer. Our forecasts appear achievable, but the tendency of the economy
to disappoint even our low expectations leaves risk of additional cuts. In any case, the
street expects EPS 5% above our forecasts for domestic stocks, pointing to another round
of consensus downgrades (Figure 146). Weak consumption and business investment are
the main top-down factors limiting growth. Negative bottom-up factors include high bank
provisions and a weak property market. Positive bottom-up factors giving various sectors
and the market as a whole double-digit growth include lower telco regulatory costs and
competition, structural growth in modern format retailing and healthcare, strong tourist
arrivals and technical rebounds from low 2015 bases for media firms.
Dan Fineman
dan.fineman@credit-
suisse.com
+662-614-6218
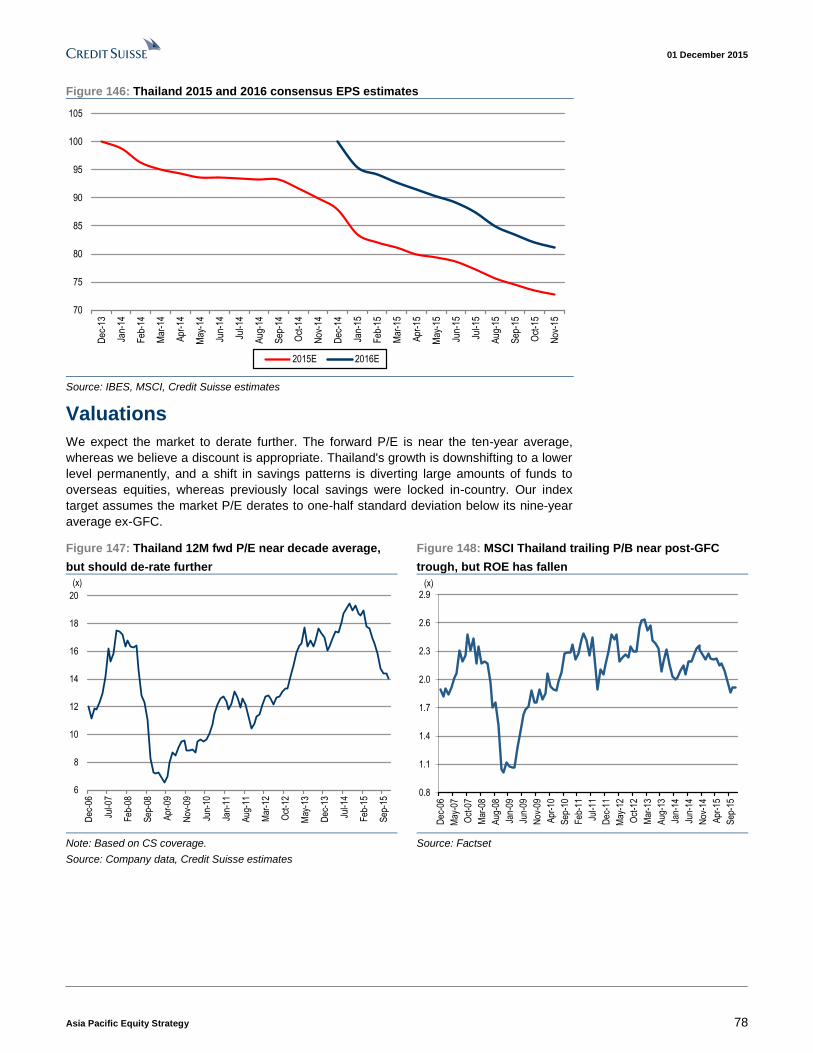
01 December 2015
Asia Pacific Equity Strategy 78
Figure 146: Thailand 2015 and 2016 consensus EPS estimates
70
75
80
85
90
95
100
105
Dec
-13
Jan-
14
Feb
-14
Mar
-14
Apr
-14
May
-14
Jun-
14
Jul-1
4
Aug
-14
Sep
-14
Oct
-14
Nov
-14
Dec
-14
Jan-
15
Feb
-15
Mar
-15
Apr
-15
May
-15
Jun-
15
Jul-1
5
Aug
-15
Sep
-15
Oct
-15
Nov
-15
2015E 2016E
Source: IBES, MSCI, Credit Suisse estimates
Valuations
We expect the market to derate further. The forward P/E is near the ten-year average,
whereas we believe a discount is appropriate. Thailand's growth is downshifting to a lower
level permanently, and a shift in savings patterns is diverting large amounts of funds to
overseas equities, whereas previously local savings were locked in-country. Our index
target assumes the market P/E derates to one-half standard deviation below its nine-year
average ex-GFC.
Figure 147: Thailand 12M fwd P/E near decade average,
but should de-rate further
Figure 148: MSCI Thailand trailing P/B near post-GFC
trough, but ROE has fallen
6
8
10
12
14
16
18
20
Dec
-06
Jul-0
7
Feb
-08
Sep
-08
Apr
-09
Nov
-09
Jun-
10
Jan-
11
Aug
-11
Mar
-12
Oct
-12
May
-13
Dec
-13
Jul-1
4
Feb
-15
Sep
-15
(x)
0.8
1.1
1.4
1.7
2.0
2.3
2.6
2.9
Dec
-06
May
-07
Oct
-07
Mar
-08
Aug
-08
Jan-
09
Jun-
09
Nov
-09
Apr
-10
Sep
-10
Feb
-11
Jul-1
1
Dec
-11
May
-12
Oct
-12
Mar
-13
Aug
-13
Jan-
14
Jun-
14
Nov
-14
Apr
-15
Sep
-15
(x)
Note: Based on CS coverage.
Source: Company data, Credit Suisse estimates
Source: Factset
01 December 2015
Asia Pacific Equity Strategy 79
What could surprise in 2016?
Competition in telcos: We expect a marked improvement in the level of competition to
appear following successful spectrum auctions in 4Q15. The creation of a more level
playing field with all three players having full 4G service and paying the same revenue
sharing should be the positive catalyst to transform competition.
Bank provisions: We expect provisions to again exceed bank guidance and for
consensus EPS cuts to follow.
A rate cut: Many in the market expect Thai rates to rise in line with US rates, but we
expect another cut. A cut would not help the broader market appreciably but would provide
a positive environment for yield stocks in telcos and utilities.
Top ideas in 2016?
Telcos
We remain heavily overweight telcos. Our telcos analyst, Colin McCallum, believes that
the market has exaggerated the damage from high prices bid in the 1800 MHz auction and
fails to appreciate the transformation in competition that will ensue. For the past two years,
True has enjoyed a temporary competitive advantage over AIS and DTAC. Its tie-up with
CAT has enabled it to offer full 4G service before its rivals, and it has had to pay no
revenue sharing to state agencies. During this window of opportunity, it has been rational
for True to market aggressively and attract as many subscribers as possible. After the
auction, however, True will lose its advantages. AIS and DTAC will also be able to offer full
4G service, and all three operators will pay the same 5.25% in revenue sharing. With its
window of opportunity closed, True will no longer have incentives to steal market share
with heavy handset subsidies and giveaways. We like AIS, INTUCH, DTAC, Jasmine and
DIFu.
Thai Union (OUTPERFORM, TP Bt22.5)
A tuna canner and seafood exporter, TU is the top beneficiary of a weak baht and also
could gain from cheap oil. The market has exaggerated the potential hit from legal
problems in the US. Our analysis indicates that the market has already more than
discounted the possible worst-case outcome as far as regulatory fines or class-action
lawsuits are concerned. What is left is one of Thailand's best-run companies, with a
globally competitive business.
BTS Group Holdings (OUTPERFORM, TP Bt12.2)
BTS is now our top infrastructure stock. BTS has lagged contractors this year, but it should
gain as much or more than most contractors. The key projects that will see progress in the
next 12 months are in Bangkok mass transit, and we expect BTS to win two and possibly
all of the bids for the Pink Line, the Yellow Line and the Light Rail Transit line. BTS trades
at a 23% discount to our DCF and sum of the parts-based TP.
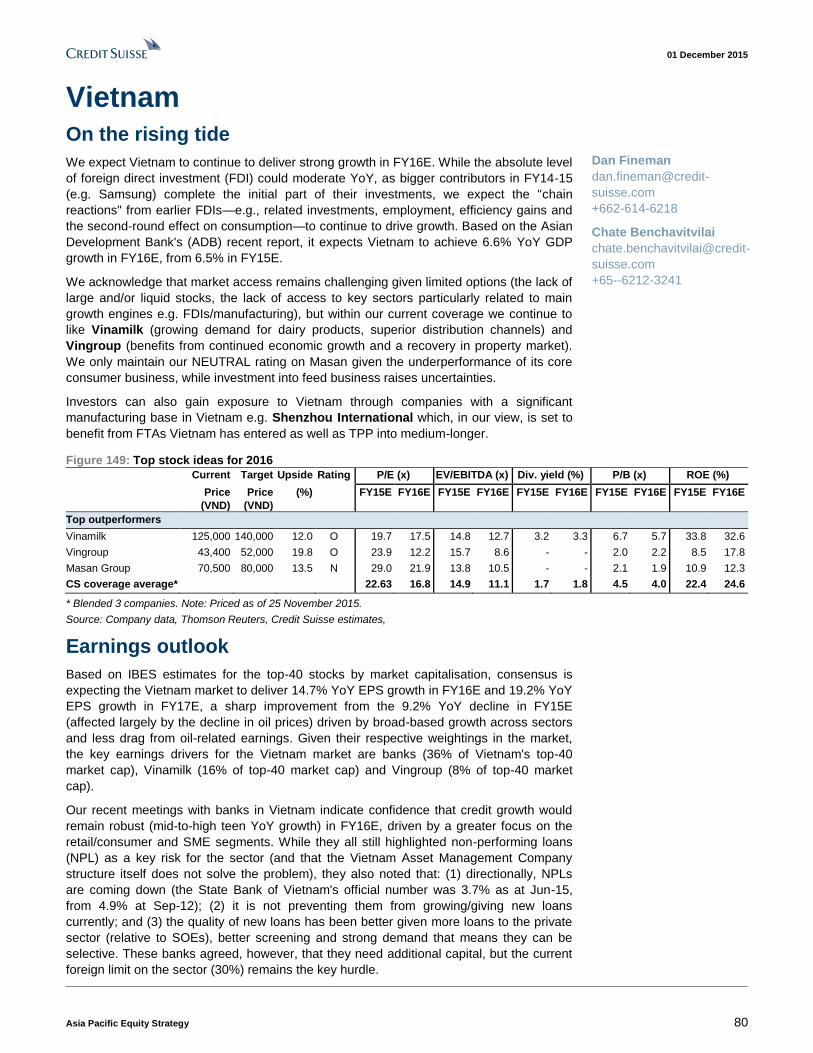
01 December 2015
Asia Pacific Equity Strategy 80
Vietnam On the rising tide
We expect Vietnam to continue to deliver strong growth in FY16E. While the absolute level
of foreign direct investment (FDI) could moderate YoY, as bigger contributors in FY14-15
(e.g. Samsung) complete the initial part of their investments, we expect the "chain
reactions" from earlier FDIs—e.g., related investments, employment, efficiency gains and
the second-round effect on consumption—to continue to drive growth. Based on the Asian
Development Bank's (ADB) recent report, it expects Vietnam to achieve 6.6% YoY GDP
growth in FY16E, from 6.5% in FY15E.
We acknowledge that market access remains challenging given limited options (the lack of
large and/or liquid stocks, the lack of access to key sectors particularly related to main
growth engines e.g. FDIs/manufacturing), but within our current coverage we continue to
like Vinamilk (growing demand for dairy products, superior distribution channels) and
Vingroup (benefits from continued economic growth and a recovery in property market).
We only maintain our NEUTRAL rating on Masan given the underperformance of its core
consumer business, while investment into feed business raises uncertainties.
Investors can also gain exposure to Vietnam through companies with a significant
manufacturing base in Vietnam e.g. Shenzhou International which, in our view, is set to
benefit from FTAs Vietnam has entered as well as TPP into medium-longer.
Figure 149: Top stock ideas for 2016
Current Target Upside Rating P/E (x) EV/EBITDA (x) Div. yield (%) P/B (x) ROE (%)
Price
(VND)
Price
(VND)
(%) FY15E FY16E FY15E FY16E FY15E FY16E FY15E FY16E FY15E FY16E
Top outperformers
Vinamilk 125,000 140,000 12.0 O 19.7 17.5 14.8 12.7 3.2 3.3 6.7 5.7 33.8 32.6
Vingroup 43,400 52,000 19.8 O 23.9 12.2 15.7 8.6 - - 2.0 2.2 8.5 17.8
Masan Group 70,500 80,000 13.5 N 29.0 21.9 13.8 10.5 - - 2.1 1.9 10.9 12.3
CS coverage average* 22.63 16.8 14.9 11.1 1.7 1.8 4.5 4.0 22.4 24.6
* Blended 3 companies. Note: Priced as of 25 November 2015.
Source: Company data, Thomson Reuters, Credit Suisse estimates,
Earnings outlook
Based on IBES estimates for the top-40 stocks by market capitalisation, consensus is
expecting the Vietnam market to deliver 14.7% YoY EPS growth in FY16E and 19.2% YoY
EPS growth in FY17E, a sharp improvement from the 9.2% YoY decline in FY15E
(affected largely by the decline in oil prices) driven by broad-based growth across sectors
and less drag from oil-related earnings. Given their respective weightings in the market,
the key earnings drivers for the Vietnam market are banks (36% of Vietnam's top-40
market cap), Vinamilk (16% of top-40 market cap) and Vingroup (8% of top-40 market
cap).
Our recent meetings with banks in Vietnam indicate confidence that credit growth would
remain robust (mid-to-high teen YoY growth) in FY16E, driven by a greater focus on the
retail/consumer and SME segments. While they all still highlighted non-performing loans
(NPL) as a key risk for the sector (and that the Vietnam Asset Management Company
structure itself does not solve the problem), they also noted that: (1) directionally, NPLs
are coming down (the State Bank of Vietnam's official number was 3.7% as at Jun-15,
from 4.9% at Sep-12); (2) it is not preventing them from growing/giving new loans
currently; and (3) the quality of new loans has been better given more loans to the private
sector (relative to SOEs), better screening and strong demand that means they can be
selective. These banks agreed, however, that they need additional capital, but the current
foreign limit on the sector (30%) remains the key hurdle.
Dan Fineman
dan.fineman@credit-
suisse.com
+662-614-6218
Chate Benchavitvilai
chate.benchavitvilai@credit-
suisse.com
+65--6212-3241

01 December 2015
Asia Pacific Equity Strategy 81
Figure 150: Top 40 VN stocks by market cap—2015 and 2016 IBES EPS estimate (US$)
0.05
0.07
0.09
0.11
0.13
0.15
0.17
0.19
Feb-14 Apr-14 Jun-14 Aug-14 Oct-14 Dec-14 Feb-15 Apr-15 Jun-15 Aug-15 Oct-15
2015 Vietnam IBES EPS (US$/shr) 2016 Vietnam IBES EPS (US$/shr)
Source: IBES, MSCI, Credit Suisse estimates
For Vinamilk (VNM), FY15 has been a particularly strong year with robust earnings (+36% in 9M15) driven by 16% revenue growth (rising volumes and market share gains) and an 8.2% rise in margins. We expect margins to remain upbeat in FY16E given VNM’s dominant franchise position, with management indicating price pass-through once contract negotiations on next year’s powder milk procurement are complete.
We also expect Vingroup to deliver strong earnings growth into FY16E given robust primary residential sales (~US$800 mn in FY15 YTD) and expansion in the retail and hospitality footprint across the country. We are expecting strong earnings momentum with a 40% EPS CAGR over FY16-18E.
Valuations
While Vietnam market's 13.6x 12-month forward P/E (based on consensus for top-40 stocks by market cap) is above its historical average, we argue that its accelerating earnings growth (14.7-19.2% EPS growth into FY16-17E ) supports multiple expansion. As we also discussed in our strategy report, Private Sector Taking Over, dated 28 October 2015, we believe that: (1) the big fall in cost of capital given the significant decline in the risk-free rate, (2) the dong's relative stability and (3) the lower systemic risk (so investors should assign a lower equity risk premium) mean that Vietnam's market multiple deserves a premium relative to its historical level, in our view.
Figure 151: P/E might be above historical average…. Figure 152: … but faster EPS growth justifies the premium
-
2.0
4.0
6.0
8.0
10.0
12.0
14.0
16.0
18.0
20.0
Nov
-08
Apr
-09
Sep
-09
Feb
-10
Jul-1
0
Dec
-10
May
-11
Oct
-11
Mar
-12
Aug
-12
Jan-
13
Jun-
13
Nov
-13
Apr
-14
Sep
-14
Feb
-15
Jul-1
5
+2 STDEV
Average
-2 STDEV
15.2%
21.1%
-0.6%
-10.1%
15.7%
2.6%
-9.2%
14.7%
19.2%
-15.0%
-10.0%
-5.0%
0.0%
5.0%
10.0%
15.0%
20.0%
25.0%
2009 2010 2011 2012 2013 2014 2015E 2016E 2017E
Source: Company data, Credit Suisse estimates Source: Company data, Credit Suisse estimates

01 December 2015
Asia Pacific Equity Strategy 82
What could surprise in 2016?
Party Congress to affirm political stability. Vietnam's Communist Party will hold its 12th
party congress in 2016 which involves the selection of new leaderships including the general
secretary of the Party. While it is already widely anticipated that Prime Minister Dung should
be able to consolidation his power (potentially becoming the general secretary), the market,
in our view, would welcome any strengthening of position / control over other key leadership
positions. Some also argue that the government has avoided executing more
sensitive/aggressive reforms ahead of the congress, and hence the completion of congress
could also lead to an acceleration of reforms over the next few years.
Follow-through for new FOL and SCIC's stake sales. The new Foreign Ownership Limit
(FOL) rule and the State Capital Investment Corporation's (SCIC) potential disposal of its
stakes in some companies, we believe, could be positive for market access/foreign
participation. These, however, require "follow-through" both from the government
(formalisation of the list for sensitive/non-sensitive sectors, the approval of SCIC's disposal
plan) and listed companies (proposal and shareholders' approval for the new limit) into 2016.
Recapitalisation of banks? While our recent meetings with Vietnamese banks indicate
their confidence in the overall economy and robust demand for credit, all of them agree
that the sector needs recapitalisation. Given the government's relatively tight fiscal
situation, we believe that another key decision the Vietnamese government would have to
make in 2016 is to reconsider the FOL for the banking sector (30%) and increase foreign
participation in the sector.
VND devaluation—the key is the RMB. The dong has effectively depreciated by 5%
(against the USD) in 2015, compared to a 1% depreciation in FY14 and the government's
2% initial target for FY15. This was largely in response to the RMB's depreciation during
FY15 and we expect a similar response from the government into FY16E if the RMB
continues to depreciate against the USD. Most Vietnamese corporates we met agree that
2-5% depreciation/year remains acceptable, but depreciation of 5-10% could cause
problems (confidence in the dong, inflation). Credit Suisse expects the RMB to depreciate
by ~6% in FY16E (to Rmb6.2/USD).
Top ideas in 2016?
Vinamilk (OUTPERFORM, TP VND140,000): Vinamilk is a leading dairy player in
Vietnam, enjoying ~50% overall market share across key products: (1) liquid milk (a 53%
share); (2) condensed milk (78% share); (3) yogurt (84% share); and (4) powder milk (25%
share)—nearly twice the size of its key competitor, FCV Dutch Lady. It also boasts the
largest distribution network with 215,000 retailers and 266 distributors (35-40% higher than
the second-largest player) and a robust supply chain, with continued investment in farming
and strong links with farmers. At an FY16E P/E of 19.5x, we note that Vinamilk is still
trading at a 15% discount to regional peers, but offers a superior growth profile. We
believe the progress on an increase in the foreign ownership limit in the company's
constitution via AGM/EOGM (likely 1Q16) could be an additional positive catalyst.
Vingroup: Vingroup is the only investible real estate developer in Vietnam with a
dominant presence in the high-end residential, retail and hospitality segments. The
company enjoys very strong brand equity domestically given its excellent track record on
the delivery of mega projects even during times of stress, such as the mixed-used
development projects of Times City and Royal City in Hanoi. Vingroup remains well
positioned to benefit from the continued recovery in the broader economy and growth in
the middle class as well as rising FDI in retail. Valuations are not overly demanding, with
Vingroup trading at a 2016E P/E of 12.2x and P/B of 2.2x.

01 December 2015
Asia Pacific Equity Strategy 83
Sector Sections

01 December 2015
Asia Pacific Equity Strategy 84
Autos and Components Growth returns
We are expecting all the three large markets in NJA—China, India, and Indonesia—to
witness a strong 2016 (for different reasons); signs of recovery visible in 4Q CY15 are
likely to become stronger in CY16. In China, the reduction in purchase tax by half, from
10% to 5%, for vehicles with engine size ≤ 1.6L is likely to drive ~15% growth in PV sales.
We prefer Chinese local brands such as Geely, Great Wall, Chang'an, and BYD. A China
recovery should also help Tata Motors (JLR) and Korean component names such as
Mobis and Mando. In India, a rebound driven by reduction in ownership costs and a
gradually recovering economy will likely receive a big boost from the implementation of the
7th Pay Commission recommendations that impacts ~20 mn government employees; we
expect 20% growth (accumulate Maruti). Indonesia market (Astra) volumes have
recovered on new launches, and this is likely to continue into CY16. US market growth is
likely to slow significantly in CY16; we believe incentives in the market will also start rising,
and hence among the Korean names, we prefer component players to the OEMs.
Figure 153: Top stock ideas for 2016
Mkt Yield P/B ROE Net debt/
Target cap P/E (x) (%) (x) (%) equity (x)
Company RIC Rating Curr. Price price (mn) FY14A FY15E FY16E FY16E FY16E FY16E FY16E
Top outperformers
Geely 0175.HK O HKD 4.2 5.7 4,770 21.3 10.5 7.4 1.6% 1.3 17.5% Net cash
Tata Motors* TAMO.BO O INR 401.1 490 17,449 9.2 11.3 8.3 0.6% 1.5 18.0% 50.6%
Maruti Suzuki* MRTI.BO O INR 4,640.5 5200 21,125 37.8 24.6 17.1 1.1% 4.1 23.8% Net cash
Hyundai Mobis 012330.KS O KRW 247,000 280,000 21,032 7.0 7.7 7.0 2.0% 0.8 11.8% Net cash
Astra International ASII.JK O IDR 6,175 7,600 18,267 12.8 14.5 12.4 4.1% 2.3 18.6% 40.4%
Top relative underperformers
Weichai Power (H) 2338.HK U HKD 8.3 6 5,929 5.5 16.3 11.2 4.5% 0.8 7.1% Net cash
* For the Indian cos; FY15E=FY16E and FY16E=FY17E; Note: Priced as of 25 November 2015.
Source: Company data, Thomson Reuters, Credit Suisse estimates
What should investors care about in 2016?
Chinese local brands to benefit from purchase tax cut
China's State Council slashed small passenger vehicles' (engine size ≤ 1.6L) purchase tax by half, from 10% to 5%, for 4Q15 and 2016 to encourage auto sales to boost consumption and help the economy. As small passenger vehicles accounted for 68% of YTD 2015 total PV sales, this tax reduction should boost around 3.0 mn units of incremental PV demand annually (or 15% the total), in our view—similar to the impact generated during the previous round's 5% auto purchase tax cut amid the 2009 Global Financial Crisis. In our China autos coverage universe, the exposure to small passenger vehicles' (engine size ≤ 1.6L) pecking order is: Geely (82%) > Great Wall (80%) > Chang'an (70%) > BYD (69%) > SAIC (69%) > BAIC (56%) > Dongfeng (54%) > GAC (42%) > Brilliance (22%).
Indian car market to enter a multi-year growth cycle
The Indian car industry after five years of muted growth (2011 to 2015) is entering a phase of very strong growth. Our thesis of a strong multi-year growth in cars is based on (1) reduction in the cost of owning a vehicle, as the benefits of lower fuel prices and interest rates flow through, (2) the Pay Commission boost in 2016, which will positively impact ~20 mn government employees, (3) GST implementation in 2017 could lead to a 10-20% reduction in car prices, which should lead to a major demand boost. We like both Maruti and Mahindra as plays on this theme. Additionally, we like Tata Motors for the strong product cycle at JLR, which combined with a recovery in China should drive strong double-digit volume growth.
Jatin Chawla
jatin.chawla@credit-
suisse.com
91 22 6777 3719
Bin Wang
bin.wang@credit-
suisse.com
852 2101 6702

01 December 2015
Asia Pacific Equity Strategy 85
Korea: Prefer components to OEMs as US auto demand likely to peak
Over the past 40 years, the US SAAR (seasonally adjusted annual rate) and the US
unemployment rate have shown high correlation. As both the indicators have reached their
historical peak levels, we expect US auto demand to post -1.2% YoY growth in 2016E; this
will likely increase incentive spending for global automakers to sustain their market shares
in the US. While solid demand outlook for China and India is clearly positive for Korean
autos, given the weak other emerging market (Eastern Europe, South America, and
Middle East) demand, HMC and Kia will likely export less to these emerging markets, but
more to the US, which could also increase incentive spending to adjust the inventory level
in the US. We prefer auto parts to OEMs in the Korean market, and within that Hyundai
Mobis and Mando are our top picks. With higher sales for Hyundai, we expect core parts
sales to increase, leading to better mix, and with 25% of Mobis' OP and 50% of Mando's
OP coming from China, a China recovery should help both these companies.
Indonesia: New models to drive both volumes and pricing
After a sharp 20% decline in CY15, volumes have started recovering on new model
launches and an improving economy. For Astra, the Toyota Avanza and the Daihatsu
Xenia have done well, and with the new Toyota Innova and the Toyota Fortuner also
expected to come in the next few months, the new model pipeline looks exciting. This,
combined with easy financing and an economic recovery, should drive 10% growth in
volumes in CY16. In our view, these new launches will not only aid volumes but also help
improve pricing and margins for Astra; hence, margins, which have shown some recovery
from 0.4% in 1Q CY15 to 1.4% in 3Q CY15, should continue to improve.
Valuations
A sector-wide rerating in the China auto sector is likely to happen as auto sales growth will
accelerate on the 5% purchase tax cut. Historically, lower sales growth caused investor
concerns about its earnings momentum, thus a lower valuation (12-month forward P/E),
whereas accelerating sales growth YoY has been accompanied by a rise in valuation. We
believe a similar trend will play out for all auto companies with a large exposure to China,
and hence Tata Motors, Mobis, and Mando should also witness a rerating. Although
Korean OEMs' absolute valuations still look undemanding, the overall valuation gap
relative to global peers has narrowed, and we do not expect any further expansion in
multiples unless better shareholder return policies are provided.
Figure 154: China passenger vehicle sales growth outlook vs Dongfeng (sector proxy)
P/E
25%
7%
47%
34%
8%
12%
19%
13%7%
15%
1%
-30%
-20%
-10%
0%
10%
20%
30%
40%
50%
0
5
10
15
20
25
2007 2008 2009 2010 2011 2012 2013 2014 2015e 2016e 2017e
unit mn
China Passenger vehicle sales YoY Dongfeng PE Source: Company data, Credit Suisse estimates
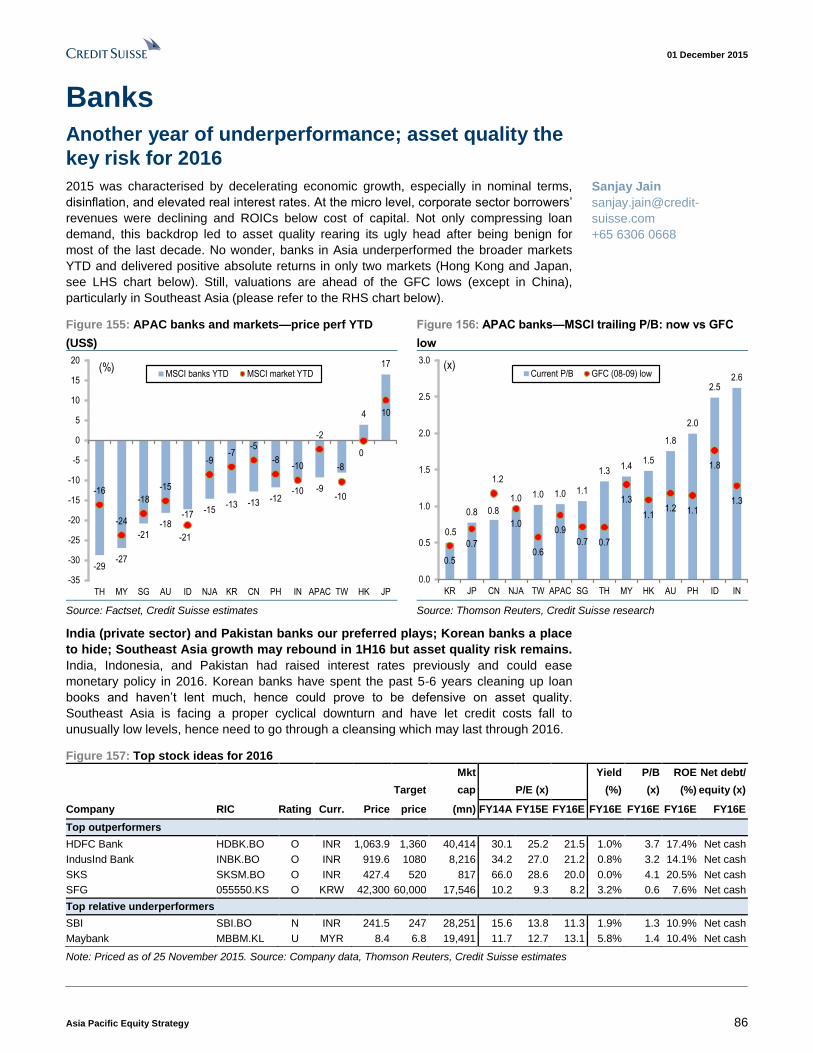
01 December 2015
Asia Pacific Equity Strategy 86
Banks Another year of underperformance; asset quality the
key risk for 2016
2015 was characterised by decelerating economic growth, especially in nominal terms,
disinflation, and elevated real interest rates. At the micro level, corporate sector borrowers’
revenues were declining and ROICs below cost of capital. Not only compressing loan
demand, this backdrop led to asset quality rearing its ugly head after being benign for
most of the last decade. No wonder, banks in Asia underperformed the broader markets
YTD and delivered positive absolute returns in only two markets (Hong Kong and Japan,
see LHS chart below). Still, valuations are ahead of the GFC lows (except in China),
particularly in Southeast Asia (please refer to the RHS chart below).
Figure 155: APAC banks and markets—price perf YTD
(US$)
Figure 156: APAC banks—MSCI trailing P/B: now vs GFC
low
-29-27
-21-18
-17-15
-13 -13 -12-10 -9
-8
4
17
-16
-24
-18
-15
-21
-9-7
-5
-8-10
-2
-10
0
10
-35
-30
-25
-20
-15
-10
-5
0
5
10
15
20
TH MY SG AU ID NJA KR CN PH IN APAC TW HK JP
MSCI banks YTD MSCI market YTD(%)
0.5
0.8 0.8
1.0 1.0 1.0 1.1
1.31.4
1.5
1.8
2.0
2.52.6
0.5
0.7
1.2
1.0
0.6
0.9
0.7 0.7
1.3
1.11.2 1.1
1.8
1.3
0.0
0.5
1.0
1.5
2.0
2.5
3.0
KR JP CN NJA TW APAC SG TH MY HK AU PH ID IN
Current P/B GFC (08-09) low(x)
Source: Factset, Credit Suisse estimates Source: Thomson Reuters, Credit Suisse research
India (private sector) and Pakistan banks our preferred plays; Korean banks a place
to hide; Southeast Asia growth may rebound in 1H16 but asset quality risk remains.
India, Indonesia, and Pakistan had raised interest rates previously and could ease
monetary policy in 2016. Korean banks have spent the past 5-6 years cleaning up loan
books and haven’t lent much, hence could prove to be defensive on asset quality.
Southeast Asia is facing a proper cyclical downturn and have let credit costs fall to
unusually low levels, hence need to go through a cleansing which may last through 2016.
Figure 157: Top stock ideas for 2016
Mkt Yield P/B ROE Net debt/
Target cap P/E (x) (%) (x) (%) equity (x)
Company RIC Rating Curr. Price price (mn) FY14A FY15E FY16E FY16E FY16E FY16E FY16E
Top outperformers
HDFC Bank HDBK.BO O INR 1,063.9 1,360 40,414 30.1 25.2 21.5 1.0% 3.7 17.4% Net cash
IndusInd Bank INBK.BO O INR 919.6 1080 8,216 34.2 27.0 21.2 0.8% 3.2 14.1% Net cash
SKS SKSM.BO O INR 427.4 520 817 66.0 28.6 20.0 0.0% 4.1 20.5% Net cash
SFG 055550.KS O KRW 42,300 60,000 17,546 10.2 9.3 8.2 3.2% 0.6 7.6% Net cash
Top relative underperformers
SBI SBI.BO N INR 241.5 247 28,251 15.6 13.8 11.3 1.9% 1.3 10.9% Net cash
Maybank MBBM.KL U MYR 8.4 6.8 19,491 11.7 12.7 13.1 5.8% 1.4 10.4% Net cash
Note: Priced as of 25 November 2015. Source: Company data, Thomson Reuters, Credit Suisse estimates
Sanjay Jain
sanjay.jain@credit-
suisse.com
+65 6306 0668

01 December 2015
Asia Pacific Equity Strategy 87
Lethargic macro backdrop to sap loan demand
Real GDP growth is settling at slower levels relative to history in most markets. But the
bigger story for banks lies in nominal GDP growth, which has softened even more than
real. With producer prices negative, corporate sales are shrinking in most markets, and
that is sapping loan demand from the banking system, exacerbated by high real rates.
Asian central banks reluctantly and belatedly cutting
rates = margin pressure for banks
Real rates calculated using GDP deflator (overall inflation in an economy) as well as
calculated using CPI are running far ahead of their historical averages (see charts below).
Monetary authorities in Asia have been behind the curve in cutting policy rates, partly due
to asset price bubbles and partly due to lofty household debt. But they eventually relented
and have been grudgingly cutting rates; banks suffer a squeeze on net interest margins.
Figure 158: Real 3M i/b rates using GDP deflator Figure 159: Real 3M i/b rates using CPI
1.5
2.7
1.6
0.2
1.20.8
1.50.7
0.0
-2.7
2.0
0.4
3.9
6.5
-1.1
-2.4
4.3
2.1
3.62.9
0.9
-3.2
2.5
-1.9
-4.0
-2.0
0.0
2.0
4.0
6.0
8.0
CN IN KR TW ID TH MY PH SG HK AU JP
5Y avg Current
1.61.0 0.8
-0.2
0.7 0.40.9
-0.2
-2.2
-3.9
1.0
-0.4
1.8
3.4
0.7 0.5
2.12.4
1.1
2.11.7
-1.6
0.60.2
-5.0
-4.0
-3.0
-2.0
-1.0
0.0
1.0
2.0
3.0
4.0
CN IN KR TW ID TH MY PH SG HK AU JP
5Y avg Current
Source: CEIC, Credit Suisse estimates Source: CEIC, Credit Suisse research
Asset quality: Finally the year of reckoning
Asia has enjoyed good times for the past decade and managed to dodge the bullet during
the GFC. With China slowing, it appears this downturn is extended and is payback for some
of the brought-forward growth. Corporate borrowers account for roughly three-quarters of
bank lending, their ROICs are below cost of capital, while cash flows are strained = a toxic
combination. To make matters worse, banks allowed credit costs to drop significantly below
pre-GFC levels. So we are not arguing for a crisis or a sharp spike in NPLs, but for a
normalisation in credit costs. Similar to 2015, it should mean no EPS growth for Asian banks
in 2016E. The markets we are most worried about for asset quality are China and India
(corporate-oriented banks), while the relatively safe markets should be Korea and Taiwan.
Figure 160: APAC ex-Japan banks—evolution of credit costs (in bp of loans)
86
120 119122
85
142
172
10788
30
-10
29
139153
58
124
97
116
79
23
10286
3442
11
35
94
135
101
126
78
109
49
20
116 120
54
32 25 22
46 43
-50
0
50
100
150
200
CN IN-G IN-P IN KR TW ID TH MY SG HK AU PH PK
Pre-GFC ('04-'08) Post-GFC ('09-'14) 2016E
Source: Company data, Credit Suisse estimates (Aggregate for CS coverage universe)

01 December 2015
Asia Pacific Equity Strategy 88
Basic Materials Competition in a weak market
We expect continued weak demand in basic materials in 2016. Demand from China would
see a further decline in steel and cement, driven by weaker infrastructure demand and flat
property construction activity. Destocking of metals (due to finished or semi-finished
product inventory) may continue to put haircut in demand in metals. The deteriorated
excess supply in China will add continued pressure to the seaborne market, especially
steel, coal and aluminium, through rising exports (or lower imports). On the other hand,
regional commodity players have also seen more aggressive cost cutting than China, due
to lower currencies and oil price to a certain extent. We expect prices to remain depressed
in 2016.
Figure 161: Top stock ideas for 2016
Mkt Yield P/B ROE Net debt/
Target cap P/E (x) (%) (x) (%) equity (x)
Company RIC Rating Curr. Price price (mn) FY14A FY15E FY16E FY16E FY16E FY16E FY16E
Top outperformers
Conch 0914.HK O HK$ 21.95 30.00 14,913 8.7 12.5 13.9 3.8 1.3 9.6 4.2
Lee&Man 2314.HK O HK$ 4.62 6.60 2,782 11.4 9.8 8.5 8.5 1.0 12.8 52.9
POSCO 005490.KS O W 171,000 240,000 11,922 21.8 n.a. 9.0 4.7 0.3 3.6 45.5
Top relative underperformers
Yanzhou 1171.HK U HK$ 3.63 3.00 2,289 19.2 n.a. n.a. n.a. 0.4 -5.6 135.6
Tata Steel TISC.BO U RS 224.35 180.00 3,320 6.1 n.a. 8.8 3.6 0.7 7.8 238.1
Source: Company data, Thomson Reuters, Credit Suisse estimates
What should investors care about in 2016?
Continued weak demand from China. We expect continued weak demand for most
commodities, especially those with higher exposures to infrastructure. Current order books
on the ground remain weaker than the seasonal pattern last year, suggesting continued
deterioration in underlying demand.
Unprecedented loss to lead to capacity exit in China. We estimate Chinese commodity
producers are in a deeper loss on top of an already difficult 9M15A (reported 9M15
aggregated loss was Rmb89 bn for steel sector, for example)—an unprecedented loss-
making condition, in our view. Capacity exit started to emerge, though not at a large scale
at this point. We estimate that nearly 15% of capacity in Tangshan region has either officially
exited or fully stopped production, while another 10-20% is in partial stages.
Coal—risk of Chinese exports. Despite the loss-making status of the industry, China
domestic supply response remains remote, due to the higher government protection. We
remain cautious on the sector, and continue to see the risk of Chinese exports to the rest
of the region, in an event that the sector further deteriorates in 2016E.
Figure 162: China in global and ex-China
China Global-ex CN CN in global CN trade vs ex China
mn t mn t % %
Refined Cu 10.9 11.1 49% -80%
Coal 1,962 1,901 51% -22%
Steel 708 805 47% 12%
Primary Al (trade in semi form) 27.9 28.0 50% 11%
Paper – total 100.5 301.0 25% 1%
Cement 2,363 1,700 58% 1%
* As % of seaborne market . ** In semi Al form. Source: Credit Suisse estimates
Trina Chen
trina.chen@credit-
suisse.com
852 2101 7031

01 December 2015
Asia Pacific Equity Strategy 89
Indonesia coal—our Indonesia team remains cautious, with coal production volume to
remain under pressure, but domestic demand to be a bright spot: (1) we expect the
challenging environment for the Indonesia coal sector to continue in 2016. After posting its
first annual decline this year, Indonesia’s thermal coal production could decrease by
another 5-10% due to continued weakness in exports (which accounts for 70-80% of total
production volume). Nonetheless, we expect improvement in electricity consumption on
the back of modest GDP growth to boost domestic demand, and therefore tailwinds for
miners with sizeable domestic sales exposure. (2) Declining oil prices and cost efficiency
initiatives have contributed to noteworthy cost savings for large coal miners, but the
magnitude of reduction would likely be smaller in 2016.
Figure 163: We forecast Indonesia coal production will
decline by another 5-10% next year as rising domestic
demand won't be sufficient to offset declining export
volumes
Figure 164: A more substantial uptick in domestic coal
demand is expected to occur from 2018 when the bulk of
new power plants would have started operations
Source: Ministry of Energy and Mineral Resources, company data,
Credit Suisse estimates
Source: RUPTL (Electricity Supply Plan) PLN 2015-2024, company
data, Credit Suisse estimates. These estimates assume a 100%
completion rate
Valuations
Top picks. Our most preferred stocks are Conch, Lee & Man and POSCO, and least
preferred are Tata Steel and Yanzhou.
Conch and Lee & Man: Chinese cement and paper are in a relatively better S/D balance
versus others. In addition, we are picking the two companies with lower cost position and
stronger balance sheet.
Tata Steel. We expect heightened concerns about Tata Steel’s European operations
given its deteriorating profitability and challenges in finding a buyer for its long products
business. In the past 4-6 quarters, its Indian profitability has shrunk too, given its raw
material integration (could not benefit from falling ore/coking coal prices globally).
Domestic prices continue to decline, even after the government’s imposition of
protectionist measures (12.5% import duty, 20% safeguard duty). Its net debt remains high
at ~$11.2 bn (77% of EV) in spite of ~$0.7 bn of strategic asset sales so far in 2015.
Excluding future asset sales (if any), we expect Tata Steel to report a loss next year.
Posco (005490 KS). While we estimate virtually zero cash steel margin in the China spot
market currently (if not loss), we believe current poor steel margins ironically imply no
room for further squeeze. We also anticipate a meaningful progress of POSCO’s
restructuring efforts on non-steel affiliates in recent months (i.e., beginning of workout
programme for POSCO Plantec, disposal of stakes in POSCO E&C, etc) to help recovery
of the parent’s consolidated earnings in 2016. POSCO is also overly discounted (i.e., P/B
of 0.3x), particularly considering DPS of no less than W8,000 for FY15 despite a net loss
in 2015E, which implies a dividend yield of >4%.
01 December 2015
Asia Pacific Equity Strategy 90
Chemicals and Oil Refining/Marketing Likely another solid year in 2016 With better stock performance YTD in refining, and the top performers of the space being
Korean names—in sharp contrast to a few Japanese non-commodity names being
laggards—we see a continuation of the strong trend, which began around 2Q 2015, for
consumer commodities (gasoline, PE, etc). This is due to incrementally better supply-
demand dynamics for both refining and bulk chemicals that should benefit the conventional
high-cost producer group (most of which are located in Northeast Asia), amid dramatic
decline in the price of crude oil, which seems sustainable in our forecast period. Low crude
oil prices have resulted in better demand and a pause in new investments, and a decline in
the cost of running a complex. CS' global oil & gas team expects steadily low price for
benchmark crude oil through 2017, which should more than offset the downside from
slowing industrial demand. We continue to prefer those with larger exposure to gasoline
within refining, and PE/PP/MEG/SM in chemicals.
Figure 165: Top stock ideas for 2016
Mkt Yield P/B ROE Net debt/
Target cap P/E (x) (%) (x) (%) equity (x)
Company RIC Rating Curr. Price price (mn) FY15E FY16E FY16E FY16E FY16E FY16E
Top outperformers
Lotte Chemical 011170.KS O W 246,500 410,000 7,364 7.2 6.3 1.0 1.0 16.2 15.0
Formosa Plastics 1301.TW O NT$ 76.5 94.0 14,998 16.4 16.3 3.1 2.0 12.9 5.8
Mitsubishi Chem Hldg 4188 O ¥ 830 10,300 9,975 20.0 16.4 1.7 1.2 7.5 71.9
Top relative underperformers
FCFC 1326.TW N NT$ 73.8 76.0 13,322 17.2 16.5 2.9 2.0 12.8 9.2
FPCC 6505.TW N NT$ 77.7 84.0 22,795 17.3 20.9 4.0 2.6 12.7 30.0
Source: Company data, Thomson Reuters, Credit Suisse estimates
What should investors care about in 2016?
Company specifics: While our projected industry macro models suggest another solid year
in 2016, we note that earnings have already improved substantially to above-normalised
levels in 2015, and we would be keen on company specifics that may be more important as
catalysts for the stock prices in 2016, whereas the high-beta angle may be less of an issue
with the exception of the "gasoline" theme, in line with increasing ownership of cars in China.
Korean names still interesting as alpha in 2016: Lotte Chem (post acquisition of SDI
and SFC) looks particularly interesting (for its organic/inorganic growth angle) whereas
those names in the early capex cycle (S-Oil) may need to be reviewed from shareholder
distribution standpoint aside from the scope of its long-term growth. SK Innovation remains
topical from a restructuring angle, while its valuation is one of the lowest in the space.
Oil price: Chemical/refining margins are inherently susceptible to oil price volatility for its
impact on inventory assessment and procurement behaviour. Also, it remains interesting
to see the long-term cost gap between conventional high-cost producers (naphtha
crackers) vs non-conventional low-cost producers (including on-purpose supplier)
Various supply-demand equations: Classic yet an essential approach—our updated
assessment of global supply-demand balance suggests a potentially constructive outlook for
styrene, EDC, EO, and MEG, while less upside from ethylene, MX/PX and PTA but at
different levels.
Kenneth Whee
kenneth.whee@credit-
suisse.com
852 2101 7319

01 December 2015
Asia Pacific Equity Strategy 91
Figure 166: Current margin by product in relation to historical peak-to-trough range
-1,000
-500
0
500
1,000
1,500
2,000
EO
MEG
Prop
ylene
Styr
ene
Buta
dien
e
CPL PX EDC
Benz
ene
ACN
Phen
ol
PTA
ABS
SBR
PVC
VCM MX PS PP PET
BPA
LDPE
Acet
ic
HDPE
Ethy
lene
03-13 Peak 03-13 Trough Current
Source: Datastream, Credit Suisse estimates
Figure 167: CS 6-2-3-1 GRM Figure 168: CS Asia bulk chemical margins (adjusted)
6
8
10
12
14
16
18
Se
p-1
1
No
v-1
1
Jan-1
2
Mar-
12
May-
12
Jul-1
2
Se
p-1
2
No
v-1
2
Jan-1
3
Mar-
13
May-
13
Jul-1
3
Se
p-1
3
No
v-1
3
Jan-1
4
Mar-
14
May-
14
Jul-1
4
Se
p-1
4
No
v-1
4
Jan-1
5
Mar-
15
May-
15
Jul-1
5
Se
p-1
5
No
v-1
5
6-2-3-1 margin Quarterly average
US$/bbl
200
300
400
500
600
700
800
900
02-Jan-09 02-Jan-10 02-Jan-11 02-Jan-12 02-Jan-13 02-Jan-14 02-Jan-15
US$/MT
CS Asia average chemical margins (adjusted)
Source: Datastream, Credit Suisse estimates Source: Datastream, Credit Suisse estimates
Valuations
Figure 169: Asia chemicals historical P/B band Figure 170: Asia refining historical P/B band
0.0
0.5
1.0
1.5
2.0
2.5
3.0
Jan-00 Jan-02 Jan-04 Jan-06 Jan-08 Jan-10 Jan-12 Jan-14
Asia Chemicals Chem avg.
Chem +1 STD Chem -1 STD
0.0
0.5
1.0
1.5
2.0
2.5
3.0
3.5
Jan-00 Jan-02 Jan-04 Jan-06 Jan-08 Jan-10 Jan-12 Jan-14
Asia refining Refining avg.
Refining +1 STD Refining -1 STD
Source: Datastream, Credit Suisse estimates Source: Datastream, Credit Suisse estimates

01 December 2015
Asia Pacific Equity Strategy 92
Consumer Be selective and have a bottom-up approach
Across the NJA consumer space, we expect demand to gradually pick up in 2016. China
benefits from the low comparison base of anti-corruption, India sees wage increase, Korea
recovers from the MERS outbreak, Indonesia has already bottomed out in 3Q15, and
Thailand and Taiwan markets get normalised. We think the recovery will be modest,
narrow and bumpy, given a lack of strong catalysts and structural changes.
Consensus has cut 2016 earnings estimates by 8% in the past six months. In particular,
estimates for Indonesia have been cut 10.8%, Thailand 8.7%, China/Hong Kong 7.6%,
and India 7.1%. Korea is the only exception, with 2016 consensus estimates being revised
up 0.7%. Consensus now estimates regional consumer 2016 earnings will be up 10.5%
(vs regional country 8.4%). In particular, China/Hong Kong consumer earnings would grow
12.7% (vs country 8.2-8.8%), India 17.6% (vs 19%), Korea 15.0% (vs 8%), Indonesia
11.8% (vs 11.2%), Thailand 16.9% (vs 12.4%), and Taiwan 3.7% (vs country 4.1%).
We expect the structural pressure of increased competitive activity to remain dominant in
2016, while the benefits of commodity cost deflation should become more marginal. With
this macroeconomic backdrop, we stay cautious and selective, and pick stocks with a
bottom-up approach. This is why we have a preference for strong execution stories where
valuations do not look low, but earnings visibility is high. Our top buy ideas are: JD.com
(China's fast-growing e-commerce company); Hindustan Unilever (accelerating volume
growth, benefiting from premiumisation trend); AmorePacific (strong export growth in
Asia); Indofood CBP (strong pricing power; input cost deflation). Our top sell ideas are:
SaSa (HK visitation slowdown; online competition), and Global (hurt by high householder
debt, weak farm income and prolonged drought).
Figure 171: Top stock ideas for 2016
Mkt Yield P/B ROE Net debt/
Target cap P/E (x) (%) (x) (%) equity (x)
Company RIC Rating Curr. Price price (mn) FY14A FY15E FY16E FY16E FY16E FY16E FY16E
Top outperformers
JD.com JD.OQ O USD 30 40 41,482 2.2* 1.5* 1.0* 0.0% 6.9 1.1% Net cash
Hindustan Unilever HLL.BO O INR 811 920 26,459 45.4 40.7 40.2 1.9% 41.3 102.7% Net cash
Amorepacific 090430.KS O KRW 408,500 440,000 20,889 63.0 39.9 30.1 0.3% 5.7 19.0% Net cash
Indofood CBP ICBP.JK O IDR 12,600 15,100 5,369 28.2 22.2 18.3 2.2% 4.0 21.8% Net cash
Top relative underperformers
Sa Sa 0178.HK U HKD 2.81 1.75 1,031 8.6 9.5 18.2 6.4% 3.5 19.8% Net cash
Siam Global GLOBAL.BK U THB 10.8 8.8 1,055 53.6 39.6 31.8 0.2% 3.2 10.0% 22.4%
Note: * Price/sales; Priced as of 25 November 2015.
Source: Company data, Thomson Reuters, Credit Suisse estimates
What should investors care about 2016?
China's growing young adults: China announced its one-child policy in 1979. The kids
are now growing up to 20- to 30-year-old young adults. They are well educated, have
sustainable earning power, and hold a strong desire for spending upgrades. In the next
five years, they will replenish China's future middle class, driving 35% of China's total
consumption in 2020 (vs 15% in 2014). We expect the winning companies to benefit from
changes in demographics and consumer behaviour; these are: (1) the ones that build
compelling 'young' images with innovative designs (Rio, Three Squirrels, UPC, and Anta);
(2) e-commerce, O2O, and services (Alibaba, JD, Ctrip, VIP, and CYTS), and (3) the
beneficiaries of the 'sharing economy' business model (Didi/Kuaidi, and CAR). On the flip
side, shopping behaviour changes and fast-growing O2O businesses are lowering the
entry barrier and creating massive business opportunities for young players to grab the
Kevin Yin
kevin.yin@credit-
suisse.com
852 2101 7655
Arnab Mitra
arnab.mitra@credit-
suisse.com
+91 22 6777 3806
A-Hyung Cho
a-hyung.cho@credit-
suisse.com
+82 2 3707 3735

01 December 2015
Asia Pacific Equity Strategy 93
wallet share of the young adults. It is destroying traditional blue chips' competitive
advantage in distribution, which triggers fundamental deterioration and valuation derating
(i.e., Tingyi, Want Want, and Belle).
India consumption on the rise: The Seventh Pay Commission recommended a 23%
hike in wages for government employees. The central government is likely to start
implementing the recommendations in early 2016, while states will follow with a 6- to 12-
month lag. The total incremental wage outgo sums up to an additional ~1.5% of GDP,
which is money directly in the hands of the end-consumer. This should provide a big boost
to discretionary consumption (i.e., appliances, QSRs, jewellery and home improvement
plays), and premiumisation in staples (an accelerating trend). The government has sharply
increased spending which directly boosts local economic activity. Inflation has remained
subdued, and disposable income growth in urban India gets aided by this. Rural growth
could remain subdued for another couple of quarters as the low agri prices and the
weaker-than-normal monsoon this year have impacted agri income. Benign input costs
(i.e., crude derivatives) will keep margins strong for staples, given their high market shares
and strong pricing power. The Goods and Services Tax (GST) has been stuck in the
parliament due to political uncertainty, and hence the base case is not of the GST coming
in. However, if there is any breakthrough in this, this is a big positive for most consumer
categories (a reduction in indirect taxation rates), although apparel and service categories
may get negatively impacted.
Korea should see a pick-up in consumption: We expect the consumption turnaround to
emerge not only in domestic consumption, but also in demand from overseas markets,
including the inbound travel visitation from China. 2015 domestic consumption and
inbound tourism had dipped due to the outbreak of MERS. This serves as a low
comparison base for 2016. We expect the multi-year export growth to remain robust based
on the growing brand equity value of the Korean cosmetics and food brands. The
government’s efforts to boost overall consumer sentiment would also fuel domestic
demand growth. We expect winners to be staples names with growing brands, and
discretionary names that can differentiate in store format and experience quality.
Hong Kong slowdown is structural, not cyclical: Hong Kong retailing will continue to
be affected by the Chinese visitation slowdown and structural changes in both sales
volume and average ticket size. Recent cultural conflicts even worsen the tension and
visitation. Japan and Korea gradually replace Hong Kong to become the new outbound
travel destinations for shopping and leisure for most mainland Chinese consumers. In
addition to the overhang on top-line growth, margin contraction is another concern as
retailers may increase the promotional and marketing activities to achieve sales targets,
which may offset the benefit from rental cost savings (landlords are lowering rates, as
more global brands continue downsizing their store network). There is low visibility on how
long the cultural conflict will last and how serious it could become in the near future. We
believe among Hong Kong retailers, those who rely less on retail sales in Hong Kong but
focus more on expansion in China, may suffer less than peers.
Valuations
Figure 172: Valuation plots (P/E and ROE) Figure 173: Valuation plots (P/E and earnings growth)
IndonesiaTaiwan
Thailand
India
Korea
China/HK
10
15
20
25
30
35
40
10% 15% 20% 25% 30% 35%
2016E P/E
2016E ROE
IndonesiaTaiwan
Thailand
India
Korea
Chin/HK
10
15
20
25
30
35
40
0% 5% 10% 15% 20% 25%
2016E P/E
EPS growth 2015-17E
Source: Credit Suisse estimates Source: Credit Suisse estimates

01 December 2015
Asia Pacific Equity Strategy 94
Environment Longer and better growth
We remain positive on the China environment sector, with solid fundamentals underpinned
by robust treatment demand growth, non-stop upgrade potential, and consistent policy
support. Despite the slowdown in the broader economy of China, the sector, with its rising
contribution to GDP, stands out perhaps more than before, in our opinion. We see a
potential multiple rerating in 2016E, on the back of improving earnings quality, driven by
accelerating profit from operations, combined with a more visible growth outlook for 2017-
20E. The upcoming 13th Five-Year Plan should not only serve as a positive catalyst, but
should also likely lead to the most incremental positive policy changes for the water
segment, through potential higher waste water treatment standards.
Figure 174: Top stock ideas for 2016
Mkt Yield P/B ROE Net debt/
Target cap P/E (x) (%) (x) (%) equity (x)
Company RIC Rating Curr. Price price (mn) FY14A FY15E FY16E FY16E FY16E FY16E FY16E
Top outperformers
Dongjiang 0895.HK O HK$ 13.0 23.0 2,615 36.4 28.5 19.0 1.1 3.0 16.7 73.4
BEW 0371.HK O HK$ 6.1 8.0 6,899 29.5 23.7 18.9 2.0 2.8 15.6 115.4
CEI 0257.HK O HK$ 11.8 18.5 6,838 31.1 22.0 15.2 1.9 2.5 17.8 32.8
SIIC SIIC.SI O S$ 0.78 1.50 1,229 24.6 19.3 12.6 0 1.4 11.6 32.0
Top relative underperformers
BJC 600008.SS U Rmb 11.1 8.7 4,203 40.2 38.7 34.1 1.7 3.0 8.9 127.0
Source: Company data, Thomson Reuters, Credit Suisse estimates
What should investors care about in 2016?
13th Five-Year Plan: water in focus. We expect the upcoming 13th Five-Year Plan for
China's environment sector to provide a consistent policy push, with a more aggressive
investment plan, and higher targets for air and water quality. Yet ultimately, the focus
would be more on water, in our view. Key things to watch: (1) total environment investment
is likely to reach Rmb10 tn over 2016E-20E, twice as much as in the 12th Five-Year Plan.
It implies that the annual investment in the sector could reach Rmb2.4 tn or 2.7% of the
GDP by 2020E (from 1.8% in 2014A). (2) New pollutants are likely to be added to the
targets, such as VOC, total N and P. (3) We expect the water sector to receive the most
incremental positive policy changes ahead, including nearly half of the total investment,
and notable changes in water quality requirement aimed at further cutting discharge of
total N and P, and NH4-H—leading to potential further standard upgrade for the waste
water treatment facilities.
Earnings: Higher for longer. The accelerated five-year investment plan, combined with
the strong project pipeline of the major operators, will improve the visibility of the sector's
growth outlook beyond 2017E. We estimate 2020E earnings of the top water operators will
be 10-22% higher than our previous estimates, under our new base case with accelerated
water plant upgrades, including 100% grade I-A conversion and 50% grade quasi-surface
water IV conversion (our revised base case). Under our 'blue-sky' scenario, a 100% grade
quasi-surface water IV conversion would lead to 27-34% earnings improvement on 2020E.
In addition, the strong project pipeline also underpins growth in operations over 2017E-
20E—as of 3Q15, we estimate projects on hand for most listed operators are on average
nearly 200% above their 2014A operating capacity, with the industrial waste segment
leading the way, followed by WTE, and water. Top operators such as Dongjiang have
project pipeline above 500% of their 2014A capacity, leading to a 24% upward revision,
and potentially 37% under our blue-sky scenario, for 2020E earnings.
Trina Chen
trina.chen@credit-
suisse.com
852 2101 7031
With rising contribution to
GDP, China's environment
sector stands out, more than
before
We expect the upcoming
13th Five-Year Plan to unveil
a more ambitious
investment road map, higher
quality targets, and bring the
most positive policy
changes for the water sector
The improved growth
visibility has led to 10-22%
upgrades in our 2020E
earnings, and potentially 27-
34% under the "blue-sky"
scenario, for top operators

01 December 2015
Asia Pacific Equity Strategy 95
Improving earnings quality: We expect improving earnings quality for the sector, as
contribution from operations to total profit should rise from 58% in 2015E, to 64% in 2017E,
and potentially to 73% by 2020E, driven by accelerating growth of profit from operations
(versus from EPC and BOT accounting profit). Specifically, we estimate the average
annual growth rate of profit from operations of the sector will accelerate from a 39% CAGR
over 2013-15E to 47% over 2015-17E, due to volume growth of waste treated, coupled
with improving unit profit of select operators (through technology upgrade, plant standard
upgrade, or better projects mix). There are emerging risks such as lower quality projects,
competition, and longer execution time.
Valuations
Our top picks are Dongjiang, BEW, SIIC, and CEI. Dongjiang ranks at the top of our list as
an operator with the right strategy and execution, in our most preferred segment—
industrial HWT. We are incrementally more positive on the waste water sector, and view
BEW, SIIC, and CEI as the key beneficiaries of the 13th Five-Year Plan. We revise our
earnings by -8% to +3% for 2015E-17E (or -9 to +4% for operational profit), and raise TP
for most stocks under coverage (by 7-21%) to incorporate the potential acceleration in
water plant upgrades, newly added projects, partly offset by a slower construction pace in
general, and the mild VAT impact.
Figure 175: China environment sector—coverage summary
Company Ticker Rate TP Price Mkt
cap
P/E (x) P/B (x) ROE (%)
Price as of Nov 26 Tccy US$ bn 15E 16E 17E 15E 16E 17E 15E 16E 17E
BEW 0371.HK O 8.0 6.1 6.9 23.7 18.9 16.8 3.1 2.8 2.5 14% 16% 16%
SIIC SIIC.SI O 1.50 0.78 1.2 19.3 12.6 9.5 1.6 1.4 1.2 9% 12% 14%
SDG 0967.HK O 11.1 7.0 1.4 10.4 8.4 7.2 1.9 1.5 1.3 20% 20% 20%
GD Inv 0270.HK N 12.0 10.7 8.7 16.7 16.1 13.5 2.1 1.9 1.7 13% 12% 14%
TJC-H 1065.HK N 5.2 6.6 2.3 20.8 17.6 17.2 1.7 1.6 1.5 9% 10% 9%
TJC-A 600874.SS U 4.3 11.8 2.3 45.2 38.1 37.2 3.8 3.5 3.3 9% 10% 9%
BJC 600008.SS U 8.7 11.1 4.2 38.7 34.1 24.5 3.1 3.0 2.8 9% 9% 12%
CEI 0257.HK O 18.5 11.8 6.8 22.0 15.2 10.1 2.9 2.5 2.1 14% 18% 23%
Dgreen 1330.HK O 5.5 4.5 0.6 16.8 12.6 8.1 1.6 1.5 1.2 10% 12% 17%
Canvest 1381.HK O 5.6 3.3 0.8 22.6 13.2 9.6 2.5 2.1 1.7 12% 17% 20%
ConchV 0586.HK O 21.5 16.9 3.9 12.2 10.9 9.5 1.6 1.4 1.3 12% 11% 12%
SDE 000826.SZ N 41.0 40.5 5.4 33.4 27.4 23.0 5.6 4.7 4.0 18% 19% 19%
Djiang-H 0895.HK O 23.0 13.0 2.6 28.5 19.0 12.7 3.4 3.0 2.5 13% 17% 21%
Djiang-A 002672.SZ N 18.2 21.8 2.6 57.8 38.6 25.7 7.0 6.0 5.0 13% 17% 21%
CT Env 1363.HK O 3.1 2.6 2.1 24.8 18.3 15.3 5.2 4.2 3.4 26% 26% 25%
GD Tech 1296.HK O 0.8 0.8 0.6 n.a. 25.1 22.1 0.4 0.4 0.4 -3% 2% 2%
Yonker 300187.SZ U 11.0 45.8 1.5 115.0 96.8 105.8 7.2 7.0 6.6 7% 7% 6%
Source: Company data, Thomson Reuters, Credit Suisse estimates
We expect earnings quality
to improve for the sector, as
contribution from operations
to total profit rises

01 December 2015
Asia Pacific Equity Strategy 96
Gaming Prefer Macau and local focused operators
Summary view: Over the past year, a weaker China VIP/high-end demand caused by the
slower China macro, the on-going anti-corruption campaign and crackdown on overseas
casinos promoting in China have adversely impacted gaming markets across Asia.
Heading into 2016, the focus of the sector would be (1) a stabilisation or a potential
recovery in the VIP market, (2) ramping up of newly opened casinos (Macau and
Philippines) and (3) new supply from two scalable casino resorts due to open in Macau—
the US$4.1 bn Wynn Palace (25 June 2016) and US$3.3 bn MGM Cotai (4Q16). The
potential recovery of the junket VIP market is likely to help regional peers. Overall, we
continue to expect that local demand (Philippines and Korea) is likely to stay resilient.
Figure 176: Top stock ideas for 2016
Mkt Yield P/B ROE Net debt/
Target cap P/E (x) (%) (x) (%) equity (x)
Company RIC Rating Curr. Price price (mn) FY14A FY15E FY16E FY16E FY16E FY16E FY16E
Top outperformers
Galaxy 0027.HK O HKD 23.6 37.6 12,967 9.8 21.5 14.0 2.2% 2.2 16.2% Net cash
MGM China 2282.HK O HKD 10.3 20 5,031 6.8 11.6 12.1 5.0% 4.3 35.9% 124.5%
Kangwon Land 035250.KS O KRW 37,750 54,000 7,065 21.3 17.4 15.2 3.2% 2.6 16.1% Net cash
Bloomberry BLOOM.PS O PHP 5.32 8.3 1,247 13.9 -35.8 39.0 1.0% 2.3 5.9% 82.6%
Genting Singapore GENS.SI O SGD 0.775 1 6,669 20.6 32.5 22.7 1.3% 1.2 5.4% Net cash
Genting Bhd GENT.KL O MYR 7.3 10.3 6,514 18.2 17.2 14.1 0.7% 0.9 6.6% Net cash
Note: Priced as of 25 November 2015. Source: Company data, Thomson Reuters, Credit Suisse estimates
What should investors care about in 2016?
Macau: A resumption of growth in 2016
Gaming revenue may be back on the growth track again in 2016. Given the easy comp
base in 2015 (GGR on track to drop 34% YoY), new properties opening, stabilising
fundamentals and accommodative policies, we expect industry GGR to grow again in 2016. In
particular, the monthly GGR growth may turn positive again in late 1Q and quarterly GGR in
2Q16. The turnaround in revenue is likely to serve as a rerating catalyst for the sector.
Price competition is unlikely even with new supply. Despite the new supply, we see
low risk for a price war. On the one hand, VIP’s thin margin and shrinking contribution to
the sector allow limited room for further promotion. On the other hand, simply raising the
reinvestment rate has proven to be of limited help in gaining mass-market market share.
We also believe that it is unwise for operators to sacrifice the profitability of existing
operations to compete for more share for their new properties.
Cost pressure is not as bad as the market would have feared. Factoring in excess
labour and lower opex for new casinos (fewer tables), we estimate that each new casino
would only need 1.5% incremental GGR to break even and 4% to generate 15% RoIC. Korea: Locally focused casinos should continue to outperform
Decoupling of Chinese VIP traffic and inbound tourists. The Chinese VIP slowdown
should have bottomed, but there are no signs of a bottoming-out in Korea unless there are
significant regulatory changes from Beijing. We believe Chinese VIP traffic would decouple
with that of Chinese inbound travellers. Paradise and GKL may continue to see limited
growth in 2016E, despite the low base in 2015.
Election events. The overhang of additional tax payments has weighed on Kangwon Land’s
share price despite improving operations. However, we believe any additional tax as unlikely
ahead of the Legislative Election and Presidential Election in 2016-17. The relieving concern
on additional tax is likely to allow a sequential valuation expansion given its unrivalled growth.
Kenneth Fong
kenneth.kc.fong@credit-
suisse.com
+852 2101 6395

01 December 2015
Asia Pacific Equity Strategy 97
IR transitions may cause over-supply issue. Paradise's new IR (Integrated Resort) is
due to open by 2Q17E. While the development of IRs is positive for long-term growth, new
openings may escalate the concern of over-supply of foreigner-only amid weak demand.
The progress of IR's development will be closely monitored by the market. More news flow
on IR should come from early-2016 onwards.
Philippines: Mass market should stay resilient; VIP recovery is an upside option
Mass market growth is likely to sustain into 2016 given (1) the increase in mass
revenue is supported by growing player count; (2) PAGCOR, whose casino quality pales
in comparison to the integrated resorts, also noted gaming revenue growth of 46% YoY in
9M15, driven by tele-betting and increasing foot traffic; (3) the non-gaming attractions
surrounding Entertainment City should further build critical mass; and (4) infrastructure
improvement, such as NAIA Expressway (expected to be completed by May 2016), also
support further revenue growth (both mass and VIP).
New supply (Manila Bay Resorts) is expected to open by end-2016/1Q17. With 2,000
hotel rooms, Manila Bay Resorts would have an allowable gaming capacity of 500 tables
and 3,000 slot machines. This is a 51% increase from the current industry (3 IRs) gaming
capacity of 971 tables (RWM 305, BLOOM 401, CoDM 265). While the PAGCOR deadline
for completion of this project has been extended to end-2016, we believe the property will
likely open by 1Q17.
Singapore: Bottoming VIP with a resilient mass
The outlook for Singapore's VIP segment should remain sluggish in 2016, especially for
Genting Singapore, due to China's anti-graft campaign. That said, we believe that the
sharp decline in VIP volumes should narrow in 2016, after a cautious four to six quarters
(Genting Singapore is more prudent extending credit to VIP players). On the other hand,
mass volume has been very resilient with steady volume over the past six to seven
quarters. The strong mass segment is also evidenced by the higher and consistent hotel
occupancy rate for both Genting Singapore and Marina Bay Sands (>85%).
Malaysia: Project renovation may drag growth in 2016
GENM’s Resorts World Genting, is undergoing a major transformation. On a positive note,
more casino tables might be approved, given the significant investment. Yet, the
challenging macro in Malaysia and the suspended operations of the theme park would
weigh on the performance in near term. Current market expectations on 2016E/17E
earnings appeared unrealistic by assuming a new theme park (Asia's first Twentieth
Century Fox World Theme Park) and shopping mall (Sky Avenue/ Sky Plaza) to open by
mid-2016E (we note that the opening will likely be postponed to early 2017E).
Valuations
At 10x FY16 EBITDA, Macau gaming names are trading at below historical average (12x).
In our view, the sector is trading at a low growth multiple but with an upside option of the
new projects, supportive policies and room for VIP recovery. Philippines names are trading
at an undemanding EBITDA multiple of 7x, but their P/E are still elevated as depreciation
expenses of newly opened projects dragged. By P/E, Kangwon Land is trading at the
higher end of historical range on its earnings resilient and growth from better capacity
utilization. Genting Singapore's EBITDA multiple has derated to 7x for 2016 (from 12x
historical average) on slower growth concern and bad debt concerns. We believe
negatives are in the prices. Genting Malaysia's 19x 2016 P/E appears fair consider its
weaker near-term growth outlook on its property renovation.

01 December 2015
Asia Pacific Equity Strategy 98
Industrials Selective among subsectors
We are selective among China industrial subsectors. We prefer wind power equipment,
and power transmission and distribution equipment makers, due to their sound long-term
demand outlook; we are cautious on conventional power equipment companies because
of the structural decline in thermal power, the high delay risk for nuclear and uncertain
overseas markets. We are neutral on railway and automation largely due to stretched
valuations.
In Korea, domestic E&C companies are expected to continue to benefit from the
recovering housing market, while legacy overseas construction projects comprise the only
risk. For shipyards, we prefer pure shipbuilders for their limited bulk and rig exposure.
We expect a gradual pick-up in capex activity in India in 2016, driven by the government
sector in the 1H and the likelihood of the private sector in the 2H in smaller segments.
In the transportation space, we prefer airlines for lower fuel prices and potentially better-
than-expected demand stimulated by lower fares. Both bulk and container shipping remain
challenged due to excess capacity and falling demand.
Figure 177: Top stock ideas for 2016
Mkt Yield P/B ROE Net debt/
Target cap P/E (x) (%) (x) (%) equity (x)
Company RIC Rating Curr. Price price (mn) FY14A FY15E FY16E FY16E FY16E FY16E FY16E
Top outperformers
Goldwind 2208.HK O HKD 13.3 26.3 6.5 17.0 9.6 8.4 5.9 1.6 19.5 35.8
Singapore Air SIAL.SI O SGD 10.47 14.00 8.9 36.3 14.6 12.0 5.0 0.9 8.0 Net cash
Voltas VOLT.BO O INR 283.20 345.00 1.4 41.9 27.7 26.9 0.9 4.0 15.6 Net cash
Hyundai Mipo 010620.KS O KRW 63,800 90,100 1.1 -2.0 19.1 14.7 0.0 0.7 4.6 125.6
Hyundai Dev 012630.KS O KRW 41,850 70,000 2.7 44.7 12.8 10.0 1.2 1.2 12.2 19.3
Top relative underperformers
SEG 2727.HK U HKD 4.81 2.20 19.2 21.0 28.9 25.5 1.2 1.2 4.9 Net cash
Evergreen 2603.TW U TWD 13.05 13.00 1.4 -30.9 -21.6 22.9 1.3 0.8 3.6 58.0
BHEL BHEL.BO U INR 173.35 155.00 6.4 29.9 21.2 16.4 1.3 1.1 7.1 Net cash
Source: Company data, Thomson Reuters, Credit Suisse estimates
What should investors care about in 2016?
China: Prefer wind and T&D equipment
We believe that 2016 will continue to be a good year for quality companies, such as
Goldwind, which should gain market share. We believe that a wind farm tariff cut may
have little impact on turbine demand because wind power plant IRRs can be defended
through: (1) lowered interest costs and (2) a shift in geographic focus. Moreover,
curtailment improvement through UHV line transmission, a renewable quota system, a
carbon trade scheme and an improved subsidy pool are all positive moves to support IRRs
in the long term. In addition, we expect a final decision on the tariff cut may be less than
the currently discussed rate, as this is just a consultation paper from the National
Development and Reform Commission (NDRC) seeking public opinion. This proposal has
actually been strongly objected toby wind farm operators and the final cut may be less
than originally proposed. Goldwind is our most preferred choice in China's industrial sector.
We maintain our positive stance on power distribution equipment makers due to
continuous large capex from the grids. We expect UHV capex to grow significantly in 2016
on a YoY basis, as nine UHV lines started construction in 2015, versus three in 2014.
Besides, we also expect strong power distribution equipment demand as the National
Edmond Huang
edmond.huang@credit-
suisse.com
+852 2101 6701
Tim Ross
MinSeok Sinn
Henry Kwon
Lokesh Garg
Baiding Rong
HaYoung Chung
01 December 2015
Asia Pacific Equity Strategy 99
Energy Administration (NEA) announced its Rmb2 tn capex plan for 2015-20. We expect
equipment suppliers to register solid sales growth in 2016 on good order momentum and a
low base in 1H15. We like XD, XJ and Wasion among Chinese T&D equipment companies.
Korea: Domestic housing market recovery to benefit constructors despite overseas
legacy projects; pure shipbuilding better off
We believe that the ongoing recovery in the domestic property market, which began in
mid-2013 after a six-year downcycle, should continue at least until early- to mid-2017.
Indeed, historically, house prices (or confidence in the housing market) have been highly
correlated with housing affordability/the cost spread between owning and renting rather
than with new housing completions, while affordability and cost spread in the domestic
property market are at record highs and narrows, respectively. On the other hand, we are
concerned about the risk of additional cost overruns from companies’ overseas business
given the risk can be fully resolved only after the completions of problematic overseas
projects, while most of the companies still have ongoing problematic projects on their
order books. All in all, we anticipate a surge in their new housing starts since mid-2014
and a surge in overall housing starts in Korea in 2014/15 to drive stellar revenue/earnings
growth for Hyundai Dev, KCC Corp and LG Hausys over 2016-17.
As we are looking for a mild recovery in conventional shipbuilding demand in 2016, we do
not believe it will be a year for major backlog build-ups for rigs since a contraction in off-
shore backlog should be expected. Conventional vessel profitability should continue to
improve given improvements in the delivery mix, which is not currently captured in sector
valuations. Hyundai Mipo is our top buy for the sector as: (1) it is a pure shipbuilding play
which will likely exceed its order target; and (2) it should see margin expansion in 2016
from improvements in delivery mix.
India: Orders to pick up in 2016 driven by the government sector in 1H and possible
private sector in 2H
Indian private sector ordering activity remained weak in 2015 given current low utilisation
and a subdued demand growth outlook in the near term. The government has remained
focused on infrastructure development with good activity in roads, power T&D ordering
and some pick-up in railways. There was a pick-up in power equipment ordering driven by
the central power generation utility, NTPC, and some states. For 2016, we expect a
gradual pick-up in capex activity, driven by the government sector in 1H and the likelihood
of the private sector in the 2H in smaller segments. We don’t envisage large private sector
capex (oil & gas, metals and power generation) to pick up soon, which makes us cautious
on large industrial names in the sector: L&T (Neutral) and BHEL (Underperform). L&T is
also expected to be impacted due to weaker oil and gas capex in the Middle East in the
wake of the continued weakness in oil prices. In this space, we like Voltas as a play on the
under-penetrated AC market in India and improving profitability in the electro-mechanical
projects business, and Container Corp of India (Concor), which is well positioned to benefit
from long-term structural growth in export-import trade.
Transportation: Prefer airline over shipping
We go into 2016 broadly encouraged by prospects for the airline sector as we see lower fuel
prices (as high price hedges roll off and spot prices stay low) translating into lower fares and
generally stimulating demand ahead of expectations and most certainly ahead of supply.
PRC outbound travel demand remains a key driver of value that we don't see dissipating,
despite weaker economic fundamentals at home, while currency headwinds at worst ought
not to intensify with any easing in USD strength a bonus. To say that shipping—both dry and
liner—remains a challenged sector is an understatement; excess capacity remains a well
identified obstacle to performance, but falling demand is adding to the sector's woes. Aside
from the US, Western demand for finished goods remains anaemic, limiting the prospects for
liner shipping, while low steel production and a structural shift away from coal consumption
in China is impacting demand for seaborne commodities. Singapore Airlines is the most
preferred, Evergreen the least preferred picks.

01 December 2015
Asia Pacific Equity Strategy 100
Insurance Continued underlying growth; low yields an issue
Underlying growth momentum remained fairly strong in most Asian markets in 2015, which
we see as continuing into 2016, especially for life insurers more focused on selling
protection-focused (rather than savings) products such as AIA and Prudential.
Key markets (and stocks) we like going into 2016 are:
■ Regional life insurance: We continue to see decent growth rates for regional life
insurers in Asia despite some slowdown in ASEAN, with AIA being our preferred
regional exposure. We see AIA benefiting from a favourable demographic profile in
many countries and low penetration rates, we expect this superior growth rate to
continue at least over the next decade. AIA's strong execution and increasing
protection mix see it much less exposed to interest rate and market movement than its
North Asian peers.
■ Australian life insurance/retirement: We believe there is an increased support for
annuities from both the industry and the government in Australia. Following
Challenger's distribution agreement with Colonial signed last year, it recently noted
that it "expects other major retail platforms to follow," and sees an uptick in discussion
for annuity products. The government is supportive of the FSI's recommendations for
annuities while the Treasurer has flagged potentially innovative changes.
■ China P&C insurance: We view the outlook for the Chinese P&C sector as good into
2016, with low-teens growth and stable margins, despite the impact of the first phase
of price de-regulation (as price reductions offset lower claims frequency). The market
remains very concentrated, and scale advantage benefits the top three insurers, which
were the only ones to generate operating profits last year.
Figure 178: Top stock ideas for 2016
Mkt Yield P/B ROE Net debt/
Target cap P/E (x) (%) (x) (%) equity (x)
Company RIC Rating Curr. Price price (mn) FY14A FY15E FY16E FY16E FY16E FY16E FY16E
Top outperformers
AMP ORD AMP.AX N AUD 5.7 6.35 12,135 17.5 16.2 15.6 5.1% 2.0 11.9% 145.1%
AIA Group 1299.HK O HKD 47.7 57.5 74,075 21.5 21.6 16.8 1.5% 2.1 12.4% 5.1%
PICC P&C 2328.HK O HKD 17.3 21.5 33,100 13.4 9.3 10.8 2.3% 1.7 16.0% Net cash
Top relative underperformers
Bangkok Life BLA.BK U THB 54.25 39.25 2,591 34.5 25.3 19.6 1.1% 2.9 15.1% n.a.
Medibank Private Ord MPL.AX U AUD 2.26 2.2 4,512 24.1 21.3 20.6 3.6% 4.2 20.3% Net cash
Note: Priced as of 25 November 2015. Source: Company data, Thomson Reuters, Credit Suisse estimates
We are less positive on the following markets/stocks:
■ Thailand life insurance: While we like the Thailand insurance market’s fundamentals, we
view falling bond yields and potentially slowing growth as the key issues. Bangkok Life
continues to trade on very high multiples despite having negative value of new business
growth last year, and being the most expensive life company globally (see Figure 182).
■ Australia Health insurance: There are currently five regulatory reviews under way
that affect the Australian private health insurance industry. These reviews will likely
highlight that the industry is not operating efficiently and is unsustainable under the
current regulatory settings. We believe solving these structural challenges will require
significant regulatory change. While there is minimal risk to core health insurance
earnings in the short term, we see earnings uncertainty in outer years from structural
challenges. We maintain our UNDERPERFORM ratings on MPL and NHF.
Arjan van Veen
arjan.vanveen@credit-
suisse.com
852 2101 7508
We continue to see good
insurance growth prospects
into 2016

01 December 2015
Asia Pacific Equity Strategy 101
What should investors care about in 2016?
Rising bond yields to provide relief for many insurers
Given large historical long-term guarantees offered to policyholders and shorter asset
durations, many life insurers in Asia are highly leveraged to changes in bond yields—with
north Asian markets being the most exposed (Taiwan, Japan, Korea, and China) as
highlighted in Figure 179.
As such, the fall in bond yields in most Asian markets in 2014 and 2015 after a rally in
2013 is quite problematic for many insurers. Within these countries, the most exposed (in
our coverage universe) are Shin Kong in Taiwan, T&D Holdings in Japan, Hanwha Life
in Korea and New China Life in China.
Figure 179: Asian insurers sensitive to bond yields… Asia insurance sensitivity to 25 bp rise in investment yield
Figure 180: …with bond yields again falling in 2015 Korean 3Y and 10Y government bond yields (%)
-5.0%
0.0%
5.0%
10.0%
15.0%
20.0%
AM
P
Suncorp
AIA
Prudential A
sia
Bangkok Life
Great E
astern
China Life
Ping A
n
China P
acific
New
China Life
China T
aiping
PIC
C G
roup
Dai-ichi Life
Sony F
inancial
T&
D H
oldings
Sam
sung Life
Hanw
ha Life
Tong Y
ang Life
Dongbu
Hyundai M
&F
LIG Insurance
Meritz F
&M
Sam
sung F&
M
Cathay F
HC
China Life T
W
Fubon F
HC
Shin K
ong FH
C
EV VNB
TaiwanHK & SEAAustralia KoreaChina Japan
0.0%
1.0%
2.0%
3.0%
4.0%
5.0%
6.0%
7.0%
Dec-0
3
Jun-0
4
Dec-0
4
Jun-0
5
Dec-0
5
Jun-0
6
Dec-0
6
Jun-0
7
Dec-0
7
Jun-0
8
Dec-0
8
Jun-0
9
Dec-0
9
Jun-1
0
Dec-1
0
Jun-1
1
Dec-1
1
Jun-1
2
Dec-1
2
Jun-1
3
Dec-1
3
Jun-1
4
Dec-1
4
Jun-1
5
Cash 3yr bond yield 10yr bond yield
10yr bond yield
3yr bond yield
Source: Company data, Credit Suisse estimates Source: Company data, Credit Suisse estimates
Valuations
With the exception of a few companies, valuations are not overly demanding throughout
Asia and premiums to developed markets have largely eroded. However, falling yields will
hamper the large rerating potential—hence, we would focus on stocks with lower interest
rate leverage and good operational momentum.
Figure 181: Asian valuations not that challenging… Asia Insurance: Price to embedded value
Figure 182: …with only a few trading above EV Implied value of 1Y new business multiplier (x)
0.00x
0.20x
0.40x
0.60x
0.80x
1.00x
1.20x
1.40x
1.60x
1.80x
2.00xM
ax India
Bangkok Life
AIA
AM
P
China Life (A
)
China Life (H
)
China P
acific (H)
New
China Life (A
)
China P
acific (A)
Ping A
n (H)
Ping A
n (A)
Prudential plc
China Life T
W
Great E
astern
Fubon F
HC
China T
aiping
New
China Life (H
)
Sam
sung F&
M
Dongbu
Korea Life
Cathay F
HC
Sam
sung Life
Sony F
inancial
Hyundai M
&F
T&
D H
oldings
-10.0x
-5.0x
0.0x
5.0x
10.0x
15.0x
20.0x
25.0x
30.0x
Bangkok Life
Max India
AIA
AM
P
Prudential plc
China Life (A
)
China Life (H
)
China P
acific (H)
Challenger
China P
acific (A)
Ping A
n (H)
China Life T
W
Ping A
n (A)
Fubon FH
C
Great E
astern
New
China Life (H
)
Dongbu
China Taiping
Hyundai M
&F
Cathay F
HC
Sam
sung F&
M
Hanw
ha Life
Source: Company data, Credit Suisse estimates Source: Company data, Credit Suisse estimates

01 December 2015
Asia Pacific Equity Strategy 102
Oil & Gas Rebalance
The Credit Suisse global energy team forecasts a US$58/bbl oil price (Brent) in 2016, a
small uptick from US$53/bbl in 2015. CS is of the view that starting 1Q16, the forces that
have caused the current oversupply situation will start to ease. The primary one being US
oil production, where we forecast production to begin to decline YoY in 1Q16 and not turn
positive again until 4Q16—the culprit being prices finally choking off enough capital for
long enough to reduce activity across all shale basins. Essentially, we do not think oil will
recover to US$70/bbl or above before 2018.
Figure 183: Call on US crude based on CS demand-supply
model (in kb/d)
Figure 184: US drilling rig count—fallen by more than half
Source: Industry data, Credit Suisse global energy team Source: Baker Hughes, Credit Suisse global energy team
Figure 185: Credit Suisse crude oil price forecasts
2013 2014 1Q15 2Q15 3Q15 4Q15E 2015E 1Q16E 2Q16E 3Q16E 4Q16E 2016E 2017E 2018E 2019E LT
Brent 108.9 98.9 54.2 62.1 49.5 48.0 53.4 51.0 57.0 60.0 64.0 58.0 65.0 70.0 70.0 75.0
WTI 97.9 93.1 48.8 57.8 45.0 43.0 48.6 46.0 54.0 57.0 59.0 54.0 60.0 65.0 65.0 70.0
Dubai 105.4 96.7 52.5 61.4 50.2 47.0 52.8 50.0 56.0 58.5 62.5 56.8 62.0 67.0 67.0 72.0
Source: Bloomberg, Credit Suisse global energy team estimates
In our view, only in the 2018-19 timeframe do we foresee oil prices rising above US$70/bbl
Brent, the low end of the range in which big, multibillion dollar oil projects (e.g., core deep
water) attract Final Investment Decisions. And in the longer run, we think that still higher
prices will be required to fill the then still relentlessly widening wedge between EM-driven
demand growth and the decline in rates.
Figure 186: Top oil & gas ideas for 2016 Yield P/B ROE Net debt/
Target Mkt cap P/E (x) (%) (x) (%) equity (x)
Company RIC Rat. Ccy. Price price (US$ mn) FY14A FY15E FY16E FY16E FY16E FY16E FY16E
Top outperformers
CNOOC 0883.HK O HKD 8.75 10.70 50,505 5.4 15.6 12.0 3.3% 0.86 7.2% 21%
Reliance Industries RELI.BO O INR 968 1,040 47,183 13.9 13.3 13.1 1.5% 1.32 10.1% 50%
PTT PTT.BK O THB 270 321 21,596 13.8 26.3 9.0 4.4% 1.02 11.3% 28%
Top relative underperformers
Anton Oil 3337.HK U HKD 0.98 0.80 280 -9.0 -11.2 -12.4 - 1.02 -8.2% 100%
Sinopec SSC - H 1033.HK U HKD 2.30 1.90 18,531 11.9 -11.6 -51.0 - 1.22 -2.4% 45%
Source: Company data, Credit Suisse estimates
Thomas Wong
thomas.wong@credit-
suisse.com
+852 2101 6738

01 December 2015
Asia Pacific Equity Strategy 103
What should investors care about in 2016?
China
We prefer CNOOC to PetroChina and Sinopec among the 'Big 3 Oils' in China. In our
view, among the three, CNOOC stands out the most in terms of capital discipline and cost
control, which should help it weather the downturn better than peers. CNOOC managed to
reduce opex by 19% YoY in 1H15, and management is confident that we could see
another 10-15% room for cost cutting should oil prices stay at US$50 levels. In addition,
the company has also increased dividend payout (62% as of 1H15, up from 27% in 1H14)
to reward shareholders through the depressed oil price environment, providing 6%
dividend yield to investors. All these, we believe, should place CNOOC ahead of peers
both in the HK/China and regional perspectives.
Thailand
We prefer PTT to PTTEP in Thailand. We hope PTT would reconsider its balance sheet
management and show commitment to improving its ROCE with better capital discipline.
In the shorter term, higher dividend payment would send a positive signal to the market.
India
We like Reliance Industries in India. Its refining and petrochemical capacity expansion is
nearing completion and has been largely successful, bringing in free cash flow generation
from FY18 onwards. Nevertheless, the current share price suggests no value for its telco
business (but all of the sunk capex), which we consider overly harsh.
Valuations
The MSCI Asia ex-Japan Energy index is trading at 11x forward P/E, 0.5 standard
deviation above its long-term historical P/E range. On a P/B basis, the MSCI Asia ex-
Japan index is at 0.9x, the lowest level over its long-term historical range amid the oil price
collapse. Consensus currently forecasts 12% earnings growth in 2016 for the sector, with
an expectation for an oil price recovery in 2016.
Figure 187: MSCI Asia ex-Japan Energy—forward P/E
band
Figure 188: MSCI Asia ex-Japan Energy—trailing P/B
band
4
6
8
10
12
14
16
18
2005 2006 2007 2008 2009 2010 2011 2012 2013 2014 2015
(x)
Avg. = 10.2x
+1 S.D. = 12.1x
-1 S.D. = 8.3x
0.5
1.0
1.5
2.0
2.5
3.0
3.5
4.0
4.5
5.0
2005 2006 2007 2008 2009 2010 2011 2012 2013 2014 2015
(x)
Avg. = 2.1x
+1 S.D. = 2.9x
-1 S.D. = 1.3x
Source: IBES, Credit Suisse estimates Source: IBES, Credit Suisse estimates

01 December 2015
Asia Pacific Equity Strategy 104
Technology Internet and software still leading the way
Summary view: Against a backdrop of slowing product cycles, aggregate earnings
growth for hardware/semis is again expected to be flattish in 2016, limiting the stock picks
to self-help stories, content gainers and those that are likely to be driven by corporate
action. On the other hand, earnings growth is likely to remain strong for IT and Internet
names, and in some cases might actually be stronger than was the case in 2015. Thus,
we maintain our mixed view on the sector—a large Overweight in Internet and IT Services
funded by a large Underweight in hardware/semis.
Figure 189: Top stock ideas for 2016 Mkt Yield P/B ROE Net debt/
Target cap P/E (x) (%) (x) (%) equity (x)
Company RIC Rat. Currency Price price (mn) FY14A FY15E FY16E FY16E FY16E FY16E FY16E
Top outperformers
Alibaba BABA O USD 81.71 98.00 205,290 37.5 31.9 24.7 0.0 4.9 19.8 (50.7)
Baidu BIDU O USD 201.80 210.00 70,934 32.1 37.8 30.9 0.0 5.6 18.2 (73.2)
Lenovo 0992.HK O HKD 8.64 11.00 12,384 14.5 (33.4) 10.8 1.9 3.5 32.4 (5.2)
Samsung Elec. 005930.KS O KRW 1,299,000 1,785,000 167,372 8.2 8.6 7.1 2.3 0.9 12.1 (6.1)
SPIL 2325.TW O TWD 45.00 52.00 4,315 12.0 12.2 11.7 6.4 1.9 16.1 3.0
Tech Mahindra TEML.BO O INR 537.55 700.00 7,830 20.1 17.4 13.9 1.7 3.0 21.9 (27.8)
Top relative underperformers
LG Elec 066570.KS N KRW 56,100 46,200 8,031 13.5 23.0 18.4 0.8 0.7 3.6 51.0
Mediatek 2454.TW N TWD 262.50 250.00 14,480 8.8 14.8 16.7 4.9 1.6 9.7 (63.3)
Pegatron 4938.TW N TWD 84.60 93.00 6,776 13.6 9.0 9.0 6.8 1.4 15.6 (36.7)
Quanta 2382.TW U TWD 52.00 46.00 6,180 10.6 11.6 11.2 6.7 1.7 14.8 (10.4)
Note: Priced as of 25 November 2015. * For Alibaba, Lenovo and Tech Mahindra, we use FY3/16E for FY15E. Source: Company data, Credit Suisse estimates
What should investors care about in 2016?
Challenging growth backdrop for Hardware/semis. 2015 proved to be an even poorer
year for EPS growth for hardware/semis than we had feared (estimated aggregate EPS
now set to decline YoY). Current street estimates for 2016 are forecasting a flattish EPS
growth year again, given a lack of top-line drivers (normalising consumer tech growth in
the absence of major product cycles). However, within the existing major product areas,
we believe that consumer PC growth is likely to be better than feared in 2016 driven by a
modest replacement cycle. Content improvement in leading smartphones should remain a
driver, particularly in 2H16, for leading component suppliers. Growth in areas such as
industrial PCs, data centres and related cloud infrastructure should provide avenues for
growth for some select companies. We believe Virtual Reality-related devices should gain
traction in 2016, though given the likely unit volumes, this should remain a niche theme.
Figure 190: MSCI tech indices: IBES EPS growth (YoY, %) Figure 191: MSCI AxJ tech—2015 and 2016 IBES EPS
(US$)
-3
24
9
-8
1
10 10
-7-2
8
31
129
-1
46
12
26
-20
-10
0
10
20
30
40
50
AxJ t
ech
Intern
et
IT Se
rvice
s
Hardw
are
Semi
s
China
Tech
India
Tech
Korea
tech
Taiwa
n Tec
h
2015 2016
24
26
28
30
32
34
36
38
40
Feb-1
4Ma
r-14
Apr-1
4Ma
y-14
Jun-1
4Ju
l-14
Aug-1
4Se
p-14
Oct-1
4No
v-14
Dec-1
4Ja
n-15
Feb-1
5Ma
r-15
Apr-1
5Ma
y-15
Jun-1
5Ju
l-15
Aug-1
5Se
p-15
Oct-1
5No
v-15
2016 EPS 2015 EPS
Source: IBES, MSCI, Thomson Reuters Source: IBES, MSCI, Datastream
Manish Nigam
manish.nigam@credit-
suisse.com
852 2101 7067

01 December 2015
Asia Pacific Equity Strategy 105
Focus on self-help and corporate action-related stories. In the absence of any major
revenue drivers for the sector in 2016, we believe that investors should look for self-help
stories (execution-driven, product mix change) or where there is the potential for some
corporate action (M&A, buy-backs, capital restructuring). We believe Lenovo offers one of
the best potential execution stories in AxJ tech over the next two years and is also a likely
beneficiary of further consolidation in the PC industry. We see strong economic reasons
for a pick-up in M&A/corporate action in Asian tech (slowing growth, high cash balances,
cheap valuations, well-funded bidders), but given the largely family-owned/influenced
nature of most of the large cap AxJ hardware and semi companies, the probability of such
events remains low and the task of forecasting such events a difficult one. While several
stocks could be at play here, we believe SPIL and Samsung Electronics offer the best
combination of bottom-up fundamentals and likely corporate action visibility.
Our big overweight remains in Internet and Indian IT. We are 600 bp Overweight
software (Internet and IT Services) against hardware/semis, a stance we maintained
throughout 2015 (but with differing levels of Overweight). Given the stronger earnings
growth on offer in 2016 for these sectors, we see little reason to change that Overweight
position. In addition, the Neutral benchmark weighting for Internet is set to increase in two
steps starting 30 November 2015, further arguing for added weighting to the sector. While
we believe that Internet still offers the best growth outlook across various tech sub-sectors,
we expect Indian IT to remain a steady grower again in 2016.
Figure 192: MSCI AxJ tech—pro-forma* sector weights
(%)
Figure 193: Internet and IT Services provide the best
earnings growers
Components5.5% (7.7%)
Hardware12.0% (13.6%)
Internet/media30.5% (19.6%)
IT Services8.9% (10.3%)
Others0.6% (0.4%)
Samsung19.8% (22.4%)
Semis22.7% (26%)
2022
28 29
12 12
23
57
28 29
41
11
15
24
0
10
20
30
40
50
60
Alibaba Baidu Tencent Vipshop TCS HCL Tech TechM
EPS growth CY16 EBIT growth CY16
Source: MSCI, Thomson Reuters Source: Company data, Credit Suisse estimates
Valuations
Valuations are modest for most parts of tech. Internet valuations are relatively more
expensive but are likely to hold in a year where growth elsewhere is likely to be elusive.
Figure 194: MSCI AxJ tech: trailing P/B (x) Figure 195: MSCI AxJ tech: 12M forward P/E (x)
1.0
1.5
2.0
2.5
3.0
3.5
4.0
01 02 03 04 05 06 07 08 09 10 11 12 13 14 15
6.0
8.0
10.0
12.0
14.0
16.0
01 02 03 04 05 06 07 08 09 10 11 12 13 14 15
Source: MSCI, Thomson Reuters, Bloomberg Source: MSCI, Thomson Reuters, Bloomberg

01 December 2015
Asia Pacific Equity Strategy 106
Telecoms A year for second-liners
Summary view: Going into 2016 we are OVERWEIGHT the telecoms sector overall,
despite a further year of outperformance in 2015, in preference to more expensive
consumer stables. However, rising interest rates may decrease the relative attractiveness
of yield plays, and so we continue to try to be selective. Within cellular, we have a
preference for stocks in markets which still have low smartphone penetration and
improving competitive dynamics (e.g., where unlimited data plans are avoided, and where
handsets subsidies are avoided or are reducing). We also like some fixed line operators
exposed to rising broadband penetration and enjoying high barriers to entry in selective
ASEAN markets. We use DCF to value each operator, and then select our regional top
picks on the basis of the largest upside to our DCF valuations versus current share prices.
Our top picks for 2015 include China Telecom, DTAC, XL and Link Net. Our top sells
include IDEA in India and True Corp in Thailand.
Figure 196: Top stock ideas for 2016
Mkt Yield P/B ROE Net debt/
Target cap P/E (x) (%) (x) (%) equity (x)
Company RIC Rating Curr. Price price (mn) FY14A FY15E FY16E FY16E FY16E FY16E FY16E
Top outperformers
Link Net LINK.JK O IDR 3,750 8,450 834 20.4 17.5 11.8 1.7% 2.6 21.7% Net cash
China Telecom 0728.HK O HKD 3.9 7.93 40,517 14.6 15.5 11.2 3.6% 0.8 7.4% 36.2%
DTAC DTAC.BK O THB 49.0 93 3,253 10.8 19.1 14.9 6.7% 3.6 23.8% 169.1%
XL Axiata EXCL.JK O IDR 3,770 5,150 2,351 -35.8 228.2 17.5 3.1% 2.2 12.4% 151.7%
Top relative underperformers
True Corp TRUE.BK U THB 8.5 3.3 5,864 106.7 53.2 524.4 0.0% 2.8 0.5% 96.2%
Idea Cellular IDEA.BO U INR 139.9 115 7,587 23.6 15.7 17.2 0.7% 2.0 11.4% 160.1%
Note: Priced as of 25 November 2015. Source: Company data, Thomson Reuters, Credit Suisse estimates
What should investors care about in 2016?
The introduction of a well-capitalised new entrant is, in our view, the single most damaging
structural change that can happen in a cellular market, given that it triggers higher
spectrum costs, higher capex (as a new entrant is forced to build nationwide coverage),
tariff competition and increased marketing expenditure (as the new entrant attempts to fill
its empty network and attract revenue over its fixed cost base). Thus industry capex
forecasts tend to be revised up, and margins and revenue tend to be revised down,
creating a 'triple-whammy' negative impact on EPS. This is already a 'live' issue for India
and we believe it could also become a problem for Singapore. Thailand is likely to
narrowly avoid this fate, though Jasmine did force up spectrum prices.
The other crucial factor in cellular is the presence or absence of unlimited data plans. The
requirement to pay a higher amount to consume larger volumes of data ensures that the
economics of consumer behaviour match the cost structure of the operators. We view the
avoidance of unlimited data plans, in markets such as China and Indonesia as healthy for
telecom operators—as consumers are incentivised to consume more and more data, there
is ARPU uplift and operators receive additional revenue from subscribers.
While the fundamentals of the Indonesian cellular market improved in 2015 (consolidation,
rising data price points), 'second-line' operators with USD-denominated debts significantly
underperformed operators, such as PT Telkom, with stronger balance sheets and no USD
exposure. We note that material downward revisions in 2015 earnings led to share price
declines in excess of impact on DCF valuation of higher debt balances in IDR terms. This
has created an opportunity for value-based investors, in our view.
Colin Mccallum
colin.mccallum@credit-
suisse.com
852 2101 6514
New entrants are the key
'red flag'
Data monetisation is crucial
Emerging market currencies
to be less of a handicap?

01 December 2015
Asia Pacific Equity Strategy 107
Figure 197: Non-Japan Asia cellular sector key structural drivers
Country Number
of
players
New
entrant
s?
Handset
subsidies
Competition
rank
FY14
Smartphone
penetration
Data pricing Proportion
revenue
bundled
Cellular market
FY15-FY17
revenue CAGR
Growth
rank
Overall
rank*
China 3 No Some 2.5 39.1% Tiered 72.0% 7.0% 4.0 3.0
Hong Kong 4 No Extensive 3.0 84.9% Tiered after Sept
2013
74.0% 3.0% 3.0 3.0
India 6-8 Yes None 1.0 15.9% Tiered 15.0% 6.4% 4.0 2.0
Indonesia 7 1 None 2.5 30.9% Tiered 31.0% 5.8% 4.0 3.0
Korea 3 No Extensive 2.5 82.2% Unlimited 3G,
Tiered LTE
84.0% 0.9% 1.0 2.0
Malaysia 4 Yes None 3.0 62.6% Tiered 52.0% 4.3% 2.0 2.7
Philippines 2 No Some 3.0 18.3% Tiered 46.0% 4.3% 2.0 2.7
Singapore 3 Possible Extensive 3.0 84.4% Tiered 61.0% -0.7% 1.0 2.3
Taiwan 3 No Extensive 3.0 64.5% Unlimited 3G, Tiered LTE 69.0% 2.3% 1.0 2.3
Thailand 3 No Some 3.0 75.2% Tiered 40.0% 4.8% 3.0 3.0
Note: 5 being most attractive, calculated as (growth rank +competition rank x2)/3); ** pre VAT impact for comparison.
Source: Company data, Credit Suisse estimates
Valuation
While China Telecom underperformed incumbent China Mobile in share price terms in
2015, its cellular service revenue grew by 11.4% YoY into 3Q15, ahead of China Mobile's
5.7% growth and Unicom's 4.5% decline. This looks set to continue. Average 4G ARPU
across 9M15 was Rmb83.0/month net of tariff discounts, 49.5% higher than the average
9M15 ARPU level of Rmb55.5/month, so a rising 4G subscriber base should drive
revenue. China Telecom is in our view a major beneficiary of tower sharing/injections. At
11.2x FY16 improving fundamentals do not seem to be priced in, in our view.
Overall broadband penetration is extremely low in Indonesia, at 7.5% of households as at
June 2015 (with only 1.9% of households enjoying speeds of 3Mbp and above), and Link
Net is constructing a 'first mover' advantage by addressing pent-up demand for broadband
access and Pay TV. At 11.8x FY16 P/E Link Net looks very cheap given its growth profile.
XL underperformed PT Telkom in share price terms in 2015, partly due to a strategy of
cleaning up unprofitable starter packs, but in large part due to forex losses.
We believe that DTAC is severely oversold versus our DCF valuation, with too much
emphasis having been placed on near term (2015) loss of revenue momentum. Regulatory
fees, and marketing costs, are set to decline in 2016 following the 900MHz 4G auction.
We remain very nervous over the prospects for the Indian market looking into FY16 given
the emergence of Reliance Jio as a well-capitalised new entrant. Thus we believe that the
strong earnings growth enjoyed in Indian cellular over the past three years could grind to a
halt in 2016. Given this, IDEA looks expensive.
We also retain True Corp as a top UNDERPERFORM call. The positive catalysts of the
towers sale and recapitalisation courtesy of China Mobile are now behind it, and valuation
(13.4x FY16 EV/EBITDA and 524x FY16 P/E) has been left looking very stretched post the
1800MHz auction. Furthermore, True Corp's relative competitive position in cellular could
weaken as AIS launches 4G services in early 2016.
We like China Telecom…
.. Link Net…
XL…
….and DTAC
We rate IDEA
UNDERPERFORM…
…together with True Corp

01 December 2015
Asia Pacific Equity Strategy 108
Transportation Demand is the greatest unknown
As it was in 2015, so do we believe it will be in 2016 for the transport sector, namely the
difficulty in matching variable demand with more fixed levels of supply. The travails of the
shipping sector are well documented with both dry and liner segments dogged by excess
capacity and the tanker segment likely to face similar issues in 2016 as the VLCC fleet
grows 8%. Airlines, while expanding, do have the benefit of demand elasticity that does
not accrue to freight; lower fares result in more passengers and lower jet fuel prices
provide an earnings cushion to falling yields. Moreover, average recorded fuel prices will
continue to decline for most APAC airlines in 2016 even were we to see a modest
increase in spot prices as expensive hedges roll off. Currency—in particular the direction
of the USD—remains the airline sector's greatest challenge in our view, but we retain our
positive outlook for this segment (warning to LCCs once more), while suggesting that all
but the most value-driven investors with long investment time frames avoid shipping.
Figure 198: Top stock ideas for 2016
Mkt Yield P/B ROE Net debt/
Target cap P/E (x) (%) (x) (%) equity (x)
Company RIC Rating Curr. Price price (mn) FY14A FY15E FY16E FY16E FY16E FY16E FY16E
Top outperformers
JAL 9201.T O JPY 4,371 6,800 12,914 4.6 9.9 8.9 2.8% 1.7 19.5% Net cash
AirAsia AIRA.KL O MYR 1.4 1.9 925 7.8 5.0 5.4 3.1% 0.9 16.1% 226.3%
SIA SIAL.SI O SGD 10.6 14 9,071 43.3 36.9 14.8 4.3% 1.0 6.7% Net cash
Top relative underperformers
EMC 2603.TW U TWD 12.6 13.0 1,363 -29.8 -20.9 22.1 1.3% 0.8 3.5% 58.0%
Westports WPHB.KL U MYR 4.25 3.75 3,441 28.3 29.4 23.5 3.2% 7.1 30.3% 38.7%
Note: Priced as of 25 November 2015. Source: Company data, Thomson Reuters, Credit Suisse estimates
What should investors care about in 2016?
Oil prices
As at mid-November 2015, the price of Brent oil has fallen 27% and this has been
reflected in the prices of jet kerosene (off 15%) and 380 centistoke (down 23%), the
primary input costs for the airline and shipping sector, respectively. Because companies in
both of these sectors tend to hold around five weeks of physical inventory and run hedge
programmes, the benefits of falling oil will continue into 2016 even with the modest rise in
Brent that Credit Suisse expects (a rise from average US$54 to US$58/bbl or 7%).
Homogenous growth in capacity; demand growth divergent
We anticipate capacity growth of 4-5% across the various transport sector sub-groups, but
the demand outcomes are likely to be substantially different. The greatest positive gap
between supply and demand is expected to be in the LCC segment as attempts to curb
capacity growth, evident since mid-2014, pay off and demand continues to rise at a rapid
clip. Full service carriers (FSCs) should also continue to enjoy upward pressure on load
factors as jet fuel price gains translate into lower fares stimulating passenger growth. Liner
players are expected to see some equilibrium, although continuous negative revision to
our global GDP growth estimate that underpins our demand expectations remains an
elevated risk. The most oversupplied (or under-demanded) segment is likely to remain dry
bulk. Declining coal volumes as China procures onshore and switches power production
preference to clean burning fuels is expected to combine with tepid steel production
limiting ore demand to generate a near 3% excess supply situation.
Timothy Ross
timothy.ross@credit-
suisse.com
+65 6212 3337
Muzhafar Mukhtar
muzhafar.mukhtar@credit-
suisse.com
+ 60 3 2723 2084
Christopher Siow
christopher.siow@credit-
suisse.com
+65 6212 3062
Lower oil price is a gift that
keeps giving
Low cost carriers should
enjoy the most positive
supply-demand spread
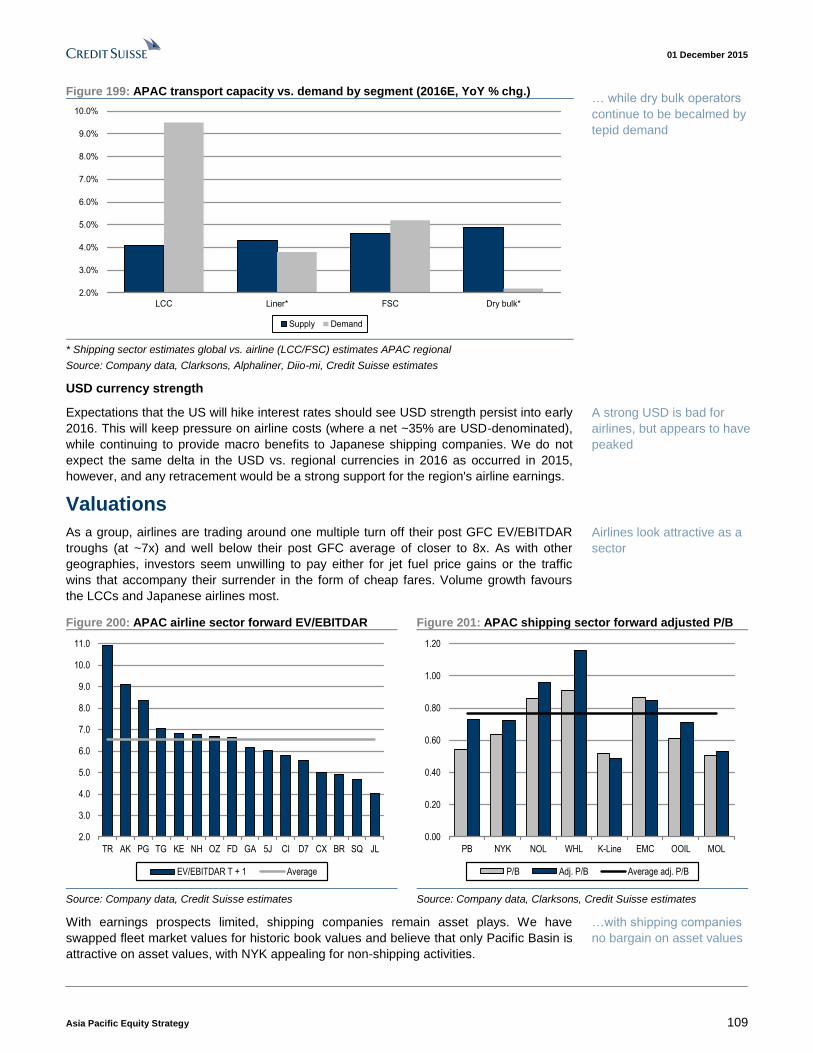
01 December 2015
Asia Pacific Equity Strategy 109
Figure 199: APAC transport capacity vs. demand by segment (2016E, YoY % chg.)
2.0%
3.0%
4.0%
5.0%
6.0%
7.0%
8.0%
9.0%
10.0%
LCC Liner* FSC Dry bulk*
Supply Demand
* Shipping sector estimates global vs. airline (LCC/FSC) estimates APAC regional
Source: Company data, Clarksons, Alphaliner, Diio-mi, Credit Suisse estimates
USD currency strength
Expectations that the US will hike interest rates should see USD strength persist into early
2016. This will keep pressure on airline costs (where a net ~35% are USD-denominated),
while continuing to provide macro benefits to Japanese shipping companies. We do not
expect the same delta in the USD vs. regional currencies in 2016 as occurred in 2015,
however, and any retracement would be a strong support for the region's airline earnings.
Valuations
As a group, airlines are trading around one multiple turn off their post GFC EV/EBITDAR
troughs (at ~7x) and well below their post GFC average of closer to 8x. As with other
geographies, investors seem unwilling to pay either for jet fuel price gains or the traffic
wins that accompany their surrender in the form of cheap fares. Volume growth favours
the LCCs and Japanese airlines most.
Figure 200: APAC airline sector forward EV/EBITDAR Figure 201: APAC shipping sector forward adjusted P/B
2.0
3.0
4.0
5.0
6.0
7.0
8.0
9.0
10.0
11.0
TR AK PG TG KE NH OZ FD GA 5J CI D7 CX BR SQ JL
EV/EBITDAR T + 1 Average
0.00
0.20
0.40
0.60
0.80
1.00
1.20
PB NYK NOL WHL K-Line EMC OOIL MOL
P/B Adj. P/B Average adj. P/B
Source: Company data, Credit Suisse estimates Source: Company data, Clarksons, Credit Suisse estimates
With earnings prospects limited, shipping companies remain asset plays. We have
swapped fleet market values for historic book values and believe that only Pacific Basin is
attractive on asset values, with NYK appealing for non-shipping activities.
… while dry bulk operators
continue to be becalmed by
tepid demand
A strong USD is bad for
airlines, but appears to have
peaked
Airlines look attractive as a
sector
…with shipping companies
no bargain on asset values

01 December 2015
Asia Pacific Equity Strategy 110
Utilities and renewable energy Demand uncertainty coupled with US rate hike risks
Summary view: 2015 has been a relatively good year for Asian utilities under our
coverage, with many regions (such as South Korea, Hong Kong, Pakistan and Malaysia)
outperforming their local indices and most of the rest (such as China, India, Thailand and
the Philippines) largely in line with market. Utilities stocks have once again proven their
defensiveness amid Asian market turbulence with concerns on potential Fed rate hikes
and strengthening of the US dollar. Going into 2016, we believe demand could become
one of the key issues for Asian utilities, with slowing industrial activities in China as well as
Malaysia and Thailand, while India may see better demand in 2016 with on-going reforms
and pick-up of the economy. Besides, risks from the US rate hike would become more
imminent in 2016, which could further weigh on Asian utilities specially the high-yield ones.
For 2016, we cherry pick stocks with the best growth outlook and least affected by macro
risks. Our top picks are (1) Huaneng Renewables, (2) NTPC, (3) KEPCO and (4) EDC; top
sells are (1) CLP and (2) Energy Absolute.
Figure 202: Top stock ideas for 2016
Mkt Yield P/B ROE Net debt/
Target cap P/E (x) (%) (x) (%) equity (x)
Company RIC Rating Curr. Price price (mn) FY14A FY15E FY16E FY16E FY16E FY16E FY16E
Top outperformers
HNR 0958.HK O HKD 2.3 4.4 2,925 15.5 9.7 6.9 2.9% 0.9 13.7% 309.4%
NTPC NTPC.BO O INR 131.2 160 16,296 11.3 12.4 11.9 4.4% 1.3 10.6% 133.4%
KEPCO 015760.KS O KRW 49,100 64,000 27,572 6.5 2.6 6.3 2.0% 0.4 7.1% 73.2%
EDC EDC.PS O PHP 6.28 9.8 2,506 13.3 12.6 10.1 3.5% 2.1 20.7% 75.0%
Top relative underperformers
CLP 0002.HK U HKD 66 62 21,515 14.9 15.6 15.3 4.2% 1.7 11.4% 63.0%
Energy Absolute EAm.BK U THB 24.4 20 2,551 56.6 33.5 19.1 0.2% 6.9 36.4% 99.2%
Note: Priced as of 25 November 2015. Source: Company data, Thomson Reuters, Credit Suisse estimates
What should investors care about in 2016?
Beware of demand risks: With increasing capacity coupled with slow economy, power is
now oversupplied (in China and Thailand) or well balanced (in Korea, Malaysia and
Philippines) in most Asian countries except Pakistan. Going into 2016, we believe demand
could become one of the key issues for Asian utilities, with slowing industrial activities in
China as well as Malaysia and Thailand, while India may see better demand in 2016 with
on-going reforms and pick-up of economy. In China, without support from demand growth,
the aggressive capacity build-up across all fuel types would further squeeze the utilisation
of coal-fired power, and the opening-up of power generation market (competitive bidding)
could lead to lower on-grid tariffs. The Philippines, India and Pakistan are relatively less
affected by demand risks with still expanding economy.
Fed rate hike is coming: The Credit Suisse Global Economics Team expects the first
Fed rate hike of 25 bp in December 2015, followed by three more in 2016 (25 bp each),
totalling 100 bp from now till end-2016. Higher US interest rates could challenge the
investment appetite for high-yield stocks, a safe-haven option over the past few years.
While most Asian utilities have been traditionally considered as growth utilities with strong
sustainable ROE, investors should be beware of possible derating risks for high-yield
stocks including China IPPs, Hong Kong power, and Thailand power, even though some
of them (like Hong Kong power) may have outperformed in 2015 (possibly due to delays in
the US rate hike).
Dave Dai, CFA
+852 2101 7358

01 December 2015
Asia Pacific Equity Strategy 111
Currency risk is across the board: With imminent Fed rate hike and strengthening of the
US dollar, almost all Asian utilities will have to face currency risks in 2016. Our house view
suggests dollar strength against most Asian currencies (>3% dollar appreciation for next
12 months, against IDR, KRW, SGD, THB, INR, MYR and CNY), with Indonesian rupiah
(possible domestic rate cuts) and Korean Won (sensitive to Chinese demand) leading the
weakness. A stronger US dollar may cause FX losses for companies with overseas
borrowings, such as China gas distributors, Thailand power, and Philippines power and
water, and also affect Korea power and Malaysia power's operations with their fuel imports
priced in USD. However, Pakistan IPPs could be immune to US dollar appreciation thanks
to their guaranteed USD-denominated project IRRs.
Valuations
The Non-Japan Asian utilities had a strong start in early 2015 driven by market sentiment.
However, the corrections since mid-2015 (led by Hong Kong and China markets) have
dragged current valuation to be well below the historical average in both forward P/E and
P/B matrix, attractive considering a decent FY15-17 EPS growth (13% on average, led by
China, Thailand and India). Hong Kong power, China IPPs, Thailand power and Pakistan
IPP offer the highest yield.
Figure 203: Forward P/E of regional Utilities stocks Figure 204: Forward P/B of regional Utilities stocks
10
11
12
13
14
15
16
17
18
Jan-11 Sep-11 May-12 Jan-13 Sep-13 May-14 Jan-15 Sep-15
(x)
14.3x Avg+1SD
13.2x Avg
15.4x Avg+2SD
12.1x Avg-1SD
11.1x Avg-2SD
1.2
1.4
1.6
1.8
2.0
2.2
Jan-11 Sep-11 May-12 Jan-13 Sep-13 May-14 Jan-15 Sep-15
(x)
1.9x Avg+1SD
1.8x Avg
2.1x Avg+2SD
1.6x Avg-1SD
1.5x Avg-2SD
Source: Company data, Credit Suisse estimates Source: Company data, Credit Suisse estimates
Top Outperform ideas: Huaneng Renewables (strongest capacity growth with lowest
power curtailment); NTPC (capacity addition, reforms, attractive valuations); KEPCO
(beneficiary of lower commodities price environment and tariff cut should be milder than
market expectations); EDC (cheapest in the sector next to FGEN but EDC is more liquid,
pays higher dividends, and has a higher potential upside).
Top relative underperformers: CLP Holdings (uncertain Hong Kong and Australian
business outlook); Energy Absolute (unattractive valuation with large premium to regional
peers).

01 December 2015
Asia Pacific Equity Strategy 112
Companies Mentioned (Price as of 01-Dec-2015)
Ace Hardware Indonesia (ACES.JK, Rp765) Advanced Info Service PCL (ADVANC.BK, Bt199.5) AGL Energy (AGL.AX, A$16.55) AIA Group (1299.HK, HK$46.3) AirAsia Berhad (AIRA.KL, RM1.36) Aisin Seiki (7259.T, ¥4,930) Alibaba Group Holding Limited (BABA.N, $82.21) Alliance Financial Group BHD (ALFG.KL, RM3.58) Amorepacific Corp (090430.KS, W403,500) AMP (AMP.AX, A$5.81) AMP (AMP.AX, A$5.81) Anhui Conch Cement Co. Ltd. (0914.HK, HK$21.15) Anton Oilfield Services Group (3337.HK, HK$0.92) ANZ Banking Group (ANZ.AX, A$27.15) Astra International (ASII.JK, Rp5,925) Baidu Inc (BIDU.OQ, $207.6) Bangkok Life (BLA.BK, Bt53.75) Bank of China Ltd (3988.HK, HK$3.44) Beijing Capital Co., Ltd (600008.SS, Rmb10.54) Beijing Enterprises Water Group Limited (0371.HK, HK$6.06) Bharat Heavy Electricals Ltd (BHEL.BO, Rs175.45) Bharti Airtel Ltd (BRTI.BO, Rs334.5) Bloomberry Resorts Corporation (BLOOM.PS, P5.22) BOC Hong Kong (Holdings) (2388.HK, HK$23.75) Brambles (BXB.AX, A$10.89) Brilliance China Automotive Holdings Limited (1114.HK, HK$9.86) BTS Group Holdings PCL (BTS.BK, Bt9.55) C.P. ALL PCL (CPALL.BK, Bt47.0) Canvest Environmental Protection Gp Co Ltd (1381.HK, HK$3.11) carsales.com.au (CAR.AX, A$10.27) Cathay Financial Holding (2882.TW, NT$45.65) Challenger Limited (CGF.AX, A$8.44) Cheung Kong Property Holdings Limited (1113.HK, HK$50.55) China Conch Venture Holdings Limited (0586.HK, HK$16.26) China Everbright International Ltd (0257.HK, HK$11.74) China Life (601628.SS, Rmb26.31) China Mobile Limited (0941.HK, HK$88.1) China Overseas Land & Investment (0688.HK, HK$25.7) China Pacific (2601.HK, HK$31.9) China Telecom (0728.HK, HK$3.8) China XD (601179.SS, Rmb6.53) CIMB Group Holdings Bhd (CIMB.KL, RM4.5) City Developments (CTDM.SI, S$7.34) CLP Holdings Limited (0002.HK, HK$64.8) CNOOC Ltd (0883.HK, HK$8.58) Commonwealth Bank Australia (CBA.AX, A$79.43) CT Environment (1363.HK, HK$2.55) CTBC Holding (2891.TW, NT$17.1) Dai-ichi Life Insurance (8750.T, ¥2,130) DBS Group (DBSM.SI, S$16.5) Delta Electronics (2308.TW, NT$156.5) DG Khan Cement Co Ltd (DGKH.KA, PRs127.8) Dongbu Insurance (005830.KS, W62,100) Dongjiang Environmental Company Limited (002672.SZ, Rmb20.26) Dongjiang Environmental Company Limited (0895.HK, HK$12.96) Dynagreen Environmental Protection (1330.HK, HK$4.31) E.Sun Financial Holding Co. (2884.TW, NT$19.65) Energy Absolute (EAm.BK, Bt24.8) Energy Development Corporation (EDC.PS, P6.2) Engro Corporation Ltd (EGCH.KA, PRs268.14) Evergreen Marine (2603.TW, NT$12.95) Formosa Chemical & Fibre (1326.TW, NT$70.6) Formosa Petrochemical (6505.TW, NT$77.2) Formosa Plastics (1301.TW, NT$73.7) Fubon Financial Holding (2881.TW, NT$52.0) Fuji Heavy Industries (7270.T, ¥5,088) Galaxy Entertainment Group (0027.HK, HK$22.8) Gamuda (GAMU.KL, RM4.54) Geely Automobile Holdings Ltd (0175.HK, HK$4.07) Genting Berhad (GENT.KL, RM7.2) Genting Malaysia Bhd (GENM.KL, RM4.4) Genting Plantations Bhd (GENP.KL, RM10.26) Genting Singapore (GENS.SI, S$0.76) GoerTek Inc. (002241.SZ, Rmb31.68) Great Wall Motor (2333.HK, HK$9.51) Guangdong Investment Limited (0270.HK, HK$10.58) Gudang Garam (GGRM.JK, Rp48,900) Guodian Technology & Environment Group Corporation (1296.HK, HK$0.74) Hangzhou Hikvision Digital Technology Co., Ltd. (002415.SZ, Rmb33.59) Hanwha Life Insurance (088350.KS, W7,640) HCL Technologies (HCLT.BO, Rs871.85) HDFC Bank (HDBK.BO, Rs1075.95)

01 December 2015
Asia Pacific Equity Strategy 113
Hindalco Industries Ltd (HALC.BO, Rs77.05) Hindustan Unilever Ltd (HLL.BO, Rs809.45) Hon Hai Precision (2317.TW, NT$84.0) HTC Corp (2498.TW, NT$81.1) Huaneng Renewables Corporation (0958.HK, HK$2.32) Hyundai Development (012630.KS, W41,000) Hyundai Heavy Industries (009540.KS, W90,600) Hyundai Mipo Dockyard (010620.KS, W62,900) Hyundai Mobis (012330.KS, W249,500) Hyundai Motor Company (005380.KS, W147,500) Idea Cellular Ltd (IDEA.BO, Rs141.4) Indofood CBP (ICBP.JK, Rp12,625) IndusInd Bank (INBK.BO, Rs933.5) Int'l Container Terminal Inc. (ICT.PS, P73.5) Intouch Limited (INTUCH.BK, Bt66.0) Japan Airlines (9201.T, ¥4,210) Jasmine International (JAS.BK, Bt4.66) JD.com, Inc. (JD.OQ, $30.15) Jiangsu Hengrui Medicine Co. Ltd (600276.SS, Rmb49.48) Kangwon Land (035250.KS, W38,200) KCC Corp (002380.KS, W459,500) K-Electric (KELE.KA, PRs7.2) Kia Motors (000270.KS, W52,500) Korea Electric Power (015760.KS, W48,950) KOSE (4922.T, ¥12,880) KT&G Corp (033780.KS, W107,000) Kweichow Moutai Co., Ltd (600519.SS, Rmb214.31) L&T (LART.NS, Rs1374.6) Lee & Man Paper (2314.HK, HK$4.46) Lend Lease (LLC.AX, A$12.75) Lenovo Group Ltd (0992.HK, HK$8.2) LG Display Co Ltd. (034220.KS, W25,400) LG Electronics Inc (066570.KS, W54,200) LG Hausys (108670.KS, W171,000) LG Household & Healthcare (051900.KS, W1,008,000) Lotte Chemical (011170.KS, W240,500) M1 Limited (MONE.SI, S$2.81) Mahindra (MAHM.NS, Rs1365.5) Malayan Banking (MBBM.KL, RM8.32) Malaysia Airports Holdings Bhd (MAHB.KL, RM5.42) Manila Water Company (MWC.PS, P24.5) Maruti Suzuki India Ltd (MRTI.BO, Rs4576.7) MediaTek Inc. (2454.TW, NT$260.5) Medibank Private Limited (MPL.AX, A$2.32) Metro Pacific Investments (MPI.PS, P5.24) Metropolitan Bank & Trust Co (MBT.PS, P80.5) MGM China (2282.HK, HK$10.2) Midea Group (000333.SZ, Rmb26.83) Mitsubishi Chemical Holdings (4188.T, ¥807) Mitsui Fudosan (8801.T, ¥3,104) NIB Holdings Limited (NHF.AX, A$3.82) NTPC Ltd (NTPC.BO, Rs131.0) Ono Pharmaceutical (4528.T, ¥19,710) Pakistan Oilfields Ltd (PKOL.KA, PRs293.23) Pegatron (4938.TW, NT$86.1) PICC P&C (2328.HK, HK$16.82) Ping An (2318.HK, HK$42.45) POSCO (005490.KS, W169,000) Prudential (PRU.L, 1539.5p) PT Bank Central Asia Tbk (BBCA.JK, Rp12,375) PT Bank Rakyat Indonesia (Persero) Tbk (BBRI.JK, Rp10,775) Pt Link Net Tbk (LINK.JK, Rp3,550) PT Summarecon Agung Tbk (SMRA.JK, Rp1,550) PTT Public Company Limited (PTT.BK, Bt256.0) Quanta Computer (2382.TW, NT$51.0) Reliance Industries Limited (RELI.BO, Rs968.0) Rio Tinto (RIO.AX, A$45.91) Sa Sa International Holding (0178.HK, HK$2.66) Samsonite International S.A. (1910.HK, HK$23.0) Samsung Electronics (005930.KS, W1,284,000) Samsung FineChem (004000.KS, W35,550) Samsung Life Insurance (032830.KS, W103,000) Shanghai Electric Group Company Limited (2727.HK, HK$4.81) Shenzhou International (2313.HK, HK$40.7) Shinhan Financial Group (055550.KS, W41,450) Shinsegae Inc (004170.KS, W250,500) Siam Global House PCL (GLOBAL.BK, Bt10.4) SIIC Environment Holdings (SIIC.SI, S$0.76) Siliconware Precision (2325.TW, NT$43.0) Singapore Airlines (SIAL.SI, S$10.16) Singapore Telecom (STEL.SI, S$3.83) Sino Thai Engr & Const PCL (STEC.BK, Bt24.2) Sinopec Oilfield Service Corp. (1033.HK, HK$2.21) SK Innovation (096770.KS, W127,500)

01 December 2015
Asia Pacific Equity Strategy 114
SKS Microfinance Ltd. (SKSM.BO, Rs452.55) SoftBank Group Corp. (9984.T, ¥6,537) S-Oil Corp (010950.KS, W74,200) Sony (6758.T, ¥3,177) Sound Global Co. Ltd (0967.HK, HK$7.0) StarHub Ltd (STAR.SI, S$3.63) State Bank Of India (SBI.BO, Rs250.45) Sumitomo Electric Industries (5802.T, ¥1,752) Sumitomo Mitsui Financial Group (8316.T, ¥4,697) Suntec REIT (SUNT.SI, S$1.54) T&D Holdings (8795.T, ¥1,725) Taiwan Semiconductor Manufacturing (2330.TW, NT$139.0) Tata Motors Ltd. (TAMO.BO, Rs423.35) Tata Steel Ltd (TISC.BO, Rs230.05) Tech Mahindra Limited (TEML.BO, Rs533.4) Telstra Corporation (TLS.AX, A$5.36) Thai Union Group (TU.BK, Bt18.5) Tianjin Capital Environmental Protection (1065.HK, HK$6.46) Tianjin Capital Environmental Protection (600874.SS, Rmb11.09) Total Access Communication PCL (DTAC.BK, Bt45.75) Toyota Motor (7203.T, ¥7,657) True Corp PCL (TRUE.BK, Bt8.45) Tus-Sound Environmental Resources Co., Ltd. (000826.SZ, Rmb37.77) Ultratech Cement Ltd (ULTC.BO, Rs2806.95) Uni-President Enterprises (1216.TW, NT$53.8) United Bank Limited (UBL.KA, PRs159.23) Vietnam Dairy Products Joint Stock Company (VNM.HM, D124000.0) Vingroup JSC (VIC.HM, D42800.0) Voltas (VOLT.BO, Rs288.5) Wanda Cinema Line Co Ltd (002739.SZ, Rmb99.3) Wasion Group (3393.HK, HK$8.84) Weichai Power Co. Ltd (2338.HK, HK$8.0) Westports Holdings Berhad (WPHB.KL, RM4.3) Xinjiang Goldwind Science & Technology Co., Ltd. (2208.HK, HK$13.14) XL Axiata Tbk (EXCL.JK, Rp3,460) Yanzhou Coal Mining Company Limited (1171.HK, HK$3.54) Yonker Environmental Protection Co., LTD. (300187.SZ, Rmb47.7)
Disclosure Appendix
Important Global Disclosures
Sakthi Siva, Neelkanth Mishra, Tan Ting Min, Farhan Rizvi, CFA, Fahd Niaz, CFA, Alvin Arogo, Gerald Wong, CFA, Gil Kim, Chung Hsu, CFA, Dan Fineman, Chate Benchavitvilai, Jatin Chawla, Bin Wang, Sanjay Jain, Sanjay Jain, Trina Chen, Kenneth Whee, Kevin Yin, Arnab Mitra, A-Hyung Cho, Trina Chen, Kenneth Fong, Edmond Huang, CFA, Timothy Ross, Minseok Sinn, Henry Kwon, Lokesh Garg, Baiding Rong, Hayoung Chung and Arjan van Veen each certify, with respect to the companies or securities that the individual analyzes, that (1) the views expressed in this report accurately reflect his or her personal views about all of the subject companies and securities and (2) no part of his or her compensation was, is or will be directly or indirectly related to the specific recommendations or views expressed in this report.
3-Year Price and Rating History for Amorepacific Corp (090430.KS)
090430.KS Closing Price Target Price
Date (W) (W) Rating
07-Feb-13 101,200 100,000 N
09-Sep-13 92,500 110,000 O *
11-Mar-14 122,200 146,000
12-May-14 143,700 155,000
29-May-14 147,500 155,000 N
12-Aug-14 198,000 204,000
10-Nov-14 216,700 218,000
20-Apr-15 390,500 347,000
14-May-15 387,000 430,000
09-Sep-15 346,500 440,000 O
* Asterisk signifies initiation or assumption of coverage.
N EU T RA L
O U T PERFO RM
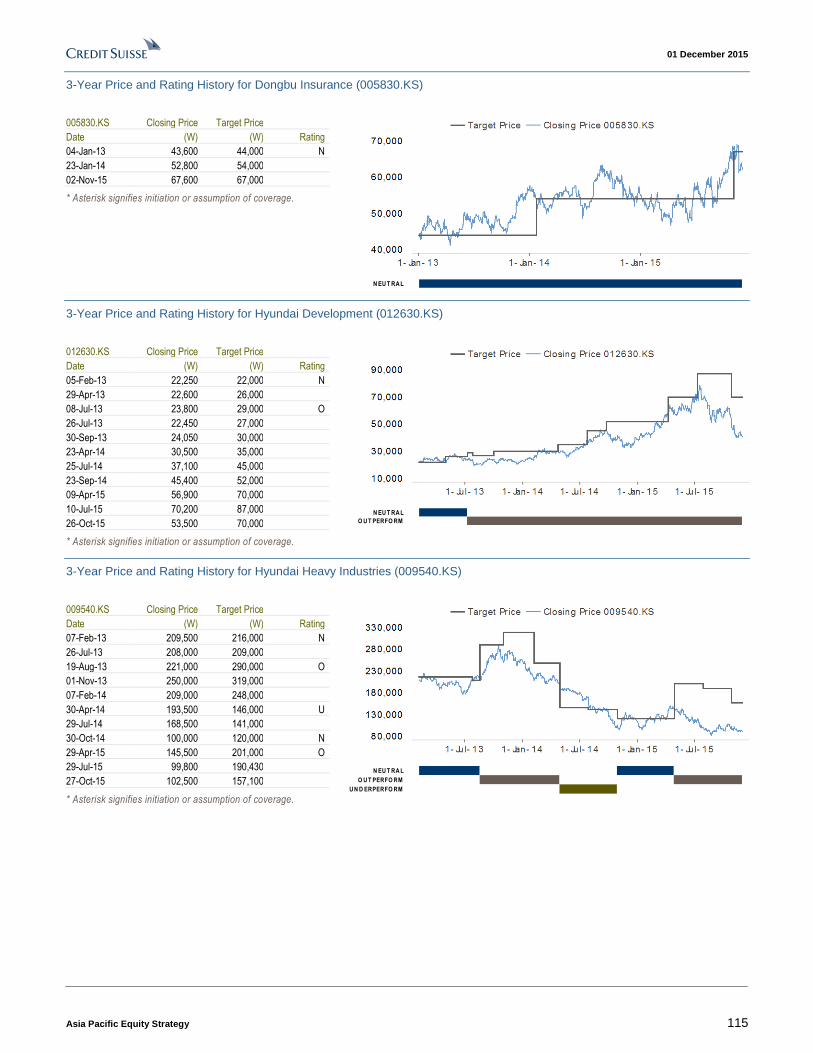
01 December 2015
Asia Pacific Equity Strategy 115
3-Year Price and Rating History for Dongbu Insurance (005830.KS)
005830.KS Closing Price Target Price
Date (W) (W) Rating
04-Jan-13 43,600 44,000 N
23-Jan-14 52,800 54,000
02-Nov-15 67,600 67,000
* Asterisk signifies initiation or assumption of coverage.
N EU T RA L
3-Year Price and Rating History for Hyundai Development (012630.KS)
012630.KS Closing Price Target Price
Date (W) (W) Rating
05-Feb-13 22,250 22,000 N
29-Apr-13 22,600 26,000
08-Jul-13 23,800 29,000 O
26-Jul-13 22,450 27,000
30-Sep-13 24,050 30,000
23-Apr-14 30,500 35,000
25-Jul-14 37,100 45,000
23-Sep-14 45,400 52,000
09-Apr-15 56,900 70,000
10-Jul-15 70,200 87,000
26-Oct-15 53,500 70,000
* Asterisk signifies initiation or assumption of coverage.
N EU T RA L
O U T PERFO RM
3-Year Price and Rating History for Hyundai Heavy Industries (009540.KS)
009540.KS Closing Price Target Price
Date (W) (W) Rating
07-Feb-13 209,500 216,000 N
26-Jul-13 208,000 209,000
19-Aug-13 221,000 290,000 O
01-Nov-13 250,000 319,000
07-Feb-14 209,000 248,000
30-Apr-14 193,500 146,000 U
29-Jul-14 168,500 141,000
30-Oct-14 100,000 120,000 N
29-Apr-15 145,500 201,000 O
29-Jul-15 99,800 190,430
27-Oct-15 102,500 157,100
* Asterisk signifies initiation or assumption of coverage.
N EU T RA L
O U T PERFO RM
U N D ERPERFO RM
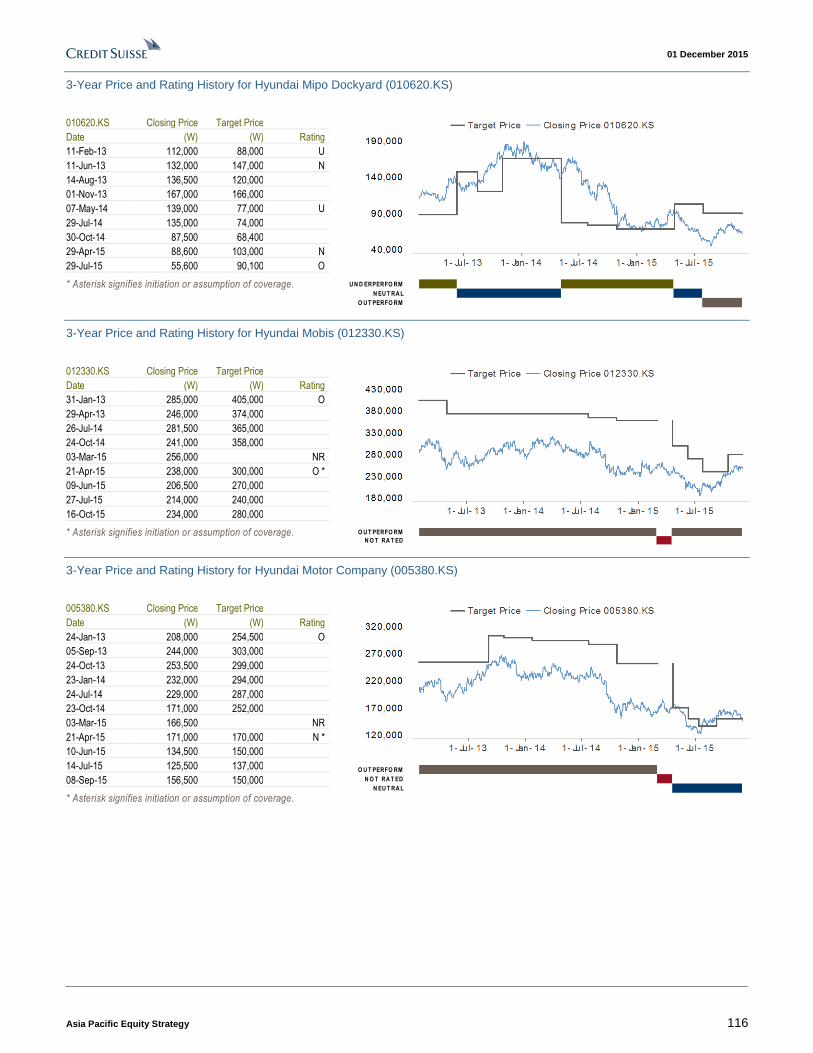
01 December 2015
Asia Pacific Equity Strategy 116
3-Year Price and Rating History for Hyundai Mipo Dockyard (010620.KS)
010620.KS Closing Price Target Price
Date (W) (W) Rating
11-Feb-13 112,000 88,000 U
11-Jun-13 132,000 147,000 N
14-Aug-13 136,500 120,000
01-Nov-13 167,000 166,000
07-May-14 139,000 77,000 U
29-Jul-14 135,000 74,000
30-Oct-14 87,500 68,400
29-Apr-15 88,600 103,000 N
29-Jul-15 55,600 90,100 O
* Asterisk signifies initiation or assumption of coverage.
U N D ERPERFO RM
N EU T RA L
O U T PERFO RM
3-Year Price and Rating History for Hyundai Mobis (012330.KS)
012330.KS Closing Price Target Price
Date (W) (W) Rating
31-Jan-13 285,000 405,000 O
29-Apr-13 246,000 374,000
26-Jul-14 281,500 365,000
24-Oct-14 241,000 358,000
03-Mar-15 256,000 NR
21-Apr-15 238,000 300,000 O *
09-Jun-15 206,500 270,000
27-Jul-15 214,000 240,000
16-Oct-15 234,000 280,000
* Asterisk signifies initiation or assumption of coverage.
O U T PERFO RM
N O T RA T ED
3-Year Price and Rating History for Hyundai Motor Company (005380.KS)
005380.KS Closing Price Target Price
Date (W) (W) Rating
24-Jan-13 208,000 254,500 O
05-Sep-13 244,000 303,000
24-Oct-13 253,500 299,000
23-Jan-14 232,000 294,000
24-Jul-14 229,000 287,000
23-Oct-14 171,000 252,000
03-Mar-15 166,500 NR
21-Apr-15 171,000 170,000 N *
10-Jun-15 134,500 150,000
14-Jul-15 125,500 137,000
08-Sep-15 156,500 150,000
* Asterisk signifies initiation or assumption of coverage.
O U T PERFO RM
N O T RA T ED
N EU T RA L

01 December 2015
Asia Pacific Equity Strategy 117
3-Year Price and Rating History for KCC Corp (002380.KS)
002380.KS Closing Price Target Price
Date (W) (W) Rating
15-May-14 561,000 720,000 O
19-May-14 582,000 *
09-Jun-14 632,000 750,000 O
04-Nov-14 598,000 700,000
07-Aug-15 472,500 530,000 N
30-Oct-15 408,500 570,000 O
* Asterisk signifies initiation or assumption of coverage.
O U T PERFO RM
N EU T RA L
3-Year Price and Rating History for KT&G Corp (033780.KS)
033780.KS Closing Price Target Price
Date (W) (W) Rating
18-Jan-13 76,600 75,000 U
09-Sep-13 74,300 67,000
16-Oct-13 78,200 *
17-Oct-13 78,100 67,000 U
17-Apr-14 81,100 72,000
17-Jul-14 94,500 88,000
22-Jan-15 78,400 88,000 N
24-Apr-15 94,900 100,000
* Asterisk signifies initiation or assumption of coverage. U N D ERPERFO RM
N EU T RA L
3-Year Price and Rating History for Kangwon Land (035250.KS)
035250.KS Closing Price Target Price
Date (W) (W) Rating
15-Feb-13 31,900 32,000 N
03-Nov-15 43,200 54,000 O *
* Asterisk signifies initiation or assumption of coverage.
N EU T RA L
O U T PERFO RM
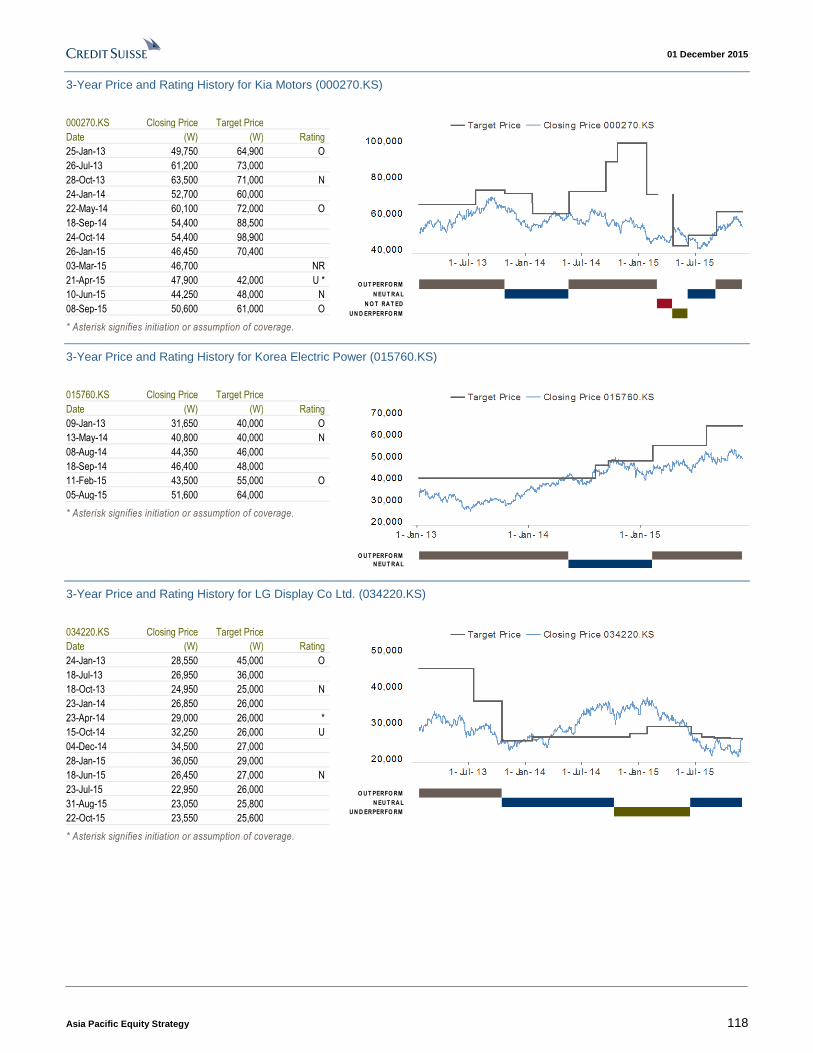
01 December 2015
Asia Pacific Equity Strategy 118
3-Year Price and Rating History for Kia Motors (000270.KS)
000270.KS Closing Price Target Price
Date (W) (W) Rating
25-Jan-13 49,750 64,900 O
26-Jul-13 61,200 73,000
28-Oct-13 63,500 71,000 N
24-Jan-14 52,700 60,000
22-May-14 60,100 72,000 O
18-Sep-14 54,400 88,500
24-Oct-14 54,400 98,900
26-Jan-15 46,450 70,400
03-Mar-15 46,700 NR
21-Apr-15 47,900 42,000 U *
10-Jun-15 44,250 48,000 N
08-Sep-15 50,600 61,000 O
* Asterisk signifies initiation or assumption of coverage.
O U T PERFO RM
N EU T RA L
N O T RA T ED
U N D ERPERFO RM
3-Year Price and Rating History for Korea Electric Power (015760.KS)
015760.KS Closing Price Target Price
Date (W) (W) Rating
09-Jan-13 31,650 40,000 O
13-May-14 40,800 40,000 N
08-Aug-14 44,350 46,000
18-Sep-14 46,400 48,000
11-Feb-15 43,500 55,000 O
05-Aug-15 51,600 64,000
* Asterisk signifies initiation or assumption of coverage.
O U T PERFO RM
N EU T RA L
3-Year Price and Rating History for LG Display Co Ltd. (034220.KS)
034220.KS Closing Price Target Price
Date (W) (W) Rating
24-Jan-13 28,550 45,000 O
18-Jul-13 26,950 36,000
18-Oct-13 24,950 25,000 N
23-Jan-14 26,850 26,000
23-Apr-14 29,000 26,000 *
15-Oct-14 32,250 26,000 U
04-Dec-14 34,500 27,000
28-Jan-15 36,050 29,000
18-Jun-15 26,450 27,000 N
23-Jul-15 22,950 26,000
31-Aug-15 23,050 25,800
22-Oct-15 23,550 25,600
* Asterisk signifies initiation or assumption of coverage.
O U T PERFO RM
N EU T RA L
U N D ERPERFO RM

01 December 2015
Asia Pacific Equity Strategy 119
3-Year Price and Rating History for LG Electronics Inc (066570.KS)
066570.KS Closing Price Target Price
Date (W) (W) Rating
30-Jan-13 73,500 63,000 U
24-Apr-13 90,000 82,000 N
24-Oct-13 70,100 77,000
27-Jan-14 68,900 75,000
29-Apr-14 71,700 83,000 *
24-Jul-14 77,000 87,000
29-Oct-14 67,800 78,000
29-Jan-15 62,600 75,000
29-Apr-15 61,200 68,000
02-Jun-15 55,400 62,000
09-Jul-15 45,750 53,500
29-Jul-15 43,800 49,000
25-Aug-15 40,850 45,500
30-Oct-15 49,100 46,200
* Asterisk signifies initiation or assumption of coverage.
U N D ERPERFO RM
N EU T RA L
3-Year Price and Rating History for LG Hausys (108670.KS)
108670.KS Closing Price Target Price
Date (W) (W) Rating
15-May-14 176,500 230,000 O
19-May-14 177,500 *
24-Jul-14 197,000 230,000 O
23-Apr-15 176,000 210,000
* Asterisk signifies initiation or assumption of coverage.
O U T PERFO RM
3-Year Price and Rating History for LG Household & Healthcare (051900.KS)
051900.KS Closing Price Target Price
Date (W) (W) Rating
22-Jan-13 669,000 745,000 O
23-Apr-13 607,000 850,000
09-Sep-13 513,000 640,000 *
18-Nov-14 609,000 720,000
09-Mar-15 655,000 900,000
21-Apr-15 933,000 1,080,000
* Asterisk signifies initiation or assumption of coverage.
O U T PERFO RM

01 December 2015
Asia Pacific Equity Strategy 120
3-Year Price and Rating History for Lotte Chemical (011170.KS)
011170.KS Closing Price Target Price
Date (W) (W) Rating
04-Feb-13 243,500 290,000 O
29-Apr-13 159,500 235,000
04-Oct-13 195,500 260,000 *
28-Oct-13 202,500 280,000
11-Mar-14 191,000 210,000 N
29-Apr-14 167,000 195,000
29-May-14 162,500 175,000
27-Oct-14 135,500 180,000 O
13-Nov-14 163,000 210,000
28-Jan-15 174,000 220,000
09-Feb-15 182,000 225,000
18-Mar-15 190,500 245,000
15-Apr-15 247,500 310,000
29-Apr-15 256,500 340,000
17-Jun-15 286,000 380,000
31-Jul-15 260,500 440,000
06-Nov-15 244,500 410,000
* Asterisk signifies initiation or assumption of coverage.
O U T PERFO RM
N EU T RA L
3-Year Price and Rating History for POSCO (005490.KS)
005490.KS Closing Price Target Price
Date (W) (W) Rating
30-Jan-13 358,000 400,000 O
26-Apr-13 316,000 350,000 N
29-Jan-14 298,500 330,000
25-Jul-14 326,000 350,000
12-Aug-14 325,500 400,000 O
05-Feb-15 262,000 330,000
21-Apr-15 253,000 300,000
15-Jul-15 209,000 270,000
20-Oct-15 179,500 240,000
* Asterisk signifies initiation or assumption of coverage.
O U T PERFO RM
N EU T RA L
3-Year Price and Rating History for S-Oil Corp (010950.KS)
010950.KS Closing Price Target Price
Date (W) (W) Rating
31-Jan-13 97,900 124,000 O
30-Apr-13 88,500 116,000
04-Oct-13 76,300 100,000 *
27-Jan-14 68,600 90,000
11-Mar-14 65,100 80,000
24-Apr-14 60,900 76,000
24-Jul-14 55,000 77,000
20-Aug-14 47,350 60,000
06-Oct-14 41,050 57,000
27-Oct-14 42,100 54,000
27-Jan-15 58,200 66,000
02-Feb-15 60,200 70,000
23-Apr-15 78,100 98,000
23-Jul-15 59,600 100,000
14-Oct-15 66,600 93,000
* Asterisk signifies initiation or assumption of coverage.
O U T PERFO RM

01 December 2015
Asia Pacific Equity Strategy 121
3-Year Price and Rating History for SK Innovation (096770.KS)
096770.KS Closing Price Target Price
Date (W) (W) Rating
01-Feb-13 168,500 206,000 O
04-Oct-13 144,000 170,000 *
04-Feb-14 126,000 165,000
28-Apr-14 120,000 150,000
25-Jul-14 104,000 140,000
21-Aug-14 93,900 130,000
06-Oct-14 77,800 120,000
04-May-15 119,000 144,000
24-Jul-15 97,700 141,000
14-Oct-15 109,000 139,000
26-Oct-15 115,000 156,000
* Asterisk signifies initiation or assumption of coverage.
O U T PERFO RM
3-Year Price and Rating History for Samsung Electronics (005930.KS)
005930.KS Closing Price Target Price
Date (W) (W) Rating
04-Feb-13 1,437,000 1,720,000 O
06-Feb-13 1,427,000 1,900,000
27-Jan-14 1,292,000 1,760,000
07-Jul-14 1,292,000 1,740,000
08-Jul-14 1,295,000 1,720,000
28-Aug-14 1,242,000 1,700,000
07-Oct-14 1,162,000 1,680,000
03-Sep-15 1,122,000 1,630,000
29-Oct-15 1,325,000 1,785,000
* Asterisk signifies initiation or assumption of coverage.
O U T PERFO RM
3-Year Price and Rating History for Samsung Life Insurance (032830.KS)
032830.KS Closing Price Target Price
Date (W) (W) Rating
23-Jan-14 101,500 120,000 O *
22-Apr-14 98,900 R
19-Jun-14 104,500 120,000 O
17-Sep-14 109,000 130,000
12-May-15 110,000 135,000
14-May-15 116,500 R
15-May-15 116,500 135,000 O
* Asterisk signifies initiation or assumption of coverage.
O U T PERFO RM
REST RICT ED

01 December 2015
Asia Pacific Equity Strategy 122
3-Year Price and Rating History for Shinhan Financial Group (055550.KS)
055550.KS Closing Price Target Price
Date (W) (W) Rating
07-Feb-13 39,200 48,500 O
01-Oct-13 44,150 54,000
12-Feb-14 43,000 53,000
01-Jul-14 46,300 56,000
22-Aug-14 51,800 60,000
04-Feb-15 45,700 57,000
29-May-15 41,900 60,000
* Asterisk signifies initiation or assumption of coverage.
O U T PERFO RM
3-Year Price and Rating History for Shinsegae Inc (004170.KS)
004170.KS Closing Price Target Price
Date (W) (W) Rating
15-Feb-13 215,500 240,000 N
16-Oct-13 253,500 *
04-Nov-13 254,000 270,000 N
26-Feb-15 173,000 R
09-Mar-15 175,000 270,000 N
13-May-15 230,000 270,000 O
14-May-15 251,500 R
15-May-15 251,500 270,000 O
22-Jul-15 209,000 R
26-Oct-15 228,500 270,000 O
16-Nov-15 264,500 330,000
* Asterisk signifies initiation or assumption of coverage.
N EU T RA L
REST RICT ED
O U T PERFO RM
The analyst(s) responsible for preparing this research report received Compensation that is based upon various factors including Credit Suisse's total revenues, a portion of which are generated by Credit Suisse's investment banking activities
As of December 10, 2012 Analysts’ stock rating are defined as follows:
Outperform (O) : The stock’s total return is expected to outperform the relevant benchmark*over the next 12 months.
Neutral (N) : The stock’s total return is expected to be in line with the relevant benchmark* over the next 12 months.
Underperform (U) : The stock’s total return is expected to underperform the relevant benchmark* over the next 12 months.
*Relevant benchmark by region: As of 10th December 2012, Japanese ratings are based on a stock’s total return relative to the analyst's coverage universe which consists of all companies covered by the analyst within the relevant sector, with Outperforms representing the most attractiv e, Neutrals the less attractive, and Underperforms the least attractive investment opportunities. As of 2nd October 2012, U.S. and Canadian as well as European ratings are based on a stock’s total return relative to the analyst's coverage universe which consists of all companies covered by the ana lyst within the relevant sector, with Outperforms representing the most attractive, Neutrals the less attractive, and Underperforms the least attractive investment opportunities. For Latin Ame rican and non-Japan Asia stocks, ratings are based on a stock’s total return relative to the average total return of the relevant country or regional benchmark; prior to 2nd October 2012 U.S. and Canadian ratings were based on (1) a stock’s absolute total return potential to its current share price and (2) the relative attractiveness of a stock’s total return potential within an analyst’s coverage universe. For Australian and New Zealand stocks, the expected total return (ETR) calculation includes 1 2-month rolling dividend yield. An Outperform rating is assigned where an ETR is greater than or equal to 7.5%; Underperform where an ETR less than or equal to 5%. A Neutral may be assigned where the ETR is between -5% and 15%. The overlapping rating range allows analysts to assign a rating that puts ETR in the context of asso ciated risks. Prior to 18 May 2015, ETR ranges for Outperform and Underperform ratings did not overlap with Neutral thresholds between 15% and 7.5%, wh ich was in operation from 7 July 2011.
Restricted (R) : In certain circumstances, Credit Suisse policy and/or applicable law and regulations preclude certain types of communications, including an investment recommendation, during the course of Credit Suisse's engagement in an investment banking transaction and in certain other circumstances.
Volatility Indicator [V] : A stock is defined as volatile if the stock price has moved up or down by 20% or more in a month in at least 8 of the past 24 months or the analyst expects significant volatility going forward.
Analysts’ sector weightings are distinct from analysts’ stock ratings and are based on the analyst’s expectations for the fundamentals and/or valuation of the sector* relative to the group’s historic fundamentals and/or valuation:
Overweight : The analyst’s expectation for the sector’s fundamentals and/or valuation is favorable over the next 12 months.

01 December 2015
Asia Pacific Equity Strategy 123
Market Weight : The analyst’s expectation for the sector’s fundamentals and/or valuation is neutral over the next 12 months.
Underweight : The analyst’s expectation for the sector’s fundamentals and/or valuation is cautious over the next 12 months.
*An analyst’s coverage sector consists of all companies covered by the analyst within the relevant sector. An analyst may cover multiple sectors.
Credit Suisse's distribution of stock ratings (and banking clients) is:
Global Ratings Distribution
Rating Versus universe (%) Of which banking clients (%)
Outperform/Buy* 59% (32% banking clients)
Neutral/Hold* 28% (36% banking clients)
Underperform/Sell* 12% (25% banking clients)
Restricted 1%
*For purposes of the NYSE and NASD ratings distribution disclosure requirements, our stock ratings of Outperform, Neutral, and Underperform most c losely correspond to Buy, Hold, and Sell, respectively; however, the meanings are not the same, as our stock ratings are determined on a relative basis. (Please refer to definitions above.) An investor's decision to buy or sell a security should be based on investment objectives, current holdin gs, and other individual factors.
Credit Suisse’s policy is to update research reports as it deems appropriate, based on developments with the subject company, the sector or the market that may have a material impact on the research views or opinions stated herein.
Credit Suisse's policy is only to publish investment research that is impartial, independent, clear, fair and not misleading. For more detail please refer to Credit Suisse's Policies for Managing Conflicts of Interest in connection with Investment Research: http://www.csfb.com/research-and-analytics/disclaimer/managing_conflicts_disclaimer.html
Credit Suisse does not provide any tax advice. Any statement herein regarding any US federal tax is not intended or written to be used, and cannot be used, by any taxpayer for the purposes of avoiding any penalties.
See the Companies Mentioned section for full company names
The subject company (AMP.AX, 088350.KS, 005930.KS, 2330.TW, ANZ.AX, 055550.KS, TLS.AX, 2891.TW, 9984.T, 1113.HK, HCLT.BO, 005380.KS, 8750.T, CBA.AX, 3988.HK, 2881.TW, 051900.KS, 0688.HK, 2388.HK, BABA.N, 8316.T, DBSM.SI, 015760.KS, 2882.TW, 8801.T, 2317.TW, 096770.KS, 000270.KS, 2318.HK, 000333.SZ, 0027.HK, GENP.KL, 1216.TW, MAHB.KL, STEL.SI, VIC.HM, MWC.PS, 2498.TW, TAMO.BO, 002739.SZ, MPL.AX, 2313.HK, ICT.PS, ULTC.BO, ADVANC.BK, CTDM.SI, VNM.HM, PKOL.KA, KELE.KA, MBT.PS, UBL.KA, EGCH.KA, 1299.HK, HLL.BO, SUNT.SI, MPI.PS, 032830.KS, CIMB.KL, SMRA.JK, 034220.KS, BBCA.JK, 2325.TW, EXCL.JK, 0883.HK, HDBK.BO, 010620.KS, AIRA.KL, 2603.TW, LINK.JK, WPHB.KL, 4938.TW, RELI.BO, SKSM.BO, MBBM.KL, ICBP.JK, 066570.KS, SIAL.SI, 2282.HK, 1171.HK, 2454.TW, 600874.SS, 2727.HK, AMP.AX, 005490.KS, 012630.KS, 108670.KS, BLA.BK, 3393.HK, 1330.HK, 0257.HK, 600008.SS, 000826.SZ, INBK.BO, SIIC.SI, 0371.HK, 0958.HK, 2328.HK, 0992.HK, 601179.SS, 0586.HK, BIDU.OQ, GENS.SI, 009540.KS, 1114.HK, PRU.L) currently is, or was during the 12-month period preceding the date of distribution of this report, a client of Credit Suisse.
Credit Suisse provided investment banking services to the subject company (ANZ.AX, TLS.AX, 9984.T, HCLT.BO, 005380.KS, CBA.AX, 3988.HK, 2388.HK, BABA.N, 2882.TW, 2318.HK, 0027.HK, MAHB.KL, STEL.SI, VIC.HM, MWC.PS, TAMO.BO, 002739.SZ, 2313.HK, ICT.PS, ADVANC.BK, EGCH.KA, 1299.HK, HLL.BO, MPI.PS, 032830.KS, 2325.TW, 0883.HK, HDBK.BO, 010620.KS, LINK.JK, ICBP.JK, SIAL.SI, 1171.HK, 600874.SS, 2727.HK, 012630.KS, 3393.HK, 600008.SS, INBK.BO, SIIC.SI, 0371.HK, 0958.HK, 0992.HK, 601179.SS, BIDU.OQ, 1114.HK, PRU.L, 088350.KS) within the past 12 months.
Credit Suisse provided non-investment banking services to the subject company (ANZ.AX, 055550.KS, 2891.TW, 005380.KS, CBA.AX, 3988.HK, 8316.T, 000270.KS, 000333.SZ, MPL.AX, ICT.PS, MBT.PS, UBL.KA) within the past 12 months
Credit Suisse has managed or co-managed a public offering of securities for the subject company (ANZ.AX, 9984.T, 005380.KS, 3988.HK, 2388.HK, STEL.SI, TAMO.BO, 002739.SZ, ICT.PS, EGCH.KA, 032830.KS, 0883.HK, HDBK.BO, SIAL.SI, 2727.HK, 012630.KS, 3393.HK, INBK.BO, SIIC.SI, 0958.HK, 0992.HK, PRU.L) within the past 12 months.
Credit Suisse has received investment banking related compensation from the subject company (ANZ.AX, TLS.AX, 9984.T, HCLT.BO, 005380.KS, CBA.AX, 3988.HK, 2388.HK, BABA.N, 2882.TW, 2318.HK, 0027.HK, MAHB.KL, STEL.SI, VIC.HM, MWC.PS, TAMO.BO, 002739.SZ, 2313.HK, ICT.PS, ADVANC.BK, EGCH.KA, 1299.HK, HLL.BO, MPI.PS, 032830.KS, 2325.TW, 0883.HK, HDBK.BO, 010620.KS, LINK.JK, ICBP.JK, SIAL.SI, 1171.HK, 600874.SS, 2727.HK, 012630.KS, 3393.HK, 600008.SS, INBK.BO, SIIC.SI, 0371.HK, 0958.HK, 0992.HK, 601179.SS, BIDU.OQ, 1114.HK, PRU.L, 088350.KS) within the past 12 months
Credit Suisse expects to receive or intends to seek investment banking related compensation from the subject company (005930.KS, 033780.KS, 7259.T, ANZ.AX, 2333.HK, 055550.KS, 5802.T, 005830.KS, TLS.AX, 2891.TW, 9984.T, 1113.HK, HCLT.BO, 7270.T, 005380.KS, 8750.T, CBA.AX, 3988.HK, 2881.TW, 7203.T, 6505.TW, BBRI.JK, 051900.KS, 0688.HK, 2388.HK, BABA.N, 8316.T, DBSM.SI, 015760.KS, 2882.TW, 8801.T, 2317.TW, 096770.KS, 000270.KS, 2318.HK, 000333.SZ, BRTI.BO, 0027.HK, GENP.KL, 1216.TW, MAHB.KL, STEL.SI, 2308.TW, MONE.SI, VIC.HM, MWC.PS, 0175.HK, 2498.TW, TAMO.BO, 002739.SZ, MPL.AX, ALFG.KL, 2313.HK, ICT.PS, ULTC.BO, ADVANC.BK, CTDM.SI, VNM.HM, PKOL.KA, 002415.SZ, KELE.KA, MBT.PS, EGCH.KA, 1299.HK, HLL.BO, 2884.TW, SUNT.SI, 600519.SS, MPI.PS, 032830.KS, CIMB.KL, SMRA.JK, 034220.KS, BBCA.JK, 2325.TW, 4528.T, EXCL.JK, 0883.HK, HDBK.BO, 010620.KS, 1301.TW, AIRA.KL, 2603.TW, LINK.JK, WPHB.KL, 0728.HK, 4938.TW, RELI.BO, SKSM.BO, MBBM.KL, MRTI.BO, GLOBAL.BK, ICBP.JK, 066570.KS, SIAL.SI, 0002.HK, 2282.HK, 1171.HK, 2454.TW, 600874.SS, 2727.HK, AMP.AX, 011170.KS, 005490.KS, 2338.HK, 012630.KS, 108670.KS, BLA.BK, 3393.HK, 0257.HK, JD.OQ,

01 December 2015
Asia Pacific Equity Strategy 124
600008.SS, 000826.SZ, 090430.KS, 2314.HK, INBK.BO, SIIC.SI, 0371.HK, EAm.BK, 3337.HK, 0958.HK, 2328.HK, 0992.HK, 601179.SS, 0586.HK, BIDU.OQ, GENS.SI, 4922.T, 010950.KS, 009540.KS, INTUCH.BK, 1114.HK, PRU.L, AMP.AX, CGF.AX, 088350.KS) within the next 3 months.
Credit Suisse has received compensation for products and services other than investment banking services from the subject company (ANZ.AX, 055550.KS, 2891.TW, 005380.KS, CBA.AX, 3988.HK, 8316.T, 000270.KS, 000333.SZ, MPL.AX, ICT.PS, MBT.PS, UBL.KA) within the past 12 months
As of the date of this report, Credit Suisse makes a market in the following subject companies (6758.T, 7203.T, 8801.T).
Credit Suisse may have interest in (BBRI.JK, GGRM.JK, SMRA.JK, ASII.JK, BBCA.JK, ACES.JK, EXCL.JK, LINK.JK, ICBP.JK)
Credit Suisse may have interest in (GENP.KL, GENT.KL, MAHB.KL, ALFG.KL, CIMB.KL, GAMU.KL, AIRA.KL, WPHB.KL, MBBM.KL, GENM.KL)
Please visit https://credit-suisse.com/in/researchdisclosure for additional disclosures mandated vide Securities And Exchange Board of India (Research Analysts) Regulations, 2014
Credit Suisse may have interest in (LART.NS, MAHM.NS, HALC.BO, HCLT.BO, BRTI.BO, TAMO.BO, ULTC.BO, TEML.BO, HLL.BO, SBI.BO, HDBK.BO, IDEA.BO, RELI.BO, BHEL.BO, SKSM.BO, MRTI.BO, VOLT.BO, INBK.BO, NTPC.BO, TISC.BO)
As of the end of the preceding month, Credit Suisse beneficially own 1% or more of a class of common equity securities of (2330.TW, 033780.KS, 2333.HK, 3988.HK, 2881.TW, 2317.TW, 2318.HK, 1216.TW, 2308.TW, VIC.HM, 2498.TW, 2601.HK, LLC.AX, 2325.TW, 0728.HK, 4938.TW, 2454.TW, 005490.KS, 1330.HK, 2382.TW, 0914.HK, 2328.HK, PRU.L, CGF.AX).
Credit Suisse has a material conflict of interest with the subject company (005930.KS) . Credit Suisse is acting as exclusive financial advisor to Samsung Electronics and Samsung Fine Chemicals in relation to the proposed sale of their ownership stakes in the semiconductor wafer joint ventures with SunEdison, SMP Ltd and MEMC Korea Company Ltd, to SunEdison.
Credit Suisse has a material conflict of interest with the subject company (2330.TW) . Credit Suisse is acting as the financial advisor to Motech Industries Inc in relation to the share subscription by Taiwan Semiconductor Manufacturing Co., Ltd.
Credit Suisse has a material conflict of interest with the subject company (BABA.N) . Credit Suisse acted as the exclusive financial advisor to Alibaba Group in relation to its investment in Snapdeal.com.
Credit Suisse has a material conflict of interest with the subject company (RIO.AX) . Credit Suisse is acting as advisor to Imerys on the proposed acquisition of the Luzenac Talc Group from Rio Tinto.
Credit Suisse has a material conflict of interest with the subject company (2882.TW) . Credit Suisse is acting as financial advisor to Cathay Financial Holding Co., Ltd. relating to the announced acquisition of stake in PT Bank Mayapada International, Tbk.
Credit Suisse has a material conflict of interest with the subject company (1299.HK) . Jack So (IB in HK) is an Independent Non-Exec Director of AIA (previously was a Non-Executive Director).
Credit Suisse has a material conflict of interest with the subject company (AGL.AX) . Peter Wilson has approx. A$1,000 worth of AGL shares as part of an employee share purchase plan. They won’t become unrestricted for 3 years.
Credit Suisse has a material conflict of interest with the subject company (0883.HK) . Credit Suisse is acting as financial advisor to both CNOOC Ltd. and SINOPEC on the acquisition of Marathon Oil Corporation's 20% interest in Block 32, offshore Angola.
Credit Suisse has a material conflict of interest with the subject company (0992.HK) . Credit Suisse is acting as financial advisor to Lenovo Group Limited for its proposed acquisition of Motorola Mobility Group from Google.
Arnab Mitra worked as an employee in Hindustan Unilever.
For other important disclosures concerning companies featured in this report, including price charts, please visit the website at https://rave.credit-suisse.com/disclosures or call +1 (877) 291-2683.
Important Regional Disclosures
Singapore recipients should contact Credit Suisse AG, Singapore Branch for any matters arising from this research report.
The analyst(s) involved in the preparation of this report may participate in events hosted by the subject company, including site visits. Credit Suisse does not accept or permit analysts to accept payment or reimbursement for travel expenses associated with these events.
Restrictions on certain Canadian securities are indicated by the following abbreviations: NVS--Non-Voting shares; RVS--Restricted Voting Shares; SVS--Subordinate Voting Shares.
Individuals receiving this report from a Canadian investment dealer that is not affiliated with Credit Suisse should be advised that this report may not contain regulatory disclosures the non-affiliated Canadian investment dealer would be required to make if this were its own report.
For Credit Suisse Securities (Canada), Inc.'s policies and procedures regarding the dissemination of equity research, please visit https://www.credit-suisse.com/sites/disclaimers-ib/en/canada-research-policy.html.
The following disclosed European company/ies have estimates that comply with IFRS: (RIO.AX, PRU.L).
Credit Suisse has acted as lead manager or syndicate member in a public offering of securities for the subject company (ANZ.AX, 9984.T, 005380.KS, CBA.AX, 3988.HK, 7203.T, 2388.HK, BABA.N, RIO.AX, 2318.HK, 1216.TW, MAHB.KL, STEL.SI, VIC.HM, TAMO.BO, 002739.SZ, 2313.HK, ICT.PS, TEML.BO, UBL.KA, EGCH.KA, 1299.HK, 032830.KS, CIMB.KL, BBCA.JK, 0883.HK, HDBK.BO, LINK.JK, WPHB.KL, 0270.HK,

01 December 2015
Asia Pacific Equity Strategy 125
SKSM.BO, SIAL.SI, 1171.HK, PTT.BK, 2727.HK, 005490.KS, 012630.KS, 3393.HK, 600008.SS, INBK.BO, SIIC.SI, 0958.HK, 2328.HK, 0992.HK, 009540.KS, INTUCH.BK, PRU.L) within the past 3 years.
As of the date of this report, Credit Suisse acts as a market maker or liquidity provider in the equities securities that are the subject of this report.
Principal is not guaranteed in the case of equities because equity prices are variable.
Commission is the commission rate or the amount agreed with a customer when setting up an account or at any time after that.
For Thai listed companies mentioned in this report, the independent 2014 Corporate Governance Report survey results published by the Thai Institute of Directors Association are being disclosed pursuant to the policy of the Office of the Securities and Exchange Commission: C.P. ALL PCL () , True Corp PCL (Very Good) , BTS Group Holdings PCL (Excellent) , Advanced Info Service PCL (Very Good) , Thai Union Group (Good) , Sino Thai Engr & Const PCL (Good) , Total Access Communication PCL (Very Good) , Siam Global House PCL (Good) , PTT Public Company Limited (Excellent) , Bangkok Life (Very Good) , Energy Absolute (Good) , Jasmine International () , Intouch Limited (Excellent)
Taiwanese Disclosures: This research report is for reference only. Investors should carefully consider their own investment risk. Investment results are the responsibility of the individual investor. Reports may not be reprinted without permission of CS. Reports written by Taiwan based analysts on non-Taiwan listed companies are not considered recommendations to buy or sell securities under Taiwan Stock Exchange Operational Regulations Governing Securities Firms Recommending Trades in Securities to Customers.
To the extent this is a report authored in whole or in part by a non-U.S. analyst and is made available in the U.S., the following are important disclosures regarding any non-U.S. analyst contributors: The non-U.S. research analysts listed below (if any) are not registered/qualified as research analysts with FINRA. The non-U.S. research analysts listed below may not be associated persons of CSSU and therefore may not be subject to the NASD Rule 2711 and NYSE Rule 472 restrictions on communications with a subject company, public appearances and trading securities held by a research analyst account.
Credit Suisse Securities (Japan) Limited ......................................................................................................................................... Daisuke Takato
Credit Suisse (Hong Kong) Limited Kin Nang Chik ; Vincent Chan ; Li Chen ; Bin Wang ; Trina Chen ; Kenneth Whee ; Kevin Yin ; Trina Chen ; Kenneth Fong ; Edmond Huang, CFA ; Baiding Rong ; Arjan van Veen; Thomas Wong ; Manish Nigam ; Colin McCallum, CA ; Dave Dai, CFA
Credit Suisse Securities (Europe) Limited, Seoul Branch ..................... Gil Kim ; A-Hyung Cho ; Minseok Sinn ; Henry Kwon ; Hayoung Chung
Credit Suisse Securities (Philippines) Inc. ............................................................................................................................................. Alvin Arogo
Credit Suisse AG, Singapore Branch Sakthi Siva ; Farhan Rizvi, CFA ; Fahd Niaz, CFA ; Gerald Wong, CFA ; Chate Benchavitvilai ; Sanjay Jain ; Sanjay Jain; Timothy Ross; Christopher Siow
Credit Suisse Securities (India) Private Limited ............................ Neelkanth Mishra ; Prateek Singh ; Jatin Chawla ; Arnab Mitra ; Lokesh Garg
Credit Suisse Securities (Malaysia) Sdn Bhd. ............................................................................................. Tan Ting Min; Muzhafar Mukhtar, CFA
Credit Suisse Equities (Australia) Limited .................................................................................................................................. Hasan Tevfik ,CFA
Credit Suisse Securities (Thailand) Limited ....................................................................................................................................... Dan Fineman
Credit Suisse AG, Taipei Securities Branch .................................................................................................................................. Chung Hsu, CFA
Important MSCI Disclosures
The MSCI sourced information is the exclusive property of Morgan Stanley Capital International Inc. (MSCI). Without prior written permission of MSCI, this information and any other MSCI intellectual property may not be reproduced, re-disseminated or used to create and financial products, including any indices. This information is provided on an "as is" basis. The user assumes the entire risk of any use made of this information. MSCI, its affiliates and any third party involved in, or related to, computing or compiling the information hereby expressly disclaim all warranties of originality, accuracy, completeness, merchantability or fitness for a particular purpose with respect to any of this information. Without limiting any of the foregoing, in no event shall MSCI, any of its affiliates or any third party involved in, or related to, computing or compiling the information have any liability for any damages of any kind. MSCI, Morgan Stanley Capital International and the MSCI indexes are services marks of MSCI and its affiliates.
The Global Industry Classification Standard (GICS) was developed by and is the exclusive property of Morgan Stanley Capital International Inc. and Standard & Poor’s. GICS is a service mark of MSCI and S&P and has been licensed for use by Credit Suisse.
For Credit Suisse disclosure information on other companies mentioned in this report, please visit the website at https://rave.credit-suisse.com/disclosures or call +1 (877) 291-2683.

01 December 2015
Asia Pacific Equity Strategy 126
References in this report to Credit Suisse include all of the subsidiaries and affiliates of Credit Suisse operating under its investment banking division. For more information on our structure, please use the following link: https://www.credit-suisse.com/who-we-are This report may contain material that is not directed to, or intended for distribution to or use by, any person or entity who is a citizen or resident of or located in any locality, state, country or other jurisdiction where such distribution, publication, availability or use would be contrary to law or regulation or which would subject Credit Suisse AG or its affiliates ("CS") to any registration or licensing requirement within such jurisdiction. All material presented in this report, unless specifically indicated otherwise, is under copyright to CS. None of the material, nor its content, nor any copy of it, may be altered in any way, transmitted to, copied or distributed to any other party, without the prior express written permission of CS. All trademarks, service marks and logos used in this report are trademarks or service marks or registered trademarks or service marks of CS or its affiliates. The information, tools and material presented in this report are provided to you for information purposes only and are not to be used or considered as an offer or the solicitation of an offer to sell or to buy or subscribe for securities or other financial instruments. CS may not have taken any steps to ensure that the securities referred to in this report are suitable for any particular investor. CS will not treat recipients of this report as its customers by virtue of their receiving this report. The investments and services contained or referred to in this report may not be suitable for you and it is recommended that you consult an independent investment advisor if you are in doubt about such investments or investment services. Nothing in this report constitutes investment, legal, accounting or tax advice, or a representation that any investment or strategy is suitable or appropriate to your individual circumstances, or otherwise constitutes a personal recommendation to you. CS does not advise on the tax consequences of investments and you are advised to contact an independent tax adviser. Please note in particular that the bases and levels of taxation may change. Information and opinions presented in this report have been obtained or derived from sources believed by CS to be reliable, but CS makes no representation as to their accuracy or completeness. CS accepts no liability for loss arising from the use of the material presented in this report, except that this exclusion of liability does not apply to the extent that such liability arises under specific statutes or regulations applicable to CS. This report is not to be relied upon in substitution for the exercise of independent judgment. CS may have issued, and may in the future issue, other communications that are inconsistent with, and reach different conclusions from, the information presented in this report. Those communications reflect the different assumptions, views and analytical methods of the analysts who prepared them and CS is under no obligation to ensure that such other communications are brought to the attention of any recipient of this report. Some investments referred to in this report will be offered solely by a single entity and in the case of some investments solely by CS, or an associate of CS or CS may be the only market maker in such investments. Past performance should not be taken as an indication or guarantee of future performance, and no representation or warranty, express or implied, is made regarding future performance. Information, opinions and estimates contained in this report reflect a judgment at its original date of publication by CS and are subject to change without notice. The price, value of and income from any of the securities or financial instruments mentioned in this report can fall as well as rise. The value of securities and financial instruments is subject to exchange rate fluctuation that may have a positive or adverse effect on the price or income of such securities or financial instruments. Investors in securities such as ADR's, the values of which are influenced by currency volatility, effectively assume this risk. Structured securities are complex instruments, typically involve a high degree of risk and are intended for sale only to sophisticated investors who are capable of understanding and assuming the risks involved. The market value of any structured security may be affected by changes in economic, financial and political factors (including, but not limited to, spot and forward interest and exchange rates), time to maturity, market conditions and volatility, and the credit quality of any issuer or reference issuer. Any investor interested in purchasing a structured product should conduct their own investigation and analysis of the product and consult with their own professional advisers as to the risks involved in making such a purchase. Some investments discussed in this report may have a high level of volatility. High volatility investments may experience sudden and large falls in their value causing losses when that investment is realised. Those losses may equal your original investment. Indeed, in the case of some investments the potential losses may exceed the amount of initial investment and, in such circumstances, you may be required to pay more money to support those losses. Income yields from investments may fluctuate and, in consequence, initial capital paid to make the investment may be used as part of that income yield. Some investments may not be readily realisable and it may be difficult to sell or realise those investments, similarly it may prove difficult for you to obtain reliable information about the value, or risks, to which such an investment is exposed. This report may provide the addresses of, or contain hyperlinks to, websites. Except to the extent to which the report refers to website material of CS, CS has not reviewed any such site and takes no responsibility for the content contained therein. Such address or hyperlink (including addresses or hyperlinks to CS's own website material) is provided solely for your convenience and information and the content of any such website does not in any way form part of this document. Accessing such website or following such link through this report or CS's website shall be at your own risk. This report is issued and distributed in Europe (except Switzerland) by Credit Suisse Securities (Europe) Limited, One Cabot Square, London E14 4QJ, England, which is authorised by the Prudential Regulation Authority and regulated by the Financial Conduct Authority and the Prudential Regulation Authority. This report is issued and distributed in Europe (except Switzerland) by Credit Suisse International, One Cabot Square, London E14 4QJ, England, which is authorised by the Prudential Regulation Authority and regulated by the Financial Conduct Authority and the Prudential Regulation Authority. This report is being distributed in Germany by Credit Suisse Securities (Europe) Limited Niederlassung Frankfurt am Main regulated by the Bundesanstalt fuer Finanzdienstleistungsaufsicht ("BaFin"). This report is being distributed in the United States and Canada by Credit Suisse Securities (USA) LLC; in Switzerland by Credit Suisse AG; in Brazil by Banco de Investimentos Credit Suisse (Brasil) S.A or its affiliates; in Mexico by Banco Credit Suisse (México), S.A. (transactions related to the securities mentioned in this report will only be effected in compliance with applicable regulation); in Japan by Credit Suisse Securities (Japan) Limited, Financial Instruments Firm, Director-General of Kanto Local Finance Bureau (Kinsho) No. 66, a member of Japan Securities Dealers Association, The Financial Futures Association of Japan, Japan Investment Advisers Association, Type II Financial Instruments Firms Association; elsewhere in Asia/ Pacific by whichever of the following is the appropriately authorised entity in the relevant jurisdiction: Credit Suisse (Hong Kong) Limited, Credit Suisse Equities (Australia) Limited, Credit Suisse Securities (Thailand) Limited, regulated by the Office of the Securities and Exchange Commission, Thailand, having registered address at 990 Abdulrahim Place, 27th Floor, Unit 2701, Rama IV Road, Silom, Bangrak, Bangkok 10500, Thailand, Tel. +66 2614 6000, Credit Suisse Securities (Malaysia) Sdn Bhd, Credit Suisse AG, Singapore Branch, Credit Suisse Securities (India) Private Limited (CIN no. U67120MH1996PTC104392) regulated by the Securities and Exchange Board of India as Research Analyst (registration no. INH 000001030) and as Stock Broker (registration no. INB230970637; INF230970637; INB010970631; INF010970631), having registered address at 9th Floor, Ceejay House, Dr.A.B. Road, Worli, Mumbai - 18, India, T- +91-22 6777 3777, Credit Suisse Securities (Europe) Limited, Seoul Branch, Credit Suisse AG, Taipei Securities Branch, PT Credit Suisse Securities Indonesia, Credit Suisse Securities (Philippines ) Inc., and elsewhere in the world by the relevant authorised affiliate of the above. Research on Taiwanese securities produced by Credit Suisse AG, Taipei Securities Branch has been prepared by a registered Senior Business Person. Research provided to residents of Malaysia is authorised by the Head of Research for Credit Suisse Securities (Malaysia) Sdn Bhd, to whom they should direct any queries on +603 2723 2020. This report has been prepared and issued for distribution in Singapore to institutional investors, accredited investors and expert investors (each as defined under the Financial Advisers Regulations) only, and is also distributed by Credit Suisse AG, Singapore branch to overseas investors (as defined under the Financial Advisers Regulations). By virtue of your status as an institutional investor, accredited investor, expert investor or overseas investor, Credit Suisse AG, Singapore branch is exempted from complying with certain compliance requirements under the Financial Advisers Act, Chapter 110 of Singapore (the "FAA"), the Financial Advisers Regulations and the relevant Notices and Guidelines issued thereunder, in respect of any financial advisory service which Credit Suisse AG, Singapore branch may provide to you. This information is being distributed by Credit Suisse AG (DIFC Branch), duly licensed and regulated by the Dubai Financial Services Authority (“DFSA”). Related financial services or products are only made available to Professional Clients or Market Counterparties, as defined by the DFSA, and are not intended for any other persons. Credit Suisse AG (DIFC Branch) is located on Level 9 East, The Gate Building, DIFC, Dubai, United Arab Emirates. This research may not conform to Canadian disclosure requirements. In jurisdictions where CS is not already registered or licensed to trade in securities, transactions will only be effected in accordance with applicable securities legislation, which will vary from jurisdiction to jurisdiction and may require that the trade be made in accordance with applicable exemptions from registration or licensing requirements. Non-U.S. customers wishing to effect a transaction should contact a CS entity in their local jurisdiction unless governing law permits otherwise. U.S. customers wishing to effect a transaction should do so only by contacting a representative at Credit Suisse Securities (USA) LLC in the U.S. Please note that this research was originally prepared and issued by CS for distribution to their market professional and institutional investor customers. Recipients who are not market professional or institutional investor customers of CS should seek the advice of their independent financial advisor prior to taking any investment decision based on this report or for any necessary explanation of its contents. This research may relate to investments or services of a person outside of the UK or to other matters which are not authorised by the Prudential Regulation Authority and regulated by the Financial Conduct Authority and the Prudential Regulation Authority or in respect of which the protections of the Prudential Regulation Authority and Financial Conduct Authority for private customers and/or the UK compensation scheme may not be available, and further details as to where this may be the case are available upon request in respect of this report. CS may provide various services to US municipal entities or obligated persons ("municipalities"), including suggesting individual transactions or trades and entering into such transactions. Any services CS provides to municipalities are not viewed as "advice" within the meaning of Section 975 of the Dodd-Frank Wall Street Reform and Consumer Protection Act. CS is providing any such services and related information solely on an arm's length basis and not as an advisor or fiduciary to the municipality. In connection with the provision of the any such services, there is no agreement, direct or indirect, between any municipality (including the officials, management, employees or agents thereof) and CS for CS to provide advice to the municipality. Municipalities should consult with their financial, accounting and legal advisors regarding any such services provided by CS. In addition, CS is not acting for direct or indirect compensation to solicit the municipality on behalf of an unaffiliated broker, dealer, municipal securities dealer, municipal advisor, or investment adviser for the purpose of obtaining or retaining an engagement by the municipality for or in connection with Municipal Financial Products, the issuance of municipal securities, or of an investment adviser to provide investment advisory services to or on behalf of the municipality. If this report is being distributed by a financial institution other than Credit Suisse AG, or its affiliates, that financial institution is solely responsible for distribution. Clients of that institution should contact that institution to effect a transaction in the securities mentioned in this report or require further information. This report does not constitute investment advice by Credit Suisse to the clients of the distributing financial institution, and neither Credit Suisse AG, its affiliates, and their respective officers, directors and employees accept any liability whatsoever for any direct or consequential loss arising from their use of this report or its content. Principal is not guaranteed. Commission is the commission rate or the amount agreed with a customer when setting up an account or at any time after that.
Copyright © 2015 CREDIT SUISSE AG and/or its affiliates. All rights reserved.
Investment principal on bonds can be eroded depending on sale price or market price. In addition, there are bonds on which investment principal can be eroded due to changes in redemption amounts. Care is required when investing in such instruments. When you purchase non-listed Japanese fixed income securities (Japanese government bonds, Japanese municipal bonds, Japanese government guaranteed bonds, Japanese corporate bonds) from CS as a seller, you will be requested to pay the purchase price only.
SY1358.doc