16a housing — attachment - home - productivity … · 16a housing — attachment ... table 16a.16...
TRANSCRIPT
Preamble
16A Housing — attachment
Data in this Report are examined by the Housing and Homelessness Working Group, but have notbeen formally audited by the Secretariat. Unsourced information was obtained from Australian,State and Territory governments.
This file is available in Adobe PDF format on the Review web page (www.pc.gov.au/gsp/).
Data reported in the attachment tables are the most accurate available at the time of data collection.Historical data may have been updated since the last report.
Definitions for indicators and descriptors in this attachment are in the Police services chapter of theCompendium.
Tables in this attachment are sourced from the Housing services attachment of the 2011 Report —table numbers from the 2011 Report are identified in the source information. For example, a sourcereference to ‘2011 Report, table 16A.15’ refers to attachment table 15 of attachment 16A of the2011 Report.
HOUSINGINDIGENOUSCOMPENDIUM 2011

Contents
Attachment contents
Public housing
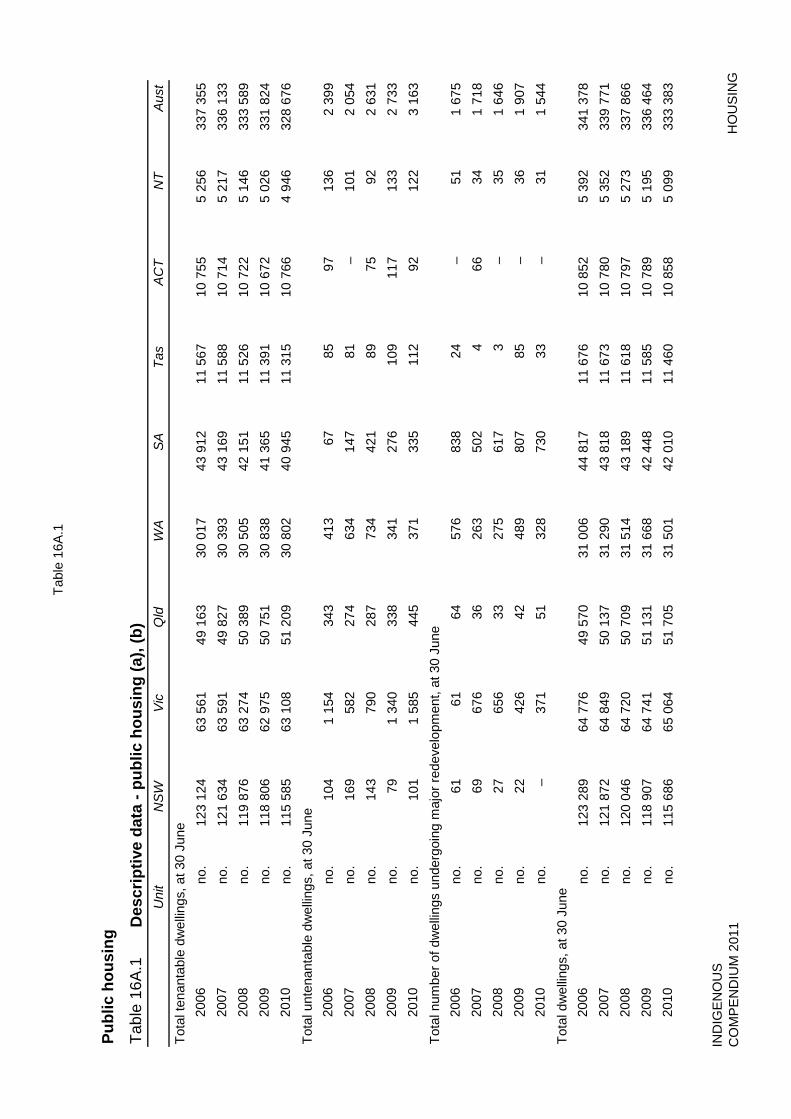
Table 16A.1 Descriptive data - public housing
Table 16A.2 Proportion of Indigenous households in public housing living in overcrowded conditions,by remoteness
SOMIH
Table 16A.3 Descriptive data - State owned and managed Indigenous housing
Table 16A.4 Proportion of new tenancies allocated to households with special needs (per cent)
Table 16A.5 Greatest need allocations as a proportion of all new allocations (per cent)
Table 16A.6 Net recurrent cost per dwelling (2009-10 dollars)
Table 16A.7 Occupancy rates as at 30 June (per cent)
Table 16A.8 Average turnaround times for vacant stock (days)
Table 16A.9 Rent collection rate (per cent)
Table 16A.10 Amenity, location and customer satisfaction with SOMIH, 2007
Table 16A.11 Average weekly subsidy per rebated household, at 30 June (2009-10 dollars)
Table 16A.12 Low income households in SOMIH, at 30 June
Table 16A.13 Proportion of low income households in SOMIH spending more than 30 per cent of theirincome in rent, at 30 June
Table 16A.14 Proportion of overcrowded households at 30 June (per cent)
Table 16A.15 Proportion of Indigenous households in SOMIH living in overcrowded conditions, byremoteness
Community housing
Table 16A.16 Descriptive data - community housing
Indigenous community housing
Table 16A.17 Descriptive data - Indigenous community housing
Table 16A.18 Proportion of permanent dwellings not connected to an organised water supply (percent)
Table 16A.19 Proportion of permanent dwellings not connected to an organised sewerage supply (percent)
Table 16A.20 Proportion of permanent dwellings not connected to an organised electricity supply (percent)
Table 16A.21 Dwelling condition, (per cent)
Table 16A.22 Net recurrent cost per dwelling (2008-09 dollars)
Table 16A.23 Occupancy rates (per cent)
Table 16A.24 Rent collection rate (per cent)
Table 16A.25 Proportion of overcrowded households (per cent)
Table 16A.26 Proportion of Indigenous households in Indigenous community housing living inovercrowded conditions, by number of bedrooms needed
CRA
Table 16A.27 Number of Indigenous income units receiving CRA, 2010
Table 16A.28 Proportion of Indigenous CRA recipients, 2010 (per cent)
HOUSINGINDIGENOUSCOMPENDIUM 2011

Contents
Attachment contents
Table 16A.29 Income units receiving CRA, by special needs and geographic location, 2010
Table 16A.30 Proportion of Indigenous income units receiving CRA, paying more than 30 per cent ofincome on rent, with and without CRA, 2005 to 2010 (per cent)
Table 16A.31 Proportion of Indigenous income units receiving CRA, paying more than 30 per cent ofincome on rent, with and without CRA, 2001 to 2010 (per cent)
Descriptive information
Table 16A.32 Proportion of household income spent on rent — state owned and managed Indigenoushousing (per cent)
Table 16A.33 Proportion of households in State owned and managed Indigenous housing withunderutilisation, (per cent)
Table 16A.34 State owned and managed Indigenous housing, non-rebated and multiple familyhouseholds excluded, 2010
Table 16A.35 SOMIH housing policy context, 2010
HOUSINGINDIGENOUSCOMPENDIUM 2011

Public housing
HOUSINGINDIGENOUSCOMPENDIUM 2011

Tabl
e 16
A.1
Tabl
e 16
A.1
Uni
tN
SW
Vic
Qld
WA
SA
Tas
AC
TN
TA
ust
Tota
l hou
seho
lds
payi
ng le
ss th
an m
arke
t ren
t, at
30
June
no.
109
630
54
923
43
065
25
779
37
207
9 6
91 9
124
4 3
94 2
93 8
13no
. 1
07 9
59 5
2 99
7 4
4 19
6 2
4 97
2 3
6 24
2 9
113
8 8
24 4
383
288
686
no.
106
732
53
029
46
281
26
513
36
026
9 1
48 9
157
4 2
51 2
91 1
37no
. 1
05 5
24 5
0 18
6 4
8 12
6 2
6 32
7 3
6 35
1 9
331
9 3
73 4
211
289
429
no.
102
997
52
485
49
706
26
034
36
096
9 4
85 9
656
4 2
01 2
90 6
60To
tal n
ew h
ouse
hold
s as
sist
ed, f
or y
ear e
ndin
g 30
Jun
e20
05-0
6no
. 8
733
5 4
65 4
623
3 1
48 2
933
1 0
73 8
40 7
29 2
7 54
420
06-0
7no
. 8
631
5 1
68 4
452
3 1
27 2
948
1 1
59 6
95 6
44 2
6 82
420
07-0
8no
. 7
801
4 3
37 4
258
2 8
71 2
199
1 0
28 7
18 5
19 2
3 73
120
08-0
9no
. 6
185
3 7
52 4
122
2 6
87 2
083
886
614
424
20
753
2009
-10
no.
5 8
61 3
799
3 8
86 2
400
2 2
49 9
21 5
57 4
55 2
0 12
8To
tal n
ew In
dige
nous
hou
seho
lds
assi
sted
, for
yea
r end
ing
30 J
une
2005
-06
no.
1 0
27 2
67 7
13 8
54 2
64 1
36 2
8 3
72 3
661
2006
-07
no.
1 0
91 2
98 7
51 7
16 3
21 1
42 2
4 3
63 3
706
2007
-08
no.
1 0
75 2
19 7
19 8
15 2
66 1
37 4
4 2
81 3
556
2008
-09
no.
901
188
747
817
296
110
53
234
3 3
4620
09-1
0no
. 8
34 1
31 7
92 7
91 3
16 1
23 4
1 2
54 3
282
Hou
seho
lds
relo
catin
g fro
m o
ne p
ublic
hou
sing
dw
ellin
g to
ano
ther
, for
yea
r end
ing
30 J
une
2005
-06
no.
3 6
92 2
182
1 1
41 1
389
1 5
35 3
54 2
50 2
43 1
0 78
620
06-0
7no
. 3
642
1 9
18 1
156
1 2
40 1
441
305
276
179
10
157
2007
-08
no.
3 5
55 2
047
1 2
07 1
235
1 2
19 2
79 2
40 1
56 9
938
2008
-09
no.
3 2
87 2
004
1 0
33 1
379
1 0
28 2
82 2
19 2
08 9
440
2009
-10
no.
3 9
88 2
073
1 1
55 1
272
991
347
217
234
10
277
Publ
ic h
ousi
ng
Des
crip
tive
data
- pu
blic
hou
sing
(a),
(b)
2010
2006
2007
2008
2009
HO
US
ING
IND
IGE
NO
US
CO
MP
EN
DIU
M 2
011

Tabl
e 16
A.1
Tabl
e 16
A.1
Uni
tN
SW
Vic
Qld
WA
SA
Tas
AC
TN
TA
ust
Publ
ic h
ousi
ng
Des
crip
tive
data
- pu
blic
hou
sing
(a),
(b)
Tota
l ren
t cha
rged
, for
yea
r end
ing
30 J
une
2005
-06
$'00
0 5
76 2
67 2
87 6
59 2
32 5
90 1
25 0
12 2
11 8
80 4
3 38
2 6
0 22
9 2
5 52
51
562
544
2006
-07
$'00
0 6
16 3
91 3
03 3
49 2
49 6
38 1
31 5
15 2
05 3
49 4
7 63
4 6
3 48
3 4
2 43
51
659
794
2007
-08
$'00
0 6
22 2
59 3
17 3
46 2
63 5
54 1
44 4
56 2
12 3
85 5
5 22
8 6
7 44
1 3
2 47
71
715
146
2008
-09
$'00
0 6
47 5
28 3
25 4
57 2
78 5
48 1
52 7
51 2
19 8
60 5
8 94
4 7
1 92
7 2
9 01
91
784
034
2009
-10
$'00
0 6
47 3
47 3
33 1
03 2
80 1
29 1
56 6
33 2
22 1
24 6
3 23
8 7
3 68
0 2
8 49
11
804
745
Tota
l Ind
igen
ous
hous
ehol
ds, a
t 30
June
no.
8 7
00 1
233
3 1
22 4
399
1 2
10 6
39 1
91 1
647
21
141
no.
9 8
00 1
349
3 4
21 4
508
1 3
28 7
11 2
04 1
781
23
102
no.
9 8
00 1
379
3 7
42 4
751
1 4
21 7
50 2
60 1
850
23
953
no.
9 8
00 1
396
4 0
89 5
254
1 5
19 7
62 3
63 1
932
25
115
no.
9 8
00 1
442
4 5
90 5
736
1 5
92 8
09 4
32 1
962
26
363
Tota
l gre
ates
t nee
d ap
plic
ants
on
wai
ting
list,
incl
udin
g ap
plic
ants
for t
rans
fer,
at 3
0 Ju
neno
. 1
445
4 3
31 4
49 2
91 1
176
1 7
57 1
651
124
11
224
no.
2 0
02 4
495
724
476
1 2
61 1
693
911
138
11
700
no.
2 2
14 5
401
1 2
95 1
497
1 4
27 1
730
877
197
14
638
no.
3 2
21 7
247
11
124
2 7
69 1
612
2 1
74 1
278
236
29
661
no.
22
608
8 7
77 1
9 63
7 2
983
2 4
84 2
348
1 0
94 2
86 6
0 21
7To
tal a
pplic
ants
on
wai
ting
list i
nclu
ding
app
lican
ts fo
r tra
nsfe
r, at
30
June
no.
58
172
41
114
37
215
13
130
27
925
3 3
87 3
600
2 3
91 1
86 9
34no
. 5
0 31
6 4
0 91
1 3
6 81
5 1
4 57
1 2
6 20
1 3
055
1 8
70 2
582
176
321
no.
49
950
43
467
34
696
16
352
24
804
3 1
71 1
859
3 3
53 1
77 6
52no
. 4
7 41
3 4
7 73
1 2
2 50
4 2
1 23
9 2
4 70
6 3
542
2 5
64 3
757
173
456
no.
60
444
50
716
30
593
23
723
25
302
3 6
75 2
479
3 1
63 2
00 0
95
2006
2007
2010
2008
2008
2009
2009
2006
2007
2008
2009
2010
2010
2007
2006
HO
US
ING
IND
IGE
NO
US
CO
MP
EN
DIU
M 2
011
Tabl
e 16
A.1
Tabl
e 16
A.1
Uni
tN
SW
Vic
Qld
WA
SA
Tas
AC
TN
TA
ust
Publ
ic h
ousi
ng
Des
crip
tive
data
- pu
blic
hou
sing
(a),
(b)
Tota
l ten
anta
ble
dwel
lings
, at 3
0 Ju
neno
. 1
23 1
24 6
3 56
1 4
9 16
3 3
0 01
7 4
3 91
2 1
1 56
7 1
0 75
5 5
256
337
355
no.
121
634
63
591
49
827
30
393
43
169
11
588
10
714
5 2
17 3
36 1
33no
. 1
19 8
76 6
3 27
4 5
0 38
9 3
0 50
5 4
2 15
1 1
1 52
6 1
0 72
2 5
146
333
589
no.
118
806
62
975
50
751
30
838
41
365
11
391
10
672
5 0
26 3
31 8
24no
. 1
15 5
85 6
3 10
8 5
1 20
9 3
0 80
2 4
0 94
5 1
1 31
5 1
0 76
6 4
946
328
676
Tota
l unt
enan
tabl
e dw
ellin
gs, a
t 30
June
no.
104
1 1
54 3
43 4
13 6
7 8
5 9
7 1
36 2
399
no.
169
582
274
634
147
81
– 1
01 2
054
no.
143
790
287
734
421
89
75
92
2 6
31no
. 7
9 1
340
338
341
276
109
117
133
2 7
33no
. 1
01 1
585
445
371
335
112
92
122
3 1
63To
tal n
umbe
r of d
wel
lings
und
ergo
ing
maj
or re
deve
lopm
ent,
at 3
0 Ju
neno
. 6
1 6
1 6
4 5
76 8
38 2
4–
51
1 6
75no
. 6
9 6
76 3
6 2
63 5
02 4
66
34
1 7
18no
. 2
7 6
56 3
3 2
75 6
17 3
– 3
5 1
646
no.
22
426
42
489
807
85
– 3
6 1
907
no.
– 3
71 5
1 3
28 7
30 3
3–
31
1 5
44To
tal d
wel
lings
, at 3
0 Ju
neno
. 1
23 2
89 6
4 77
6 4
9 57
0 3
1 00
6 4
4 81
7 1
1 67
6 1
0 85
2 5
392
341
378
no.
121
872
64
849
50
137
31
290
43
818
11
673
10
780
5 3
52 3
39 7
71no
. 1
20 0
46 6
4 72
0 5
0 70
9 3
1 51
4 4
3 18
9 1
1 61
8 1
0 79
7 5
273
337
866
no.
118
907
64
741
51
131
31
668
42
448
11
585
10
789
5 1
95 3
36 4
64no
. 1
15 6
86 6
5 06
4 5
1 70
5 3
1 50
1 4
2 01
0 1
1 46
0 1
0 85
8 5
099
333
383
2006
2009
2010
2006
2007
2006
2007
2008
2008
2009
2010
2010
2006
2007
2008
2009
2010
2007
2008
2009
HO
US
ING
IND
IGE
NO
US
CO
MP
EN
DIU
M 2
011

Tabl
e 16
A.1
Tabl
e 16
A.1
Uni
tN
SW
Vic
Qld
WA
SA
Tas
AC
TN
TA
ust
Publ
ic h
ousi
ng
Des
crip
tive
data
- pu
blic
hou
sing
(a),
(b)
Tota
l occ
upie
d dw
ellin
gs, a
t 30
June
no.
121
529
63
159
49
011
29
818
43
096
11
487
10
712
5 1
55 3
33 9
67no
. 1
20 1
87 6
3 27
8 4
9 67
7 3
0 19
7 4
2 52
7 1
1 52
6 1
0 62
6 5
121
333
139
no.
118
839
62
964
50
243
30
299
41
625
11
492
10
642
5 0
32 3
31 1
36no
. 1
17 2
42 6
2 56
5 5
0 57
9 3
0 61
3 4
0 77
4 1
1 36
4 1
0 62
0 4
922
328
679
no.
114
422
62
593
51
041
30
558
40
206
11
266
10
737
4 8
50 3
25 6
73To
tal r
ents
cha
rged
for w
eek
of 3
0 Ju
ne$'
000
11
123
5 6
56 4
659
2 4
26 3
736
967
1 1
93 4
86 3
0 24
5$'
000
11
577
6 0
21 4
849
2 6
07 3
860
971
1 3
07 5
02 3
1 69
4$'
000
12
004
6 1
81 5
283
2 8
55 3
974
1 0
34 1
365
529
33
225
$'00
0 1
2 44
3 6
521
5 4
52 2
978
4 0
55 1
104
1 4
25 5
41 3
4 51
9$'
000
12
713
6 9
06 5
307
3 0
45 4
157
1 1
70 1
455
551
35
304
Tota
l mar
ket r
ent v
alue
of a
ll dw
ellin
gs fo
r whi
ch re
nt w
as c
harg
ed fo
r wee
k of
30
June
$'00
0 2
4 07
4 1
0 11
5 8
238
4 0
55 6
357
1 7
26 2
508
970
58
044
$'00
0 2
4 61
6 1
0 32
2 9
622
4 1
04 6
580
1 5
01 2
700
993
60
437
$'00
0 2
5 85
4 1
0 50
8 1
0 90
2 4
927
6 9
51 1
639
3 0
09 1
066
64
856
$'00
0 2
7 96
9 1
0 48
3 1
2 25
6 4
994
7 4
36 1
818
3 3
58 1
139
69
454
$'00
0 2
7 66
5 1
2 05
7 1
2 86
3 4
996
7 8
67 1
994
3 6
25 1
213
72
282
Tota
l dw
ellin
gs in
maj
or c
ities
, at 3
0 Ju
ne (c
) no
. 9
9 58
7 4
6 68
9 3
0 50
9 2
1 85
0 3
4 71
1..
10
844
.. 2
44 1
91no
. 9
8 76
6 4
6 75
5 3
0 89
3 2
2 11
4 3
3 92
8..
10
772
.. 2
43 2
29no
. 9
8 32
7 4
6 80
7 3
4 18
2 2
2 27
9 3
3 44
7..
10
788
.. 2
45 8
30no
. 9
7 61
4 4
6 84
5 3
4 46
7 2
2 27
5 3
2 80
5..
10
779
.. 2
44 7
85no
. 9
5 93
6 4
6 94
5 3
4 77
8 2
2 05
4 3
2 50
8..
10
848
.. 2
43 0
69
2006
2007
2007
2008
2009
2010
2008
2009
2010
2006
2010
2006
2007
2008
2006
2007
2008
2009
2009
2010
HO
US
ING
IND
IGE
NO
US
CO
MP
EN
DIU
M 2
011

Tabl
e 16
A.1
Tabl
e 16
A.1
Uni
tN
SW
Vic
Qld
WA
SA
Tas
AC
TN
TA
ust
Publ
ic h
ousi
ng
Des
crip
tive
data
- pu
blic
hou
sing
(a),
(b)
Tota
l dw
ellin
gs in
inne
r reg
iona
l are
as, a
t 30
June
(c)
no.
18
695
14
528
9 6
91 2
983
3 0
71 8
501
8..
57
477
no.
18
265
14
566
9 7
89 3
022
3 0
46 8
517
8..
57
214
no.
17
416
14
499
8 2
47 2
971
2 8
83 8
517
9..
54
542
no.
17
149
14
537
8 3
70 3
029
2 8
51 8
493
10
.. 5
4 43
9no
. 1
5 98
0 1
4 75
8 8
482
3 0
37 2
805
8 3
90 1
0..
53
462
Tota
l of d
wel
lings
in o
uter
regi
onal
are
as, a
t 30
June
(c)
no.
4 5
84 3
530
8 1
96 2
967
6 1
75 3
076
.. 3
729
32
259
no.
4 4
36 3
500
8 2
52 2
942
5 9
92 3
058
.. 3
693
31
872
no.
3 9
31 3
396
7 1
58 3
039
6 0
20 3
004
.. 3
710
30
257
no.
3 7
68 3
342
7 1
63 3
097
5 9
70 2
998
.. 3
647
29
985
no.
3 4
33 3
343
7 3
01 3
107
5 8
86 2
978
.. 3
577
29
625
Tota
l dw
ellin
gs in
rem
ote
area
s, a
t 30
June
(c)
no.
350
28
880
2 1
82 7
92 6
8..
1 4
51 5
752
no.
335
27
889
2 1
84 7
85 6
7..
1 4
54 5
740
no.
334
19
847
2 2
74 7
64 6
6..
1 3
45 5
649
no.
325
18
852
2 2
82 7
50 6
3..
1 3
54 5
644
no.
302
18
865
2 3
13 7
39 6
1..
1 3
33 5
631
Tota
l of d
wel
lings
in v
ery
rem
ote
area
s, a
t 30
June
(c)
no.
73
.. 2
93 1
023
68
31
.. 2
12 1
700
no.
71
.. 3
14 1
028
66
31
.. 2
05 1
716
no.
38
.. 2
75 9
51 7
5 3
1..
218
1 5
88no
. 3
6..
279
985
72
31
.. 1
94 1
597
no.
35
.. 2
79 9
90 7
2 3
1..
189
1 5
96
2008
2009
2010
2006
2006
2007
2007
2008
2006
2007
2009
2010
2008
2006
2010
2009
2007
2008
2010
2009
HO
US
ING
IND
IGE
NO
US
CO
MP
EN
DIU
M 2
011

Tabl
e 16
A.1
Tabl
e 16
A.1
Uni
tN
SW
Vic
Qld
WA
SA
Tas
AC
TN
TA
ust
Publ
ic h
ousi
ng
Des
crip
tive
data
- pu
blic
hou
sing
(a),
(b)
Tota
l num
ber o
f all
hous
ehol
ds, a
t 30
June
no.
121
529
63
159
49
011
29
819
43
096
11
487
10
712
5 1
55 3
33 9
68no
. 1
20 1
87 6
3 27
8 4
9 67
7 3
0 14
2 4
2 52
7 1
1 52
6 1
0 62
7 5
121
333
085
no.
118
839
62
964
50
243
30
299
41
625
11
492
10
642
5 0
32 3
31 1
36no
. 1
17 2
42 6
2 56
5 5
0 57
9 3
0 61
6 4
0 77
4 1
1 36
4 1
0 62
0 4
976
328
736
no.
114
421
62
593
51
041
30
558
40
206
11
266
10
737
4 9
04 3
25 7
26
(a)
(b)
(c)
2006
2007
2008
2009
.. N
ot a
pplic
able
. – N
il or
roun
ded
to z
ero.
Sou
rce
: Au
stra
lian
Inst
itute
ofH
ealth
and
Wel
fare
(AIH
W)
(200
6,20
08,2
009)
CS
HA
natio
nald
ata
repo
rt;A
IHW
(201
0,20
11)H
ousi
ngas
sist
ance
tabl
es;2
011
Rep
ort,
tabl
e 16
A.1.
2010
Dat
am
ayno
tbe
com
para
ble
acro
ssju
risdi
ctio
nsan
dov
ertim
ean
dco
mpa
rison
sco
uld
bem
isle
adin
g.Fu
rther
info
rmat
ion
abou
tthe
data
inth
ista
ble
can
befo
und
at w
ww
.pc.
gov.
au/g
sp/re
ports
/rogs
/201
1.
Due
toro
undi
ngth
ena
tiona
ltot
alm
ayno
tequ
alth
esu
mof
juris
dict
ions
’dat
aite
ms
for(
1)to
tald
wel
lings
inm
ajor
citie
s,in
nera
ndou
terr
egio
nal,
rem
ote
and
very
rem
ote
Aust
ralia
and
mig
rato
ryar
eas
and
open
ing
and
clos
ing
rent
debt
ors
and
(2)t
otal
rent
sch
arge
dan
dto
talm
arke
tren
tval
ueof
dwel
lings
forw
hich
are
nt w
as c
harg
ed.
Base
d on
the
Aust
ralia
n St
anda
rd G
eogr
aphi
cal C
lass
ifica
tion
rem
oten
ess
area
stru
ctur
e.
HO
US
ING
IND
IGE
NO
US
CO
MP
EN
DIU
M 2
011

Table 16A.2
Public housing
Table 16A.2
Unit NSW Vic Qld WA SA Tas ACT NT Aust2009-10
Major cities % 8.8 12.9 14.0 9.9 8.7 .. 10.6 .. 10.4Inner regional % 6.4 12.4 9.4 10.2 7.3 12.3 0.7 .. 8.8Outer regional % 5.8 12.6 15.2 9.2 9.7 9.7 .. 14.8 11.9Remote % 5.9 11.1 14.0 12.8 9.0 3.0 .. 13.0 12.6Very remote % np .. np 15.5 np 0.0 .. 18.7 15.0
(a)
(b)
Source : AIHW (2010), derived from National Housing Assistance Data Respository ; 2011 Report,table 16A.14.
Proportion of Indigenous households in public housing livingin overcrowded conditions, by remoteness (a), (b)
Calculated as the number of Indigenous households in public rental housing living in overcrowdedconditions as a proportion of all Indigenous households in public rental housing.
Data are based on the Canadian National Occupancy Standard for overcrowding, whereovercrowding is deemed to occur if one or more bedrooms are required to meet the standard.
.. Not applicable. – Nil or rounded to zero. np Not published.
HOUSINGINDIGENOUSCOMPENDIUM 2011

State owned and managed
Indigenous housing
HOUSINGINDIGENOUSCOMPENDIUM 2011

Tabl
e 16
A.3
Tabl
e 16
A.3
Uni
tN
SW
Vic
(c)
Qld
WA
SA
Tas
Tota
lTo
tal h
ouse
hold
s pa
ying
less
than
mar
ket,
at 3
0 Ju
neno
. 3
359
1 0
93 2
382
1 8
01 1
530
270
10
435
no.
3 3
52 1
049
2 2
64 1
703
1 5
69 2
66 1
0 20
3no
. 3
379
816
2 4
17 1
780
1 5
99 2
70 1
0 26
1no
. 3
304
139
2 6
27 1
690
1 6
49 2
70 9
679
no.
2 6
67..
2 8
58 1
626
1 6
14 2
78 9
043
Tota
l new
hou
seho
lds
assi
sted
, for
yea
r end
ing
30 J
une
2005
-06
no.
383
138
269
310
223
53
1 3
7620
06-0
7no
. 4
33 1
40 3
45 3
23 1
95 3
2 1
468
2007
-08
no.
400
47
314
302
189
42
1 2
9420
08-0
9no
. 3
03–
331
298
139
36
1 1
0720
09-1
0no
. 3
62..
314
226
141
26
1 0
69H
ouse
hold
s re
loca
ting
from
one
Sta
te o
wne
d an
d m
anag
ed In
dige
nous
hou
sing
dw
ellin
g to
ano
ther
, for
yea
r end
ing
30 J
une
2005
-06
no.
184
78
92
131
121
11
617
2006
-07
no.
153
57
99
114
87
4 5
1420
07-0
8no
. 1
33 1
4 1
03 1
13 6
6 1
1 4
4020
08-0
9no
. 1
21np
93
108
48
5 3
7520
09-1
0no
. 1
93..
96
129
62
21
501
Tota
l ren
t cha
rged
, for
yea
r end
ing
30 J
une
$'00
0 2
2 11
1 6
232
14
435
10
309
9 0
10 1
308
63
406
$'00
0 2
4 72
6 6
791
16
325
10
870
9 4
72 1
566
69
750
$'00
0 2
6 42
3 6
794
19
312
11
860
9 9
38 1
725
76
052
$'00
0 2
8 05
8na
20
604
12
503
10
439
1 6
70 7
3 27
4$'
000
35
581
.. 2
0 73
0 1
2 63
2 1
0 53
7 1
981
81
461
2007
2008
2009
2010
2008
2009
2006
2010
Stat
e ow
ned
and
man
aged
Indi
geno
us h
ousi
ng
Des
crip
tive
data
- St
ate
owne
d an
d m
anag
ed In
dige
nous
hou
sing
(a),
(b)
2006
2007
HO
US
ING
IND
IGE
NO
US
CO
MP
EN
DIU
M 2
011

Tabl
e 16
A.3
Tabl
e 16
A.3
Uni
tN
SW
Vic
(c)
Qld
WA
SA
Tas
Tota
l
Stat
e ow
ned
and
man
aged
Indi
geno
us h
ousi
ng
Des
crip
tive
data
- St
ate
owne
d an
d m
anag
ed In
dige
nous
hou
sing
(a),
(b)
Tota
l gre
ates
t nee
d ap
plic
ants
on
wai
ting
list,
incl
udin
g ap
plic
ants
for t
rans
fer a
t 30
June
2005
-06
no.
47
170
50
91
295
na 6
5320
06-0
7no
. 7
2 1
77 1
11 1
65 1
92–
717
2007
-08
no.
64
212
212
380
97
na 9
6520
08-0
9no
. 1
25 2
94 1
685
531
95
– 2
730
2009
-10
no.
494
.. 2
834
584
99
– 4
011
Tota
l app
lican
ts o
n w
aitin
g lis
t inc
ludi
ng a
pplic
ants
for t
rans
fer
2005
-06
no.
1 7
37 1
178
2 7
10 2
007
2 0
01 1
82 9
815
2006
-07
no.
1 6
28 1
085
3 8
49 2
135
1 9
50 1
88 1
0 83
520
07-0
8no
. 1
685
1 0
60 3
862
2 2
05 1
771
143
10
726
2008
-09
no.
1 7
07 1
293
2 9
03 2
645
1 8
30 1
50 1
0 52
820
09-1
0no
. 2
175
.. 4
661
2 8
02 1
812
185
11
635
Tota
l ten
anta
ble
dwel
lings
, at 3
0 Ju
neno
. 4
119
1 2
58 2
834
2 1
78 1
883
349
12
621
no.
4 2
24 1
290
2 9
27 2
193
1 8
79 3
42 1
2 85
5no
. 4
163
1 0
07 2
994
2 2
09 1
858
342
12
573
no.
4 1
69 1
98 3
069
2 1
64 1
828
344
11
772
no.
4 2
00–
3 1
77 2
102
1 8
75 3
44 1
1 69
8To
tal u
nten
anta
ble
dwel
lings
, at 3
0 Ju
neno
. 2
8 3
1 6
3 6
2–
3 1
87no
. 8
29
57
63
– 7
164
no.
6 1
1 5
4 6
0–
5 1
36no
.–
– 1
19 4
9 2
1 2
191
no.
1–
119
58
8 5
191
2010
2006
2007
2008
2009
2010
2006
2007
2008
2009
HO
US
ING
IND
IGE
NO
US
CO
MP
EN
DIU
M 2
011

Tabl
e 16
A.3
Tabl
e 16
A.3
Uni
tN
SW
Vic
(c)
Qld
WA
SA
Tas
Tota
l
Stat
e ow
ned
and
man
aged
Indi
geno
us h
ousi
ng
Des
crip
tive
data
- St
ate
owne
d an
d m
anag
ed In
dige
nous
hou
sing
(a),
(b)
Tota
l num
ber o
f dw
ellin
gs u
nder
goin
g m
ajor
rede
velo
pmen
t, at
30
June
no.
– 2
19
32
32
– 8
5no
. 2
9 1
3 3
1 2
4–
79
no.
– 6
3 3
9 2
1–
69
no.
––
5 6
2 2
4 2
93
no.
–..
22
27
14
– 6
3To
tal d
wel
lings
, at 3
0 Ju
ne no.
4 1
47 1
291
2 9
16 2
272
1 9
15 3
52 1
2 89
3no
. 4
234
1 3
28 2
997
2 2
87 1
903
349
13
098
no.
4 1
69 1
024
3 0
51 2
308
1 8
79 3
47 1
2 77
8no
. 4
169
198
3 1
93 2
275
1 8
73 3
48 1
2 05
6no
. 4
201
.. 3
318
2 1
87 1
897
349
11
952
Tota
l occ
upie
d dw
ellin
gs, a
t 30
June
no.
4 0
41 1
248
2 8
22 2
138
1 7
91 3
46 1
2 38
6no
. 4
135
1 2
80 2
914
2 1
62 1
790
341
12
622
no.
4 1
04 1
002
2 9
80 2
171
1 7
78 3
39 1
2 37
4no
. 4
083
198
3 0
48 2
152
1 7
58 3
43 1
1 58
2no
. 4
123
.. 3
147
2 0
88 1
753
341
11
452
Tota
l ren
ts c
harg
ed fo
r wee
k of
30
June
$'00
0 4
24 1
25 2
77 2
01 1
73 3
3 1
233
$'00
0 4
54 1
40 3
53 2
18 1
85 3
1 1
381
$'00
0 4
77 1
12 3
87 2
34 1
91 3
5 1
437
$'00
0 5
05 2
6 4
09 2
44 1
96 3
8 1
417
$'00
0 6
65..
394
246
202
41
1 5
47
2010
2006
2007
2008
2009
2010
2006
2007
2008
2009
2006
2007
2008
2009
2010
2010
2006
2007
2008
2009
HO
US
ING
IND
IGE
NO
US
CO
MP
EN
DIU
M 2
011

Tabl
e 16
A.3
Tabl
e 16
A.3
Uni
tN
SW
Vic
(c)
Qld
WA
SA
Tas
Tota
l
Stat
e ow
ned
and
man
aged
Indi
geno
us h
ousi
ng
Des
crip
tive
data
- St
ate
owne
d an
d m
anag
ed In
dige
nous
hou
sing
(a),
(b)
Tota
l mar
ket r
ent v
alue
of a
ll dw
ellin
gs fo
r whi
ch re
nt w
as c
harg
ed fo
r wee
k of
30
June
$'00
0 7
87 2
34 5
15 3
49 3
03 5
9 2
246
$'00
0 8
08 2
44 6
11 3
51 3
24 5
0 2
389
$'00
0 8
79 1
91 7
05 4
08 3
46 5
4 2
584
$'00
0 9
20 3
9 8
04 4
06 3
76 6
1 2
607
$'00
0 9
47..
847
396
402
69
2 6
61To
tal d
wel
lings
in m
ajor
citi
es, a
t 30
June
(d)
no.
1 7
00 4
94 3
82 6
49 1
163
– 4
389
no.
1 7
14 5
02 4
16 6
49 1
158
– 4
439
no.
1 7
11 3
02 4
52 6
44 1
140
– 4
247
no.
1 7
21 6
8 4
58 6
35 1
139
.. 4
021
no.
1 7
59..
459
612
1 1
32..
3 9
62To
tal d
wel
lings
in in
ner r
egio
nal a
reas
, at 3
0 Ju
ne (d
)no
. 1
329
478
434
179
148
289
2 8
58no
. 1
361
496
458
181
149
287
2 9
31no
. 1
379
421
592
177
140
289
2 9
99no
. 1
369
59
610
177
140
290
2 6
45no
. 1
364
.. 6
23 1
75 1
42 2
91 2
595
Tota
l dw
ellin
gs in
out
er re
gion
al a
reas
, at 3
0 Ju
ne (d
)no
. 8
32 3
14 1
302
499
340
63
3 3
50no
. 8
73 3
26 1
327
487
336
62
3 4
11no
. 8
44 2
96 1
215
477
337
58
3 2
26no
. 8
44 7
1 1
258
478
337
58
3 0
46no
. 8
38..
1 3
19 4
60 3
34 5
8 3
009
2008
2009
2010
2009
2010
2006
2007
2010
2006
2007
2008
2006
2007
2008
2009
2009
2010
2006
2007
2008
HO
US
ING
IND
IGE
NO
US
CO
MP
EN
DIU
M 2
011

Tabl
e 16
A.3
Tabl
e 16
A.3
Uni
tN
SW
Vic
(c)
Qld
WA
SA
Tas
Tota
l
Stat
e ow
ned
and
man
aged
Indi
geno
us h
ousi
ng
Des
crip
tive
data
- St
ate
owne
d an
d m
anag
ed In
dige
nous
hou
sing
(a),
(b)
Tota
l dw
ellin
gs in
rem
ote
area
s, a
t 30
June
(d)
no.
215
5 3
00 4
57 1
14–
1 0
92no
. 2
16 5
298
466
113
– 1
099
no.
206
5 3
02 4
66 1
01–
1 0
80no
. 2
05–
338
461
98
– 1
102
no.
208
.. 3
38 4
54 9
8–
1 0
98To
tal d
wel
lings
in v
ery
rem
ote
area
s, a
t 30
June
(d)
no.
64
.. 4
98 4
87 1
50–
1 1
98no
. 6
4..
498
504
147
– 1
212
no.
31
.. 4
90 5
45 1
61–
1 2
27no
. 3
1..
529
525
159
– 1
244
no.
31
.. 5
79 4
85 1
91–
1 2
86To
tal h
ouse
hold
s, a
t 30
June
no.
4 0
41 1
248
2 8
22 2
138
1 7
91 3
46 1
2 38
6no
. 4
135
1 2
80 2
925
2 1
51 1
790
341
12
622
no.
4 1
04 1
002
2 9
80 2
172
1 7
78 3
39 1
2 37
5no
. 4
083
198
3 0
48 2
152
1 7
58 3
43 1
1 58
2no
. 4
122
.. 3
147
2 0
88 1
753
341
11
451
(a)
(b)
(c)
2009
2010
2010
2006
2007
2008
2006
2007
2008
2009
2007
2008
2009
2010
2006
Dat
am
ayno
tbe
com
para
ble
acro
ssju
risdi
ctio
nsan
dov
ertim
ean
dco
mpa
rison
sco
uld
bem
isle
adin
g.Fu
rther
info
rmat
ion
abou
tthe
data
inth
ista
ble
can
befo
und
at w
ww
.pc.
gov.
au/g
sp/re
ports
/rogs
/201
1.
Due
toro
undi
ngth
ena
tiona
ltot
alfo
r(1
)to
tald
wel
lings
inm
ajor
citie
s,in
ner
and
oute
rre
gion
al,
rem
ote
and
very
rem
ote
Aust
ralia
and
mig
rato
ryar
eas
and
open
ing
and
clos
ing
rent
debt
ors
and
(2)
tota
lren
tsch
arge
dan
dto
talm
arke
tren
tval
ueof
dwel
lings
for
whi
cha
rent
was
char
ged,
may
note
qual
the
sum
ofju
risdi
ctio
ns’ d
ata
item
s.
Vict
oria
ndw
ellin
gsm
anag
edin
the
SOM
IHpr
ogra
mha
vebe
entra
nsfe
rred
toot
her
prog
ram
sas
part
ofth
etra
nsiti
onto
inde
pend
ence
for
Abor
igin
alH
ousi
ngVi
ctor
ia. T
here
wer
e no
SO
MIH
dw
ellin
gs in
Vic
toria
at 3
0 Ju
ne 2
010.
HO
US
ING
IND
IGE
NO
US
CO
MP
EN
DIU
M 2
011

Tabl
e 16
A.3
Tabl
e 16
A.3
Uni
tN
SW
Vic
(c)
Qld
WA
SA
Tas
Tota
l
Stat
e ow
ned
and
man
aged
Indi
geno
us h
ousi
ng
Des
crip
tive
data
- St
ate
owne
d an
d m
anag
ed In
dige
nous
hou
sing
(a),
(b)
(d)
Base
d on
the
Aust
ralia
n St
anda
rd G
eogr
aphi
cal C
lass
ifica
tion
rem
oten
ess
area
stru
ctur
e.
AIH
W (2
006,
200
8, 2
009)
CS
HA
nat
iona
l dat
a re
port
; AIH
W (2
010,
201
1) H
ousi
ng a
ssis
tanc
e ta
bles
; 201
1 R
epor
t, ta
ble
16A.
16.
Sou
rce
: na
Not
ava
ilabl
e. ..
Not
app
licab
le. –
Nil
or ro
unde
d to
zer
o. n
p N
ot p
ublis
hed.
HO
US
ING
IND
IGE
NO
US
CO
MP
EN
DIU
M 2
011

Table 16A.4
Table 16A.4
NSW Vic (b) Qld WA SA Tas Total2005-06 48.8 42.8 46.8 53.2 45.3 62.3 48.82006-07 47.6 52.9 47.0 44.6 45.6 65.6 47.42007-08 46.0 44.7 50.6 46.4 42.9 61.9 47.22008-09 53.5 na 51.4 39.6 41.7 75.0 48.32009-10 52.2 .. 56.7 38.5 55.3 61.5 51.3
(a)
(b)
Source : AIHW (2006, 2008, 2009) CSHA national data report ; AIHW (2010, 2011) Housing assistancetables ; 2011 Report, table 16A.17.
na Not available. .. Not applicable.
State owned and managed Indigenous housing
Proportion of new tenancies allocated to households with specialneeds (per cent) (a)
Data may not be over time and comparisons could be misleading. Further information about the data inthis table can be found at www.pc.gov.au/gsp/reports/rogs/2011.
Victorian dwellings managed in the SOMIH program have been transferred to other programs as part ofthe transition to independence for Aboriginal Housing Victoria. There were no SOMIH dwellings inVictoria at 30 June 2010.
HOUSINGINDIGENOUSCOMPENDIUM 2011

Table 16A.5
Table 16A.5
NSW Vic (b) Qld WA SA Tas Total
Total for year ending 30 June 2006Proportion of new allocations to those in greatest need in:< 3 months 17.5 28.6 22.6 37.9 71.7 na 36.8
3 months to < 6 months 11.9 35.7 40.0 72.5 100.0 na 41.7
6 months to <1 year 1.6 27.3 14.8 23.7 85.7 na 25.1
1 year to < 2 years 5.2 31.3 4.8 – 88.6 na 20.7
2+ years – – 3.3 – 72.2 na 5.5
Overall total 8.2 23.9 11.9 28.4 79.4 na 26.3
Total for year ending 30 June 2007Proportion of new allocations to those in greatest need in:Under 3 months 17.5 34.4 32.1 32.2 78.8 na 33.33 < 6 months 15.5 50.0 56.3 50.0 88.2 na 40.26 months to < 1 year 10.2 14.3 37.3 41.3 89.7 na 36.41 < 2 years 3.1 11.1 14.3 15.9 66.7 na 19.22+ years – 2.1 4.1 – 59.6 na 8.8Overall total 10.5 19.3 20.2 28.2 74.4 na 25.8
Total for year ending 30 June 2008Proportion of new allocations to those in greatest need in:Under 3 months 23.6 35.7 50.0 32.5 83.0 na 42.03 < 6 months 11.7 11.1 50.0 68.4 70.0 na 37.06 months to < 1 year 12.7 50.0 53.8 62.7 66.7 na 37.61 < 2 years – 12.5 18.8 20.0 70.4 na 22.02+ years – – 5.4 – 39.5 na 7.7Overall total 12.9 17.0 29.9 34.9 69.3 na 30.2
Total for year ending 30 June 2009Proportion of new allocations to those in greatest need in:Under 3 months 32.9 na 85.8 20.0 80.0 na 55.63 < 6 months 20.6 na 87.8 67.4 100.0 na 55.96 months to < 1 year 11.8 na 80.4 65.9 80.0 na 51.41 < 2 years 5.6 na 85.0 56.0 61.1 na 50.72+ years – na 94.7 8.5 18.5 na 27.9Overall total 14.9 na 86.7 37.5 67.6 na 48.6
State owned and managed Indigenous housing
Greatest need allocations as a proportion of all new allocations (percent) (a)
HOUSINGINDIGENOUSCOMPENDIUM 2011

Table 16A.5
Table 16A.5
NSW Vic (b) Qld WA SA Tas Total
State owned and managed Indigenous housing
Greatest need allocations as a proportion of all new allocations (percent) (a)
Total for year ending 30 June 2010Proportion of new allocations to those in greatest need in:Under 3 months 46.2 .. 75.3 36.1 93.1 na 62.03 < 6 months 57.4 .. 84.5 88.9 85.7 na 74.26 months to < 1 year 36.7 .. 70.7 73.2 100.0 na 59.71 < 2 years 14.1 .. 73.2 64.7 83.3 na 49.72+ years 23.6 .. 78.6 13.0 66.7 na 27.4Overall total 34.8 .. 75.8 48.0 88.7 na 55.9
(a)
(b)
Data may not be comparable across jurisdictions and over time and comparisons could be misleading.Further information about the data in this table can be found at www.pc.gov.au/gsp/reports/rogs/2011.
AIHW (2006, 2008, 2009) CSHA national data report ; AIHW (2010, 2011) Housing assistancetables ; 2011 Report, table 16A.18.
Source : na Not available. – Nil or rounded to zero. .. Not applicable
Victorian dwellings managed in the SOMIH program have been transferred to other programs as part ofthe transition to independence for Aboriginal Housing Victoria. There were no SOMIH dwellings inVictoria at 30 June 2010.
HOUSINGINDIGENOUSCOMPENDIUM 2011

Table 16A.6
Table 16A.6NSW Vic (c) Qld WA SA Tas Total
Net recurrent cost of providing assistance (excluding the cost of capital) per dwelling2005-06 6 252 7 235 7 672 8 845 8 078 6 470 7 4062006-07 6 457 4 526 8 292 8 465 7 407 7 136 7 1882007-08 6 619 5 238 8 650 11 399 10 109 6 912 8 5162008-09 7 145 4 494 9 138 9 100 10 760 7 235 8 5952009-10 9 152 .. 9 211 9 058 13 079 7 163 9 657
(a)
(b)
(c) Victorian dwellings managed in the SOMIH program have been transferred to other programs as part ofthe transition to independence for Aboriginal Housing Victoria. There were no SOMIH dwellings inVictoria at 30 June 2010.
Data may not be comparable across jurisdictions and over time and comparisons could be misleading.
State owned and managed Indigenous housing
Net recurrent cost per dwelling (2009-10 dollars) (a), (b)
Source : State governments (unpublished); table AA.11; 2011 Report, table 16A.19.
Data are presented in current prices based on the Australian Bureau of Statistics (ABS) Gross DomesticProduct price deflator (index) (2009-10 = 100) table AA.11.
.. Not applicable.
HOUSINGINDIGENOUSCOMPENDIUM 2011

Table 16A.7
State owned and managed Indigenous housing
Table 16A.7NSW Vic (b) Qld WA SA Tas Total
Proportion of State owned and managed Indigenous housing dwellings occupied 98.0 95.4 94.0 96.0 94.3 93.1 95.8 97.9 96.6 94.6 95.2 91.2 92.7 95.4 97.6 96.1 94.2 94.4 91.8 95.8 95.2 98.0 96.7 96.8 94.1 92.2 98.2 96.0 97.4 95.8 96.1 94.2 91.8 97.7 95.5 97.4 96.7 96.8 94.1 93.5 98.3 96.1 97.7 96.4 97.2 94.5 94.1 97.7 96.4 98.4 97.9 97.7 94.1 94.6 97.7 96.8 97.9 100.0 95.5 94.6 93.9 98.6 96.1 98.1 .. 94.8 95.5 92.4 97.7 95.8
(a)
(b)
Occupancy rates as at 30 June (per cent) (a)
20062007
2005
2001200220032004
.. Not applicable.AIHW (2006, 2008, 2009) CSHA national data report ; AIHW (2010, 2011) Housing assistancetables ; 2011 Report, table 16A.20.
200820092010
Data may not be comparable across jurisdictions and over time and comparisons could be misleading.Further information about the data in this table can be found at www.pc.gov.au/gsp/reports/rogs/2011.
Source :
Victorian dwellings managed in the SOMIH program have been transferred to other programs as part ofthe transition to independence for Aboriginal Housing Victoria. There were no SOMIH dwellings inVictoria at 30 June 2010.
HOUSINGINDIGENOUSCOMPENDIUM 2011

Table 16A.8
Table 16A.8NSW Vic (b) Qld WA SA Tas Total
2005-06 36.0 40.6 35.5 25.8 46.7 42.4 36.02006-07 36.6 33.6 35.0 51.5 49.1 42.9 40.72007-08 28.2 44.3 34.2 40.2 40.8 45.2 35.12008-09 22.6 na 42.0 43.3 33.2 32.6 36.22009-10 28.1 .. 43.6 21.3 29.1 40.7 30.5
(a)
(b)
State owned and managed Indigenous housing
Average turnaround times for vacant stock (days) (a)
Data may not be comparable across jurisdictions and over time and comparisons could be misleading.Further information about the data in this table can be found at www.pc.gov.au/gsp/reports/rogs/2011.
Source : AIHW (2006, 2008, 2009) CSHA national data report ; AIHW (2010, 2011) Housing assistancetables ; 2011 Report, table 16A.21.
Victorian dwellings managed in the SOMIH program have been transferred to other programs as part ofthe transition to independence for Aboriginal Housing Victoria. There were no SOMIH dwellings inVictoria at 30 June 2010.
.. Not applicable. na Not available.
HOUSINGINDIGENOUSCOMPENDIUM 2011

Table 16A.9
Table 16A.9NSW Vic (d) Qld WA SA Tas Total
2005-06 100.5 99.7 99.7 104.3 94.7 103.8 100.02006-07 101.8 97.3 97.3 105.3 103.0 102.1 100.62007-08 96.8 99.6 99.6 104.3 103.7 99.8 99.02008-09 99.8 97.2 97.2 103.6 99.7 99.0 99.72009-10 101.5 .. 101.5 104.5 100.7 101.7 101.8
(a)
(b)
(c)
(d)
State governments (unpublished); 2011 Report, table 16A.22.
Victorian dwellings managed in the SOMIH program have been transferred to other programs as part ofthe transition to independence for Aboriginal Housing Victoria. There were no SOMIH dwellings inVictoria at 30 June 2010.
State owned and managed Indigenous housing
Rent collection rate (per cent) (a), (b), (c)
Source :
Due to rounding the national total for total rent collected from tenants and total rent charged to tenantsmay not equal the sum of jurisdictions’ data items.
Payment arrangements for rent in some jurisdictions mean that rent collected over a 12-month periodmay be higher than rent charged over that period.
.. Not applicable.
Data may not be comparable across jurisdictions and over time and comparisons could be misleading.
HOUSINGINDIGENOUSCOMPENDIUM 2011

Tabl
e 16
A.10
Tabl
e 16
A.1
0
Uni
tN
SW
Vic
Qld
WA
SA
Tas
Tota
l%
75.
3 7
7.9
82.
6 7
7.8
77.
2 7
9.6
78.
1S
tand
ard
erro
r (am
enity
)%
2.4
4.6
2.9
3.1
2.9
4.3
1.3
% 8
7.1
91.
4 9
1.6
86.
3 8
9.1
89.
6 8
8.7
Stan
dard
err
or (l
ocat
ion)
% 2
.0 3
.3 2
.4 2
.9 2
.4 3
.8 1
.1C
usto
mer
Sat
isfa
ctio
nSa
mpl
e si
zeno
. 3
87 8
7 2
04 2
16 2
54 1
00 1
259
Perc
enta
ge o
f ten
ants
that
wer
e:Ve
ry s
atis
fied
% 1
5.0
14.
8 3
4.4
15.
3 1
1.9
15.
2 1
9.0
Satis
fied
% 4
3.6
50.
0 4
0.4
44.
9 4
6.0
57.
6 4
4.5
Dis
satis
fied
% 2
8.2
23.
8 1
2.6
24.
6 2
5.0
24.
2 2
3.0
Sta
ndar
d er
ror
% 2
.5 4
.8 3
.0 3
.3 3
.1 4
.5 1
.4
(a)
Amen
ity, l
ocat
ion
and
cust
omer
sat
isfa
ctio
n w
ith S
OM
IH, 2
007
(a)
Stat
e ow
ned
and
man
aged
Indi
geno
us h
ousi
ng
Sou
rce
:
Prop
ortio
n of
tent
ants
ratin
g am
enity
as
impo
rtant
Prop
ortio
n of
tent
ants
ratin
g lo
catio
n as
impo
rtant
The
sam
ple
size
sfo
rcu
stom
ersa
tisfa
ctio
nre
flect
the
num
ber
ofun
wei
ghte
dva
lidre
spon
ses
and
are
ther
efor
edi
ffere
ntto
thos
epr
ovid
edfo
ram
enity
/loca
tion.
For m
ore
info
rmat
ion
on e
rror
s an
d da
ta c
avea
ts, s
ee w
ww
.aih
w.g
ov.a
u/ho
usin
g/ns
hs/p
ublic
_and
_Ind
igen
ous_
hous
ing.
cfm
>.
AIH
W (2
009)
CS
HA
Nat
iona
l Dat
a R
epor
t; 2
011
Rep
ort,
tabl
e 16
A.23
.
HO
US
ING
IND
IGE
NO
US
CO
MP
EN
DIU
M 2
011

Table 16A.11
Table 16A.11
Unit NSW Vic (c) Qld WA SA Tas Total
$ 105 102 98 81 84 86 95$ 95 90 98 68 87 60 89$ 126 103 140 104 103 78 119$ 127 93 152 97 111 89 125$ 106 .. 159 93 124 99 123
(a)
(b)
(c)
State owned and managed Indigenous housing
Average weekly subsidy per rebated household, at 30 June (2009-10dollars) (a), (b)
Victorian dwellings managed in the SOMIH program have been transferred to other programs as part ofthe transition to independence for Aboriginal Housing Victoria. There were no SOMIH dwellings inVictoria at 30 June 2010.
Source :
2010
2006
.. Not applicable
200720082009
Data are presented in current prices based on the Australian Bureau of Statistics (ABS) GrossDomestic Product price deflator (index) (2009-10 = 100) table AA.11.
Data may not be comparable across jurisdictions and over time and comparisons could be misleading.
AIHW (2009) CSHA national data report ; 2011 Report, table 16A.24.
HOUSINGINDIGENOUSCOMPENDIUM 2011

Table 16A.12
Table 16A.12Unit NSW Qld WA SA Tas Total
Number of low income households in SOMIHno. 2 633 2 912 2 021 1 603 323 9 492
Low income households as a proportion of all households in SOMIH% 98.7 92.7 96.9 91.5 94.5 95.0
(a)(b)
(c)Source : AIHW (2011) Housing Assistance tables 2011 ; 2011 Report, table 16A.25.
2010
2010
Low income households are those in the bottom 40 per cent of equivalised household disposable income.
There is no SOMIH in Victoria, the ACT or NT.
Further information about the data in this table can be found at www.pc.gov.au/gsp/reports/rogs/2011.
State owned and managed Indigenous housing
Low income households in SOMIH, at 30 June (a), (b), (c)
HOUSINGINDIGENOUSCOMPENDIUM 2011

Table 16A.13
Table 16A.13
Unit NSW Qld WA SA Tas Total% 0.1 – 2.0 2.2 – 0.8
(a)
(b)
(c)
2010
State owned and managed Indigenous housing
Proportion of low income households in SOMIH spending morethan 30 per cent of their income in rent, at 30 June (a), (b), (c)
Further information about the data in this table can be found at www.pc.gov.au/gsp/reports/rogs/2011.
Source : AIHW (2011) Housing Assistance tables 2011 ; 2011 Report, table 16A.26. – Nil or rounded to zero.
Low income households are those in the bottom 40 per cent of equivalised household disposableincome.
There is no SOMIH in Victoria, the ACT or NT.
HOUSINGINDIGENOUSCOMPENDIUM 2011

Table 16A.14
Table 16A.14
NSW Vic (c) Qld WA SA Tas Total 3.4 2.7 9.2 11.7 5.9 2.1 6.6 2.9 4.3 10.2 7.2 6.3 2.8 6.2 3.1 4.9 11.3 7.8 6.5 1.9 6.8 3.6 2.9 10.9 7.8 7.2 2.7 7.1 3.3 .. 14.6 12.3 11.0 4.9 10.2
(a)
(b)(c)
Further information about the data in this table can be found at www.pc.gov.au/gsp/reports/rogs/2011.Victorian dwellings managed in the SOMIH program have been transferred to other programs as part ofthe transition to independence for Aboriginal Housing Victoria. There were no SOMIH dwellings inVictoria at 30 June 2010.
.. Not applicable.
Source : AIHW (2006, 2008, 2009) CSHA national data report ; AIHW (2010, 2011) Housing assistancetables ; 2011 Report, table 16A.27.
State owned and managed Indigenous housing
Proportion of overcrowded households at 30 June (per cent) (a), (b)
Data are not comparable over time. Data for 2010 are based on the Canadian National OccupancyStandard (where one or more bedrooms are required to meet the standard), while data prior to 2010 arebased on a proxy standard (where two or more bedrooms are required to meet the standard).Overcrowding will be higher under the CNOS than for the proxy standard.
20062007200820092010
HOUSINGINDIGENOUSCOMPENDIUM 2011

Table 16A.15
Table 16A.15
Unit NSW Qld WA SA Tas Total2009-10
Major cities % 6.9 14.1 12.6 10.7 .. 9.7Inner regional % 8.0 10.7 13.3 8.5 6.4 8.9Outer regional % 7.2 15.2 10.1 np np 11.7Remote % 8.5 13.7 11.6 11.5 0.0 11.6Very remote % np 21.5 14.3 np 0.0 17.5
(a)
(b)
Source : AIHW (2010) derived from National Housing Assistance Data Respository ; 2011 Report, table16A.28.
State owned and managed Indigenous housing
Proportion of Indigenous households in SOMIH living inovercrowded conditions, by remoteness (a), (b)
Calculated as the number of Indigenous households in SOMIH living in overcrowded conditions as aproportion of all Indigenous households in SOMIH.
np Not published. .. Not applicable. – Nil or rounded to zero. There is no SOMIH in Victoria, the ACT or the NT.
HOUSINGINDIGENOUSCOMPENDIUM 2011

Community housing
HOUSINGINDIGENOUSCOMPENDIUM 2011

Tabl
e 16
A.16
Tabl
e 16
A.1
6U
nit
NS
WV
ic
Qld
WA
SA
Ta
s A
CT
NT
Aus
t (b
)To
tal n
ew h
ouse
hold
s as
sist
ed, f
or y
ear e
ndin
g 30
Jun
e20
05-0
6no
. 2
518
893
1 6
37 4
87 5
94 5
9 3
01na
6 4
8920
06-0
7no
. 3
218
1 1
35 2
541
826
646
90
285
na 8
741
2007
-08
no.
3 4
37 1
480
1 8
22 7
15 8
79 4
9 3
46na
8 7
2820
08-0
9no
. 3
339
2 1
69 2
200
1 2
31 5
62 1
15 2
94na
9 9
1020
09-1
0no
. 4
728
3 7
69 2
162
1 5
68 2
76 9
8 2
33na
12
834
Tota
l new
Indi
geno
us h
ouse
hold
s as
sist
ed, f
or y
ear e
ndin
g 30
Jun
e20
05-0
6no
. 1
95 3
2 1
71 4
5 2
3 3
12
na 4
8120
06-0
7no
. 2
33 2
0 2
94 7
6 1
9 6
13
na 6
6120
07-0
8no
. 2
36 4
16 2
37 5
6 1
4 3
13
na 9
7520
08-0
9no
. 2
67 2
47 2
84 9
8 1
8np
6na
920
2009
-10
no.
392
362
214
148
14
npnp
na 1
143
Tota
l ren
ts c
harg
ed fo
r yea
r end
ing
30 J
une
2004
-05
$'00
0 4
6 92
6 1
1 16
6 2
1 62
6 1
1 52
0 1
7 91
6 2
058
984
na 1
12 1
9620
05-0
6$'
000
55
800
21
216
24
833
14
237
20
897
2 3
91 1
109
na 1
40 4
8420
06-0
7$'
000
60
707
29
375
26
118
17
189
22
454
2 3
99 2
079
na 1
60 3
2220
07-0
8$'
000
67
013
43
094
29
961
11
877
24
510
2 0
09 4
248
na 1
82 7
1220
08-0
9$'
000
98
553
51
471
32
145
16
535
26
640
2 5
29 2
638
na 2
30 5
11To
tal I
ndig
enou
s ho
useh
olds
, at 3
0 Ju
neno
. 6
61 5
6 7
25 1
21 6
5 1
1 2
4na
1 6
63no
. 9
28 3
6 5
82 1
37 5
8 8
24
na 1
773
no.
935
499
615
151
59
10
29
na 2
298
no.
1 2
80 4
86 6
40 1
74 6
6 6
28
na 2
680
no.
1 3
94 8
54 5
42 2
38 9
6 5
24
na 3
153
2009
2010
2006
2007
2008
Des
crip
tive
data
- co
mm
unity
hou
sing
(a)
Com
mun
ity h
ousi
ng
HO
US
ING
IND
IGE
NO
US
CO
MP
EN
DIU
M 2
011

Tabl
e 16
A.16
Tabl
e 16
A.1
6U
nit
NS
WV
ic
Qld
WA
SA
Ta
s A
CT
NT
Aus
t (b
)D
escr
iptiv
e da
ta -
com
mun
ity h
ousi
ng (a
)
Com
mun
ity h
ousi
ng
Tota
l num
ber o
f new
app
lican
ts w
ho h
ave
grea
test
nee
d, a
t 30
June
no.
7 3
43 8
52 8
186
1 4
32 1
155
287
230
na 1
9 48
5no
. 7
184
936
na 1
514
1 1
75 3
24na
na 1
1 13
3no
. 8
064
1 4
08 1
532
1 0
83 1
190
286
265
na 1
3 82
8no
. 1
0 22
0 3
662
5 0
25 1
781
1 1
67 2
93 8
7na
22
235
no.
na 5
611
14
440
495
755
398
161
na 2
1 86
0To
tal a
pplic
ants
on
wai
ting
list,
at 3
0 Ju
neno
. 1
8 22
0 9
83 1
0 77
4 2
514
3 8
35 4
04 2
53na
36
983
no.
15
436
1 7
19na
3 6
82 3
857
478
332
na 2
5 50
4no
. 1
5 60
3 2
890
9 9
01 3
617
4 3
07 3
60 2
68na
36
946
no.
20
504
8 6
75 1
1 54
3 3
158
4 6
51 4
75 1
81na
49
187
no.
na 1
2 56
2 1
9 95
8 1
899
1 5
73 5
35 1
62na
36
689
Tota
l ten
anta
ble
tena
ncy
rent
al u
nits
, at 3
0 Ju
neno
. 1
1 48
7 4
295
5 3
88 2
333
4 3
48 4
67 7
45 8
7 2
9 15
0no
. 1
3 96
1 4
564
6 2
10 3
285
4 4
05 4
97 7
93 9
2 3
3 80
7no
. 1
5 31
1 5
125
6 4
80 3
074
4 5
39 3
87 7
40 9
3 3
5 74
9no
. 1
6 03
7 7
747
6 9
72 2
852
4 4
63 4
07 6
61 1
31 3
9 27
0no
. 1
7 74
4 8
473
7 0
95 3
756
4 6
51 6
10 4
68 1
45 4
2 94
2To
tal u
nten
anta
ble
tena
ncy
rent
al u
nits
, at 3
0 Ju
neno
. 5
7 8
1 5
4 2
3 9
2 1
16
– 3
24no
. 1
79 1
84 6
5 2
5 5
5 2
12
– 5
22no
. 8
6 1
25 7
0 3
7 9
– 6
– 3
33no
. 1
04 2
08 5
4 9
8 6
8 3
12
– 5
47no
. 1
54 3
68 1
02 1
03 8
1 8
2–
818
2007
2008
2009
2010
2006
2006
2007
2008
2009
2010
2006
2007
2008
2009
2010
2006
2007
2008
2009
2010
HO
US
ING
IND
IGE
NO
US
CO
MP
EN
DIU
M 2
011

Tabl
e 16
A.16
Tabl
e 16
A.1
6U
nit
NS
WV
ic
Qld
WA
SA
Ta
s A
CT
NT
Aus
t (b
)D
escr
iptiv
e da
ta -
com
mun
ity h
ousi
ng (a
)
Com
mun
ity h
ousi
ng
Tota
l ten
ancy
rent
al u
nits
, at 3
0 Ju
neno
. 1
1 54
4 4
458
5 4
42 2
974
3 9
55 4
68 7
65 8
7 2
9 69
3no
. 1
4 14
0 4
593
6 2
75 3
869
4 3
73 5
29 8
01 9
2 3
4 67
2no
. 1
5 39
7 5
250
6 5
50 3
111
4 5
48 3
87 7
43 9
3 3
6 07
9no
. 1
6 14
1 7
930
7 0
26 2
987
4 4
73 4
10 6
72 1
31 3
9 77
0no
. 1
8 46
6 8
841
7 1
97 3
859
4 7
32 6
18 4
70 1
45 4
4 32
8To
tal o
ccup
ied
tena
ncy
rent
al u
nits
, at 3
0 Ju
neno
. 1
1 35
8 4
176
5 2
92 2
800
3 8
17 4
67 6
87 8
7 2
8 68
4no
. 1
3 74
3 4
436
6 0
60 3
718
4 2
32 5
21 7
24 9
2 3
3 52
6no
. 1
5 15
0 5
009
6 3
56 2
980
4 3
70 3
87 6
98 9
3 3
5 04
3no
. 1
5 85
8 7
531
6 9
76 2
650
4 3
29 4
06 6
43 1
31 3
8 52
4no
. 1
8 23
3 8
262
6 8
55 3
561
4 4
64 5
89 4
50 1
45 4
2 55
9To
tal r
ents
cha
rged
for w
eek
endi
ng 3
0 Ju
ne$'
000
1 3
52 3
04 7
53 1
43 3
68 3
4 5
2 6
3 0
12$'
000
1 3
83 5
22 2
4 1
78 4
13 2
7 6
3 6
2 6
15$'
000
1 4
45 6
57 1
68 1
81 4
61 3
9 5
7 6
3 0
14$'
000
1 9
00 1
019
186
294
483
39
56
8 3
986
$'00
0 2
408
797
205
383
472
26
35
8 4
333
Tota
l ten
ancy
rent
al u
nits
in m
ajor
citi
es, a
t 30
June
no.
8 6
85 3
186
2 0
31 1
020
3 7
31..
765
.. 1
9 41
8no
. 9
919
3 3
28 2
772
2 5
76 3
737
.. 7
98..
23
130
no.
10
529
5 1
00 3
000
2 7
51 3
889
.. 7
43..
26
012
no.
10
679
6 2
07 2
942
3 4
91 3
850
.. 6
70..
27
839
no.
12
044
6 8
68 3
385
4 0
09 4
123
.. 6
80..
31
109
2006
2007
2008
2009
2010
2006
2007
2008
2009
2010
2006
2007
2008
2009
2010
2006
2007
2008
2009
2010
HO
US
ING
IND
IGE
NO
US
CO
MP
EN
DIU
M 2
011

Tabl
e 16
A.16
Tabl
e 16
A.1
6U
nit
NS
WV
ic
Qld
WA
SA
Ta
s A
CT
NT
Aus
t (b
)D
escr
iptiv
e da
ta -
com
mun
ity h
ousi
ng (a
)
Com
mun
ity h
ousi
ng
Tota
l ten
ancy
rent
al u
nits
in in
ner r
egio
nal a
reas
, at 3
0 Ju
neno
. 3
029
1 0
55 1
356
484
364
298
–..
6 5
86no
. 3
397
1 0
81 1
441
479
411
275
–..
7 0
84no
. 3
421
1 3
65 1
521
543
367
393
....
7 6
10no
. 3
674
1 8
13 1
608
632
409
382
2..
8 5
20no
. 4
482
1 9
86 1
604
716
404
828
2..
10
022
Tota
l ten
ancy
rent
al u
nits
in o
uter
regi
onal
are
as, a
t 30
June
no.
941
196
1 4
66 2
50 1
93 1
67..
62
3 2
75no
. 7
64 1
70 1
462
502
197
250
.. 6
4 3
409
no.
1 1
42 2
21 1
383
652
215
185
.. 6
7 3
865
no.
1 3
36 3
33 1
798
674
206
212
.. 8
4 4
643
no.
1 4
46 3
45 1
538
740
222
372
.. 8
5 4
748
Tota
l ten
ancy
rent
al u
nits
in re
mot
e ar
eas,
at 3
0 Ju
neno
. 1
4 1
4 2
31 1
09 5
6 3
.. 1
8 4
45no
. 6
0 1
3 2
32 2
51 5
6 1
1..
22
645
no.
23
12
265
399
63
19
.. 2
0 8
01no
. 2
8 1
3 2
24 4
23 6
2 9
.. 4
2 8
01no
. 2
8 1
5 2
72 4
41 6
0 1
9..
55
890
Tota
l ten
ancy
rent
al u
nits
in v
ery
rem
ote
area
s, a
t 30
June
no.
4..
358
6 4
–..
7 3
79no
.–
.. 3
68 6
0 4
–..
6 4
38no
. 4
.. 3
80 1
29 4
–..
6 5
23no
. 4
.. 4
39 1
29 4
–..
5 5
81no
. 5
.. 3
99 1
35 4
–..
5 5
48
2006
2007
2008
2009
2010
2006
2007
2008
2009
2010
2006
2007
2008
2009
2010
2006
2007
2008
2009
2010
HO
US
ING
IND
IGE
NO
US
CO
MP
EN
DIU
M 2
011

Tabl
e 16
A.16
Tabl
e 16
A.1
6U
nit
NS
WV
ic
Qld
WA
SA
Ta
s A
CT
NT
Aus
t (b
)D
escr
iptiv
e da
ta -
com
mun
ity h
ousi
ng (a
)
Com
mun
ity h
ousi
ng
Tota
l ten
ancy
rent
al u
nits
by
the
ASG
C re
mot
enes
s ar
eas,
at 3
0 Ju
neno
. 1
2 67
3 4
451
5 4
42 1
869
4 3
48 4
68 7
65 8
7 3
0 10
3no
. 1
4 14
0 4
593
6 2
75 3
868
4 4
05 5
36 7
98 9
2 3
4 70
7no
. 1
5 11
9 6
698
6 5
49 4
474
4 5
38 5
97 7
43 9
3 3
8 81
1no
. 1
5 72
1 8
366
7 0
11 5
349
4 5
31 6
03 6
72 1
31 4
2 38
4no
. 1
8 00
5 9
214
7 1
97 6
041
4 8
13 1
219
682
145
47
316
Tota
l com
mun
ity h
ousi
ng p
rovi
ders
, at 3
0 Ju
neno
. 2
30 1
67 3
32 1
08 1
18 4
7 9
20
1 0
31no
. 2
24 1
76 2
96 1
29 1
15 5
1 8
24
1 0
23no
. 2
10 1
82 2
93 1
95 1
04 5
4 7
24
1 0
69no
. 1
87 1
08 2
59 1
90 9
9 5
5 7
26
931
no.
154
119
281
189
94
89
5 2
8 9
59
(a)
(b)
2007
2008
2009
2010
Dat
am
ayno
tbe
com
para
ble
acro
ssju
risdi
ctio
nsor
over
time
and
com
paris
ons
coul
dbe
mis
lead
ing.
Furth
erin
form
atio
nab
outt
heda
tain
this
tabl
eca
nbe
foun
d at
ww
w.p
c.go
v.au
/gsp
/repo
rts/ro
gs/2
011.
2009
2010
Sou
rce
: na
Not
ava
ilabl
e. ..
Not
app
licab
le. –
Nil
or ro
unde
d to
zer
o. n
p N
ot p
ublis
hed.
2006
2007
2008
2006
Aust
ralia
n to
tals
may
not
repr
esen
t nat
iona
l tot
als
beca
use
com
plet
e da
ta w
ere
not a
vaila
ble
for a
ll ju
risdi
ctio
ns.
AIH
W (2
007,
200
8, 2
009)
CS
HA
nat
iona
l dat
a re
port
; AIH
W (2
010,
201
1) H
ousi
ng a
ssis
tanc
e ta
bles
; 201
1 R
epor
t, ta
ble
16A.
29.
HO
US
ING
IND
IGE
NO
US
CO
MP
EN
DIU
M 2
011

Indigenous community housing
HOUSINGINDIGENOUSCOMPENDIUM 2011

Tabl
e 16
A.17
Tabl
e 16
A.1
7U
nit
NS
W (
b)V
icQ
ld (
c)W
A (
d)S
A (
e)Ta
sA
CT
(f)N
T (g
)A
us G
ov (
h)A
ust
(i)N
umbe
r of p
erm
anen
t dw
ellin
gs m
anag
ed b
y fu
nded
/act
ivel
y re
gist
ered
ICH
Os,
at 3
0 Ju
neno
.na
nana
nana
nana
nana
nano
. 2
450
.. 4
136
1 3
74 9
45..
23
6 1
68 1
993
17
089
no.
2 9
46..
4 1
57 2
956
947
.. 2
3 6
165
2 2
30 1
9 42
4no
. 2
510
348
4 0
92 2
200
895
.. 2
3 6
326
1 0
28 1
7 42
2no
. 2
520
1 2
33 4
096
2 4
33 9
95..
24
2 7
76 1
096
15
173
Num
ber o
f per
man
ent d
wel
lings
, at 3
0 Ju
neno
.na
nana
nana
nana
nana
nano
. 4
989
.. 4
136
3 2
13 9
83..
23
6 1
68 1
993
21
505
no.
4 4
57..
4 1
57 2
956
967
.. 2
3 6
337
2 2
30 2
1 12
7no
. 4
461
348
4 0
92 3
260
994
.. 2
3 6
405
2 7
81 2
2 36
4no
. 4
423
1 2
33 4
096
3 2
60 1
031
.. 2
4 2
841
2 6
99 1
9 60
7N
umbe
r of i
mpr
ovis
ed d
wel
lings
, at 3
0 Ju
ne
no.
nana
nana
nana
nana
nana
no.
–..
nana
8..
– 6
39 4
0na
no.
–..
na 3
47 7
..–
527
10
891
no.
20
–na
347
–..
– 5
48–
915
no.
6–
na 1
06–
..–
513
– 6
25N
umbe
r of p
erm
anen
t dw
ellin
gs n
ot c
onne
cted
to w
ater
, at 3
0 Ju
ne
no.
nana
nana
nana
nana
nana
no.
–..
––
–..
– 2
92 2
294
no.
–..
––
–..
– 2
92 3
295
no.
––
––
2..
– 2
92 1
295
no.
––
––
–..
–na
1na
Indi
geno
us c
omm
unity
hou
sing
2008
2008
Des
crip
tive
data
- In
dige
nous
com
mun
ity h
ousi
ng (a
)
2008
2008
2007
2007
2009
2009
2005
2006
2009
2005
2006
2005
2006
2005
2006
2007
2007
2009
HO
US
ING
IND
IGE
NO
US
CO
MP
EN
DIU
M 2
011

Tabl
e 16
A.17
Tabl
e 16
A.1
7U
nit
NS
W (
b)V
icQ
ld (
c)W
A (
d)S
A (
e)Ta
sA
CT
(f)N
T (g
)A
us G
ov (
h)A
ust
(i)
Indi
geno
us c
omm
unity
hou
sing
Des
crip
tive
data
- In
dige
nous
com
mun
ity h
ousi
ng (a
)
Num
ber o
f per
man
ent d
wel
lings
not
con
nect
ed to
sew
erag
e, a
t 30
June
no
.na
nana
nana
nana
nana
nano
.–
..–
––
..–
396
9 4
05no
.–
..–
––
..–
396
3 3
99no
.–
––
– 5
..–
396
1 4
02no
.–
––
––
..–
na 1
naN
umbe
r of p
erm
anen
t dw
ellin
gs n
ot c
onne
cted
to e
lect
ricity
, at 3
0 Ju
ne
no.
nana
nana
nana
nana
nana
no.
–..
––
–..
– 3
34 2
336
no.
–..
––
–..
– 3
34 6
340
no.
––
––
4..
– 3
34–
338
no.
––
––
7..
–na
–na
Tota
l num
ber o
f hou
seho
lds
livin
g in
per
man
ent d
wel
lings
, at 3
0 Ju
ne
no.
nana
nana
nana
nana
nana
no.
na..
5 7
12na
827
.. 2
2 6
807
nana
no.
na..
3 9
33 2
062
481
.. 2
3na
461
6 9
60no
.na
345
4 0
14na
1 0
77..
23
6 4
05 8
71na
no.
2 4
88 1
269
3 9
63 1
557
1 2
64..
24
2 7
76 8
20 1
4 16
1To
tal r
ent c
olle
cted
by
ICH
Os
for t
he y
ear e
ndin
g 30
Jun
e20
04-0
5$'
000
nana
nana
nana
nana
nana
2005
-06
$'00
0 9
688
.. 1
1 10
0 4
547
1 1
43..
117
11
600
8 9
24 4
7 11
920
06-0
7$'
000
10
638
.. 1
1 40
0 5
937
1 2
30..
172
13
102
12
215
54
694
2007
-08
$'00
0 9
986
598
10
841
7 0
01 7
10..
250
13
661
3 9
11 4
6 95
820
08-0
9$'
000
11
933
5 2
78 1
1 71
8 3
467
417
.. 1
31 4
098
4 5
41 4
1 58
5
2008
2008
2008
2005
2006
2009
2007
2007
2009
2009
2005
2006
2005
2006
2007
HO
US
ING
IND
IGE
NO
US
CO
MP
EN
DIU
M 2
011

Tabl
e 16
A.17
Tabl
e 16
A.1
7U
nit
NS
W (
b)V
icQ
ld (
c)W
A (
d)S
A (
e)Ta
sA
CT
(f)N
T (g
)A
us G
ov (
h)A
ust
(i)
Indi
geno
us c
omm
unity
hou
sing
Des
crip
tive
data
- In
dige
nous
com
mun
ity h
ousi
ng (a
)
Tota
l ren
t cha
rged
by
ICH
Os
for t
he y
ear e
ndin
g 30
Jun
e20
04-0
5$'
000
nana
nana
nana
nana
nana
2005
-06
$'00
0 1
0 83
1..
11
400
4 8
33 1
113
.. 1
17 1
1 18
0 1
0 53
7 5
0 01
120
06-0
7$'
000
11
820
.. 1
1 80
0 6
134
1 8
78..
172
11
752
13
274
56
830
2007
-08
$'00
0 1
1 11
9 6
27 1
1 94
1 6
922
15
046
.. 2
49 1
1 94
4 4
197
62
043
2008
-09
$'00
0 1
3 46
8 5
611
10
120
5 3
97 1
462
.. 1
31 3
545
4 4
78 4
4 21
2To
tal r
ecur
rent
exp
endi
ture
for I
CH
Os
for t
he y
ear e
ndin
g 30
Jun
e20
04-0
5$'
000
nana
nana
nana
nana
nana
2005
-06
$'00
0 1
4 07
2..
5 3
00 1
132
6 0
74..
515
21
200
8 1
91 5
6 48
420
06-0
7$'
000
28
759
.. 1
3 60
0 3
2 53
2 3
079
.. 1
30 2
1 77
2 1
5 91
4 1
15 7
8620
07-0
8$'
000
38
566
1 0
49 2
7 92
4 2
8 99
9 2
701
.. 1
57na
5 9
18 1
05 3
1520
08-0
9$'
000
31
579
11
017
15
176
15
421
3 2
53..
242
na 5
948
82
637
Tota
l cap
ital e
xpen
ditu
re fo
r IC
HO
s fo
r the
yea
r end
ing
30 J
une
2004
-05
$'00
0na
nana
nana
nana
nana
na20
05-0
6$'
000
20
976
.. 3
4 60
0 6
0 05
3 7
023
.. 1
447
25
970
16
817
166
886
2006
-07
$'00
0 1
3 98
3..
38
800
93
360
8 3
08..
25
25
198
8 4
03 1
88 0
7720
07-0
8$'
000
14
363
139
33
958
41
443
5 5
62..
– 3
8 62
0 5
25 1
34 6
1020
08-0
9$'
000
16
941
8 2
05 4
1 29
2 4
3 10
7 6
878
..–
na 3
540
119
963
Tota
l net
recu
rren
t cos
ts fo
r IC
HO
s fo
r the
yea
r end
ing
30 J
une
2004
-05
$'00
0na
nana
nana
nana
nana
na20
05-0
6$'
000
17
062
..na
na 6
074
.. 5
15 3
500
13
710
na20
06-0
7$'
000
23
386
.. 1
3 60
0–
3 0
79..
nana
na 4
0 06
520
07-0
8$'
000
29
416
1 0
49 2
7 92
4 2
8 99
9 2
501
.. 1
57na
5 7
02 9
5 74
920
08-0
9$'
000
26
476
7 2
75 1
5 17
6 1
5 42
1 3
253
.. 2
42na
5 1
46 7
2 99
0
HO
US
ING
IND
IGE
NO
US
CO
MP
EN
DIU
M 2
011
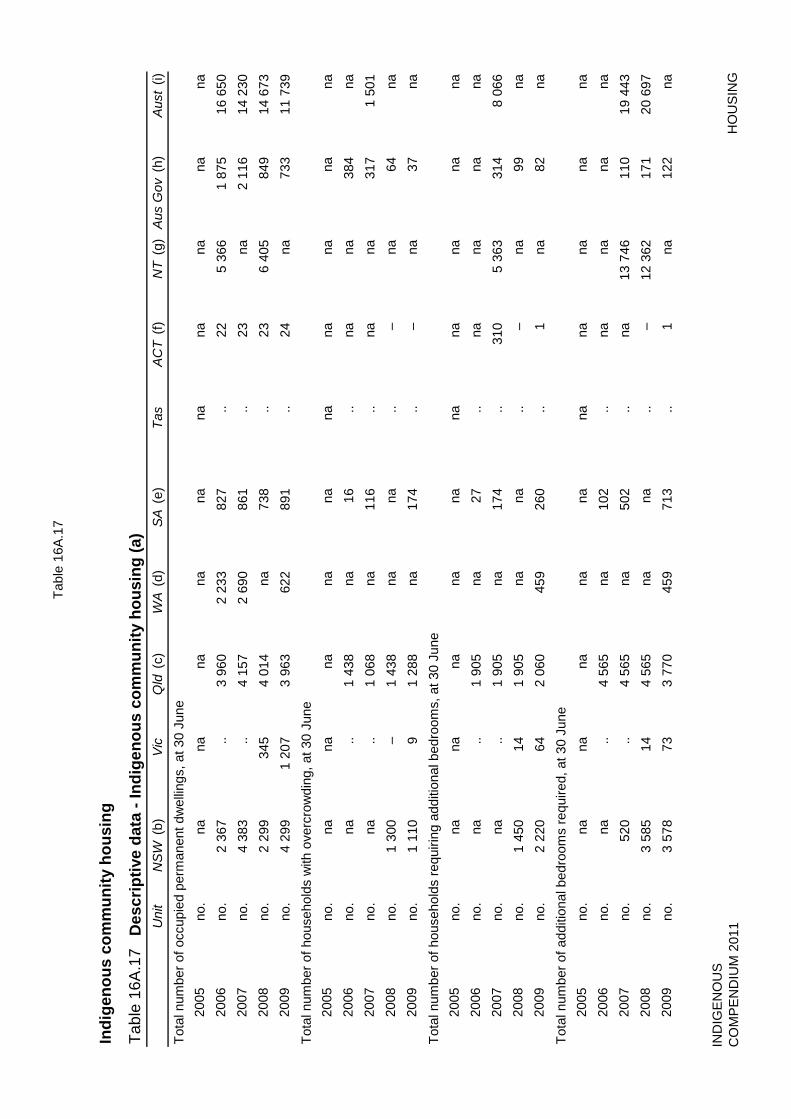
Tabl
e 16
A.17
Tabl
e 16
A.1
7U
nit
NS
W (
b)V
icQ
ld (
c)W
A (
d)S
A (
e)Ta
sA
CT
(f)N
T (g
)A
us G
ov (
h)A
ust
(i)
Indi
geno
us c
omm
unity
hou
sing
Des
crip
tive
data
- In
dige
nous
com
mun
ity h
ousi
ng (a
)
Tota
l num
ber o
f occ
upie
d pe
rman
ent d
wel
lings
, at 3
0 Ju
ne
no.
nana
nana
nana
nana
nana
no.
2 3
67..
3 9
60 2
233
827
.. 2
2 5
366
1 8
75 1
6 65
0no
. 4
383
.. 4
157
2 6
90 8
61..
23
na 2
116
14
230
no.
2 2
99 3
45 4
014
na 7
38..
23
6 4
05 8
49 1
4 67
3no
. 4
299
1 2
07 3
963
622
891
.. 2
4na
733
11
739
Tota
l num
ber o
f hou
seho
lds
with
ove
rcro
wdi
ng, a
t 30
June
no.
nana
nana
nana
nana
nana
no.
na..
1 4
38na
16
..na
na 3
84na
no.
na..
1 0
68na
116
..na
na 3
17 1
501
no.
1 3
00–
1 4
38na
na..
–na
64
nano
. 1
110
9 1
288
na 1
74..
–na
37
naTo
tal n
umbe
r of h
ouse
hold
s re
quiri
ng a
dditi
onal
bed
room
s, a
t 30
June
no.
nana
nana
nana
nana
nana
no.
na..
1 9
05na
27
..na
nana
nano
.na
.. 1
905
na 1
74..
310
5 3
63 3
14 8
066
no.
1 4
50 1
4 1
905
nana
..–
na 9
9na
no.
2 2
20 6
4 2
060
459
260
.. 1
na 8
2na
Tota
l num
ber o
f add
ition
al b
edro
oms
requ
ired,
at 3
0 Ju
neno
.na
nana
nana
nana
nana
nano
.na
.. 4
565
na 1
02..
nana
nana
no.
520
.. 4
565
na 5
02..
na 1
3 74
6 1
10 1
9 44
3no
. 3
585
14
4 5
65na
na..
– 1
2 36
2 1
71 2
0 69
7no
. 3
578
73
3 7
70 4
59 7
13..
1na
122
na
2008
2008
2009
2008
2008
2007
2007
2007
2005
2009
2009
2006
2005
2006
2006
2009
2007
2005
2006
2005
HO
US
ING
IND
IGE
NO
US
CO
MP
EN
DIU
M 2
011

Tabl
e 16
A.17
Tabl
e 16
A.1
7U
nit
NS
W (
b)V
icQ
ld (
c)W
A (
d)S
A (
e)Ta
sA
CT
(f)N
T (g
)A
us G
ov (
h)A
ust
(i)
Indi
geno
us c
omm
unity
hou
sing
Des
crip
tive
data
- In
dige
nous
com
mun
ity h
ousi
ng (a
)
Tota
l num
ber o
f hou
seho
lds
for w
hich
hou
seho
ld g
roup
s an
d dw
ellin
g de
tails
wer
e kn
own,
at 3
0 Ju
neno
.na
nana
nana
nana
nana
nano
.na
.. 3
933
na 2
85..
22
na 1
993
nano
.na
.. 3
933
2 0
62 4
81..
23
na 4
61 6
960
no.
4 4
61 2
96 3
933
nana
.. 2
3–
629
9 3
42no
. 4
423
1 0
80 3
963
1 5
31 5
47..
22
na 2
71 1
1 83
7To
tal n
umbe
r of b
edro
oms
in p
erm
anen
t dw
ellin
gs, a
t 30
June
no.
nana
nana
nana
nana
nana
no.
9 9
85..
13
065
na 2
269
.. 7
3 1
8 03
7 5
775
49
204
no.
12
260
.. 1
3 22
8na
2 6
69..
69
18
426
6 8
44 5
3 49
6no
. 1
3 52
3 1
010
13
085
9 7
80 2
561
.. 7
1 1
8 70
7 2
266
61
003
no.
14
006
3 5
97 1
3 21
0 8
526
2 5
39..
75
6 4
22 1
741
50
116
Tota
l num
ber o
f peo
ple
livin
g in
per
man
ent d
wel
lings
, at 3
0 Ju
neno
.na
nana
nana
nana
nana
nano
. 1
7 81
6..
20
501
na 4
822
.. 7
4 5
2 88
7 6
672
102
772
no.
21
800
.. 2
0 50
1na
3 7
58..
73
46
308
7 7
04 1
00 1
44no
. 1
7 68
6 8
98 2
0 50
1 1
2 18
3 2
366
.. 7
8na
2 8
03na
no.
17
684
3 1
18 2
0 03
0 1
0 06
1 3
677
.. 8
3na
2 0
05 5
6 65
8N
umbe
r of c
urre
ntly
fund
ed/a
ctiv
ely
regi
ster
ed IC
HO
s, a
t 30
June
no.
nana
nana
nana
nana
nana
no.
126
.. 3
4 3
9 5
2..
1 7
6 8
5 4
13no
. 1
42..
34
33
50
.. 1
70
54
384
no.
122
1 1
6 1
4 2
6..
1 7
0 3
3 2
83no
. 1
33 1
16
12
32
.. 1
29
36
260
2009
2007
2008
2008
2008
2009
2007
2008
2005
2006
2009
2007
2005
2006
2005
2006
2005
2006
2007
2009
HO
US
ING
IND
IGE
NO
US
CO
MP
EN
DIU
M 2
011

Tabl
e 16
A.17
Tabl
e 16
A.1
7U
nit
NS
W (
b)V
icQ
ld (
c)W
A (
d)S
A (
e)Ta
sA
CT
(f)N
T (g
)A
us G
ov (
h)A
ust
(i)
Indi
geno
us c
omm
unity
hou
sing
Des
crip
tive
data
- In
dige
nous
com
mun
ity h
ousi
ng (a
)
Num
ber o
f IC
HO
s, a
t 30
June
no.
nana
nana
nana
nana
nana
no.
268
.. 3
4 1
22 5
8..
1 7
6 8
5 6
44no
. 2
49..
34
33
61
.. 1
73
54
505
no.
249
1 1
6 1
4 4
1..
1 7
2 9
3 4
87no
. 2
02 1
16
12
41
.. 1
30
93
396
Num
ber o
f IC
HO
s w
ith a
hou
sing
man
agem
ent p
lan,
at 3
0 Ju
neno
.na
nana
nana
nana
nana
nano
. 7
2..
34
32
37
.. 1
71
41
288
no.
71
.. 3
4 3
3 4
1..
1 6
5 3
9 2
84no
. 4
9–
16
14
24
.. 1
66
12
182
no.
75
1 1
4 1
2 3
2..
na 1
7 1
7 1
68To
tal n
umbe
r of I
ndig
enou
s em
ploy
ees
in IC
HO
s, a
t 30
June
no.
nana
nana
nana
nana
nana
no.
294
.. 2
59na
10
.. 4
338
134
1 0
39no
. 6
62..
177
26
10
..–
367
27
1 2
69no
. 6
23 1
2 5
6na
10
.. 3
337
192
1 2
33no
. 6
80 8
269
na 1
1..
1 9
4 3
9 1
102
Num
ber o
f Ind
igen
ous
empl
oyee
s in
ICH
Os
who
had
com
plet
ed a
ccre
dite
d tra
inin
g, a
t 30
June
no.
nana
nana
nana
nana
nana
no.
59
.. 2
1na
7..
2 4
1 5
7 1
87no
. 7
0..
22
5 8
..–
11
55
171
no.
49
3 1
2na
8..
3 9
50
134
no.
54
4 1
30na
10
.. 1
13
22
234
2008
2005
2006
2008
2008
2008
2008
2009
2009
2009
2009
2007
2007
2007
2005
2006
2005
2006
2005
2006
HO
US
ING
IND
IGE
NO
US
CO
MP
EN
DIU
M 2
011

Tabl
e 16
A.17
Tabl
e 16
A.1
7U
nit
NS
W (
b)V
icQ
ld (
c)W
A (
d)S
A (
e)Ta
sA
CT
(f)N
T (g
)A
us G
ov (
h)A
ust
(i)
Indi
geno
us c
omm
unity
hou
sing
Des
crip
tive
data
- In
dige
nous
com
mun
ity h
ousi
ng (a
)
Num
ber o
f Ind
igen
ous
empl
oyee
s in
ICH
Os
who
wer
e un
derta
king
acc
redi
ted
train
ing,
at 3
0 Ju
neno
.na
nana
nana
nana
nana
nano
. 1
4..
12
na 1
.. 1
152
52
232
no.
11
.. 1
7 1
2 2
..–
36
27
105
no.
26
8 6
na 4
..–
31
32
107
no.
28
4 1
01na
4..
1 2
5 6
169
Tota
l num
ber o
f em
ploy
ees
in IC
HO
s, a
t 30
June
no.
nana
nana
nana
nana
nana
no.
343
.. 2
72na
16
.. 6
470
189
1 2
96no
. 6
85..
234
48
13
.. 1
509
43
1 5
33no
. 6
48 1
6 8
3na
12
.. 3
490
296
1 5
48no
. 7
07 9
398
na 1
4..
3 1
15 5
1 1
297
(a)
(b)
NSW
Foot
note
sto
this
tabl
ela
rgel
yre
late
toda
tafo
rye
aren
ding
30Ju
ne20
09,
the
mos
tre
cent
year
for
whi
chda
taar
eav
aila
ble.
Ref
erto
prev
ious
Rep
orts
for
spec
ific
cave
ats
onpr
evio
usye
ars
data
.D
ata
may
not
beco
mpa
rabl
eac
ross
juris
dict
ions
and
over
time
and
com
paris
ons
coul
dbe
mis
lead
ing.
Dat
aw
ithin
juris
dict
ions
from
2007
-08
and
2008
onw
ards
may
notb
eco
mpa
rabl
eto
prev
ious
year
sdu
eto
ach
ange
insc
ope
ofth
eIC
Hco
llect
ion
in20
07-0
8,an
dva
riatio
nsin
the
ICH
Os
that
resp
ond
toth
esu
rvey
,or
for
whi
chju
risdi
ctio
nsca
npr
ovid
eda
ta.D
ata
may
notb
eco
mpa
rabl
eac
ross
juris
dict
ions
beca
use
ofco
nsid
erab
leva
riatio
nin
the
way
ICH
oper
ates
inea
chju
risdi
ctio
n.O
rgan
isat
ion
and
hous
ehol
din
form
atio
nm
ayva
ryco
nsid
erab
lybe
caus
eof
the
polic
yan
dpr
ogra
men
viro
nmen
t and
the
natu
re o
f the
sec
tor.
NSW
data
colle
ctio
nfo
cuse
son
dwel
lings
man
aged
byac
tivel
yre
gist
ered
orga
nisa
tions
.Act
ive
regi
stra
tion
with
the
Abor
igin
alH
ousi
ngO
ffice
(AH
O)
does
not
guar
ante
e fu
ndin
g an
d do
es n
ot e
quat
e to
fund
ed IC
HO
s.
The
num
ber
ofpe
rman
ent
dwel
lings
man
aged
byac
tivel
yan
dno
n-ac
tivel
yre
gist
ered
orga
nisa
tions
isso
uced
from
AHO
’sne
wly
deve
lope
dAb
orig
inal
Com
mun
ity H
ousi
ng P
rovi
der d
atab
ase.
Dat
ain
this
tabl
ear
ein
com
plet
ean
ddo
notn
eces
saril
yre
pese
ntal
lIC
Hfo
rea
chju
risdi
ctio
nbe
caus
eda
tafo
rso
me
orga
nisa
tions
/dw
ellin
gs/h
ouse
hold
sw
ere
not a
vaila
ble.
2007
2009
2008
2007
2005
2006
2005
2006
2009
2008
HO
US
ING
IND
IGE
NO
US
CO
MP
EN
DIU
M 2
011

Tabl
e 16
A.17
Tabl
e 16
A.1
7U
nit
NS
W (
b)V
icQ
ld (
c)W
A (
d)S
A (
e)Ta
sA
CT
(f)N
T (g
)A
us G
ov (
h)A
ust
(i)
Indi
geno
us c
omm
unity
hou
sing
Des
crip
tive
data
- In
dige
nous
com
mun
ity h
ousi
ng (a
)
Tota
lre
curr
ent
cost
sar
eth
ose
incu
rred
byAH
Oth
roug
hem
ploy
ee-r
elat
edan
dot
her
proj
ect
expe
nses
,su
chas
Sect
orSu
ppor
tan
dR
esou
rcin
g,H
ealth
yIn
dige
nous
Hou
sing
Initi
ativ
e, T
enan
ts In
itiat
ive,
Res
ourc
ing
Com
mun
ity O
rgan
isat
ions
. IC
HO
recu
rren
t exp
ense
s ar
e no
t inc
lude
d.
Net
recu
rren
t exp
ense
s ar
e th
ose
incu
rred
by
AHO
on
the
Abor
igin
al c
omm
unity
hou
sing
sec
tor.
Net
recu
rren
t exp
ense
s in
curr
ed b
y IC
HO
s ar
e no
t inc
lude
d.
Tota
lnum
bero
focc
upie
dpe
rman
entd
wel
lings
was
deriv
edby
extra
pola
ting
prop
ortio
nally
fort
hew
hole
ICH
Ose
ctor
,usi
ngth
enu
mbe
rofp
erm
anen
tdw
ellin
gsm
anag
edby
ICH
Os
that
rene
wed
regi
stra
tion
with
Abor
igin
alH
ousi
ngO
ffice
and
wer
eoc
cupi
edas
at30
June
2009
.Cau
tion
shou
ldbe
appl
ied
inus
ing
this
tode
rive
occu
panc
y ra
te a
s 52
of 7
4 un
occu
pied
per
man
ent d
wel
lings
man
aged
by
ICH
Os
that
rene
wed
thei
r reg
istra
tion
wer
e no
t ten
anta
ble.
The
tota
lnum
bers
ofho
useh
olds
with
over
crow
ding
,ho
useh
olds
requ
iring
extra
bedr
oom
san
dad
ditio
nalb
edro
oms
requ
ired
are
appr
oxim
ate
only
and
have
been
ext
rapo
late
d fo
r all
ICH
dw
ellin
gs. C
alcu
latio
ns fo
r the
se d
ata
item
s ar
e ba
sed
on th
e pr
oxy
stan
dard
.
Asa
resu
ltof
data
qual
ityis
sues
for
the
tota
lren
tch
arge
dan
dto
talr
ent
colle
cted
byIC
HO
s,th
eda
taex
clud
ein
form
atio
non
dwel
lings
man
aged
byso
me
activ
ely
regi
ster
ed o
rgan
isat
ions
(128
dw
ellin
gs fo
r 200
9).
Cap
ital e
xpen
ditu
re o
nly
incl
udes
the
amou
nt s
pent
by
AHO
on
the
Abor
igin
al c
omm
unity
hou
sing
sec
tor.
Cap
ital e
xpen
ditu
re b
y IC
HO
s is
not
ava
ilabl
e.
Num
bers
ofpe
rman
ent
dwel
lings
man
aged
byfu
nded
and
unfu
nded
ICH
Os
not
conn
ecte
dto
wat
eror
elec
trici
tyar
eco
nsis
tent
with
data
from
the
2006
Com
mun
ityH
ousi
ngan
dIn
frast
ruct
ure
Nee
dsSu
rvey
(CH
INS)
.N
umbe
rof
perm
anen
tdw
ellin
gsm
anag
edby
fund
edan
dun
fund
edIC
HO
sno
tco
nnec
ted
tose
wer
age
is m
ostly
con
sist
ent w
ith th
e 20
06 C
HIN
S.
Tota
lnum
ber
ofho
useh
olds
livin
gin
perm
anen
tdw
ellin
gsis
for
orga
nisa
tions
that
rene
wed
regi
stra
tion
with
AHO
,bu
tm
ayha
vequ
ality
issu
es.
Itis
larg
ely
assu
med
that
mos
tdw
ellin
gsco
nsis
tofo
neho
useh
old,
exce
ptw
here
ther
eis
obvi
ousl
ytw
oco
uple
s.48
occu
pied
dwel
lings
with
unkn
own
num
bero
fhou
seho
lds
wer
e as
sum
ed to
con
tain
onl
y on
e ho
useh
old.
Tota
lren
tcol
lect
edby
ICH
Os
amou
ntre
fers
tore
ntco
llect
edfro
mth
edw
ellin
gsm
anag
edby
ICH
Os
that
are
activ
ely
regi
ster
edw
ithAH
Oas
at30
June
.Itd
oes
not i
nclu
de th
e am
ount
of r
ent c
olle
cted
by
ICH
Os
that
did
not
rene
w th
eir r
egis
tratio
n w
ith A
HO
.
Num
bero
fim
prov
ised
dwel
lings
man
aged
byIC
HO
ssh
ould
bein
terp
rete
dw
ithca
utio
n,as
ther
em
aybe
data
qual
ityco
ncer
nsth
atre
sult
from
non-
clar
ityof
wha
tan
impr
ovis
ed d
wel
ling
is o
n th
e pa
rt of
ICH
Os
that
com
plet
ed A
borig
inal
Hou
sing
Offi
ce re
gist
ratio
n fo
rms.
Tota
l num
ber o
f hou
seho
lds
for w
hich
hou
seho
ld g
roup
s an
d dw
ellin
g de
tails
hav
e be
en e
xtra
pola
ted
for a
ll IC
H d
wel
lings
.Th
e to
tal n
umbe
r of p
eopl
e liv
ing
in p
erm
anen
t dw
ellin
gs w
as s
ourc
ed fr
om A
HO
’s n
ewly
dev
elop
ed A
borig
inal
Com
mun
ity H
ousi
ng P
rovi
ders
dat
abas
e.N
umbe
r of c
urre
ntly
fund
ed/a
ctiv
ely
regi
ster
ed IC
HO
s as
at J
une
2009
. Tw
enty
-two
of th
e IC
HO
s di
d no
t man
age
prop
ertie
s as
at J
une
2009
. N
umbe
rof
fund
ed/a
ctiv
ely
regi
ster
edan
dun
fund
ed/n
on-a
ctiv
ely
regi
ster
edIC
HO
sw
asso
urce
dfro
mAH
O’s
new
lyde
velo
ped
Abor
igin
alC
omm
unity
Hou
sing
Prov
ider
s da
taba
se.
HO
US
ING
IND
IGE
NO
US
CO
MP
EN
DIU
M 2
011

Tabl
e 16
A.17
Tabl
e 16
A.1
7U
nit
NS
W (
b)V
icQ
ld (
c)W
A (
d)S
A (
e)Ta
sA
CT
(f)N
T (g
)A
us G
ov (
h)A
ust
(i)
Indi
geno
us c
omm
unity
hou
sing
Des
crip
tive
data
- In
dige
nous
com
mun
ity h
ousi
ng (a
)
(c)
(d)
Wes
tern
Aus
tral
ia
Fort
henu
mbe
rofI
CH
Os
and
num
bero
ffun
ded/
activ
ely
regi
ster
edIC
HO
s,lo
calg
over
nmen
tref
orm
sin
Mar
ch20
08re
sulte
din
2co
unci
lsbe
ing
deve
lope
dfro
mth
e am
alga
mat
ion
of 5
and
15
coun
cils
resp
ectiv
ely.
Dat
aon
the
tota
lnu
mbe
rsof
ICH
Oem
ploy
ees,
Indi
geno
usIC
HO
empl
oyee
s,an
dIn
dige
nous
ICH
Oem
ploy
ees
who
had
com
plet
edor
wer
eun
derta
king
accr
edite
dtra
inin
gar
eso
urce
dfro
ma
com
bina
tion
ofse
lf-re
porte
dda
tapr
ovid
edby
14of
the
16C
ounc
ilsin
2007
-08
ofpr
oper
tyan
dte
nanc
ym
anag
emen
tem
ploy
ees
as20
08-0
9da
tano
tava
ilabl
e,an
da
tele
phon
esu
rvey
ofth
e16
Cou
ncils
cond
ucte
dby
the
Dep
artm
enti
nM
ay20
09ab
outt
heem
ploy
ees
(incl
udin
gqu
alifi
edtra
des
empl
oyee
s)in
volv
edin
hous
ing
rela
ted
trade
s.D
ata
also
sour
ced
from
Qbu
ild's
Hum
anR
esou
rce
Info
rmat
ion
Syst
emat
30Ju
ne20
09.T
his
data
may
not
bea
true
refle
ctio
nof
the
actu
alnu
mbe
rof
Indi
geno
usan
dno
n-In
dige
nous
empl
oyee
sas
itis
not
com
puls
ory
for
staf
fto
com
plet
ean
Equa
lity
ofEm
ploy
men
t Opp
ortu
nity
cen
sus
form
or i
dent
ify a
s ei
ther
an
Abor
igin
al o
r Tor
res
Stra
it Is
land
er p
erso
n.
The
repo
rted
data
for
the
num
ber
ofIC
HO
sw
itha
hous
ing
man
agem
entp
lan
refe
rto
ICH
Os
with
hous
ing
man
agem
entp
lans
that
incl
ude
som
eor
allo
fthe
spec
ified
com
pone
nts
ofth
epl
an.
Thes
eco
mpo
nent
sar
e:ob
ject
ives
for
deliv
erin
gho
usin
gas
sist
ance
,as
set
man
agem
ent
plan
,re
ntco
llect
ion
polic
ies
and
finan
cial
pra
ctic
es a
nd re
porti
ng s
yste
ms
that
link
reso
urce
s to
out
com
es.
Cou
ncils
are
curr
ently
unab
leto
sepa
rate
the
recu
rren
tcos
tsas
soci
ated
with
hous
ing
serv
ices
from
thos
eas
soci
ated
with
the
othe
rse
rvic
esth
eypr
ovid
e.Th
eam
ount
repo
rted
here
isth
eco
stof
mai
nten
ance
serv
ices
prov
ided
byth
eQ
ueen
slan
dG
over
nmen
t,pl
usst
affa
ndre
late
dad
min
istra
tive
cost
sas
soci
ated
with
the
Hea
lthy
Indi
geno
us H
ousi
ng In
itiat
ive.
Incl
udes
Indi
geno
us G
ovt C
oord
inat
ion
cont
ribut
ion.
Prox
yst
anda
rdus
edto
calc
ulat
eth
eto
taln
umbe
rof
hous
ehol
dsw
ithov
ercr
owdi
ng,
the
tota
lnum
ber
ofho
useh
olds
requ
iring
addi
tiona
lbed
room
s,an
dto
tal
num
ber
ofad
ditio
nalb
edro
oms
requ
ired.
Dat
aso
urce
dfro
mSA
Pat
30Ju
ne20
09fo
r6
tena
ncy-
man
aged
com
mun
ities
.Rem
aini
ng28
com
mun
ities
data
asre
porte
d by
PC
AT s
urve
y in
200
5 an
d 20
06.
Dat
afo
rto
tal
num
ber
ofpe
ople
livin
gin
perm
anen
tdw
ellin
gsso
urce
dfro
mSA
Pat
30Ju
ne20
09fo
r6
tena
ncy-
man
aged
com
mun
ities
.R
emai
ning
28co
mm
uniti
es d
ata
as re
porte
d by
PC
AT s
urve
y in
200
5 an
d 20
06.
Dat
a fo
r the
num
ber o
f per
man
ent d
wel
lings
not
con
nect
to w
ater
, sew
erag
e or
ele
ctric
ity a
re s
ourc
ed fr
om th
e Pr
oper
ty C
ondi
tion
and
Tena
nts
Surv
ey 2
006-
07.
Que
ensl
and
Dat
afo
rth
enu
mbe
rof
perm
anen
tdw
ellin
gsm
anag
edby
fund
edan
dun
fund
edor
gani
satio
ns,
capi
tale
xpen
ditu
re,
tota
lnum
ber
ofbe
droo
ms
inpe
rman
ent
dwel
lings
are
sou
rced
from
dep
artm
enta
l adm
inis
trativ
e da
ta (S
AP) a
t 30
June
200
9.
Dat
afo
rre
ntco
llect
ed,r
entc
harg
ed,a
ndto
taln
umbe
rof
occu
pied
perm
anen
tdw
ellin
gsar
eso
urce
dfro
ma
com
bina
tion
ofSA
Pat
30Ju
ne20
09(5
ofth
e6
tena
ncy-
man
aged
com
mun
ities
) and
Qua
rterly
Per
form
ance
Rep
orts
(rem
aini
ng c
omm
uniti
es).
Mai
nten
ance
exp
endi
ture
is s
ourc
ed fr
om m
aint
enan
ce s
ervi
ces
prov
ided
by
Qbu
ild.
HO
US
ING
IND
IGE
NO
US
CO
MP
EN
DIU
M 2
011

Tabl
e 16
A.17
Tabl
e 16
A.1
7U
nit
NS
W (
b)V
icQ
ld (
c)W
A (
d)S
A (
e)Ta
sA
CT
(f)N
T (g
)A
us G
ov (
h)A
ust
(i)
Indi
geno
us c
omm
unity
hou
sing
Des
crip
tive
data
- In
dige
nous
com
mun
ity h
ousi
ng (a
)
(e)
Com
plet
eun
itre
cord
data
toca
lcul
ate
tota
lhou
seho
lds
with
over
crow
ding
are
not
avai
labl
e.C
ompl
ete
data
onto
taln
umbe
rof
hous
ehol
dsre
quiri
ngex
trabe
droo
ms
are
not
avai
labl
e.To
tal
num
ber
ofad
ditio
nal
bedr
oom
sre
quire
dm
ayre
pres
ent
anun
derc
ount
asco
mpl
ete
hous
ehol
dda
taw
ere
not
avai
labl
e.
Dat
are
late
tofu
nded
ICH
Os
only
exce
ptfo
rthe
tota
lnum
bero
fper
man
entd
wel
lings
man
aged
byfu
nded
and
unfu
nded
ICH
Os.
Dur
ing
2008
-09,
775
dwel
lings
form
erly
man
aged
by
Indi
geno
us C
omm
unity
Hou
sing
org
anis
atio
ns w
ere
in th
e pr
oces
s of
tran
sitio
ning
to d
irect
man
agem
ent b
y th
e W
A go
vern
men
t.
Tota
lnum
ber
ofpe
rman
entd
wel
lings
occu
pied
isba
sed
ona
repr
esen
tativ
esa
mpl
eof
702
dwel
lings
(ofw
hich
693
wer
epe
rman
ent)
asco
mpl
ete
hous
ehol
dle
vel d
ata
was
not
ava
ilabl
e.
Tota
lrec
urre
ntco
stis
repo
rted
inst
ead
ofne
trec
urre
ntco
st,a
sda
taon
excl
usio
nsar
eno
thel
d,w
ithth
eex
cept
ion
ofgr
ants
and
subs
idie
s,w
hich
wer
eth
epr
inci
pal m
etho
d of
pay
men
t for
mai
nten
ance
ser
vice
s to
hou
sing
.
WA
num
ber
ofpe
rman
entd
wel
lings
man
aged
byIC
HO
sno
tcon
nect
edto
wat
er,s
ewer
age
and
elec
trici
tyda
taar
eno
tava
ilabl
efo
reve
rydw
ellin
gin
the
Stat
e.N
o dw
ellin
gs m
anag
ed b
y fu
nded
ICH
Os
are
know
n to
be
lack
ing
conn
ectio
ns.
Hou
seho
ldda
taar
ein
the
proc
ess
ofbe
ing
ente
red
into
the
Dep
artm
ento
fHou
sing
and
Wor
ks’H
ousi
ngM
anag
emen
tSys
tem
for
hous
esm
anag
edby
fund
edIC
HO
s, b
ut th
is w
as n
ot c
ompl
ete
by 3
0 Ju
ne 2
009.
Tota
lnum
ber
ofem
ploy
ees
inIC
HO
san
dnu
mbe
rof
Indi
geno
usem
ploy
ees
inIC
HO
sw
hoha
dco
mpl
eted
orw
ere
unde
rtaki
ngac
cred
ited
train
ing
data
are
not
avai
labl
e at
this
sta
ge.
Dat
a on
impr
ovis
ed d
wel
lings
are
not
col
lect
edD
ata
onth
enu
mbe
rof
perm
anen
tdw
ellin
gsno
tcon
nect
edto
wat
er,s
ewer
age
orel
ectri
city
are
base
don
Tena
ncy
/Ass
etau
dits
capt
ured
in20
08an
d20
09.
Dw
ellin
g w
ithou
t Met
ered
Pow
er w
ith a
con
ditio
n ra
ting
of N
ot A
pplic
able
or P
oor a
re c
ount
ed a
s no
t bei
ng c
onne
cted
to e
lect
ricity
.
Dat
aon
the
tota
lnum
ber
ofho
useh
olds
livin
gin
perm
anen
tdw
ellin
gsis
prov
ided
base
don
Tena
ncy
/Ass
etau
dits
capt
ured
in20
08an
d20
09.1
69oc
cupi
edpe
rman
ent d
wel
lings
with
unk
now
n nu
mbe
r of h
ouse
hold
s w
ere
assu
med
to c
onta
in o
nly
1 ho
useh
old
per d
wel
ling.
Ren
t col
lect
ed a
nd h
ousi
ng m
aint
enan
ce e
xpen
ditu
re fo
r 10
ICH
Os
is fo
r the
Jun
e to
Dec
embe
r 200
8 po
rtion
of t
he fi
nanc
ial p
erio
d.
Cap
itale
xpen
ditu
rein
clud
esem
erge
ncy
fund
spr
ovid
edby
the
Offi
cefo
rAb
orig
inal
Hou
sing
toco
mm
uniti
esth
atca
nno
tbe
dire
ctly
appo
rtion
edto
indi
vidu
alco
mm
uniti
es.
Dat
aon
the
num
ber
ofpe
rman
entd
wel
lings
man
aged
byfu
nded
ICH
Os,
and
the
tota
lnum
ber
ofpe
rman
entd
wel
lings
(i.e.
man
aged
byfu
nded
and
unfu
nded
ICH
Os)
are
base
don
Tena
ncy
/As
set
audi
tsca
ptur
edin
2008
and
2009
.D
wel
lings
ofun
know
nst
atus
(6m
anag
edby
fund
edIC
HO
san
d9
man
aged
byun
fund
ed IC
HO
s) w
ere
assu
med
to b
e pe
rman
ent.
Sout
h Au
stra
lia
HO
US
ING
IND
IGE
NO
US
CO
MP
EN
DIU
M 2
011

Tabl
e 16
A.17
Tabl
e 16
A.1
7U
nit
NS
W (
b)V
icQ
ld (
c)W
A (
d)S
A (
e)Ta
sA
CT
(f)N
T (g
)A
us G
ov (
h)A
ust
(i)
Indi
geno
us c
omm
unity
hou
sing
Des
crip
tive
data
- In
dige
nous
com
mun
ity h
ousi
ng (a
)
(f) (g)
(h)
Mai
nten
ance
cost
sfo
rdw
ellin
gsun
der
leas
eto
Indi
geno
usco
mm
unity
hous
ing
inth
eAC
Tar
em
etby
gove
rnm
ent
(18
dwel
lings
).M
aint
enan
ceco
sts
for
the
rem
aini
ng d
wel
lings
wer
e m
et b
y th
e IC
HO
but
wer
e no
t ava
ilabl
e fo
r rep
ortin
g.
Dat
afo
rthe
tota
lnum
bers
ofho
useh
olds
with
over
crow
ding
,hou
seho
lds
requ
iring
addi
tiona
lbed
room
san
dad
ditio
nalb
edro
oms
requ
ired
are
base
don
data
for
22 o
f the
24
hous
ehol
ds.
Dur
ing
2008
-09,
4,09
6dw
ellin
gs,f
unde
dun
dert
heN
atio
nalP
artn
ersh
ipAg
reem
entf
orR
emot
eIn
dige
nous
Hou
sing
wer
ere
clas
sifie
das
Rem
ote
Publ
icH
ousi
ngan
dar
eno
long
erm
anag
edby
Indi
geno
usC
omm
unity
Hou
sing
orga
nisa
tions
.Due
toth
eun
ique
man
agem
enta
rran
gem
ents
fort
hese
dwel
lings
,the
yw
ere
not
repo
rted
inei
ther
the
2008
-09
Indi
geno
usco
mm
unity
hous
ing
or20
08-0
9pu
blic
rent
alco
llect
ions
.For
2009
-10,
whe
reda
taar
eav
aila
ble,
thes
edw
ellin
gsw
illbe
sepa
rate
ly id
entif
ied
and
repo
rted
with
the
Indi
geno
us c
omm
unity
hou
sing
col
lect
ion.
Tota
lnum
bers
ofIC
HO
empl
oyee
s,In
dige
nous
ICH
Oem
ploy
ees,
and
Indi
geno
usIC
HO
empl
oyee
sw
hoha
dco
mpl
eted
orw
ere
unde
rtaki
ngac
cred
ited
train
ing
are
base
d on
dat
a pr
ovid
ed b
y 19
of t
he 3
0 or
gani
satio
ns.
Aust
ralia
nG
over
nmen
tco
ntai
nsda
tafro
mVi
ctor
ia,
Que
ensl
and
and
Tasm
ania
,an
din
clud
esdw
ellin
gsm
anag
edby
fund
edan
dun
fund
edor
gani
satio
nsre
spon
ding
toth
eFa
HC
SIA
surv
ey.D
ata
are
larg
ely
base
don
surv
eyre
turn
sfro
m13
outo
f22
Vict
oria
nIC
HO
s,8
of68
Que
ensl
and
ICH
Os,
and
1ou
tof3
Tasm
ania
n IC
HO
s.
Aust
ralia
n G
over
nmen
t
Ren
t col
lect
ed fr
om a
nd re
nt c
harg
ed to
hou
seho
lds
is b
ased
on
data
pro
vide
d by
22
of th
e 30
org
anis
atio
ns.
Num
ber o
f fun
ded
ICH
Os,
and
the
num
ber o
f tot
al IC
HO
s in
clud
es S
hire
Cou
ncils
, Out
stat
ion
Res
ourc
e C
entre
s an
d ho
usin
g or
gani
satio
ns.
Nor
ther
n Te
rrito
ry
Fund
ing
arra
ngem
ents
assu
mes
that
neta
ndto
talr
ecur
rent
expe
nses
are
equa
l.R
ecur
rent
expe
nses
for1
0IC
HO
Sis
fort
heJu
neto
Dec
embe
r200
8po
rtion
ofth
e fin
anci
al p
erio
d.
Dat
aar
eba
sed
onTe
nanc
y/
Asse
tau
dits
capt
ured
in20
08an
d20
09fo
rth
efo
llow
ing:
the
tota
lnum
ber
ofpe
rman
ent
occu
pied
dwel
lings
,ho
useh
olds
with
over
crow
ding
,hou
seho
lds
requ
iring
addi
tiona
lbed
room
s,ad
ditio
nalb
edro
oms
requ
ired,
hous
ehol
dsfo
rwhi
chho
useh
old
grou
psan
ddw
ellin
gde
tails
are
know
n,be
droo
ms
and
peop
le li
ving
in p
erm
anen
t dw
ellin
gs
Hou
sing
mai
nten
ance
exp
endi
ture
is b
ased
on
data
pro
vide
d by
29
of th
e 30
org
anis
atio
ns.
Dat
a on
the
tota
l num
ber o
f IC
HO
s w
ith a
hou
sing
man
agem
ent p
lan
are
due
to th
e co
mm
ence
men
t of t
he S
hire
s da
ta c
olle
cted
in 2
008/
09.
Aust
ralia
n C
apita
l Ter
ritor
y
HO
US
ING
IND
IGE
NO
US
CO
MP
EN
DIU
M 2
011

Tabl
e 16
A.17
Tabl
e 16
A.1
7U
nit
NS
W (
b)V
icQ
ld (
c)W
A (
d)S
A (
e)Ta
sA
CT
(f)N
T (g
)A
us G
ov (
h)A
ust
(i)
Indi
geno
us c
omm
unity
hou
sing
Des
crip
tive
data
- In
dige
nous
com
mun
ity h
ousi
ng (a
)
(i)D
ata
for s
ome
Aust
ralia
n to
tals
are
not
repo
rted
due
to in
suffi
cien
t dat
a fo
r jur
isdi
ctio
ns.
Dat
aon
the
tota
lnum
bero
fper
man
entd
wel
lings
man
aged
byIC
HO
s,fo
rnon
-res
pond
ing
ICH
Os
wer
eso
urce
dfro
mth
eju
risdi
ctio
n’s
hist
oric
alre
cord
s(V
icto
ria:
9, Q
ueen
slan
d: 6
0, T
asm
ania
: 2).
Dw
ellin
gs o
f unk
now
n dw
ellin
g st
atus
wer
e as
sum
ed to
be
perm
anen
t (Q
ueen
slan
d: 1
834;
Tas
man
ia: 1
03 d
wel
lings
).
Sou
rce
: na
Not
ava
ilabl
e. ..
Not
app
licab
le. –
Nil
or ro
unde
d to
zer
o.AI
HW
(200
7, 2
009,
201
0 an
d un
publ
ishe
d) In
dige
nous
Com
mun
ity H
ousi
ng d
ata
colle
ctio
n, C
anbe
rra;
201
1 R
epor
t, ta
ble
16A.
42.
Dat
aon
the
num
bero
fper
man
entd
wel
lings
man
aged
byfu
nded
ICH
Os,
forn
on-r
espo
ndin
gfu
nded
ICH
Os
wer
eso
urce
dfro
mth
eju
risdi
ctio
n’s
hist
oric
alre
cord
s(V
icto
ria: 9
, Que
ensl
and:
5, T
asm
ania
: 2).
Dw
ellin
gs o
f unk
now
n dw
ellin
g st
atus
wer
e as
sum
ed to
be
perm
anen
t (Q
ueen
slan
d: 2
78; T
asm
ania
: 19
dwel
lings
).
For T
asm
ania
n da
ta, t
he to
tal n
umbe
r of b
edro
oms
and
peop
le in
per
man
ent d
wel
lings
are
for 1
ICH
O o
nly.
Fund
ing
stat
us o
f IC
HO
s w
ho d
id n
ot re
spon
d to
the
surv
ey w
as b
ased
on
juris
dict
ions
’ rec
ords
(Vic
toria
: 9 IC
HO
s, Q
ueen
slan
d: 6
0 IC
HO
s, T
asm
ania
: 2 IC
HO
s).
Tasm
ania
nda
taon
the
tota
lnu
mbe
rsof
ICH
Oem
ploy
ees,
Indi
geno
usIC
HO
empl
oyee
s,an
dIn
dige
nous
ICH
Oem
ploy
ees
who
had
com
plet
edor
wer
eun
derta
king
acc
redi
ted
train
ing
are
base
d on
cur
rent
dat
a fo
r 1 IC
HO
, and
juris
dict
ion’
s hi
stor
ical
reco
rds
for 1
ICH
O.
Vict
oria
n da
ta o
n im
prov
ised
dw
ellin
gs fo
r 9 n
on-r
espo
ndin
g IC
HO
s w
ere
sour
ced
from
the
juris
dict
ion’
s hi
stor
ical
reco
rds.
Cur
rent
Tasm
ania
nda
taon
the
num
ber
ofpe
rman
ent
dwel
lings
not
conn
ecte
dto
wat
er,
sew
erag
ean
del
ectri
city
resp
ectiv
ely
wer
eon
lyav
aila
ble
for
1or
gani
satio
n. F
or 1
org
anis
atio
n, d
ata
wer
e so
urce
d fro
m th
e ju
risdi
ctio
n’s
hist
oric
al re
cord
s.Fo
rth
eto
taln
umbe
rof
hous
ehol
dsliv
ing
inpe
rman
entd
wel
lings
,dw
ellin
gsw
ithan
unkn
own
num
bero
fhou
seho
lds
wer
eas
sum
edto
have
one
hous
ehol
dpe
rdw
ellin
g(V
icto
ria:
65,
Que
ensl
and:
109)
.Fo
rTa
sman
ian
data
,cu
rren
tdw
ellin
gco
unts
wer
eon
lyav
aila
ble
for
1or
gani
satio
n.Fo
r1
orga
nisa
tion,
data
wer
eso
urce
dfro
mth
eju
risdi
ctio
n’s
hist
oric
alre
cord
s.Ta
sman
ian
rent
char
ged,
rent
colle
cted
,hou
sing
mai
nten
ance
expe
nditu
re,n
etan
dto
talr
ecur
rent
cost
sar
efo
rII
CH
Oon
ly.F
orTa
sman
ian
tota
lnum
ber
ofpe
rman
ento
ccup
ied
dwel
lings
,cur
rent
dwel
ling
coun
tsw
ere
only
avai
labl
efo
r1
orga
nisa
tion.
For
1or
gani
satio
n,da
ta w
ere
sour
ced
from
the
juris
dict
ion’
s hi
stor
ical
reco
rds.
The
tota
lnum
bero
fhou
seho
lds
with
over
crow
ding
,hou
seho
lds
with
requ
iring
addi
tiona
lbed
room
s,ad
ditio
nalb
edro
oms
requ
ired
and
tota
lnum
bero
fhou
seho
lds
for w
hich
hou
seho
ld g
roup
s an
d dw
ellin
g de
tails
are
kno
wn,
sho
uld
be in
terp
rete
d w
ith c
autio
n.
Ther
em
aybe
data
qual
ityis
sues
with
the
Vict
oria
nda
ta,Q
ueen
slan
dda
tais
for
2IC
HO
son
ly,a
ndTa
sman
ian
data
isba
sed
oncu
rren
tdat
afo
r1IC
HO
only
.Fo
r1
Tasm
ania
nIC
HO
data
wer
eso
urce
dfro
mth
eju
risdi
ctio
n’s
hist
oric
alre
cord
s.Ta
sman
ian
over
crow
ding
data
are
estim
ates
base
don
the
ICH
O’s
know
ledg
e of
the
num
ber o
f kno
wn
occu
pant
s in
the
hous
ehol
d.
HO
US
ING
IND
IGE
NO
US
CO
MP
EN
DIU
M 2
011

Tabl
e 16
A.18
Tabl
e 16
A.1
8
NS
W (
c)V
icQ
ld (
d)W
A (
e)S
A (f
)Ta
sA
CT
NT
Aus
Gov
(g)
Aus
t20
04-0
5na
nana
nana
nana
nana
na20
05-0
6–
..–
––
..–
4.7
0.1
1.7
2006
-07
–..
––
–..
– 4
.7 0
.1 1
.520
07-0
8–
––
– 0
.4..
– 4
.6 0
.1 1
.620
08-0
9–
––
––
..–
na–
na
(a)
(b)
(c)
(d)
(e)
(f) (g)
Dat
a ar
e ba
sed
on s
urve
y re
turn
s fro
m 1
3 ou
t of 2
2 Vi
ctor
ian
ICH
Os,
8 o
ut o
f 68
Que
ensl
and
ICH
OS,
and
1 o
ut o
f 3 T
asm
ania
n IC
HO
S.
Indi
geno
us c
omm
unity
hou
sing
Sou
rce
:
Prop
ortio
n of
per
man
ent d
wel
lings
not
con
nect
ed to
an
orga
nise
d w
ater
sup
ply
(per
cen
t) (a
), (b
)
na N
ot a
vaila
ble.
.. N
ot a
pplic
able
. – N
il or
roun
ded
to z
ero.
AIH
W (2
007,
200
9, 2
010
and
unpu
blis
hed)
Indi
geno
us C
omm
unity
Hou
sing
dat
a co
llect
ion
, Can
berr
a; 2
011
Rep
ort,
tabl
e 16
A.43
.
Dat
am
ayno
tbe
com
para
ble
acro
ssju
risdi
ctio
nsan
dov
ertim
ean
dco
mpa
rison
sco
uld
bem
isle
adin
g.Th
isis
due
toa
chan
gein
scop
eof
the
ICH
colle
ctio
nin
2007
-08,
varia
tions
inth
eIC
HO
sth
atre
spon
dto
the
surv
ey,
orfo
rw
hich
juris
dict
ions
can
prov
ide
data
,an
dva
riatio
nin
the
way
ICH
oper
ates
inea
chju
risdi
ctio
n.O
rgan
isat
ion
and
hous
ehol
din
form
atio
nm
ayva
ryco
nsid
erab
lybe
caus
eof
the
polic
yan
dpr
ogra
men
viro
nmen
tan
dth
ena
ture
ofth
ese
ctor
.Fu
rther
info
rmat
ion
abou
t the
dat
a in
this
tabl
e ca
n be
foun
d at
ww
w.p
c.go
v.au
/gsp
/repo
rts/ro
gs/2
011.
Cal
cula
tions
onl
y in
clud
e th
ose
dwel
lings
for w
hich
con
nect
ion
stat
us w
as k
now
n.D
ata
are
cons
iste
nt w
ith d
ata
from
the
2006
Com
mun
ity H
ousi
ng a
nd In
frast
ruct
ure
Nee
ds S
urve
y (C
HIN
S).
Dat
a ar
e so
urce
d fro
m th
e Pr
oper
ty C
ondi
tion
and
Tena
nts
Surv
ey 2
006-
07.
Dat
a ar
e no
t ava
ilabl
e fo
r eve
ry d
wel
ling
in th
e W
A. N
o dw
ellin
gs m
anag
ed b
y fu
nded
ICH
Os
are
know
n to
be
lack
ing
conn
ectio
ns.
Dat
a ar
e ba
sed
on T
enan
cy /
Asse
t aud
its c
aptu
red
in 2
008
and
2009
.
HO
US
ING
IND
IGE
NO
US
CO
MP
EN
DIU
M 2
011

Tabl
e 16
A.19
Tabl
e 16
A.1
9
NS
W (c
)V
icQ
ld (d
)W
A (e
)S
A (f
)Ta
sA
CT
NT
Aus
Gov
(g)
Aus
t20
04-0
5na
nana
nana
nana
nana
na20
05-0
6–
..–
––
..–
6.4
0.5
2.4
2006
-07
–..
––
–..
– 6
.4 0
.1 2
.120
07-0
8–
––
– 0
.9..
– 6
.2 0
.1 2
.120
08-0
9–
––
––
..–
na–
na
(a)
(b)
(c)
(d)
(e)
(f) (g)
Indi
geno
us c
omm
unity
hou
sing
na N
ot a
vaila
ble.
.. N
ot a
pplic
able
. – N
il or
roun
ded
to z
ero.
Prop
ortio
n of
per
man
ent d
wel
lings
not
con
nect
ed to
an
orga
nise
d se
wer
age
supp
ly (p
er c
ent)
(a),
(b)
Dat
am
ayno
tbe
com
para
ble
acro
ssju
risdi
ctio
nsan
dov
ertim
ean
dco
mpa
rison
sco
uld
bem
isle
adin
g.Th
isis
due
toa
chan
gein
scop
eof
the
ICH
colle
ctio
nin
2007
-08,
varia
tions
inth
eIC
HO
sth
atre
spon
dto
the
surv
ey,
orfo
rw
hich
juris
dict
ions
can
prov
ide
data
,an
dva
riatio
nin
the
way
ICH
oper
ates
inea
chju
risdi
ctio
n.O
rgan
isat
ion
and
hous
ehol
din
form
atio
nm
ayva
ryco
nsid
erab
lybe
caus
eof
the
polic
yan
dpr
ogra
men
viro
nmen
tan
dth
ena
ture
ofth
ese
ctor
.Fu
rther
info
rmat
ion
abou
t the
dat
a in
this
tabl
e ca
n be
foun
d at
ww
w.p
c.go
v.au
/gsp
/repo
rts/ro
gs/2
011.
Cal
cula
tions
onl
y in
clud
e th
ose
dwel
lings
for w
hich
con
nect
ion
stat
us w
as k
now
n.D
ata
are
mos
tly c
onsi
sten
t with
the
2006
CH
INS.
Dat
a ar
e so
urce
d fro
m th
e Pr
oper
ty C
ondi
tion
and
Tena
nts
Surv
ey 2
006-
07.
Dat
a ar
e no
t ava
ilabl
e fo
r eve
ry d
wel
ling
in th
e St
ate.
No
dwel
lings
man
aged
by
fund
ed IC
HO
s ar
e kn
own
to b
e la
ckin
g co
nnec
tions
.D
ata
are
base
d on
Ten
ancy
/ As
set a
udits
cap
ture
d in
200
8 an
d 20
09.
Dat
a ar
e ba
sed
on s
urve
y re
turn
s fro
m 1
3 ou
t of 2
2 Vi
ctor
ian
ICH
Os,
8 o
ut o
f 68
Que
ensl
and
ICH
OS,
and
1 o
ut o
f 3 T
asm
ania
n IC
HO
S.
Sou
rce
: AI
HW
(200
7, 2
009,
201
0 an
d un
publ
ishe
d) In
dige
nous
Com
mun
ity H
ousi
ng d
ata
colle
ctio
n, C
anbe
rra;
201
1 R
epor
t, ta
ble
16A.
44.
HO
US
ING
IND
IGE
NO
US
CO
MP
EN
DIU
M 2
011

Tabl
e 16
A.20
Tabl
e 16
A.2
0
NS
W (c
)V
icQ
ld (d
)W
A (e
)S
A (f
)Ta
sA
CT
NT
Aus
Gov
(g)
Aus
t20
04-0
5na
nana
nana
nana
nana
na20
05-0
6–
..–
––
..–
5.4
0.1
2.0
2006
-07
–..
––
–..
– 5
.4 0
.3 1
.820
07-0
8–
––
– 0
.7..
– 5
.2–
1.8
2008
-09
––
––
0.8
..–
na–
na
(a)
(b)
(c)
(d)
(e)
(f) (g)
Sou
rce
: AI
HW
(200
7, 2
009,
201
0 an
d un
publ
ishe
d) In
dige
nous
Com
mun
ity H
ousi
ng d
ata
colle
ctio
n, C
anbe
rra;
201
1 R
epor
t, ta
ble
16A.
45.
Indi
geno
us c
omm
unity
hou
sing
na N
ot a
vaila
ble.
.. N
ot a
pplic
able
. – N
il or
roun
ded
to z
ero.
Prop
ortio
n of
per
man
ent d
wel
lings
not
con
nect
ed to
an
orga
nise
d el
ectr
icity
sup
ply
(per
cen
t) (a
), (b
)
Dat
am
ayno
tbe
com
para
ble
acro
ssju
risdi
ctio
nsan
dov
ertim
ean
dco
mpa
rison
sco
uld
bem
isle
adin
g.Th
isis
due
toa
chan
gein
scop
eof
the
ICH
colle
ctio
nin
2007
-08,
varia
tions
inth
eIC
HO
sth
atre
spon
dto
the
surv
ey,
orfo
rw
hich
juris
dict
ions
can
prov
ide
data
,an
dva
riatio
nin
the
way
ICH
oper
ates
inea
chju
risdi
ctio
n.O
rgan
isat
ion
and
hous
ehol
din
form
atio
nm
ayva
ryco
nsid
erab
lybe
caus
eof
the
polic
yan
dpr
ogra
men
viro
nmen
tan
dth
ena
ture
ofth
ese
ctor
.Fu
rther
info
rmat
ion
abou
t the
dat
a in
this
tabl
e ca
n be
foun
d at
ww
w.p
c.go
v.au
/gsp
/repo
rts/ro
gs/2
011.
Cal
cula
tions
onl
y in
clud
e th
ose
dwel
lings
for w
hich
con
nect
ion
stat
us w
as k
now
n.
Dat
a ar
e ba
sed
on s
urve
y re
turn
s fro
m 1
3 ou
t of 2
2 Vi
ctor
ian
ICH
Os,
8 o
ut o
f 68
Que
ensl
and
ICH
OS,
and
1 o
ut o
f 3 T
asm
ania
n IC
HO
S.
Dat
a ar
e m
ostly
con
sist
ent w
ith th
e 20
06 C
HIN
S.D
ata
are
sour
ced
from
the
Prop
erty
Con
ditio
n an
d Te
nant
s Su
rvey
200
6-07
.D
ata
are
not a
vaila
ble
for e
very
dw
ellin
g in
the
Stat
e. N
o dw
ellin
gs m
anag
ed b
y fu
nded
ICH
Os
are
know
n to
be
lack
ing
conn
ectio
ns.
Dat
aar
eba
sed
onTe
nanc
y/A
sset
audi
tsca
ptur
edin
2008
and
2009
.Dw
ellin
gw
ithou
tMet
ered
Pow
erw
itha
cond
ition
ratin
gof
Not
Appl
icab
leor
Poor
are
coun
ted
as n
ot b
eing
con
nect
ed to
ele
ctric
ity.
HO
US
ING
IND
IGE
NO
US
CO
MP
EN
DIU
M 2
011

Tabl
e 16
A.21
Tabl
e 16
A.2
1N
SW
and
AC
T (b
)V
icQ
ldW
AS
ATa
sN
T A
ust
18.
8 2
4.7
26.
3 2
7.9
22.
4 3
0.6
21.
0 2
3.4
2.7
4.5
5.9
10.
1 5
.8–
10.
2 7
.2
(a)
(b)
– N
il or
roun
ded
to z
ero.
Sou
rce
: AB
S (2
007)
Hou
sing
and
Infra
stru
ctur
e in
Abo
rigin
al a
nd T
orre
s S
trait
Isla
nder
Com
mun
ities
200
6, A
ustra
lia; 2
011
Rep
ort,
tabl
e 16
A.46
.
Indi
geno
us c
omm
unity
hou
sing
Dat
a ar
e co
mpi
led
from
200
6 C
omm
unity
Hou
sing
and
Infra
stru
ctur
e N
eeds
Sur
vey
(CH
INS)
.Fo
r the
num
ber o
f per
man
ent d
wel
lings
in n
eed
of m
ajor
repa
ir an
d re
plac
emen
t, th
e AC
T da
ta h
ave
been
incl
uded
with
NSW
due
to lo
w n
umbe
rs.
Dw
ellin
g co
nditi
on, (
per c
ent)
(a)
Prop
ortio
n of
dw
ellin
gs in
nee
d of
maj
or re
pair
Prop
ortio
n of
dw
ellin
gs in
nee
d of
repl
acem
ent
2006
2006
HO
US
ING
IND
IGE
NO
US
CO
MP
EN
DIU
M 2
011

Tabl
e 16
A.22
Tabl
e 16
A.2
2N
SW
(d)
Vic
Qld
(e)
WA
(f)
SA
(g)
Tas
AC
TN
T A
us G
ov (
h)A
ust
(i)20
04-0
5na
nana
nana
nana
nana
na20
05-0
6 8
014
..na
na 7
397
.. 2
5 76
6 6
52 7
916
na20
06-0
7 8
694
.. 3
584
na 3
561
..na
nana
5 4
5120
07-0
8 6
919
3 1
64 7
161
13
831
2 7
08..
7 1
69na
8 2
99 7
841
2008
-09
5 9
86 5
901
3 7
05 6
338
3 2
76..
10
088
na 7
501
5 2
56
(a)
(b)
(c)
(d)
(e)
(f) (g)
(h)
(i)Indi
geno
us c
omm
unity
hou
sing
Sou
rce
:
Dat
am
ayno
tbe
com
para
ble
acro
ssju
risdi
ctio
nsan
dov
ertim
ean
dco
mpa
rison
sco
uld
bem
isle
adin
g.Th
isis
due
toa
chan
gein
scop
eof
the
ICH
colle
ctio
nin
2007
-08,
varia
tions
inth
eIC
HO
sth
atre
spon
dto
the
surv
ey,
orfo
rw
hich
juris
dict
ions
can
prov
ide
data
,an
dva
riatio
nin
the
way
ICH
oper
ates
inea
chju
risdi
ctio
n.O
rgan
isat
ion
and
hous
ehol
din
form
atio
nm
ayva
ryco
nsid
erab
lybe
caus
eof
the
polic
yan
dpr
ogra
men
viro
nmen
tan
dth
ena
ture
ofth
ese
ctor
.Fu
rther
info
rmat
ion
abou
t the
dat
a in
this
tabl
e ca
n be
foun
d at
ww
w.p
c.go
v.au
/gsp
/repo
rts/ro
gs/2
011.
na N
ot a
vaila
ble.
.. N
ot a
pplic
able
.AI
HW
(200
7, 2
009,
201
0 an
d un
publ
ishe
d) In
dige
nous
Com
mun
ity H
ousi
ng d
ata
colle
ctio
n, C
anbe
rra;
201
1 R
epor
t, ta
ble
16A.
47.
Net
recu
rren
t cos
t per
dw
ellin
g (2
008-
09 d
olla
rs) (
a), (
b), (
c)
Aust
ralia
n to
tals
may
not
repr
esen
t nat
iona
l tot
als
beca
use
data
wer
e no
t ava
ilabl
e fo
r all
juris
dict
ions
.
Dat
aar
epr
esen
ted
incu
rren
tpric
esba
sed
onth
eAu
stra
lian
Bure
auof
Stat
istic
s(A
BS)
Gro
ssD
omes
ticPr
oduc
tpric
ede
flato
r(in
dex)
(200
8-09
=10
0)ta
ble
AA.1
1.
Cal
cula
tions
onl
y in
clud
e th
ose
dwel
lings
for w
hich
net
recu
rren
t cos
ts w
ere
know
n.
Dat
a ar
e ba
sed
on s
urve
y re
turn
s fro
m 1
3 ou
t of 2
2 Vi
ctor
ian
ICH
Os,
8 o
ut o
f 68
Que
ensl
and
ICH
OS,
and
1 o
ut o
f 3 T
asm
ania
n IC
HO
S.
Net
recu
rren
t exp
ense
s ar
e th
ose
incu
rred
by
AHO
on
the
Abor
igin
al c
omm
unity
ho
usin
g se
ctor
. Net
recu
rren
t exp
ense
s in
curr
ed b
y IC
HO
s ar
e no
t ava
ilabl
e.
Cou
ncils
are
curr
ently
unab
leto
sepa
rate
the
recu
rren
tcos
tsas
soci
ated
with
hous
ing
serv
ices
from
thos
eas
soci
ated
with
the
othe
rser
vice
sth
eypr
ovid
e.Th
eam
ount
repo
rted
here
isth
eco
stof
mai
nten
ance
serv
ices
prov
ided
byth
eQ
ueen
slan
dG
over
nmen
t,pl
usst
affa
ndre
late
dad
min
istra
tive
cost
sas
soci
ated
with
the
Hea
lthy
Indi
geno
us H
ousi
ng In
itiat
ive.
Incl
udes
Indi
geno
us G
ovt C
oord
inat
ion
cont
ribut
ion.
Tota
lrec
urre
ntco
stis
repo
rted
inst
ead
ofne
trec
urre
ntco
st,a
sda
taon
excl
usio
nsar
eno
thel
d,w
ithth
eex
cept
ion
ofgr
ants
and
subs
idie
s,w
hich
wer
eth
epr
inci
pal m
etho
d of
pay
men
t for
mai
nten
ance
ser
vice
s to
hou
sing
.
Fund
ing
arra
ngem
ents
ass
umes
that
net
and
tota
l rec
urre
nt e
xpen
ses
are
equa
l.
HO
US
ING
IND
IGE
NO
US
CO
MP
EN
DIU
M 2
011

Tabl
e 16
A.23
Tabl
e 16
A.2
3N
SW
(c)
Vic
Qld
(d)
WA
(e)
SA
(f)
Tas
AC
TN
TA
us G
ov (
g)A
ust
(h)
nana
nana
nana
nana
nana
96.
6..
95.
7 7
7.9
88.
3..
95.
7 8
7.0
94.
1 8
9.6
98.
3..
100
.0 9
1.0
89.
0..
100
.0na
94.
9 9
6.2
96.
0 9
9.1
98.
1na
93.
3..
100
.0 1
00.0
96.
6 9
8.3
99.
2 9
7.9
96.
8 8
9.8
87.
7..
100
.0na
95.
3 9
6.5
(a)
(b)
(c)
(d)
(e)
(f) (g)
(h)
2007
2008
Sou
rce
: na
Not
ava
ilabl
e. ..
Not
app
licab
le.
AIH
W (2
007,
200
9, 2
010
and
unpu
blis
hed)
Indi
geno
us C
omm
unity
Hou
sing
dat
a co
llect
ion
, Can
berr
a; 2
011
Rep
ort,
tabl
e 16
A.48
.
2009
Aust
ralia
n to
tals
may
not
repr
esen
t nat
iona
l tot
als
beca
use
data
wer
e no
t ava
ilabl
e fo
r all
juris
dict
ions
.
Dat
am
ayno
tbe
com
para
ble
acro
ssju
risdi
ctio
nsan
dov
ertim
ean
dco
mpa
rison
sco
uld
bem
isle
adin
g.Th
isis
due
toa
chan
gein
scop
eof
the
ICH
colle
ctio
nin
2007
-08,
varia
tions
inth
eIC
HO
sth
atre
spon
dto
the
surv
ey,
orfo
rw
hich
juris
dict
ions
can
prov
ide
data
,an
dva
riatio
nin
the
way
ICH
oper
ates
inea
chju
risdi
ctio
n.O
rgan
isat
ion
and
hous
ehol
din
form
atio
nm
ayva
ryco
nsid
erab
lybe
caus
eof
the
polic
yan
dpr
ogra
men
viro
nmen
tan
dth
ena
ture
ofth
ese
ctor
.Fu
rther
info
rmat
ion
abou
t the
dat
a in
this
tabl
e ca
n be
foun
d at
ww
w.p
c.go
v.au
/gsp
/repo
rts/ro
gs/2
011.
Cal
cula
tions
onl
y in
clud
e th
ose
dwel
lings
for w
hich
occ
upan
cy s
tatu
s w
as k
now
n.
Occ
upan
cy ra
tes
(per
cen
t) (a
), (b
)
2005
2006
Indi
geno
us c
omm
unity
hou
sing
Dat
a ar
e ba
sed
on s
urve
y re
turn
s fro
m 1
3 ou
t of 2
2 Vi
ctor
ian
ICH
Os,
8 o
ut o
f 68
Que
ensl
and
ICH
OS,
and
1 o
ut o
f 3 T
asm
ania
n IC
HO
S.
Tota
lnum
bero
focc
upie
dpe
rman
entd
wel
lings
was
deriv
edby
extra
pola
ting
prop
ortio
nally
fort
hew
hole
ICH
Ose
ctor
,usi
ngth
enu
mbe
rofp
erm
anen
tdw
ellin
gsm
anag
edby
ICH
Os
that
rene
wed
regi
stra
tion
with
Abor
igin
alH
ousi
ngO
ffice
and
wer
eoc
cupi
edas
at30
June
2009
.Cau
tion
shou
ldbe
appl
ied
inus
ing
this
tode
rive
occu
panc
y ra
te a
s 52
of 7
4 un
occu
pied
per
man
ent d
wel
lings
man
aged
by
ICH
Os
that
rene
wed
thei
r reg
istra
tion
wer
e no
t ten
anta
ble.
Dat
aar
eso
urce
dfro
ma
com
bina
tion
ofSA
Pat
30Ju
ne20
09(5
ofth
e6
tena
ncy-
man
aged
com
mun
ities
)an
dQ
uarte
rlyPe
rform
ance
Rep
orts
(rem
aini
ngco
mm
uniti
es).
Cal
cula
tion
is b
ased
on
a re
pres
enta
tive
sam
ple
of 7
02 d
wel
lings
(of w
hich
693
wer
e pe
rman
ent)
as c
ompl
ete
hous
ehol
d le
vel d
ata
was
not
ava
ilabl
e.
Dat
a ar
e ba
sed
on T
enan
cy /
Asse
t aud
its c
aptu
red
in 2
008
and
2009
.
HO
US
ING
IND
IGE
NO
US
CO
MP
EN
DIU
M 2
011

Tabl
e 16
A.24
Tabl
e 16
A.2
4N
SW
(c)
Vic
Qld
(d)
WA
SA
(e)
Tas
AC
TN
T (f
)A
us G
ov (g
)A
ust
2004
-05
nana
nana
nana
nana
nana
2005
-06
89.
4..
97.
4 9
4.1
102
.7..
100
.0 1
03.8
84.
7 9
4.2
2006
-07
90.
0..
96.
6 9
6.8
65.
5..
100
.0 1
11.5
92.
0 9
6.2
2007
-08
89.
8 9
5.4
90.
8 1
01.1
63.
5..
100
.4 1
14.4
93.
2 9
7.6
2008
-09
90.
4 9
4.1
115
.8 6
4.2
60.
3..
100
.0 1
15.6
97.
9 9
6.3
(a)
(b)
(c)
(d)
(e)
(f) (g)
Sou
rce
: na
Not
ava
ilabl
e. ..
Not
app
licab
le.
AIH
W (2
007,
200
9, 2
010
and
unpu
blis
hed)
Indi
geno
us C
omm
unity
Hou
sing
dat
a co
llect
ion
, Can
berr
a; 2
011
Rep
ort,
tabl
e 16
A.49
.
Ren
t col
lect
ed fo
r 10
ICH
Os
is fo
r the
Jun
e to
Dec
embe
r 200
8 po
rtion
of t
he fi
nanc
ial p
erio
d.R
ent c
olle
cted
from
and
rent
cha
rged
to h
ouse
hold
s is
bas
ed o
n da
ta p
rovi
ded
by 2
2 of
the
30 o
rgan
isat
ions
.D
ata
are
base
d on
sur
vey
retu
rns
from
13
out o
f 22
Vict
oria
n IC
HO
s, 8
out
of 6
8 Q
ueen
slan
d IC
HO
S, a
nd 1
out
of 3
Tas
man
ian
ICH
OS.
Indi
geno
us c
omm
unity
hou
sing
Ren
t col
lect
ion
rate
(per
cen
t) (a
), (b
)
Dat
am
ayno
tbe
com
para
ble
acro
ssju
risdi
ctio
nsan
dov
ertim
ean
dco
mpa
rison
sco
uld
bem
isle
adin
g.Th
isis
due
toa
chan
gein
scop
eof
the
ICH
colle
ctio
nin
2007
-08,
varia
tions
inth
eIC
HO
sth
atre
spon
dto
the
surv
ey,
orfo
rw
hich
juris
dict
ions
can
prov
ide
data
,and
varia
tion
inth
ew
ayIC
Hop
erat
esin
each
juris
dict
ion.
Org
anis
atio
nan
dho
useh
old
info
rmat
ion
may
vary
cons
ider
ably
beca
use
ofth
epo
licy
and
prog
ram
envi
ronm
ent
and
the
natu
reof
the
sect
or.
Furth
er in
form
atio
n ab
out t
he d
ata
in th
is ta
ble
can
be fo
und
at w
ww
.pc.
gov.
au/g
sp/re
ports
/rogs
/201
1.C
alcu
latio
ns o
nly
incl
ude
thos
e IC
HO
s fo
r whi
ch b
oth
rent
col
lect
ed a
nd re
nt c
harg
ed w
ere
know
n.R
entc
olle
ctio
nra
teis
base
don
2,11
3dw
ellin
gsfo
rwhi
chfu
llre
ntal
info
rmat
ion
(wee
kly
rent
,wee
kste
nant
able
,and
wee
kin
arre
ars)
was
avai
labl
edu
ring
the
regi
stra
tion
perio
d.
Dat
aar
eso
urce
dfro
ma
com
bina
tion
ofSA
Pat
30Ju
ne20
09(5
ofth
e6
tena
ncy-
man
aged
com
mun
ities
)an
dQ
uarte
rlyPe
rform
ance
Rep
orts
(rem
aini
ngco
mm
uniti
es).
HO
US
ING
IND
IGE
NO
US
CO
MP
EN
DIU
M 2
011

Tabl
e 16
A.25
Tabl
e 16
A.2
5
NS
W (c
)V
icQ
ld (d
)W
AS
A (e
)Ta
sA
CT
(f)
NT
Aus
Gov
(g)
Aus
t (h
)na
nana
nana
nana
nana
nana
.. 3
6.6
na 5
.6..
4.5
na 1
9.3
nana
.. 2
7.2
na 2
4.1
..na
na 2
4.5
na 2
9.1
– 3
6.6
nana
..–
na 1
0.2
na 2
5.1
0.8
32.
5na
31.
8..
–na
13.
7na
(a)
(b)
(c)
(d)
(e)
(f) (g)
(h)
Indi
geno
us c
omm
unity
hou
sing
2007
2008
2005
Dat
a ar
e ba
sed
on s
urve
y re
turn
s fro
m 1
3 ou
t of 2
2 Vi
ctor
ian
ICH
Os,
8 o
ut o
f 68
Que
ensl
and
ICH
OS,
and
1 o
ut o
f 3 T
asm
ania
n IC
HO
S.
2006
Prop
ortio
n of
ove
rcro
wde
d ho
useh
olds
(per
cen
t) (a
), (b
)
Dat
am
ayno
tbe
com
para
ble
acro
ssju
risdi
ctio
nsan
dov
ertim
ean
dco
mpa
rison
sco
uld
bem
isle
adin
g.Th
isis
due
toa
chan
gein
scop
eof
the
ICH
colle
ctio
nin
2007
-08,
varia
tions
inth
eIC
HO
sth
atre
spon
dto
the
surv
ey,
orfo
rw
hich
juris
dict
ions
can
prov
ide
data
,an
dva
riatio
nin
the
way
ICH
oper
ates
inea
chju
risdi
ctio
n.O
rgan
isat
ion
and
hous
ehol
din
form
atio
nm
ayva
ryco
nsid
erab
lybe
caus
eof
the
polic
yan
dpr
ogra
men
viro
nmen
tan
dth
ena
ture
ofth
ese
ctor
.Fu
rther
info
rmat
ion
abou
t the
dat
a in
this
tabl
e ca
n be
foun
d at
ww
w.p
c.go
v.au
/gsp
/repo
rts/ro
gs/2
011.
2009
Sou
rce
:
Cal
cula
tions
onl
y in
clud
e th
ose
hous
ehol
ds fo
r whi
ch d
etai
ls w
ere
know
n.Th
epr
opor
tion
ofho
useh
olds
that
are
over
crow
ded
are
appr
oxim
ate
only
,and
are
base
don
1,55
7dw
ellin
gs,e
xtra
pola
ted
fora
llIC
Hdw
ellin
gs.C
alcu
latio
nsfo
rth
ese
data
item
s ar
e ba
sed
on th
e pr
oxy
stan
dard
.
Dat
a fo
r hou
seho
lds
that
are
ove
rcro
wde
d ar
e ba
sed
on T
enan
cy /
Asse
t aud
its c
aptu
red
in 2
008
and
2009
.D
ata
for t
he h
ouse
hold
s w
ith o
verc
row
ding
are
bas
ed o
n da
ta fo
r 22
of th
e 24
hou
seho
lds.
AIH
W (2
007,
200
9, 2
010
and
unpu
blis
hed)
Indi
geno
us C
omm
unity
Hou
sing
dat
a co
llect
ion
, Can
berr
a; 2
011
Rep
ort,
tabl
e 16
A.50
.na
Not
ava
ilabl
e. ..
Not
app
licab
le. –
Nil
or ro
unde
d to
zer
o.Au
stra
lian
tota
ls m
ay n
ot re
pres
ent n
atio
nal t
otal
s be
caus
e da
ta w
ere
not a
vaila
ble
for a
ll ju
risdi
ctio
ns.
Prox
yst
anda
rdus
edto
calc
ulat
eth
eto
tal
num
ber
ofho
useh
olds
with
over
crow
ding
.D
ata
sour
ced
from
SAP
at30
June
2009
for
6te
nanc
y-m
anag
edco
mm
uniti
es. R
emai
ning
28
com
mun
ities
dat
a as
repo
rted
by P
CAT
sur
vey
in 2
005
and
2006
.
HO
US
ING
IND
IGE
NO
US
CO
MP
EN
DIU
M 2
011

Indi
geno
us c
omm
unity
hou
sing
Tabl
e 16
A.2
6
Uni
tN
SW
(c)
Vic
Qld
(d)
WA
SA
(e)
Tas
AC
T (f
)N
TA
us G
ov (g
)A
ust
2008
-09
1 be
droo
m n
eede
d%
25.
1 5
.0 1
9.5
na 1
5.7
.. 4
.5na
16.
6na
2 be
droo
ms
need
ed%
25.
1 0
.8 3
2.5
na 3
1.8
..–
na 1
3.7
naTo
tal
% 5
0.2
5.9
52.
0na
47.
5..
4.5
na 3
0.3
na
(a)
(b)
(c)
(d)
(e)
(f) (g)
Sou
rce
: A
IHW
(201
0) In
dige
nous
Com
mun
ity H
ousi
ng d
ata
colle
ctio
n, C
anbe
rra;
201
1 R
epor
t, ta
ble
16A.
51.
na N
ot a
vaila
ble.
.. N
ot a
pplic
able
. – N
il or
roun
ded
to z
ero.
Prox
yst
anda
rdus
edto
calc
ulat
eth
eto
tal
num
ber
ofho
useh
olds
with
over
crow
ding
.D
ata
sour
ced
from
SAP
at30
June
2009
for
6te
nanc
y-m
anag
edco
mm
uniti
es. R
emai
ning
28
com
mun
ities
dat
a as
repo
rted
by P
CAT
sur
vey
in 2
005
and
2006
.
Dat
a fo
r hou
seho
lds
that
are
ove
rcro
wde
d ar
e ba
sed
on T
enan
cy /
Asse
t aud
its c
aptu
red
in 2
008
and
2009
.D
ata
for t
he h
ouse
hold
s w
ith o
verc
row
ding
are
bas
ed o
n da
ta fo
r 22
of th
e 24
hou
seho
lds.
Dat
a ar
e ba
sed
on s
urve
y re
turn
s fro
m 1
3 ou
t of 2
2 Vi
ctor
ian
ICH
Os,
8 o
ut o
f 68
Que
ensl
and
ICH
OS,
and
1 o
ut o
f 3 T
asm
ania
n IC
HO
S.
Prop
ortio
nof
Indi
geno
usho
useh
olds
inIn
dige
nous
com
mun
ityho
usin
gliv
ing
inov
ercr
owde
dco
nditi
ons,
bynu
mbe
r of b
edro
oms
need
ed (a
), (b
)
Dat
am
ayno
tbe
com
para
ble
acro
ssju
risdi
ctio
nsan
dov
ertim
ean
dco
mpa
rison
sco
uld
bem
isle
adin
g.Th
isis
due
toa
chan
gein
scop
eof
the
ICH
colle
ctio
nin
2007
-08,
varia
tions
inth
eIC
HO
sth
atre
spon
dto
the
surv
ey,o
rfor
whi
chju
risdi
ctio
nsca
npr
ovid
eda
ta,a
ndva
riatio
nin
the
way
ICH
oper
ates
inea
chju
risdi
ctio
n.O
rgan
isat
ion
and
hous
ehol
din
form
atio
nm
ayva
ryco
nsid
erab
lybe
caus
eof
the
polic
yan
dpr
ogra
men
viro
nmen
tand
the
natu
reof
the
sect
or.F
urth
erin
form
atio
nab
out t
he d
ata
in th
is ta
ble
can
be fo
und
at w
ww
.pc.
gov.
au/g
sp/re
ports
/rogs
/201
1.C
alcu
latio
ns o
nly
incl
ude
thos
e ho
useh
olds
for w
hich
det
ails
wer
e kn
own.
The
prop
ortio
nof
hous
ehol
dsth
atar
eov
ercr
owde
dar
eap
prox
imat
eon
ly,a
ndar
eba
sed
on1,
557
dwel
lings
,ext
rapo
late
dfo
ral
lIC
Hdw
ellin
gs.C
alcu
latio
nsfo
rth
ese
data
item
s ar
e ba
sed
on th
e pr
oxy
stan
dard
.
IND
IGE
NO
US
CO
MP
EN
DIU
M 2
011

Commonwealth Rent Assistance
HOUSINGINDIGENOUSCOMPENDIUM 2011

Tabl
e 16
A.27
Type
of i
ncom
e un
itN
SW
Vic
Qld
WA
SA
Tas
AC
TN
TA
ust
Sing
le, n
o de
pend
ant c
hild
ren
5 4
24 1
294
3 8
65 8
92 7
00 3
46 7
1 3
84 1
2 97
7
Sing
le, n
o ch
ildre
n, s
hare
r 1
318
301
1 4
54 3
34 1
73 1
12 3
8 6
8 3
800
Sing
le, 1
or 2
dep
enda
nt c
hild
ren
4 8
30 8
95 3
376
794
526
309
38
234
11
006
Sing
le, 3
or m
ore
depe
ndan
t chi
ldre
n 1
696
294
1 2
35 2
61 1
38 8
3np
56
3 7
73
Partn
ered
, no
depe
ndan
t chi
ldre
n 1
021
196
893
140
119
132
np 4
0 2
549
Partn
ered
, 1 o
r 2 d
epen
dant
chi
ldre
n 1
754
358
1 9
16 3
87 2
29 2
69np
87
5 0
10
Partn
ered
, 3 o
r mor
e de
pend
ant c
hild
ren
1 2
68 2
04 1
427
260
133
137
np 5
2 3
500
Partn
ered
, illn
ess
or te
mpo
rary
sep
arat
ed 4
7np
54
33
npnp
np 2
3 1
56
Tota
l 1
7 35
8 3
549
14
220
3 1
01 2
025
1 3
92 1
87 9
51 4
2 79
7
(a)
(b)
(c)Com
mon
wea
lth R
ent A
ssis
tanc
e
Tabl
e 16
A.2
7N
umbe
r of I
ndig
enou
s in
com
e un
its re
ceiv
ing
CR
A, 2
010
(a),
(b),
(c)
FaH
CSI
A (u
npub
lishe
d); 2
011
Rep
ort,
tabl
e 16
A.55
.
Incl
udes
inco
me
units
pai
d C
RA
unde
r soc
ial s
ecur
ity o
r fam
ily a
ssis
tanc
e la
w w
ho w
ere
entit
led
to a
dai
ly ra
te o
f ass
ista
nce
at 4
Jun
e 20
10.
Sou
rce
: np
Not
pub
lishe
d.
Stat
e an
d Te
rrito
ry to
tals
incl
ude
peop
le in
unk
now
n lo
calit
ies.
The
Aus
tralia
n to
tals
incl
ude
peop
le in
oth
er te
rrito
ries
and
peop
le w
ith u
nkno
wn
addr
esse
s.
Valu
es o
f les
s th
an 2
0 ar
e re
plac
ed w
ith 'n
p'.
HO
US
ING
IND
IGE
NO
US
CO
MP
EN
DIU
M 2
011

Tabl
e 16
A.28
Type
of i
ncom
e un
itN
SW
Vic
Qld
WA
SA
Tas
AC
TN
TA
ust
Sing
le, n
o de
pend
ant c
hild
ren
31.
2 3
6.5
27.
2 2
8.8
34.
6 2
4.9
38.
0 4
0.4
30.
3
Sing
le, n
o ch
ildre
n, s
hare
r 7
.6 8
.5 1
0.2
10.
8 8
.5 8
.0 2
0.3
7.2
8.9
Sing
le, 1
or 2
dep
enda
nt c
hild
ren
27.
8 2
5.2
23.
7 2
5.6
26.
0 2
2.2
20.
3 2
4.6
25.
7
Sing
le, 3
or m
ore
depe
ndan
t chi
ldre
n 9
.8 8
.3 8
.7 8
.4 6
.8 6
.0 5
.0 5
.9 8
.8
Partn
ered
, no
depe
ndan
t chi
ldre
n 5
.9 5
.5 6
.3 4
.5 5
.9 9
.5 3
.0 4
.2 6
.0
Partn
ered
, 1 o
r 2 d
epen
dant
chi
ldre
n 1
0.1
10.
1 1
3.5
12.
5 1
1.3
19.
3 5
.0 9
.1 1
1.7
Partn
ered
, 3 o
r mor
e de
pend
ant c
hild
ren
7.3
5.7
10.
0 8
.4 6
.6 9
.8 9
.0 5
.5 8
.2
Partn
ered
, illn
ess
or te
mpo
rary
sep
arat
ed 0
.3–
0.4
1.1
––
– 3
.4 0
.4
Tota
l 1
00.0
100
.0 1
00.0
100
.0 1
00.0
100
.0 1
00.0
100
.0 1
00.0
(a)
(b)
Sou
rce
: Fa
HC
SIA
(unp
ublis
hed)
; 201
1 R
epor
t, ta
ble
16A.
56.
Incl
udes
inco
me
units
pai
d C
RA
unde
r soc
ial s
ecur
ity o
r fam
ily a
ssis
tanc
e la
w w
ho w
ere
entit
led
to a
dai
ly ra
te o
f ass
ista
nce
at 4
Jun
e 20
10.
Com
mon
wea
lth R
ent A
ssis
tanc
e
– N
il or
roun
ded
to z
ero.
Tabl
e 16
A.2
8Pr
opor
tion
of In
dige
nous
CR
A re
cipi
ents
, 201
0 (p
er c
ent)
(a),
(b)
Stat
e an
d Te
rrito
ry to
tals
incl
ude
peop
le in
unk
now
n lo
calit
ies.
The
Aus
tralia
n to
tals
incl
ude
peop
le in
oth
er te
rrito
ries
and
peop
le w
ith u
nkno
wn
addr
esse
s.
HO
US
ING
IND
IGE
NO
US
CO
MP
EN
DIU
M 2
011

Tabl
e 16
A.29
Tabl
e 16
A.2
9U
nit
NS
WV
icQ
ldW
AS
ATa
sA
CT
NT
Aus
tN
on-In
dige
nous
Inco
me
units
no.
356
673
240
786
260
931
86
225
78
236
26
348
8 7
00 4
400
1 06
2 35
7In
cap
ital c
ity%
55.6
69.0
41.9
74.2
75.9
43.1
100.
078
.458
.4In
rest
of S
tate
/Ter
ritor
y%
44.3
31.0
58.0
25.6
24.0
56.9
..20
.241
.5
%95
.498
.594
.896
.597
.595
.097
.982
.296
.1
% 9
7.7
99.
3 9
6.4
96.
6 9
8.1
96.
0 9
8.7
69.
8 9
7.4
Indi
geno
us (c
)In
com
e un
itsno
. 1
7 35
8 3
549
14
220
3 1
01 2
025
1 3
92 1
87 9
51 4
2 79
7In
cap
ital c
ity%
26.0
40.7
27.2
55.4
58.3
41.0
100.
051
.532
.6In
rest
of S
tate
/Ter
ritor
y%
74.0
59.2
72.7
44.2
41.7
59.0
..47
.867
.3
% 4
.6 1
.5 5
.2 3
.5 2
.5 5
.0 2
.1 1
7.8
3.9
% 2
.3 0
.7 3
.6 3
.4 1
.9 4
.0 1
.3 3
0.2
2.6
Dis
abilit
y S
uppo
rt P
ensi
on (d
)In
com
e un
itsno
. 7
5 07
9 5
1 43
5 5
1 99
7 1
6 14
2 1
6 78
1 6
067
1 2
23 1
181
219
915
In c
apita
l city
%46
.865
.040
.071
.274
.344
.310
0.0
71.4
53.7
In re
st o
f Sta
te/T
errit
ory
%53
.135
.059
.928
.625
.655
.7..
28.1
46.2
% 2
0.1
21.
1 1
8.9
18.
1 2
0.9
21.
9 1
3.8
22.
1 1
9.9
Com
mon
wea
lth R
ent A
ssis
tanc
e
Indi
geno
us p
opul
atio
n, a
s pr
opor
tion
of to
tal p
opul
atio
n
Inco
me
units
rece
ivin
g C
RA,
by
spec
ial n
eeds
and
geo
grap
hic
loca
tion,
201
0 (a
), (b
)
Non
-Indi
geno
us in
com
e un
its a
s pr
opor
tion
of a
ll C
RA
reci
pien
t in
com
e un
its
Non
-Indi
geno
us p
opul
atio
n, a
s pr
opor
tion
of to
tal p
opul
atio
n
Indi
geno
us in
com
e un
its a
s pr
opor
tion
of a
ll C
RA
reci
pien
t in
com
e un
its
Inco
me
units
as
prop
ortio
n of
all
CR
A re
cipi
ent i
ncom
e un
its
HO
US
ING
IND
IGE
NO
US
CO
MP
EN
DIU
M 2
011

Tabl
e 16
A.29
Tabl
e 16
A.2
9U
nit
NS
WV
icQ
ldW
AS
ATa
sA
CT
NT
Aus
t
Com
mon
wea
lth R
ent A
ssis
tanc
e
Inco
me
units
rece
ivin
g C
RA,
by
spec
ial n
eeds
and
geo
grap
hic
loca
tion,
201
0 (a
), (b
)
% 1
.1 0
.9 1
.2 0
.7 1
.0 1
.2 0
.3 0
.5 1
.0
Age
d 24
yea
rs o
r und
er (
e)In
com
e un
itsno
. 4
8 39
0 3
5 41
5 4
3 14
6 1
4 19
3 1
2 75
2 5
327
2 8
62 8
16 1
62 9
23In
cap
ital c
ity%
45.1
63.7
46.2
77.3
79.3
48.3
100.
074
.656
.1In
rest
of S
tate
/Ter
ritor
y%
54.7
36.2
53.7
22.4
20.6
51.7
..23
.343
.7
% 1
2.9
14.
5 1
5.7
15.
9 1
5.9
19.
2 3
2.2
15.
2 1
4.7
% 0
.7 0
.7 1
.0 0
.6 0
.8 1
.1 0
.8 0
.4 0
.7
Age
d 75
yea
rs o
r ove
r (f)
Inco
me
units
no.
30
965
20
125
21
478
8 1
38 7
725
2 1
60 4
37 2
01 9
1 23
7In
cap
ital c
ity%
52.9
66.8
37.9
70.4
68.0
34.8
100.
064
.255
.1In
rest
of S
tate
/Ter
ritor
y%
47.1
33.2
62.1
29.4
31.9
65.2
..35
.844
.9
% 8
.3 8
.2 7
.8 9
.1 9
.6 7
.8 4
.9 3
.8 8
.3
% 0
.4 0
.4 0
.5 0
.4 0
.5 0
.4 0
.1 0
.1 0
.4
Tota
l inc
ome
units
no.
374
031
244
335
275
151
89
326
80
261
27
740
8 8
87 5
351
1 10
5 15
4
(a)
(b)
(c)
(d)
(e)
Incl
udes
inco
me
units
pai
d C
RA
unde
r soc
ial s
ecur
ity o
r fam
ily a
ssis
tanc
e la
w w
ho w
ere
entit
led
to a
dai
ly ra
te o
f ass
ista
nce
at 4
Jun
e 20
10.
Stat
e an
d Te
rrito
ry to
tals
incl
ude
peop
le in
unk
now
n lo
calit
ies.
The
Aus
tralia
n to
tals
incl
ude
peop
le in
oth
er te
rrito
ries
and
peop
le w
ith u
nkno
wn
addr
esse
s.
Incl
udes
inco
me
whe
re o
ne m
embe
r was
24
year
s ol
d or
you
nger
at 4
Jun
e 20
10.
Incl
udes
inco
me
units
whe
re o
ne m
embe
r has
sel
f-ide
ntifi
ed a
s In
dige
nous
.In
clud
es in
com
e un
its w
here
one
mem
ber w
as in
reci
pien
t of D
isab
ility
Supp
ort P
ensi
on a
t 4 J
une
2010
.
Inco
me
units
as
prop
ortio
n of
all
CR
A re
cipi
ent i
ncom
e un
its
Aged
75
year
s or
ove
r, as
pr
opor
tion
of to
tal p
opul
atio
n
Dis
abilit
y Su
ppor
t Pen
sion
po
pula
tion,
as
prop
ortio
n of
tota
l po
pula
tion
Inco
me
units
as
prop
ortio
n of
all
CR
A re
cipi
ent i
ncom
e un
its
Aged
24
year
s or
und
er, a
s pr
opor
tion
of to
tal p
opul
atio
n
HO
US
ING
IND
IGE
NO
US
CO
MP
EN
DIU
M 2
011

Tabl
e 16
A.29
Tabl
e 16
A.2
9U
nit
NS
WV
icQ
ldW
AS
ATa
sA
CT
NT
Aus
t
Com
mon
wea
lth R
ent A
ssis
tanc
e
Inco
me
units
rece
ivin
g C
RA,
by
spec
ial n
eeds
and
geo
grap
hic
loca
tion,
201
0 (a
), (b
)
(f)
FaH
CSI
A(u
npub
lishe
d);A
BSpo
pula
tion
byag
ean
dse
x,Au
stra
lian
Stat
esan
dTe
rrito
ries,
Cat
.no.
3201
.0,(
unpu
blis
hed)
.ABS
(200
7)20
06C
ensu
sof
Pop
ulat
ion
and
Hou
sing
, Can
berr
a; A
BS (2
008)
Pop
ulat
ion
Pro
ject
ions
, Aus
tralia
, 200
6 - 2
101
, Cat
. no.
322
2.0,
Can
berr
a; 2
011
Rep
ort,
tabl
e 16
A.58
.S
ourc
e:
.. N
ot a
pplic
able
.In
clud
es in
com
e w
here
one
mem
ber w
as 7
5 ye
ars
old
or o
lder
at 4
Jun
e 20
10.
HO
US
ING
IND
IGE
NO
US
CO
MP
EN
DIU
M 2
011

Table 16A.30
NSW Vic Qld WA SA Tas ACT NT Aust
Capital CityWith CRA 44.4 39.4 30.2 24.5 30.2 27.3 38.8 30.9 34.3Without CRA 72.0 70.8 61.9 61.3 66.0 58.8 61.2 68.0 66.1
Rest of StateWith CRA 23.1 22.7 22.2 17.3 19.8 19.5 .. 25.3 22.2Without CRA 55.2 58.2 53.0 48.5 50.2 51.3 .. 58.4 53.8
TotalWith CRA 29.2 30.8 24.4 21.3 26.4 22.3 38.8 28.5 26.5Without CRA 60.0 64.3 55.5 55.6 60.2 54.0 61.2 63.9 58.2
Capital CityWith CRA 39.6 38.0 32.1 25.9 29.1 24.2 38.7 32.2 33.6Without CRA 64.3 67.9 62.0 58.0 63.4 61.4 58.8 64.8 62.9
Rest of StateWith CRA 21.1 21.6 24.2 17.6 18.9 21.4 na 27.0 22.2Without CRA 51.0 55.5 54.1 48.2 51.0 51.3 na 56.1 52.3
TotalWith CRA 26.1 29.3 26.4 22.2 25.3 22.4 39.2 29.9 26.1Without CRA 54.6 61.3 56.3 53.6 58.8 54.8 59.2 61.0 55.9
Capital CityWith CRA 37.5 37.3 30.5 26.0 28.6 30.1 33.3 32.0 32.7Without CRA 65.0 65.7 61.3 56.9 62.2 64.1 58.5 67.7 62.8
Rest of StateWith CRA 21.2 20.6 23.6 19.4 21.9 22.6 na 24.8 22.1Without CRA 51.7 56.2 52.6 49.5 48.8 50.1 na 55.8 52.1
TotalWith CRA 25.6 28.2 25.5 22.9 25.9 25.5 33.8 28.9 25.7Without CRA 55.3 60.6 55.1 53.4 56.9 55.5 58.8 62.5 55.7
Capital CityWith CRA 37.5 32.9 33.0 30.6 29.7 28.6 37.7 30.9 33.5Without CRA 64.9 65.8 61.9 59.0 64.7 61.4 63.1 63.5 63.2
2007
2008
Commonwealth Rent Assistance
Table 16A.30 Proportion of Indigenous income units receiving CRA, paying morethan 30 per cent of income on rent, with and without CRA, 2005 to2010 (per cent) (a), (b)
2005
2006
HOUSINGINDIGENOUSCOMPENDIUM 2011

Table 16A.30
NSW Vic Qld WA SA Tas ACT NT Aust
Commonwealth Rent Assistance
Table 16A.30 Proportion of Indigenous income units receiving CRA, paying morethan 30 per cent of income on rent, with and without CRA, 2005 to2010 (per cent) (a), (b)
Rest of StateWith CRA 21.2 22.9 27.0 24.6 21.4 25.0 np 21.4 23.7Without CRA 52.2 55.9 54.7 51.7 51.1 51.8 np 54.4 53.3
TotalWith CRA 25.4 27.5 28.6 27.9 26.3 26.4 37.7 26.6 27.0Without CRA 55.4 60.4 56.7 55.6 59.2 55.4 63.1 59.4 56.6
Capital CityWith CRA 39.3 33.6 39.8 37.6 36.0 32.3 38.9 37.8 38.0Without CRA 67.0 66.8 68.3 64.9 68.4 66.3 63.8 68.1 67.2
Rest of StateWith CRA 22.9 18.6 32.2 30.3 24.2 24.8 np 22.5 26.4Without CRA 54.6 56.2 60.8 58.2 56.0 51.8 np 57.1 57.1
TotalWith CRA 27.2 24.6 34.2 34.2 31.2 27.7 38.9 30.5 30.2Without CRA 57.8 60.5 62.9 61.9 63.4 57.4 63.8 62.9 60.4
Capital CityWith CRA 38.6 35.9 43.7 43.1 38.6 35.2 40.0 38.1 40.1Without CRA 71.3 69.0 72.3 70.1 69.6 66.6 66.5 68.9 70.7
Rest of StateWith CRA 22.9 20.6 32.2 31.7 23.1 24.9 .. 23.4 26.6Without CRA 58.3 58.0 62.1 59.3 57.9 57.7 .. 60.5 59.6
TotalWith CRA 27.0 26.8 35.4 38.1 32.1 29.2 40.0 31.0 31.0Without CRA 61.7 62.4 64.9 65.3 64.7 61.3 66.5 64.8 63.3
(a)
(b)
2009
na Not available. .. Not applicable. – Nil or rounded to zero.Source : FaHCSIA (unpublished); 2011 Report, table 16A.76.
2010
Includes income units paid CRA under social security or family assistance law who were entitled to adaily rate of assistance, where one member of the income unit has self-identified as Indigenous.Excludes a small number of income units where income details are incomplete.
See section 16.6 for an explanation of how the proportion of income spent on rent is calculated.
HOUSINGINDIGENOUSCOMPENDIUM 2011

Commonwealth Rent Assistance
NSW Vic Qld WA SA Tas ACT NT Aust
With CRA 28.0 31.2 22.7 23.6 26.7 21.3 39.8 36.0 25.8 27.0 31.8 20.8 22.5 25.9 17.8 38.1 30.2 24.4 29.0 30.5 23.3 21.2 27.5 21.0 40.9 28.7 25.9 28.0 30.6 22.3 22.5 26.1 20.0 43.6 30.7 25.4 29.2 30.8 24.4 21.3 26.4 22.3 38.8 28.5 26.5 26.1 29.3 26.4 22.2 25.3 22.4 39.2 29.9 26.1 25.6 28.2 25.5 22.9 25.9 25.5 33.8 28.9 25.7 25.4 27.5 28.6 27.9 26.3 26.4 37.7 26.6 27.0 27.2 24.6 34.2 34.2 31.2 27.7 38.9 30.5 30.2 27.0 26.8 35.4 38.1 32.1 29.2 40.0 31.0 31.0
Without CRA 60.4 67.1 57.7 56.3 59.1 58.1 69.4 68.0 59.6 61.9 68.2 55.9 58.3 59.7 52.2 66.7 69.2 59.6 61.0 66.8 57.3 57.9 60.7 55.7 64.6 66.0 59.7 60.3 65.7 55.0 58.0 60.4 54.2 66.4 63.9 58.5 60.0 64.3 55.5 55.6 60.2 54.0 61.2 63.9 58.2 54.6 61.3 56.3 53.6 58.8 54.8 59.2 61.0 55.9 55.3 60.6 55.1 53.4 56.9 55.5 58.8 62.5 55.7 55.4 60.4 56.7 55.6 59.2 55.4 63.1 59.4 56.6 57.8 60.5 62.9 61.9 63.4 57.4 63.8 62.9 60.4 61.7 62.4 64.9 65.3 64.7 61.3 66.5 64.8 63.3
(a)
(b)
2004
2004
2008
2001
20092010
2006
Source : FaHCSIA (unpublished); 2011 Report, table 16A.77.
Table 16A.31 Proportion of Indigenous income units receiving CRA, paying morethan 30 per cent of income on rent, with and without CRA, 2001 to2010 (per cent) (a), (b)
2007
2007
2002
2003
2003
20012002
See section 2011 Report, 16.6 for an explanation of how the proportion of income spent on rent iscalculated.
Includes income units paid CRA under social security or family assistance law who were entitled to adaily rate of assistance, where one member of the income unit has self-identified as Indigenous.Excludes a small number of income units where income details are incomplete.
2010
2005
2005
2006
20082009
INDIGENOUSCOMPENDIUM 2011

Descriptive information
HOUSINGINDIGENOUSCOMPENDIUM 2011

Table 16A.32
NSW (f), (g) Vic (h) Qld (h) WA (i) SA (h) Tas AustLess than or equal to 20 per cent
2006 30.0 49.4 67.2 67.3 34.9 32.2 47.92007 22.0 45.1 36.2 65.3 33.9 30.1 36.92008 17.0 41.8 38.7 62.6 36.1 38.1 35.72009 17.0 29.7 36.1 63.1 37.9 35.9 34.52010 15.1 na 36.5 66.4 39.0 32.9 37.3
More than 20 per cent but not more than 25 per cent2006 61.4 50.2 32.7 31.6 63.3 57.0 48.62007 69.6 54.9 63.6 30.0 63.4 61.3 58.82008 75.7 58.2 61.1 31.9 60.8 52.2 60.22009 74.4 70.3 63.7 34.1 60.7 54.8 61.52010 83.8 na 63.2 29.2 57.3 56.3 60.4
More than 25 per cent but not more than 30 per cent2006 8.6 – 0.0 0.6 0.9 7.8 3.22007 8.4 – – 4.4 1.8 8.6 4.02008 7.2 – 0.1 3.9 1.8 9.6 3.62009 6.1 – 0.1 2.0 0.8 9.3 2.92010 1.0 na 0.3 2.5 1.5 10.8 1.5
Greater than 30 per cent2006 – 0.4 0.0 0.5 0.9 3.0 0.32007 – – 0.1 0.4 0.9 – 0.22008 – – 0.2 1.6 1.3 – 0.52009 2.5 – 0.1 0.8 0.5 – 1.12010 0.1 na 0.1 2.0 2.2 – 0.8
(a)
(b)
(c)
(d)
(e)
Amounts of up to but excluding 0.5 per cent above the cut-off for a category are to be included in thatcategory. For example, if rent charged/income x 100 = 20.4, then it is counted in the 'paying 20 per centor less' category.
Data for total rebated households paying 20 per cent or less, more than 20 per cent but not more than 25per cent, more than 25 per cent but not more than 30 per cent and more than 30 per cent of assessableincome in rent exclude households where either assessable income or rent charged is zero.
The ACT does not have a separately identified or funded Indigenous housing program. People ofIndigenous descent are housed as part of the public rental housing program.
Most Indigenous-specific housing programs in the NT are currently community managed andadministered. The NT is moving to a Public Housing management framework across all regions.
Descriptive Information
Table 16A.32 Proportion of household income spent on rent — state owned andmanaged Indigenous housing (per cent) (a), (b), (c), (d), (e)
Data are not comparable over time, due to a change in methodology for 2009-10. Data for 2009-10 arefor low income households in SOMIH paying gross income on rent, while data for 2008-09 and precedingyears are rebated households in SOMIH paying assessable income on rent. Further information aboutthe data in this table can be found at www.pc.gov.au/gsp/reports/rogs/2011.
HOUSINGINDIGENOUSCOMPENDIUM 2011

Table 16A.32
NSW (f), (g) Vic (h) Qld (h) WA (i) SA (h) Tas Aust
Descriptive Information
Table 16A.32 Proportion of household income spent on rent — state owned andmanaged Indigenous housing (per cent) (a), (b), (c), (d), (e)
(f)
(g)
(h)
(i)
Source : AIHW (2006, 2008, 2009) CSHA national data report ; AIHW (2010, 2011) Housing assistancetables ; 2011 Report, table 16A.94.
– Nil or rounded to zero. na Not available.
Total rebated households paying 20 per cent or less, more than 20 per cent but not more than 25 percent, more than 25 per cent but not more than 30 per cent and more than 30 per cent of assessableincome in rent are based upon gross income (not assessable income).
Since 2005-06 and with the introduction of the Reshaping Public Housing policy, moderate incomerenters are charged 25–30 per cent of their income as rent. Some SOMIH tenants are eligible to receiveCRA and the CRA component of their income is assessed at 100 per cent for rent.
No household is charged more than 30 per cent of income for rent. Households in these categories arethe result of rent and/or income details not having been updated.
No household is charged more than 25 per cent of assessable income for rent. Households in thesecategories are the result of rent and/or income details having not been updated or minor policyvariations.
HOUSINGINDIGENOUSCOMPENDIUM 2011

Table 16A.33
NSW Vic Qld WA SA Tas Aust
Underutilisation2006 22.0 15.8 11.9 9.2 24.7 15.2 16.82007 23.1 14.1 11.5 13.8 24.9 14.7 17.72008 23.9 14.4 11.0 13.1 24.1 14.7 17.62009 23.5 16.5 11.4 12.5 23.3 15.8 17.52010 76.1 .. 51.1 52.6 64.0 70.2 60.9
(a)
(b)
(c)
(d)
.. Not applicable.AIHW (2006, 2008, 2009) CSHA national data report ; AIHW (2010, 2011) Housing assistancetables ; 2011 Report, table 16A.97.
Source :
Descriptive Information
Proportion of households in State owned and managed Indigenoushousing with underutilisation, (per cent) (a), (b), (c), (d)
Table 16A.33
Data are not comparable over time. Data for 2010 are based on the Canadian National OccupancyStandard (where one or more bedrooms are required to meet the standard), while data prior to 2010are based on a proxy standard (where two or more bedrooms are required to meet the standard).Underutilisation using the CNOS will be higher than for the proxy standard. Further information aboutthe data in this table can be found at www.pc.gov.au/gsp/reports/rogs/2011.The ACT does not have a separately identified or funded Indigenous housing program. People ofIndigenous descent are housed as part of the public rental housing program. There is no SOMIH inVictoria in 2009-10.
Most Indigenous-specific housing programs in the NT are currently community managed andadministered. The NT is moving to a Public Housing management framework across all regions.
Comparisons between jurisdictions' data should be made with caution as jurisdictions exclude varioustypes of households in total households with under-utilisation, as shown in the 2011 Report, table16A.104.
HOUSINGINDIGENOUSCOMPENDIUM 2011
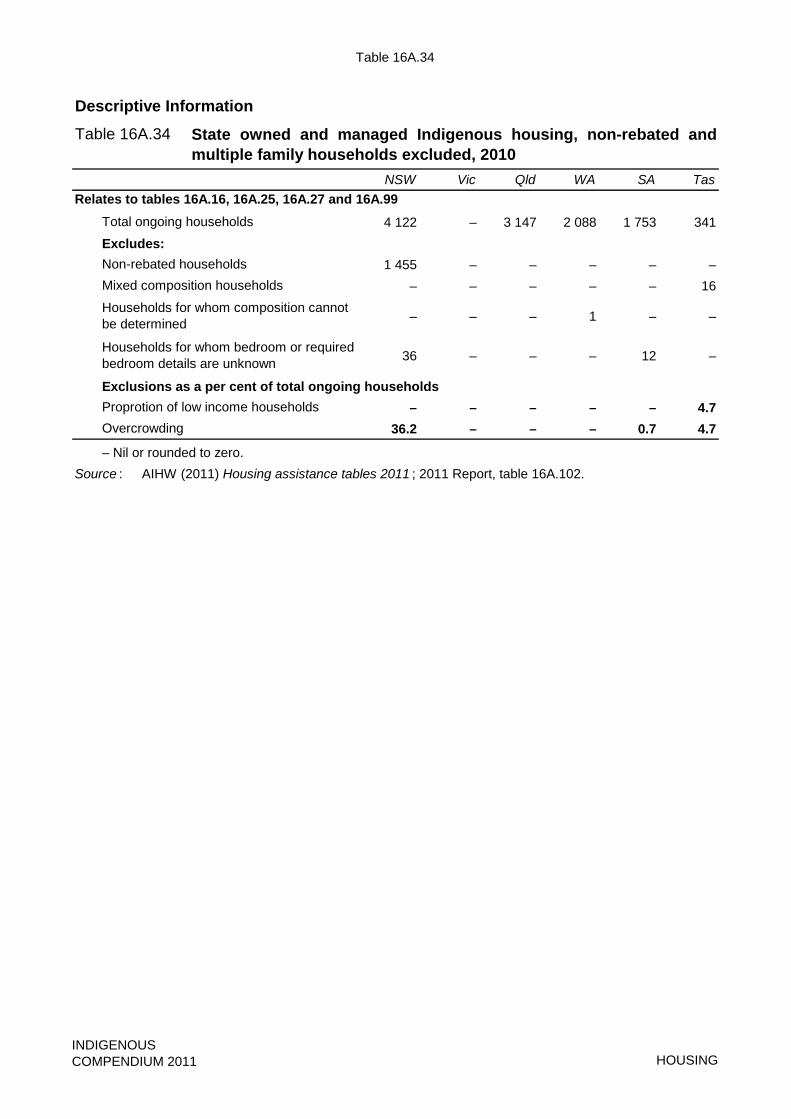
Table 16A.34
Table 16A.34
NSW Vic Qld WA SA Tas
4 122 – 3 147 2 088 1 753 341Excludes:
1 455 – – – – –– – – – – 16
– – – 1 – –
36 – – – 12 –
Exclusions as a per cent of total ongoing households– – – – – 4.7
36.2 – – – 0.7 4.7
Source : – Nil or rounded to zero.
AIHW (2011) Housing assistance tables 2011 ; 2011 Report, table 16A.102.
Total ongoing households
Non-rebated householdsMixed composition households
Households for whom composition cannot be determined
Descriptive Information
State owned and managed Indigenous housing, non-rebated andmultiple family households excluded, 2010
OvercrowdingProprotion of low income households
Relates to tables 16A.16, 16A.25, 16A.27 and 16A.99
Households for whom bedroom or required bedroom details are unknown
HOUSINGINDIGENOUSCOMPENDIUM 2011

Tabl
e 16
A.35
Tabl
e 16
A.3
5N
SW
(b)
Vic
(c)
Qld
WA
(d)
SA
(e)
Tas
(f)
460
..60
943
077
645
0N
one
..76
750
liqu
id
t41
000
cas
h30
7 00
035
000
18..
Non
e18
Non
e16
Com
bine
d w
ith p
ublic
hou
sing
..C
ombi
ned
with
pu
blic
hou
sing
Com
bine
d w
ith
publ
ic h
ousi
ngN
eed
(four
se
gmen
ts)
Prio
rity,
sim
ilar t
o pu
blic
hou
sing
Non
e..
Non
eN
one
12 m
onth
s3–
6 m
onth
s3
and
6 m
onth
s 2,
5 a
nd 1
0 ye
ars
..N
one
3 or
6 m
onth
sN
one
1–3
year
s
Con
tinuo
us le
ases
refe
r to
tena
nts
who
wer
e ho
used
be
fore
1 J
uly
2005
.H
ousi
ng N
SW n
o lo
nger
of
fers
con
tinuo
us le
ases
.
..Su
bjec
t to
revi
ewO
ngoi
ngO
ngoi
ng a
fter
prob
atio
nD
epen
dant
s on
ho
usin
g hi
stor
y
Prio
r to
the
end
of th
e te
nanc
y..
Rev
iew
at 4
or 1
0 ye
ars
Annu
alN
one
Fixe
d te
rm le
ases
re
view
ed a
t end
of
each
term
25–3
0..
2523
or 2
525
23–2
5
(a)
At 3
0 Ju
ne.
Reb
ated
rent
set
ting
Ren
t-to-
inco
me
ratio
(%)
Des
crip
tive
Info
rmat
ion
SOM
IH h
ousi
ng p
olic
y co
ntex
t, 20
10 (a
)
Elig
ibili
tyIn
com
e lim
it pe
r wee
k ($
) (g)
Oth
er' a
sset
lim
its ($
) (g)
Min
imum
age
(yea
rs)
Fixe
d te
rm
Ong
oing
Tena
ncy
revi
ew
Wai
ting
list
Det
ails
Tenu
re Prob
atio
n pe
riod
HO
US
ING
IND
IGE
NO
US
CO
MP
EN
DIU
M 2
011

Tabl
e 16
A.35
Tabl
e 16
A.3
5N
SW
(b)
Vic
(c)
Qld
WA
(d)
SA
(e)
Tas
(f)
Des
crip
tive
Info
rmat
ion
SOM
IH h
ousi
ng p
olic
y co
ntex
t, 20
10 (a
)
(b)
(c)
(d)
(e)
(f) (g)
Inte
rest
accr
ued
from
cash
asse
tsis
asse
ssed
asin
com
ele
ssth
efir
st$5
000
ofea
chpe
rson
’ssa
ving
s.Ap
plic
ants
unde
rthe
age
of18
year
sm
ustd
emon
stra
teliv
ing
skills
tobe
elig
ible
for
hous
ing.
Tena
nts
hous
edpr
ior
to1
July
2005
wer
ege
nera
llypr
ovid
edw
itha
cont
inuo
usle
ase.
New
tena
nts
hous
edsi
nce
1Ju
ly20
05ar
ege
nera
llypr
ovid
edw
itha
fixed
term
leas
e.N
ewte
nanc
ies
from
1Ju
ly20
05to
22O
ctob
er20
06w
ere
sign
edto
18m
onth
inte
rimte
nanc
ies.
Tena
nts
onan
18m
onth
fixed
term
leas
ear
ere
view
edpr
iort
oth
een
dof
leas
e,an
dif
elig
ible
,are
offe
red
a2,
5or
10ye
arle
ase.
Ifin
elig
ible
,the
yar
eof
fere
da
12m
onth
fixed
term
leas
e. F
rom
23
Oct
ober
200
6 th
e D
epar
tmen
t beg
an to
offe
r 2, 5
or 1
0 ye
ar le
ases
to n
ew te
nant
s an
d ce
ased
to o
ffer t
he 1
8 m
onth
inte
rim le
ases
.
Sou
rce
: St
ate
and
Terr
itory
gov
ernm
ents
(unp
ublis
hed)
; 201
1 R
epor
t, ta
ble
16A.
105.
The
rent
-to-in
com
era
tiois
indi
cativ
eon
ly.
The
maj
ority
ofho
useh
olds
pay
amou
nts
with
inth
isra
nge,
but
som
epa
yle
sser
orhi
gher
amou
nts,
depe
ndin
gon
hous
ehol
d co
mpo
sitio
n an
d th
e re
latio
nshi
p of
hou
seho
ld m
embe
rs to
the
tena
nt, f
or e
xam
ple,
boa
rder
, par
ent,
inde
pend
ent c
hild
.
Lim
its a
re fo
r a s
ingl
e pe
rson
.
From
5D
ecem
ber
2005
new
thre
shol
dsan
dru
les
dete
rmin
ew
heth
era
tena
ntis
elig
ible
for
are
ntsu
bsid
yan
dth
epe
rcen
tage
ofin
com
eth
eyw
illpa
yas
rent
.Th
eir
hous
ehol
d’s
gros
sas
sess
able
inco
me,
hous
ehol
dsi
zean
dag
eof
hous
ehol
dm
embe
rsar
eus
edw
hen
asse
ssin
gth
eho
useh
old’
sel
igib
ility
for
are
ntsu
bsid
y.Fo
rreb
ated
rent
s,va
ried
conc
essi
onal
rate
sar
eap
plic
able
toce
rtain
age
grou
psan
dso
me
pens
ione
rs.F
orho
useh
olds
rece
ivin
gFa
mily
Tax
Bene
fits
Part
A an
d Pa
rt B
paid
by
Cen
trelin
k, th
ese
paym
ents
are
ass
esse
d at
15
per c
ent.
The
sam
ede
finiti
onas
the
Cen
trelin
kas
sett
estt
hres
hold
fora
sing
lepe
rson
who
does
noto
wn
thei
row
nho
me
isus
ed.M
osth
ouse
hold
spa
ya
rent
toin
com
era
tioof
25pe
rce
ntof
asse
ssab
lein
com
ein
rent
.How
ever
,hou
seho
lds
rece
ivin
gle
ssth
anth
esi
ngle
New
star
tAllo
wan
cepa
yre
ntto
inco
me
ratio
of19
.5pe
rce
nt.
SOM
IH d
wel
lings
hav
e be
en tr
ansf
erre
d to
ICH
.Th
e in
com
e lim
it fo
r tho
se in
nor
th w
est r
emot
e ar
eas
is $
610
per w
eek.
Tho
se a
ged
over
60
year
s ar
e su
bjec
t to
a ca
sh a
sset
lim
it of
$80
000
.
HO
US
ING
IND
IGE
NO
US
CO
MP
EN
DIU
M 2
011