1996 annual report - s1.q4cdn.coms1.q4cdn.com/579586326/files/doc_financials/ar1996.pdf · 1996...
TRANSCRIPT

1996 Annual Report

October 14, 1999 1:12 AM
Contents
Five Year Financial Highlights 1
Corporate Profile 2
Chairman's Letter to Shareholders 4
Auditors' Report to the Shareholders 19
Valuation Actuary's Report 19
Fairfax Consolidated Financial Statements 20
Notes to Consolidated Financial Statements 24
Management's Discussion and Analysis 35
Fairfax Insurance and Reinsurance Companies - Combined Financial Statements 54
Fairfax with Equity Accounting of Lindsey Morden - Consolidated Financial Statements 56
Lindsey Morden Group Inc. - Consolidated Financial Statements 58
Fairfax Unconsolidated Financial Statements 60
Appendix 62
Consolidated Financial Summary 66
Corporate Information 67

October 14, 1999 1:12 AM
1
1996 Annual Report
..
Five Year Financial Highlights
(in $ millions except share and per share data) 1996 1995 1994 1993 1992
Revenue 1,475.8 1,145.5 634.9 344.0 286.8
Net earnings 150.8 87.5 38.1 33.3 10.0
Total assets 5,778.4 * 2,873.5 * 2,173.4 1,200.3 590.5
Shareholders' equity 911.1 472.6 391.9 279.5 143.8
Shares outstanding - year-end (mil.) 10.5 8.9 9.0 8.0 6.1
Return on average equity 21.4% 20.1% 12.1% 20.3% 7.7%Per share
Net earnings 15.36 9.79 4.66 5.42 1.76
Shareholders' equity 87.05 53.28 43.77 35.13 23.76Market prices per share
High 310.00 100.00 76.00 61.25 30.00
Low 98.00 66.25 52.00 24.00 21.75
Close 290.00 98.00 67.00 61.25 25.00
*reflects a change in accounting policy for reinsurance recoverables (note 2 to the financial statements)

October 14, 1999 1:12 AM
2
CORPORATE PROFILE
Fairfax Financial Holdings Limited is a financial services holding company whose corporate objective
is to achieve a high rate of return on invested capital and build long term shareholder value. The
company has been under present management since September 1985.
Commonwealth Insurance, based in Vancouver, offers commercial property and oil and gas
insurance in Canada, the United States and internationally, and commercial casualty insurance in
Canada. In 1996 Commonwealth's net premiums written totalled $87.3 million. Commonwealth has
been in business since 1947 and at year-end the company had capital and surplus of $136.9 million
and there were 127 employees.
Federated Insurance is based in Winnipeg. Its two companies market a broad range of insurance
products in Canada primarily for commercial customers. In 1996 Federated's net premiums written
totalled $60.4 million, consisting of $49.5 million of property and casualty business and $10.9 million
of life and group health and disability products. Federated has been in business since 1920 and at the
end of 1996 had capital and surplus of $51.8 million and 238 employees.
Lombard Insurance, based in Toronto, writes a complete range of commercial and personal insurance
products in Canada. The company has been in business since 1904. In 1996 Lombard's net premiums
written were $357.6 million. At year-end the company had capital and surplus of $196.4 million and
there were 671 employees.
Markel Insurance, based in Toronto, is one of the largest trucking insurance companies in Canada
and has provided the Canadian trucking industry with a continuous market for this class of insurance
since 1951. In 1996 net premiums written were $62.6 million and the company had 95 employees and
capital and surplus of $52.8 million at year-end.
Ranger Insurance, based in Houston, Texas, specializes in writing property and casualty insurance
to niche markets in the United States such as propane distributors, petroleum and gas marketers and
agri-products. The company has been in business since 1923. In 1996 Ranger's net premiums written
were US$156.0 million. At year-end the company had capital and surplus of US$121.3 million and
there were 293 employees.
CRC (Bermuda) Reinsurance, based in Bermuda, continues to be a major reinsurer of Lombard
Insurance. The company received its insurance certificate early in 1995 and had net premiums written

October 14, 1999 1:12 AM
3
in 1996 of $99.0 million. At year-end the company had capital and surplus of $65.0 million.
Compagnie Transcontinentale de Réassurance (CTR) is based in Paris, France and writes primarily
property, casualty and some life reinsurance internationally. The company was established in 1951 and
in 1996 CTR=s net premiums written exceeded FF1.5 billion (approximately FF4 = C$1). At year-end
the company had capital and surplus of FF900 million and 170 employees.
Odyssey Reinsurance (formerly Skandia America Reinsurance) is based in New York, New York and
writes property and casualty reinsurance in the United States and Canada. The company was
established in 1918 and in 1996 Odyssey Re's net premiums written were US$201 million. At year-end
the company had capital and surplus of US$364.6 million and 170 employees.
Wentworth Insurance was incorporated in 1990 as an insurance company domiciled in Barbados.
In 1996 Wentworth's net premiums written were $8.3 million. At year-end the company had capital and
surplus of $123.7 million and there were 7 employees.
Lindsey Morden Group is engaged in providing claims adjusting, appraisal and loss management
services to a wide variety of insurance companies and self-insured organizations across Canada and
the United States. In 1996 revenue totalled $162.3 million. The company was established in 1923, and
at year-end the group had 1,513 employees located in 299 offices.
Hamblin Watsa Investment Counsel provides discretionary investment management, primarily to
pension funds and insurance companies, including the insurance company subsidiaries of Fairfax.
Hamblin Watsa was founded in 1984 and at year-end managed approximately $5 billion.
Note: All companies are wholly owned except Lindsey Morden Group, a public company of whichFairfax owns 57% of the equity and 92% of the votes.

October 14, 1999 1:12 AM
4
To Our ShareholdersWhat a way to begin the second decade of our corporate existence! While we have had some
great years in the past, 1996 was certainly the best yet. We earned 21.4% on average
shareholders' equity in 1996 (versus 9.1% for the TSE 300). Net income after tax increased by
72% to $150.8 million. In spite of an 18% increase in shares outstanding, earnings per share
increased by 57% to $15.36. Book value per share increased by 63% to $87.05 and our shares
almost tripled to $290 per share. I did not realize that my comment last year about my shares not
being for sale at even $200 per share would be tested so soon!
While we were gratified by these results, what made 1996 special was that we developed a global
reinsurance business through the purchase of two reinsurance companies, and ended the year in a
stronger financial position than when we began. We accessed the long end of the U.S. bond
market for the first time and we ended the year with in excess of $100 million in cash in the holding
company and unused, unsecured, committed, long term bank lines of $600 million. Also, unlike
many companies that have grown through acquisition, we have negative goodwill resulting from
acquisitions at discounts to book value that, with the recent purchase of CTR, will amount to $193
million ($18 per share). This is effectively an after-tax reserve or cushion for the proverbial "rainy
day". In addition, we have about $350 million (or $33 per share) in reserve and reinsurance
recoverable indemnifications that are not shown on our balance sheet. You can see why we think
1996 was so good.
This is perhaps the best time to give you the bad news! All of this was not based on a >'vision='
statement or long term plan that we have at Fairfax. It was simply reacting to the opportunities that
presented themselves to us and doing what we considered was best for shareholders in the long
term. If Jim Dowd, Chief Executive Officer of Odyssey Re, hadn't phoned me in December 1995,
all of this may not have taken place. This also means that there is no way the results in 1996 can
be extrapolated into the future. So don't be surprised if we make no acquisitions in the next five
years.
The acquisitions of Odyssey Re and CTR were so significant to Fairfax that we decided to provide
additional disclosure on each purchase in our first and third quarter reports to you (as opposed to
waiting for this report). These disclosures are reprinted in the Appendix for those of you who are
truly long term investors and only read our Annual Report! Please read them carefully as they not
only outline the reasons for our purchase but also the risks involved.

October 14, 1999 1:12 AM
5
The following are highlights on the two purchases together:
1) Odyssey Re is a North American reinsurer while CTR operates worldwide with offices in Paris,
Singapore, Tokyo and New York. CTR's North American business is small and was easily
amalgamated into Odyssey Re. Essentially there is very little overlap between the two
companies and together they have a global network. Jim Dowd and Andy Barnard run
Odyssey Re and Jean-Philippe Casanova runs CTR in co-ordination with Andy. All three are
firmly committed to underwriting profitability and not market share growth. As we have little
experience outside North America, it is fair to say that we would not have purchased CTR if
Andy had not joined the group.
2) The two companies together will write net premiums in excess of US$500 million with capital
in excess of US$500 million, ranking the Odyssey Re/CTR group among the top reinsurers in
the U.S.
3) Both companies were purchased in our "fair and friendly" way from Skandia, Sweden and the
GAN group, France.
4) Both companies have significant long tail liabilities (including asbestos and environmental).
We feel the indemnifications are sufficient protection, but only time will tell.
5) Both companies have significant reinsurance recoverables and are exposed to potential bad
debts on these recoverables. We feel the bad debt reserves in place, together with the
indemnifications, will prove adequate, but again only time will tell.
6) As mentioned in our first quarter report, reinsurance is a business that magnifies the abilities
of management. We are very excited about our long term prospects in the reinsurance
business under the stewardship of Jim, Andy and Jean-Philippe. We welcome them and the
employees of Odyssey Re and CTR to Fairfax and look forward to participating in their
companies' growth.
We financed the purchase of the two reinsurance companies by issuing 1.1 million shares at $155
per share and 500,000 shares at $260 per share to raise a total of approximately $300 million. The
issues were led by Dick Falconer from CIBC Wood Gundy and ably supported by ScotiaMcLeod,
RBC Dominion Securities, Nesbitt Burns, TD Securities, Deutsche Morgan Grenfell Canada, First
Marathon, Midland Walwyn and Newcrest Capital. We thank them for an excellent job. After not
issuing shares for seven years ending in 1993, we have raised almost $500 million from share
issues in the past three years. No wonder the investment dealer industry is doing well! We
welcome our new shareholders and emphasize again, as we did in 1993 and 1994, that our
company is run for the long term. So don't be too concerned about short term results as we will

October 14, 1999 1:12 AM
6
accept short term volatility in our earnings for better long term results. We have been fortunate not
to have had any short term (read quarterly) surprises but I'm sure they will come one of these days!
We have mentioned in the past that we are very careful about issuing shares. In our 1986 Annual
Report we said, "We consider our stock as good as cash. When we issue stock, we will ensure
that we get as much value as we give." While we have been very clear about the "getting" part, we
consider the "giving" part to be equally important. So, while we have raised money at higher and
higher stock prices in 1996, we feel our new shareholders are getting excellent long term value -
otherwise we would not issue shares at these prices. Remember we said long term. In the short
term, we have no idea where our shares will trade.
To help finance the purchase of Odyssey Re, we did our third U.S. debt financing, led again by J. P.
Morgan and strongly supported by Credit Suisse First Boston and Deutsche Morgan Grenfell. For
the first time, as we said earlier, we were able to access the long end of the U.S. bond market (30
years) with the issue of US$125 million of unsecured debentures with an effective interest cost of
83% per annum and a 30 year term to maturity. You may be surprised to know that in the property
and casualty industry there are only nine companies in the U.S., and only Fairfax in Canada, that
have 30 year bonds outstanding. We were happy with the absolute rate but the spread of 153 basis
points over comparable treasuries was a little higher than we expected.
The spread over comparable treasuries of all three of our U.S. debenture issues has contracted
dramatically in 1996 and at year-end was in the range of 85 basis points for our 2003 issue, 110
basis points for our 2015 issue and 120 basis points for our 2026 issue - all significantly down from
where we issued the debentures. While much of this is due to the general narrowing in corporate
spreads, we feel there is a wider recognition in the bond market of our very strong financial position.
Unfortunately, we have yet to convince the rating agencies to upgrade Fairfax to an A from BBB+.
We welcome our new debenture investors and want to reassure them that we continue to have an
A rating as our objective. Our ability to access the U.S. bond market over all maturity levels is a
very significant strength of our company and one that we do not take lightly.
By way of perspective, the table below shows you how significantly we have grown in 1996.
.. ($ millions)
As of December 31 1995 1996 * IncreaseNet premiums written 865 1,500 1.7x
Investment portfolio 1,669 4,100 2.5x
Shareholders' equity 473 911 1.9x
Net debt 228 417 1.8x
Shares outstanding 8.9 10.5 1.2x
*Includes CTR, which closed in February 1997

October 14, 1999 1:12 AM
7
As shown, net premiums written, shareholders' equity and net debt have grown by approximately 2
times and the investment portfolio has increased 2.5 times, while the number of shares outstanding
has increased only 1.2 times. Obviously, reinsurance is now a very significant activity for Fairfax
and our future will be very dependent on the performance of our two recent acquisitions.
Investments per share have increased from $188 per share at year-end 1995 to $390 per share at
year-end 1996 (including CTR) - an increase of 107%. Investment income per share (only interest
and dividends) from this portfolio, which ultimately drives earnings per share and book value per
share, should increase significantly in 1997.
While all of this frenetic activity took place in 1996, there were no changes in the small Fairfax head
office. It is quite amazing what our small group, led by Rick Salsberg and John Varnell and ably
supported by Brenda Adams, Sam Chan and Ronald Schokking, did over the past year. Most other
companies would need a corporate head office many, many times larger and still perhaps not be as
effective. Our Fairfax head office shows what a few capable, hardworking and trusted individuals
can accomplish working together as a team with no egos. Late in 1996 Francis Chou joined the
company. Francis was the person who gave me the idea about Fairfax almost 12 years ago. We
look forward to more ideas like that from Francis.
The table below shows the sources of our net earnings.
.. ($ millions)
1996 1995Insurance underwriting (50.6) (40.9)
Interest and dividends 144.1 86.3
Total 93.5 45.4
Claims adjusting (Fairfax portion) 2.3 2.1
Interest expense (35.0) (19.1)
Goodwill and other amortization (4.8) (4.8)
Corporate overhead and other (6.6) (5.6)
Realized gains 131.3 71.9
Pre-tax income 180.7 89.9
Less: taxes 29.9 2.4
Net earnings 150.8 87.5
The table shows you the results from our insurance (underwriting and investments) and non-
insurance operations. In this report insurance operations include reinsurance operations. Claims
adjusting shows you our share of Lindsey Morden's after-tax income. Goodwill and other
amortization includes Hamblin Watsa goodwill ($1.4 million) and amortization from Ranger ($3.4
million). The corporate overhead expense is net of Hamblin Watsa's pre-tax income. Shown
separately are realized gains so that you can better understand our earnings from our operating

October 14, 1999 1:12 AM
8
companies. Also please note the unaudited financial statements of our combined insurance
operations and of Fairfax with Lindsey Morden equity accounted, as well as Lindsey Morden's
financial statements, shown on pages x to x .
The increase in underwriting losses in 1996 was largely due to Ranger. Interest and dividend
income as well as interest expense increased because of the Odyssey Re acquisition in May 1996.
Lindsey Morden's contribution increased in 1996 from record 1995 levels. Corporate overhead and
other increased because of one time expenses associated with the debt and share issues.
Realized gains were very large and almost twice 1995 levels. These gains more than offset the
increase in underwriting losses and were the main reason for the increase in earnings in 1996.
Fairfax's effective tax rate was 17% in 1996 reflecting utilization of loss carryforwards, tax-free
Canadian dividend income and international operations with lower tax rates.
Book value per share increased from $53.28 to $87.05, approximately 45% from earnings and 55%
from our share issues.
Insurance operations1996 was another excellent year for our Canadian insurance companies with a combined ratio of
99.1%. Odyssey Re performed as expected but Ranger had another poor year as discussed later.
In total, our insurance and reinsurance operations had a combined ratio of 104.9%, the same as in
1995. This means that we have achieved our target of a combined ratio of 100% or less in only five
of the last eleven years. While we are not pleased with this record, it has been achieved in an
industry environment which has been in a cyclical downturn for nine of the past eleven years - with
no sign of an upturn yet!
Commonwealth, led by John Watson, continued to produce extraordinary results with a combined
ratio of 87.0%, even better than the 89.5% in 1995. John and his management team have had
combined ratios of less than 100% in five out of the last six years.
Because of the competitive environment discussed in last year's Annual Report, Commonwealth=s
gross premiums written declined 10% to $262 million while net premiums written remained flat at
$87 million. Net income after taxes was a record $24.4 million because of significant underwriting
profits and realized gains. Since we purchased Commonwealth in 1990, it has had cumulative
underwriting profits and net income after taxes of $18 million and $94 million respectively, paid out
a total of $45 million in dividends and ended 1996 with shareholders' equity of $137 million - all
versus our purchase price of $571/2 million in 1990.
Of course, Commonwealth's record goes much further back than 1990. It was started in its present
form in Vancouver in 1968 with a $10,000 investment, with the only significant additional capital
being a contribution of about $20 million in the middle 1980s. Ron Schwab, Executive Vice

October 14, 1999 1:12 AM
9
President, Underwriting, was one of the founding employees at the time. The company has had
almost no employee turnover and has never lost money since its founding - an exceptional track
record and a major contributor to Fairfax's success.
While we are exposed to catastrophes at Commonwealth, the risk is managed well. Also, the
company has recently further increased its catastrophe protection. While there are no guarantees,
we continue to feel a major catastrophe would impact Commonwealth's income statement but not
its balance sheet.
Federated, under John Paisley's leadership, had another excellent year in 1996 with a combined
ratio of 98.6% for the property and casualty company (100.2% including the life operations). Gross
premiums written increased by 6% to $58.6 million while net premiums written increased 5% to
$49.5 million. Federated's expense ratio of 34.8% in 1996 was better than the 36.6% in 1995 and
significantly better than the 42% that prevailed three years ago. Net income after taxes of $5.5
million was down 20% from $6.9 million in 1995 mainly because of lower realized gains. Since we
purchased Federated in 1989, the company has had cumulative underwriting profits and net income
after taxes of $0.1 million and $46 million respectively, paid out total dividends of $22 million and
ended the year with shareholders' equity of $52 million - all versus our purchase price of $28 million
in 1989. Under John=s leadership Federated has done very well in the past, but we think it will do
even better in the future.
Byron Messier and his management team at Lombard had an excellent year in 1996 with a
normalized combined ratio of 99.5% - more than fulfilling the 100% objective Byron had set in 1993
for 1996. On a net premium base of $443 million (including CRC (Bermuda)), this was truly
outstanding! Both sides of the house, commercial lines and personal lines, achieved combined
ratios below 100%.
Lombard maintained its gross and net premiums written in 1996 at 1995 levels but net income after
taxes increased to a record $59 million. In the two years since we purchased Lombard it has
earned $101 million after taxes. It won't be long before we have earned our purchase price of $155
million!
In 1995/96, Lombard commenced a pilot program of direct marketing of automobile and home
insurance to people over 50 years old, partnering with a select group of brokers in Alberta and then
the Maritimes. The program, called Privilege 50, provides 24-hour service via telephone with
binding quotes and three day policy delivery. The program has been well received and will be
introduced in Ontario during March 1997 through Zenith Insurance, a broker joint venture with
Lombard. More on the results next year!
Lombard's commercial book of business continues to be more focused on its market niches and

October 14, 1999 1:12 AM
10
thus less susceptible to competitive market pressures.
Considering the highly competitive state of the market, Markel, under Mark Ram's leadership, had a
very good year with a combined ratio of 102.9% in 1996. As mentioned in last year's Annual
Report, Mark and his management team continue to build Markel into the premier trucking
insurance company in Canada by providing the best claims, underwriting and loss prevention
services available in the country, a first rate driver training school, the first truck skid school in
Canada, a new A-(excellent) rating from A.M. Best, etc., etc. Pricing, though, has collapsed and we
have been losing some accounts at 30-50% discounts to our prices, a level at which other insurers
have historically lost money. We have experienced this kind of irrational competition before and,
since we began in 1985, two of Markel=s largest competitors have gone bankrupt, leaving their
insureds in a bind. As Santayana said, "Those who cannot remember the past are condemned to
repeat it.=> Markel remains committed to providing stability to its insureds. Net premiums written
dropped 21% to $62.6 million in 1996. Pre-tax income at $8.2 million was only 6% off 1995 levels
but net income after tax has dropped in half because we didn't pay any taxes in 1995.
I was wrong, again, on Ranger in 1996. The key word is I and not Pete Wallner and his
management team. The problems of the past continued to haunt Pete and Ranger with a
combined ratio of 123.5%. Excluding the lines in run-off and a further increase in reserves for past
years, Ranger's combined ratio from continuing operations drops to 105.5% - a good indication of
Pete=s performance in 1996.
The table below shows you our experience at Ranger in 1995 and 1996.
.. (US$ millions)
1995 1996 TotalUnderwriting loss (50.2) (35.3) (85.5)
Combined ratio 138% 124% 131%
Indemnities - vendor 11.5 - 11.5- Fairfax 14.0 - 14.0
25.5 - 25.5
Underwriting loss (24.7) (35.3) (60.0) (after indemnities)
Investment income 38.0 33.1 71.1
Pre-tax income (loss) 13.3 (2.2) 11.1
Taxes (credit) - (11.1) (11.1)
Net income 13.3 8.9 22.2
Some observations:
1) Underwriting losses totalled US$86 million in the two years. The combined ratio for the two
years was 131%. The cost to Fairfax in the two years of these underwriting losses,
excluding the vendor's indemnification but including the Fairfax indemnification and some

October 14, 1999 1:12 AM
11
related reinsurance, was US$85 million, i.e. more than $11 per share pre-tax!
2) Run-off lines cost us US$56 million in losses for the two years, increasing Ranger's
combined ratio by 20 percentage points to 131%. The combined ratio for these lines was
193%.
3) The reserve increase for 1995 and prior years (at year-end 1996) on Ranger's core lines
totalled US$24 million, approximately 8 percentage points of Ranger's combined ratio.
4) In spite of these underwriting losses, Ranger had net income of US$13.3 million in 1995
and US$8.9 million in 1996 for a total of US$22.2 million. Year-end GAAP capital of
US$121.3 million was the highest in Ranger's history. However, A.M. Best did drop
Ranger=s rating to A- from A.
5) Ranger had net premiums written of US$156.0 million in 1996 - up 19% from 1995 levels.
After realized gains of US$19.6 million (including US$8.1 million from the sale of a largely
inactive subsidiary, Ranger County Mutual), Ranger had a US$2.2 million pre-tax loss.
Including tax credits, Ranger had a net income after tax of US$8.9 million in 1996.
As you can see, Pete Wallner and his management team have worked very hard to correct the
problems of the past and, dare I say, 1997 should be a much better year.
While we have increased reserves at Ranger again in 1996 (even though we felt they were
adequate last year), we do not think this will be repeated in 1997. I hope I don't have to eat humble
pie again!
Wentworth, our Barbados company, continued to have good results with a combined ratio of 98%
on much reduced net premiums written of $8.3 million. Net income dropped to $2.5 million in 1996
because of lower realized gains.
Odyssey Re had a good year in 1996. It had a combined ratio of 110% as expected after US$15.7
million in indemnification from Skandia, Sweden. Net premiums written were US$201.1 million for
the year - about the same as last year. After significant realized gains, Odyssey Re earned
US$63.5 million after taxes in 1996. Even though all the earnings in 1996 accrued to the benefit of
Fairfax, only US$56 million was included in our statements as the purchase closed during the
second quarter. Jim Dowd and Andy Barnard are focused on reducing Odyssey Re's combined
ratio below 100% in the next two years. CTR's net income will flow into Fairfax for the full year
1997. Kris Datt and his team (from Ranger Re) have joined the reinsurance group of Odyssey Re
and CTR.

October 14, 1999 1:12 AM
12
Our insurance companies are all well capitalized as shown on page x. We continue to have
significant unused capacity with no signs as to when we can use it.
Our reserves continue to be certified at the individual insurance company level and on a
consolidated basis as in the past. Odyssey Re and CTR will have their reserves certified by
external actuaries in 1997. We mentioned last year that our goal at Fairfax is to ensure that the
reserve >=past=> does not hurt us in the future but helps us, i.e. we expect to see reserve
redundancies each year in each of our insurance companies. In 1996 our Canadian insurance
companies had redundancies of $16.7 million, while Ranger had a deficiency of US$24.0 million
(C$32.7 million). In total then, we had a net reserve deficiency of $16.0 million in 1996 - not very
good. We think we have more than adequately provided for reserves at Ranger but only time will
tell. We provide extensive disclosure on our reserves beginning on page x.
Claims adjustingUnder Ken Polley's leadership, Lindsey Morden had an excellent year in 1996. While earnings hit
another record, the real story was free cash flow. In 1996, after capital expenditures and working
capital requirements, Lindsey Morden generated $6.7 million which, with existing cash, was used to
reduce short and long term debt by $7.2 million. If this level of earnings and cash flow persists in
1997, Lindsey Morden will soon be free of debt. With no use for additional capital, the board of
Lindsey Morden has decided to increase annual dividends from 104 per share to 504 per share and
will review dividend payouts at the end of each year. Our confidence in the management of Lindsey
Morden has been fully justified and we feel the company has developed excellent momentum,
thanks to Ken Polley, Don Smith, Don Cain and Ferd Roibas, the new Vice President, Finance. We
really appreciate the efforts of Don Cain who came out of retirement to help turn around the
Canadian operations and has headed back to Fredericton after a job well done.
In 1996 Lindsey Morden's revenue increased 5% to $162.3 million while net income after taxes
increased 9% to $4.4 million. Return on average shareholders' equity in 1996 remained at the 1995
level of approximately 11%. Lindsey Morden's financial position strengthened considerably with the
debt to equity ratio dropping to 0.31:1 from 0.52:1 at year-end 1995. Lindsey Morden is on its way
to providing excellent returns for its shareholders.
For further information on Lindsey Morden, please read the annual report - available by phoning
Doreen Brown at (416) 362-6762.
Investment management1996 was an exceptional year on an absolute and relative basis for Canadian equities and bonds.
Not surprisingly, our U.S. equity results did not keep pace with the explosive U.S. market.
However, as shown below, on a long term basis the partners of Hamblin Watsa Investment
Counsel have produced excellent results in all of the areas in which they provide investment
management - Canadian equities, U.S. equities, Canadian bonds, U.S. bonds and balanced funds.

October 14, 1999 1:12 AM
13
Please note the U.S. bond results which we have disclosed for the first time. Brian Bradstreet, who
manages our Canadian and U.S. bonds, has done an exceptional job in both countries. Brian
Bradstreet, Frances Burke, Tony Hamblin, Roger Lace and I have worked together for more than
20 years and are responsible for the results shown below.
Annualized rates of return (%)
Cumulative periods ended December 31, 1996
.. 5 years 10 years 15 yearsCanadian Equities 18.0 14.7 16.3
TSE 300 13.9 10.0 11.3
U.S. Equities 29.9 21.8 19.2S&P 500 19.2 15.2 17.9
Canadian Bonds 15.5 12.1 -SM Index 11.0 11.0 -
U.S. Bonds 9.8 11.2 * -ML Index 6.3 8.4 * -
Balanced Fund 17.8 15.2 -
* 8 years
Source: Representative balanced fund managed by HWIC for twelve years. Equity results for an additional three years are from the organization for which theprincipals previously worked.
Incentive fees were earned from some clients as HWIC met the 1996 test for all funds but not the
long term test (i.e. results from incentive fee inception date) for some clients. Total fees in 1996
increased to a record $10.1 million from $5.3 million in 1995 mainly because of incentive fees ($3.0
million), the addition of Odyssey Re ($1.3 million) and the rising markets. With the addition of
Odyssey Re, HWIC has reduced its average base fee (before incentive fees) paid by Fairfax
insurance subsidiaries from 0.17% of assets to a flat fee of 0.15% of assets. For more details of
HWIC fees, please read the 1994 Annual Report. Fairfax earned a 35% pre-tax cash return in
1996 on its $14 million investment in HWIC. On a cumulative basis, since 1992 Fairfax has earned
a pre-tax cash return of 107% on its investment while revenues have increased from $3.7 million in
1992 to $10.1 million in 1996.
We welcome Jean Ouellet, who joined HWIC in early 1997 to manage CTR's non-North American
bond portfolios.
Financial positionAs in previous reports, we feel our unaudited balance sheet with Lindsey Morden equity accounted
(shown on page x) is the best way to understand our financial position.
Here is what our year-end financial position looks like compared to the end of 1995.

October 14, 1999 1:12 AM
14
($ millions) .. 1996 1995
Cash and short term investments 101.1 70.4
Bank debt - -
Long term debentures 470.5 298.0
Net debt 369.4 227.7
Common shareholders' equity 911.1 472.6
Net debt/equity 41% 48%
Net debt/total capital 29% 33%
As shown, common shareholders' equity, our capital, increased by $438.5 million - $288.3 million
net from the two stock issues and $150.8 million from net income less $0.6 million used to
purchase 3,500 shares at $160 per share. The long term debentures increased because of the
US$125 million debenture issue in April 1996. Our cash position in the holding company (i.e.
Fairfax) increased to $101.1 million from $70.4 million at the end of 1995. This excludes the cash
raised for the acquisition of CTR which was invested in Wentworth pending the closing (note our
unconsolidated balance sheet on page x). Our net debt (i.e. long term debentures less cash) to
equity ratio dropped to 41% from 48% last year and our net debt to total capital ratio dropped to
29% from 33% last year. Including CTR, which closed in February 1997, our net debt to equity ratio
at year-end 1996 would have dropped to 46% and our net debt to total capital ratio to 31%. So in
spite of two significant purchases in 1996, we improved our financial ratios (and built a $193 million
negative goodwill cushion).
Also, we have increased our unused, unsecured, committed, long term bank lines to $600 million
(from $215 million) from eight major banks - four Canadian, three U.S. and one European. Just
three years ago we had only $75 million in bank lines. As emphasized repeatedly in the past, these
are unused bank lines which, for a low standby cost, provide us flexibility on an emergency basis -
we have not and will not use them to make an acquisition. We also have letter of credit (LOC)
facilities in excess of $70 million for use in the ordinary course of our insurance businesses.
Our financial position continues to be very strong for the same reasons that we discussed in our
1995 Annual Report. Briefly they are:
1) We have no bank debt. Our debt consists of three public debentures with a long term to
maturity (7 years, 19 years and 30 years) and low interest rates (7:%, 83% and 83%
respectively), and a small seven year 7:% debenture issued to a vendor. All of this debt
was issued under a single trust indenture containing a covenant package that provides us
with great flexibility. Late in the year we decided to swap the fixed interest rate on the 30
year debenture issue into floating rates, saving approximately 120 basis points currently.
On closing CTR in February 1997, we issued a 22% ten year French franc debenture.
2) We have unused, unsecured, committed, long term bank lines of $600 million with excellent

October 14, 1999 1:12 AM
15
covenants. In addition, we have LOC facilities in excess of $70 million.
3) Our net long term debt is less than three times our earnings base. Also, our earnings base
is well diversified between many insurance and reinsurance companies, Lindsey Morden,
HWIC, and Canadian, U.S. and, through CTR, non-North American streams of income.
4) Available cash flow at the Fairfax (holding company) level from dividends, management
fees and interest covers our expenses (administrative and interest) by about two times.
This is based on normal dividend payouts from our insurance companies (and effectively
none from our reinsurance companies) which is much less than our maximum dividend-
paying capacity. Note Fairfax's parent company-only income statement on page x.
5) With $101 million in cash in the holding company, we can pay our administrative and
interest expenses at Fairfax, with no dividends from any of our insurance or reinsurance
companies, for four to five years - a management holding company survival ratio, if you will!
6) As discussed in the MD&A, our insurance companies are all over-capitalized with large
solvency margins in excess of mandated regulatory levels.
7) Our foreign exchange exposure from Ranger and Odyssey Re has been fully hedged by the
U.S. debenture issues and the purchase of foreign exchange contracts. We have also
hedged our expected U.S. dollar income for the next five years with the purchase of
additional foreign exchange contracts, as disclosed in note 12. During 1996 we were able
to take advantage of collapsing Canadian/U.S. interest rate spreads in the three to five year
area and realize $6.7 million in profits by extending the term of our contracts to ten years.
Our French franc exposure from CTR has also been fully hedged together with our
estimated French franc net income over the next three to five years (note 12).
Investments1996 was an excellent year for the financial markets, particularly the Canadian and U.S. stock
markets. This resulted in a record year for realized gains and a very significant increase in
unrealized gains as shown below:
($ millions)
1996 1995Bonds 26.9 21.7
Preferred stocks 19.0 5.7
Common stocks 81.2 (12.9)
127.1 14.5
Even though they are substantial, I would de-emphasize the unrealized gains as they can easily

October 14, 1999 1:12 AM
16
disappear if the markets decline. However, our realized gains of $131 million were almost twice the
record $72 million realized in 1995 - you probably thought we had run out of ammunition! Realized
gains are totally unpredictable but we purchase stocks with the intention of making significant gains
in the long term - sometimes they come a little sooner! Since we began in 1985, we have realized
cumulative gains of $286 million or $27 per share pre-tax. The $131 million in gains in 1996
consisted of $43 million from bonds, $69 million from stocks, $11 million from the sale of Ranger
County Mutual (a largely inactive subsidiary of Ranger Insurance Company), and almost all the
remaining $8 million from the sale of foreign exchange contracts.
The $69 million realized from stocks is about a 15% return on an average common stock portfolio
of approximately $447 million - about 7% (forgetting dividends) above the 8% interest income we
could have obtained if it was all invested in bonds.
The table on page x shows the returns on our investment portfolios. Investment income (interest
and dividends) has increased dramatically because of the Odyssey Re portfolio. Pre-tax
investment income per share has increased from $10.00 in 1995 to $15.42 in 1996. Since the 874
per share generated in 1985, pre-tax investment income per share has compounded at 30%
annually. Investment income per share will increase again in 1997 because of the CTR acquisition.
In our 1994 Annual Report, we mentioned the Canadian government=s intention to tax unrealized
stock gains in financial institutions= investment portfolios annually. We said, >=We believe this is
seriously wrong in principle and unjustly harmful both to the companies affected and the operation
of the capital markets. We have come across no other country in the world that taxes unrealized
gains, and consider this to be a significant disincentive (if passed into law) to long term capital
investment in Canada by financial institutions. We hope that sanity will prevail as our government
begins to recognize the importance of encouraging investors to make substantial long term capital
commitments to Canadian enterprises.=> Well, sanity did not prevail and we will be paying cash
taxes of approximately $24 million in 1997 on unrealized capital gains on Canadian common and
preferred stocks at year-end 1996 of $55 million.
Gross realized gains totalled $143.7 million. After realized losses of $4.8 million and increased
provisions of $7.6 million, net realized gains were $131.3 million. The major contributors to realized
gains were Salomon Inc. ($8.5 million), Trizec Hahn ($8.0 million), Sears ($7.6 million), Royal Bank
($6.5 million), American Express ($5.3 million), Bank of Montreal ($4.5 million), Mercury General
($3.6 million), E-L Financial ($3.5 million), AIG ($3.4 million), Toronto-Dominion Bank ($2.6 million),
Canadian Tire ($2.3 million), Trilon ($2.2 million) and Canadian Gypsum ($1.2 million).
Last year we made the point that it was getting increasingly difficult to identify good long term values
in the U.S. while we could find them abundantly in Canada. With both markets up significantly in
1996, we are now finding it very difficult to identify long term values in both markets. For the first

October 14, 1999 1:12 AM
17
time since Fairfax's inception in 1985, we are becoming concerned about the overall stock market
environment. The S&P 500 is selling at a very high P/E of approximately 18 times, exceeded in
only four years since WWII (1962, 1991, 1992, 1993). With a 2% yield and long term growth in
earnings per share of only 7%, the S&P 500 can provide a return of only 9% in the next decade if
the current extremely high P/E ratios are maintained. If corporate earnings were to stumble,
interest rates rise or P/E ratios contract, the performance of stocks could be extremely
disappointing. We don't think we are being unduly pessimistic in surmising that recent
extraordinary historical rates of return in U.S. equities cannot be sustained. While Canadian
equities may have a little way to go, the same logic applies.
Investors with a long term perspective may be interested in knowing that the July 1996 article in
Reader's Digest, entitled "You Can Make A Million" and extolling the virtues of long term investing in
the stock market, was almost identical to the article in the August 1929 issue of the Ladies Home
Journal entitled "Everybody Ought to be Rich". While we do not disagree with this thesis, it appears
to us to be a classic example of a sound concept rendered unsound by mindless overuse and total
disregard for prices paid. The explosion in U.S. mutual funds ( from 161 in 1960 to 4,764 in 1996),
the proliferation of U.S. investment clubs (4,000 in 1981 to 24,000 currently) and record IPOs are all
indications of a frothy market. According to the July 19, 1996 issue of Grant's Interest Rate
Observer, "In the 20 years immediately following publication of "Everybody Ought to be Rich", big
cap stocks returned 3.1% a year." Grant's continues, in the same issue, "The return of one's
money, the humblest investment attribute in good times, is always prized in bad times." With many
warning lights flashing, we are being more cautious than usual in making any new stock
investments.
At the end of 1996 we had approximately $507 million ($48 per share) or 15% of our $3.5 billion
investment portfolios in common stock. As a percentage of our investment portfolios or as a
percentage of common shareholders' equity, our common stock holdings are currently at close to
their lowest relative levels in the past eleven years. Of the $507 million in common stock, $377
million is invested in Canadian common stock and $130 million in U.S. common stock. Of this
amount, $121 million is invested in industrial products companies, $120 million in financial services
companies, $112 million in consumer product companies, $66 million in natural resource
companies and $88 million in other miscellaneous categories.
Last year I mentioned that Paul Fink and Chandran Ratnaswami are reviewing international
insurance and common stock investments for us. In 1996 we began investing outside of North
America - mainly through value-oriented managers with good long term records.
Our "nuclear bomb" testing on insurance regulatory capital of a simultaneous decline of 50% in our
common stock holdings, 30% in our preferred stock holdings and 20% in our bond holdings
continues on a monthly basis. While all our insurance and reinsurance companies met this test, we

October 14, 1999 1:12 AM
18
have decided to buy a >'put'= at Odyssey Re similar to the one purchased in 1995 for Lombard. We
consider the cost of this put (US$1 million) to be cheap insurance if the nuclear bomb were to
explode!
We have added to our small real estate investments with the purchase of an 80% interest in a
warehouse building in Toronto for a net investment of $5.0 million. We expect to receive an income
return in excess of 10% with some possible long term appreciation. We made the investment
because we liked our partner who is managing the property.
MiscellaneousIn 1996 Fairfax and its subsidiaries donated approximately $1.6 million (about 1% of pre-tax
income) to over 300 charities in North America. Our individual companies make a significant
percentage of these donations, and Fairfax makes the rest.
Please review page x which is an unaudited, unconsolidated balance sheet on an equity accounted
basis showing you where your money is invested. The table shows our investment in Odyssey Re
at $390 million - approximately $118 million below its underlying book value. The increased
investment in Wentworth is because we are financing CTR through Wentworth even though CTR
will be grouped with Odyssey Re for management purposes. Excluding Odyssey Re and
Wentworth, we have $718.0 million invested in our insurance companies, $30.3 million in Lindsey
Morden, $8.2 million in HWIC and $101.1 million in cash. Our insurance companies and Lindsey
Morden are shown at their underlying book value, i.e. very conservatively valued. In case you
missed Noro Inc., that means "No Return On Investment" (courtesy of John Varnell). This is the
subsidiary that owns a plane we purchased in February 1996 for US$1.8 million. Another indicator
of irrational exuberance!
You may have again missed that dividend that we paid you in 1996. By purchasing 3,500 shares at
$160 per share for a total cost of $0.6 million, we indirectly gave you a dividend of 64 per share.
You can't live on Fairfax's dividends though! We always consider investing in our stock first (i.e.
stock buybacks) before making any acquisitions.
Since we began in 1985, eleven years ago, our book value has compounded at 40.4% annually
while our stock price has compounded at 50.4%. During some portions of that period, the reverse
has happened: our book value compounded at a rate higher than our stock price. In the long run,
these rates should converge. While we are very grateful for the past, rest assured it won't help you
in the future. Our objective continues to be to achieve a 20% return on shareholders' equity in the
future, retain all earnings and compound book values at 20% annually - about half of what we have
achieved in the past eleven years.
Our return on average shareholders' equity over the past eleven years has averaged 20.4%, slightly

October 14, 1999 1:12 AM
19
in excess of our target of 20%. In case you think this is an easy bogey, the TSE 300 averaged
7.7% over the same period. In the July 1996 issue of Report on Business Magazine, Fairfax's five
year return on equity was ranked 79th out of the top 1,000 companies listed on Canadian stock
exchanges, i.e. in the top 7-8% of all companies in Canada. Our own analysis indicates that our ten
year ROE (ending December 1995) ranks 7th out of all the TSE 300 companies. So achieving 20%
is not going to be easy but it continues to be our objective.
Two further points on our record. We have an employee share purchase plan that allows
employees to contribute up to 10% of their salary and the company matches 30% automatically with
a further 20% if Fairfax achieves its 20% ROE objective. You will be interested to know that if an
employee, at a salary of only $20,000, had participated fully in the plan over the nine years of its
existence, he or she would have approximately 775 shares worth $225,000 at the end of 1996. You
know why many of our employees have smiles on their faces! All our companies have high
employee participation rates in our plan and we continue to encourage our employees to think long
term. We like our employees to be owners of our company and this plan is a great way to do it.
Lest you non-employee shareholders are concerned, Fairfax shares are purchased in the market
and not from the treasury.
The second point on our record leads me to corporate governance. There is much discussion in
the media about corporate governance, board composition, etc., etc. Also there has been some
negative press about dual voting share structures. I must say that a major reason for Fairfax's track
record is its small, non-bureaucratic board and its share structure that together allow us to be
entrepreneurial and react quickly to opportunities, and to take the long view and not be worried
about stock market fluctuations. In the past 18 months, we have seen two excellent companies in
the oil industry, Nowsco and Morrison Petroleum, be taken over because their share prices were
temporarily low and vulnerable to hostile takeovers. Management at both companies have served
shareholders well over the long term and probably would have benefitted from a dual voting
structure. While there are many abuses of this share structure, as far as Fairfax is concerned it is a
big plus! Please read the proxy circular for additional information on corporate governance at
Fairfax.
Our company is run for the long term and over time has attracted shareholders with a long term
horizon. During 1996, 2.5 million shares of Fairfax were traded on the TSE or approximately 25%
of the float. When compared to all companies on the TSE 300, Fairfax's turnover (shares traded as
a percentage of the float) continues to be ranked in the bottom 10%. Long term shareholders are
reminded to note the section on Issues and Risks on page x that lists the risks that Fairfax faces.
Caveat emptor!
We had an excellent annual meeting last year at the old Toronto Stock Exchange building - many of
you came and your questions benefitted all shareholders. In order to provide more space this year,

October 14, 1999 1:12 AM
20
the meeting will be held at 4:30 p.m. on April 16, 1997 in Room 105 at the Metro Toronto
Convention Centre. We hope to see as many of you there as possible, including some of our
newer shareholders.
Again, on your behalf, I would like to thank the board and the management and employees of all
our companies for an outstanding year.
February 28, 1997
V. Prem Watsa
Chairman andChief Executive Officer

October 14, 1999 1:12 AM
21
February 5, 1997
Auditors' Report to the Shareholders
We have audited the consolidated balance sheets of Fairfax Financial Holdings Limited as atDecember 31, 1996 and 1995 and the consolidated statements of earnings, retained earnings andchanges in cash resources for the years then ended. These financial statements are theresponsibility of the company's management. Our responsibility is to express an opinion on thesefinancial statements based on our audits.
We conducted our audits in accordance with generally accepted auditing standards. Thosestandards require that we plan and perform an audit to obtain reasonable assurance whether thefinancial statements are free of material misstatement. An audit includes examining, on a testbasis, evidence supporting the amounts and disclosures in the financial statements. An audit alsoincludes assessing the accounting principles used and significant estimates made by management,as well as evaluating the overall financial statement presentation.
In our opinion, these consolidated financial statements present fairly, in all material respects, thefinancial position of the company as at December 31, 1996 and 1995 and the results of itsoperations and the changes in its financial position for the years then ended in accordance withgenerally accepted accounting principles.
Coopers & LybrandChartered AccountantsToronto, Ontario
February 5, 1997
Valuation Actuary's Report
Coopers & Lybrand has valued the policy liabilities of the subsidiary insurance companies of FairfaxFinancial Holdings Limited in its consolidated balance sheet at December 31, 1996 and theirchange as reflected in its consolidated statement of earnings for the year then ended in accordancewith accepted actuarial practice except as described in the following paragraph.
Under accepted actuarial practice, the valuation of policy liabilities reflects the time value of money. Management has chosen not to reflect the time value of money in the valuation of its policyliabilities. Our valuation complies with that policy.
In our opinion the valuation is appropriate, except as noted in the previous paragraph, and theconsolidated financial statements fairly present its results.
Coopers & LybrandRichard Gauthier, FCIA, FCASToronto, Ontario

October 14, 1999 1:12 AM
22
Consolidated Financial Statementsfor the years ended December 31, 1996 and 1995
Consolidated Balance Sheetsas at December 31, 1996 and 1995
1996 1995($000) ($000)
AssetsCash and short term investments.............................................. 101,067 70,354
Accounts receivable .................................................................. 626,245 400,153
Recoverable from reinsurers ..................................................... 1,258,899 523,783
Claims in process ..................................................................... 15,029 15,390
Income taxes refundable .......................................................... 16,288 18,530
Prepaid expenses ..................................................................... 15,273 12,575
2,032,801 1,040,785
Portfolio investments (note 3)
Subsidiary cash and short term investments(market value - $513,205; 1995 - $256,677)..................... 513,205 256,677
Bonds(market value - $2,151,569; 1995 - $821,244).................. 2,124,620 799,507
Preferred stocks(market value - $201,239; 1995 - $160,298)..................... 182,229 154,646
Common stocks(market value - $588,128; 1995 - $357,722)..................... 506,939 370,639
Real estate(market value - $26,461; 1995 - $16,268)......................... 26,461 16,268
Total(market value - $3,480,602; 1995 - $1,612,209) .............. 3,353,454 1,597,737
Deferred premium acquisition costs .......................................... 145,496 101,773
Deferred income taxes .............................................................. 134,824 34,163
Capital assets (note 4)............................................................... 40,915 33,763
Goodwill .................................................................................... 43,758 46,449
Other assets ............................................................................. 27,141 18,878
5,778,389 2,873,548
Signed on behalf of the Board
Director
Director

October 14, 1999 1:12 AM
23
1996 1995($000) ($000)
LiabilitiesBank indebtedness (note 5)....................................................... 2,394 7,621
Accounts payable and accrued liabilities .................................. 220,009 154,136
Premium deposits ..................................................................... 43,674 10,929
266,077 172,686
Provision for claims (note 8) ...................................................... 3,405,173 1,327,137
Unearned premiums ................................................................. 688,009 572,016
Long term debt (note 6) ............................................................ 487,038 310,236
4,580,220 2,209,389
Non-controlling interest.............................................................. 21,000 18,919
Shareholders' EquityCapital stock (note 7)................................................................. 513,420 225,295
Retained earnings ..................................................................... 397,672 247,259
911,092 472,554
5,778,389 2,873,548

October 14, 1999 1:12 AM
24
Consolidated Statements of Earningsfor the years ended December 31, 1996 and 1995
1996 1995($000) ($000)
Revenue Premiums earned ................................................................... 1,030,888 829,340
Claims fees ............................................................................. 162,266 154,914
Interest and dividends (note 3) ............................................... 151,387 89,354
Realized gains on investments (note 3) .................................. 131,274 71,912
1,475,815 1,145,520
Expenses Losses on claims .................................................................... 753,777 614,059
Operating expenses ................................................................ 336,880 304,969
Interest expense ..................................................................... 36,554 21,171
Commissions, net ................................................................... 161,291 109,404
1,288,502 1,049,603
Earnings before income taxes ............................................... 187,313 95,917
Provision for income taxes (note 10) ........................................ 34,360 6,455
Earnings from operations ......................................................... 152,953 89,462
Non-controlling interest ............................................................. (2,133) (1,965)
Net earnings ............................................................................ 150,820 87,497
Net earnings per share (note 14) ............................................ $15.36 $9.79
Consolidated Statements of Retained Earningsfor the years ended December 31, 1996 and 1995
1996 1995 ($000) ($000)
Retained earnings - beginning of year ................................. 247,259 164,146
Net earnings for the year ........................................................ 150,820 87,497
Excess over stated value of shares purchased for cancellation (note 7) ...................................... (407) (4,384)
Retained earnings - end of year ............................................ 397,672 247,259

October 14, 1999 1:12 AM
25
Consolidated Statements of Changes in Cash Resourcesfor the years ended December 31, 1996 and 1995
1996 1995($000) ($000)
Operating activities Earnings from operations ....................................................... 152,953 89,462
Amortization ............................................................................ 13,565 12,699
Deferred income taxes ........................................................... 5,224 (805)
Gains on investments ............................................................. (131,274) (71,912)
40,468 29,444
Increase (decrease) in provision for claims ............................ 56,635 (9,019)
Increase in unearned premiums ............................................. 19,926 14,215
Decrease in cash funds resulting from
changes in other operating working capital items ................. (38,156) (36,246)
Cash resources provided by (used in) operating activities 78,873 (1,606)
Investing activities Investments - sales ................................................................. 29,896 9,576
Purchase of capital assets ...................................................... (18,317) (13,200)
Purchase of subsidiary, net of cash acquired ......................... (262,452) -
(250,873) (3,624)
Financing activities Capital stock transactions (note 7) ......................................... 287,718 (6,892)
Increase in long term debt (note 6) ......................................... 176,802 69,742
Change in non-controlling interest .......................................... (52) (361)
464,468 62,489
Increase in cash resources .................................................... 292,468 57,259
Cash resources - beginning of year ...................................... 319,410 262,151
Cash resources - end of year ................................................ 611,878 319,410
Cash resources consist of cash and short term investments including subsidiary cash and short terminvestments less bank indebtedness.

October 14, 1999 1:12 AM
26
Notes To Consolidated Financial Statementsfor the years ended December 31, 1996 and 1995(in $000s except per share amounts and as otherwise indicated)
1. Summary of Significant Accounting PoliciesThe preparation of financial statements in accordance with generally accepted accounting principles
requires management to make estimates and assumptions that affect reported amounts of assets and
liabilities and disclosure of contingent assets and liabilities as at the date of the financial statements.
Estimates also affect the reported amounts of income and expenses for the reporting period of the
statement of earnings. Actual results could differ from those estimates.
Business operations
The company is a financial services holding company which through its subsidiaries and affiliates is
engaged in the insurance of commercial and personal property, oil and gas, casualty and life risks,
property and casualty reinsurance, investment management and the provision of claims adjusting,
appraisal and loss management services in Canada and the United States.
Principles of consolidation
The consolidated financial statements include the accounts of the company and all of its subsidiaries:
Markel Insurance Company of Canada, Federated Insurance Holdings of Canada Ltd., Commonwealth
Insurance Company, Wentworth Insurance Company Ltd., Ranger Insurance Company, Lombard
General Insurance Company of Canada, CRC (Bermuda) Reinsurance Limited, Odyssey Reinsurance
Corporation and Hamblin Watsa Investment Counsel Ltd., all 100% owned; and Lindsey Morden Group
Inc., 57% equity and 92% voting interest. Acquisitions are accounted for by the purchase method,
whereby the results of acquired companies are included only from the date of acquisition. Divestitures
are included up to the date of disposal.
Premiums
Insurance premiums and reinsurance premiums are taken into income evenly throughout the terms of
the related policies. As premium deposits secure the payment of premiums and are refundable, they
are not taken into income unless default in payment of premiums occurs.
Claims in process
The company records its inventory of claims in process at its estimated value at year-end, based on
a determination of the claims in process at year-end through a complete physical count of related files.
Claims adjustment fees arising therefrom are accounted for on an estimated percentage-of-completion
basis.

October 14, 1999 1:12 AM
27
Deferred premium acquisition costs
Acquisition costs consist of brokers= commissions and premium taxes. The costs incurred in acquiring
insurance premiums are deferred, to the extent that they are considered recoverable, and amortized
over the same period as the related premiums are taken into income.
Investments
Bonds are carried at amortized cost providing for the amortization of the discount or premium on a
straight line basis to maturity. Bonds are classified at the earliest of the available maturity dates.
Preferred and common stocks are carried at cost. Real estate is recorded at book value. When there
has been a loss in value of an investment that is other than temporary, the investment is written down
to its estimated net realizable value. Such writedowns are reflected in realized gains (losses) on
investments. At December 31, 1996 the aggregate provision for losses on investments was $16.5
million (1995 - $8.9 million).
Investment income
Investment income is recorded as it accrues. Dividends are recorded as income on the record date.
Gains and losses realized on the disposal of investments are taken into income on the date of disposal.
Provision for claims
Claim provisions are established by the case method as claims are reported. For reinsurance, the
provision for claims is based on reports and individual case estimates received from ceding companies.
The estimates are regularly reviewed and updated as additional information on the estimated claims
becomes known and any resulting adjustments are included in income. A provision is also made for
management's calculation of factors affecting the future development of claims including claims
incurred but not reported (IBNR) based on the volume of business currently in force and the historical
experience on claims.
Translation of foreign currencies
Assets and liabilities in foreign currencies are translated into Canadian dollars at year-end exchange
rates. Income and expenses are translated at the exchange rates in effect at the date incurred.
Realized gains and losses on foreign exchange are recognized in the statements of earnings.
The operations of the company's subsidiaries in the United States are self-sustaining. As a result, the
assets and liabilities of these subsidiaries are translated at the year-end rates of exchange. Revenue
and expenses are translated at the average rate of exchange for the years. The unrealized gains and
losses, if material, which result from translation are deferred and included in shareholders' equity under
a caption "currency translation adjustment".
The company enters into foreign currency contracts from time to time to hedge the foreign currency
exposure related to its net investments in self-sustaining foreign operations. Such contracts are

October 14, 1999 1:12 AM
28
translated at the year-end rates of exchange and a corresponding adjustment, if material, will be
included in the currency translation adjustment account in shareholders' equity.
Goodwill
The excess of purchase cost over the fair value of the net assets of acquired businesses is amortized
on a straight line basis over their estimated useful life which ranges from 10 years for Hamblin Watsa
Investment Counsel Ltd. and Ranger Insurance Company to 40 years for Lindsey Morden Group Inc.
The company assesses the continuing value of goodwill based on the underlying cash flows and
operating results of the subsidiaries.
Reinsurance
The company reflects third party reinsurance balances on the balance sheet on a gross basis to
indicate the extent of credit risk related to third party reinsurance and its obligations to policyholders and
on a net basis in the statement of earnings to indicate the results of its retention of premiums written.
2. Change in Accounting PolicyEffective January 1, 1996, the company adopted the provisions of the new CICA presentation and
disclosure standards for financial instruments. This change, with respect to the presentation of third
party reinsurance, has been applied retroactively with the result that amounts recoverable from third
party reinsurers of $523,783 at December 31, 1995 are disclosed separately on the balance sheet,
corresponding adjustments are made to provision for claims ($414,482), unearned premiums
($140,483) and deferred premium acquisition costs ($16,914), and there is a net reduction in accounts
payable related to other balances with reinsurers ($14,268).
3. Investment Information
1996 1995 Book Estimated Book EstimatedValue Fair Value Value Fair Value($000) ($000) ($000) ($000)
Subsidiary cash and short term investments 513,205 513,205 256,677 256,677
BondsCanadian - government 498,843 499,707 406,649 406,206
- corporate 154,559 166,631 104,262 111,578Foreign - government 450,639 447,902 76,485 77,511
- corporate 1,020,579 1,037,329 212,111 225,949Preferred stocks
Canadian 177,437 195,943 154,646 160,298Foreign 4,792 5,296 - -
Common stocksCanadian 376,711 431,224 284,871 265,301Foreign 130,228 156,904 85,768 92,421
Real estate 26,461 26,461 16,268 16,268
3,353,454 3,480,602 1,597,737 1,612,209

October 14, 1999 1:12 AM
29
The estimated fair values of preferred and common stocks and debt securities are based on quoted
market values. The book value of real estate approximates fair value.
Management has reviewed currently available information regarding those investments whose
estimated fair value is less than book value, amounting to an aggregate unrealized loss of $42 million,
and ascertained that the book values are expected to be recovered. Debt securities whose book value
exceeds market value can be held until maturity. Preferred and common stock investments have been
reviewed to ensure that corporate performance expectations have not changed significantly to
adversely affect the market value of these securities other than on a temporary basis.
Liquidity and interest rate riskMaturity profile as at December 31, 1996
Within 1Year($000)
1 to 5Years($000)
6 to 10Years($000)
Over 10Years($000)
BookValue($000)
Bonds 139,146 510,352 1,296,266 178,856 2,124,620
Effective interest rate 6.2%
Investment Income1996 1995($000) ($000)
Interest and dividends:
Cash and short term investments 13,887 12,997
Bonds 111,311 60,819
Preferred stocks 11,401 11,949
Common stocks 28,253 10,054
164,852 95,819
Expenses (13,465) (6,465)
151,387 89,354
Gain on sale of investments:
Bonds 43,101 31,603
Preferred stocks 110 201
Common stocks 68,936 45,300
Other 26,737 (1,222)
Provision for loss (7,610) (3,970)
131,274 71,912
Net investment income 282,661 161,266

October 14, 1999 1:12 AM
30
4. Capital Assets 1996 1995($000) ($000)
Land and buildings 5,363 5,302
Furniture and equipment 68,646 55,924
Leasehold improvements 19,280 9,582
Transportation 3,847 968
97,136 71,776
Accumulated amortization 56,221 38,013
40,915 33,763
Amortization for the year was $11,165 (1995 - $9,269).
5. Bank IndebtednessBank indebtedness is $2,394 (1995 - $7,621) for which a general assignment of accounts
receivable and claims in process of subsidiaries of Lindsey Morden Group Inc. have been pledged
as security. Interest expense on bank indebtedness amounted to $583 (1995 -$1,200).
6. Long Term DebtThe long term debt at December 31 consists of the following balances:
.. 1996 1995($000) ($000)
Fairfax unsecured senior notes of US$100million at 7.75% due December 15, 2003 137,060 136,520
Fairfax unsecured senior notes of US$100million at 8.25% due October 1, 2015 137,060 136,520
Fairfax unsecured senior notes of US$125million at 8.30% due April 15, 2026 * 171,325 -
Fairfax unsecured senior note at 7.75%due December 15, 2003 25,000 25,000
Long term debt of Lindsey Morden GroupInc. at an average annual rate of 8.02%during 1996 (1995 - 8.01%) 16,593 12,196
487,038 310,236
* In 1996 , the company entered an interest rate swap agreement on its debt due in2026 whereby it now pays interest on this debt at LIBOR plus 148 basis points.
Interest expense on long term debt amounted to $35,971 (1995 - $19,971).

October 14, 1999 1:12 AM
31
Principal repayments on these loans are due as follows:($000)
1997 1,275
1998 154
1999 1,355
2000 2,032
2001 2,032
Thereafter 481,465
488,313
Less: current portion 1,275
487,038
7. Capital StockAuthorized capital
The authorized share capital of the company consists of an unlimited number of preferred shares
issuable in series, an unlimited number of multiple voting shares carrying ten votes per share and
an unlimited number of subordinate voting shares carrying one vote per share.
Issued capital
1996 1995 number ($000) number ($000)
Subordinate voting shares 9,717,158 527,442 8,120,658 239,317
Multiple voting shares 1,548,000 5,000 1,548,000 5,000
11,265,158 532,442 9,668,658 244,317
Interest in shares heldthrough ownership interestin shareholder (799,230) (19,022) (799,230) (19,022)
Net effectively outstanding 10,465,928 513,420 8,869,428 225,295
On March 26, 1996 the company issued 1,100,000 subordinate voting shares at $155 per share, for
net proceeds of $163,596, and on October 3, 1996 issued 500,000 subordinate voting shares at
$260 per share, for net proceeds of $124,682. In 1996, under the terms of a normal course issuer
bid approved by The Toronto Stock Exchange, the company purchased and cancelled 3,500
subordinate voting shares for an aggregate cost of $560, of which $407 was charged to retained
earnings.
In 1995, under the terms of a normal course issuer bid approved by The Toronto Stock Exchange,
the company purchased and cancelled 85,100 subordinate voting shares for an aggregate cost of
$6,892, of which $4,384 was charged to retained earnings.

October 14, 1999 1:12 AM
32
8. Provision for ClaimsThe provision for unpaid claims and adjustment expenses and the third party reinsurers= share are
estimates subject to variability, and the variability could be material in the near term. The variability
arises because all events affecting the ultimate settlement of claims have not taken place and may
not take place for some time. Variability can be caused by receipt of additional claim information,
changes in judicial interpretation of contracts or significant changes in severity or frequency of
claims from historical trends. The estimates are principally based on the company's historical
experience. Methods of estimation have been used which the company believes produce
reasonable results given current information.
Changes in claim liabilities recorded on the balance sheet for the years ended December 31, 1996
and 1995 and their impact on unpaid claims and adjustment expenses for these two years are as
shown in the following table:
..
1996 1995 ($000) ($000)
Unpaid claim liabilities - beginning of year - net 965,372 921,675
Increase in estimated losses and expenses for lossesoccurring in prior years 16,018 56,904
Provision for losses and expenses on claims occurringin the current year 641,519 599,251
Paid on claims occurring during:
the current year (253,507) (253,367)
prior years (315,640) (359,091)
Unpaid claim liabilities before reserve indemnification 1,053,762 965,372
Reserve indemnification (46,600) (52,717)
Unpaid claim liabilities after reserve indemnification 1,007,162 912,655
Unpaid claim liabilities of Odyssey Re 1,250,589 -
Unpaid claim liabilities - end of year - net 2,257,751 912,655
Reinsurance gross-up 1,147,422 414,482
3,405,173 1,327,137
The basic assumptions made in establishing actuarial liabilities are best estimates of possible
outcomes. To recognize the uncertainty in establishing these best estimates, to allow for possible
deterioration in experiences, and to provide greater comfort that the actuarial liabilities are adequate
to pay future benefits, actuaries are required to include margins (referred to as provisions for
adverse development) in some assumptions. A range of allowable margins is prescribed by the
Canadian Institute of Actuaries relating to claim development, reinsurance recoveries and

October 14, 1999 1:12 AM
33
investment income variables. The company presents its claims on an undiscounted basis.
9. ReinsuranceThe company follows the policy of underwriting and reinsuring contracts of insurance and
reinsurance which, depending on the type of contract, limits the liability of the individual insurance
and reinsurance companies to a maximum amount on any one loss of $0.3 to $4.0 million, varying
by line of business. Reinsurance is generally placed on an excess of loss basis in several layers.
The company's reinsurance does not, however, relieve the company of its primary obligation to the
policyholders.
The company has guidelines and a review process in place to ascertain the creditworthiness of the
companies to which it cedes. No information has come to the company's attention indicating
weakness or failure of any of its current reinsurers.
During the year, the company ceded earned premiums of $402,967 (1995 - $349,932) and
$267,568 (1995 - $318,789) of claims incurred.
10. Income TaxesThe provision for income taxes differs from the statutory marginal rate as certain sources of income
are exempt from tax or are taxed at other than the marginal rate.
A reconciliation of income tax calculated at the statutory marginal tax rate with the income tax
provision at the effective tax rate in the financial statements is summarized in the following table:
1996 1995($000) ($000)
Provision for taxes at statutory marginal income tax rate 72,057 41,583
Non-taxable investment income (15,018) (8,689)
Income earned outside Canada (977) (3,451)
Utilization of prior years' losses and other (21,702) (22,988)
Provision for income taxes 34,360 6,455
11. Statutory Requirements - Insurance SubsidiariesThe company's insurance subsidiaries are subject to certain requirements and restrictions under
their respective insurance company Acts including minimum asset requirements and dividend
restrictions.

October 14, 1999 1:12 AM
34
12. Contingencies and CommitmentsSubsidiaries of the company are defendants in several damage suits and have been named as third
party in other suits. The uninsured exposure to the company is not considered to be material.
The company may under certain circumstances be obligated to purchase loans to officers and
directors of the company and its subsidiaries from a Canadian chartered bank totalling $11,145
(1995 - $11,135) for which 393,570 (1995 - 399,092) subordinate voting shares of the company with
a year-end market value of $114,135 (1995 - $39,111) have been pledged as security.
At December 31, 1996 the company had net foreign currency contracts outstanding to sell
US$350,000, primarily to hedge future earnings from U.S. subsidiaries and U.S. portfolio
investments of Canadian subsidiaries, as well as FF800 million to hedge its net future investment
and future earnings from Compagnie Transcontinentale de Réassurance. At December 31, 1996
the unrealized gain associated with these foreign currency contracts was $2,652.
13. Operating LeasesAggregate future commitments at December 31, 1996 under operating leases relating to premises,
automobiles and equipment for various terms up to ten years are as follows:($000)
1997 33,600
1998 28,700
1999 22,500
2000 19,300
2001 15,000
Thereafter (in aggregate) 42,900
162,000
14. Earnings per ShareFully diluted and basic earnings per share are the same in 1996, as they were in 1995. Basic
earnings per share are $15.36 for 1996 and $9.79 for 1995. The weighted average number of
shares for 1996 was 9,817,482 (1995 - 8,933,098).

October 14, 1999 1:12 AM
35
15. AcquisitionsEffective May 31, 1996 the company purchased Odyssey Reinsurance Corporation (then named
Skandia America Reinsurance Corporation) of New York, New York. The purchase price was
US$228 million cash. On May 31, 1996 Odyssey Re had US$1,836 million in total assets and
US$1,522 million in total liabilities, at fair value. The US$86 million (C$118 million) excess of the
fair value of net assets acquired over the purchase price has been allocated to provision for claims,
which will be amortized to income as the underlying claims are paid. The vendor provided a
secured indemnification to a maximum of US$175 million for any inadequacy in Odyssey Re's
provision for claims as at December 31,1995 and any of Odyssey Re's reinsurance relating to the
period up to December 31, 1995 which subsequently becomes unrecoverable.
16. Segmented InformationThe company is a financial services holding company which through its subsidiaries and affiliates is
engaged in the insurance of commercial and personal property, oil and gas, casualty and life risks,
property and casualty reinsurance, investment management and the provision of claims adjusting,
appraisal and loss management services mainly in Canada and the United States.
(a) Industry segments.. Claims
Adjusting, Corporate and Insurance and Appraisal and Consolidation Reinsurance Loss Management Adjustments Consolidated
1996 1995 1996 1995 1996 1995 1996 1995($000) ($000) ($000) ($000) ($000) ($000) ($000) ($000)
Revenue 1,299,447 985,916 162,266 154,914 14,102 4,690 1,475,815 1,145,520
Earnings beforeincome taxes 202,423 102,920 8,898 8,083 (24,008) (15,086) 187,313 95,917
Identifiable assets 5,558,727 2,697,496 93,087 96,836 126,575 79,216 5,778,389 2,873,548
Amortization 8,269 7,691 3,906 3,618 1,390 1,390 13,565 12,699
Interest expense - - 2,347 2,875 34,207 18,296 36,554 21,171
(b) Geographic segments.. Canada United States Total
1996 1995 1996 1995 1996 1995($000) ($000) ($000) ($000) ($000) ($000)
Revenue 805,207 766,783 670,608 378,737 1,475,815 1,145,520
Earnings before income taxes 77,316 54,640 109,997 41,277 187,313 95,917
Identifiable assets 2,161,056 1,942,116 3,617,333 931,432 5,778,389 2,873,548
Amortization 11,216 10,552 2,349 2,147 13,565 12,699
Interest expense 35,904 20,415 650 756 36,554 21,171
CRC (Bermuda) Reinsurance is included in the Canadian segment and Wentworth Insurance is
included in the United States segment.

October 14, 1999 1:12 AM
36
17. Fair ValueInformation on the fair values of financial instruments of the company where those values differ
from their carrying values in the financial statements at December 31, 1996 include:
.. Note Book EstimatedReference Value Fair Value
($000) ($000)
Investments 3 3,353,454 3,480,602
Long term debt 6 487,038 502,378
Foreign exchange contracts 12 0 2,652
The amounts do not include the fair value of underlying lines of business. While fair value amounts
are designed to represent estimates of the amounts at which instruments could be exchanged in
current transactions between willing parties, certain of the company's financial instruments lack an
available trading market. Therefore, these instruments have been valued on a going concern basis.
Fair value information on the provision for claims is not determinable.
These fair values have not been reflected on the financial statements.
18. Subsequent EventOn September 6, 1996 the company announced that it had agreed to purchase Compagnie
Transcontinentale de Réassurance (CTR) of Paris, France for FF700 million (approximately $175
million), of which FF300 million was to be financed by a 10 year 21/2% note. At December 31, 1996
CTR had FF4.2 billion ($1.1 billion) in total assets and shareholders= equity of FF900 million ($225
million). CTR is an international reinsurer writing property and casualty reinsurance internationally.
CTR had gross written premiums exceeding FF2 billion ($500 million) in 1996. Completion of the
purchase is expected in February 1997.

October 14, 1999 1:12 AM
37
Management's Discussion and Analysis of Financial Condition and Results of Operations
Sources of RevenueRevenue reflected in the consolidated financial statements includes premiums earned and
investment income of the insurance companies, claims adjusting fees of Lindsey Morden and other
miscellaneous income. The following table summarizes the total revenue derived from these
categories from the date of acquisition of each company for the past five years:
Revenue by
Line of Business
.. 1996 1995 1994 1993 1992($000) ($000) ($000) ($000) ($000)
Insurance 1,299,447 985,916 476,445 201,402 143,915
Claims adjusting 162,266 154,914 156,093 142,105 139,782
Other income 14,102 4,690 2,359 515 3,133
1,475,815 1,145,520 634,897 344,022 286,830
The increase in insurance revenue in 1996 over 1995 was mainly the result of the May 31, 1996
acquisition of Odyssey Re which resulted in higher insurance premiums and investment income.
On a geographic basis, Canadian operations accounted for approximately 55% of Fairfax's revenue
and 41% of operating profits in 1996, compared with approximately 67% of revenue and 57% of
operating profits in 1995.
Canadian insurance operations accounted for approximately 56% of Fairfax's insurance premiums
in 1996.

October 14, 1999 1:12 AM
38
Net EarningsSources of net earnings with Lindsey Morden equity accounted were as follows for the past five
years:
1996 1995 1994 1993 1992($000) ($000) ($000) ($000) ($000)
Insurance underwriting (50,563) (40,883) (16,880) 2,065 (16,883)
Interest and dividends 144,101 86,274 53,742 23,006 22,786
Insurance earnings beforerealized gains 93,538 45,391 36,862 25,071 5,903
Claims adjusting(Fairfax portion) 2,298 2,098 532 395 282
Interest expense (34,997) (19,086) (10,426) (4,228) (5,552)
Goodwill and other amortization (4,765) (4,765) (1,392) (1,392) (232)
Corporate overhead and other (6,656) (5,618) (2,147) (2,862) 2,078
Realized gains 131,274 71,912 20,026 27,822 3,400
Pre-tax income 180,692 89,932 43,455 44,806 5,879
Less: taxes 29,872 2,435 5,350 11,466 (4,166)
Net earnings 150,820 87,497 38,105 33,340 10,045
Net earnings in 1996 were $150.8 million, an increase of $ 63.3 million or 72% from 1995 net
earnings of $87.5 million.
The major changes which affected net earnings were:
- Insurance earnings before realized gains increased by $48.1 million from 1995 due to
increased interest and dividend income, partially offset by higher underwriting losses
- Net realized gains increased in 1996 to $131.3 million from $71.9 million in 1995
- Interest expense increased in 1996 due to higher interest expenses from the debt related to
the purchase of Odyssey Re
- Corporate overhead and other increased mainly because of one time expenses associated
with the debt and share issues
- The provision for income taxes was higher in 1996 due to the higher pre-tax income partially
offset by a greater amount of tax-free Canadian dividend income.
Insurance UnderwritingFairfax's insurance companies employ disciplined underwriting practices with the objective of
rejecting underpriced risks. The combined loss and expense ratio is the traditional measure of
underwriting results of property and casualty companies. In any year when the ratio exceeds 100%,
it generally indicates that unprofitable business has been underwritten.

October 14, 1999 1:12 AM
39
A summary follows of the net premiums written and earned, and the loss, expense and combined
ratios, for the past twelve years:
NET PREMIUMS RATIOS
Written Earned Loss Expense Combined($000) ($000) (%) (%) (%)
1985 23,415 14,049 96 30 126
1986 55,992 40,885 72 23 95
1987 71,378 62,012 73 25 98
1988 68,224 66,265 73 19 92
1989 35,477 40,444 100 40 140
1990 74,487 78,427 82 31 113
1991 93,450 90,507 60 34 94
1992 128,664 118,854 79 35 114
1993 163,508 150,844 73 26 99
1994 411,570 400,559 74 30 104
1995 864,589 829,340 74 31 105
1996 1,043,079 1,030,888 73 32 105
In 1996 the combined ratio did not improve due to poor results at Ranger. Since current
management took over in September 1985 Fairfax has had combined ratios of less than 100% in
five of the eleven full years and greater than 100% in the remaining six years.
Net premiums written and earned by company for the past five years are shown in the following
table:

October 14, 1999 1:12 AM
40
1996 1995 1994 1993 1992($000) ($000) ($000) ($000) ($000)
Markel Written 62,576 79,683 55,937 44,896 38,422Earned 60,148 56,976 52,149 43,749 33,760
Federated Written 60,405 57,549 50,396 41,629 38,923Earned 59,472 54,297 47,376 40,436 38,776
Commonwealth Written 87,297 87,875 90,403 71,181 51,319Earned 87,770 86,962 86,520 61,855 46,318
Ranger Written 212,815 180,253 175,410 - -Earned 209,409 173,937 179,345 - -
Lombard Written 357,550 351,592 30,727 - -Earned 349,566 352,082 26,869 - -
CRC (Bermuda) Written 99,044 92,270 - - -Earned 97,805 89,252 - - -
Odyssey Re Written 155,044 - - - -Earned 158,547 - - - -
Wentworth and other Written 8,348 15,367 8,697 5,802 -Earned 8,171 15,834 8,300 4,804 -
Totals Written 1,043,079 864,589 411,570 163,508 128,664Earned 1,030,888 829,340 400,559 150,844 118,854
Increased competition resulted in a decrease in net premiums written in 1996 at Markel and flat
premiums at Commonwealth and Lombard. Federated and Ranger had higher net premiums
written in 1996 due to increased market penetration in their respective segments. Wentworth had a
significant decrease in net premiums written in 1996 as it benefitted from significant reinstatement
premiums in 1995. Odyssey Re results have been included for only seven months.
Net premiums written increased at Markel and Federated in 1995 due to price increases and
additional accounts written. Ranger and Lombard were included in Fairfax's income statements for
the first time in 1994 - for a year and for one month respectively. CRC (Bermuda)'s premiums
written originate mainly from a quota share treaty with Lombard.

October 14, 1999 1:12 AM
41
The total underwriting profit (loss) for the individual insurance companies for the past five years is
shown in the following table:
1996 1995 1994 1993 1992($000) ($000) ($000) ($000) ($000)
Markel (1,717) (1,088) (7,965) (5,088) (5,000)
Federated (132) (1,120) 257 (1,320) (1,294)
Commonwealth 11,435 9,104 1,867 5,126 (9,959)
Ranger (49,131) (31,524) (15,061) - -
Lombard (17,475) (30,915) (143) - -
CRC (Bermuda) 2,813 6,635 - - -
Odyssey Re (4,881) - - - -
Wentworth and other 8,525 8,025 4,165 3,347 (630)
Totals (50,563) (40,883) (16,880) 2,065 (16,883)
As shown, in 1996, as well as in 1995, the most significant underwriting loss (in relationship to
premiums earned) was incurred at Ranger. Lombard's underwriting loss should be considered
together with CRC (Bermuda)'s underwriting profit which includes an additional $10.9 million
underwriting loss from Ranger because of related reinsurance. As discussed in the Chairman's
section, management does not expect Ranger's loss to be repeated, and Lombard, including CRC
(Bermuda), had a small underwriting profit on a normalized basis. The Wentworth and other
underwriting profit includes a $7.9 million consolidation adjustment related to the Odyssey Re
acquisition.
Provision for ClaimsClaim provisions are established by the case method as claims are reported. The provisions are
subsequently adjusted as additional information on the estimated amount of a claim becomes
known during the course of its settlement. A provision is also made for management's calculation
of factors affecting the future development of claims including claims incurred but not reported
(IBNR) based on the volume of business currently in force and the historical experience on claims.
As time passes, more information about the claims becomes known and provision estimates are
appropriately adjusted upward or downward. Because of the estimation elements encompassed in
this process, and the time it takes to settle many of the more substantial claims, several years are
required before a meaningful comparison of actual losses to the original provisions can be
developed.
The development of the provision for claims is shown by the difference between estimates of
reserves as of the initial year-end and the re-estimated liability at each subsequent year-end. This
is based on actual payments in full or partial settlement of claims, plus re-estimates of the reserves

October 14, 1999 1:12 AM
42
required for claims still open or claims still unreported. Favourable development means that the
original reserve estimates were higher than subsequently indicated. Unfavourable development
means that the original reserve estimates were lower than subsequently indicated.
The following table presents a reconciliation of the provision for claims and loss adjustment
expense (LAE) by company for the past five years. As shown in the table, the sum of the provision
for claims for each of Fairfax's insurance subsidiaries is $3,405.2 million as at December 31, 1996 -
the amount shown as "Provision for claims" on Fairfax's balance sheet on page x. The >=other=>
shown in the table below is the $14 million Fairfax indemnification of Ranger reserves.
..
Reconciliation of Provision for Claimsand LAE as at December 31
1996 1995 1994 1993 1992($000) ($000) ($000) ($000) ($000)
Commonwealth, Federated and Markel 244,972 219,406 211,313 185,010 179,588
Lombard 307,877 312,331 311,546 - -
CRC (Bermuda) 193,270 163,592 150,930 - -
Total Canadian subsidiaries 746,119 695,329 673,789 185,010 179,588
Wentworth 13,363 12,095 7,659 1,486 6,381
Ranger 210,585 169,017 217,251 235,525 -
Odyssey Re 1,250,589 - - - -
Total U.S. subsidiaries 1,474,537 181,112 224,910 237,011 6,381
Federated Life 23,095 22,214 22,975 22,825 22,794
Other 14,000 14,000 - - 53
Total provision for claims and LAE 2,257,751 912,655 921,674 444,846 208,816
Reinsurance gross-up 1,147,422 414,482
Total including gross-up 3,405,173 1,327,137
The four tables that follow show the reconciliation and the reserve development of the insurance
companies' provision for claims. In order to avoid the distortions caused by foreign exchange
fluctuations, separate tables are provided for the Canadian and U.S. subsidiaries of Fairfax. CRC
(Bermuda) is included with the Canadian subsidiaries while Wentworth is included with the U.S.
subsidiaries.
The following table shows for Fairfax's Canadian subsidiaries the provision for claims liability for
unpaid losses and LAE as originally and as ultimately estimated for the years 1992 through 1996.
The favourable or unfavourable development from prior years is credited or charged to each year's
earnings.

October 14, 1999 1:12 AM
43
Reconciliation of Provision for ClaimsCanadian Subsidiaries.. 1996 1995 1994 1993 1992 ($000) ($000) ($000) ($000) ($000)Provision for claims and LAE at January 1
for Commonwealth, Federated, Markel,and, for 1996 and 1995, Lombardand CRC (Bermuda) 695,328 673,789 185,010 179,588 168,394
Incurred losses on claims and LAE
Provision for current accident year's claims 482,970 456,967 139,671 102,582 94,177
Increase (decrease) in provision for prior accident years' claims (16,692) 4,149 2,809 360 (393)
Total incurred losses on claims and LAE 466,278 461,116 142,480 102,942 93,784
Payments for losses and LAE
Payments on current accident year's claims (195,604) (205,766) (53,222) (40,696) (34,540)
Payments on prior accident years' claims (219,883) (233,811) (62,955) (56,824) (48,050)
Total payments for losses and LAE (415,487) (439,577) (116,177) ( 97,520) (82,590)
Provision for claims and LAE at December 31 - - 211,313 185,010 179,588
Reserves of Lombard and CRC (Bermuda) at December 31 - - 462,476
Provision for claims and LAE at December 31including Lombard and CRC (Bermuda) 746,119 695,328 673,789
The company strives to establish adequate provisions at the original valuation date. It is the
company=s objective to have favourable development from the past. The Canadian subsidiaries
had favourable development in 1996 of $16.7 million. The reserves will always be subject to
upward or downward development in the future.
The following table shows for Fairfax's Canadian subsidiaries the original provision for claims
reserves including LAE at each calendar year-end with the subsequent cumulative payments made
from these years and the subsequent re-estimated amount of these reserves. The following
insurance subsidiaries' reserves are included from the respective years in which they were originally
acquired:
Subsidiary Year AcquiredMarkel Insurance Company of Canada 1985
Federated Insurance Company of Canada 1990
Commonwealth Insurance Company 1990
Lombard General Insurance Company of Canada 1994
CRC (Bermuda) Reinsurance Limited 1994
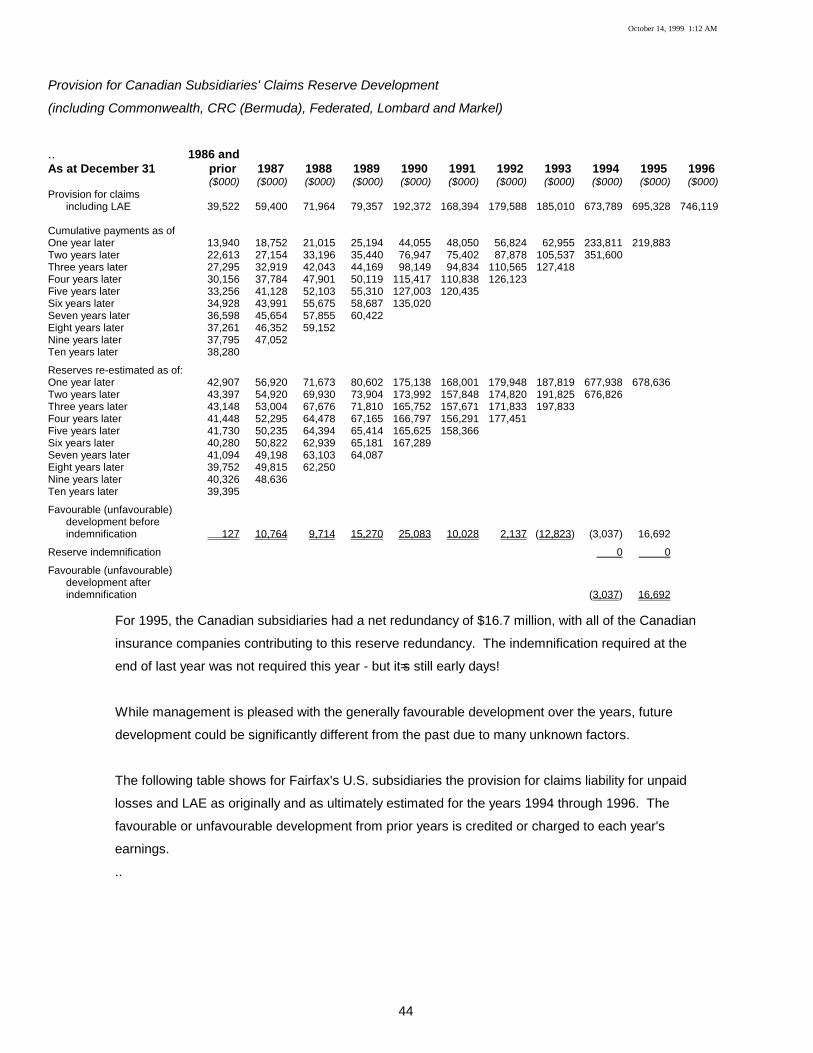
October 14, 1999 1:12 AM
44
Provision for Canadian Subsidiaries' Claims Reserve Development
(including Commonwealth, CRC (Bermuda), Federated, Lombard and Markel)
.. 1986 andAs at December 31 prior 1987 1988 1989 1990 1991 1992 1993 1994 1995 1996
($000) ($000) ($000) ($000) ($000) ($000) ($000) ($000) ($000) ($000) ($000)Provision for claims
including LAE 39,522 59,400 71,964 79,357 192,372 168,394 179,588 185,010 673,789 695,328 746,119
Cumulative payments as ofOne year later 13,940 18,752 21,015 25,194 44,055 48,050 56,824 62,955 233,811 219,883Two years later 22,613 27,154 33,196 35,440 76,947 75,402 87,878 105,537 351,600Three years later 27,295 32,919 42,043 44,169 98,149 94,834 110,565 127,418Four years later 30,156 37,784 47,901 50,119 115,417 110,838 126,123Five years later 33,256 41,128 52,103 55,310 127,003 120,435Six years later 34,928 43,991 55,675 58,687 135,020Seven years later 36,598 45,654 57,855 60,422Eight years later 37,261 46,352 59,152Nine years later 37,795 47,052Ten years later 38,280
Reserves re-estimated as of:One year later 42,907 56,920 71,673 80,602 175,138 168,001 179,948 187,819 677,938 678,636Two years later 43,397 54,920 69,930 73,904 173,992 157,848 174,820 191,825 676,826Three years later 43,148 53,004 67,676 71,810 165,752 157,671 171,833 197,833Four years later 41,448 52,295 64,478 67,165 166,797 156,291 177,451Five years later 41,730 50,235 64,394 65,414 165,625 158,366Six years later 40,280 50,822 62,939 65,181 167,289Seven years later 41,094 49,198 63,103 64,087Eight years later 39,752 49,815 62,250Nine years later 40,326 48,636Ten years later 39,395
Favourable (unfavourable)development beforeindemnification 127 10,764 9,714 15,270 25,083 10,028 2,137 (12,823) (3,037) 16,692
Reserve indemnification 0 0
Favourable (unfavourable)development afterindemnification (3,037) 16,692
For 1995, the Canadian subsidiaries had a net redundancy of $16.7 million, with all of the Canadian
insurance companies contributing to this reserve redundancy. The indemnification required at the
end of last year was not required this year - but it=s still early days!
While management is pleased with the generally favourable development over the years, future
development could be significantly different from the past due to many unknown factors.
The following table shows for Fairfax's U.S. subsidiaries the provision for claims liability for unpaid
losses and LAE as originally and as ultimately estimated for the years 1994 through 1996. The
favourable or unfavourable development from prior years is credited or charged to each year's
earnings.
..

October 14, 1999 1:12 AM
45
Reconciliation of Provision for Claims
U.S. Subsidiaries
1996 1995 1994 (US$000) (US$000) (US$000)
Provision for claims and LAE at January 1for Ranger and Wentworth 166,603 160,331 179,001
Incurred losses on claims and LAE
Provision for current accident year'sclaims 116,238 93,235 97,899
Increase in provision for prior accidentyears' claims 23,981 38,117 8,202
Total incurred losses on claims and LAE 140,219 131,352 106,101
Payments for losses and LAE
Payments on current accident year'sclaims (37,832) (34,394) (39,277)
Payments on prior accident years' claims (71,596) (90,686) (85,494)
Total payments for losses and LAE (109,428) (125,080) (124,771)
Provision for claims and LAE at December 31before indemnification 197,394 166,603 160,331
Reserve indemnification (34,000) (34,000) -
Provision for claims and LAE at December 31after indemnification 163,394 132,603 160,331
Reserves of Odyssey Re at December 31 848,719 - -
Provision for claims and LAE at December 31for Ranger, Wentworth and Odyssey Re 1,012,113 132,603 160,331Exchange rate 1.3706 1.3652 1.4028
Converted to Canadian dollars C$1,387,202 C$ 181,030 C$ 224,910
Purchase price and other adjustments C$ 87,335 C$ 82 -
Provision for claims and LAE at December 31after all adjustments C$1,474,537 C$ 181,112 C$224,910
The unfavourable reserve development of US$24.0 million in the U.S. operations in 1996 was due
to additional development of reserves at Ranger in the core lines as well as worse than expected
performance of the run-off lines.
The following table shows for Fairfax's U.S. subsidiaries the original provision for claims reserves
including LAE at each calendar year-end with the subsequent cumulative payments made from
these years and the subsequent re-estimated amount of these reserves. The following insurance
subsidiaries' reserves are included from the respective years in which they were originally acquired
(Wentworth from 1993 as its operations were minor prior to that):
SubsidiaryWentworth Insurance Company Ltd. Commenced business 1990
Ranger Insurance Company Acquired 1993
Provision for U.S. Subsidiaries' Claims Reserve Development
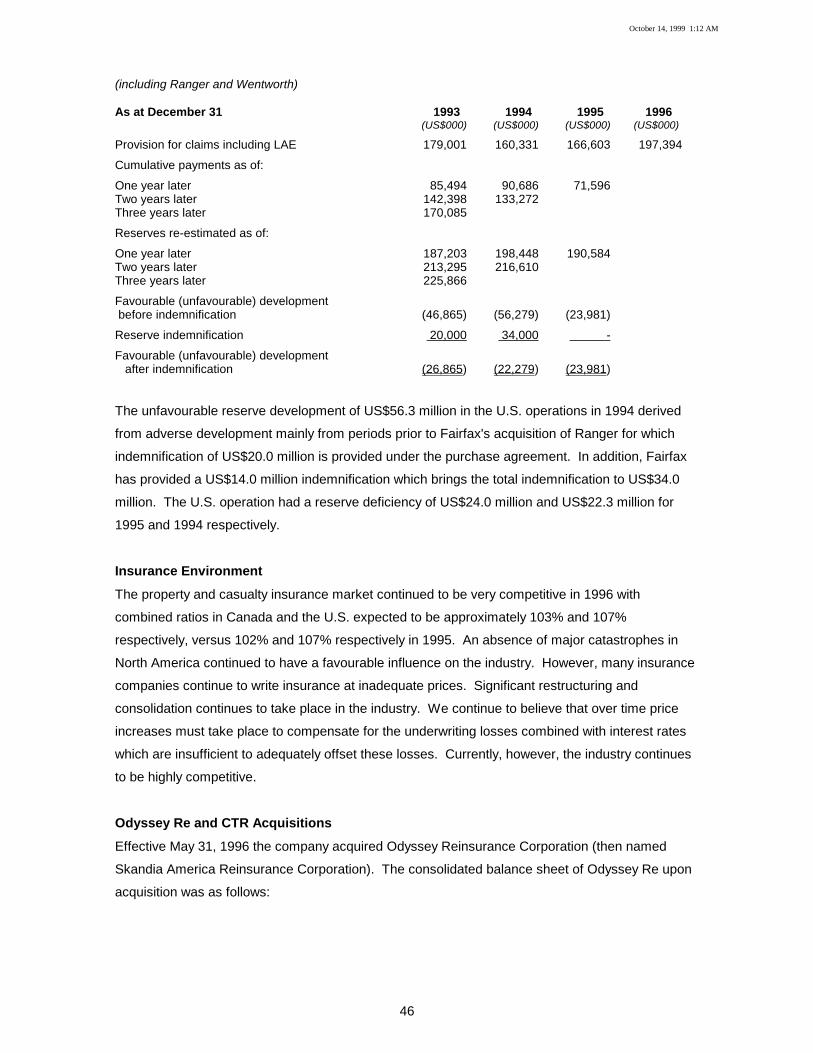
October 14, 1999 1:12 AM
46
(including Ranger and Wentworth)
As at December 31 1993 1994 1995 1996 (US$000) (US$000) (US$000) (US$000)
Provision for claims including LAE 179,001 160,331 166,603 197,394
Cumulative payments as of:
One year later 85,494 90,686 71,596Two years later 142,398 133,272Three years later 170,085
Reserves re-estimated as of:
One year later 187,203 198,448 190,584Two years later 213,295 216,610Three years later 225,866
Favourable (unfavourable) development before indemnification (46,865) (56,279) (23,981)
Reserve indemnification 20,000 34,000 -
Favourable (unfavourable) development after indemnification (26,865) (22,279) (23,981)
The unfavourable reserve development of US$56.3 million in the U.S. operations in 1994 derived
from adverse development mainly from periods prior to Fairfax's acquisition of Ranger for which
indemnification of US$20.0 million is provided under the purchase agreement. In addition, Fairfax
has provided a US$14.0 million indemnification which brings the total indemnification to US$34.0
million. The U.S. operation had a reserve deficiency of US$24.0 million and US$22.3 million for
1995 and 1994 respectively.
Insurance EnvironmentThe property and casualty insurance market continued to be very competitive in 1996 with
combined ratios in Canada and the U.S. expected to be approximately 103% and 107%
respectively, versus 102% and 107% respectively in 1995. An absence of major catastrophes in
North America continued to have a favourable influence on the industry. However, many insurance
companies continue to write insurance at inadequate prices. Significant restructuring and
consolidation continues to take place in the industry. We continue to believe that over time price
increases must take place to compensate for the underwriting losses combined with interest rates
which are insufficient to adequately offset these losses. Currently, however, the industry continues
to be highly competitive.
Odyssey Re and CTR AcquisitionsEffective May 31, 1996 the company acquired Odyssey Reinsurance Corporation (then named
Skandia America Reinsurance Corporation). The consolidated balance sheet of Odyssey Re upon
acquisition was as follows:

October 14, 1999 1:12 AM
47
(US$000)
Investments, including cash 1,088,136
Deferred premium acquisition costs 7,332
Accounts receivable 662,860
Deferred income taxes 70,321
Other assets 7,238
1,835,887
Provision for claims 1,364,128
Unearned premiums 81,006
Other liabilities 76,265
Shareholders' equity 314,488
1,835,887
The purchase price of US$228 million was paid in cash. The US$86 million (C$118 million) excess
of the shareholders' equity over the purchase price has been allocated to the provision for claims.
Odyssey Re underwrites a complete range of property and casualty reinsurance products. Odyssey
Re's net premiums written for 1996 were US$201 million.
Effective January 1, 1997 the company acquired Compagnie Transcontinentale de Réassurance.
The consolidated balance sheet of CTR upon acquisition was as follows:
(FF millions)
Investments, including cash 3,200
Deferred premium acquisition costs 80
Accounts receivable 640
Other assets 230
4,150
Provision for claims 2,200
Unearned premiums 500
Other liabilities 500
Deferred income taxes 50
Shareholders' equity 900
4,150
The purchase price of FF700 million (approximately $175 million) was paid in cash (FF400 million)
and a FF300 million 10 year 22% note. The FF300 million (approximately $75 million ) excess of
the shareholders= equity over the effective purchase price will be allocated to provision for claims.

October 14, 1999 1:12 AM
48
CTR writes primarily property, casualty and some life reinsurance internationally. CTR=s net
premiums written for 1996 exceeded FF1.5 billion.
Interest and Dividend IncomeThe majority of interest and dividend income is earned by the insurance companies. The
Commonwealth and Federated acquisitions added $130 million and $101 million respectively to the
investment portfolio at the end of 1990, and interest and dividend income for Commonwealth was
included for only two months in 1990. Ranger's $400 million investment portfolio acquired effective
December 31, 1993, Lombard's $684 million portfolio acquired effective November 30, 1994 and
Odyssey Re's $1,490 million portfolio acquired effective May 31, 1996 are included in the following
tables only as indicated.
.. Average Interest and DividendIncome
Investments Pre-Tax After Tax
at Book Value Amount YieldPer Share Amount Yield Per Share($000) ($000) (%) ($) ($000) (%) ($)
1985 29,060 2,455 8.45 0.87 1,271 4.37 0.45
1986 64,181 4,678 7.29 0.96 2,522 3.93 0.52
1987 109,825 8,042 7.32 1.10 5,499 5.01 0.77
1988 130,782 8,922 6.82 1.22 6,618 5.06 0.90
1989 135,703 11,628 8.57 1.51 8,537 6.29 1.11
1990 237,868 20,704 8.70 2.75 14,017 5.89 1.86
1991 338,461 26,051 7.70 4.44 17,731 5.24 3.02
1992 366,481 23,988 6.55 4.17 17,749 4.84 3.09
1993 * 418,207 23,251 5.56 3.78 17,994 4.30 2.92
1994 ** 852,010 58,219 6.83 7.12 39,608 4.65 4.85
1995 1,608,054 89,354 5.56 10.00 73,664 4.58 8.25
1996 *** 2,548,076 151,387 5.94 15.42 111,458 4.37 11.35* Ranger is not included in this line.** Lombard is not included in this line.*** Odyssey Re is included in this line for seven months.
Interest and dividend income increased in 1996 due mainly to the inclusion of Odyssey Re's
portfolio in May 1996. As shown, the pre-tax income yield increased in 1996 to 5.94% due to higher
interest yields on the Odyssey Re portfolio. The after-tax income yield dropped in 1996 because
the higher interest income from the Odyssey Re portfolio is fully taxable. Pre-tax interest and
dividend income per share has compounded at 30% per year since 1985.
Investments for the past twelve years are shown in the following table, the first five columns of

October 14, 1999 1:12 AM
49
which show them at the average of their carrying values at the beginning and end of each year, and
the final two columns of which show them at year-end.
Cash andShort Term Total
Investments Investments Bonds Preferreds Common Average Year-End Per Share
($000) ($000) ($000) ($000) ($000) ($000) ($) 1985 10,526 15,388 732 2,414 29,060 32,728 6.55
1986 16,605 24,523 7,979 15,074 64,181 95,633 13.65
1987 28,025 26,242 16,516 39,042 109,825 124,016 16.90
1988 29,843 23,575 25,191 52,173 130,782 137,548 18.79
1989 20,623 28,528 32,212 54,340 135,703 133,858 18.30
1990 33,596 99,220 45,652 59,400 237,868 335,740 61.30
1991 60,099 140,177 75,685 62,500 338,461 341,180 62.54
1992 77,929 108,818 99,821 79,913 366,481 396,240 65.44
1993 * 102,968 90,682 118,604 105,953 418,207 848,774 106.70
1994 ** 226,205 303,859 132,138 189,808 852,010 1,551,343 173.25
1995 297,989 796,310 157,017 356,738 1,608,054 1,668,656 188.14
1996 *** 470,651 1,462,064 168,438 446,923 2,548,076 3,454,521 330.07
* Ranger is not included in the first five columns in this line.** Lombard is not included in the first five columns in this line.*** Odyssey Re is included in this line
Total investments per share at year-end 1996 increased significantly due to the Odyssey Re
acquisition. Since 1985 investments per share have compounded at 43% per year.
The acquisition of CTR in February 1997 will increase investments per share to about $390 per
share.
Return on Investment PortfolioThe following table shows the performance of the investment portfolio for the past twelve years.
The total return includes all interest and dividend income, gains (losses) on the disposal of
securities and the change in the unrealized gains (losses) during the year.

October 14, 1999 1:12 AM
50
.. Realized Interest Gains Change in
Average and (Losses) UnrealizedInvestments Dividends after Gains Total Return
on at Book Value Earned Provisions (Losses) Average
Investments($000) ($000) ($000) ($000) ($000) (%)
1985 29,060 2,455 459 878 3,792 13
1986 64,181 4,678 952 (352) 5,278 8
1987 109,825 8,042 9,159 (7,976) 9,225 8
1988 130,782 8,922 7,802 12,131 28,855 22
1989 135,703 11,628 15,458 (6,272) 20,814 15
1990 237,868 20,704 2,278 (32,943) (9,961) (4)
1991 338,461 26,051 (4,512) 27,866 49,405 15
1992 366,481 23,988 3,400 (11,197) 16,191 4
1993 * 418,207 23,251 27,822 28,792 79,865 19
1994 ** 852,010 58,219 20,026 (42,407) 35,838 4
1995 1,608,054 89,354 71,912 45,438 206,704 13
1996*** 2,548,076 151,387 131,274 112,676 395,337 16
* Ranger is not included in this line.** Lombard is not included in this line.*** Odyssey Re is included in this line.
Investment gains (losses) have been an important component of Fairfax's net earnings since 1985.
The amount has fluctuated significantly from period to period, but the amount of investment gains
(losses) for any period has no predictive value and variations in amount from period to period have
no practical analytical value. At December 31, 1996 the aggregate provision for losses on
investments was $16.5 million (1995 - $8.9 million). At December 31, 1996 the Fairfax investment
portfolio had an unrealized gain of $127.1 million compared to an unrealized gain at December 31,
1995 of $14.5 million.
The company has a long term value-oriented investment philosophy. It continues to expect
fluctuations in the stock market.
Capital ResourcesAt December 31, 1996 total capital, comprising shareholders' equity and non-controlling (minority)
interest, was $932.1 million, compared to $491.5 million at December 31, 1995.
The following table shows the level of capital as at December 31 for the past five years:
1996 1995 1994 1993 1992($ millions)
Non-controlling interest 21.0 18.9 17.3 17.4 17.4
Shareholders' equity 911.1 472.6 391.9 279.5 143.8
932.1 491.5 409.2 296.9 161.2

October 14, 1999 1:12 AM
51
Fairfax's consolidated balance sheet as at December 31, 1996 continues to reflect significant
financial strength. Fairfax's shareholders' equity has increased from $472.6 million at December
31, 1995 to $911.1 million at December 31, 1996.
On March 26, 1996 the company issued 1,100,000 subordinate voting shares at $155 per share, for
net proceeds of $163.6 million, and on October 3, 1996 issued 500,000 subordinate voting shares
at $260 per share, for net proceeds of $124.7 million. In 1996, under the terms of a normal course
issuer bid approved by The Toronto Stock Exchange, the company purchased and cancelled 3,500
subordinate voting shares for an aggregate cost of $560,000 of which $407,000 was charged to
retained earnings.
In 1995 the company purchased and cancelled 85,100 subordinate voting shares for an aggregate
cost of $6,892,000, of which $4,384,000 was charged to retained earnings.
On October 12, 1994 the company issued 1,000,000 subordinate voting shares at $76 per share,
for net proceeds of $74.4 million. On November 26, 1993 the company issued 2,000,000
subordinate voting shares at $55 per share, for net proceeds of $104.8 million.
Fairfax's indirect ownership of its own shares through The Sixty Two Investment Company Limited
results in an effective reduction of shares outstanding by 799,230, and this reduction has been
reflected in the earnings per share and book value per share figures.
A common measure of capital adequacy in the property and casualty industry is the premiums to
surplus (or common shareholders' equity) ratio. This is shown for the insurance subsidiaries of
Fairfax for the past five years in the following table:
.. Net PremiumsWritten to Surplus
(Common
Shareholders' Equity)
1996 1995 1994 1993 1992Markel 1.2:1 1.6:1 1.3:1 1.1:1 1.0:1
Federated 1.2:1 1.2:1 0.9:1 1.1:1 1.1:1
Commonwealth 0.6:1 0.7:1 0.8:1 0.7:1 0.6:1
Ranger 1.1:1 1.2:1 1.5:1 1.6:1 -
Lombard 1.7:1 2.0:1 2.3:1 - -
Odyssey Re 0.6:1 - - - -
Canadian insurance industry 1.3:1 1.3:1 1.4:1 1.4:1 1.4:1
U.S. insurance industry 1.0:1 1.1:1 1.3:1 1.3:1 1.4:1

October 14, 1999 1:12 AM
52
In Canada, property and casualty companies are regulated by the Office of the Superintendent of
Financial Institutions on the basis of their Section 516 surplus. At December 31, 1996 Fairfax's
Canadian property and casualty insurance subsidiaries had a consolidated Section 516 surplus of
approximately $406 million (1995 - $275 million), significantly in excess of minimum requirements.
In the U.S. the National Association of Insurance Commissioners (NAIC) developed a model law
and risk-based capital (RBC) formula designed to help regulators identify property-casualty insurers
that may be inadequately capitalized. Under the NAIC's requirements an insurer must maintain
total capital and surplus above a calculated threshold or face varying levels of regulatory action.
The threshold is based on a formula that attempts to quantify the risk of a company's insurance,
investment and other business activities. Fairfax does not anticipate any adverse effects of such
requirements because of the strong capitalization of Ranger and Odyssey Re. At the end of 1996
Ranger and Odyssey Re each had capital and surplus in excess of three times the authorized
control level.
Fairfax and its insurance subsidiaries are rated as follows by the respective rating agencies as at
December 31, 1996:
A.M. Best Standard Duff DBRS Moody's& Poor's & Phelps
Fairfax - BBB+ BBB+ BBB(high) Baa3
Commonwealth A A A+ - -
Federated A - - - -
Markel A- - - - -
Ranger A- - A - -
Lombard A- - - - -
CRC (Bermuda) A- - - - -
Wentworth A- - - - -
Odyssey Re A- BBB+ - - -
In 1996 Markel was upgraded by A.M. Best to an A-(excellent), while CRC (Bermuda) and
Wentworth were given initial ratings by A.M. Best of A-. Odyssey Re was upgraded to BBB+ by
S&P on the purchase by Fairfax, while Ranger was downgraded by A.M. Best to A-. All other
ratings were maintained during the year.
LiquidityThe purpose of liquidity management is to ensure that there is sufficient cash to meet all financial
commitments and obligations as they fall due.

October 14, 1999 1:12 AM
53
Fairfax's parent company-only income statement is disclosed on page x. As shown, Fairfax had
revenue of $58.2 million in 1996, consisting of dividends from its insurance subsidiaries ($34.5
million), management fees ($8.7 million), interest income ($8.2 million) and realized gains ($6.8
million). After interest expense ($35.0 million), operating expenses ($7.6 million) and non-recurring
expenses ($3.0 million), the parent company (or holding company) had income of $12.6 million
before taxes. As inter-company dividends are tax free the parent company paid no income taxes,
so that net income after taxes amounted to $12.6 million. This income statement shows that in
1996 Fairfax comfortably met all its obligations from internal sources.
In 1997 Fairfax has access to a much larger amount of dividends and management fees and
should again comfortably meet all its obligations from internal sources, all the more so given the
elimination of non-recurring expenses.
Fairfax has a large cash holding of $101 million available to meet unexpected requirements. The
cash in the holding company would permit Fairfax to meet its net interest and other expenses for
four to five years without access to any dividends from its insurance subsidiaries.
Also, Fairfax has $600 million of unused, unsecured, committed, five year bank lines. The principal
covenant attached to these lines is a covenant to maintain a net debt to equity ratio not exceeding
1:1.
During 1996 Fairfax raised US$125 million in unsecured debentures due 2026 through a public
issue in the United States. These funds were used to complete the acquisition of Odyssey
Reinsurance Corporation.
During 1995 Fairfax raised US$100 million in unsecured 83% debentures due 2015 through a
public issue in the United States. These funds were used in part to pay off the long term bank debt
of $60 million described in the next paragraph.
During 1994 Fairfax raised $74.4 million through the share issue referred to above under "Capital
Resources". A further $60 million in five year unsecured bank loans provided the balance of the
cash component of the purchase price of Lombard. Payment of the purchase price was completed
by the issue of an unsecured $25 million 7:% debenture due December 15, 2003 containing the
same terms as the publicly issued debentures.
The company manages its debt levels based on the following financial measurements and ratios:
.. 1996 1995 1994Net debt ($ millions) 369.4 227.7 218.0
Net debt to equity 41% 48% 56%
Net debt to capital 29% 33% 36%

October 14, 1999 1:12 AM
54
Net debt to earnings 2.4x 2.6x 5.7x
Interest coverage 6.2x 5.7x 5.2x
The company=s financial position is very strong and all of its ratios improved in 1996.
The company has not paid and does not intend to pay dividends as long as it can reinvest its funds
and earn a 20% return on equity over time.
Issues and RisksThe following issues and risks, among others, should also be considered in evaluating the outlook
of the company.
Claims Reserves
The major risk that all property and casualty insurance and reinsurance companies face is that the
provision for claims is an estimate and may be found to be deficient in the future for a variety of
reasons including unpredictable jury verdicts, expansion of insurance coverage to include
exposures not contemplated at the time of policy issue (e.g. asbestos, pollution, breast implants), or
poor weather. The provision for claims before reinsurance gross-up amounted to $2,257.8 million
on Fairfax's balance sheet as at December 31, 1996.
Reinsurance Recoverables
Most insurance and reinsurance companies reduce their liability for any individual claim by
reinsuring amounts in excess of the maximum they want to retain. This third party reinsurance
does not relieve the company of its primary obligation to the insured. Reinsurance recoverables
can become an issue mainly due to solvency credit concerns but also due to policy disputes.
Fairfax had $1,258.9 million recoverable from reinsurers as at December 31, 1996.
Catastrophe Exposure
Insurance and reinsurance companies are subject to losses from catastrophes like earthquakes,
windstorms or hailstorms, which are unpredictable and can be very significant.
Prices
Prices in the insurance and reinsurance industry are cyclical and can fluctuate quite dramatically.
With under-reserving, competitors can price below underlying costs for many years and still survive.
Foreign Exchange
The company has assets, liabilities, revenue and costs that are subject to currency fluctuations,
particularly in the U.S. dollar but also other foreign currencies. These currency fluctuations have
been and can be very significant.

October 14, 1999 1:12 AM
55
Cost of Revenue
Unlike most businesses, the insurance and reinsurance business can have enormous costs that
bear no relation to revenue. Similar to short selling in the stock market (selling shares not owned),
there is no limit to the losses that can arise from most insurance policies.
Regulation
Insurance companies are regulated businesses which means that Fairfax does not have access to
each insurance company's net income and shareholders' capital without the approval of the
insurance regulatory authorities.
Common Stock Holdings
The company has a significant amount of common stocks in its portfolio. As common stocks
fluctuate, the company's shareholders' equity (or surplus) is exposed to fluctuations in the stock
market.
Goodwill
Most of the goodwill on the balance sheet comes from Lindsey Morden. Continued profitability is
essential for there to be no deterioration in the carrying value of the goodwill.
Ratings
The company has excellent claims paying and debt ratings by the major rating agencies in North
America. As financial stability is very important to its customers, the company is vulnerable to
downgrades by the rating agencies.
Holding Company
Being a small company, Fairfax is very dependent on strong operating management, which makes
it vulnerable to management turnover.
Quarterly Data (unaudited)(in $ millions except per share data)
First Second Third Fourth FullYears ended December 31 quarter quarter quarter quarter year
1996Revenue 276.4 316.1 420.0 463.3 1,475.8Net income 15.6 20.1 40.3 74.8 150.8Earnings per share $1.75 $2.03 $4.11 $7.47 $15.36
1995Revenue 266.0 281.0 294.8 303.7 1,145.5Net income 13.4 13.8 18.1 42.2 87.5Earnings per share $1.50 $1.53 $2.02 $4.74 $9.79
Stock Prices

October 14, 1999 1:12 AM
56
Below are The Toronto Stock Exchange high, low and closing prices of subordinate voting shares
of Fairfax for each quarter of 1996 and 1995.
First Second Third Fourthquarter quarter quarter quarter
($) ($) ($) ($) 1996
High 190.00 190.00 266.00 310.00Low 98.00 160.00 172.00 250.00Close 167.00 173.00 256.00 290.00
1995High 79.00 82.00 86.00 100.00Low 66.25 72.50 79.00 78.00Close 73.00 79.00 81.00 98.00

October 14, 1999 1:12 AM
57
Fairfax Insurance and Reinsurance CompaniesCombined Balance Sheetsas at December 31, 1996 and 1995(unaudited)
1996 1995($000) ($000)
AssetsAccounts receivable ............................................................ 596,928 369,094
Recoverable from reinsurers ................................................ 1,258,899 523,783
Income taxes refundable ..................................................... 14,652 18,911
Prepaid expenses ................................................................ 5,797 7,661
1,876,276 919,449Portfolio investments (at book value)
Cash and short term investments ........................................ 509,554 252,500
Bonds .................................................................................. 2,124,620 799,507
Preferred stocks .................................................................. 184,229 155,646
Common stocks ................................................................... 504,925 371,951
Real estate .......................................................................... 26,461 16,268
3,349,789 1,595,872
Deferred premium acquisition costs ..................................... 145,496 101,773
Deferred income taxes ......................................................... 138,860 38,046
Capital assets....................................................................... 26,906 20,987
Other assets ......................................................................... 21,400 21,369
5,558,727 2,697,496
LiabilitiesAccounts payable and accrued liabilities.............................. 190,239 125,741
Premium deposits................................................................. 43,674 10,929
233,913 136,670
Provision for claims .............................................................. 3,405,173 1,327,137
Unearned premiums ............................................................ 688,009 572,016
4,093,182 1,899,154
Shareholders' EquityCapital stock ........................................................................ 758,862 319,031
Contributed surplus .............................................................. 21,182 21,157
Retained earnings ............................................................... 451,588 321,485
1,231,632 661,673
5,558,727 2,697,496

October 14, 1999 1:12 AM
58
Fairfax Insurance and Reinsurance CompaniesCombined Statements of Earningsfor the years ended December 31, 1996 and 1995(unaudited)
1996 1995($000) ($000)
RevenuePremiums earned ....................................................................... 1,030,888 829,340
ExpensesLosses on claims ........................................................................ 753,777 614,059
Operating expenses ................................................................... 166,383 146,760
Commissions, net ....................................................................... 161,291 109,404
1,081,451 870,223
Underwriting loss .............................................................................. (50,563) (40,883)
Investment and other income (expense)Interest and dividends ............................................................... 144,100 86,274
Realized gains on investments ................................................... 124,459 70,302
268,559 156,576
Other .......................................................................................... (15,573) (12,773)
252,986 143,803
Earnings before income taxes ......................................................... 202,423 102,920
Provision for income taxes ......................................................... 30,028 2,418
Net earnings ...................................................................................... 172,395 100,502
Fairfax Insurance and Reinsurance CompaniesFairfax's insurance and reinsurance business is conducted by eight subsidiaries. These subsidiariesunderwrite a wide range of commercial and personal property, oil and gas, casualty and life insurance, andproperty and casualty reinsurance, in Canada, the United States and internationally.

October 14, 1999 1:12 AM
59
Fairfax with Equity Accounting of Lindsey MordenConsolidated Balance Sheetsas at December 31, 1996 and 1995(unaudited).. 1996 1995
($000) ($000)
AssetsCash and short term investments ........................................................ 101,067 70,354
Accounts receivable ............................................................................. 597,170 369,811
Recoverable from reinsurers ............................................................... 1,258,899 523,783
Income taxes refundable ...................................................................... 17,611 19,501
Prepaid expenses ................................................................................. 11,280 7,781
1,986,027 991,230
Portfolio investments
Subsidiary cash and short term investments(market value - $512,867; 1995 - $255,684)................................ 512,867 255,684
Bonds(market value - $2,151,569; 1995 - $821,244)............................. 2,124,620 799,507
Preferred stocks(market value - $201,239; 1995 - $160,298)................................ 182,229 154,646
Common stocks(market value - $588,128; 1995 - $357,722)................................ 506,939 370,639
Real estate(market value - $26,461; 1995 - $16,268).................................... 26,461 16,268
Total (market value - $3,480,264; 1995 - $1,611,216)......................... 3,353,116 1,596,744
Investment in Lindsey Morden ............................................................. 30,330 28,107
Deferred premium acquisition costs .................................................... 145,496 101,773
Deferred income taxes ......................................................................... 138,860 38,046
Capital assets ....................................................................................... 29,006 20,987
Goodwill ................................................................................................ 12,656 14,675
Other assets .......................................................................................... 25,497 18,112
5,720,988 2,809,674
LiabilitiesAccounts payable and accrued liabilities.............................................. 202,595 128,998
Premium deposits ................................................................................. 43,674 10,929
246,269 139,927
Provision for claims............................................................................... 3,405,173 1,327,137
Unearned premiums ............................................................................. 688,009 572,016
Long term debt ...................................................................................... 470,445 298,040
4,563,627 2,197,193
Shareholders' EquityCapital stock.......................................................................................... 513,420 225,295
Retained earnings................................................................................. 397,672 247,259
911,092 472,554
5,720,988 2,809,674

October 14, 1999 1:12 AM
60
Fairfax with Equity Accounting of Lindsey MordenConsolidated Statements of Earningsfor the years ended December 31, 1996 and 1995(unaudited)
1996 1995($000) ($000)
RevenuePremiums earned ........................................................................ 1,030,888 829,340
Interest and dividends ................................................................ 152,177 90,144
Realized gains on investments.................................................... 131,274 71,912
Equity earnings of Lindsey Morden,
net of dividends ................................................................... 2,278 2,098
1,316,617 993,494
ExpensesLosses on claims ........................................................................ 753,777 614,059
Operating expenses ................................................................... 185,860 161,013
Interest expense ......................................................................... 34,997 19,086
Commissions, net ....................................................................... 161,291 109,404
1,135,925 903,562
Earnings before income taxes ......................................................... 180,692 89,932
Provision for income taxes ......................................................... 29,872 2,435
Net earnings ...................................................................................... 150,820 87,497
Net earnings per share ..................................................................... $15.36 $9.79

October 14, 1999 1:12 AM
61
Lindsey Morden Group Inc.Consolidated Balance Sheetsas at December 31, 1996 and 1995
1996 1995($000) ($000)
AssetsCash ........................................................................................... 336 995
Accounts receivable .................................................................... 29,074 29,813
Claims in process ....................................................................... 15,029 15,390
Prepaid expenses ....................................................................... 919 1,478
45,358 47,676
Capital assets ............................................................................. 11,909 12,777
Other assets ................................................................................ 35,820 36,383
93,087 96,836
LiabilitiesBank indebtedness ..................................................................... 2,394 7,621
Accounts payable and accrued liabilities .................................... 17,459 17,824
Long term debt - current portion.................................................. 1,275 1,672
Deferred income taxes ................................................................ 4,036 3,883
25,164 31,000
Long term debt ........................................................................... 10,335 11,947
Future retirement payments ....................................................... 6,258 6,614
16,593 18,561
Subordinated convertible debenture .......................................... 7,900 8,149
Shareholders' EquityCapital stock ............................................................................... 22,986 22,618
Retained earnings ...................................................................... 20,444 16,508
43,430 39,126
93,087 96,836

October 14, 1999 1:12 AM
62
Lindsey Morden Group Inc.Consolidated Statements of Earningsfor the years ended December 31, 1996 and 1995
1996 1995($000) ($000)
Revenue ................................................................................162,266 154,914
Cost and expensesCost of service............................................................................. 127,102 120,631
Selling, general and administration ............................................. 23,919 23,425
Interest ........................................................................................ 2,347 2,775
153,368 146,831
Earnings before income taxes .......................................................... 8,898 8,083
Income taxes .............................................................................. 4,487 4,020
Net earnings ....................................................................................... 4,411 4,063
Consolidated Statements of Retained Earningsfor the years ended December 31, 1996 and 1995
1996 1995($000) ($000)
Retained earnings - beginning of year ............................................. 16,508 12,921
Net earnings for the year............................................................. 4,411 4,063
Dividends..................................................................................... (475) (476)
Retained earnings - end of year........................................................ 20,444 16,508
These condensed financial statements have been prepared from the Lindsey Morden Group Inc. audited
consolidated financial statements as at and for the years ended December 31, 1996 and 1995, copies of
which are available on request.

October 14, 1999 1:12 AM
63
Fairfax Financial Holdings LimitedUnconsolidated Balance Sheets (equity accounted)as at December 31, 1996 and 1995(unaudited)
1996 1995($000) ($000)
AssetsInsurance companies
Odyssey Re .. .......................................................... 390,270 -
Ranger .......... .......................................................... 215,087 195,268
Lombard......... .......................................................... 196,449 172,105
Commonwealth ......................................................... 136,916 127,191
Federated ...... .......................................................... 51,812 52,927
Markel ........... .......................................................... 52,768 52,163
CRC (Bermuda) ....................................................... 65,004 40,875
Wentworth ..... .......................................................... 123,724 13,185
1,232,030 653,714
Lindsey Morden - common shares............................... 22,430 20,207
- debentures ..................................... 7,900 7,900
30,330 28,107
Hamblin Watsa .. .......................................................... 8,167 9,567
Cash and short term investments.................................. 101,067 70,354
Investment portfolio ...................................................... 8,496 6,813
Noro Inc. (see page x ) ................................................. 2,326 -
Other assets ...... .......................................................... 12,086 2,217
1,394,502 770,772
LiabilitiesAccounts payable ......................................................... 12,965 178
Long term debt .. .......................................................... 470,445 298,040
483,410 298,218
Shareholders' EquityCapital stock ...... .......................................................... 513,420 225,295
Retained earnings ........................................................ 397,672 247,259
911,092 472,554
1,394,502 770,772

October 14, 1999 1:12 AM
64
Fairfax Financial Holdings LimitedUnconsolidated Statements of Earnings(parent company-only income statement)for the years ended December 31, 1996 and 1995(unaudited)
1996 1995($000) ($000)
RevenueDividend income .............................................. 34,452 27,302
Interest income ... ......................................................... 8,212 3,898
Management fees ......................................................... 8,736 8,736
Realized gains .... ......................................................... 6,840 2,610
58,240 42,546
ExpensesInterest expense .............................................. 34,997 19,420
Operating expenses ..................................................... 7,574 5,061
Non-recurring expenses ............................................... 3,044 4,131
45,615 28,612
Net earnings .......... ......................................................... 12,625 13,934

October 14, 1999 1:12 AM
65
APPENDIX
1. This is the letter which accompanied Fairfax's interim report for the three monthsended March 31, 1996.
To Our Shareholders: May 13, 1996
This letter is being mailed to you with our first quarter report to provide you with additionaldetails on our recently announced purchase of Skandia America Reinsurance Corporation(as opposed to waiting for the 1996 Annual Report).
On February 21, 1996, we announced that we had signed a definitive agreement, subject toour due diligence and financing, to purchase Skandia Re, an established reinsurancecompany located in New York, for US$230 million. As of December 31, 1995, Skandia Rehad a book value of US$344 million and an investment portfolio of US$1.2 billion. Itexpects to write net premiums of approximately US$200 million in 1996. The vendor,Skandia Sweden, is providing a US$175 million secured indemnification against adversedevelopment in reserves and reinsurance unrecoverables over the next 10 years.
On April 22, 1996, we announced that we had closed the purchase of Skandia Re inescrow, with final closing being subject to regulatory approval which we expect to receiveby the end of May. We financed the purchase price of US$230 million through the issue of1.1 million Fairfax shares at $155 per share and a 30 year U.S. public debenture issue forUS$125 million with an interest cost of 83% per annum. By year end 1996, we expect ourdebt/equity and debt/total capital ratios to be similar to year end 1995 ratios. Our financialposition will continue to be very strong.
So why are we buying Skandia Re? The major reasons are:
1) Skandia Re is among the oldest reinsurance companies in the U.S. with establishedmanagement in place, led by Jim Dowd. A.M. Best Company rates it A-(excellent)and Standard & Poor's, BBB+.
2) Reinsurance magnifies the abilities of management. A few people can have a verysignificant impact on the company. Also, the business is not as regulated as a primaryinsurance company.
3) The investment portfolio of US$1.2 billion provides significant diversification forFairfax.
4) The US$175 million secured indemnification, together with the US$114 milliondiscount to book value, provides very significant downside protection for Fairfax.
5) The low premium volume (US$200 million) to investment portfolio (US$1.2 billion),combined with the indemnification, should result in Fairfax comfortably achieving its20% return objective on the purchase price of US$230 million.
6) Long term equity and debt financing was available on fair terms.

October 14, 1999 1:12 AM
66
As always, there are risks in any purchase and the main ones are discussed below.
a) Skandia Re has significant long tail liabilities (including asbestos and environmental). We feel the US$175 million indemnification is sufficient protection but only time willtell (you may be too old to care by the time we know!).
b) Skandia Re lacked parental commitment since 1992 and has lost some managementtalent and some clients. It will take time to replace both.
c) Historical results at Skandia Re have been very poor (due mainly to adverse lossdevelopment). Adverse loss development from the past should not be a problem goingforward due to the reserve indemnification. We think Skandia Re can achieve acombined ratio of 110% in 1996 with a target of 100% or better going forward.
d) Skandia Re has reinsurance recoverables of approximately US$500 million on a netreserve base of approximately US$1 billion. The company is exposed to potential baddebts on its reinsurance recoverables. We feel comfortable with the bad debt reserveof US$30 million already in place and the US$175 million indemnification but again,only time will tell.
All in all, we feel that we have significant protection against the downside at Skandia Reand we are quite excited about the company's prospects in the future.
After the purchase and the financing of Skandia Re, Fairfax's investment portfolios willincrease to approximately $3.3 billion or $329 per share - up 75% from $188 per share as atDecember 31, 1995. Investment income per share (only interest and dividends) from theseportfolios, which ultimately drives earnings per share and book value per share, shoulddouble to $20 per share from $10 per share in 1995.
As always, who knows what the short term will bring, but we are very excited about ourlong term prospects with the purchase of Skandia Re.
V. Prem WatsaChairman and Chief Executive Officer

October 14, 1999 1:12 AM
67
B. This is the letter which accompanied Fairfax's interim report for the three monthsended September 30, 1996.
To Our Shareholders: November 2
This letter is being mailed to you with our third quarter report to provide you withadditional details on our recently announced purchase of Compagnie Transcontinentale deRéassurance (CTR) of France. The purchase terms are very similar to the terms of ourpurchase of Odyssey Re (Skandia Re's new name) discussed in our first quarter report.
On September 6, 1996, we announced that we had agreed, subject to our due diligence andfinancing, to purchase CTR, an established reinsurance company located in Paris, Francefor FF700 million (currently 3.85 French Francs = CDN$1). By December 31, 1996, CTRis expected to have a book value of approximately FF900 million, and an investmentportfolio of approximately FF3.2 billion. It expects to write net premiums ofapproximately FF1.5 billion in 1996. The vendor, the GAN group of France, is providing aFF250 million secured indemnification against adverse development in reserves andreinsurance unrecoverables over the next 10 years.
We have now signed a definitive purchase agreement for CTR. Closing is expected to bein mid-January, subject only to approval from the Government of France. We havefinanced the purchase price of FF700 million through the issue in early October of 500,000shares of Fairfax at $260 per share and by arranging a 10 year, FF300 million credit facilitybearing interest at 2.5% per annum and a possible participating interest based on CTR'scombined ratio. As with the purchase of Odyssey Re, we expect our debt/equity anddebt/total capital ratios to be similar to year end 1995 ratios. Our financial position willcontinue to be very strong.
So why are we buying CTR? The major reasons are:
1) CTR is among the oldest reinsurance companies in France with establishedmanagement in place, led by Jean-Philippe Casanova. Established in 1951, CTR hasstrong relationships all over the world, particularly in Europe and Asia. As mentionedwith the Odyssey Re purchase, we like the reinsurance business as it magnifies theabilities of management.
2) CTR provides an international reinsurance network for Odyssey Re under the capableleadership of Jim Dowd, Chairman and Chief Executive Officer, and Andy Barnard,President and Chief Operating Officer. Andy, who joined Odyssey Re in August 1996,helped build Transatlantic Re into an international reinsurance company.
3) CTR provides Fairfax with further business and investment diversification. For thefirst time, we will have sources of income from outside North America.
4) The FF250 million secured indemnification, together with the discount to book value,provides very meaningful downside protection for Fairfax.

October 14, 1999 1:12 AM
68
5) With CTR's combined ratio around 100% and investment portfolio of FF3.2 billion, aswell as attractive purchase financing, Fairfax should achieve its 20% return objectiveon the purchase price of FF700 million.
6) The purchase of CTR was able to be financed at fair terms and Fairfax continues tomaintain its very strong financial position.
As with Odyssey Re, there are risks in any purchase and the main ones are discussedbelow:a) CTR has a run-off book of business from the London market (business that had been
cancelled in 1983 and has been in run-off since). We feel the FF250 million securedindemnification is sufficient protection, but like Odyssey Re, only time will tell.
b) CTR has reinsurance recoverables of approximately FF340 million on a net reservebase of approximately FF2 billion. The company is exposed to potential bad debts onits reinsurance recoverables. We feel comfortable with the reinsurers CTR uses, itsexcellent bad debt experience in the past and the FF250 million securedindemnification, but again, only time will tell.
c) We have no insurance/reinsurance experience outside North America. Andy Barnard'sexperience is very key for us.
d) We have no significant investment experience outside North America. However, weare in the process of establishing that capability.
All in all, we feel we have significant protection against the downside at CTR and we arequite excited about the company's prospects in the future.
With the purchase of CTR, the combination of Odyssey Re and CTR will have in excess ofUS$500 million in both capital and net premiums - ranking Odyssey Re among the topreinsurers in the U.S.
After the purchase and financing of CTR, Fairfax's investment portfolios will increase toapproximately $4.1 billion or $390 per share - up 20% from $325 per share as at September30, 1996. Investment income per share (only interest and dividends) from these portfolios,which ultimately drives earnings per share and book value per share, should increase toover $24 per share in 1997.
As always, who knows what the short term will bring, but we are very optimistic about ourlong term prospects with the purchase of Odyssey Re and CTR.
V. Prem WatsaChairman and Chief Executive Officer

October 14, 1999 1:12 AM
69
Consolidated Financial Summary (in $ millions except share and per share data)
..Return on Per Share Shares
average Net Earnings outstand-share- Share-earnings before Share- ing at Closing
holders' holders' - fully income Net Total Invest- Net holders' year-end stockequity equity diluted Revenue taxes earnings assets ments debt * equity (000) price
For the years ended December 31:
1985 - 2.08 (1.89) 17.0 (0.9) (0.9) 41.5 32.7 - 10.4 5,000 3.25 **
1986 25.4% 5.89 1.35 53.7 9.1 6.5 129.8 95.6 2.8 41.3 7,007 12.75
1987 31.3% 8.32 2.23 113.0 18.2 16.0 185.4 124.0 2.8 61.0 7,337 12.37
1988 21.2% 10.13 1.94 133.6 21.3 14.4 246.8 137.5 28.2 74.2 7,322 15.00
1989 20.3% 12.41 2.25 125.8 19.2 16.7 248.1 133.9 22.0 90.8 7,316 18.75
1990 23.0% 17.29 2.92 195.4 23.2 21.3 536.0 335.7 65.9 94.7 5,477 11.00
1991 21.3% 21.41 3.94 250.0 32.5 22.5 516.6 341.2 51.3 116.8 5,455 21.25
1992 7.7% 23.76 1.76 286.8 7.0 10.0 590.5 396.2 68.2 143.8 6,055 25.00
1993 20.3% 35.13 5.42 344.0 46.7 33.3 1,200.3 848.8 132.4 279.5 7,955 61.25
1994 12.1% 43.77 4.66 634.9 46.0 38.1 2,173.4 1,551.3 218.0 391.9 8,955 67.00
1995 20.1% 53.28 9.79 1,145.5 95.9 87.5 2,873.5 *** 1,668.1 227.7 472.6 8,869 98.00
1996 21.4% 87.05 15.36 1,475.8 187.3 150.8 5,778.4 *** 3,454.5 369.4 911.1 10,466 290.00
* Total debt (beginning in 1994, net of cash in the holding company) with Lindsey Morden equity accounted** When current management took over in September 1985*** Reflects a change in accounting policy for reinsurance recoverables (note 2 to the financial statements)
Readers of the Management's Discussion and Analysis should review the entire Annual Report for additionalcommentary and information.

October 14, 1999 1:12 AM
70
Directors of the Company
Winslow W. BennettPresident, Winwood Holdings Ltd.
H Robbert HartogPresident, Robhar Investments Ltd.
H Steven A. MarkelVice ChairmanMarkel Corporation
Kenneth R. PolleyPresident and Chief Executive OfficerLindsey Morden Group Inc.
John C. PuddingtonPresident, Trilwood Investments Limited
H V. Prem WatsaChairman andChief Executive Officer
H Audit Committee Member
Operating Management
John B. O. WatsonPresidentCommonwealth Insurance Company
Jean-Philippe CasanovaPresidentCompagnie Transcontinentale de Réassurance
John M. PaisleyPresidentFederated Insurance Company of Canada andFederated Life Insurance Company of Canada
Anthony F. HamblinPresidentHamblin Watsa Investment Counsel Ltd.
Kenneth R. PolleyPresidentLindsey Morden Group Inc.
Byron G. MessierPresidentLombard General Insurance Companyof Canada
Mark J. RamPresidentMarkel Insurance Company of Canada
James F. Dowd, ChairmanAndrew A. Barnard, PresidentOdyssey Reinsurance Corporation
Peter M. WallnerPresidentRanger Insurance Company
Officers of the Company
Brenda AdamsVice President and Corporate Secretary
Sam ChanVice President
J. Paul T. FinkVice President
Eric P. SalsbergVice President, Corporate Affairs
Ronald SchokkingVice President, Finance
John C. VarnellVice President andChief Financial Officer
V. Prem WatsaChairman and Chief Executive Officer
Head Office
95 Wellington Street WestSuite 800Toronto, Ontario M5J 2N7Telephone (416) 367-4941
Transfer Agent and RegistrarThe R-M Trust Company
Share ListingThe Toronto Stock ExchangeStock Symbol FFH
General CounselTory Tory DesLauriers & Binnington
AuditorsCoopers & Lybrand
Annual MeetingThe annual meeting of shareholders of Fairfax Financial HoldingsLimited will be held on Wednesday, April 16, 1997 in Room 105at 4.30 p.m. at the Metro Toronto Convention Centre,255 Front Street West, Toronto.
