2017 annual report -...
TRANSCRIPT

2017 Annual Report

Contents
Fairfax Corporate Performance . . . . . . . . . . . . . 1
Corporate Profile . . . . . . . . . . . . . . . . . . . . . . 2
Chairman’s Letter to Shareholders . . . . . . . . . . 4
Management’s Responsibility for the FinancialStatements and Management’s Report onInternal Control over Financial Reporting . . . 28
Independent Auditor’s Report to theShareholders . . . . . . . . . . . . . . . . . . . . . . . . 29
Fairfax Consolidated Financial Statements . . . . . 32
Notes to Consolidated Financial Statements . . . 39
Management’s Discussion and Analysis ofFinancial Condition and Results of Operations 123
Appendix – Fairfax Guiding Principles . . . . . . . . 202
Corporate Information . . . . . . . . . . . . . . . . . . 203

30JAN201416052574
2017 Annual Report
Fairfax Corporate Performance(in US$ millions, except as otherwise indicated)(1)
Book Common Earningsvalue Closing Net share- Shares (loss)
per share earnings Total Invest- Net holders’ out- pershare price(1) Revenue (loss) assets ments debt equity standing share
As at and for the years ended December 31(2)
1985 1.52 3.25(3) 12.2 (0.6) 30.4 23.9 – 7.6 5.0 (1.35)1986 4.25 12.75 38.9 4.7 93.4 68.8 3.7 29.7 7.0 0.981987 6.30 12.37 86.9 12.3 139.8 93.5 4.9 46.0 7.3 1.721988 8.26 15.00 112.0 12.1 200.6 111.7 27.3 60.3 7.3 1.631989 10.50 18.75 108.6 14.4 209.5 113.1 21.9 76.7 7.3 1.871990 14.84 11.00 167.0 18.2 461.9 289.3 83.3 81.6 5.5 2.421991 18.38 21.25 217.4 19.6 447.0 295.3 58.0 101.1 5.5 3.341992 18.55 25.00 237.0 8.3 464.6 311.7 69.4 113.1 6.1 1.441993 26.39 61.25 266.7 25.8 906.6 641.1 118.7 211.1 8.0 4.191994 31.06 67.00 464.8 27.9 1,549.3 1,105.9 166.3 279.6 9.0 3.411995 38.89 98.00 837.0 63.9 2,104.8 1,221.9 175.7 346.1 8.9 7.151996 63.31 290.00 1,082.3 110.6 4,216.0 2,520.4 281.6 664.7 10.5 11.261997 86.28 320.00 1,507.7 152.1 7,148.9 4,054.1 369.7 960.5 11.1 14.121998 112.49 540.00 2,469.0 280.3 13,640.1 7,867.8 830.0 1,364.8 12.1 23.601999 155.55 245.50 3,905.9 42.6 22,229.3 12,289.7 1,248.5 2,088.5 13.4 3.202000 148.14 228.50 4,157.2 75.5 21,667.8 10,399.6 1,251.5 1,940.8 13.1 5.042001 117.03 164.00 3,953.2 (406.5) 22,183.8 10,228.8 1,194.1 1,679.5 14.4 (31.93)2002 125.25 121.11 5,104.7 252.8 22,173.2 10,596.5 1,602.8 1,760.4 14.1 17.492003 163.70 226.11 5,731.2 288.6 24,877.1 12,491.2 1,961.1 2,264.6 13.8 19.512004 162.76 202.24 5,829.7 53.1 26,271.2 13,460.6 1,965.9 2,605.7 16.0 3.112005 137.50 168.00 5,900.5 (446.6) 27,542.0 14,869.4 1,984.0 2,448.2 17.8 (27.75)2006 150.16 231.67 6,803.7 227.5 26,576.5 16,819.7 1,613.6 2,662.4 17.7 11.922007 230.01 287.00 7,510.2 1,095.8 27,941.8 19,000.7 1,207.4 4,063.5 17.7 58.382008 278.28 390.00 7,825.6 1,473.8 27,305.4 19,949.8 412.5 4,866.3 17.5 79.532009 369.80 410.00 6,635.6 856.8 28,452.0 21,273.0 1,071.1 7,391.8 20.0 43.752010 376.33 408.99 5,967.3 335.8 31,448.1 23,300.0 1,254.9 7,697.9 20.5 14.822011 364.55 437.01 7,475.0 45.1 33,406.9 24,322.5 2,055.7 7,427.9 20.4 (0.31)2012 378.10 358.55 8,022.8 526.9 36,945.4 26,094.2 1,920.6 7,654.7 20.2 22.682013 339.00 424.11 5,944.9 (573.4) 35,999.0 24,861.6 1,752.9 7,186.7 21.2 (31.15)2014 394.83 608.78 10,017.9 1,633.2 36,131.2 26,192.7 1,966.3 8,361.0 21.2 73.012015 403.01 656.91 9,580.4 567.7 41,529.0 29,016.1 2,075.6 8,952.5 22.2 23.152016 367.40 648.50 9,299.6 (512.5) 43,384.4 28,430.7 3,438.2 8,484.6 23.1 (24.18)2017 449.55 669.34 16,224.6 1,740.6 64,090.1 39,255.4 4,057.2 12,475.6 27.8 64.98
Compound annual growth19.5% 18.1%
(1) All share references are to common shares; Closing share price is in Canadian dollars; per share amounts are in US dollars;Shares outstanding are in millions.
(2) IFRS basis for 2010 to 2017; Canadian GAAP basis for 2009 and prior. Under Canadian GAAP, investments weregenerally carried at cost or amortized cost in 2006 and prior.
(3) When current management took over in September 1985.
1

FAIRFAX FINANCIAL HOLDINGS LIMITED
Corporate Profile
Fairfax Financial Holdings Limited is a holding company whose corporate objective is to build long termshareholder value by achieving a high rate of compound growth in book value per share over the long term. Thecompany has been under present management since September 1985.
Insurance and Reinsurance
Northbridge Financial, based in Toronto, Canada, provides property and casualty insurance products in theCanadian market through its Northbridge Insurance and Federated subsidiaries. It is one of the largest commercialproperty and casualty insurers in Canada based on gross premiums written. In 2017, Northbridge’s net premiumswritten were Cdn$1,381.0 million. At year-end, the company had statutory equity of Cdn$1,442.2 million and therewere 1,467 employees.
OdysseyRe, based in Stamford, Connecticut, underwrites treaty and facultative reinsurance as well as specialtyinsurance, with principal locations in the United States, Toronto, London, Paris, Singapore and Latin America. In2017, OdysseyRe’s net premiums written were US$2,495.9 million. At year-end, the company had shareholders’equity of US$4,067.7 million and there were 987 employees.
Crum & Forster (C&F), based in Morristown, New Jersey, is a national commercial property and casualty insurancecompany in the United States writing a broad range of commercial, principally specialty, coverages. In 2017, C&F’snet premiums written were US$1,863.4 million. At year-end, the company had statutory surplus ofUS$1,302.3 million and there were 2,298 employees.
Zenith National, based in Woodland Hills, California, is primarily engaged in the workers’ compensationinsurance business in the United States. In 2017, Zenith National’s net premiums written were US$837.4 million. Atyear-end, the company had statutory surplus of US$571.7 million and there were 1,535 employees.
Brit, based in London, England, is a market-leading global Lloyd’s of London specialty insurer and reinsurer. In2017, Brit’s net premiums written were US$1,530.9 million. At year-end, the company had shareholders’ equity ofUS$1,130.3 million and there were 558 employees.
Allied World, based in Zug, Switzerland, provides property, casualty and specialty insurance and reinsurancesolutions, with principal locations in the United States, Bermuda, London, Singapore and Canada. In 2017, AlliedWorld’s net premiums written were US$2,238.8 million. At year-end, the company had shareholders’ equity ofUS$2,523.8 million and there were 1,430 employees. Allied World was acquired on July 6, 2017.
Fairfax Asia
Falcon Insurance, based in Hong Kong, writes property and casualty insurance in niche markets in Hong Kong. In2017, Falcon’s net premiums written were HKD 361.9 million (approximately HKD 7.8 = US$1). At year-end, thecompany had shareholders’ equity of HKD 573.4 million and there were 66 employees.
Pacific Insurance, based in Malaysia, writes all classes of general insurance and medical insurance in Malaysia. In2017, Pacific Insurance’s net premiums written were MYR 229.0 million (approximately MYR 4.3 = US$1). Atyear-end, the company had shareholders’ equity of MYR 439.6 million and there were 422 employees.
AMAG, based in Indonesia, writes all classes of general insurance in Indonesia. In 2017, AMAG’s net premiumswritten were IDR 672.1 billion (approximately IDR 13,381.5 = US$1). At year-end, the company had shareholders’equity of IDR 3,170.1 billion and there were 769 employees.
Fairfirst Insurance, based in Sri Lanka, writes general insurance in Sri Lanka, specializing in automobile andpersonal accident lines of business. In 2017, Union Assurance’s net premiums written were LKR 7,831.3 million(approximately LKR 152.6 = US$1). At year-end, the company had shareholders’ equity of LKR 5,358.7 million andthere were 963 employees. Union Assurance amalgamated with Fairfirst Insurance Limited effective February 28,2017 and the amalgamated entity continued as Fairfirst Insurance Limited.
Insurance and Reinsurance – Other
Advent, based in London, England, is a reinsurance and insurance company, operating through Syndicate 780 atLloyd’s, focused on specialty property reinsurance and insurance risks. In 2017, Advent’s net premiums written wereUS$184.4 million. At year-end, the company had shareholders’ equity of US$129.7 million and there were117 employees.
2

Group Re primarily constitutes the participation by CRC Re and Wentworth (both based in Barbados) in thereinsurance of Fairfax’s subsidiaries by quota share or through participation in those subsidiaries’ third partyreinsurance programs on the same terms and pricing as the third party reinsurers. Group Re also writes third partybusiness. In 2017, Group Re’s net premiums written were US$129.2 million. At year-end, the Group Re companieshad combined shareholders’ equity of US$442.7 million.
Bryte Insurance, based in South Africa, writes property and casualty insurance in South Africa and Botswana. In2017, Bryte Insurance’s net premiums written were ZAR 3.2 billion (approximately ZAR 13.3 = US$1). At year-end,the company had shareholders’ equity of ZAR 1,861.6 million and there were 765 employees.
Fairfax Central and Eastern Europe comprises Polish Re and Colonnade Insurance.
Polish Re, based in Warsaw, writes reinsurance in the Central and Eastern European regions. In 2017, Polish Re’s netpremiums written were PLN 211.1 million (approximately PLN 3.8 = US$1). At year-end, the company hadshareholders’ equity of PLN 334.5 million and there were 39 employees.
Colonnade Insurance, based in Luxembourg, writes general insurance through its Ukrainian insurance company andthrough its branches in the Czech Republic, Hungary, Slovakia, Bulgaria, Poland and Romania. In 2017, ColonnadeInsurance’s net premiums written were US$92.2 million. At year-end, the company had shareholders’ equity ofUS$67.3 million and there were 461 employees.
Fairfax Latin America comprises Fairfax Brasil and Fairfax Latam.
Fairfax Brasil, based in Sao Paulo, writes general insurance in Brazil. In 2017, Fairfax Brasil’s net premiums writtenwere BRL 200.5 million (approximately BRL 3.2 = US$1). At year-end, the company had shareholders’ equity of BRL213.8 million and there were 104 employees.
Fairfax Latam, with its headquarters in Miami, writes general, property and casualty insurance through its operatingcompanies in Chile and Colombia (acquired July 2017), Argentina (acquired September 2017) and Uruguay(acquired January 2018). In 2017, Fairfax Latam’s net premiums written were US$97.7 million. At year-end, thecompany had shareholders’ equity of US$146.9 million and there were 980 employees.
Run-off
The run-off business comprises the U.S. and the European run-off groups. At year-end, the run-off group hadcombined shareholders’ equity of US$1,750.7 million.
The Resolution Group (TRG) and the RiverStone Group (run by TRG management) manage run-off under theRiverStone name. At year-end, TRG/RiverStone had 269 employees in the U.S., located primarily in Manchester,New Hampshire, and 137 employees in its offices in the United Kingdom.
Other
Pethealth, based in Toronto with 412 employees, provides pet medical insurance and pet-related managementsoftware and database management services in North America and the United Kingdom. In 2017, Pethealthproduced gross premiums written of Cdn$80.6 million.
Hamblin Watsa Investment Counsel, founded in 1984 and based in Toronto, provides investment managementto the insurance, reinsurance and run-off subsidiaries of Fairfax.
Notes:
(1) All of the above companies are wholly owned (except for 73%-owned Brit, 67%-owned Allied World, 85%-owned PacificInsurance, 78%-owned Fairfirst Insurance and 80%-owned AMAG).
(2) The foregoing lists all of Fairfax’s operating subsidiaries (many of which operate through their own operating structure,primarily involving wholly-owned operating subsidiaries). The Fairfax corporate structure also includes a 9.9% interest inICICI Lombard (an Indian property and casualty insurance company), a 41.4% interest in Gulf Insurance (a Kuwaitcompany with property and casualty insurance operations in the MENA region), a 34.9% interest in Thai Re (a Thaireinsurance and insurance company), a 15.0% interest in Alltrust Insurance (a Chinese property and casualty insurancecompany), a 35.0% interest in BIC Insurance (a Vietnamese property and casualty insurance company), a 27.8% interestin Singapore Re (a Singapore based reinsurance company), a 41.2% interest in Falcon Insurance (Thailand), a 43.3%interest in Eurolife (a Greek life and non-life insurer), a 45.3% interest in Digit (an insurance company in India establishedby Fairfax) and a 7.4% interest in Africa Re as well as investments in a number of non-insurance-related companies. Theother companies in the Fairfax corporate structure, which include a number of intermediate holding companies, have noinsurance, reinsurance, run-off or other operations.
3

FAIRFAX FINANCIAL HOLDINGS LIMITED
To Our Shareholders,
We had a record year in 2017 in spite of a spate of hurricanes and other catastrophes that cost us $1.3 billion(1). Weearned a record $1.7 billion in 2017, our book value per share increased 24.7% (adjusted for the $10 per sharedividend paid) to $450 per share and we ended the year with a record $2.4 billion in cash and marketable securities inthe holding company. Since we began in 1985, our book value per share has compounded at 19.5% annually whileour common stock price has compounded at 18.1% annually. Our company is in great shape.
Here’s how our insurance companies performed in 2017:
Combined RatioUnderwriting Combined Catastrophe Excluding
Profit (Loss) Ratio Losses Cat Losses
Northbridge 9 99.1% 0.9% 98.2%OdysseyRe 60 97.4% 16.8% 80.6%Crum & Forster 3 99.8% 2.3% 97.5%Zenith 117 85.6% 1.0% 84.6%Brit (202) 113.1% 16.8% 96.3%Allied World* (587) 157.0% 52.7% 104.3%Fairfax Asia 38 88.4% – 88.4%Other Insurance and Reinsurance (80) 110.2% 10.0% 100.2%
Consolidated (642) 106.6% 13.7% 92.9%
* For the period since its acquisition on July 6, 2017
The second half of 2017 reminded us yet again that ours is a risk business. During the third quarter of 2017, theinsurance industry experienced some of the largest catastrophe losses in its history as a result of Hurricanes Harvey,Irma and Maria and earthquakes in Mexico. During the fourth quarter, the industry suffered losses from theCalifornia wildfires, resulting in total catastrophe losses of about $130 billion for the industry in 2017 – close to thelargest losses the industry has suffered in its history. Catastrophe losses cost us 13.7% of net premiums earned in 2017versus 4.6% in 2016. Over the past ten years, catastrophe losses have cost us 7.7% of net premiums earned. The tablebelow shows you our 2017 losses from the major catastrophes (we acquired Allied World only in July 2017):
Fairfaxexcluding Allied
Allied World World Total
Hurricane Irma 218 154 372Hurricane Maria 157 125 282Hurricane Harvey 129 123 252California wildfires 98 87 185Mexico earthquakes 15 9 24Other 171 44 215
Total catastrophe losses 788 542 1,330
As % of net premiums earned 9.1% 52.7%* 13.7%
* % of net premiums earned by Allied World since we acquired it in July 2017
As you can see, catastrophe losses for Fairfax amounted to $1.3 billion or 13.7% of net premiums earned; AlliedWorld’s losses as a percentage of net premiums earned were magnified as the losses were on only six months ofpremiums: for the year, Allied World’s catastrophe losses were 25.1% of net premiums earned – higher than our ownexperience. We do not expect this to be the case in the future. Our combined ratio for Fairfax, including Allied World,was 106.6%, of which catastrophe losses accounted for 13.7%. Excluding Allied World, our catastrophe losses were
(1) Amounts in this letter are in U.S. dollars unless specified otherwise. Numbers in the tables in this letter are in U.S. dollarsand $ millions except as otherwise indicated.
4

9.1% of net premiums earned – within the range you would expect in a very severe catastrophe year like 2017. Ourcombined ratio excluding Allied World was 100.6%.
With the exception of Brit, which demonstrated a combined ratio under 100% excluding catastrophe losses, all ofour pre-existing major insurance subsidiaries continued to achieve a combined ratio under 100%, with Zenith andFairfax Asia at 85.6% and 88.4% respectively. But special mention must be made of OdysseyRe, whose business issignificantly subject to catastrophe risk.
OdysseyRe had an outstanding year in 2017, with a combined ratio of 97.4% in spite of the catastrophes, andpremiums growing by 17%. This was the first time in OdysseyRe’s history that its combined ratio was less than 100%in a year of major catastrophe losses. A big round of applause for Brian Young and his team. It helped that Brian hadHudson Insurance, which we began essentially from scratch in 2002 and which is run by Chris Gallagher, with$1 billion in premium in 2017 at a combined ratio of 92%!
We have always told you that our results will be lumpy, and this was demonstrated in spades by our two large capitalgains in 2017:
1. from the reduction in our ownership of ICICI Lombard from 35% to 9.9%; and
2. from our strategic alliance with Mitsui Sumitomo Insurance Company and our sale of First Capital to them.
Why did we make these two sales?
ICICI Lombard is an Indian insurance company that we began in 2001 from scratch as a minority partner with ICICIBank. Over the following 16 years, ICICI Lombard went on to become the largest non-government-owned propertyand casualty insurance company in India. Until fairly recently, our ownership interest was limited to 26% bygovernment mandate. About three years ago, the government allowed the foreign ownership to go to 49%, whichresulted in our going to 35% by buying 9% from ICICI Bank. Since then, given ICICI Lombard’s intent to go public,ICICI Bank wanting to control ICICI Lombard with at least 55% ownership, and Indian law requiring that the publicown at least 25% of a public company, our ownership would be reduced to a mere 20%. As property and casualtyinsurance is our core business and we are very optimistic about the growth prospects in India, and as Indian law doesnot permit an ownership of 10% or more in more than one insurance company, we agreed with ICICI Bank that wewould reduce our interest in ICICI Lombard to below 10% so that we could start our own property and casualtycompany in India, Digit. ICICI Lombard is a great company led by an exceptional leader, Bhargav Dasgupta, and wewish them much success in the years to come. We have thoroughly enjoyed our partnership with ICICI Bank and itsCEO Chanda Kochhar and we wish them also much success in the future.
The reduction in our equity interest in ICICI Lombard from 35% to 9.9% resulted in cash proceeds of $909 millionplus our continuing to own 45 million shares of ICICI Lombard worth $450 million at the IPO (now worth about$550 million) resulting in an after-tax gain of $930 million.
For the past two years, Mr. Athappan has come to me saying that he had taken First Capital as far as he could in thecommercial property and casualty business in Singapore and that he needed a partner like Mitsui with a brand nameto build the personal lines business. I refused him twice as I really did not want to sell First Capital. His continuedpersistence, his position as the founder of the company, and the fact that he would continue to run Fairfax Asia andFirst Capital and we would have a 25% quota share in the business of First Capital going forward persuaded us, withunanimous support from our officers and directors, to form a global alliance with Mitsui Sumitomo InsuranceCompany and sell First Capital to them. We worked very closely with Matsumoto san, the Senior Executive Officer ofInternational Business of Mitsui Sumitomo, and his team, and the partnership is going very well. Through ourcooperation agreement with Mitsui Sumitomo, we have been working together on a number of fronts includingopportunities on reinsurance, shared business and products and innovation to name a few. We are very excited to bea partner with Mitsui Sumitomo. Total proceeds from the sale of First Capital were $1.7 billion, resulting in anafter-tax gain of $1.0 billion. I do want to emphasize that we agreed to this global alliance and sale only because of itstruly unique circumstances and we do not see this being repeated! Our companies are not for sale, period!
By the way, Mr. Athappan has had an incredible record with us in building First Capital. We provided $35 million in2002 to let him establish First Capital; 15 years later, with no additional capital having been added, he had grownFirst Capital to be the largest P&C company in Singapore and with the Mitsui Sumitomo deal, gave us back$1.7 billion. That’s a compound rate of return of approximately 30% annually. A fantastic track record byMr. Athappan!
5

FAIRFAX FINANCIAL HOLDINGS LIMITED
While catastrophes in 2017 led to huge losses for us and the P&C industry, the following table shows the record ofOdysseyRe’s property book from 2000 to 2017 on an underwriting year basis (on this basis, losses are attributed to theyear when the insurance contract generating those losses was entered into, which may be the year prior to the yearwhen the loss was incurred):
NetUnderwriting Premiums Combined UnderwritingYear Earned Ratio Profit (Loss)
2000 113 68.1% 362001 284 104.2% (12)2002 440 79.7% 892003 539 72.9% 1462004 555 94.8% 292005 636 130.4% (193)2006 581 65.4% 2012007 597 77.3% 1352008 627 81.0% 1192009 638 81.6% 1172010 706 120.0% (141)2011 884 78.4% 1912012 1,140 66.5% 3822013 1,056 72.4% 2912014 970 70.0% 2912015 704 73.8% 1852016 683 92.8% 492017 468 137.1% (174)
Total 11,621 85.1% 1,741
In spite of September 11 in 2001, hurricanes in 2005, the Tokyo earthquake, Thai floods and New Zealandearthquakes in 2011, Super Storm Sandy in 2012 and the catastrophes of 2017, the cumulative combined ratio ofOdysseyRe’s property business over the last 18 years on an underwriting year basis was 85%. Catastrophes are theforemost risk that a P&C company faces and we take great care to monitor our exposures carefully.
As I mentioned in the section on ICICI Lombard earlier, we are very excited to welcome Kamesh Goyal and his morethan 240 employees at Digit to Fairfax. Kamesh built Bajaj Allianz from scratch to be the second largestnon-government-owned P&C company in India and then spent a total of 17 years at Allianz, the last five years inMunich operating at the highest levels. He is building a digital property and casualty insurance company in India,which was created in December 2016 and has begun actively selling policies. We are very excited about the prospectsof Digit.
We closed our acquisition of Allied World on July 6, 2017 and we welcomed Scott Carmilani and Allied World’s1,430 employees to the Fairfax family. As you know, Allied World is the largest acquisition that we have done and wepursued this acquisition because of Allied World’s outstanding track record over its 15 years of existence and thequality of its management team. We are very thankful to our financing partners OMERS ($1 billion), AIMCO($0.5 billion) and two others. We issued a total of 5.1 million shares for Allied World. The effect of this acquisition isshown in the table below, which was previously presented to you at our 2017 annual shareholders’ meeting:
($ billions) Fairfax Allied World Combined % Change
Gross premiums written 10.2 3.1 13.3 30%Investment portfolio 27.4 8.7 35.3(1) 29%Common shareholders’ equity 8.5 3.6 10.9(1) 28%Shares outstanding (millions) 23.1 28.2 22%Investments per share ($) 1,186 1,250 5%
(1) Combined numbers adjusted for financing and goodwill
6

As you can see, while this acquisition increased our gross premiums, investment portfolio and common equity byabout 30%, our shares outstanding grew by only 22%. Although we issued the Fairfax shares at a 6% premium tobook value while we purchased Allied World at a 32% premium to book value, we are confident that the high qualityof Allied World, let by Scott Carmilani, will make this an excellent acquisition for us, but we were not pleased atissuing our shares at only a 6% premium to book value.
The table below shows the shares we have issued and retired over our history:
Shares Shares SharesIssued Repurchased Outstanding Reason for Issue
(shares in millions)
1985 5.01986-90 2.3 1.8 5.5 Morden & Helwig1991-95 3.8 0.4 8.9 Hamblin Watsa/Ranger/Lombard1996-00 5.3 1.1 13.1 OdysseyRe/Sphere Drake/Crum & Forster/TIG2001-05 5.5 0.8 17.8 Financial soundness2006-10 4.3 1.6 20.5 Zenith/OdysseyRe minority2011-15 2.2 0.5 22.2 Brit2016 1.0 0.1 23.1 ICICI Lombard/Eurolife2017 5.1 0.4 27.8 Allied World
Total 29.5 6.7 27.8
Over our history, we have issued 29.5 million shares as we expanded Fairfax from net premiums written of$10 million to $10 billion (current run rate of $11.5 billion). During this period, we have also reduced our sharesoutstanding by 6.7 million, for a net increase of 22.8 million. As the table below shows, our shares outstanding havegrown by 5.6x while net premiums written, investments and common equity have increased by 1,000x or more.Henry Singleton, at Teledyne, reversed this trend, as you know, and over the next ten years we expect to do thesame – use our free cash flow to buy back our shares!
1985 2017
Net premiums written 10 9,984Net earnings (1) 1,741Investment portfolio 24 39,255Common shareholders’ equity 8 12,476Shares outstanding (millions) 5.0 27.8
We have now completed our acquisition of AIG’s insurance operations in Argentina, Chile, Colombia and Uruguay.In 2017, these Latin American operations had aggregate premiums of $580 million, an investment portfolio of$249 million and common equity of $145 million. In total, 980 employees have joined the Fairfax family and we givethem a warm welcome.
Our Latin American operations, excluding Brazil, report to Fabricio Campos. We have a very small office in Miamiwith Fabricio, Simon Bobbin (CFO) and Marcelo Milani (Chief Risk Officer) – and like it that way! We have strongcountry managers in Juan Luis Campos (Argentina), Fabiana De Nicolo (Chile), Marta Lucia Pava (Colombia) andMarcelo Lena (Uruguay). Latin America is very under-penetrated in insurance and has huge opportunity for usover time.
Our Colonnade Insurance subsidiary, run by Peter Csakvari, acquired AIG’s operations in Bulgaria, the CzechRepublic, Hungary, Poland, Romania and Slovakia. We have strong country managers in Venislav Yotov (Bulgariaand Romania), Dominik Stros (Czech Republic), Gabor Kovacs (Hungary), Pawel Holnicki-Szulc (Poland), Peter Cısar(Slovakia) and Svyatoslav Yaroshevych (Ukraine), all reporting to Peter Csakvari. We welcome the 229 employees ofthese Central and Eastern Europe operations to the Fairfax family.
Both Fabricio and Peter work closely with Bijan Khosrowshahi while Andy Barnard provides oversight, as he doeswith all of Fairfax’s insurance operations.
7

FAIRFAX FINANCIAL HOLDINGS LIMITED
I like to review all our annual reports before I begin writing the most recent one. I noticed this year that in 2011, Iwrote to you that the major risks for the economy would be felt in the next three years and after that, common stockswould do very well over the next decade – and it was unlikely that bonds would outperform stocks in the next decadeas they had in the past two decades, given that long term treasuries were yielding only 2.9% at the time!Unfortunately, we did not eliminate our index hedges after three years, since we continued to be concerned aboutthe economy, but that changed when the new U.S. administration got elected in 2016. We quickly eliminated ourindex hedges and have virtually eliminated our individual shorts also, and it is extremely unlikely that we will resortto shorting to protect our portfolios in the future. The new U.S. administration’s reduction in the corporate tax rateto 21%, accelerated depreciation for capital expenditures, roll back in regulation and potential massive infrastructurespending – combined with the fact that the U.S. has never had an eight year stretch of less than 2% real economicgrowth – could result in much higher economic growth in the next few years. Higher economic growth would result,we think, in higher profits for many companies, so that even though the indices may not go up significantly, wethink this will be a ‘‘stock pickers’’ market in which a value investor like us can thrive. So we are back to playingoffense again, recognizing of course that the stock market is not cheap. Long interest rates have bottomed out andwill likely go higher over the next five years, perhaps significantly higher.
We continue to be vigilant, though, about the many risks to global economic growth that prevail, includingprotectionism and a collapse in world trade, China unraveling and a significant blow up in the junk bond market,which is trading at record low spreads. To protect us against these risks, we continue to retain the $117 billionnotional amount in deflation swaps, which have 41⁄2 years to go and cannot cost us more (their carried value is only$40 million). We also have more than $17 billion in cash and short term securities in our insurance portfolios whichshould benefit from rising interest rates.
More on all of this in our section on investments.
In last year’s annual report, I documented the significant opportunity cost to our shareholders of our decision tohedge our common stocks. Another cost of our hedging, and why it is extremely unlikely that we will repeat this inthe future, is that it required us to sell some wonderful long term common stock holdings, as shown below:
IncreaseTotal Sale Realized Current from
Cost Proceeds Gain % Value Sale %
Johnson & Johnson 512 725 213 42% 1,071 346 48%US Bancorp 258 567 309 120% 859 292 52%Kraft 291 385 94 32% 805 420 109%Wells Fargo 388 795 407 105% 1,144 349 44%
Total 1,449 2,472 1,023 70% 3,879 1,407 57%
While we realized $1.0 billion on the sale of these long term common stock holdings, these compound growthmachines resulted in us leaving $1.4 billion on the table. A costly mistake we will try not to repeat!
Fairfax has benefitted greatly from its decentralized structure over its 32 years. It gives us a major competitive edge, asit empowers our Presidents to run their operations unfettered from head office and allows us at head office torespond quickly to risks and opportunities. Our North American insurance operations are run by Silvy Wright, BrianYoung, Marc Adee, Kari Van Gundy and Scott Carmilani; Brit is run by Matthew Wilson and Mark Cloutier; Advent isrun by Nigel Fitzgerald and William Beveridge; Fairfax Asia is run by Mr. Athappan; our Middle Eastern partnership,Gulf Insurance, is run by Khaled Al Hasan; our Latin American operations, excluding Brazil, which is run by BrunoCamargo, are under the supervision of Fabricio Campos; while Peter Csakvari runs our Central and Eastern Europeanoperations and Bryte is run by Edwyn O’Neill. We, of course, monitor all of these insurance operations and provideassistance as requested, essentially through Andy Barnard, supported by Peter Clarke, our Chief Risk Officer, andothers including Bijan Khosrowshahi, Jean Cloutier, Gobi Athappan, Ravi Prabhakar and Mark Cloutier, so that weare confident that we are on top of all of the insurance operations (we buttress this by advising all our Presidents thatwhen there is bad news, we want to hear it quickly).
This same decentralized structure applies to our non-insurance operations. Cara is run by Bill Gregson but itssubsidiaries, such as Keg Restaurants and St. Hubert, are run separately by their own Presidents; Thomas Cook is runby Madhavan Menon but its subsidiaries are run independently – Quess by Ajit Isaac and Sterling Holidays byRamesh Ramanathan; Fairfax’s Fairbridge subsidiary is run by Harsha Raghavan; and Fairfax Africa is run by MikeWilkerson and Neil Holzapfel. Our monitoring and assistance of these non-insurance operations is by ChandranRatnaswami as to the Indian operations, and otherwise by Paul Rivett; again, this and our instruction to give us badnews quickly makes us confident that we are on top of all of the non-insurance operations.
8

As you can see, this structure allows us to attract the best and brightest in all the countries where we operate, whileour fair and friendly culture binds us all together. So when you see Fairfax acquiring companies, rest assured thatthere is a proven President running the operations independently, with light monitoring by us.
In 1995, Chandran Ratnaswami joined us to build our international insurance and common stock investments,particularly in India. I said then, ‘‘this may be an acorn for a future oak tree.’’ Well what an oak tree Chandran hasdeveloped! We, with ICICI Bank, created the largest non-government-owned property and casualty insurancecompany in India from scratch, managed an Indian investment portfolio with outstanding results for over 20 years,created Fairbridge with Harsha Raghavan as Managing Director, acquired a 77% interest in Thomas Cook Indiawhich then acquired Quess and Sterling Resorts, and finally created Fairfax India which now has a market value of$2.5 billion. Chandran was intimately involved with all of these activities and serves on most of the Boards of ourIndian companies.
We now have approximately $5 billion(1) invested in India, employing a total of approximately 285,000 people, asshown in the table below:
MarketValue
% Cost of Market % (under Number ofCompany Ownership Investment Value Change management)(1) Employees CEO
Fairfax India 30.2 469 666 42% 2,207 Chandran RatnaswamiIIFL 26.6 277 908 228% 14,239 Nirmal JainNCML 89.5 174 179 3% 3,521 Sanjay KaulSanmar 300 334 11% 2,252 N. SankarBIAL. 48.0 586 608 4% 903 Hari MararFairchem 48.8 74 149 101% 1,336 Nahoosh Jariwala/Mahesh BabaniOther 423 430 2%
Thomas Cook 67.6 253 997 294% 1,474 6,686 Madhavan MenonQuess 49.0 47 1,292 2,650% 250,000 Ajit IsaacSterling Resorts 100.0 140 152 9% 2,479 Ramesh Ramanathan
Government Bonds 425 475 12% 475IIFL 8.9 65 303 364% 303 14,239 Nirmal JainICICI Lombard 9.9 99 549 453% 549 6,460 Bhargav DasguptaOther 299 327 10% 327
Total investments 1,610 3,317 106% 5,335
(1) Includes 100% of Fairfax India and Thomas Cook
Our first major acquisition in India was the purchase of a 77% interest (later reduced to 68%) in Thomas Cook Indialed by Madhavan Menon. Thomas Cook, first set up in India in 1881, is the leading integrated travel and travel-related financial services company in India, offering, through its about 6,700 employees, a broad spectrum of servicesthat include foreign exchange, corporate travel, leisure travel, insurance, visa and passport services and e-business.Through Thomas Cook India, we purchased Quess, founded and run by Ajit Isaac, and Sterling Resorts, run byRamesh Ramanathan. Thomas Cook India dominates the foreign exchange and high end travel business in India.Through the purchase of Kuoni’s Indian travel business, and last year, its international operations all over the world,Thomas Cook India is today one of the largest travel service provider networks headquartered in the Asia-Pacificregion. We welcome Asian Trails, Allied T Pro, Australian Tours Management, Desert Adventures, Travel CircleInternational and Private Safaris East & South Africa to the Fairfax family, which added to Thomas Cook India’sexisting Thomas Cook, SOTC, TCI and Sita brands.
Quess has had a phenomenal run since we acquired our interest in it in 2013. Thomas Cook India invested$47 million in Quess in 2013, sold 5.4% last year for $97 million and retains 49%, which is currently worth over$1 billion. Because of Quess’ great success, Thomas Cook India intends to spin its holding in Quess out to itsshareholders during 2018 so that Quess can be run independently as a public company under the leadership of AjitIsaac. A big thank you to Madhavan Menon for nurturing Quess under the Thomas Cook India umbrella as it becamelarge enough to be a freestanding company. Today, Quess is India’s leading integrated business services provider.With over 250,000 employees, the company has a pan-India presence with 65 offices across 34 cities, along with anoverseas footprint in North America, the Middle East and South East Asia. It serves over 1,700 customers across fivesegments – Industrials, Global Technology Solutions, People and Services, Integrated Facility Management andInternet Solutions.
9

FAIRFAX FINANCIAL HOLDINGS LIMITED
When Mr. Modi got elected in 2014, we thought, based on his outstanding track record in Gujarat, that India couldbe transformed by ‘‘an unabashedly business friendly government’’. We are even more excited about India’sprospects today than we were in 2014. Mr. Modi’s election led us to create Fairfax India, which has just completed itsthird year as a public company listed on the TSX. I must say, its success, under the leadership of ChandranRatnaswami, Harsha Raghavan and the team at Fairbridge, has far exceeded even our most optimistic expectations. Icannot fail to mention that Deepak Parekh, the Founder and Chairman of HDFC and now a director on the Board ofFairfax India, has been instrumental in Fairfax India’s success, as we have not done anything without hiswise counsel.
Fairfax India’s investments are shown in the table on page 9. Chandran’s letter to shareholders in Fairfax India’sannual report and the individual company websites give you a lot more information on each of Fairfax India’sinvestee companies. Please read that report for more details.
Suffice it to say, we have built a huge amount of intrinsic value in Fairfax India which is much in excess of its currentmarket value. When after-tax profits are growing at over 30%, as they have at IIFL and other companies in India, aP/E ratio of 20x drops quickly to 9x in three years. We are optimistic about all our investments in Fairfax India andexpect over the years to invest much more money in that country. We think the opportunity in India is unparalleled!Our investment in Fairfax India was $469 million, and its market value today is $753 million.
Also, every three years we are eligible for a performance fee from Fairfax India. In the three years endingDecember 31, 2017, from the IPO price of $10 per share, Fairfax India investors enjoyed a 15.5% gross annualcompound return and a net 13.5% return after payment of the performance fee, versus 5.9% for the US$ S&P BSESensex Index. As a result of this excellent performance, the performance fee for the three-year period to the end of2017 was $114 million, which we took, as required, in shares of Fairfax India, thereby increasing our ownership to33.6% from 30.2%. Much more to come from Fairfax India.
With Roger Lace, Brian Bradstreet and I having worked together for over 40 years, we felt it was time to begin thetransition to a younger group for the management of our investment portfolios, of course supervised by the three ofus. So Roger will pass the title of President of Hamblin Watsa to Wade Burton, while he becomes Chairman. Wade,currently Hamblin Watsa’s Chief Investment Officer, has been with us since 2009 and has achieved an outstandingreturn on the investment portfolio he has been managing (he should have been managing all of the portfolios!).Wade, Lawrence Chin and Quinn McLean (who is also responsible for the Middle East and Africa) will be responsiblefor running our North American portfolios, Jamie Lowry our U.K. and European portfolios, Yi Sang our SoutheastAsia and greater China portfolios, and Jeff Ware our Latin American portfolios. Peter Furlan is our Director ofResearch and Paul Ianni is Vice President and our exceptional analyst. Together we work as a team, and with ourinvestment decision-making now more dispersed than in the past but supervised by Roger, Brian and myself, I amreally excited about our potential returns under Wade’s leadership. Wade works closely with Paul Rivett and myself.
With $40 billion in investments, a current run rate of $11.5 billion in net premiums written and $12.5 billion incommon shareholders’ equity, we need an investment return of approximately 7% in order to achieve an annual15% increase in book value per share, assuming a consolidated combined ratio of 95% at our insurance operations.We have drilled deeper and by analyzing each of our consolidated insurance companies (a total of 21), we haveestimated the investment return needed for each company in order for us to achieve our 15% target. We havedelegated investment responsibility for each of our insurance companies to one member of our investment team.
In our restaurant businesses, we ended the year with a bang! After over four years of working together collaboratively,David Aisenstat from the Keg and Bill Gregson at Cara decided to merge their two businesses. Fairfax assisted with thetransaction by agreeing to contribute its 51% ownership of the Keg, primarily in return for shares of Cara. Thecombined businesses will have a network of 1,365 restaurants with total system sales in excess of Cdn$3.5 billion andEBITDA in excess of Cdn$200 million. Much like with the St. Hubert transaction, the Keg business will continue to berun independently from its head office in Vancouver and regional office in Toronto under the leadership of DavidAisenstat and his senior executive team, including Neil Maclean, Doug Smith and Jamie Henderson. David will alsoassist with the other premium brand restaurants in the Cara group. In the coming months, the publicly traded Carawill look to change its name and ticker symbol to reflect the changing nature of the business following the Kegtransaction. In 2017, Cara also purchased the Pickle Barrel restaurant group from a group led by its CEO, Peter Higley.Pickle Barrel had approximately Cdn$50 million in sales in 2017 from 12 restaurants as well as a 50% partnershipwith Rose Reisman in one of Canada’s premier catering businesses. Peter Higley will continue to run the companyand provide his expertise to the Cara group. The Cara team continues to watch for accretive acquisition
10

opportunities, but if none present themselves, they will focus on debt reduction and share buybacks with excess freecash flow.
Our partner, Mark McEwan, grew the sales in his business for the fifth straight year. Mark continues to grow hishighly-respected brand with the entrepreneurial, customer service focus we look for in each of our business partners.We are particularly excited about the growth of his high-end grocery and ready-made meal locations.
In addition to our restaurant businesses, our investment in the Davos craft spirit brands, in partnership with ourgood friend David Sokol and the management team led by Andrew Chrisomalis, continues to do exceptionally well.Davos’ brands include TYKU Sake, Aviation American Gin, Sombra Mezcal and Astral Tequila. Davos recentlypartnered with Ryan Reynolds (star of the blockbuster movie Deadpool) in Aviation American Gin.
Our partners at Sporting Life, David and Patti Russell, had a fantastic year with over Cdn$160 million in sales as theycontinued to roll their brand out across Canada. We love the winter here in Canada!
On the other side of the seasonal divide, our boys of summer, Chad McKinnon and Fred Lecoq, continued to exceedexpectations, with the Golf Town business now running profitably on approximately Cdn$250 million in sales in2017 following a somewhat difficult exit from bankruptcy last year (we bought Golf Town on its exit frombankruptcy). Chad and Fred and their team have also worked collaboratively with the team at Sporting Life on anumber of mutually beneficial projects.
Kitchen Stuff Plus continued its profitable, steady growth in Ontario. Our partner, Mark Halpern, is relentless oncosts but has also found ways to expand creatively and profitably. Meanwhile, Jackie Chiesa and her team at WilliamAshley have been focused on the build-out of their new one-of-a-kind retail location while continuing to benefitfrom the ongoing success of their iconic holiday warehouse sale.
Sean Smith, Alan Maresky, Mike Wallace, Michelle Cole and the entire team at Pethealth continue to grow theirbusiness, recently acquiring the pet portfolio from PC Financial. With Pethealth’s software solutions in over3,000 locations across the U.S. and Canada, the business continues to see substantial proprietary opportunitiesassisting pets and their owners with adoption, recovery and health insurance.
David Fortier, Ivan Schneeberg and John Young, our partners at Boat Rocker Media, continued to grow their businesswith several acquisitions, including Proper Television and Fremantle Media’s Kids and Family Entertainmentdivision. The company has grown from Cdn$90 million in production volume in 2015 to Cdn$130 million last yearand has been profitable since inception eleven years ago.
Rouge Media and our partners, Martin Poitras and his wife Alison Jacobs, continued their profitable expansion in theout-of-home media space across the U.S. and Canada while doubling sales in 2017. The Rouge team continues to seemany long-term organic growth and acquisition opportunities, particularly in certain U.S. niches.
Our partnership with Paul Desmarais III and his excellent team at Sagard Capital progressed well through 2017. TheBauer and Cascade brands are overseen by Ed Kinnaly and the Easton business by Tony Palma. Both businesses haverecovered nicely since we acquired them on their exit from bankruptcy and both revenue and earnings are outpacingexpectations.
Arbor Memorial, which we helped the Scanlan family take private in 2012, continues to do well. Brian Snowden andthe Scanlan family have proven to be great partners. Death care continues to be an excellent business in Canada.
FairVentures’ innovation efforts at Fairfax continued to progress well throughout 2017. As you will recall,FairVentures, led by Gerry McGuire, is focused on identifying innovations and technologies that may disrupt theFairfax group businesses. Gerry works closely with Dave Kruis and the Innovation Lab in Waterloo, Davidson Pattizand the many dedicated creative volunteers participating in the Fairfax Innovation Working Group as well as JDDolan and his accelerator group at LDR. This year we will be presenting the inaugural Presidents’ Innovation Awardto the team in the Fairfax group that has shown the most innovative achievement in the year (no easy task to choosea winner from over 31 submissions from over 10 companies across our group!).
John Chen has completed the transition of BlackBerry from a smartphone company to a software company withabout $1 billion in revenue and growing. BlackBerry’s reputation for security for mobile devices, its focus on anintegrated internet of things system and its very large patent portfolio stand it in good stead for the future. Its QNXplatform has had much success with building autonomous car systems for the major automobile companies, and itsRadar for the trucking industry continues to excel. In 2017, BlackBerry also benefitted from a $1 billion (about $2 pershare) arbitration award from Qualcomm. We continue to bet on John!
11

FAIRFAX FINANCIAL HOLDINGS LIMITED
Early in 2017, we listed another Fairfax company, Fairfax Africa, on the TSX. This was a result of our excellentexperience with Mike Wilkerson and Neil Holzapfel on taking the Afgri Group private in 2014. Mike and Neil hadfurther opportunities for investment in Africa and we enthusiastically adopted Paul Rivett’s proposal that the bestway to take advantage of those opportunities was to clone Fairfax India and create Fairfax Africa, a company focusedon investments in Africa. Neil, Trent Hudson and Jim Bisenius, based in Johannesburg, South Africa, have a heart forAfrica and, with Mike, fit our fair and friendly culture well. So we raised $500 million, of which we contributed$325 million, including our interest in Afgri Group. Fairfax Africa made two additional investments in 2017 – AtlasMara and Nova Pioneer. Richie Boucher of Bank of Ireland fame joined the Eurobank Board and has also joined theAtlas Mara Board. We are excited to have Richie as our partner, especially on anything to do with banks. Fairfax Africahas had a good start in 2017. Please read the company’s annual report for further details.
2018 should be the year for Greece as the government fulfills all its requirements to exit the ECB program. Also,Greece has at last accessed the bond market – once in August 2017 for A3 billion and more recently in February 2018for A3 billion of seven-year bonds with a yield to maturity of 3.5%. Greece is expected to have GDP growth of 2.6% in2017 and the unemployment rate has dropped from 28% to 21% currently. Greece attracted foreign directinvestment for the first time in a long time in 2017. Given how far the Greek economy has fallen (27%), it is likelythat Greece will recover strongly in the next four years. In fact, the Greek purchasing manager index has recentlybeen at record highs. The yield on ten-year Greek government bonds, which at the height of the Greek crisis reached35%, has recently dropped below 4%. With Greece having access to the bond market and strong economic growth,we expect our Greek investments to do very well (at last!). The table below shows our investments in Greece:
December 31, 2017
Cost Fair Value
Eurobank Ergasias 975.5 395.0Grivalia Properties (see more detail below) 396.3 568.6Mytilineos 15.9 31.5Praktiker and Other 32.7 34.5
1,420.4 1,029.6
Percent decline (28)%
Not shown in the table above is our investment in Eurolife led by Alex Sarrigeorgiou. As you know, Eurolife is one ofGreece’s leading life and non-life insurance companies, created by Eurobank in 2000. We bought our share of Eurolifein 2016 for $181 million, with Eurolife being 40% owned by us, 40% by OMERS and 20% by Eurobank. We expect tobuy out OMERS within the next two years, so Eurolife will become a Fairfax insurance subsidiary. Eurolife has earned$111 million (our share) since we acquired it, benefitting greatly from a Greek bond portfolio of about A1 billion. Thenon-life portfolio had a combined ratio less than 70% again in 2017. We are very excited to be partners with Alex andhis team at Eurolife as they build a very successful company in Greece.
In 2017, we raised our equity interest in Grivalia to 52.7% by buying 10.3% for $100 million when Eurobank decidedto divest its interest in Grivalia. It has been six years since we first met George Chryssikos, the outstanding CEO ofGrivalia. Through Wade Burton, we took our first position in Grivalia in 2011 at A5.77 per share. George hasnavigated the Greek economic crisis superbly by buying only the highest quality commercial buildings and shoppingcentres at huge discounts to replacement cost and unlevered returns of 8% to 10%, not using excessive leverage andalways focusing on the long term. We are very excited to be partners with George and his team as they build afantastic real estate company. Like Bill McMorrow at Kennedy Wilson, George has a unique nose for value in realestate! And like all our Fairfax companies, he is building a fine company, focused on its customers, looking after itsemployees, making a return for shareholders and gratefully reinvesting in the communities where it operates.Business is a good thing!!
12

As this may well be Greece’s year, we think Eurobank will benefit greatly as its non-performing loans dropsignificantly and margins begin to increase again. Eurobank has been superbly run by Fokion Karavias as he alsonavigated an economy undergoing a depression. Eurobank is well financed and we expect it to pass the stress tests allGreek banks will go through this spring. At 74 Euro cents, with a book value of A2.64 per share, we consider Eurobankto be one of the cheaper stocks in the world! Let’s see what happens this year!
Finally in Greece, Praktiker and Mytilineos also continue to do well.
Below we update the table on our intrinsic value and stock price. As discussed in previous annual reports, we use bookvalue as a first measure of intrinsic value.
INTRINSIC VALUE STOCK PRICE% Change in % Change in
US$ Book Value per Share Cdn$ Price per Share
1986 +180 +2921987 +48 �31988 +31 +211989 +27 +251990 +41 �411991 +24 +931992 +1 +181993 +42 +1451994 +18 +91995 +25 +461996 +63 +1961997 +36 +101998 +30 +691999 +38 �552000 �5 �72001 �21 �282002 +7 �262003 +31 +872004 �1 �112005 �16 �172006 +9 +382007 +53 +242008 +21 +362009 +33 +52010 +2 –2011 �3 +72012 +4 �182013 �10 +182014 +16 +442015 +2 +82016 �9 �12017 +22 +31985-2017 (compound annual growth) +19.5 +18.1
The table shows the change in book value in U.S. dollars and our stock price in Canadian dollars. As I have saidbefore, we think our intrinsic value far exceeds our book value. As shown in the table, there have been many yearswhen our stock price has gone up significantly as that intrinsic value is recognized in the marketplace. We are focusedon performing to make that happen again!
13

FAIRFAX FINANCIAL HOLDINGS LIMITED
Insurance and Reinsurance Operations
The table below shows the recent combined ratios and the 2017 change in net premiums written of our insuranceand reinsurance operations:
Change in NetPremiums
Combined Ratio Written
2017 2016 2015 2017
Northbridge 99.1% 94.9% 91.8% 13.0%(1)
OdysseyRe 97.4% 88.7% 84.7% 18.8%Crum & Forster 99.8% 98.2% 97.7% 3.5%Zenith 85.6% 79.7% 82.5% 2.2%Brit 113.1% 97.9% 94.9%(2) 3.4%Allied World 157.0%(3) – – –Fairfax Asia 88.4% 86.4% 87.9% (6.2)%(4)
Other Insurance and Reinsurance 110.2% 93.7% 89.6% 4.9%(5)
Consolidated 106.6% 92.5% 89.9% 8.3%(6)
(1) An increase of 10.7% in Canadian dollars
(2) For the period since its acquisition on June 5, 2015
(3) For the period since its acquisition on July 6, 2017
(4) Excluding AMAG and Fairfirst
(5) Excluding Bryte, Fairfax Latin America (other than Fairfax Brasil) and operations acquired by Colonnade in 2017
(6) Insurance and reinsurance operations, excluding Allied World and the acquisitions described in footnotes (4) and (5)
Northbridge continued to strengthen its position in the Canadian marketplace. A flurry of large loss activityadversely affected results at its Federated subsidiary, generating an unfavorable 117% combined ratio. ForNorthbridge as whole, Silvy Wright and her team produced a combined ratio of 99.1% – 96.0% excluding Federated.As has consistently been the case, Northbridge’s conservative reserving practices benefitted our calendar year resultsonce again. Premiums grew over 10%, and the various brand and distribution initiatives undertaken over the lastseveral years are expected to bear fruit in the years ahead.
At OdysseyRe, Brian Young and his colleagues distinguished themselves in 2017 by posting a combined ratio of97.4% despite the historic level of catastrophe losses. Compared with others in the market, this stands out as aremarkable accomplishment and speaks to the singular underwriting discipline and portfolio management skillspresent at Odyssey. Also worth noting, Odyssey’s specialist insurance arm, Hudson Insurance, posted a 91.8%combined ratio and surpassed the billion dollar mark in gross premiums written in 2017. Great credit goes to ChrisGallagher, CEO of Hudson, and the terrific team he has assembled over the years!
Crum and Forster’s results were largely stable. Its combined ratio of 99.8% reflected approximately one point ofcatastrophe activity from the major windstorms. Results were very favorable in the excess and surplus lines division,which includes business from the prior acquisitions of First Mercury and American Safety. The transportationdivision, under Joe DeVito, continued to ramp up. Under the leadership of Marc Adee, Crum and Forster continues todevelop its middle market specialty lines footprint in the United States, and we think its future is bright.
Guided by the strong leadership of Kari Van Gundy, Zenith outshone all of our companies in 2017 by producing anunderwriting profit of $117 million and a combined ratio of 85.6%. Since our purchase of Zenith in 2010, it has gonefrom producing our worst combined ratio to our best. Throughout that period, Kari and her predecessors, Jack Millerand Stanley Zax, have maintained an unwavering commitment to professional excellence. Aside from thesuperlative results being generated within Zenith, its unparalleled expertise in the workers’ compensation field hasbeen a boon elsewhere in Fairfax, as our companies have been adept at leveraging the Zenith capabilities to improvetheir own results.
14

Brit’s results were negatively impacted by the spate of catastrophes in 2017, as both its insurance and reinsurancedivisions were hit hard. Its combined ratio of 113.1% included over 16 points related to the storms, earthquakes andwildfires. Brit’s underlying business remains sound, and the underwriting culture guided by CEO Matthew Wilson iswell-positioned to capitalize as opportunities emerge from the ever-changing markets. Special mention should be madeof CFO Mark Allan, who has overseen a variety of innovative initiatives designed to improve Brit’s financial flexibility.
Allied World became part of the Fairfax group in 2017, and it sure entered with a bang! As a prominent writer ofcatastrophe risk, Allied World was not spared the worst of the losses in the second half of the year. At Fairfax, we wereunfortunately deprived of Allied World’s favorable results from the first half of the year. Hence, for the six monthsAllied World’s results are included in Fairfax, its combined ratio was an unpleasant 157%. As we turn the page into 2018and beyond, we expect big things from Allied World, carrying on the consistent excellence of every one of the15 pre-2017 years since it began. Scott Carmilani and his team are savvy operators, and they give us a prominentpresence in markets in which we have heretofore had a limited presence.
From Singapore, Mr. Athappan had another excellent year for Fairfax Asia with an 88.4% combined ratio. First Capitalwas, of course, the star performer and we will miss its performance in the future. Fairfax Asia, excluding First Capital,had a combined ratio of 99.2% with gross premiums written of $333 million.
In South Africa, Bryte Insurance had its first full year as a Fairfax company, generating gross premiums written of$349 million and a combined ratio of 101.2%. Local catastrophe losses pushed Bryte’s combined ratio into the red in2017. We expect Edwyn O’Neill and his strong team to deliver an underwriting profit for us in 2018.
Bruno Camargo of Fairfax Brasil brought his combined ratio in at 98.3%, despite ongoing market challenges. In fact,Fairfax Brasil was one of the few companies operating in the Brazilian market to produce an underwriting profit in2017.
In London, Advent had a difficult year. Its combined ratio of 126.3% yielded an underwriting loss of $49 million.Catastrophe losses were the primary culprit, though adverse results in the marine and accident and health divisionscontributed to the red ink. Nigel Fitzgerald and William Beveridge, our leaders at Advent, are hard at work rightingthe ship!
Our partnership in Gulf Insurance, which operates in 11 countries in the Middle East, is going very well. Although itsresults slipped a bit, we were pleased to see that it still produced an underwriting profit at a 99.8% combined ratio.Bijan Khosrowshahi continues to do an excellent job working with Khaled Al Hasan, Gulf’s excellent CEO. As I havesaid previously, Faisal Al-Ayyar, from Kipco, has been an outstanding partner for us.
15

FAIRFAX FINANCIAL HOLDINGS LIMITED
The table below shows you our international operations at December 31, 2017:
Fairfax Share
Gross GrossPremiums Shareholders’ Investment Fairfax Premiums Shareholders’
Written Equity Portfolio Ownership Written Equity
ConsolidatedFairfax Latam(1) 580 145 249 100% 580 145Advent (Lloyd’s) 271 130 468 100% 271 130Bryte Insurance (South Africa) 349 150 234 100% 349 150Fairfax Brasil 148 64 159 100% 148 64Colonnade (Central and Eastern
Europe) 126 67 104 100% 126 67Pacific Insurance (Malaysia) 122 109 152 85% 104 93AMAG (Indonesia) 112 234 128 80% 90 187Polish Re 65 96 229 100% 65 96Falcon Insurance (Hong Kong) 63 73 134 100% 63 73Fairfirst Insurance (Sri Lanka) 66 35 40 78% 51 27
1,902 1,103 1,897 1,847 1,032
Non-consolidatedGulf Insurance (Middle East) 1,005 280 780 41% 416 116Eurolife (Greece) 546 782 3,264 43% 236 338Alltrust Insurance (China) 962 387 959 15% 144 58BIC (Vietnam)(2) 83 93 143 35% 29 33Falcon Insurance (Thailand) 52 17 33 41% 21 7
2,648 1,559 5,179 846 552
Total InternationalOperations 4,550 2,662 7,076 2,693 1,584
(1) Full year 2017 premium (the component operations basically joined at different times during 2017)
(2) As at and for the 12 months ended September 30, 2017
All of our major companies are well capitalized, as shown in the table below:
As at and for the Year EndedDecember 31, 2017
Net PremiumsNet Premiums Statutory Written/Statutory
Written Surplus Surplus
Northbridge Cdn 1,381.0 Cdn 1,442.2 1.0xOdysseyRe 2,495.9 4,067.7(1) 0.6xCrum & Forster 1,863.4 1,302.3 1.4xZenith 837.4 571.7 1.5xBrit 1,530.9 1,130.3 1.4xAllied World 2,238.8(2) 2,523.8(3) 0.9xFairfax Asia 201.3(4) 478.5(5) 0.4x
(1) IFRS total equity
(2) Net premiums written is for full year 2017
(3) US GAAP equity
(4) Net premiums written excludes First Capital
(5) IFRS equity, excluding certain holding company investments
16

On average we are writing at about 0.8 times net premiums written to surplus. In the hard markets of 2002 – 2005 wewrote, on average, at 1.5 times. We have significant unused capacity currently and our strategy during the times of softpricing is to be patient and stand ready for the hard markets to come.
The combined ratios of our companies which we have owned since 2008 are shown in the table below:
2008 – 2017
Cumulative Net AveragePremiums Written Combined Ratio
($ billions)
Northbridge Cdn 11.2 100.2%OdysseyRe 21.7 93.8%Crum & Forster 12.6 103.4%Zenith(1) 5.4 96.2%Fairfax Asia 2.3 82.9%
Total 53.2 97.2%
(1) Since acquisition on May 20, 2010
Since we began, we have written over $100 billion in net premiums, with a combined ratio of approximately 100%.
The table below shows the average annual reserve redundancies for the past ten years (business written from 2007onwards) for our companies which we have owned since 2007:
2007 – 2016Average Annual
ReserveRedundancies
Northbridge 14.7%OdysseyRe 12.8%Crum & Forster 0%Zenith(1) 11.9%Fairfax Asia 15.4%
(1) Since acquisition on May 20, 2010
The table shows you how our reserves have developed for the ten accident years prior to 2017. We are very pleased withthis reserving record, but given the inherent uncertainty in setting reserves in the property casualty business, wecontinue to be focused on being conservative in our reserving process. More on our reserves in the MD&A and theAnnual Financial Supplement for the year ended December 31, 2017 available on our website www.fairfax.ca.
Our run-off operations under the leadership of Nick Bentley continued to be busy in 2017, looking at over fifteenacquisition opportunities but completing only the one which met its standards. Nick and his team continue toexhibit a disciplined approach on the acquisition front, an approach which is validated by the success of their pastrun-off acquisitions. Run-off had an operating loss of $185 million in 2017, reflecting development on asbestos reservesfrom our legacy business and depressed investment income as a result of the low interest rate environment. Late in2017, run-off made the final payment of $125 million in regard to the purchase consideration associated with theacquisition of TRG (our original run-off management team) in 2002. As we have said before, we strongly believe thatRiverStone was one of the best acquisitions we have made.
17

FAIRFAX FINANCIAL HOLDINGS LIMITED
We have updated the float table that we show you each year for our insurance and reinsurance companies:
AverageCost Long Term
Underwriting Average (Benefit) Canada TreasuryYear Profit Float of Float Bond Yield
1986 3 22 (11.6)% 9.6%2008 (281) 8,918 3.1% 4.1%2017 (642) 16,978 3.8% 2.3%
Weighted average last ten years (0.5)% 2.9%Fairfax weighted average financing differential last
ten years: 3.4%
Float is essentially the sum of loss reserves, including loss adjustment expense reserves, and unearned premiumreserves, less accounts receivable, reinsurance recoverables and deferred premium acquisition costs. Our long term goalis to increase the float at no cost, by achieving combined ratios consistently at or below 100%. This, combined with ourability to invest the float well, is why we feel we can achieve our long term objective of compounding book value pershare by 15% per annum. In 2017, our cost of float was 3.8% versus only 2.3% for the long term Canadian bond yield.In the last ten years, our float has cost us nothing (in fact, it provided a 0.5% benefit per year) – significantly less thanthe average 2.9% that it cost the Government of Canada to borrow for ten years.
The table below shows you the breakdown of our year-end float for the past five years:
TotalInsurance and Reinsurance
InsuranceCrum & Zenith Allied Fairfax and
Year Northbridge OdysseyRe Forster National Brit World Asia Other Reinsurance Run-off Total($ billions)
2013 2.1 4.7 2.3 1.2 – – 0.5 1.0 11.8 3.7 15.62014 1.9 4.5 2.6 1.2 – – 0.5 0.9 11.6 3.5 15.12015 1.6 4.2 2.6 1.2 2.7 – 0.6 0.8 13.7 3.4 17.12016 1.7 4.0 2.7 1.2 2.8 – 0.6 0.8 13.8 2.9 16.72017 1.8 4.4 2.9 1.2 3.1 5.4 0.2 1.2 20.2 2.5 22.7
In the past five years our float has increased by 46%, due partly to organic growth in net premiums written at Crum &Forster, Zenith and Fairfax Asia, but due principally to the acquisition of Brit and Allied World.
Of course, our float and float per share have grown tremendously since we began in 1985, as the table below shows. Thishas been one of the key reasons for our success in the past and will continue to be a key reason in the future.
Total Float Float per Share
1985 13 $2 1⁄21990 164 301995 653 742000 5,877 4492005 8,757 4922010 13,110 6412016 16,673 7222017 22,730 819
Our float increased to $819 per share, a 13% increase from 2016.
18

The table below shows the sources of our net earnings. This table, like various others in this letter, is set out in aformat which we have consistently used and we believe assists you in understanding Fairfax.
2017 2016
Underwriting – insurance and reinsuranceNorthbridge 9.0 46.3OdysseyRe 60.0 235.2Crum & Forster 3.2 32.4Zenith 117.2 164.1Brit (201.9) 29.1Allied World (586.6) –Fairfax Asia 38.2 41.1Other (80.6) 27.7
Underwriting profit (loss) (641.5) 575.9Interest and dividends – insurance and reinsurance 425.8 463.3
Operating income (loss) (215.7) 1,039.2Run-off (excluding net gains (losses) on investments) (184.6) (149.4)Non-insurance operations 212.1 133.5Interest expense (331.2) (242.8)Corporate overhead and other 56.5 (131.2)
Pre-tax income (loss) before net gains (losses) on investments (462.9) 649.3Net realized gains (losses) on investments 1,742.0 (2,071.4)
Pre-tax income (loss) including net realized gains (losses) on investments 1,279.1 (1,422.1)Net change in unrealized gains (losses) on investments 744.1 867.8
Pre-tax income (loss) 2,023.2 (554.3)Income taxes and non-controlling interests (282.6) 41.8
Net earnings (loss) 1,740.6 (512.5)
The table shows the results from our insurance and reinsurance (underwriting and interest and dividends), run-offand non-insurance operations (which shows the pre-tax income (loss) before interest). Net realized gains (losses) andnet change in unrealized gains (losses) are shown separately to help you understand the composition of our earnings.In 2017, after interest and dividend income, our insurance and reinsurance companies had an operating loss of$215.7 million because of the catastrophes discussed earlier. Excluding unrealized gains, our pre-tax income was$1.3 billion. All in, after-tax income was $1.74 billion. (See more detail in the MD&A.)
19

FAIRFAX FINANCIAL HOLDINGS LIMITED
Financial Position
ExcludingNon-Insurance
Consolidated Company Debt2017 2017
Holding company cash and investments (net of short sale and derivativeobligations) 2,356.9 2,356.9
Borrowings – holding company 3,475.1 3,475.1Borrowings – insurance and reinsurance companies 1,373.0 1,373.0Borrowings – non-insurance companies 1,566.0 –
Total debt 6,414.1 4,848.1
Net debt 4,057.2 2,491.2
Common shareholders’ equity 12,475.6 12,475.6Preferred stock 1,335.5 1,335.5Non-controlling interests 4,600.9 1,725.9(1)
Total equity 18,412.0 15,537.0
Net debt/total equity 22.0% 16.0%Net debt/net total capital 18.1% 13.8%Total debt/total capital 25.8% 23.8%Interest coverage 7.1x 8.0xInterest and preferred share dividend distribution coverage 6.0x 6.5x
(1) Excludes non-insurance minority interests
When we have a controlling interest in a company (for example, Cara or Thomas Cook India), we are required toconsolidate that company’s financial statements into our own financial statements even though we do not guaranteethe debt – and quite often it is an investment in a public company. From this year onwards, we will show you ourfinancial position both on a consolidated basis as well as excluding the debt of non-insurance companies that we donot own 100%. Excluding non-insurance company debt, our debt/capital ratios are excellent and for 2017, we hadinterest and fixed charge coverage of 8.0x and 6.5x respectively.
Excluding hedging losses, which we are quite confident will not be repeated, our interest and fixed charge coveragein the last five years was 7.1x and 5.4x respectively.
We have a very strong financial position, with $2.4 billion in cash and marketable securities at the end of 2017 andvery limited debt maturities in the next three years as we continue to refinance near-term maturities. In addition,during 2017 we increased our unused four-year bank lines to $2 billion from $1 billion, while improving thecovenants. Our financial position is rock solid, much better than our ratings would suggest!
Investments
The table below shows the time-weighted compound annual returns (excluding equity hedging) achieved byHamblin Watsa, Fairfax’s wholly-owned investment manager, on the stocks and bonds of our companies managed byit during the past 15 years, compared to the benchmark index in each case:
5 Years 10 Years 15 Years
Common stocks 7.2% 4.2% 10.9%S&P 500 15.8% 8.5% 9.9%
Taxable bonds 4.2% 9.0% 9.6%Merrill Lynch U.S. corporate (1-10 year) bond index 2.8% 4.8% 4.7%
The table shows that our common equity results have been poor, particularly during the past five years! We areworking on changing that soon. Our bond results continue to be outstanding.
20

The last five years have favoured momentum investing and growth stocks. Value investing has underperformed inthe last five years but its time will come again. In fact, during the 1999-2001 period when the S&P 500 dropped 40%,Fairfax’s stock portfolio went up 100%. Don’t give up on us yet!
We think economic growth under the new U.S. administration will be robust due to the reduction in the corporatetax rate to 21%, the rollback in regulation and potential infrastructure spending. These policy changes, combinedwith the fact that the U.S. has never had an eight year stretch of economic growth less than 2%, potentially providesa long runway for above average economic growth. Animal spirits are alive and well in the U.S. as economicoptimism by small business has never been higher. When President Reagan dropped taxes (corporate and personal)in 1981, economic growth in the following four years was 4% per year – and this may well be repeated in the next fewyears! Earnings for the S&P 500 index are forecasted to be about 150 in 2018 or a price earnings ratio of 18x at currentlevels. If economic growth is robust, these price earnings ratios could prevail for some time as they did in the 1960s.In this environment, a ‘‘stock pickers’’ market, we are playing offense even though we recognize the stock market isnot cheap. Of course, it may not be as expensive as the Shiller CAPE Price Earnings Ratio suggests, because a priceearnings ratio based on ten-year average earnings may not be appropriate when earnings are increasingsignificantly – as they are currently.
Here is a listing of the debt and warrants that we have acquired over the past 18 months:
Debt and warrant deals
Warrant Warrant Current PotentialCompany Principal Coupon Maturity Strike Price Stock Price Ownership
(local currency)
Seaspan 250 5.5% Feb-2025 6.50 5.87 22.4%Chorus Aviation 155 6.0% Dec-2024 8.25 8.09 16.2%AGT Foods 148 5.4% Aug-2024 33.25 15.61 19.1%Mosaic Capital 116 5.7% Jan-2024 8.81 6.50 61.7%Altius Minerals 78 5.0% Dec-2024 15.00 13.42 13.4%Westaim 39 5.0% Dec-2024 3.50 2.95 8.2%
786 5.5%
We have invested approximately $800 million with an average yield of 5.5% in these debt and warrant deals. We willget an annual income of $43 million while we wait for the warrants to become valuable over time. We expect to domany more of these deals in the U.S. and Canada with companies that have great long term track records and whowould like to have a supportive, friendly long term shareholder.
In this connection, you will have noticed that with the unanimous approval of our board of directors, we invested$50 million in a global small and mid-cap fund with a long term value orientation managed by my son, Ben. Thefund has had excellent results over the six years since it began, and the small and mid-cap area where the fund investsis quite different from the areas where we invest. We invested in that fund to get access to these excellent returns, butalso to potentially do debt and warrant deals with some of the fund’s investee companies.
Late in 2017, we had the good fortune to be a partner with David Sokol and Dennis Washington, two outstandingbusinessmen with great track records, by investing in Seaspan. Dennis is the largest shareholder of Seaspan whileDavid became its Executive Chairman in July 2017. David has one of the most outstanding records I have comeacross, as he built Mid American Energy from revenue of $116 million in 1991 to revenue of $11 billion in 2010,while net income increased from $27 million to $1.2 billion over the same period, representing a compound growthrate of 22.4% per year.
Seaspan is the world’s largest independent owner of container ships, managing a fleet of 110 container shipsrepresenting a total capacity of approximately 900,000 TEUs (twenty foot equivalent unit cargo containers) and witha current operating fleet of 89 vessels with an average age of approximately six years and an average remaining leaseperiod of approximately five years. Lease rates for container ships appear to have bottomed out and have increasedsignificantly recently. We have invested $250 million in a seven-year debenture with a coupon of 5.5% with warrantsexercisable at $6.50 per share, for a potential ownership position of 22.4%.
A couple of years ago, Paul Rivett came across a great Canadian entrepreneur, Murad Al-Katib from Regina,Saskatchewan. Murad, whose parents immigrated to Canada from Turkey, had the bright idea that the prairie
21

FAIRFAX FINANCIAL HOLDINGS LIMITED
provinces could grow pulses (peas, lentils and beans) as a rotation crop instead of wheat. He began Saskcan PulseTrading in 2001 and developed the market, one farm at a time. AGT was formed in 2007 through the merger ofSaskcan with Arbel (a Turkish-based food ingredients company controlled by the Arslan family)(http://www.agtfoods.com/about-agt/history.html). Huseyin Arslan joined the board of AGT as its Executive Chairman,overseeing global operations while Murad continued to oversee the head office based in Regina. Together Murad andHuseyin control 19% of the company. Today, AGT is the global leader in the procurement and distribution of pulseswith over Cdn$2 billion in revenue from over 120 countries and Cdn$100 million in EBITDA. Over the last few yearsthe company has spent significantly on capex, acquiring and building over 40 facilities on five continents as well asexpanding rail and port facilities necessary to ensure product delivery. Without any further growth capex, we believethat the company will generate between Cdn$75-100 million annually in free cash flow (Cdn$3-4 per share). There istremendous overlap between the AGT global operations and Fairfax’s existing agricultural investments in Canada,India, the Ukraine and South Africa. We believe that our investment in AGT could be the first step towards building aglobal agricultural platform with our existing partners. We have invested $148 million in a debenture with a couponof 5.375% with warrants exercisable at Cdn$33.25 per share, for a potential ownership of 19.1%
We also invested in Westaim, a TSX-listed investment holding company run by Cameron MacDonald that controlstwo businesses, a U.S. property and casualty insurer called Houston International Insurance Group and aU.S. commercial mortgage and debt origination investment manager called Arena Investors. At the time of ourinvestment, Westaim’s stock was trading at a slight discount to book value. The deal is structured on a similar basis toour recent transactions with Chorus, Mosaic and Altius (secured debt and warrants). Westaim has issued 5% debt tous, secured by its shares of Houston International and Arena, along with warrants exercisable at Cdn$3.50 per share.Fairfax has also agreed to invest up to $500 million in commercial mortgages and secured debt investments sourcedby Arena, at Fairfax’s discretion on a case by case basis.
An update on one of the best banks we have ever invested in, the CIB Bank of Egypt. It has an outstanding trackrecord and has been run by Hisham Ezz Al-Arab since 2002 and Hussein Abaza (CEO since March 2017). Since 2002,earnings per share for CIB Bank have compounded by 23% annually and book value per share by 19.4% annually.Egypt has only 3 million bank accounts despite a population of 92 million people – an unlimited growth opportunityfor CIB Bank.
We acquired the bulk of our 7.3% stake in CIB in May 2014 for a total cost of $330 million. Since then, in localcurrency, the book value per share has gone up 115%, while the stock price is up 183%. CIB today sells at 10xearnings. Unfortunately, in November 2016, the Egyptian pound was allowed to float and depreciated 50% veryquickly. In dollar terms, our investment is valued at $392 million today, only 19% higher than our cost. You may findit interesting to know that HDFC, the premier financial services company in India and perhaps in the world, had acompound growth in stock price of 29% in rupee terms over the last 27 years. Even though the rupee depreciated by70% during this time period, HDFC’s share price compounded at 24% in U.S. dollars. So over the long term, exchangerates are not that important when you invest in growth companies!
Can I finish this section on investments without making a comment on Bitcoin and cryptocurrencies? I am alwaysamazed at how rank speculation comes into markets once every decade or so! Reminds me of the outstanding book‘‘Extraordinary Popular Delusions and the Madness of Crowds’’. Bitcoin, a digital currency operating independentlyof central banks that uses blockchain technology to regulate the creation of new coins, went from $500 in 2015 to$19,000 in 2017 – that’s a parabolic curve if you have ever seen one! And it currently trades at under $10,000. It hasno assets, no revenue and no profit. Madness of crowds all right! Will any of us be surprised to see this go back to$500 – down 97% from the top!! Having said that, I must say I felt the same about Amazon in 1999. It did fall 92%from the top but has had huge success in the last ten years. Perhaps Bitcoin and the blockchain technology willexperience the same result – you have to survive the first 92% drop of course!!
With more robust economic growth, it is very likely that inflation and long treasury bond rates have bottomed andcould be heading upwards: they have started to do so already. We have no net long term bonds (the interest rates onany we have are hedged), and we have over $17 billion (50% of our insurance portfolios) in cash and short terminvestments which should benefit from higher rates.
There are many risks in the world today as there will always be, like a collapse in world trade, problems in China or asignificant blow-up in the junk bond market. As we have said earlier, to protect us against these risks, we continue toretain the $117 billion notional amount in deflation swaps, which have 41⁄2 years to go and cannot cost us more(their carried value is only $40 million).
22

In 2017 we benefitted significantly by the removal of our hedges. Excluding the gain on the sale of ICICI Lombardand First Capital, we had net gains on our equity and equity-related holdings of $649 million. We had net gains onour long equity exposure of $1.1 billion offset by net losses on our remaining individual short positions of$418 million (now behind us). During 2017 we realized net gains of $201 million on our long equity exposures,primarily from the sale of our remaining holdings in Bank of Ireland, a partial sale of IIFL Holdings to Fairfax Indiaand the sale of Tembec.
Also, when you review our financial statements, please remember that generally when we own more than 20% of acompany, we equity account (and call them associates), and when we own above 50%, we consolidate, so that markto market gains in these companies are not reflected in our results. Let me mention some of those gains.
As you can see in note 6 to our consolidated financial statements, the fair value of our investment in associates(excluding investments in associates held by Fairfax India and Fairfax Africa) is $2,824 million while its carryingvalue is $2,487 million, representing an unrealized gain of $337 million which is not on our balance sheet.
Also, we own significant positions in Cara, Grivalia, Thomas Cook, Fairfax India and Fairfax Africa which areconsolidated in our statements. The unrealized gain on these positions, based on market values at December 31,2017, is $896 million. This brings the total unrealized gain not reflected on our balance sheet to $1,233 million.
Our common stock portfolio, which reflects our long term value-oriented investment philosophy, is broken down bycountry as follows (at market value at year-end):
Canada 1,060.7United States 2,078.2Other 3,137.0
Total 6,275.9
We continue to like the long term prospects of our common stock holdings, which include names like GeneralMotors, General Electric and US Gypsum, all of which should benefit from robust economic growth in the U.S. andare currently very reasonably priced.
Miscellaneous
Our dividend remained the same in 2017 in spite of record earnings. We are focused on using our free cash flow tobuy back stock so it is unlikely our dividend will be increased soon. Since we began paying dividends, we have paidcumulative dividends per share of $103.
Our ‘‘fair and friendly’’ corporate culture is being recognized worldwide as executives and companies, insurance andnon-insurance, want to join our company. Our culture is now our biggest strength – and one we guard fiercely. Thisprinciple of treating people in a ‘‘fair and friendly’’ way is firmly embedded in our culture and backed by our GuidingPrinciples (included as an Appendix to this annual report, as always). I am really excited about our small holdingcompany team who with great integrity, team spirit and no egos keep the whole company going forward, protectingus from unexpected downside risks and taking advantage of opportunities when they arise. This team is led by ourPresident, Paul Rivett. As I said last year, there is no one more hard working than Paul or who represents our cultureso well, and he is a delight to work with! Paul leads our efforts in all areas but particularly the non-insuranceacquisitions we have made. He, of course, is backed by a fantastic team of officers whom I again want to thank onyour behalf. They are David Bonham, Peter Clarke, Jean Cloutier, Vinodh Loganadhan, Brad Martin, Rick Salsberg,Ronald Schokking and John Varnell. The glue that keeps our company together is trust and a long term focus. Fromour Board of Directors through our officers and all our employees, you can count on them to do the right thing,always taking the long term view. Our Presidents, officers and investment principals are ultimately the strength ofour company and the reason I am so excited about our future.
As our 32nd year comes to an end, I want to particularly thank Rick Salsberg, who has been with me from day one in1985 when this incredible journey began. As I have said many times over, Rick is our ‘‘consigliere’’ and we have nevermade any significant decision without his approval. He represents the heart and soul of our company and we are verygrateful that he has not retired. Our future is bright with Rick!
23

FAIRFAX FINANCIAL HOLDINGS LIMITED
As you all know, my multiple voting shares prevent our company from being taken over – now and after I pass awaybecause these shares will never be sold. This allows our company to be built over the next 100 years with the sameculture that has prevailed over the past 32 years. To help retain our culture, long after I have gone, we nominated myson Ben to the Board of Directors in April 2015. This year, as you will note in the management proxy circular, we havenominated my daughter Christine McLean to join our Board for the very same reason. Christine is the Director ofResearch at Sprucegrove, a money management firm in Toronto managing $20 billion, and she has been in theinvestment business for 13 years. With our Board of Directors, including Ben and Christine, I feel confident that ourculture will stand the test of time.
Goodwill and intangibles (G&I) increased significantly last year to $6.1 billion from $3.8 billion in 2016. Of the$6.1 billion in G&I in 2017, $3.8 billion comes from our insurance companies ($1.7 billion being added in 2017 fromAllied World). This is ‘‘good’’ goodwill as our companies have all demonstrated their ability to consistently generateunderwriting profits (excluding huge hurricanes!). The remaining $2.3 billion in G&I comes from our consolidatednon-insurance operations. We consider all of this G&I to be ‘‘good’’, but while the goodwill portion comprises onlyour share of the goodwill, a significant portion of these intangibles are not ours as we do not own 100% of thesecompanies (for example, we only own 40% of Cara and 68% of Thomas Cook India). While we are comfortable withthe goodwill on our balance sheet, we thought we would highlight these points for you.
We continue to encourage all our employees to be owners of our company through our employee share ownershipplan, under which our employees’ share purchases by way of payroll deduction are supplemented by contributionsby their employer. It is an excellent plan and employees have had great returns over the long term, as shown below:
Compound Annual Return
Since5 Years 10 Years 15 Years 20 Years Inception
Employee Share Ownership Plan 23% 17% 16% 13% 16%
On May 8, 2017, we were profoundly saddened when we lost one of our own. Monika Wozniak-Makarska, Presidentof Polish Re, passed away in Warsaw at the age of 44 after a courageous battle with cancer. Monika was appointedPresident and CEO of Polish Re on August 26, 2013. She was previously the Chief Underwriting Officer of thecompany and was with Polish Re since its formation in 1996. She left behind her husband, her two sons and herparents. We will always remember Monika as a wonderful person and a valuable member of the Fairfax family.
In our 2014 annual report, I mentioned that ‘‘in tragedy there is always hope, and when one of our employee’sten-year-old daughter lost a valiant battle with cancer, the Odyssey and Fairfax family made a donation for thetreatment and research for Merkel Cell Carcinoma, under the leadership of Andy Dickson and his wife Raquel, inhonor of their beloved daughter Kelsey, whose legacy endures through our efforts to find a cure so others won’t haveto suffer what she and her parents went through.’’ The 2015 Kelsey Dickson Team Science Courage Research Award atthe University of Washington accelerated an absolute ‘‘breakthrough’’ in precision curative treatment for what is nolonger a fatal cancer. This cancer has gone from chemotherapy incurable to over 60% curable. Pembrolizumab is nowavailable to patients with Merkel Cell Cancer – like Kelsey had – in over 16 countries. What a miracle!
Our donations program continues to thrive across the communities all over the world where we do business. Ouremployees are all pitching in and having ‘‘fun’’, helping people less fortunate. In 2017, we donated $22 million, for atotal of $177 million since we began. In 2017, we created a Fairfax foundation, with an initial donation of$20 million, which will allow us to help communities all over the world over the long term. Over the 27 years sincewe began our donations program, our annual donations have gone up approximately 125 times at a compound rateof 20% per year. Here are a few examples of our company donations that I would like to highlight:
In the wake of the suffering and destruction caused by the severe flooding in Houston in 2017, we donated $1 millionto programs providing flood relief there.
Northbridge’s Northbridge Cares program focuses on empowering, educating and supporting Canadian youth toreach their potential. Northbridge has partnered with six organizations that directly benefit the communities whereits customers and employees live and work – Pathways to Education, DAREarts, SickKids, Jack.org, United Way andTree Canada. Northbridge’s employees are passionate about these charities, together with Northbridge have donatedover $1.5 million to support these organizations, and have donated over 2,000 volunteer hours.
24

Crum & Forster reaffirmed its commitment to community health and wellness by stepping up as the DiamondSponsor of Morristown Medical Center’s signature fundraising event, which will help fund the new Center forNursing Innovation and Research. While C&F employees make a difference in communities across the country, othercauses close to home at corporate headquarters included, among many others, donations to the world-renownedSeeing Eye guide dog program and the Mayo Performing Arts Center, both based in Morristown, and C&F employeesproviding volunteer services for the relief of battered women and hunger. In recognition of leadership andcommunity service across the state, NJBIZ, New Jersey’s leading business journal, named Crum & Forster 2017Corporate Citizen of the Year.
OdysseyRe continued its ongoing commitment to cancer research, global disaster relief, education and many otherworthy causes, including the National Kidney Foundation, Institut Pasteur, Stamford Hospital and AmeriCares.Additional funding was provided to assist in rebuilding efforts in the wake of Hurricanes Harvey, Irma and Maria forthose impacted in the U.S. and Caribbean countries. A new OdysseyRe Global Studies Award Fund was alsoestablished at the St. John’s School of Risk Management.
Each year Brit supports ten charities chosen by its employees, which for 2017 were the Motor Neuron DiseaseAssociation, Autistica, Action Duchenne, The Disability Foundation, Ordinary 2 Extraordinary, Horatio’s Garden,Rockinghorse (all U.K.), Bountiful Blessings (U.S.), Philabundance (U.S.) and Blossom Trust (India). Brit has alsopartnered with Decoda, a Canadian charity working to increase the literacy and learning skills of children in fostercare, and the Creative Corrections Education Foundation, a U.S. charity helping the children of incarcerated parentsthrough education. During 2017 Brit donated $200,000 for the completion of a dormitory to house up to 100 girlsbeing educated at the Soweto Academy in Kibera, Kenya, the largest slum in Africa, and set up a fund to keep girls inan environment safe from the perils of sexual assault and early pregnancy.
Allied World has supported two NYC-based charities – the N.Y. Police and Fire Widows’ & Children’s Benefit Fund atwhose gala Scott Carmilani, Allied World’s CEO, was the honoree in November 2017, and the Citizens Committee forNew York City, whose mission is to improve the quality of life for low-income New Yorkers via various communityprojects.
RiverStone U.S. supports a number of charities, including three major initiatives which respond to various needs ofthe local community. RiverStone U.S. enjoys a decades-long relationship with the New Hampshire Food Bank andcontributed over $150,000 (as well as additional contributions to Atlanta and San Diego food banks) from aweek-long, employee-driven campaign in its offices in 2017. RiverStone U.S. also provided a full, four-yearscholarship to a local Manchester, NH student to attend St. Anselm’s college, and continues to partner with City Year,which serves students who are at risk of dropping out of school by providing support and supportive programs.
RiverStone U.K. supports a wide variety of causes nominated by employees, including RISE, a charity which providessanctuary and support for victims of domestic violence and abuse in the local area. RiverStone U.K.’s donationprovides those individuals with access to a 12-week group-work program with specialist childcare support.
In addition to making charitable donations, Zenith actively promotes and enables volunteerism among itsemployees to benefit its local communities. In times of need, Zenith supports disaster relief and humanitarian aidprograms by facilitating employee contributions and making matching donations. This year, Zenith responded tohurricanes Harvey, Irma and Maria, the earthquake in Mexico, the Las Vegas tragedy and the California wildfires.Many Zenith employees also volunteered their time to assist some of those affected by these disasters, which in somecases included customers and agents.
We are looking forward to seeing you at our annual meeting in Toronto at 9:30 a.m. (Eastern time) on Thursday,April 26, 2018 at Roy Thomson Hall. As in the past few years, we will have booths (the number keeps growing eachyear) which will provide information and allow you the opportunity to interact with the Presidents and seniormembers of our insurance companies, such as Northbridge, OdysseyRe, Crum & Forster, Zenith, Brit, Allied World,RiverStone, Fairfax Asia (which now includes AMAG, Pacific Insurance, Falcon, BIC, our insurance operation inVietnam, and Fairfirst, our insurance operation in Sri Lanka), and our partners in the Middle East, the Gulf InsuranceGroup, along with Colonnade which covers Central and Eastern Europe, our Latin American operations and Digit,our insurance company that we launched late last year in India. We continue to be active in the pet insurance marketand for all you pet lovers, Sean Smith and his team at Pethealth will be on hand to help you insure your favorite pet:Sean did not see enough of you last year, so please stop by the Pethealth booth and take advantage of some specialoffers that he has for you. To give you ample time to visit all our booths, the doors will open at 8:00 a.m.
25

FAIRFAX FINANCIAL HOLDINGS LIMITED
The Fairfax Leadership Workshop continues to grow, so that now about 150 individuals have attended the program.Many have moved on to senior leadership roles and some are running our companies. You will recognize them by thespecial pins that they wear that even I do not get. You will see them at the various insurance company booths, so stopby and speak to them. In addition, the booths will showcase some of our non-insurance company investments,including some you have known previously, such as William Ashley, Sporting Life, Arbor Memorial, Quess, GolfTown, Boat Rocker Media and Blue Ant Media, and some new ones like AGT, Altius and Chorus Aviation. Ourinnovation lab that we started in Waterloo, for which we created our FairVentures company, continues to grow andsupport innovation at all our companies, so please stop by and visit their booth where Dave Kruis, who runs theFairVentures Innovation Lab, promises to have an interactive experience for you.
Like last year, after our meeting we will have Cara, which now includes The Keg, and McEwan’s, led by celebrity chefMark McEwan, tantalize your taste buds with some of their delicious offerings from their various restaurants. Ireiterate that we are now the third largest restaurant company in Canada: you cannot go too far before you comeacross one of our restaurants in either the fast food or fine dining space.
Madhavan Menon from Thomas Cook India has said that not enough shareholders have taken advantage of thediscount to take your family for a trip of a lifetime to India, so this year he will be auctioning off a ‘‘Trip of a Lifetimeto India’’: all proceeds from the auction will go to the Crohn’s and Colitis Foundation, so please be generous. Thiswill be a truly memorable trip: we only ask that the winner come back and let everyone else know how wonderful itwas, so others can experience it as well! Please visit Madhavan, Dipak Deva and others at the Thomas Cook Indiabooth. We will have Hari Marar who runs the Bangalore Airport on hand and you can hear from him all the excitingthings that he has planned in the year ahead. Ajit Isaac from Quess will be there, as will Nirmal Jain from IIFL andVijay Sankar from Sanmar. Sterling Resorts, NCML, Saurashatra Freight, Fairchem, Privi, Quantum and Primary RealEstate will round out the investments that we have in India, each represented by its CEO. I guarantee that after youspeak to them, you will be as excited as I am regarding our investments in India.
Also, stop by Golf Town, where you can improve your putting in a three-hole contest, with the winner getting a prize:you might find me there as well, practising my putting! We will also have Bauer, which will showcase some of itslatest equipment.
Altogether, this is a fantastic opportunity for you to learn more about our companies, as well as to get some discountsfor shopping at William Ashley, Sporting Life and Golf Town and for dining at Cara and The Keg.
As in the past, highlighted will be two excellent programs that we support: the Ben Graham Centre for ValueInvesting with George Athanassakos at the Ivey School of Business, and the Actuarial Program at the University ofWaterloo – both among the best in North America! This year the staff at the University of Waterloo booth will againinclude co-op students working at our companies. I encourage you to speak to them: I assure you that you will beimpressed. Many of you have hired, and will want to continue to hire, a few more at your own companies: theUniversity will have someone on hand to let you know how you can go about doing so. George will also have manyof his MBA students on hand, so speak to them: you may want to hire them as well. George runs a Value InvestingConference the day before our meeting. This will be its seventh year and in case you have not attended, please checkthe website for details (www.bengrahaminvesting.ca). I highly recommend it and it is well worth your time to attend.Many who have attended have mentioned to me that it is one of the best of its kind, and this year’s lineup of speakersis outstanding!
Also, as we have done in the past, we will be giving you a book by Sir John Templeton: this year, ‘‘Thrift andGenerosity – The Joy of Giving’’. As I have said many times, Sir John was a mentor to me and the great admirationthat I have had for him and the influence that he has had on me personally and others in our company will alwaysresonate with us. Sanjeev Parsad will hand out the book for a donation of your choosing, and all the money collectedwill go to the Crohn’s and Colitis Foundation in memory of my assistant Jo Ann Butler. Sanjeev has raised a little overCdn$160,000 to date. Hats off to Sanjeev for spearheading this valiant effort.
Similarly to last year, Fairfax India (of which many of you are also shareholders) will hold its annual meeting at2:00 p.m. on April 26 at Roy Thomson Hall. Chandran Ratnaswami, Jenn Allen, John Varnell, Harsha Raghavan andthe CEOs of many of Fairfax India’s investees will be on hand to answer any questions you may have. As noted above,Fairfax India will also showcase the companies in its portfolio at the booths in the foyer, so stop by and visit themand hear firsthand all the wonderful things taking place in India and the vast potential that lies ahead there.
26

10MAR201607580995
This year Fairfax Africa will hold its first shareholders’ meeting on Wednesday, April 25 at 2:30 p.m. at the SheratonHotel in Toronto. Fairfax Africa will also have a booth at our meeting, so stop by and say hello to Michael Wilkersonand his partner Neil Holzapfel and see the exciting opportunities that lie ahead in Africa.
So, as we have done for the last 32 years, we look forward to meeting you, our shareholders, and answering all yourquestions, as well as getting you to meet our dedicated directors and the fine men and women who work at and runour companies. I personally am inspired each and every time that I meet you all, and when I hear your stories I wantto work twice as hard to make a return for you in the long term. We are truly blessed to have the loyal shareholdersthat we have and I look forward to seeing you at our shareholders’ meeting in April.
March 9, 2018
V. Prem WatsaChairman and Chief Executive Officer
27

10MAR201607580995 30JAN201416020159
FAIRFAX FINANCIAL HOLDINGS LIMITED
Management’s Responsibility for the Financial Statements
The preparation and presentation of the accompanying consolidated financial statements, Management’sDiscussion and Analysis of Financial Condition and Results of Operations (‘‘MD&A’’) and all financial informationare the responsibility of management and have been approved by the Board of Directors.
The consolidated financial statements have been prepared in accordance with International Financial ReportingStandards as issued by the International Accounting Standards Board. Financial statements, by nature, are not precisesince they include certain amounts based upon estimates and judgments. When alternative methods exist,management has chosen those it deems to be the most appropriate in the circumstances.
We, as Fairfax’s Chief Executive Officer and Chief Financial Officer, have certified Fairfax’s annual disclosuredocuments filed with the Canadian Securities Administrators and the Securities and Exchange Commission(Form 40-F) in accordance with Canadian securities legislation and the United States Sarbanes-Oxley Act of 2002respectively.
The Board of Directors is responsible for ensuring that management fulfills its responsibilities for financial reportingand is ultimately responsible for reviewing and approving the consolidated financial statements and MD&A. TheBoard carries out this responsibility principally through its Audit Committee which is independent frommanagement.
The Audit Committee is appointed by the Board of Directors and reviews the consolidated financial statements andMD&A; considers the report of the independent auditor; assesses the adequacy of the internal controls of thecompany, including management’s assessment described below; examines the fees and expenses for audit services;and recommends to the Board the independent auditor for appointment by the shareholders. The independentregistered public accounting firm has full access to the Audit Committee and meet with it to discuss their audit work,Fairfax’s internal control over financial reporting and financial reporting matters. The Audit Committee reports itsfindings to the Board for consideration when approving the consolidated financial statements for issuance to theshareholders and management’s assessment of the internal control over financial reporting.
Management’s Report on Internal Control over Financial Reporting
Management is responsible for establishing and maintaining adequate internal control over financial reporting.
Management has assessed the effectiveness of the company’s internal control over financial reporting as ofDecember 31, 2017 using criteria established in Internal Control – Integrated Framework (2013) issued by theCommittee of Sponsoring Organizations of the Treadway Commission (‘‘COSO’’). The scope of this assessment, inaccordance with Canadian and U.S. securities laws, did not include an evaluation of the internal control overfinancial reporting of Allied World Assurance Company Holdings, AG (since renamed ‘‘Allied World AssuranceCompany Holdings, GmbH’’) which was acquired on July 6, 2017. The operations of Allied World AssuranceCompany Holdings, GmbH represented 6.5% of the company’s consolidated revenue for the year endedDecember 31, 2017 and represented 22.8% and 23.9% of the company’s consolidated assets and liabilitiesrespectively as at December 31, 2017. Based on this assessment, management concluded that the company’s internalcontrol over financial reporting was effective as of December 31, 2017.
The effectiveness of the company’s internal control over financial reporting as of December 31, 2017 has beenaudited by PricewaterhouseCoopers LLP, an independent registered public accounting firm, as stated in their reportwhich appears herein.
March 9, 2018
V. Prem Watsa David BonhamChairman and Chief Executive Officer Vice President and Chief Financial Officer
28

Report of Independent Registered Public Accounting Firm
To the Shareholders and Board of Directors of Fairfax Financial Holdings Limited
Opinions on the financial statements and internal control over financial reporting
We have audited the accompanying consolidated balance sheets of Fairfax Financial Holdings Limited and itssubsidiaries (together, the Company) as of December 31, 2017 and 2016, and the related consolidated statements ofearnings, comprehensive income, changes in equity and cash flows for the years then ended, including the relatednotes (collectively referred to as the consolidated financial statements). We also have audited the Company’s internalcontrol over financial reporting as of December 31, 2017, based on criteria established in Internal Control – IntegratedFramework (2013) issued by the Committee of Sponsoring Organizations of the Treadway Commission (COSO).
In our opinion, the consolidated financial statements referred to above present fairly, in all material respects, thefinancial position of the Company as of December 31, 2017 and 2016, and its financial performance and its cashflows for the years then ended in conformity with International Financial Reporting Standards (IFRS) as issued by theInternational Accounting Standards Board (IASB). Also in our opinion, the Company maintained, in all materialrespects, effective internal control over financial reporting as of December 31, 2017, based on criteria established inInternal Control – Integrated Framework (2013) issued by the COSO.
Basis for opinions
The Company’s management is responsible for these consolidated financial statements, for maintaining effectiveinternal control over financial reporting, and for its assessment of the effectiveness of internal control over financialreporting, included in Management’s Report on Internal Control over Financial Reporting. Our responsibility is toexpress opinions on the Company’s consolidated financial statements and on the Company’s internal control overfinancial reporting based on our audits. We are a public accounting firm registered with the Public CompanyAccounting Oversight Board (United States) (PCAOB) and are required to be independent with respect to theCompany in accordance with the U.S. federal securities laws and the applicable rules and regulations of the Securitiesand Exchange Commission and the PCAOB.
We conducted our audits in accordance with the standards of the PCAOB. Those standards require that we plan andperform the audits to obtain reasonable assurance about whether the consolidated financial statements are free ofmaterial misstatement, whether due to error or fraud, and whether effective internal control over financial reportingwas maintained in all material respects.
Our audits of the consolidated financial statements included performing procedures to assess the risks of materialmisstatement of the consolidated financial statements, whether due to error or fraud, and performing proceduresthat respond to those risks. Such procedures included examining, on a test basis, evidence regarding the amountsand disclosures in the consolidated financial statements. Our audits also included evaluating the accountingprinciples used and significant estimates made by management, as well as evaluating the overall presentation of theconsolidated financial statements. Our audit of internal control over financial reporting included obtaining anunderstanding of internal control over financial reporting, assessing the risk that a material weakness exists, andtesting and evaluating the design and operating effectiveness of internal control based on the assessed risk. Ouraudits also included performing such other procedures, as we considered necessary in the circumstances. We believethat our audits provide a reasonable basis for our opinions.
As described in Management’s Report on Internal Control over Financial Reporting, management has excludedAllied World Assurance Company Holdings, AG, which was subsequently renamed Allied World AssuranceCompany Holdings, GmbH (Allied World) from its assessment of internal control over financial reporting as ofDecember 31, 2017 because it was acquired by the Company in a purchase business combination during 2017. Wehave also excluded Allied World from our audit of internal control over financial reporting. Allied World is asubsidiary whose total assets, total liabilities and total revenues excluded from management’s assessment and ouraudit of internal control over financial reporting represent 22.8%, 23.9% and 6.5%, respectively, of the relatedconsolidated financial statement amounts as of and for the year ended December 31, 2017.
29

8MAR201809340041
FAIRFAX FINANCIAL HOLDINGS LIMITED
Definition and limitations of internal control over financial reporting
A company’s internal control over financial reporting is a process designed to provide reasonable assurance regardingthe reliability of financial reporting and the preparation of financial statements for external purposes in accordancewith generally accepted accounting principles. A company’s internal control over financial reporting includes thosepolicies and procedures that (i) pertain to the maintenance of records that, in reasonable detail, accurately and fairlyreflect the transactions and dispositions of the assets of the company; (ii) provide reasonable assurance thattransactions are recorded as necessary to permit preparation of financial statements in accordance with generallyaccepted accounting principles, and that receipts and expenditures of the company are being made only inaccordance with authorizations of management and directors of the company; and (iii) provide reasonable assuranceregarding prevention or timely detection of unauthorized acquisition, use, or disposition of the company’s assetsthat could have a material effect on the financial statements.
Because of its inherent limitations, internal control over financial reporting may not prevent or detectmisstatements. Also, projections of any evaluation of effectiveness to future periods are subject to the risk thatcontrols may become inadequate because of changes in conditions, or that the degree of compliance with thepolicies or procedures may deteriorate.
Chartered Professional Accountants, Licensed Public Accountants
Toronto, CanadaMarch 9, 2018
We have served as the Company’s auditor since at least 1985. We have not determined the specific year we beganserving as auditor of the Company or its predecessor.
30

(This page is intentionally left blank)
31

10MAR201607580995 10MAR201607580340
FAIRFAX FINANCIAL HOLDINGS LIMITED
Consolidated Financial StatementsConsolidated Balance Sheetsas at December 31, 2017 and December 31, 2016
December 31, December 31,Notes 2017 2016
(US$ millions)
AssetsHolding company cash and investments (including assets pledged
for short sale and derivative obligations – $77.8; December 31,2016 – $94.4) 5, 27 2,368.4 1,371.6
Insurance contract receivables 10 4,686.9 2,917.5
Portfolio investmentsSubsidiary cash and short term investments 5, 27 17,382.5 9,938.0Bonds (cost $8,764.6; December 31, 2016 – $8,699.1) 5 9,164.1 9,323.2Preferred stocks (cost $338.5; December 31, 2016 – $111.2) 5 296.8 69.6Common stocks (cost $4,877.5; December 31, 2016 – $4,824.0) 5 4,838.7 4,158.8Investments in associates (fair value $2,824.3; December 31, 2016 –
$2,955.4) 5, 6 2,487.0 2,393.0Derivatives and other invested assets (cost $585.7; December 31,
2016 – $546.2) 5, 7 255.4 179.7Assets pledged for short sale and derivative obligations (cost $197.5;
December 31, 2016 – $223.9) 5, 7 194.7 228.5Fairfax India and Fairfax Africa cash, portfolio investments and
associates 5, 6, 27 2,394.0 1,002.6
37,013.2 27,293.4
Deferred premium acquisition costs 11 927.5 693.1Recoverable from reinsurers (including recoverables on paid losses –
$453.8; December 31, 2016 – $290.9) 9 7,812.5 4,010.3Deferred income taxes 18 380.8 732.6Goodwill and intangible assets 12 6,072.5 3,847.5Other assets 13 4,828.3 2,518.4
Total assets 64,090.1 43,384.4
See accompanying notes.
Signed on behalf of the Board
Director Director
32

December 31, December 31,Notes 2017 2016
(US$ millions)
LiabilitiesAccounts payable and accrued liabilities 14 3,629.5 2,888.6Income taxes payable 18 95.6 35.4Short sale and derivative obligations (including at the holding
company – $11.5; December 31, 2016 – $42.2) 5, 7 126.2 234.3Funds withheld payable to reinsurers 850.2 416.2Insurance contract liabilities 8 34,562.5 23,222.2Borrowings – holding company and insurance and reinsurance
companies 15 4,848.1 3,908.0Borrowings – non-insurance companies 15 1,566.0 859.6
Total liabilities 45,678.1 31,564.3
Equity 16Common shareholders’ equity 12,475.6 8,484.6Preferred stock 1,335.5 1,335.5
Shareholders’ equity attributable to shareholders of Fairfax 13,811.1 9,820.1Non-controlling interests 4,600.9 2,000.0
Total equity 18,412.0 11,820.1
64,090.1 43,384.4
See accompanying notes.
33

FAIRFAX FINANCIAL HOLDINGS LIMITED
Consolidated Statements of Earningsfor the years ended December 31, 2017 and 2016
Notes 2017 2016(US$ millions except per
share amounts)
RevenueGross premiums written 10, 25 12,207.5 9,534.3
Net premiums written 25 9,983.5 8,088.4
Gross premiums earned 11,822.0 9,209.7Premiums ceded to reinsurers (2,100.6) (1,347.5)
Net premiums earned 25 9,721.4 7,862.2Interest and dividends 5 559.0 555.2Share of profit of associates 6 200.5 24.2Net gains (losses) on investments 5 1,467.5 (1,203.6)Gain on sale of subsidiary 23 1,018.6 –Other revenue 25 3,257.6 2,061.6
16,224.6 9,299.6
ExpensesLosses on claims, gross 8 9,518.7 5,682.9Losses on claims ceded to reinsurers 9 (2,371.8) (964.3)
Losses on claims, net 26 7,146.9 4,718.6Operating expenses 26 2,049.5 1,597.7Commissions, net 9 1,649.2 1,336.4Interest expense 15 331.2 242.8Other expenses 25, 26 3,024.6 1,958.4
14,201.4 9,853.9
Earnings (loss) before income taxes 2,023.2 (554.3)Provision (recovery) for income taxes 18 408.3 (159.6)
Net earnings (loss) 1,614.9 (394.7)
Attributable to:Shareholders of Fairfax 1,740.6 (512.5)Non-controlling interests (125.7) 117.8
1,614.9 (394.7)
Net earnings (loss) per share 17 $ 66.74 $ (24.18)Net earnings (loss) per diluted share 17 $ 64.98 $ (24.18)Cash dividends paid per share 16 $ 10.00 $ 10.00Shares outstanding (000) (weighted average) 17 25,411 23,017
See accompanying notes.
34

Consolidated Statements of Comprehensive Incomefor the years ended December 31, 2017 and 2016
Notes 2017 2016(US$ millions)
Net earnings (loss) 1,614.9 (394.7)
Other comprehensive income (loss), net of income taxes 16
Items that may be subsequently reclassified to net earningsNet unrealized foreign currency translation gains (losses) on foreign operations 461.7 (80.2)Losses on hedge of net investment in Canadian subsidiaries 7 (106.3) (37.5)Share of other comprehensive income (loss) of associates, excluding net gains
(losses) on defined benefit plans 6 110.1 (35.6)
465.5 (153.3)
Items that will not be subsequently reclassified to net earningsShare of net gains (losses) on defined benefit plans of associates 6 5.2 (33.2)Net losses on defined benefit plans 21 (31.8) (18.3)
(26.6) (51.5)
Other comprehensive income (loss), net of income taxes 438.9 (204.8)
Comprehensive income (loss) 2,053.8 (599.5)
Attributable to:Shareholders of Fairfax 2,024.4 (696.4)Non-controlling interests 29.4 96.9
2,053.8 (599.5)
Notes 2017 2016
Income tax (expense) recovery included in other comprehensive income(loss)
Income tax on items that may be subsequently reclassified to netearningsNet unrealized foreign currency translation gains (losses) on foreign operations 10.4 14.0Share of other comprehensive income (loss) of associates, excluding net gains
(losses) on defined benefit plans (25.9) 3.7
(15.5) 17.7
Income tax on items that will not be subsequently reclassified to netearningsShare of net gains (losses) on defined benefit plans of associates (7.4) 10.5Net losses on defined benefit plans 2.3 5.0
(5.1) 15.5
Total income tax (expense) recovery (20.6) 33.2
See accompanying notes.
35

FAIRFAX FINANCIAL HOLDINGS LIMITED
Consolidated Statements of Changes in Equityfor the years ended December 31, 2017 and 2016(US$ millions)
Share-based Equity
payments Accumulated attributableSubordinate Multiple Treasury and other Common to Non-
voting voting shares other Retained comprehensive shareholders’ Preferred shareholders controlling Totalshares shares (at cost) reserves earnings income (loss) equity shares of Fairfax interests equity
Balance as of January 1, 2017 4,750.8 3.8 (285.1) 106.8 4,456.2 (547.9) 8,484.6 1,335.5 9,820.1 2,000.0 11,820.1Net earnings (loss) for the year – – – – 1,740.6 – 1,740.6 – 1,740.6 (125.7) 1,614.9Other comprehensive income, net of
income taxes:Net unrealized foreign currency
translation gains on foreignoperations – – – – – 306.7 306.7 – 306.7 155.0 461.7
Losses on hedge of net investmentin Canadian subsidiaries – – – – – (106.3) (106.3) – (106.3) – (106.3)
Share of other comprehensiveincome of associates, excludingnet gains on defined benefitplans – – – – – 109.3 109.3 – 109.3 0.8 110.1
Share of net gains on definedbenefit plans of associates – – – – – 5.0 5.0 – 5.0 0.2 5.2
Net losses on defined benefit plans – – – – – (30.9) (30.9) – (30.9) (0.9) (31.8)Issuance of shares 2,196.4 – 17.4 (16.9) – – 2,196.9 – 2,196.9 – 2,196.9Purchases and amortization (45.6) – (140.5) 51.8 – – (134.3) – (134.3) 3.8 (130.5)Excess of book value over
consideration of common sharespurchased for cancellation – – – – (50.6) – (50.6) – (50.6) – (50.6)
Common share dividends – – – – (237.4) – (237.4) – (237.4) (67.5) (304.9)Preferred share dividends – – – – (44.6) – (44.6) – (44.6) – (44.6)Acquisitions of subsidiaries (note 23) – – – – – – – – – 2,451.2 2,451.2Other net changes in capitalization
(note 16) – – – 52.8 183.8 – 236.6 – 236.6 184.0 420.6
Balance as of December 31, 2017 6,901.6 3.8 (408.2) 194.5 6,048.0 (264.1) 12,475.6 1,335.5 13,811.1 4,600.9 18,412.0
Balance as of January 1, 2016 4,229.8 3.8 (236.0) 88.2 5,230.7 (364.0) 8,952.5 1,334.9 10,287.4 1,731.5 12,018.9Net earnings (loss) for the year – – – – (512.5) – (512.5) – (512.5) 117.8 (394.7)Other comprehensive loss, net of
income taxes:Net unrealized foreign currency
translation losses on foreignoperations – – – – – (61.4) (61.4) – (61.4) (18.8) (80.2)
Losses on hedge of net investmentin Canadian subsidiaries – – – – – (37.5) (37.5) – (37.5) – (37.5)
Share of other comprehensive lossof associates, excluding net losseson defined benefit plans – – – – – (35.4) (35.4) – (35.4) (0.2) (35.6)
Share of net losses on definedbenefit plans of associates – – – – – (32.0) (32.0) – (32.0) (1.2) (33.2)
Net losses on defined benefit plans – – – – – (17.6) (17.6) – (17.6) (0.7) (18.3)Issuance of shares 523.5 – 15.1 (17.6) – – 521.0 – 521.0 – 521.0Purchases and amortization (6.1) – (64.2) 40.6 – – (29.7) – (29.7) (0.8) (30.5)Excess of book value over
consideration of common sharespurchased for cancellation – – – – (8.0) – (8.0) – (8.0) – (8.0)
Common share dividends – – – – (227.8) – (227.8) – (227.8) (41.2) (269.0)Preferred share dividends – – – – (44.0) – (44.0) – (44.0) – (44.0)Acquisitions of subsidiaries (note 23) – – – – – – – – – 86.8 86.8Other net changes in capitalization 3.6 – – (4.4) 17.8 – 17.0 0.6 17.6 126.8 144.4
Balance as of December 31, 2016 4,750.8 3.8 (285.1) 106.8 4,456.2 (547.9) 8,484.6 1,335.5 9,820.1 2,000.0 11,820.1
See accompanying notes.
36

Consolidated Statements of Cash Flowsfor the years ended December 31, 2017 and 2016
Notes 2017 2016(US$ millions)
Operating activitiesNet earnings (loss) 1,614.9 (394.7)Depreciation, amortization and impairment charges 26 280.5 191.7Net bond premium (discount) amortization (52.7) 3.6Amortization of share-based payment awards 51.8 40.6Share of profit of associates 6 (200.5) (24.2)Deferred income taxes 18 230.3 (273.8)Net (gains) losses on investments 5 (1,467.5) 1,203.6Gain on sale of subsidiary 23 (1,018.6) –Loss on repurchase of borrowings 15 28.6 –Net sales of securities classified as FVTPL 27 2,678.4 1,119.3Changes in operating assets and liabilities 27 555.4 (607.9)
Cash provided by operating activities 2,700.6 1,258.2
Investing activitiesSales of investments in associates 6, 23 1,014.9 45.8Purchases of investments in associates 6, 23 (1,026.5) (735.3)Net purchases of premises and equipment and intangible assets (415.2) (208.3)Purchases of subsidiaries, net of cash acquired 23 (1,107.7) (779.1)Sale of subsidiary, net of cash divested 23 640.4 –Decrease in restricted cash for purchase of subsidiary – 6.5
Cash used in investing activities (894.1) (1,670.4)
Financing activitiesBorrowings – holding company and insurance and reinsurance companies: 15
Proceeds, net of issuance costs 577.0 637.7Repayments (483.7) (5.4)Net borrowings from (repayments to) holding company revolving credit
facility (200.0) 200.0Borrowings – non-insurance companies: 15
Proceeds, net of issuance costs 500.6 360.5Repayments (268.7) (38.9)Net borrowings from revolving credit facilities 193.7 193.6Increase in restricted cash related to financing activities (150.8) (18.9)
Subordinate voting shares: 16Issuances, net of issuance costs – 523.5Repurchases for treasury (140.5) (64.2)Repurchases for cancellation (96.2) (14.1)
Common share dividends 16 (237.4) (227.8)Preferred share dividends 16 (44.6) (44.0)Subsidiary common shares:
Issuances to non-controlling interests, net of issuance costs 23 2,223.2 157.1Purchases of non-controlling interests 23 (140.3) (87.2)Sales to non-controlling interests 23 96.8 12.7Dividends paid to non-controlling interests 16 (67.5) (41.2)
Cash provided by financing activities 1,761.6 1,543.4
Increase in cash and cash equivalents 3,568.1 1,131.2Cash and cash equivalents – beginning of year 4,219.1 3,125.6Foreign currency translation 147.8 (37.7)
Cash and cash equivalents – end of year 27 7,935.0 4,219.1
See accompanying notes.
37

FAIRFAX FINANCIAL HOLDINGS LIMITED
Index to Notes to Consolidated Financial Statements
1. Business Operations . . . . . . . . . . . . . . . . . . . . . . . . . . . . . . . . . . . . . . . . . . . . . . . . . . . . . . . . . 39
2. Basis of Presentation . . . . . . . . . . . . . . . . . . . . . . . . . . . . . . . . . . . . . . . . . . . . . . . . . . . . . . . . 39
3. Summary of Significant Accounting Policies . . . . . . . . . . . . . . . . . . . . . . . . . . . . . . . . . . . . . . . . 39
4. Critical Accounting Estimates and Judgments . . . . . . . . . . . . . . . . . . . . . . . . . . . . . . . . . . . . . . . 51
5. Cash and Investments . . . . . . . . . . . . . . . . . . . . . . . . . . . . . . . . . . . . . . . . . . . . . . . . . . . . . . . 52
6. Investments in Associates . . . . . . . . . . . . . . . . . . . . . . . . . . . . . . . . . . . . . . . . . . . . . . . . . . . . . 60
7. Short Sales and Derivatives . . . . . . . . . . . . . . . . . . . . . . . . . . . . . . . . . . . . . . . . . . . . . . . . . . . . 65
8. Insurance Contract Liabilities . . . . . . . . . . . . . . . . . . . . . . . . . . . . . . . . . . . . . . . . . . . . . . . . . . 67
9. Reinsurance . . . . . . . . . . . . . . . . . . . . . . . . . . . . . . . . . . . . . . . . . . . . . . . . . . . . . . . . . . . . . . 70
10. Insurance Contract Receivables . . . . . . . . . . . . . . . . . . . . . . . . . . . . . . . . . . . . . . . . . . . . . . . . . 71
11. Deferred Premium Acquisition Costs . . . . . . . . . . . . . . . . . . . . . . . . . . . . . . . . . . . . . . . . . . . . . 72
12. Goodwill and Intangible Assets . . . . . . . . . . . . . . . . . . . . . . . . . . . . . . . . . . . . . . . . . . . . . . . . . 73
13. Other Assets . . . . . . . . . . . . . . . . . . . . . . . . . . . . . . . . . . . . . . . . . . . . . . . . . . . . . . . . . . . . . . 75
14. Accounts Payable and Accrued Liabilities . . . . . . . . . . . . . . . . . . . . . . . . . . . . . . . . . . . . . . . . . . 75
15. Borrowings . . . . . . . . . . . . . . . . . . . . . . . . . . . . . . . . . . . . . . . . . . . . . . . . . . . . . . . . . . . . . . . 76
16. Total Equity . . . . . . . . . . . . . . . . . . . . . . . . . . . . . . . . . . . . . . . . . . . . . . . . . . . . . . . . . . . . . . 78
17. Earnings per Share . . . . . . . . . . . . . . . . . . . . . . . . . . . . . . . . . . . . . . . . . . . . . . . . . . . . . . . . . . 81
18. Income Taxes . . . . . . . . . . . . . . . . . . . . . . . . . . . . . . . . . . . . . . . . . . . . . . . . . . . . . . . . . . . . . 82
19. Statutory Requirements . . . . . . . . . . . . . . . . . . . . . . . . . . . . . . . . . . . . . . . . . . . . . . . . . . . . . . 85
20. Contingencies and Commitments . . . . . . . . . . . . . . . . . . . . . . . . . . . . . . . . . . . . . . . . . . . . . . . 86
21. Pensions and Post Retirement Benefits . . . . . . . . . . . . . . . . . . . . . . . . . . . . . . . . . . . . . . . . . . . . 87
22. Operating Leases . . . . . . . . . . . . . . . . . . . . . . . . . . . . . . . . . . . . . . . . . . . . . . . . . . . . . . . . . . . 88
23. Acquisitions and Divestitures . . . . . . . . . . . . . . . . . . . . . . . . . . . . . . . . . . . . . . . . . . . . . . . . . . 88
24. Financial Risk Management . . . . . . . . . . . . . . . . . . . . . . . . . . . . . . . . . . . . . . . . . . . . . . . . . . . 94
25. Segmented Information . . . . . . . . . . . . . . . . . . . . . . . . . . . . . . . . . . . . . . . . . . . . . . . . . . . . . . 111
26. Expenses . . . . . . . . . . . . . . . . . . . . . . . . . . . . . . . . . . . . . . . . . . . . . . . . . . . . . . . . . . . . . . . . 117
27. Supplementary Cash Flow Information . . . . . . . . . . . . . . . . . . . . . . . . . . . . . . . . . . . . . . . . . . . 118
28. Related Party Transactions . . . . . . . . . . . . . . . . . . . . . . . . . . . . . . . . . . . . . . . . . . . . . . . . . . . . 119
29. Subsidiaries . . . . . . . . . . . . . . . . . . . . . . . . . . . . . . . . . . . . . . . . . . . . . . . . . . . . . . . . . . . . . . . 120
38

Notes to Consolidated Financial Statementsfor the years ended December 31, 2017 and 2016(in US$ and $ millions except per share amounts and as otherwise indicated)
1. Business Operations
Fairfax Financial Holdings Limited (‘‘the company’’ or ‘‘Fairfax’’) is a holding company which, through itssubsidiaries, is principally engaged in property and casualty insurance and reinsurance and the associatedinvestment management. The holding company is federally incorporated and domiciled in Ontario, Canada.
2. Basis of Presentation
The company’s consolidated financial statements for the year ended December 31, 2017 are prepared in accordancewith International Financial Reporting Standards (‘‘IFRS’’) as issued by the International Accounting Standards Board(‘‘IASB’’) effective as at December 31, 2017, except IFRS 9 (2010) Financial Instruments which was adopted early. Theconsolidated financial statements have been prepared on a historical cost basis, except for derivative financialinstruments and fair value through profit and loss (‘‘FVTPL’’) financial assets and liabilities that have been measuredat fair value.
The consolidated balance sheets of the company are presented on a non-classified basis. Assets expected to berealized and liabilities expected to be settled within the company’s normal operating cycle of one year are consideredcurrent, including the following balances: cash, short term investments, insurance contract receivables, deferredpremium acquisition costs, income taxes payable, and short sale and derivative obligations. The following balancesare considered non-current: deferred income taxes and goodwill and intangible assets. All other balances arecomprised of current and non-current amounts.
The holding company has significant liquid resources that are generally not restricted by insurance regulators. Theoperating subsidiaries are primarily insurers and reinsurers that are often subject to a wide variety of insurance andother laws and regulations that vary by jurisdiction and are intended to protect policyholders rather than investors.These laws and regulations may limit the ability of operating subsidiaries to pay dividends or make distributions toparent companies. The company’s consolidated balance sheet and consolidated statement of cash flows thereforemake a distinction in classification between the holding company and the operating subsidiaries for cash and shortterm investments to provide additional insight into the company’s liquidity, financial leverage and capital structure.
These consolidated financial statements were approved for issue by the company’s Board of Directors onMarch 9, 2018.
3. Summary of Significant Accounting Policies
The principal accounting policies applied to the presentation of these consolidated financial statements and themethods of computation have been consistently applied to all periods presented unless otherwise stated, and are asset out below.
ConsolidationSubsidiaries – The company’s consolidated financial statements include the assets, liabilities, equity, revenue,expenses and cash flows of the holding company and its subsidiaries. A subsidiary is an entity over which thecompany has control. The company controls an entity when the company has power over the entity, is exposed to,or has rights to, variable returns from its involvement with the entity and has the ability to affect those returnsthrough its power over the entity. Assessment of control is based on the substance of the relationship between thecompany and the entity and includes consideration of both existing voting rights and, if applicable, potential votingrights that are currently exercisable and convertible. The operating results of subsidiaries acquired are included in theconsolidated financial statements from the date control is acquired (typically the acquisition date). The operatingresults of subsidiaries that are divested during the year are included up to the date control ceased and any differencebetween the fair value of the consideration received and the carrying value of a divested subsidiary is recognized inthe consolidated statement of earnings.
The consolidated financial statements were prepared as of December 31, 2017 and 2016 based on individual holdingcompanies’ and subsidiary companies’ financial statements at those dates. Accounting policies of subsidiaries have
39

FAIRFAX FINANCIAL HOLDINGS LIMITED
been aligned with those of the company where necessary. The company’s significant subsidiaries are identified innote 29.
Non-controlling interests – A non-controlling interest is initially recognized as the proportionate share of theidentifiable net assets of a subsidiary on its acquisition date and is subsequently adjusted for the non-controllinginterest’s share of changes in the acquired subsidiary’s earnings and capital. Effects of transactions withnon-controlling interests are recorded in equity if there is no change in control.
Business combinationsBusiness combinations are accounted for using the acquisition method of accounting whereby the considerationtransferred is measured at fair value at the date of acquisition. This consideration may include cash paid and the fairvalue at the date of exchange of assets given, liabilities incurred and equity instruments issued by the company or itssubsidiaries. The consideration transferred also includes any contingent consideration arrangements, recorded at fairvalue. Directly attributable acquisition-related costs are expensed in the current period and reported withinoperating expenses. At the date of acquisition, the company recognizes the identifiable assets acquired, the liabilitiesassumed and any non-controlling interest in the acquired business. The identifiable assets acquired and liabilitiesassumed are initially recognized at fair value. If the consideration transferred is less than the fair value of identifiablenet assets acquired, the excess is recognized in the consolidated statement of earnings.
A pre-existing equity interest is re-measured to fair value at the date of a business combination with any gain or lossrecognized in net gains (losses) on investments in the consolidated statement of earnings.
Goodwill and intangible assetsGoodwill – Goodwill is recorded as the excess of consideration transferred over the fair value of the identifiable netassets acquired in a business combination, less accumulated impairment charges, and is allocated to thecash-generating units expected to benefit from the acquisition for the purpose of impairment testing. On an annualbasis or more frequently if there are potential indicators of impairment, the carrying value of a cash-generating unitinclusive of its allocated goodwill is compared to its recoverable amount, with any goodwill impairment measured asthe excess of the carrying amount over the recoverable amount. Goodwill is derecognized on disposal of acash-generating unit to which goodwill was previously allocated.
Intangible assets – Intangible assets are comprised primarily of customer and broker relationships, brand names,Lloyd’s participation rights, computer software (including enterprise systems) and other acquired identifiablenon-monetary assets without physical form.
Intangible assets are initially recognized at cost (fair value when acquired through a business combination) andsubsequently measured at cost less accumulated amortization and impairment, where amortization is calculatedusing the straight-line method based on the estimated useful life of those intangible assets with a finite life. Thecarrying value of intangible assets with a finite life are re-evaluated by the company when there are potentialindicators of impairment. Indefinite-lived intangible assets are not subject to amortization but are assessed forimpairment annually or more frequently if there are potential indicators of impairment.
The estimated useful lives of the company’s intangible assets are as follows:
Customer and broker relationships 8 to 20 yearsBrand names and Lloyd’s participation rights IndefiniteComputer software 3 to 15 years
Brand names are considered to be indefinite-lived based on their strength, history and expected future use.
Investments in associatesInvestments in associates are accounted for using the equity method and are comprised of investments incorporations, limited partnerships and trusts where the company has the ability to exercise significant influence butnot control. Under the equity method of accounting, an investment in associate is initially recognized at cost andadjusted thereafter for the post-acquisition change in the company’s share of net assets of the associate. Thecompany’s share of profit (loss) and other comprehensive income (loss) of associates are reported in thecorresponding lines in the consolidated statement of earnings and consolidated statement of comprehensiveincome, respectively. A pre-existing equity interest is re-measured to fair value at the date significant influence isobtained and included in the carrying value of the associate.
40

The fair value of associates is estimated at each reporting date (or more frequently when conditions warrant) usingvaluation techniques consistent with those applied to the company’s other investments in equity instruments. See‘Determination of fair value’ under the heading of ‘Investments’ for further details. If there is objective evidence thatthe carrying value of an associate is impaired, the associate is written down to its recoverable amount and theunrealized impairment loss is recognized in share of profit (loss) of associates in the consolidated statement ofearnings. Impairment losses are reversed in future periods if the circumstances that led to the impairment no longerexist. The reversal is limited to restoring the carrying amount to what would have been determined had noimpairment loss been recognized in prior periods.
Upon loss of significant influence, any retained interest classified as a financial asset is re-measured to fair value andall amounts previously recognized in other comprehensive income in relation to that investee are reclassified to theconsolidated statement of earnings. Gains and losses on loss of significant influence or disposition of an associate arerecognized in net gains (losses) on investments in the consolidated statement of earnings.
Foreign currency translationFunctional and presentation currency – The consolidated financial statements are presented in U.S. dollarswhich is the holding company’s functional currency and the presentation currency of the consolidated group.
Foreign currency transactions – Foreign currency transactions are translated into the functional currencies ofthe holding company and its subsidiaries using the exchange rates prevailing at the dates of the transactions. Foreignexchange gains and losses resulting from the settlement of such transactions and from the translation at year-endexchange rates of monetary assets and liabilities denominated in foreign currencies are recognized in theconsolidated statement of earnings. Non-monetary items carried at cost are translated using the exchange rate at thedate of the transaction. Non-monetary items carried at fair value are translated at the date the fair valueis determined.
Translation of foreign subsidiaries – The functional currencies of some of the company’s subsidiaries(principally in Canada, the United Kingdom and Asia) differ from the consolidated group U.S. dollar presentationcurrency. As a result, the assets and liabilities of these foreign subsidiaries (including goodwill and fair valueadjustments arising on their acquisition, where applicable) are translated on consolidation at the rates of exchangeprevailing at the balance sheet date. Revenue and expenses are translated at the average rate of exchange for theperiod. The net unrealized gain or loss resulting from this translation is recognized in accumulated othercomprehensive income, and only recycled to the consolidated statement of earnings upon reduction of aninvestment in a foreign subsidiary.
Net investment hedge – The company has designated a portion of the principal amount of its Canadian dollardenominated borrowings as a hedge of its net investment in its Canadian subsidiaries. The cumulative unrealizedgain or loss relating to the effective portion of the hedge is recognized in accumulated other comprehensive income,and only recycled to the consolidated statement of earnings upon reduction of an investment in a hedged foreignsubsidiary. Gains and losses relating to any ineffective portion of the hedge are recorded in net gains (losses) oninvestments in the consolidated statement of earnings.
Comprehensive income (loss)Comprehensive income (loss) consists of net earnings (loss) and other comprehensive income (loss) and includes allchanges in total equity during a period, except for those resulting from investments by owners or distributions toowners. Unrealized foreign currency translation amounts arising from foreign subsidiaries and associates that do nothave U.S. dollar functional currencies and the effective portion of changes in the fair value of hedging instrumentson hedges of net investments in foreign subsidiaries are recognized in other comprehensive income (loss) andincluded in accumulated other comprehensive income (loss) until recycled to the consolidated statement of earningson reduction of an investment in a foreign subsidiary or associate. Actuarial gains and losses and changes in assetlimitation amounts on defined benefit pension and post retirement plans are recorded in other comprehensiveincome (loss) and included in accumulated other comprehensive income (loss) without recycling. Upon settlementof the defined benefit plan or disposal of the related associate or subsidiary, those amounts are reclassified directly toretained earnings. Accumulated other comprehensive income (loss), net of income taxes, is included on theconsolidated balance sheet as a component of common shareholders’ equity.
41

FAIRFAX FINANCIAL HOLDINGS LIMITED
Consolidated statement of cash flowsThe company’s consolidated statement of cash flows is prepared in accordance with the indirect method, classifyingcash flows by operating, investing and financing activities.
Cash and cash equivalents – Cash and cash equivalents consist of holding company and subsidiary cash onhand, demand deposits with banks and other short term highly liquid investments with maturities of three monthsor less when purchased, and exclude cash and short term highly liquid investments that are restricted.
InvestmentsInvestments include cash and cash equivalents, short term investments, equity instruments, debt instruments,securities sold short, derivatives, investment property and investments in associates. Management determines theappropriate classifications of investments at their acquisition date. The company has not designated any financialassets or liabilities (including derivatives) as accounting hedges except for the hedge of its net investment inCanadian subsidiaries as described in note 7.
Classification – Short term investments, equity instruments, bonds, securities sold short and derivatives areclassified as FVTPL.
An investment in a debt instrument is measured at amortized cost if (i) the objective of the company’s businessmodel is to hold the instrument in order to collect contractual cash flows and (ii) the contractual terms of theinstrument give rise on specified dates to cash flows that are solely payments of principal and interest on theprincipal amount outstanding. The company’s business model currently does not permit any of its short terminvestments or bonds to be measured at amortized cost.
Recognition and measurement – The company recognizes purchases and sales of investments on the trade date,which is the date on which the company commits to purchase or sell the asset. Transactions pending settlement arereflected on the consolidated balance sheet in other assets or in accounts payable and accrued liabilities.
Investments classified as FVTPL are carried at fair value on the consolidated balance sheet, with transaction costsexpensed as incurred and changes in fair value reported in the consolidated statement of earnings as interest anddividends and net gains (losses) on investments. Interest and dividends comprises dividends received on holdings ofcommon stocks and preferred stocks, and interest income on short term investments and bonds calculated using theeffective interest method, net of investment expenses. All other changes in fair value of investments classified asFVTPL are reported in net gains (losses) on investments in the consolidated statement of earnings, such that the sumof interest income and net gains (losses) on short term investments and bonds is equal to their total change in fairvalue for the reporting period.
Interest and dividends and net gains (losses) on investments are reported as operating activities in the consolidatedstatement of cash flows.
An investment is derecognized when the rights to receive cash flows from the investment have expired or have beentransferred and when the company has transferred substantially the risks and rewards of ownership.
Short term investments – Debt instruments with maturity dates between three months and twelve months whenpurchased are presented as short term investments.
Bonds – Debt instruments with maturity dates greater than twelve months when purchased are presented as bonds.
Securities sold short – Securities sold short (‘‘short sales’’) represent obligations to deliver securities which werenot owned at the time of the sale.
Derivatives – Derivatives may include interest rate, credit default, currency and total return swaps, consumer priceindex linked (‘‘CPI-linked’’), futures, forwards, warrants and option contracts, all of which derive their value mainlyfrom changes in underlying interest rates, foreign exchange rates, credit ratings, commodity values, inflationindexes or equity instruments. A derivative contract may be traded on an exchange or over-the-counter (‘‘OTC’’).Exchange-traded derivatives are standardized and include futures and certain warrants and option contracts. OTCderivative contracts are individually negotiated between contracting parties and may include the company’sforwards, CPI-linked derivatives and total return swaps.
The company uses derivatives principally to mitigate financial risks arising from its investment holdings andreinsurance recoverables, and monitors its derivatives for effectiveness in achieving their risk managementobjectives.
42
The fair value of derivatives in a gain position is presented on the consolidated balance sheet in derivatives and otherinvested assets in portfolio investments and in cash and investments of the holding company. The fair value ofderivatives in a loss position and obligations to purchase securities sold short, if any, are presented on theconsolidated balance sheet in short sale and derivative obligations. The initial premium paid for a derivativecontract, if any, would be recorded as a derivative asset and subsequently adjusted for changes in the fair value of thecontract at each balance sheet date. Changes in the fair value of a derivative are recorded as net gains (losses) oninvestments in the consolidated statement of earnings at each balance sheet date, with a corresponding adjustmentto the carrying value of the derivative asset or liability.
Cash received from counterparties as collateral for derivative contracts is recognized within holding company cashand investments or subsidiary cash and short term investments, and a corresponding liability is recognized withinaccounts payable and accrued liabilities. Securities received from counterparties as collateral are not recordedas assets.
Cash and securities delivered to counterparties as collateral for derivative contracts continue to be reflected as assetson the consolidated balance sheet within holding company cash and investments or within portfolio investments asassets pledged for short sale and derivative obligations.
Equity contracts – The company’s long equity total return swaps allow the company to receive the total return on anotional amount of an equity index or individual equity (including dividends and capital gains or losses) inexchange for the payment of a floating rate of interest on the notional amount. Conversely, short equity total returnswaps allow the company to pay the total return on a notional amount of an equity index or individual equity inexchange for the receipt of a floating rate of interest on the notional amount. The company classifies dividends andinterest paid or received related to its long and short equity and equity index total return swaps on a net basis asinterest and dividends in the consolidated statement of earnings. The company’s equity and equity index totalreturn swaps contain contractual reset provisions requiring counterparties to cash-settle monthly or quarterly anyfair value movements arising subsequent to the prior settlement. Any cash amounts paid to settle unfavourable fairvalue changes and, conversely, any cash amounts received in settlement of favourable fair value changes, arerecorded as net gains (losses) on investments in the consolidated statement of earnings. To the extent that acontractual reset date of a contract does not correspond to the balance sheet date, the company records net gains(losses) on investments in the consolidated statement of earnings to adjust the carrying value of the derivative assetor liability associated with each total return swap contract to reflect its fair value at the balance sheet date. Final cashsettlements of total return swaps are recognized as net gains (losses) on investments net of any previously recordedunrealized fair value changes since the last quarterly reset date. Total return swaps require no initial net investmentand have a fair value of nil at inception.
CPI-linked derivative contracts – The company’s derivative contracts referenced to consumer price indexes (‘‘CPI’’) inthe geographic regions in which it operates serve as an economic hedge against the potential adverse financialimpact on the company of decreasing price levels. These contracts may be structured to provide a payout at maturityif there is cumulative deflation over the life of the contract or if cumulative average inflation is below a specified floorrate over the life of the contract. As the average remaining life of a CPI-linked derivative declines, the fair value of thecontract (excluding the impact of changes in the underlying CPI) will generally decline.
Determination of fair value – Fair values for substantially all of the company’s financial instruments aremeasured using market or income approaches. Considerable judgment may be required in interpreting market dataused to develop estimates of fair value. Accordingly, actual values realized in future market transactions may differfrom the estimates presented in these consolidated financial statements. The use of different market assumptionsand/or valuation methodologies may have a material effect on the estimated fair values. The fair values of financialinstruments are based on bid prices for financial assets and ask prices for financial liabilities. The companycategorizes its fair value measurements using a three level hierarchy in accordance with IFRS (‘‘fair value hierarchy’’)as described below:
Level 1 – Inputs represent unadjusted quoted prices for identical instruments exchanged in active markets. Thefair values of securities sold short, the majority of the company’s common stocks, equity call options and certainwarrants are based on published quotes in active markets.
Level 2 – Inputs include directly or indirectly observable inputs (other than Level 1 inputs) such as quoted pricesfor similar financial instruments exchanged in active markets, quoted prices for identical or similar financialinstruments exchanged in inactive markets and other market observable inputs. The fair value of the vast
43

FAIRFAX FINANCIAL HOLDINGS LIMITED
majority of the company’s investments in bonds are priced based on information provided by independentpricing service providers while much of the remainder, along with most derivative contracts (including totalreturn swaps, U.S. treasury bond forward contracts and certain warrants) are based primarily on non-bindingthird party broker-dealer quotes that are prepared using Level 2 inputs. Where third party broker-dealer quotesare used, typically one quote is obtained from a broker-dealer with particular expertise in the instrument beingpriced. Preferred stocks are priced using a combination of independent pricing service providers and internalvaluation models that rely on directly or indirectly observable inputs.
The fair values of investments in certain limited partnerships classified as common stocks on the consolidatedbalance sheet are based on the net asset values received from the general partner, adjusted for liquidity asrequired and are classified as Level 2 when they may be liquidated or redeemed within three months or less ofproviding notice to the general partner. Otherwise, such investments in limited partnerships are classified asLevel 3.
Level 3 – Inputs include unobservable inputs used in the measurement of financial instruments. Management isrequired to use its own assumptions regarding unobservable inputs as there is little, if any, market activity inthese instruments or related observable inputs that can be corroborated at the measurement date. CPI-linkedderivatives are classified as Level 3 and valued using broker-dealer quotes which management has determinedutilize market observable inputs except for the inflation volatility input which is not market observable.
Transfers between fair value hierarchy categories are considered effective from the beginning of the reporting periodin which the transfer is identified.
Valuation techniques used by the company’s independent pricing service providers and third party broker-dealersinclude use of prices from similar instruments where observable market prices exist, discounted cash flow analysis,option pricing models, and other valuation techniques commonly used by market participants. The companyassesses the reasonableness of pricing received from these third party sources by comparing the fair values received torecent transaction prices for similar assets where available, to industry accepted discounted cash flow models (thatincorporate estimates of the amount and timing of future cash flows and market observable inputs such as creditspreads and discount rates) and to option pricing models (that incorporate market observable inputs including thequoted price, volatility and dividend yield of the underlying security and the risk free rate).
Fair values of CPI-linked derivative contracts received from third party broker-dealers are assessed by comparing thefair values to recent market transactions where available and values determined using third party pricing softwarebased on the Black-Scholes option pricing model for European-style options that incorporates market observable andunobservable inputs such as the current value of the relevant CPI underlying the derivative, the inflation swap rate,nominal swap rate and inflation volatility. The fair values of CPI-linked derivative contracts are sensitive toassumptions such as market expectations of future rates of inflation and related inflation volatilities.
The company employs dedicated personnel responsible for the valuation of its investment portfolio. Detailedvaluations are performed for those financial instruments that are priced internally, while external pricing receivedfrom independent pricing service providers and third party broker-dealers are evaluated by the company forreasonableness. The company’s Chief Financial Officer oversees the valuation function and regularly reviewsvaluation processes and results, including at each quarterly reporting period. Significant valuation matters,particularly those requiring extensive judgment, are communicated to the company’s Audit Committee.
Accounts receivable and accounts payableAccounts receivable and accounts payable are recognized initially at fair value. Due to their short-term nature,carrying value is considered to approximate fair value.
Insurance contractsInsurance contracts are those contracts that have significant insurance risk at the inception of the contract.Insurance risk arises when the company agrees to compensate a policyholder if a specified uncertain future eventadversely affects the policyholder, with the possibility of paying (including variability in timing of payments)significantly more in a scenario where the insured event occurs than when it does not occur. Contracts not meetingthe definition of an insurance contract under IFRS are classified as investment contracts, derivative contracts orservice contracts, as appropriate.
44

Revenue recognition – Premiums written are deferred as unearned premiums and recognized as revenue, net ofpremiums ceded, on a pro rata basis over the terms of the underlying policies. Net premiums earned are reportedgross of premium taxes which are included in operating expenses as the related premiums are earned. Certainreinsurance premiums are estimated at the individual contract level, based on historical patterns and experiencefrom the ceding companies for contracts where reports from ceding companies for the period are not contractuallydue until after the balance sheet date. The cost of reinsurance purchased by the company (premiums ceded) isincluded in recoverable from reinsurers and is amortized over the contract period in proportion to the amount ofinsurance protection provided. Unearned premium represents the portion of premiums written relating to periods ofinsurance and reinsurance coverage subsequent to the balance sheet date. Impairment losses on insurance premiumsreceivable are included in operating expenses in the consolidated statement of earnings.
Deferred premium acquisition costs – Certain costs of acquiring insurance contracts, consisting of brokers’commissions and premium taxes, are deferred and charged to earnings as the related premiums are earned. Deferredpremium acquisition costs are limited to their estimated realizable value based on the related unearned premium,which considers anticipated losses and loss adjustment expenses and estimated remaining costs of servicing thebusiness based on historical experience. The ultimate recoverability of deferred premium acquisition costs isdetermined without regard to investment income. Brokers’ commissions are included in commissions, net, in theconsolidated statement of earnings. Premium taxes and impairment losses on deferred premium acquisition costs areincluded in operating expenses in the consolidated statement of earnings.
Provision for losses and loss adjustment expenses – The company is required by applicable insurance laws,regulations and Canadian accepted actuarial practice to establish reserves for payment of losses and loss adjustmentexpenses that arise from the company’s general insurance and reinsurance products and its run-off operations. Thesereserves are based on assumptions that represent the best estimates of possible outcomes aimed at evaluating theexpected ultimate cost to settle claims occurring prior to, but still outstanding as of, the balance sheet date. Thecompany establishes its reserves by product line, type and extent of coverage and year of occurrence. Loss reservesfall into two categories: reserves for reported losses (case reserves) and reserves for incurred but not reported (‘‘IBNR’’)losses. Additionally, reserves are held for loss adjustment expenses, which include the estimated legal and otherexpenses expected to be incurred to finalize the settlement of the losses. Losses and loss adjustment expenses arecharged to losses on claims, gross, in the consolidated statement of earnings.
The company’s reserves for reported losses and loss adjustment expenses are based on estimates of future paymentsto settle reported general insurance and reinsurance claims and claims from its run-off operations. Case reserveestimates are based on the facts available at the time the reserves are established and for reinsurance, based on reportsand individual case reserve estimates received from ceding companies. The company establishes these reserves on anundiscounted basis to recognize the estimated costs of bringing pending claims to final settlement, taking intoaccount inflation, as well as other factors that can influence the amount of reserves required, some of which aresubjective and some of which are dependent on future events. In determining the level of reserves, the companyconsiders historical trends and patterns of loss payments, pending levels of unpaid claims and types of coverage. Inaddition, court decisions, economic conditions and public attitudes may affect the ultimate cost of settlement and,as a result, the company’s estimation of reserves. Between the reporting and final settlement of a claim,circumstances may change, which would result in changes to established reserves. Items such as changes in law andinterpretations of relevant case law, results of litigation, changes in medical costs, as well as costs of vehicle andbuilding repair materials and labour rates can substantially impact ultimate settlement costs. Accordingly, thecompany regularly reviews and re-evaluates case reserves. Any resulting adjustments are included in the consolidatedstatement of earnings in the period the adjustment is made. Amounts ultimately paid for losses and loss adjustmentexpenses can vary significantly from the level of reserves originally set or currently recorded.
The company also establishes reserves for IBNR claims on an undiscounted basis to recognize the estimated finalsettlement cost for loss events which have already occurred but which have not yet been reported. Historicalinformation and statistical models, based on product line, type and extent of coverage, as well as reported claimtrends, claim severities, exposure growth, and other factors, are relied upon to estimate IBNR reserves. Theseestimates are revised as additional information becomes available and as claims are actually reported and paid.
Estimation techniques – Provisions for losses and loss adjustment expenses and provisions for unearnedpremiums are determined based upon previous claims experience, knowledge of events, the terms and conditions ofthe relevant policies and on interpretation of circumstances. Particularly relevant is experience with similar cases andhistorical claims payment trends. The approach also includes consideration of the development of loss payment
45

FAIRFAX FINANCIAL HOLDINGS LIMITED
trends, the potential longer term significance of large events, the levels of unpaid claims, legislative changes, judicialdecisions and economic and political conditions.
Where possible the company applies several commonly accepted actuarial projection methodologies in estimatingrequired provisions to give greater insight into the trends inherent in the data being projected. These includemethods based upon the following: the development of previously settled claims, where payments to date areextrapolated for each prior year; estimates based upon a projection of numbers of claims and average cost; notifiedclaims development, where notified claims to date for each year are extrapolated based upon observed developmentof earlier years; and, expected loss ratios. In addition, the company uses other techniques such as aggregatebenchmarking methods for specialist classes of business. In selecting its best estimate, the company considers theappropriateness of the methods to the individual circumstances of the line of business and accident orunderwriting year.
Large claims impacting each relevant line of business are generally assessed separately, being measured either at theface value of the loss adjusters’ estimates or projected separately in order to allow for the future development oflarge claims.
Provisions for losses and loss adjustment expenses are calculated gross of any reinsurance recoveries. A separateestimate is made of the amounts that will be recoverable from reinsurers based upon the gross provisions and havingdue regard to collectability.
The provisions for losses and loss adjustment expenses are subject to review at the subsidiary level by subsidiaryactuaries, at the corporate level by the company’s Chief Risk Officer and by independent third party actuaries. Inaddition, for major classes of business where the risks and uncertainties inherent in the provisions are greatest, adhoc detailed reviews are undertaken by internal and external advisers who are able to draw upon their specialistexpertise and a broader knowledge of current industry trends in claims development. The results of these reviews areconsidered when establishing the appropriate levels of provisions for losses and loss adjustment expenses andunexpired risks.
ReinsuranceReinsurance does not relieve the originating insurer of its liability and is reflected on the consolidated balance sheeton a gross basis to indicate the extent of credit risk related to reinsurance and the obligations of the insurer to itspolicyholders. Reinsurance assets include balances due from reinsurance companies for paid and unpaid losses andloss adjustment expenses and ceded unearned premiums. Amounts recoverable from reinsurers are estimated in amanner consistent with the claim liability associated with the reinsured policy. Reinsurance is recorded gross on theconsolidated balance sheet unless a legal right to offset against a liability owing to the same reinsurer exists.
Ceded premiums and losses are recorded in the consolidated statement of earnings in premiums ceded to reinsurersand losses on claims ceded to reinsurers respectively and in recoverable from reinsurers on the consolidated balancesheet. Commission income earned on premiums ceded to reinsurers is included in commissions, net in theconsolidated statement of earnings. Unearned premiums are reported before reduction for premiums ceded toreinsurers and the reinsurers’ portion is classified with recoverable from reinsurers on the consolidated balance sheetalong with the estimates of the reinsurers’ shares of provision for claims determined on a basis consistent with therelated claims liabilities.
Impairment – Reinsurance assets are assessed regularly for any events that may trigger impairment, including legaldisputes with third parties, changes in capital, surplus levels and in credit ratings of a counterparty, and historicexperience regarding collectability from specific reinsurers. If there is objective evidence that a reinsurance asset isimpaired, the carrying amount of the asset is reduced to its recoverable amount by recording a provision foruncollectible reinsurance in the consolidated statement of earnings.
Risk transfer – Reinsurance contracts are assessed to ensure that insurance risk is transferred by the ceding orassuming company to the reinsurer. Those contracts that do not transfer insurance risk are accounted for using thedeposit method whereby a deposit asset or liability is recognized based on the consideration paid or received less anyexplicitly identified premiums or fees to be retained by the ceding company.
Premiums – Premiums payable in respect of reinsurance ceded are recognized on the consolidated balance sheet inthe period in which the reinsurance contract is entered into and include estimates for contracts in force which havenot yet been finalized. Premiums ceded are recognized in the consolidated statement of earnings over the period ofthe reinsurance contract.
46

Income taxesThe provision for income taxes for the period comprises current and deferred income tax. Income taxes arerecognized in the consolidated statement of earnings, except when related to items recognized in othercomprehensive income or directly in equity. In those cases, the income taxes are also recognized in othercomprehensive income or directly in equity, respectively.
Current income tax is calculated on the basis of the tax laws enacted or substantively enacted at the end of thereporting period in the countries where the company’s subsidiaries and associates operate and generatetaxable income.
Deferred income tax is calculated under the liability method whereby deferred income tax assets and liabilities arerecognized for temporary differences between the financial statement carrying amounts of assets and liabilities andtheir respective income tax bases at current substantively enacted tax rates. With the exception of initial recognitionof deferred income tax arising from business combinations, changes in deferred income tax associated withcomponents of other comprehensive income are recognized in other comprehensive income while all other changesin deferred income tax are included in the provision for income taxes in the consolidated statement of earnings.
Deferred income tax assets are recognized to the extent that it is probable that future taxable profits will be availableagainst which the temporary differences can be utilized. Carry forwards of unused losses or unused tax credits are taxeffected and recognized as deferred tax assets when it is probable that future taxable profits will be available againstwhich these losses or tax credits can be utilized.
Deferred income tax is not recognized on unremitted earnings of subsidiaries where the company has determined itis not probable those earnings will be repatriated in the foreseeable future.
Current and deferred income tax assets and liabilities are offset when the income taxes are levied by the sametaxation authority and there is a legally enforceable right of offset.
On December 22, 2017 the United States enacted the Tax Cuts and Jobs Act (‘‘U.S. tax reform’’) that, among otherchanges, introduced a new minimum base erosion and anti-abuse tax (‘‘BEAT’’) on certain payments to foreignaffiliates and a U.S. tax on foreign earnings for certain global intangible low-taxed income (‘‘GILTI’’), applicable toU.S. corporate income tax for tax years beginning after December 31, 2017. The company will recognize chargesrelated to BEAT and GILTI, if any, in the periods in which they are incurred, and does not include their impacts inmeasuring its net deferred income tax asset.
Investment propertyReal estate held by the company for investment purposes, such as capital appreciation or long-term rental yield, isinitially recorded at cost (including transaction costs) and subsequently carried at historical cost less accumulatedamortization and any accumulated impairment losses. On the consolidated balance sheet investment property heldis included in portfolio investments by the insurance and reinsurance companies and in other assets by thenon-insurance companies. Investment property rental income and gains or losses on disposal are recorded in theconsolidated statement of earnings as interest and dividends and net gains (losses) on investments respectively bythe insurance and reinsurance companies, and as other revenue by the non-insurance companies.
Other assetsOther assets consist of inventories, receivables and investment properties of non-insurance companies included inthe Other reporting segment, premises and equipment, accrued interest and dividends, income taxes refundable,receivables for securities sold, pension assets, deferred compensation assets, prepaid expenses and othermiscellaneous receivables.
Premises and equipment – Premises and equipment is recorded at historical cost less accumulated amortizationand any accumulated impairment losses. The company reviews premises and equipment for impairment whenevents or changes in circumstances indicate that the carrying value may not be recoverable. The cost of premises andequipment is depreciated on a straight-line basis over the asset’s estimated useful life and charged to operatingexpenses in the consolidated statement of earnings.
47

FAIRFAX FINANCIAL HOLDINGS LIMITED
Other revenue and expensesRevenue from the sale of hospitality, travel and other non-insurance products and services are recognized when theprice is fixed or determinable, collection is reasonably assured and the product or service has been delivered to thecustomer. The revenue and related cost of inventories sold or services provided are recorded in other revenue andother expenses respectively in the consolidated statement of earnings.
BorrowingsBorrowings are initially recognized at fair value, net of transaction costs incurred, and subsequently carried atamortized cost. Interest expense on borrowings is recognized in the consolidated statement of earnings using theeffective interest rate method.
EquityCommon stock issued by the company is classified as equity when there is no contractual obligation to transfer cashor other financial assets to the holder of the shares. Incremental costs directly attributable to the issue or repurchasefor cancellation of equity instruments are recognized in equity, net of tax.
Treasury shares are equity instruments reacquired by the company which have not been cancelled and are deductedfrom equity on the consolidated balance sheet, irrespective of the objective of the transaction. The company acquiresits own subordinate voting shares on the open market for its share-based payment awards. No gain or loss isrecognized in the consolidated statement of earnings on the purchase, sale, issue or cancellation of treasury shares.Consideration paid or received is recognized directly in equity.
Dividends and other distributions to holders of the company’s equity instruments are recognized directly in equity.
Share-based paymentsThe company has restricted share plans or equivalent for management of the holding company and its subsidiarieswith vesting periods of up to ten years from the date of grant. The fair value of restricted share awards on the grantdate is amortized to compensation expense over the vesting period, with a corresponding increase in the share-basedpayments equity reserve. At each balance sheet date, the company reviews its estimates of the number of restrictedshare awards expected to vest.
Net earnings per share attributable to shareholders of FairfaxNet earnings (loss) per share – Basic net earnings (loss) per share is calculated by dividing the net earnings (loss)attributable to shareholders of Fairfax, after the deduction of preferred share dividends declared and the excess overstated value of preferred shares purchased for cancellation, by the weighted average number of subordinate andmultiple voting shares issued and outstanding during the period, excluding subordinate voting shares purchased bythe company and held as treasury shares.
Net earnings (loss) per diluted share – Diluted earnings (loss) per share is calculated by adjusting the weightedaverage number of subordinate and multiple voting shares outstanding during the period for the dilutive effect, ifany, of share-based payments.
Pensions and post retirement benefitsThe company’s subsidiaries have a number of arrangements in Canada, the United States, the United Kingdom andcertain other jurisdictions that provide pension and post retirement benefits to retired and current employees. Theholding company has no such arrangements or plans. Pension arrangements of the subsidiaries include definedbenefit statutory pension plans, as well as supplemental arrangements that provide pension benefits in excess ofstatutory limits. These plans are a combination of defined benefit plans and defined contribution plans. The assets ofthese plans are held separately from the company’s general assets in separate pension funds and invested principallyin high quality fixed income securities and cash and short term investments. Certain of the company’s postretirement benefit plans covering medical care and life insurance are internally funded.
Defined contribution plan – A defined contribution plan is a pension plan under which the company pays fixedcontributions. Contributions to defined contribution pension plans are charged to operating expenses in the periodin which the employment services qualifying for the benefit are provided. The company has no further paymentobligations once the contributions have been paid.
48

Defined benefit plan – A defined benefit plan is a plan that defines an amount of pension or other post retirementbenefit that an employee will receive on retirement, usually dependent on one or more factors such as age, years ofservice and salary. Actuarial valuations of benefit liabilities for the majority of pension and post retirement benefitplans are performed each year using the projected benefit method prorated on service, based on management’sassumptions.
Defined benefit obligations, net of the fair value of plan assets, and adjusted for pension asset limitations, if any, areaccrued on the consolidated balance sheet in accounts payable and accrued liabilities (note 14). Plans in a net assetposition, subject to any minimum funding requirements, are recognized in other assets (note 13).
Defined benefit expense recognized in the consolidated statement of earnings includes the net interest on the netdefined benefit liability (asset) calculated using a discount rate based on market yields on high quality bonds, pastservice costs arising from plan amendments or curtailments and gains or losses on plan settlements.
Re-measurements, consisting of actuarial gains and losses on plan liabilities, the actual return on plan assets(excluding the net interest component) and any change in asset limitation amounts, are recognized in othercomprehensive income and subsequently included in accumulated other comprehensive income. Thesere-measurements will not be recycled to the consolidated statement of earnings in the future, but are reclassified toretained earnings upon settlement of the plan or disposal of the related subsidiary.
Operating leasesThe company and its subsidiaries are lessees under various operating leases relating to premises, automobiles andequipment. Payments made under an operating lease, net of any incentives received from the lessor, are recorded inoperating expenses on a straight-line basis over the term of the lease.
New accounting pronouncements adopted in 2017The company adopted the following amendments, effective January 1, 2017. These changes were adopted inaccordance with the applicable transitional provisions of each amendment, and did not have a significant impact onthe consolidated financial statements.
IFRS Annual Improvements 2014-2016In December 2016 the IASB issued an amendment to clarify the scope of the disclosure requirements in IFRS 12Disclosure of Interests in Other Entities.
Recognition of Deferred Tax Assets for Unrealised Losses (Amendments to IAS 12)In January 2016 the IASB issued amendments to IAS 12 Income Taxes to clarify the requirements on recognition ofdeferred income tax assets for unrealized losses.
Disclosure Initiative (Amendments to IAS 7)In January 2016 the IASB issued amendments to IAS 7 Statement of Cash Flows that require additional disclosures forcash and non-cash changes in liabilities arising from financing activities.
New accounting pronouncements issued but not yet effectiveThe following new standards have been issued by the IASB and were not yet effective for the fiscal year beginningJanuary 1, 2017. The company is currently evaluating their impact on its consolidated financial statements and doesnot expect to adopt any of them in advance of their respective effective dates.
Foreign Currency Transactions and Advance Consideration (‘‘IFRIC 22’’)In December 2016 the IASB issued an interpretation by the IFRS Interpretations Committee to clarify the accountingfor transactions that include the receipt or payment of advance consideration in a foreign currency. IFRIC 22 iseffective for annual periods beginning on or after January 1, 2018, with a choice of prospective or retrospectiveapplication. Adoption of IFRIC 22 is not expected to have a significant impact on the company’s consolidatedfinancial statements.
Classification and Measurement of Share-based Payment Transactions (Amendments to IFRS 2)In June 2016 the IASB issued narrow-scope amendments to clarify the classification and measurement requirementsof IFRS 2 Share-based Payment. The amendments are effective for annual periods beginning on or after January 1,
49

FAIRFAX FINANCIAL HOLDINGS LIMITED
2018, with prospective application in accordance with certain transitional provisions. Adoption of the amendmentsis not expected to have a significant impact on the company’s consolidated financial statements.
IFRS 9 Financial Instruments (‘‘IFRS 9’’)In July 2014 the IASB issued the complete version of IFRS 9 which will supersede the 2010 version of IFRS 9 currentlyapplied by the company (‘‘IFRS 9 (2010)’’). IFRS 9 is effective for annual periods beginning on or after January 1,2018, with retrospective application, and includes requirements for the classification and measurement of financialassets and liabilities, an expected credit loss model that replaces the existing incurred loss impairment model, andnew hedge accounting guidance. The company is nearing completion of its analysis of IFRS 9’s accountingrequirements and has determined that its current classifications of equity investments, derivatives, financialliabilities and hedge of net investment under IFRS 9 (2010) will remain substantially unchanged. The companycontinues to monitor and consider evolving guidance and interpretations related to IFRS 9 as it works through theclassification analysis for its investments in debt instruments.
IFRS 15 Revenue from Contracts with Customers (‘‘IFRS 15’’)In May 2014 the IASB issued IFRS 15 which introduces a single model for recognizing revenue from contracts withcustomers. IFRS 15 excludes insurance contracts and financial instruments from its scope and is applicable primarilyto the company’s non-insurance companies. In April 2016 the IASB issued amendments to clarify certain aspects ofIFRS 15 and to provide additional practical expedients upon transition. The standard is effective for annual periodsbeginning on or after January 1, 2018, with retrospective application. The company has substantially completed itsanalysis of the accounting requirements under IFRS 15 and does not expect the adoption of IFRS 15 to have asignificant impact on the company’s consolidated financial statements or to require any significant transitionadjustments.
IFRS 16 Leases (‘‘IFRS 16’’)In January 2016 the IASB issued IFRS 16 which largely eliminates the distinction between finance and operatingleases for lessees. With limited exceptions, a lessee will be required to recognize a right-of-use asset and a liability forits obligation to make lease payments. The standard is effective for annual periods beginning on or after January 1,2019, with a choice of modified retrospective or full retrospective application. The company has commenced impactassessments and reviews of lease data at its operating companies in preparation for the adoption of IFRS 16.
IFRIC Interpretation 23 Uncertainty over Income Tax Treatments (‘‘IFRIC 23’’)In June 2017 the IASB issued IFRIC 23 to clarify how the requirements of IAS 12 Income Taxes should be applied whenthere is uncertainty over income tax treatments. The interpretation is effective for annual periods beginning on orafter January 1, 2019, with modified retrospective or retrospective application. Adoption of IFRIC 23 is not expectedto have a significant impact on the company’s consolidated financial statements.
IFRS Annual Improvements 2015-2017In December 2017 the IASB issued amendments to clarify the requirements of four IFRS standards. The amendmentsare effective for annual periods beginning on or after January 1, 2019, primarily with prospective application.Adoption of the amendments is not expected to have a significant impact on the company’s consolidated financialstatements.
IFRS 17 Insurance Contracts (‘‘IFRS 17’’)In May 2017 the IASB issued IFRS 17, a comprehensive standard that establishes principles for the recognition,measurement, presentation and disclosure of insurance contracts. The measurement approach is based on thefollowing: (i) a current, unbiased probability-weighted estimate of future cash flows expected to arise as the insurerfulfills the contract; (ii) the effect of the time value of money; (iii) a risk adjustment that measures the effects ofuncertainty about the amount and timing of future cash flows; and (iv) a contractual service margin whichrepresents the unearned profit in a contract (that is recognized in net earnings as the insurer fulfills its performanceobligations under the contract). Estimates are required to be re-measured each reporting period. In addition, asimplified measurement approach is permitted for short-duration contracts in which the coverage period isapproximately one year or less. The standard is effective for annual periods beginning on or after January 1, 2021,with retrospective application and some practical expedients available on adoption. The company has commencedimplementation planning, education workshops and impact assessments at its largest insurance and reinsurancecompanies in preparation for the adoption of IFRS 17.
50

4. Critical Accounting Estimates and Judgments
In the preparation of the company’s consolidated financial statements, management has made a number of criticalaccounting estimates and judgments which are discussed below, with the exception of the determination of fairvalue for financial instruments (notes 3 and 5), carrying value of associates (notes 3 and 6), charges related to U.S. taxreform (note 18) and contingencies (note 20). Estimates and judgments are continually evaluated and are based onhistorical experience and other factors, including expectations of future events that are believed to be reasonableunder the circumstances.
Provision for losses and loss adjustment expensesProvisions for losses and loss adjustment expenses are estimated based on Canadian accepted actuarial practices,which are designed to ensure the company establishes an appropriate reserve on the consolidated balance sheet tocover insured losses with respect to reported and unreported claims incurred as of the end of each accounting periodand related claims expenses. The assumptions underlying the estimation of provisions for losses and loss adjustmentexpenses are reviewed and updated by the company on an ongoing basis to reflect recent and emerging trends inexperience and changes in the risk profile of the business. The estimation techniques employed by the company indetermining provisions for losses and loss adjustment expenses and the inherent uncertainties associated withinsurance contracts are described in the ‘‘Underwriting Risk’’ section of note 24 while the historic development ofthe company’s insurance liabilities are presented in note 8.
Recoverability of deferred income tax assetsIn determining the recoverability of deferred income tax assets, management exercises judgment in assessing recentand expected profitability of applicable operating companies and their ability to utilize any recorded income taxassets. The company reviews its deferred income tax assets quarterly, taking into consideration the availability ofsufficient current and projected taxable profits, reversals of taxable temporary differences and tax planningstrategies. Details of deferred income tax assets are presented in note 18.
Business combinationsJudgment may be required to determine whether a transaction qualifies as a business combination when it involveselements such as contractual arrangements between shareholders or potential voting rights. Accounting for businesscombinations requires fair values to be estimated for the consideration transferred, assets acquired and liabilitiesassumed. The company uses all available information, including external valuations and appraisals whereappropriate, to determine these fair values. Changes in estimates of fair value due to additional information relatedto facts and circumstances that existed at the acquisition date would impact the amount of goodwill (or gain onbargain purchase) recognized. If necessary, the company has up to one year from the acquisition date to finalize thedetermination of fair values for a business combination. Details of business combinations are presented in note 23.
Assessment of goodwill for potential impairmentGoodwill is assessed annually for impairment or more frequently if there are potential indicators of impairment.Management estimates the recoverable amount of each of the company’s cash-generating units using one or moregenerally accepted valuation techniques, which requires the making of a number of assumptions, includingassumptions about future revenue, net earnings, corporate overhead costs, capital expenditures, cost of capital, andgrowth rate. The recoverable amount of each cash-generating unit to which goodwill has been assigned is comparedto its carrying value (inclusive of assigned goodwill). If the recoverable amount of a cash-generating unit isdetermined to be less than its carrying value, the excess is recognized as a goodwill impairment loss in theconsolidated statement of earnings. Given the variability of future-oriented financial information, goodwillimpairment tests are subjected to sensitivity analysis. The critical estimates pertain to those cash-generating unitswhere there is little difference between the recoverable amount and the related carrying amount. Details of goodwillare presented in note 12.
51

FAIRFAX FINANCIAL HOLDINGS LIMITED
5. Cash and Investments
Holding company cash and investments, portfolio investments and short sale and derivative obligations areclassified as FVTPL, except for investments in associates and other invested assets which are classified as other, andare shown in the table below:
December 31, December 31,2017 2016
Holding companyCash and cash equivalents (note 27) 995.4 533.2Short term investments 115.4 285.4Bonds 380.9 264.8Preferred stocks 2.8 1.0Common stocks(1) 784.9 153.2Derivatives (note 7) 11.2 39.6
2,290.6 1,277.2
Assets pledged for short sale and derivative obligations:Short term investments 77.8 82.6Bonds – 11.8
77.8 94.4
2,368.4 1,371.6Short sale and derivative obligations (note 7) (11.5) (42.2)
2,356.9 1,329.4
Portfolio investmentsCash and cash equivalents (note 27) 7,384.1 3,943.4Short term investments 9,998.4 5,994.6Bonds 9,164.1 9,323.2Preferred stocks 296.8 69.6Common stocks(1) 4,838.7 4,158.8Investments in associates (note 6) 2,487.0 2,393.0Derivatives (note 7) 192.6 163.7Other invested assets 62.8 16.0
34,424.5 26,062.3
Assets pledged for short sale and derivative obligations:Cash and cash equivalents (note 27) 16.8 –Short term investments 145.7 189.6Bonds 32.2 38.9
194.7 228.5
Fairfax India cash, portfolio investments and associates 1,762.5 1,002.6Fairfax Africa cash, portfolio investments and associates 631.5 –
2,394.0 1,002.6
37,013.2 27,293.4Short sale and derivative obligations (note 7) (114.7) (192.1)
36,898.5 27,101.3
Total investments 39,255.4 28,430.7
(1) Common stocks include investments in limited partnerships and other funds with carrying values of $1,903.7 and $90.9respectively at December 31, 2017 (December 31, 2016 – $1,171.6 and $157.1).
52

Fairfax India and Fairfax Africa cash, portfolio investments and associates were comprised as follows:
Fairfax India Fairfax Africa
December 31, December 31, December 31, December 31,2017 2016 2017 2016
Cash and cash equivalents (note 27) 44.0 173.2 329.7 –Short term investments 34.3 33.6 57.2 –Bonds 694.2 528.8 19.4 –Common stocks 40.5 26.5 4.9 –Investments in associates (note 6) 949.5 240.5 219.8 –Derivatives and other invested assets – – 0.5 –
1,762.5 1,002.6 631.5 –
Restricted cash and cash equivalents at December 31, 2017 of $835.0 (December 31, 2016 – $430.7) was comprisedprimarily of amounts required to be maintained on deposit with various regulatory authorities to support thesubsidiaries’ insurance and reinsurance operations. Restricted cash and cash equivalents are included on theconsolidated balance sheet in holding company cash and investments, or in portfolio investments within subsidiarycash and short term investments, assets pledged for short sale and derivative obligations and Fairfax India and FairfaxAfrica cash, portfolio investments and associates.
The company’s subsidiaries have pledged cash and investments, inclusive of trust funds and regulatory deposits, assecurity for their own obligations to pay claims or make premium payments (these pledges are either direct or tosupport letters of credit). In order to write insurance business in certain jurisdictions (primarily U.S. states) thecompany’s subsidiaries must deposit funds with local insurance regulatory authorities to provide security for futureclaims payments as ultimate protection for the policyholder. Additionally, some of the company’s subsidiariesprovide reinsurance to primary insurers, for which funds must be posted as security for losses that have been incurredbut not yet paid. These pledges are in the normal course of business and are generally released when the paymentobligation is fulfilled.
The table that follows summarizes assets pledged to third parties by the nature of the pledge requirement (excludingassets pledged in favour of Lloyd’s (note 20), for short sale and derivative obligations and for certain intercompanyreinsurance arrangements). Pledged assets primarily consist of cash and fixed income securities within portfolioinvestments on the consolidated balance sheets.
December 31, December 31,2017 2016
Regulatory deposits 4,256.8 4,748.2Security for reinsurance and other 1,449.2 732.8
5,706.0 5,481.0
53

FAIRFAX FINANCIAL HOLDINGS LIMITED
Fixed Income Maturity ProfileBonds are summarized by their earliest contractual maturity date in the table below. Actual maturities may differfrom maturities shown below due to the existence of call and put features. At December 31, 2017 bonds containingcall and put features represented approximately $3,390.3 and $93.3 respectively (December 31, 2016 – $4,498.0 and$196.2) of the total fair value of bonds. The table below does not reflect the impact of $1,693.8 (December 31, 2016 –$3,013.4) notional amount of U.S. treasury bond forward contracts (described in note 7) that reduce the company’sexposure to interest rate risk.
December 31, 2017 December 31, 2016
Amortized Fair Amortized Faircost value cost value
Due in 1 year or less 3,383.9 3,537.6 1,649.4 1,779.0Due after 1 year through 5 years 3,540.7 3,720.2 3,245.9 3,447.6Due after 5 years through 10 years 1,017.6 1,054.3 1,046.7 1,031.3Due after 10 years 1,872.1 1,978.7 3,575.1 3,909.6
9,814.3 10,290.8 9,517.1 10,167.5
Effective interest rate 4.0% 4.7%
The calculation of the effective interest rate of 4.0% (December 31, 2016 – 4.7%) is on a pre-tax basis and thereforedoes not give effect to the favourable tax treatment which the company expects to receive with respect to its taxadvantaged U.S. state and municipal bond investments of approximately $2.3 billion (December 31, 2016 –$3.3 billion).
54

Fair Value DisclosuresThe company’s use of quoted market prices (Level 1), valuation models with significant observable marketinformation as inputs (Level 2) and valuation models with significant unobservable information as inputs (Level 3)in the valuation of securities and derivative contracts by type of issuer was as follows:
December 31, 2017 December 31, 2016
Significant SignificantTotal fair other Significant Total fair other Significant
value Quoted observable unobservable value Quoted observable unobservableasset prices inputs inputs asset prices inputs inputs
(liability) (Level 1) (Level 2) (Level 3) (liability) (Level 1) (Level 2) (Level 3)
Cash and cash equivalents 8,770.0 8,770.0 – – 4,649.8 4,649.8 – –
Short term investments:
Canadian government 7.1 7.1 – – 8.2 8.2 – –
Canadian provincials 281.9 281.9 – – 261.7 261.7 – –
U.S. treasury 9,225.5 9,225.5 – – 5,930.3 5,930.3 – –
Other government 403.0 307.0 96.0 – 212.2 212.2 – –
Corporate and other 511.3 – 466.3 45.0 173.4 – 173.4 –
10,428.8 9,821.5 562.3 45.0 6,585.8 6,412.4 173.4 –
Bonds:
Canadian government 84.4 – 84.4 – 311.4 – 311.4 –
Canadian provincials 93.8 – 93.8 – 196.9 – 196.9 –
U.S. treasury 1,779.3 – 1,779.3 – 1,117.3 – 1,117.3 –
U.S. states and municipalities 2,452.1 – 2,452.1 – 4,732.2 – 4,732.2 –
Other government 1,799.4 – 1,799.4 – 1,176.2 – 1,176.2 –
Corporate and other 4,081.8 – 2,185.7 1,896.1 2,633.5 – 1,580.4 1,053.1
10,290.8 – 8,394.7 1,896.1 10,167.5 – 9,114.4 1,053.1
Preferred stocks:
Canadian 240.7 – 11.3 229.4 22.2 – 10.9 11.3
U.S. 5.0 – – 5.0 0.3 – – 0.3
Other 53.9 1.5 3.6 48.8 48.1 0.6 15.1 32.4
299.6 1.5 14.9 283.2 70.6 0.6 26.0 44.0
Common stocks:
Canadian 958.7 825.9 110.3 22.5 665.3 545.0 98.6 21.7
U.S. 1,583.3 474.8 66.9 1,041.6 1,172.6 629.6 33.9 509.1
Other funds 90.9 – 90.9 – 157.1 – 157.1 –
Other 3,036.1 1,713.7 415.1 907.3 2,343.5 1,037.2 532.5 773.8
5,669.0 3,014.4 683.2 1,971.4 4,338.5 2,211.8 822.1 1,304.6
Derivatives and other invested assets 267.1 – 89.5 177.6 219.3 – 121.5 97.8
Short sale and derivative obligations (126.2) – (126.2) – (234.3) – (234.3) –
Holding company cash andinvestments and portfolioinvestments measured at fair value 35,599.1 21,607.4 9,618.4 4,373.3 25,797.2 13,274.6 10,023.1 2,499.5
100.0% 60.7% 27.0% 12.3% 100.0% 51.5% 38.9% 9.6%
Investments in associates (note 6)(1) 4,629.3 2,004.3 45.3 2,579.7 3,267.3 1,100.1 40.9 2,126.3
(1) The carrying value of investments in associates is determined using the equity method of accounting so fair value ispresented separately in the table above.
55

FAIRFAX FINANCIAL HOLDINGS LIMITED
Transfers between fair value hierarchy levels are considered effective from the beginning of the reporting period inwhich the transfer is identified. The increase in the company’s Level 3 financial assets during 2017 was partially dueto the consolidation of certain Allied World investments in limited partnerships that were classified as Level 3common stocks ($583.8) based on their unobservable net asset values and inability to be liquidated or redeemedwithin three months. In addition, during 2017 a private placement debt security was transferred from Level 2 toLevel 3 due to the modification of its terms and its credit spread (a key valuation input) becoming unobservable.During 2017 and 2016 there were no significant transfers of financial instruments between Level 1 and Level 2and there were no other significant transfers of financial instruments in or out of Level 3 as a result of changes in theobservability of valuation inputs.
A summary of changes in Level 3 financial assets measured at fair value on a recurring basis for the years endedDecember 31 follows:
2017
Private Private DerivativesPrivate company Limited Private company and other
placement preferred partnerships equity common investeddebt securities shares and other funds shares assets Total
Balance – January 1 1,053.1 44.0 981.4 167.8 155.4 97.8 2,499.5Net realized and unrealized gains (losses) included in the
consolidated statement of earnings 190.2 1.3 243.4 (5.5) 22.6 (9.9) 442.1Purchases 430.2 268.4 221.2 – 11.1 72.3 1,003.2Sales and distributions (209.7) (34.1) (443.4) – (19.4) – (706.6)Acquisitions of subsidiaries (note 23) 22.4 – 583.8 – 29.9 9.7 645.8Transfer into category 384.0 – – – – 7.1 391.1Unrealized foreign currency translation gains on foreign
operations included in other comprehensive income 70.9 3.6 12.3 8.2 2.6 0.6 98.2
Balance – December 31 1,941.1 283.2 1,598.7 170.5 202.2 177.6 4,373.3
2016
Private Private DerivativesPrivate company Limited Private company and other
placement preferred partnerships equity common investeddebt securities shares and other funds shares assets Total
Balance – January 1 696.4 7.7 960.9 171.0 138.0 285.4 2,259.4Net realized and unrealized gains (losses) included in the
consolidated statement of earnings (52.9) 2.5 102.7 (12.5) (21.6) (204.4) (186.2)Purchases 955.6 115.7 124.4 16.4 38.8 21.1 1,272.0Sales and distributions (548.2) (82.5) (202.9) (10.2) – (4.9) (848.7)Transfer into category 9.4 0.4 – – – – 9.8Unrealized foreign currency translation gains (losses) on
foreign operations included in other comprehensiveincome (7.2) 0.2 (3.7) 3.1 0.2 0.6 (6.8)
Balance – December 31 1,053.1 44.0 981.4 167.8 155.4 97.8 2,499.5
56

The table below presents the valuation techniques, range of values applied for significant unobservable inputs andthe typical relationship between significant unobservable inputs and estimated fair values for the company’ssignificant Level 3 financial assets:
Carrying Input rangevalue at Effect on estimated fairused
December 31, Significant value if input value isAsset class 2017 Valuation technique unobservable input Low High increased(a)
Private placement debtsecurities(b)(1) 1,340.4 Discounted cash flow Credit spread 1.6% 18.9% Decrease
Private placement debtsecurities(b)(2) 402.0 Net asset valuation of Recoverability of assets 60.0% 100.0% Increase
secured loans
Limited partnerships andother(c)(3) 1,598.7 Net asset value Net asset value / Price N/A N/A Increase
Private company preferredshares(d)(4) 207.3 Discounted cash flow Credit spread 3.5% 3.6% Decrease
Private equity funds(c)(3) 100.9 Net asset value Net asset value / Price N/A N/A Increase
Private equity funds(c)(5) 69.6 Market comparable Price/Earnings 10.0 10.0 Increasemultiple
Private company commonshares(c)(5) 81.2 Market comparable Book value multiple 1.3 1.3 Increase
Private company commonshares(c)(5) 40.5 Market comparable Price/Earnings 26.2 26.2 Increase
multiple
Warrants(e)(6) 73.1 Option pricing model Equity volatility 24.6% 39.3% Increase
CPI-linked derivatives(e)(7) 39.6 Option pricing model Inflation volatility 0.0% 3.7% Increase
(a) Decreasing the input value would have the opposite effect on the estimated fair value.
(b) Classified within holding company cash and investments or bonds on the consolidated balance sheet.
(c) Classified within holding company cash and investments or common stocks on the consolidated balance sheet.
(d) Classified within preferred stocks on the consolidated balance sheet.
(e) Classified within holding company cash and investments or derivatives and other invested assets on the consolidatedbalance sheet.
(1) Valued using industry accepted discounted cash flow models that incorporate credit spreads of the issuers, whichare not market observable. At December 31, 2017 this asset class consisted of 7 investments, the largest being$663.6. By increasing (decreasing) the credit spreads within a reasonably possible range, the fair value of theseprivate placement debt securities would decrease by $41.6 (increase by $44.3).
(2) At December 31, 2017 this asset class consisted of 2 investments, the larger being $253.0.
(3) Valued primarily based on net asset value statements provided by the respective third party fund managers andgeneral partners. The fair values in those statements are determined using quoted prices of the underlying assets,and to a lesser extent, observable inputs where available and unobservable inputs, in conjunction with industryaccepted valuation models, where required. In some instances, such investments are classified as Level 3 becausethey may require at least three months’ notice to liquidate. The company has not applied reasonably possiblealternative assumptions to the estimated fair value of these investments due to their diverse nature and resultingdispersion of prices. At December 31, 2017 limited partnerships and other consisted of 47 investments, thelargest being $355.3.
(4) Valued using industry accepted discounted cash flow models that incorporate market unobservable creditspreads of the preferred shares.
(5) Fair values are determined by reference to various valuation measures for comparable companies andtransactions, including relevant valuation multiples. In some instances, such investments are classified asLevel 3 because the valuation multiples applied by the company are adjusted for differences in attributesbetween the investment and the underlying companies or transactions from which the valuation multipleswere derived.
(6) Valued using industry accepted option pricing models that incorporate market unobservable long-dated equityvolatilities. A higher equity volatility generally results in a higher fair value due to the higher probability ofobtaining a greater return from the warrant.
57

FAIRFAX FINANCIAL HOLDINGS LIMITED
(7) Valued based on broker-dealer quotes which management has determined utilize market observable inputsexcept for inflation volatility which is an unobservable input.
Investment IncomeAn analysis of investment income for the years ended December 31 follows:
Interest and dividends and share of profit of associates
2017 2016
Interest income:Cash and short term investments 117.5 33.4Bonds 441.9 622.4Derivatives and other (44.8) (141.4)
514.6 514.4
Dividends:Preferred stocks 2.1 11.2Common stocks 71.1 55.6
73.2 66.8
Investment expenses (28.8) (26.0)
Interest and dividends 559.0 555.2
Share of profit of associates (note 6) 200.5 24.2
58

Net gains (losses) on investments
2017 2016
Net Net change Net Net changerealized in unreal- Net gains realized in unreal- Net gains
gains ized gains (losses) on gains ized gains (losses) on(losses) (losses) investments (losses) (losses) investments
Bonds 445.7 (167.7) 278.0 683.7 (400.4) 283.3Preferred stocks 0.2 (0.5) (0.3) (68.0)(4)(5) 61.6(4)(5) (6.4)Common stocks 126.5 585.7 712.2 (162.2)(4)(6) 91.2(4)(6) (71.0)
572.4 417.5 989.9 453.5 (247.6) 205.9
Derivatives:Common stock and equity index short positions (485.6)(1) 67.7 (417.9) (915.8)(1) (264.0) (1,179.8)Common stock and equity index long positions 21.6(1) (2.0) 19.6 10.4(1) 12.9 23.3Equity index put options – – – (20.3) 7.2 (13.1)Equity warrants and call options 22.9 15.4 38.3 – (4.0) (4.0)CPI-linked derivatives – (71.0) (71.0) – (196.2) (196.2)U.S. treasury bond forwards (174.5) 21.3 (153.2) 96.7 (49.7) 47.0Other (8.4) 8.1 (0.3) (70.6) 63.2 (7.4)
(624.0) 39.5 (584.5) (899.6) (430.6) (1,330.2)
Foreign currency net gains (losses) on:Investing activities 0.8 88.0 88.8 54.4 (191.3) (136.9)Underwriting activities (74.9) – (74.9) 19.7 – 19.7Foreign currency contracts (21.0) 9.9 (11.1) 6.5 (18.8) (12.3)
(95.1) 97.9 2.8 80.6 (210.1) (129.5)
Gain on disposition of associates 999.9(2)(3) – 999.9 – – –
Other 2.1 57.3 59.4 3.2 47.0 50.2
Net gains (losses) on investments 855.3 612.2 1,467.5 (362.3) (841.3) (1,203.6)
(1) Amounts recorded in net realized gains (losses) include net gains (losses) on total return swaps where the counterparties arerequired to cash-settle on a quarterly or monthly basis the market value movement since the previous reset datenotwithstanding that the total return swap positions remain open subsequent to the cash settlement. The companydiscontinued its economic equity hedging strategy during the fourth quarter of 2016 and closed out $6,350.6 notionalamount of short positions effected through equity index total return swaps (comprised of Russell 2000, S&P 500 andS&P/TSX 60 short equity index total return swaps) (see notes 7 and 24).
(2) During 2017 the company sold a 24.3% equity interest in ICICI Lombard for net proceeds of $908.5 and recorded a netrealized gain of $595.6. The company’s remaining 9.9% equity interest in ICICI Lombard was reclassified to commonstock measured at FVTPL and re-measured to fair value for a net realized gain of $334.5 (see note 6).
(3) During 2017 the company acquired control of Grivalia Properties by increasing its equity interest to 52.7% andcommenced consolidating Grivalia Properties in the Other reporting segment. As a result, the company re-measured itsequity accounted carrying value of Grivalia Properties to fair value and recorded a net realized gain of $51.3 (see note 6).
(4) During 2016 the company recognized net realized losses of $220.3 and $103.7 on common and preferred stockinvestments pursuant to the issuer’s plan of restructuring and subsequent emergence from bankruptcy protection. Priorperiod unrealized losses on the common and preferred stock investments of $209.5 and $99.6 were reclassified to netrealized losses with a net impact of nil on the consolidated statement of earnings.
(5) During 2016 the company was required to convert a preferred stock investment into common shares of the issuer, resultingin a net realized gain on investment of $35.1 (the difference between the share price of the underlying common stock at thedate of conversion and the exercise price of the preferred stock). Prior period unrealized gains on the preferred stockinvestment of $41.7 were reclassified to net realized gains with a net impact of nil on the consolidated statementof earnings.
(6) During 2016 the company increased its ownership interest in APR Energy to 49.0% and commenced applying the equitymethod of accounting, resulting in the reclassification of an unrealized loss of $68.1 on APR Energy to realized losses witha net impact of nil on the consolidated statement of earnings.
59

FAIRFAX FINANCIAL HOLDINGS LIMITED
6. Investments in Associates
The following summarizes the company’s investments in associates:
Year endedDecember 31, 2017December 31,
Carrying value 2017
Associates Fairfax India Share ofOwnership Fair and joint and Fairfax profitpercentage value(a) arrangements Africa associates Total (loss)(8)
Insurance and reinsurance:Eurolife ERB Insurance Group Holdings S.A. (‘‘Eurolife’’) 43.3% 303.0 298.0(b) – 298.0 117.6Gulf Insurance Company (‘‘Gulf Insurance’’) 41.4% 233.1 185.4 – 185.4 7.7Thai Re Public Company Limited (‘‘Thai Re’’)(1) 34.9% 80.5 80.3 – 80.3 (21.3)Bank for Investment and Development of Vietnam Insurance Joint
Stock Corporation (‘‘BIC Insurance’’) 35.0% 66.7 48.6 – 48.6 1.6Singapore Reinsurance Corporation Limited (‘‘Singapore Re’’) 27.8% 39.6 38.5 – 38.5 3.2Ambridge Partners LLC (‘‘Ambridge Partners’’) 50.0% 34.9 34.9 – 34.9 4.4Go Digit Infoworks Services Private Limited (‘‘Digit’’)(2) 45.3% 10.6 10.6 – 10.6 –Falcon Insurance PLC (‘‘Falcon Thailand’’) 41.2% 9.2 9.2 – 9.2 –Camargue Underwriting Managers Group Ltd. (‘‘Camargue’’) 50.0% 5.5 5.5 – 5.5 0.7ICICI Lombard General Insurance Company Limited (‘‘ICICI
Lombard’’)(3) – – – – – 24.0
783.1 711.0 – 711.0 137.9
Non-insurance:
AgricultureAstarta Holding N.V. (‘‘Astarta’’)(4) 28.1% 101.2 140.6 – 140.6 15.8Farmers Edge Inc. (‘‘Farmers Edge’’)(5) 46.1% 95.0 88.1 – 88.1 (10.5)
196.2 228.7 – 228.7 5.3
Real estateKWF Real Estate Ventures Limited Partnerships (‘‘KWF LPs’’)(6) – 213.4 213.4(b) – 213.4 12.2Grivalia Properties REIC (‘‘Grivalia Properties’’)(7) – – – – – 12.8Other – 88.7 88.6(b) – 88.6 9.0
302.1 302.0 – 302.0 34.0
IndiaBangalore International Airport Limited (‘‘Bangalore Airport’’)(12) 48.0% 608.3 – 611.1(c) 611.1 15.8IIFL Holdings Limited (‘‘IIFL Holdings’’)(13) 35.5% 1,185.1 102.7 317.2(c) 419.9 36.55paisa Capital Limited (‘‘5paisa’’)(13) 35.5% 26.6 6.6 20.2(c) 26.8 –Fairchem Limited (‘‘Fairchem’’)(14) – – – – – 0.2Other – 0.6 – 1.0(c) 1.0 –
1,820.6 109.3 949.5 1,058.8 52.5
AfricaAtlas Mara Limited (‘‘Atlas Mara’’)(15) 43.3% 168.7 – 170.3(d) 170.3 1.6AFGRI Holdings Proprietary Limited (‘‘AFGRI’’)(16) 60.0% 119.0 – 49.5(d) 49.5 (0.4)
287.7 – 219.8 219.8 1.2
OtherResolute Forest Products Inc. (‘‘Resolute’’)(8) 33.8% 334.0 320.6 – 320.6 0.3APR Energy plc (‘‘APR Energy’’)(9) 67.8% 336.4 309.4(b) – 309.4 (3.1)Peak Achievement Athletics (‘‘Peak Achievement’’)(10) 42.6% 153.5 144.8(b) – 144.8 (6.2)Arbor Memorial Services Inc. (‘‘Arbor Memorial’’) 43.4% 111.8 61.4 – 61.4 10.6Partnerships, trusts and other(11) – 303.9 299.8 – 299.8 (32.0)
1,239.6 1,136.0 – 1,136.0 (30.4)
3,846.2 1,776.0 1,169.3 2,945.3 62.6
Investments in associates 4,629.3 2,487.0 1,169.3 3,656.3 200.5
As presented on the consolidated balance sheet:Investments in associates 2,824.3 2,487.0Fairfax India cash and portfolio investments(12)(13) 1,517.3 949.5Fairfax Africa cash and portfolio investments(15)(16) 287.7 219.8
4,629.3 3,656.3
(a) See note 5 for fair value hierarchy information.(b) These investments are considered joint arrangements.(c) Fairfax India associate.(d) Fairfax Africa associate.
60

Year endedDecember 31, 2016December 31,
Carrying value 2016
Associates Share ofOwnership Fair and joint Fairfax profitpercentage value(a) arrangements India associates Total (loss)(8)
Insurance and reinsurance:Eurolife ERB Insurance Group Holdings S.A. (‘‘Eurolife’’) 40.0% 171.4 150.6(b) – 150.6 (6.4)
Gulf Insurance Company (‘‘Gulf Insurance’’) 41.4% 235.8 195.7 – 195.7 14.0
Thai Re Public Company Limited (‘‘Thai Re’’) 32.4% 80.2 94.7 – 94.7 (1.8)
Bank for Investment and Development of Vietnam Insurance JointStock Corporation (‘‘BIC Insurance’’) 35.0% 68.5 48.4 – 48.4 1.8
Singapore Reinsurance Corporation Limited (‘‘Singapore Re’’) 27.8% 35.5 34.6 – 34.6 2.0
Ambridge Partners LLC (‘‘Ambridge Partners’’) 50.0% 31.4 31.4 – 31.4 3.4
Falcon Insurance PLC (‘‘Falcon Thailand’’) 41.2% 8.8 8.8 – 8.8 0.7
Camargue Underwriting Managers Group Ltd. (‘‘Camargue’’) 50.0% 5.2 5.2 – 5.2 0.2
ICICI Lombard General Insurance Company Limited (‘‘ICICI Lombard’’) 34.6% 878.0 371.1 – 371.1 44.1
1,514.8 940.5 – 940.5 58.0
Non-insurance:
Real estate
KWF Real Estate Ventures Limited Partnerships (‘‘KWF LPs’’)(6) – 202.8 202.8(b) – 202.8 13.9
Grivalia Properties REIC (‘‘Grivalia Properties’’) 40.6% 332.4 295.9 – 295.9 16.1
535.2 498.7 – 498.7 30.0
India
IIFL Holdings Limited (‘‘IIFL Holdings’’) 30.5% 373.9 96.3 220.1(c) 316.4 18.5
Fairchem Limited (‘‘Fairchem’’) 44.9% 45.5 – 19.4(c) 19.4 0.3
Other – 0.4 – 1.0(c) 1.0 –
419.8 96.3 240.5 336.8 18.8
Other
Resolute Forest Products Inc. (‘‘Resolute’’)(8) 33.9% 162.5 304.5 – 304.5 (73.6)
APR Energy plc (‘‘APR Energy’’) 45.0% 234.0 187.3(b) – 187.3 (29.0)
Peak Achievement Athletics (‘‘Peak Achievement’’) 38.2% 83.0 82.7(b) – 82.7 –
Arbor Memorial Services Inc. (‘‘Arbor Memorial’’) 43.4% 93.6 56.0 – 56.0 9.0
Partnerships, trusts and other – 224.4 227.0 – 227.0 11.0
797.5 857.5 – 857.5 (82.6)
1,752.5 1,452.5 240.5 1,693.0 (33.8)
Investments in associates 3,267.3 2,393.0 240.5 2,633.5 24.2
As presented on the consolidated balance sheet:
Investments in associates 2,955.4 2,393.0
Fairfax India cash and portfolio investments 311.9 240.5
3,267.3 2,633.5
(a) See note 5 for fair value hierarchy information.(b) These investments are considered joint arrangements.(c) Fairfax India associate.
Insurance and reinsurance associates
(1) At December 31, 2017 Thai Re Public Company Limited’s (‘‘Thai Re’’) recoverable amount of $80.3 wasdetermined to be lower than its carrying value, resulting in a non-cash impairment charge of $17.7 recognized inshare of profit (loss) of associates in the consolidated statement of earnings.
(2) Through various transactions during 2017 the company acquired a 45.3% equity interest in Go Digit InfoworksPrivate Limited (‘‘Digit’’) for cash consideration of $10.6 (694.4 million Indian rupees) and invested inconvertible preferred shares of Digit for $48.9 (3.2 billion Indian rupees). Digit is a newly formed Indiancompany that has established and is operating an insurance company in India named Go Digit GeneralInsurance Limited.
61

FAIRFAX FINANCIAL HOLDINGS LIMITED
(3) On July 6, 2017 the company sold a 12.2% equity interest in ICICI Lombard General Insurance CompanyLimited (‘‘ICICI Lombard’’) to private equity investors for net proceeds of $376.3 and a net realized investmentgain of $223.3. On September 19, 2017 the company sold an additional 12.1% equity interest throughparticipation in ICICI Lombard’s initial public offering for net proceeds of $532.2 and a net realized investmentgain of $372.3. The company’s remaining 9.9% equity interest in ICICI Lombard was reclassified from the equitymethod of accounting to common stock at FVTPL, resulting in a $334.5 re-measurement gain.
Non-insurance associates
(4) Through various transactions between January 3, 2017 and May 10, 2017, the company acquired an aggregateequity interest in Astarta Holding N.V. (‘‘Astarta’’) of 28.0% with an initial carrying value of $120.1 under theequity method of accounting, comprised of cash consideration of $104.4 (420.1 million Polish zlotys) andre-measurements to fair value of $15.7. Astarta specializes in sugar production, crop growing, soybeanprocessing and cattle farming, primarily in Ukraine.
(5) On March 1, 2017 the company acquired a 46.1% equity interest in Farmers Edge Inc. (‘‘Farmers Edge’’) forpurchase consideration of $95.0. Farmers Edge specializes in data science, precision agronomy (farming),geographic information systems, hardware engineering, software development, soil science and sustainability.
(6) The KWF LPs are partnerships formed between the company and Kennedy-Wilson Holdings, Inc. and itsaffiliates (‘‘Kennedy Wilson’’) to invest in U.S. and international real estate properties. The company participatesas a limited partner in the KWF LPs, with limited partnership interests ranging from 50% to 90%. KennedyWilson is the general partner and holds the remaining limited partnership interest in each of the KWF LPs.
(7) On July 4, 2017 the company acquired control of Grivalia Properties REIC (‘‘Grivalia Properties’’) by increasingits equity interest to 52.6% through the purchase of an additional 10.3% equity interest from EurobankErgasias S.A. for cash consideration of $100.0 (A88.0). Accordingly, the company re-measured its equityaccounted carrying value of Grivalia Properties to fair value, recorded a net realized gain of $51.3 andcommenced consolidating Grivalia Properties (and its equity accounted investments with a fair value of $39.5)in the Other reporting segment. Pursuant to Greek securities law, the company then made a tender offer for allremaining outstanding shares of Grivalia Properties which expired on September 6, 2017, resulting in thecompany increasing its equity interest by 0.1% to 52.7% for cash consideration of $0.6 (A0.5). Grivalia Propertiesis a real estate investment company listed on the Athens Stock Exchange.
(8) At December 31, 2016 the carrying value of the company’s investment in Resolute Forest Products Inc.(‘‘Resolute’’) exceeded its fair value as determined by the market price of Resolute shares. The companyperformed a value-in-use analysis to establish the recoverable amount of its investment in Resolute andrecognized a non-cash impairment charge of $100.4 in share of profit of associates in the 2016 consolidatedstatement of earnings.
(9) On July 20, 2017 the company increased its indirect equity interest in APR Energy plc (‘‘APR Energy’’) to 67.9%through the acquisition of an additional 22.9% equity interest for purchase consideration of $109.0. APR Energycontinues to be reported under the equity method of accounting due to certain contractual arrangementsbetween Fairfax and the second-largest shareholder which preclude either party from exercising unilateralcontrol over APR Energy’s most relevant decisions governing its operations, including the appointment ofexecutive management and the approval of the detailed annual business plan. On October 13, 2017 APR Energyobtained further capital financing through the issuance of common shares to existing shareholders for whichthe company participated by investing an additional $13.2. The net impact of the common share issuancereduced the company’s indirect equity interest to 67.8%.
(10) On March 1, 2017 the restructuring of Performance Sports Group Ltd. (‘‘PSG’’) was substantially completed afterall of the assets and certain related operating liabilities of PSG were sold to an intermediate holding company(‘‘Performance Sports’’) co-owned by Fairfax and Sagard Holdings Inc. The company’s $153.5 equity investmentin Performance Sports represents a voting interest of 50.0% and an equity interest of 42.6%. On April 3, 2017Performance Sports was renamed Peak Achievement Athletics Inc. (‘‘Peak Achievement’’).
(11) On August 2, 2017 the company acquired an 81.2% non-voting equity interest in Sigma CompaniesInternational Corp. (‘‘Sigma’’) for cash consideration of $41.4. Sigma, through its subsidiary, is engaged in globalwater and wastewater infrastructure projects.
62

Fairfax India
(12) On March 24, 2017 Fairfax India acquired a 38.0% equity interest in Bangalore International Airport Limited(‘‘Bangalore Airport’’) for cash consideration of $385.5 (25.2 billion Indian rupees). On July 13, 2017 FairfaxIndia increased its equity interest in Bangalore Airport to 48.0% through the acquisition of an additional 10.0%equity interest from a wholly-owned subsidiary of GVK Power and Infrastructure Limited (‘‘GVK’’) for purchaseconsideration of $200.1 (12.9 billion Indian rupees). A put option previously issued to GVK during thecompany’s initial investment in Bangalore Airport was terminated by this transaction. Bangalore Airport, undera concession agreement with the Government of India, operates and manages the Kempegowda InternationalAirport in Bengaluru, India through a public-private partnership.
(13) On October 20, 2017 IIFL Holdings Limited (‘‘IIFL Holdings’’) completed a spin-off of a wholly owned subsidiaryresulting in the entity 5paisa Capital Limited (‘‘5paisa’’). IIFL Holdings investors received 5paisa shares pro ratabased on existing ownership in IIFL Holdings. The transaction was recorded as a non-cash distribution thatreduced the carrying value of the company’s investment in IIFL Holdings. Subsequent to the spin-offtransaction, the company holds a 35.5% equity interest in 5paisa recorded at an initial carrying value of $26.4.5paisa is a provider of a web-based, mobile technology platform that facilitates trading of securities on the BSEand NSE of India.
(14) On March 14, 2017 Fairchem Speciality Limited (‘‘Fairchem’’) and Privi Organics Limited (‘‘Privi Organics’’)completed their previously announced merger, with the merged entity continuing under the Fairchem nameand being consolidated by Fairfax India (see note 23).
Fairfax Africa
(15) On August 31, 2017 Fairfax Africa, through a series of transactions, acquired a 42.4% equity interest in AtlasMara Limited (‘‘Atlas Mara’’) for cash consideration of $155.8. On December 22, 2017 Fairfax Africa acquired anadditional 0.9% equity interest in Atlas Mara for cash consideration of $2.4. Atlas Mara is a financial servicesinstitution listed on the London Stock Exchange that operates in seven sub-Saharan countries.
(16) On February 17, 2017 the company contributed its indirect equity ownership interest in AFGRI HoldingsProprietary Limited (‘‘AFGRI’’) to Fairfax Africa (fair value of $72.8 and carrying value of $40.5) in exchange for7,284,606 multiple voting shares of Fairfax Africa valued at $10.00 per multiple voting share (see note 23).Despite the company’s significant equity interest, AFGRI is reported under the equity method of accounting dueto contractual arrangements between Fairfax Africa and certain other shareholders of AFGRI which preclude anyshareholders from exercising unilateral control over AFGRI’s most relevant decisions governing its operations,including approval of significant transactions and the five-year business plan.
63

FAIRFAX FINANCIAL HOLDINGS LIMITED
Changes in the investments in associates balances for the years ended December 31 were as follows:
2017
Joint Fairfax India Fairfax AfricaAssociates arrangements associates associates Total
Balance – January 1 1,769.6 623.4 240.5 – 2,633.5Share of pre-tax comprehensive income (loss) of associates and
joint arrangements:Share of profit of associates and joint arrangements 25.6 128.2 45.5 1.2 200.5Share of other comprehensive income (loss), excluding gains
(losses) on defined benefit plans 22.9 46.4 (0.1) (1.3) 67.9Share of gains (losses) on defined benefit plans 12.4 – (0.1) – 12.3
60.9 174.6 45.3 (0.1) 280.7Dividends and distributions received (50.5) (57.0) (26.8) – (134.3)Purchases and acquisitions 367.4 301.6 682.9 219.9 1,571.8Divestitures and other net changes in capitalization (290.5) (2.4) (0.7) – (293.6)Reclassifications(1) (440.4) – (20.4) – (460.8)Foreign exchange effect 20.5 9.8 28.7 – 59.0
Balance – December 31 1,437.0 1,050.0 949.5 219.8 3,656.3
(1) Comprised of the consolidation of Grivalia Properties, the reduction of the company’s investment in ICICI Lombard and the consolidationof Fairchem subsequent to its merger with Privi Organics.
2016
Joint Fairfax India Fairfax AfricaAssociates arrangements associates associates Total
Balance – January 1 1,538.7 191.5 202.7 – 1,932.9Share of pre-tax comprehensive income (loss) of associates and
joint arrangements:Share of profit (loss) of associates and joint arrangements 32.1 (21.5) 13.6 – 24.2Share of other comprehensive loss, excluding losses on defined
benefit plans (24.9) (14.4) – – (39.3)Share of losses on defined benefit plans (43.5) – – – (43.5)
(36.3) (35.9) 13.6 – (58.6)Dividends and distributions received (45.6) (47.8) (4.6) – (98.0)Purchases and acquisitions 306.2 528.4 20.5 – 855.1Divestitures and other net changes in capitalization 5.6 (11.6) 13.7 – 7.7Foreign exchange effect 1.0 (1.2) (5.4) – (5.6)
Balance – December 31 1,769.6 623.4 240.5 – 2,633.5
The company’s strategic investment in 15.0% of Alltrust Insurance Company of China Ltd. had a carrying value of$81.2 at December 31, 2017 (December 31, 2016 – $76.1) and is classified as FVTPL within common stocks on theconsolidated balance sheet.
64

7. Short Sales and Derivatives
The following table summarizes the company’s derivative financial instruments:
December 31, 2017 December 31, 2016
Fair value Fair valueNotional Notional
Cost amount Assets Liabilities Cost amount Assets Liabilities
Equity derivatives:
Equity index total return swaps – short positions – 52.6 0.4 – – 43.3 0.6 –
Equity total return swaps – short positions – 892.5 11.8 12.1 – 1,623.0 10.4 78.1
Equity total return swaps – long positions – 697.8 17.8 15.6 – 213.1 9.4 5.1
Equity and equity index call options 0.4 8.2 3.9 – 16.2 1,104.4 12.8 –
Warrants 64.8 607.1 73.7 – 6.5 32.2 6.5 –
CPI-linked derivative contracts 678.4 117,254.6 39.6 – 670.0 110,365.5 83.4 –
U.S. treasury bond forwards – 1,693.8 – 28.8 – 3,013.4 – 49.7
Foreign exchange forward contracts – – 57.1 69.7 – – 80.2 101.4
Total 204.3 126.2 203.3 234.3
The company is exposed to significant market risk (comprised of foreign currency risk, interest rate risk and otherprice risk) through its investing activities. Certain derivative contracts entered into by the company are consideredeconomic hedges of certain market risks but are not designated as hedges for financial reporting.
Equity contracts
Throughout most of 2016 the company had economically hedged certain market risks associated with its equity andequity-related holdings (comprised of common stocks, convertible preferred stocks, convertible bonds,non-insurance investments in associates and equity-related derivatives) against a potential significant decline inequity markets by way of short positions effected through equity and equity index total return swaps (includingshort positions in certain equity indexes and individual equities) and equity index put options (S&P 500). Thecompany’s equity hedges were structured to provide a return that was inverse to changes in the fair values of theindexes and certain individual equities.
The company discontinued its economic equity hedging strategy in the fourth quarter of 2016 after givingconsideration to the possible and actual outcome of the U.S. elections and the potential for fundamental changesthat could improve U.S. economic growth and equity markets. During 2016 the company closed out $6,350.6notional amount of short positions effected through equity index total return swaps (comprised of Russell 2000,S&P 500 and S&P/TSX 60 short equity index total return swaps) and recognized a net loss on investment of $955.2(realized loss of $2,665.4 of which $1,710.2 had been recognized as unrealized losses in prior years). The companycontinues to hold short equity and equity index total return swaps for investment purposes, but no longer regardsthem as hedges of its equity and equity-related holdings. During 2017 the company paid net cash of $485.6 (2016 –$915.8) in connection with the closures and reset provisions of its short equity and equity index total return swaps(excluding the impact of collateral requirements).
During 2017 the company closed out $1,202.9 notional amount of short equity total return swaps and recognized anet loss on investment of $237.9 (realized loss of $553.1 of which $315.2 was recognized as unrealized losses in prioryears). In the first quarter of 2018 the company closed out an additional $481.3 notional amount of short equity andequity index total return swaps and recognized a net loss on investment of $8.1 (realized loss of $199.0 of which$190.9 was recognized as unrealized losses in prior years), which reduced the notional amount of remaining shortequity and equity index total return swaps to approximately $509. During 2017 the company closed out $1,100.0notional amount of S&P 500 call options and recorded a net gain on investment of $10.1.
At December 31, 2017 the company had entered into long equity total return swaps on individual equities forinvestment purposes with an original notional amount of $706.3 (December 31, 2016 – $283.9). During 2017 thecompany received net cash of $21.6 (2016 – $10.4) in connection with the reset provisions of its long equity totalreturn swaps (excluding the impact of collateral requirements).
65

FAIRFAX FINANCIAL HOLDINGS LIMITED
At December 31, 2017 the fair value of collateral deposited for the benefit of derivative counterparties included inholding company cash and investments, or in assets pledged for short sale and derivative obligations, was $272.5(December 31, 2016 – $322.9), comprised of collateral of $36.0 (December 31, 2016 – $86.4) securing amounts owedto counterparties in respect of fair value changes since the most recent reset date, and collateral of $236.5(December 31, 2016 – $236.5) required to be deposited to enter into such derivative contracts (principally related tototal return swaps).
U.S. treasury bond forward contracts
To reduce its exposure to interest rate risk (specifically with respect to U.S. state and municipal bonds and anyremaining long dated U.S. treasury bonds held in its fixed income portfolio following sales which occurred late in2016 and in the first quarter of 2017), the company entered into forward contracts to sell long dated U.S. treasurybonds. At December 31, 2017 these contracts had a notional amount of $1,693.8 (December 31, 2016 – $3,013.4) andan average term to maturity of less than three months, and could be renewed at market rates.
CPI-linked derivative contracts
The company has purchased derivative contracts referenced to consumer price indexes (‘‘CPI’’) in the geographicregions in which it operates to serve as an economic hedge against the potential adverse financial impact on thecompany of decreasing price levels. At December 31, 2017 these contracts have a remaining weighted average life of4.6 years (December 31, 2016 – 5.6 years) and notional amounts and fair values as shown in the table below. In theevent of a sale, expiration or early settlement of any of these contracts, the company would receive the fair value ofthat contract on the date of the transaction. The company’s maximum potential loss on a contract is limited to theoriginal cost of that contract. The CPI-linked derivative contracts are summarized as follows:
December 31, 2017
WeightedNotional amount
Averag average Index value MarketFloor life Original U.S. strike at period Cost in Market value in Unrealized
Underlying CPI index rate(1) (in years) currency dollars price end Cost bps(2) value bps(2) gain (loss)
United States 0.0% 4.7 46,725.0 46,725.0 231.39 246.52 287.5 61.5 20.6 4.4 (266.9)
United States 0.5% 6.8 12,600.0 12,600.0 238.30 246.52 39.9 31.7 17.2 13.7 (22.7)
European Union 0.0% 4.0 41,375.0 49,683.0 96.09 102.57 307.1 61.8 1.4 0.3 (305.7)
United Kingdom 0.0% 4.9 3,300.0 4,464.1 243.82 278.10 23.2 52.0 0.3 0.7 (22.9)
France 0.0% 5.1 3,150.0 3,782.5 99.27 101.76 20.7 54.7 0.1 0.3 (20.6)
4.6 117,254.6 678.4 39.6 (638.8)
December 31, 2016
WeightedNotional amount
Average average Index value MarketFloor life Original U.S. strike at period Cost in Market value in Unrealized
Underlying CPI index rate(1) (in years) currency dollars price end Cost bps(2) value bps(2) gain (loss)
United States 0.0% 5.7 46,725.0 46,725.0 231.39 241.43 286.9 61.4 35.2 7.5 (251.7)
United States 0.5% 7.8 12,600.0 12,600.0 238.30 241.43 39.5 31.3 34.3 27.2 (5.2)
European Union 0.0% 5.0 41,375.0 43,640.4 96.09 101.26 300.3 68.8 12.5 2.9 (287.8)
United Kingdom 0.0% 5.9 3,300.0 4,077.6 243.82 267.10 22.6 55.4 0.5 1.2 (22.1)
France 0.0% 6.1 3,150.0 3,322.5 99.27 100.66 20.7 62.3 0.9 2.7 (19.8)
5.6 110,365.5 670.0 83.4 (586.6)
(1) Contracts with a floor rate of 0.0% provide a payout at maturity if there is cumulative deflation over the life of thecontract. Contracts with a floor rate of 0.5% provide a payout at maturity based on an equivalent weighted average strikeprice of 250.49 if cumulative inflation averages less than 0.5% per year over the life of the contract. At December 31, 2017the equivalent weighted average strike price for the United States 0.5% CPI-linked derivative contracts was 242.20(December 31, 2016 – 241.00).
(2) Expressed as a percentage of the notional amount.
During 2017 the company did not enter into any new CPI-linked derivative contracts. The company’s CPI-linkedderivative contracts produced net unrealized losses of $71.0 in 2017 (2016 – $196.2).
66

Foreign exchange forward contractsLong and short foreign exchange forward contracts primarily denominated in the euro, the British pound sterlingand the Canadian dollar, are used to manage certain foreign currency exposures arising from foreign currencydenominated transactions. These contracts have an average term to maturity of less than one year and can berenewed at market rates.
Counterparty collateralThe company endeavours to limit counterparty risk through diligent selection of counterparties to its derivativecontracts and through the terms of negotiated agreements. The fair value of the collateral deposited for the benefit ofthe company at December 31, 2017 consisted of cash of $3.6 and government securities of $35.9 (December 31,2016 – $8.3 and $54.4). The company has recognized the cash collateral within subsidiary cash and short terminvestments and recognized a corresponding liability within accounts payable and accrued liabilities. The companyhad not exercised its right to sell or repledge collateral at December 31, 2017. The company’s exposure tocounterparty risk and the management thereof are discussed in note 24.
Hedge of net investment in Canadian subsidiariesAt December 31, 2017 the company has designated the carrying value of Cdn$2,212.9 principal amount of itsCanadian dollar denominated unsecured senior notes with a fair value of $1,868.6 (December 31, 2016 – principalamount of Cdn$1,975.0 with a fair value of $1,618.1) as a hedge of its net investment in its Canadian subsidiaries forfinancial reporting. During 2017 the company recognized pre-tax losses of $106.3 (2016 – $37.5) related to foreigncurrency movements on the unsecured senior notes in losses on hedge of net investment in Canadian subsidiaries inthe consolidated statement of comprehensive income.
8. Insurance Contract Liabilities
December 31, 2017 December 31, 2016
Gross Ceded Net Gross Ceded Net
Provision for unearned premiums 5,951.7 1,169.0 4,782.7 3,740.4 539.8 3,200.6Provision for losses and loss adjustment
expenses 28,610.8 6,189.7 22,421.1 19,481.8 3,179.6 16,302.2
Total insurance contract liabilities 34,562.5 7,358.7 27,203.8 23,222.2 3,719.4 19,502.8
Current 13,405.0 2,975.9 10,429.1 9,013.9 1,586.8 7,427.1Non-current 21,157.5 4,382.8 16,774.7 14,208.3 2,132.6 12,075.7
34,562.5 7,358.7 27,203.8 23,222.2 3,719.4 19,502.8
At December 31, 2017 the company’s net provision for losses and loss adjustment expenses of $22,421.1(December 31, 2016 – $16,302.2) were comprised of case reserves of $9,731.5 and IBNR of $12,689.6 (December 31,2016 – $7,537.2 and $8,765.0).
Provision for unearned premiumsChanges in the provision for unearned premiums for the years ended December 31 were as follows:
2017 2016Provision for unearned premiums – January 1 3,740.4 3,284.8
Gross premiums written 12,207.5 9,534.3Less: gross premiums earned (11,822.0) (9,209.7)
Acquisitions of subsidiaries (note 23) 1,906.2 111.1Divestiture of subsidiary (note 23) (157.9) –Foreign exchange effect and other 77.5 19.9
Provision for unearned premiums – December 31 5,951.7 3,740.4
67

FAIRFAX FINANCIAL HOLDINGS LIMITED
Provision for losses and loss adjustment expensesChanges in the provision for losses and loss adjustment expenses for the years ended December 31 were as follows:
2017 2016Provision for losses and loss adjustment expenses – January 1 19,481.8 19,816.4
Decrease in estimated losses and expenses for claims occurring in the prior years (218.8) (559.8)Losses and expenses for claims occurring in the current year 9,736.5 6,247.8Paid on claims occurring during:
the current year (2,263.9) (1,595.6)the prior years (5,526.0) (4,441.8)
Acquisitions of subsidiaries (note 23) 7,377.6 143.1Divestiture of subsidiary (note 23) (546.6) –Foreign exchange effect and other 570.2 (128.3)
Provision for losses and loss adjustment expenses – December 31 28,610.8 19,481.8
Development of insurance losses, grossThe development of insurance liabilities illustrates the estimation uncertainty associated with these liabilities andprovides a measure of the company’s ability to estimate the ultimate value of claims. The loss development tablewhich follows shows the provision for losses and loss adjustment expenses at the end of each calendar year, thecumulative payments made in respect of those reserves in subsequent years and the re-estimated amount of eachcalendar year’s provision for losses and loss adjustment expenses as at December 31, 2017.
Calendar year
2008 2009 2010 2011 2012 2013 2014 2015 2016 2017
Provision for losses and lossadjustment expenses 14,467.2 14,504.8 16,049.3 17,232.2 19,648.8 19,212.8 17,749.1 19,816.4 19,481.8 28,610.8
Less: CTR Life(1) 34.9 27.6 25.3 24.2 20.6 17.9 15.2 14.2 12.8 8.7
14,432.3 14,477.2 16,024.0 17,208.0 19,628.2 19,194.9 17,733.9 19,802.2 19,469.0 28,602.1Cumulative payments as of:One year later 3,136.0 3,126.6 3,355.9 3,627.6 4,323.5 4,081.1 3,801.6 4,441.4 4,608.0Two years later 5,336.4 5,307.6 5,441.4 6,076.7 7,153.1 6,787.6 6,364.5 7,283.6Three years later 7,070.7 6,846.3 7,063.1 7,920.3 9,148.0 8,775.5 8,172.7Four years later 8,318.7 7,932.7 8,333.3 9,333.4 10,702.8 10,212.4Five years later 9,189.1 8,936.9 9,327.0 10,458.7 11,783.3Six years later 10,039.4 9,721.1 10,202.6 11,263.6Seven years later 10,705.5 10,456.1 10,823.4Eight years later 11,379.9 10,975.6Nine years later 11,857.8
Reserves re-estimated as of:One year later 14,746.0 14,616.0 15,893.8 17,316.4 19,021.2 18,375.6 16,696.4 19,169.3 19,343.1Two years later 14,844.4 14,726.6 15,959.7 17,013.6 18,529.4 17,475.0 16,269.2 18,973.6Three years later 14,912.4 14,921.6 15,705.6 16,721.0 17,820.5 17,307.9 16,114.0Four years later 15,127.5 14,828.9 15,430.4 16,233.9 17,735.5 17,287.2Five years later 15,091.0 14,663.1 15,036.2 16,269.6 17,830.5Six years later 15,011.7 14,433.0 15,099.0 16,331.8Seven years later 14,873.6 14,551.5 15,252.1Eight years later 15,028.8 14,744.2Nine years later 15,231.4
Favourable (unfavourable)development (799.1) (267.0) 771.9 876.2 1,797.7 1,907.7 1,619.9 828.6 125.9
Comprised of favourable(unfavourable):Effect of foreign currency
translation (317.7) 82.0 264.2 265.1 575.6 476.0 248.5 (252.3) (205.7)Loss reserve development (481.4) (349.0) 507.7 611.1 1,222.1 1,431.7 1,371.4 1,080.9 331.6
(799.1) (267.0) 771.9 876.2 1,797.7 1,907.7 1,619.9 828.6 125.9
(1) Guaranteed minimum death benefit retrocessional business written by Compagnie Transcontinentale de Reassurance(‘‘CTR Life’’), a wholly owned subsidiary of the company that was transferred to Wentworth and placed into run-offin 2002.
68

The effect of foreign currency translation in the table above primarily arose on translation to U.S. dollars of the lossreserves of subsidiaries with functional currencies other than the U.S. dollar. The company’s exposure to foreigncurrency risk and the management thereof are discussed in note 24.
Loss reserve development in the table above excludes the loss reserve development of a subsidiary in the year it isacquired whereas the consolidated statement of earnings includes the loss reserve development of a subsidiary fromits acquisition date.
Favourable loss reserve development in calendar year 2017 of $331.6 in the table above was principally comprised offavourable loss emergence on the more recent accident years, partially offset by adverse development primarilyrelating to asbestos and other latent reserves.
Development of losses and loss adjustment expenses for asbestosA number of the company’s subsidiaries wrote general liability policies and reinsurance prior to their acquisition bythe company under which policyholders continue to present asbestos-related injury claims. The vast majority ofthese claims are presented under policies written many years ago and reside primarily within the run-off group.
There is a great deal of uncertainty surrounding these types of claims, which impacts the ability of insurers andreinsurers to estimate the ultimate amount of unpaid claims and related settlement expenses. The majority of theseclaims differ from most other types of claims because there is inconsistent precedent, if any at all, to determine what,if any, coverage exists or which, if any, policy years and insurers/reinsurers may be liable. These uncertainties areexacerbated by judicial and legislative interpretations of coverage that in some cases have eroded the clear andexpress intent of the parties to the insurance contracts, and in others have expanded theories of liability.
The following is an analysis of the changes which have occurred in the company’s provision for losses and lossadjustment expenses related to asbestos exposure on a gross and net basis for the years ended December 31:
2017 2016
Gross Net Gross Net
Provision for asbestos claims and loss adjustment expenses – January 1 1,347.7 1,065.5 1,381.0 1,043.8Losses and loss adjustment expenses incurred 153.0 141.8 219.9 218.7Losses and loss adjustment expenses paid (208.6) (174.0) (253.2) (197.0)
Provision for asbestos claims and loss adjustment expenses – December 31 1,292.1 1,033.3 1,347.7 1,065.5
Fair ValueThe estimated fair value of insurance and reinsurance contracts is as follows:
December 31, 2017 December 31, 2016
Fair Carrying Fair Carryingvalue value value value
Insurance contracts 33,807.2 34,562.5 22,598.3 23,222.2Ceded reinsurance contracts 6,948.7 7,358.7 3,501.3 3,719.4
The fair value of insurance contracts is comprised of the fair value of both unpaid claim liabilities and unearnedpremiums. The fair value of ceded reinsurance contracts is comprised of the fair value of reinsurers’ share of unpaidclaim liabilities and unearned premiums. Both reflect the time value of money through discounting, whereas thecarrying values (including the reinsurers’ share thereof) do not. The calculation of the fair value of unearnedpremiums includes acquisition expenses to reflect the deferral of these expenses at the inception of the insurancecontract. The estimated fair value of insurance and ceded reinsurance contracts is determined by projecting theexpected future cash flows of the contracts, selecting the appropriate interest rates, and applying the resultingdiscount factors to the expected future cash flows. The difference between the sum of the undiscounted expectedfuture cash flows and the sum of the discounted expected future cash flows represents the time value of money. Amargin for risk and uncertainty is added to the discounted cash flows to reflect the volatility of the lines of businesswritten, quantity of reinsurance purchased, credit quality of reinsurers and the possibility of future changes ininterest rates.
69

FAIRFAX FINANCIAL HOLDINGS LIMITED
The table that follows illustrates the potential impact of interest rate fluctuations on the fair value of the company’sinsurance and reinsurance contracts:
December 31, 2017 December 31, 2016
Fair value of Fair value of Fair value of Fair value ofinsurance reinsurance insurance reinsurance
Change in interest rates contracts contracts contracts contracts
100 basis point increase 32,820.7 6,764.1 21,973.4 3,425.7100 basis point decrease 34,877.5 7,147.6 23,274.9 3,582.4
9. Reinsurance
Reinsurers’ share of insurance contract liabilities was comprised as follows:
December 31, 2017 December 31, 2016
Gross Grossrecoverable Provision for Recoverable recoverable Provision for Recoverable
from uncollectible from from uncollectible fromreinsurers reinsurance(1) reinsurers reinsurers reinsurance(1) reinsurers
Provision for losses and loss adjustment expenses 6,216.2 (26.5) 6,189.7 3,210.0 (30.4) 3,179.6Reinsurers’ share of paid losses 593.7 (139.9) 453.8 432.2 (141.3) 290.9Provision for unearned premiums 1,169.0 – 1,169.0 539.8 – 539.8
7,978.9 (166.4) 7,812.5 4,182.0 (171.7) 4,010.3
Current 3,418.6 1,846.6Non-current 4,393.9 2,163.7
7,812.5 4,010.3
(1) The company’s management of credit risk associated with its reinsurance recoverables is discussed in note 24.
70

Changes in reinsurers’ share of paid losses, unpaid losses, unearned premiums and the provision for uncollectiblebalances for the years ended December 31 were as follows:
2017
Provision for RecoverablePaid Unpaid Unearned uncollectible from
losses losses premiums reinsurance reinsurers
Balance – January 1, 2017 432.2 3,210.0 539.8 (171.7) 4,010.3Reinsurers’ share of losses paid to insureds 1,330.7 (1,330.7) – – –Reinsurance recoveries received (1,314.0) – – – (1,314.0)Reinsurers’ share of unpaid losses and premiums earned – 2,367.1 (2,100.6) – 266.5Premiums ceded to reinsurers – – 2,224.0 – 2,224.0Change in provision, recovery or write-off of impaired
balances (0.2) 0.7 – 7.2 7.7Acquisitions of subsidiaries (note 23) 162.7 2,115.2 586.0 – 2,863.9Divestiture of subsidiary (note 23) (29.0) (237.8) (86.8) 0.1 (353.5)Foreign exchange effect and other 11.3 91.7 6.6 (2.0) 107.6
Balance – December 31, 2017 593.7 6,216.2 1,169.0 (166.4) 7,812.5
2016
Provision for RecoverablePaid Unpaid Unearned uncollectible from
losses losses premiums reinsurance reinsurers
Balance – January 1, 2016 419.4 3,259.8 398.7 (187.0) 3,890.9Reinsurers’ share of losses paid to insureds 1,018.3 (1,018.3) – – –Reinsurance recoveries received (1,017.4) – – – (1,017.4)Reinsurers’ share of unpaid losses and premiums earned – 952.1 (1,347.5) – (395.4)Premiums ceded to reinsurers – – 1,445.9 – 1,445.9Change in provision, recovery or write-off of impaired
balances 0.7 (11.3) – 15.5 4.9Acquisitions of subsidiaries (note 23) 11.5 65.0 32.3 – 108.8Foreign exchange effect and other (0.3) (37.3) 10.4 (0.2) (27.4)
Balance – December 31, 2016 432.2 3,210.0 539.8 (171.7) 4,010.3
Commission income earned on premiums ceded to reinsurers in 2017 of $347.1 (2016 – $267.4) is included incommissions, net in the consolidated statement of earnings.
10. Insurance Contract Receivables
Insurance contract receivables were comprised as follows:
December 31, December 31,2017 2016
Insurance premiums receivable 2,752.3 1,906.2Reinsurance premiums receivable 1,086.4 788.8Funds withheld receivable 659.8 181.8Other 218.7 68.3Provision for uncollectible balances (30.3) (27.6)
4,686.9 2,917.5
71

FAIRFAX FINANCIAL HOLDINGS LIMITED
Changes in the insurance premiums receivable and reinsurance premiums receivable balances for the years endedDecember 31 were as follows:
Insurance Reinsurancepremiums receivable premiums receivable
2017 2016 2017 2016
Balance – January 1 1,906.2 1,677.1 788.8 659.5Gross premiums written 9,329.9 6,930.2 2,877.6 2,604.1Premiums collected (8,075.2) (6,050.5) (2,323.3) (1,876.5)Recovery (impairments) 0.5 (1.6) (0.7) (1.2)Amounts due to brokers and agents (932.3) (707.8) (686.4) (581.2)Acquisitions of subsidiaries (note 23) 604.1 54.7 445.2 0.8Divestiture of subsidiary (note 23) (64.7) – (48.5) –Foreign exchange effect and other (16.2) 4.1 33.7 (16.7)
Balance – December 31 2,752.3 1,906.2 1,086.4 788.8
11. Deferred Premium Acquisition Costs
Changes in deferred premium acquisition costs for the years ended December 31 were as follows:
2017 2016
Balance – January 1 693.1 532.7Premium acquisition costs deferred 2,380.2 1,851.1Amortization (2,140.7) (1,696.2)Divestiture of subsidiary (note 23) (15.8) –Foreign exchange effect and other 10.7 5.5
Balance – December 31 927.5 693.1
72

12. Goodwill and Intangible Assets
Goodwill and intangible assets were comprised as follows:
Goodwill Intangible assets Total
Lloyd’s Customer Computerparticipation and broker Brand software
rights(1) relationships names(1) and other
Balance – January 1, 2017 1,633.7 420.5 431.8 1,014.4 347.1 3,847.5Additions 1,212.3 87.4 672.8 87.5 172.9 2,232.9Disposals (1.7) – – – (0.2) (1.9)Amortization and impairment (0.1) – (67.9) – (91.5) (159.5)Foreign exchange effect and other 60.5 – 11.1 69.5 12.4 153.5
Balance – December 31, 2017 2,904.7 507.9 1,047.8 1,171.4 440.7 6,072.5
Gross carrying amount 2,911.8 507.9 1,266.7 1,171.4 767.7 6,625.5Accumulated amortization – – (218.9) – (311.5) (530.4)Accumulated impairment (7.1) – – – (15.5) (22.6)
2,904.7 507.9 1,047.8 1,171.4 440.7 6,072.5
Goodwill Intangible assets Total
Lloyd’s Customer Computerparticipation and broker Brand software
rights(1) relationships names(1) and other
Balance – January 1, 2016 1,428.2 420.5 385.6 723.3 257.3 3,214.9Additions 216.0 – 73.8 280.9 163.4 734.1Disposals – – – – (0.1) (0.1)Amortization and impairment (7.0) – (35.3) – (68.9) (111.2)Foreign exchange effect and other (3.5) – 7.7 10.2 (4.6) 9.8
Balance – December 31, 2016 1,633.7 420.5 431.8 1,014.4 347.1 3,847.5
Gross carrying amount 1,640.7 420.5 578.6 1,014.4 599.5 4,253.7Accumulated amortization – – (146.8) – (237.7) (384.5)Accumulated impairment (7.0) – – – (14.7) (21.7)
1,633.7 420.5 431.8 1,014.4 347.1 3,847.5
(1) Not subject to amortization.
73

FAIRFAX FINANCIAL HOLDINGS LIMITED
Goodwill and intangible assets are allocated to the company’s cash-generating units (‘‘CGUs’’) as follows:
December 31, 2017 December 31, 2016
Intangible IntangibleGoodwill assets Total Goodwill assets Total
Allied World 938.9 763.7 1,702.6 – – –Cara 222.3 1,073.6 1,295.9 211.5 990.3 1,201.8Brit 154.3 571.3 725.6 154.3 576.6 730.9Zenith National 317.6 115.5 433.1 317.6 121.4 439.0Crum & Forster 188.8 129.4 318.2 186.5 145.1 331.6Quess 229.0 21.8 250.8 23.7 18.5 42.2Thomas Cook India 150.0 54.2 204.2 115.3 50.1 165.4Northbridge 95.7 77.1 172.8 88.3 64.5 152.8OdysseyRe 119.7 51.6 171.3 119.7 55.2 174.9AMAG 44.7 110.2 154.9 72.6 63.0 135.6All other(1) 443.7 199.4 643.1 344.2 129.1 473.3
2,904.7 3,167.8 6,072.5 1,633.7 2,213.8 3,847.5
(1) Comprised primarily of balances related to NCML, Fairchem, Mosaic Capital, Boat Rocker, The Keg, U.S. Run-offand Pethealth.
At December 31, 2017 goodwill and intangible assets were comprised primarily of amounts arising on theacquisitions of Allied World and Manipal (by Quess) during 2017, St-Hubert and Original Joe’s (both by Cara) during2016, Cara and Brit during 2015, Quess during 2013, Thomas Cook India during 2012, and Zenith National during2010. Impairment tests for goodwill and intangible assets not subject to amortization were completed in 2017 and itwas concluded that no impairments had occurred. Allied World’s recoverable amount exceeded its carrying value(inclusive of goodwill), but the excess was not significant as a result of being acquired only on July 6, 2017.
When testing for impairment, the recoverable amount of each CGU or group of CGUs was based on the higher of fairvalue less costs of disposal or value in use, determined on the basis of market prices where available, or discountedcash flow models. Cash flow projections covering a five year period were derived from financial budgets approved bymanagement. Cash flows beyond the five year period were extrapolated using estimated growth rates which do notexceed the long term average historic growth rate for the business in which each CGU operates.
A number of other assumptions and estimates including premium volumes, investment returns, revenues, expensesand working capital requirements were required to be incorporated into the discounted cash flow models. Theforecasts were based on the best estimates of future premiums or revenues and operating expenses using historicaltrends, general geographical market conditions, industry trends and forecasts and other available information. Theseassumptions and estimates were reviewed by the applicable CGU’s management and by head office management.The cash flow forecasts are adjusted by applying appropriate after-tax discount rates within a range of 7.8% to 15.4%for insurance business and 9.2% to 21.3% for non-insurance business. A long term investment return of 5.0% wasapplied to the investment portfolios of insurance businesses. The weighted average annual growth rate used toextrapolate cash flows beyond five years for the majority of the CGUs was 3.0%.
74

13. Other Assets
Other assets were comprised as follows:
December 31, 2017 December 31, 2016
Insurance and Non- Insurance and Non-reinsurance insurance reinsurance insurance
companies companies Total companies companies Total
Premises and equipment 403.0 847.3 1,250.3 251.9 639.6 891.5
Other reporting segment investment properties (note 23) – 1,168.4 1,168.4 – – –
Other reporting segment sales receivables – 470.0 470.0 – 295.2 295.2
Other reporting segment inventories – 320.7 320.7 – 235.5 235.5
Receivables for securities sold but not yet settled 207.3 – 207.3 15.6 26.5 42.1
Prepaid expenses 83.7 102.5 186.2 59.7 64.4 124.1
Income taxes refundable 83.1 63.9 147.0 174.7 28.0 202.7
Accrued interest and dividends 105.2 16.2 121.4 97.3 9.5 106.8
Deferred compensation plans 67.1 – 67.1 63.4 – 63.4
Pension surplus (note 21) 49.1 – 49.1 50.8 – 50.8
Other 565.5 275.3 840.8 307.3 199.0 506.3
1,564.0 3,264.3 4,828.3 1,020.7 1,497.7 2,518.4
Current 788.5 1,069.0 1,857.5 487.5 792.9 1,280.4
Non-current 775.5 2,195.3 2,970.8 533.2 704.8 1,238.0
1,564.0 3,264.3 4,828.3 1,020.7 1,497.7 2,518.4
14. Accounts Payable and Accrued Liabilities
Accounts payable and accrued liabilities were comprised as follows:
December 31, 2017 December 31, 2016
Insurance and Non- Insurance and Non-reinsurance insurance reinsurance insurance
companies companies Total companies companies Total
Other reporting segment payables related to cost of sales – 530.8 530.8 – 416.7 416.7
Payable to reinsurers 428.2 – 428.2 498.3 – 498.3
Salaries and employee benefit liabilities 296.8 77.3 374.1 218.3 31.2 249.5
Deferred gift card, hospitality and other revenue 27.3 294.7 322.0 20.9 263.4 284.3
Pension and post retirement liabilities (note 21) 227.1 23.7 250.8 196.2 20.7 216.9
Amounts withheld and accrued taxes 205.2 43.4 248.6 169.7 48.5 218.2
Ceded deferred premium acquisition costs 161.4 – 161.4 84.7 – 84.7
Accrued rent, storage and facilities costs 33.1 59.7 92.8 17.1 47.7 64.8
Amounts payable to agents and brokers 90.4 0.1 90.5 30.5 0.1 30.6
Accrued commissions 79.8 0.4 80.2 85.4 – 85.4
Accrued premium taxes 66.6 – 66.6 55.2 – 55.2
Accrued interest expense 48.0 3.4 51.4 41.4 2.1 43.5
Accrued legal and professional fees 37.7 10.7 48.4 29.6 8.5 38.1
Amounts payable for securities purchased but not yet settled 18.2 – 18.2 14.4 – 14.4
Administrative and other 621.7 243.8 865.5 453.3 134.7 588.0
2,341.5 1,288.0 3,629.5 1,915.0 973.6 2,888.6
Current 1,429.7 1,019.7 2,449.4 1,174.7 770.8 1,945.5
Non-current 911.8 268.3 1,180.1 740.3 202.8 943.1
2,341.5 1,288.0 3,629.5 1,915.0 973.6 2,888.6
75

FAIRFAX FINANCIAL HOLDINGS LIMITED
15. Borrowings
December 31, 2017 December 31, 2016
Carrying Fair Carrying FairPrincipal value(a) value(b) Principal value(a) value(b)
Borrowings – holding companyFairfax unsecured notes:
7.375% due April 15, 2018(e) 144.2 144.2 146.4 144.2 144.2 153.87.50% due August 19, 2019 (Cdn$400.0)(d)(1)(7) – – – 298.3 297.0 334.47.25% due June 22, 2020 (Cdn$275.0)(d)(7) 213.3 212.7 235.6 205.1 204.2 233.65.80% due May 15, 2021(d) 500.0 498.0 534.1 500.0 497.4 538.96.40% due May 25, 2021 (Cdn$400.0)(d)(7) 315.7 314.4 349.4 298.3 296.5 337.35.84% due October 14, 2022 (Cdn$450.0)(d) 359.2 362.5 397.2 335.6 339.6 373.94.50% due March 22, 2023 (Cdn$400.0) 319.2 316.8 333.5 298.3 295.4 310.64.875% due August 13, 2024(d) 300.0 296.2 313.4 300.0 295.6 297.84.95% due March 3, 2025 (Cdn$350.0)(d) 279.3 275.5 297.1 261.0 256.6 272.68.30% due April 15, 2026(e) 91.8 91.6 116.3 91.8 91.6 109.94.70% due December 16, 2026 (Cdn$450.0) 359.2 356.6 371.7 335.6 332.7 338.94.25% due December 6, 2027 (Cdn$650.0)(3) 518.8 516.2 514.7 – – –7.75% due July 15, 2037(e) 91.3 90.4 114.1 91.3 90.4 104.2
Revolving credit facility – – – 200.0 200.0 200.0Purchase consideration payable due 2017 and other(2) – – – 131.3 131.3 131.3
3,492.0 3,475.1 3,723.5 3,490.8 3,472.5 3,737.2
Borrowings – insurance and reinsurance companiesAllied World senior notes:
5.50% due November 1, 2020 300.0 320.4 320.0 – – –4.35% due October 29, 2025 500.0 508.4 507.3 – – –
Allied World revolving credit facility and other borrowings 45.0 49.2 49.2 – – –OdysseyRe floating rate unsecured senior notes due 2021 90.0 89.8 93.0 90.0 89.8 94.1Brit 6.625% subordinated notes due December 9, 2030 (£135.0) 182.6 188.5 199.0 166.8 175.9 169.0Brit floating rate revolving credit facility(4) 45.0 45.0 45.0 – – –First Mercury trust preferred securities due 2036 and 2037 41.4 41.4 41.4 41.4 41.4 41.4Zenith National 8.55% debentures due August 1, 2028(d) 38.4 38.2 38.2 38.4 38.2 38.2Advent floating rate subordinated notes due June 3, 2035(d) 48.4 47.1 47.8 46.7 45.4 41.5Advent floating rate unsecured senior notes due 2026(d) 46.0 45.0 46.0 46.0 44.8 46.0
1,336.8 1,373.0 1,386.9 429.3 435.5 430.2
Borrowings – non-insurance companies(c)
Fairfax India floating rate term loan due July 11, 2018(6) 400.0 400.0 400.0 225.0 223.8 223.8Fairfax India subsidiary borrowings 186.1 186.1 186.1 80.8 80.8 80.8Fairfax Africa floating rate term loan due January 31, 2018(5) 150.0 150.0 150.0 – – –Grivalia Properties term loans and revolving facility 160.4 160.4 160.4 – – –Cara floating rate term loan due September 2, 2019 (Cdn$150.0) 119.7 119.3 119.3 111.9 111.4 111.4Cara floating rate credit facility expiring September 2, 2021 182.8 181.7 181.7 180.5 179.1 179.1The Keg 7.5% note due May 31, 2042 (Cdn$57.0) 45.5 45.5 45.5 42.5 42.5 42.5The Keg floating rate revolving facility and term loan due July 2,
2020 31.9 31.7 31.7 20.9 20.7 20.7Loans and revolving credit facilities primarily at floating rates 291.7 291.3 291.4 201.8 201.3 200.7
1,568.1 1,566.0 1,566.1 863.4 859.6 859.0
Total debt 6,396.9 6,414.1 6,676.5 4,783.5 4,767.6 5,026.4
(a) Principal net of unamortized issue costs and discounts (premiums).
(b) Based principally on quoted market prices with the remainder based on discounted cash flow models using marketobservable inputs (Levels 1 and 2 respectively in the fair value hierarchy).
(c) These borrowings are non-recourse to the holding company.
(d) Redeemable at the issuer’s option at any time at certain prices specified in the instrument’s offering document.
(e) This debt has no provision for redemption prior to the contractual maturity date.
76

During 2017 the company and its subsidiaries completed the following debt transactions:
(1) On December 29, 2017 the company completed an early redemption of its remaining Cdn$388.4 principalamount 7.5% unsecured senior notes due August 19, 2019 for cash consideration of $340.6 (Cdn$430.6),including accrued interest, and recognized a loss on repurchase of long term debt of $26.0 (Cdn$32.8) in otherexpenses in the consolidated statement of earnings.
(2) On December 13, 2017 the company repaid $124.9 principal amount of purchase consideration payableupon maturity.
(3) On December 4, 2017 the company completed an underwritten public offering of Cdn$650.0 principal amountof 4.25% unsecured senior notes due December 6, 2027 at an issue price of 99.992 for net proceeds after discount,commissions and expenses of $509.5 (Cdn$646.8). Commissions and expenses of $2.4 (Cdn$3.1) were includedas part of the carrying value of the notes. The notes are redeemable at any time prior to September 6, 2027, at thecompany’s option, in whole or in part, at the greater of (i) a specified redemption price based on the then currentyield of a Government of Canada bond with an equal term to maturity or (ii) par, and at any time on or afterSeptember 6, 2027 at par. The company has designated these senior notes as a hedge of a portion of its netinvestment in its Canadian subsidiaries.
(4) On November 29, 2017 Brit drew $45.0 on its revolving credit facility that was subsequently repaid onJanuary 5, 2018.
(5) On August 31, 2017 Fairfax Africa entered into a $150.0 five-month floating rate term loan and a $153.9(2 billion South African rand) non-revolving seven-month letter of credit facility with a Canadian charteredbank that required cash collateral of $150.0 and $162.0 respectively. On December 11, 2017 the letter of creditfacility was terminated with the $162.0 cash collateral released on January 12, 2018. On January 31, 2018 FairfaxAfrica extended the maturity of the $150.0 term loan to August 31, 2018.
(6) On March 31, 2017 Fairfax India repaid its floating rate secured term loan of $225.0. On July 11, 2017 FairfaxIndia entered into a $400.0 one-year floating rate term loan with a Canadian chartered bank and used a portionof the proceeds to fund an additional investment in Bangalore Airport (note 6).
(7) On March 15, 2017 the company closed its tender offers to purchase a targeted aggregate principal amount of upto Cdn$250.0 of certain of its outstanding senior notes. Pursuant to those tender offers, the company purchasedprincipal amounts of $8.7, $5.8 and $3.3 of its notes due in 2019, 2020 and 2021 for cash consideration of $9.7,$6.6 and $3.7 respectively.
Changes in the carrying values of borrowings for the years ended December 31 were as follows:
2017 2016
Insurance Insuranceand Non- and Non-
Holding reinsurance insurance Holding reinsurance insurancecompany companies companies Total company companies companies Total
Balance – January 1 3,472.5 435.5 859.6 4,767.6 2,599.0 468.5 284.0 3,351.5Net cash inflows (outflows)
from issuances andrepayments (174.2) 67.5 425.6 318.9 832.3 – 515.2 1,347.5
Non-cash changes:Acquisitions (note 23) – 860.5 221.5 1,082.0 – – 60.4 60.4Loss on redemption 28.6 – – 28.6 – – – –Foreign exchange effect and
other 148.2 9.5 59.3 217.0 41.2 (33.0) – 8.2
Balance – December 31 3,475.1 1,373.0 1,566.0 6,414.1 3,472.5 435.5 859.6 4,767.6
77

FAIRFAX FINANCIAL HOLDINGS LIMITED
Principal repayments on borrowings are due as follows:
2018 2019 2020 2021 2022 Thereafter Total
Holding company 144.2 – 213.3 815.7 359.2 1,959.6 3,492.0Insurance and reinsurance companies 5.0 – 345.0 90.0 – 896.8 1,336.8Non-insurance companies 855.9 187.8 131.4 242.5 49.4 101.1 1,568.1
Total 1,005.1 187.8 689.7 1,148.2 408.6 2,957.5 6,396.9
Credit Facility – Holding company
On December 21, 2017 the company increased its unsecured revolving credit facility with a syndicate of lenders to$2.0 billion from $1.0 billion and extended the expiry to December 21, 2021 from May 11, 2019. The credit facilitycontains certain financial covenants that require the company to maintain a ratio of consolidated debt toconsolidated capitalization of not more than 0.35:1 and consolidated shareholders’ equity attributable toshareholders of Fairfax of not less than $9.5 billion. At December 31, 2017 there were no amounts drawn on thecredit facility and the company was in compliance with its covenants (consolidated debt to consolidatedcapitalization ratio of 0.24:1 and consolidated shareholders’ equity attributable to shareholders of Fairfax of$13.8 billion).
16. Total Equity
Equity attributable to shareholders of Fairfax
Authorized capital
The authorized share capital of the company consists of an unlimited number of preferred shares issuable in series, anunlimited number of multiple voting shares (cumulatively carrying 41.8% voting power) and an unlimited numberof subordinate voting shares carrying one vote per share.
Issued capital
Issued capital at December 31, 2017 included 1,548,000 (December 31, 2016 – 1,548,000) multiple voting shares and27,904,801 (December 31, 2016 – 23,004,207) subordinate voting shares without par value prior to deducting902,498 (December 31, 2016 – 659,411) subordinate voting shares reserved in treasury for share-based paymentawards. The multiple voting shares are not traded.
Common stock
The number of shares outstanding was as follows:
2017 2016
Subordinate voting shares – January 1 22,344,796 21,465,089Issuances during the year 5,084,961 1,000,000Repurchases for cancellation (184,367) (30,732)Treasury shares acquired (277,364) (130,075)Treasury shares reissued 34,277 40,514
Subordinate voting shares – December 31 27,002,303 22,344,796Multiple voting shares – beginning and end of year 1,548,000 1,548,000Interest in multiple and subordinate voting shares held through ownership interest
in shareholder – beginning and end of year (799,230) (799,230)
Common stock effectively outstanding – December 31 27,751,073 23,093,566
During 2017 the company issued 5,084,961 subordinate voting shares, of which 5,075,894 shares with a fair value of$2,191.6 were issued pursuant to the acquisition of Allied World as described in note 23.
78

During 2017 the company repurchased for cancellation 184,367 subordinate voting shares (2016 – 30,732) under theterms of its normal course issuer bids at a cost of $96.2 (2016 – $14.1), of which $50.6 (2016 – $8.0) was charged toretained earnings. Subsequent to December 31, 2017 and up to March 9, 2018 the company repurchased forcancellation 20,000 subordinate voting shares under the terms of its normal course issuer bid at a cost of $9.9.
During 2017 the company repurchased for treasury 277,364 subordinate voting shares at a cost of $140.5 (2016 –130,075 subordinate voting shares at a cost of $64.2) on the open market for use in its share-based payment awards.Subsequent to December 31, 2017 and up to March 9, 2018 the company repurchased for treasury47,372 subordinate voting shares at a cost of $24.3 on the open market for use in its share-based payment awards.
Dividends paid by the company on its outstanding multiple voting and subordinate voting shares were as follows:
TotalDividend cash
Date of declaration Date of record Date of payment per share payment
January 3, 2018 January 18, 2018 January 25, 2018 $10.00 $283.2January 4, 2017 January 19, 2017 January 26, 2017 $10.00 $237.4January 5, 2016 January 20, 2016 January 27, 2016 $10.00 $227.8
Preferred stock
The number of preferred shares outstanding was as follows:
Series C Series D Series E Series F Series G Series H Series I Series J Series K Series M Total
January 1, 2016 6,016,384 3,983,616 3,967,134 3,572,044 7,432,952 2,567,048 10,465,553 1,534,447 9,500,000 9,200,000 58,239,178
2016 activity: – – – – – – – – – – –
December 31, 2016 6,016,384 3,983,616 3,967,134 3,572,044 7,432,952 2,567,048 10,465,553 1,534,447 9,500,000 9,200,000 58,239,178
2017 activity: – – – – – – – – – – –
December 31, 2017 6,016,384 3,983,616 3,967,134 3,572,044 7,432,952 2,567,048 10,465,553 1,534,447 9,500,000 9,200,000 58,239,178
The carrying value of preferred shares outstanding was as follows:
Series C Series D Series E Series F Series G Series H Series I Series J Series K Series M Total
January 1, 2016 136.7 90.5 90.8 81.8 175.3 60.6 251.6 36.9 231.7 179.0 1,334.9
2016 activity:
Other – – – – – – – – – 0.6 0.6
December 31, 2016 136.7 90.5 90.8 81.8 175.3 60.6 251.6 36.9 231.7 179.6 1,335.5
2017 activity: – – – – – – – – – – –
December 31, 2017 136.7 90.5 90.8 81.8 175.3 60.6 251.6 36.9 231.7 179.6 1,335.5
The terms of the company’s cumulative five-year rate reset preferred shares at December 31, 2017 were as follows:
FloatingNext possible Number of Liquidation Fixed dividend rate
redemption and shares preference dividend rate perconversion date(1)(2) outstanding Stated capital per share per annum annum(3)
Series C December 31, 2019 6,016,384 Cdn$150.4 Cdn $25.00 4.58% –Series D December 31, 2019 3,983,616 Cdn$99.6 Cdn $25.00 – 4.02%Series E March 31, 2020 3,967,134 Cdn$99.2 Cdn $25.00 2.91% –Series F March 31, 2020 3,572,044 Cdn$89.3 Cdn $25.00 – 3.03%Series G September 30, 2020 7,432,952 Cdn$185.8 Cdn $25.00 3.32% –Series H September 30, 2020 2,567,048 Cdn$64.2 Cdn $25.00 – 3.43%Series I December 31, 2020 10,465,553 Cdn$261.6 Cdn $25.00 3.71% –Series J December 31, 2020 1,534,447 Cdn$38.4 Cdn $25.00 – 3.72%Series K March 31, 2022 9,500,000 Cdn$237.5 Cdn $25.00 4.67% –Series M March 31, 2020 9,200,000 Cdn$230.0 Cdn $25.00 4.75% –
(1) Fixed and floating rate cumulative preferred shares are redeemable at the company’s option at each stated redemption dateand on each subsequent five-year anniversary date at Cdn$25.00 per share.
(2) Holders of Series C, Series E, Series G, Series I, Series K and Series M fixed rate cumulative preferred shares will have theright, at their option, to convert their shares into floating rate cumulative preferred shares Series D, Series F, Series H,
79

FAIRFAX FINANCIAL HOLDINGS LIMITED
Series J, Series L and Series N respectively, at the conversion dates specified in the table above, and on each subsequentfive-year anniversary date. Holders of Series D, Series F, Series H and Series J floating rate cumulative preferred shares willhave the right, at their option, to convert their shares into fixed rate cumulative preferred shares Series C, Series E, Series Gand Series I respectively, at the conversion dates specified in the table above, and on each subsequent five-yearanniversary date.
(3) The Series D, Series F, Series H, and Series J preferred shares, and the Series L and Series N preferred shares (of which noneare currently issued), have a floating dividend rate equal to the three-month Government of Canada treasury bill yield plus3.15%, 2.16%, 2.56%, 2.85%, 3.51% and 3.98% respectively, with rate resets at the end of each calendar quarter.
During 2017 the company paid aggregate preferred share dividends of $44.6 (2016 – $44.0).
Accumulated other comprehensive income (loss)
The amounts related to each component of accumulated other comprehensive income (loss) attributable toshareholders of Fairfax were as follows:
December 31, 2017 December 31, 2016
Income tax Income taxPre-tax (expense) After-tax Pre-tax (expense) After-tax
amount recovery amount amount recovery amount
Items that may be subsequently reclassifiedto net earningsCurrency translation account (166.6) 2.8 (163.8) (356.6) (7.6) (364.2)Share of accumulated other comprehensive loss
of associates, excluding share of net losses ondefined benefit plans of associates (22.0) 0.5 (21.5) (157.1) 26.3 (130.8)
(188.6) 3.3 (185.3) (513.7) 18.7 (495.0)
Items that will not be subsequentlyreclassified to net earningsShare of net losses on defined benefit plans of
associates (30.3) 3.5 (26.8) (42.6) 10.8 (31.8)Net losses on defined benefit plans (60.9) 8.9 (52.0) (28.0) 6.9 (21.1)
(91.2) 12.4 (78.8) (70.6) 17.7 (52.9)
Accumulated other comprehensive lossattributable to shareholders of Fairfax (279.8) 15.7 (264.1) (584.3) 36.4 (547.9)
Non-controlling interests
Non-controlling interests for the years ended December 31 were as follows:
Net earnings(loss) attributable to
non-controllinginterests
2017 2016Year ended
Minority MinorityDecember 31,
voting Carrying voting CarryingSubsidiary Domicile percentage value percentage value 2017 2016
Allied World(1) Switzerland 32.6% 1,229.4 – – (182.3) –Fairfax India(2) Canada 6.4% 1,110.7 4.7% 743.7 (59.9) 24.4Cara(3) Canada 43.3% 578.0 43.4% 523.9 55.7 30.8Grivalia Properties(4) Greece 47.3% 517.6 – – 20.0 –Brit(5) U.K. 27.5% 435.3 27.5% 463.4 (19.1) 50.4Thomas Cook India(6) India 32.4% 391.2 32.3% 139.6 28.2 2.4Fairfax Africa(7) Canada 1.2% 191.6 – – 4.3 –All other – 147.1 129.4 27.4 9.8
4,600.9 2,000.0 (125.7) 117.8
Pursuant to the transactions described in note 23:
(1) During the third quarter of 2017 the company acquired an indirect 67.4% equity interest in Allied World.
80

(2) The increase in carrying value of Fairfax India’s non-controlling interests at December 31, 2017 compared toDecember 31, 2016 was primarily due to common shares issued as a result of Fairfax India’s public offering andprivate placement on January 13, 2017, the acquisition of a 51.0% interest in Saurashtra Freight, the merger ofFairchem and Privi Organics, and the impact of foreign currency translation (principally the strengthening ofthe Indian rupee relative to the U.S. dollar), partially offset by non-controlling interests’ share of net loss.
(3) The increase in carrying value of Cara’s non-controlling interests at December 31, 2017 compared toDecember 31, 2016 was primarily due to net earnings and the impact of foreign currency translation(strengthening of the Canadian dollar relative to the U.S. dollar), partially offset by repurchase of shares by Caraand dividends paid.
(4) On July 4, 2017 the company increased its equity interest in Grivalia Properties to 52.6% and commencedconsolidating Grivalia Properties in the Other reporting segment.
(5) On March 3, 2017 Brit paid a dividend of $45.8 to its minority shareholder (OMERS).
(6) The increase in carrying value of Thomas Cook India’s non-controlling interests at December 31, 2017 comparedto December 31, 2016 was primarily due to a reduction in the company’s indirect ownership of Quess from42.1% to 33.1%.
(7) On February 17, 2017 the company acquired a 64.2% equity interest in Fairfax Africa.
Non-controlling interest voting percentages in the table above are consistent with economic ownership for eachsubsidiary at December 31, 2017 except for Fairfax India, Cara, and Fairfax Africa whose non-controlling interesteconomic ownership percentages were 69.8%, 59.8%, and 35.8% respectively.
Other net changes in capitalization
Other net changes in capitalization on the consolidated statement of changes in equity generally reflect the impactof capital transactions and changes in ownership interests of consolidated subsidiaries where the companymaintains control after the transaction. During 2017 other net changes in capitalization increased both equityattributable to shareholders of Fairfax ($236.6) and non-controlling interests ($184.0), and principally reflected theimpact of capital transactions and changes in ownership interest related to Fairfax India’s public offering and privateplacement, Thomas Cook India’s partial sale of Quess shares, Quess’ private placement of its own shares, sharesissued by Quess to acquire Manipal, and the acquisition of the remaining shares of Allied World AG. See note 23for details.
17. Earnings per Share
Net earnings (loss) per share is calculated based upon the weighted average common shares outstanding as follows:
2017 2016
Net earnings (loss) attributable to shareholders of Fairfax 1,740.6 (512.5)Preferred share dividends (44.6) (44.0)
Net earnings (loss) attributable to common shareholders – basic and diluted 1,696.0 (556.5)
Weighted average common shares outstanding – basic 25,411,246 23,017,184Share-based payment awards 689,571 –
Weighted average common shares outstanding – diluted 26,100,817 23,017,184
Net earnings (loss) per common share – basic $ 66.74 $ (24.18)Net earnings (loss) per common share – diluted $ 64.98 $ (24.18)
Share-based payment awards of 567,450 were not included in the calculation of net loss per diluted common sharefor the year ended December 31, 2016 as inclusion of the awards would be anti-dilutive.
81

FAIRFAX FINANCIAL HOLDINGS LIMITED
18. Income Taxes
The company’s provision (recovery) for income taxes for the years ended December 31 were as follows:
2017 2016
Current income taxCurrent year expense 200.6 95.1Adjustments to prior years’ income taxes (22.6) 19.1
178.0 114.2
Deferred income taxOrigination and reversal of temporary differences (22.5) (265.6)Adjustments to prior years’ deferred income taxes 24.3 2.9Change in tax rate related to U.S. tax reform 222.4 –Other 6.1 (11.1)
230.3 (273.8)
Provision (recovery) for income taxes 408.3 (159.6)
A significant portion of the company’s earnings or losses before income taxes may be earned or incurred outside ofCanada. The statutory income tax rates for jurisdictions outside of Canada generally differs from the Canadianstatutory income tax rate (and may be significantly higher or lower). The company’s earnings (loss) before incometaxes by jurisdiction and the associated provision (recovery) for income taxes for the years ended December 31 aresummarized in the following table:
2017 2016
Canada(1) U.S.(2) U.K.(3) Other(4) Total Canada(1) U.S.(2) U.K.(3) Other(4) Total
Earnings (loss) before incometaxes (141.3) 543.5 (72.1) 1,693.1 2,023.2 (258.5) (428.4) 42.2 90.4 (554.3)
Provision (recovery) forincome taxes 52.9 420.5 (24.6) (40.5) 408.3 69.6 (234.6) (23.7) 29.1 (159.6)
Net earnings (loss) (194.2) 123.0 (47.5) 1,733.6 1,614.9 (328.1) (193.8) 65.9 61.3 (394.7)
(1) Includes Fairfax India and Fairfax Africa.
(2) Principally comprised of Crum & Forster, Zenith National, OdysseyRe (notwithstanding that certain operations ofOdysseyRe conduct business outside of the U.S.), U.S. Run-off and other associated holding company results.
(3) Principally comprised of Brit, Riverstone UK, Advent and other associated holding company results.
(4) Includes India, Asia, non-U.K. European companies and Allied World (acquired on July 6, 2017; notwithstanding thatcertain operations of Allied World conduct business in the U.S. and the U.K., the majority of Allied World’s net earnings(loss) is sourced from its Bermuda operations).
The decrease in the pre-tax loss in Canada in 2017 compared to 2016 primarily reflected an improvement ininvestment results. The increase in pre-tax earnings in the U.S. in 2017 compared to 2016 primarily reflected animprovement in investment results, partially offset by weaker underwriting results (reflecting increased catastrophelosses). The increase in the pre-tax loss in the U.K. in 2017 compared to 2016 primarily reflected weaker underwritingresults (reflecting increased catastrophe losses). The increase in pre-tax earnings in Other in 2017 compared to 2016primarily reflected the gains on sale of First Capital and a portion of the company’s investment in ICICI Lombard,partially offset by the underwriting loss at Allied World (reflecting catastrophe losses).
82

Reconciliations of the provision (recovery) for income taxes calculated at the Canadian statutory income tax rate tothe provision (recovery) for income taxes at the effective tax rate in the consolidated financial statements for theyears ended December 31 are summarized in the following table:
2017 2016
Canadian statutory income tax rate 26.5% 26.5%
Provision (recovery) for income taxes at the Canadian statutory income tax rate 536.1 (146.9)Tax rate differential on income and losses incurred outside Canada (445.3) (65.3)Non-taxable investment income (116.2) (74.7)Change in unrecorded tax benefit of losses and temporary differences 210.2 117.5Change in tax rate for deferred income taxes related to U.S. tax reform 222.4 –Change in tax rate for deferred income taxes (excluding U.S. tax reform) 2.2 (15.1)Other including permanent differences (15.6) 11.3Foreign exchange effect 12.8 (8.4)Provision relating to prior years 1.7 22.0
Provision (recovery) for income taxes 408.3 (159.6)
The tax rate differential on income and losses incurred outside Canada of $445.3 in 2017 principally reflected theimpact of net gains on the sales of ICICI Lombard and First Capital which were not taxable in the jurisdictions inwhich they were held (income tax rate benefits of $246.5 in Mauritius and $269.9 in Barbados respectively), partiallyoffset by income in the U.S. that is taxed at rates higher than the Canadian statutory rate and losses at Allied Worldand in the U.K. that are taxed at rates lower than the Canadian statutory rate. The tax rate differential on income andlosses incurred outside Canada of $65.3 in 2016 principally reflected income in the U.K. that is taxed at rates lowerthan the Canadian statutory rate and losses in the U.S. which are taxed at rates higher than the Canadianstatutory rate.
Non-taxable investment income of $116.2 in 2017 (2016 – $74.7) was principally comprised of dividend income,non-taxable interest income, the 50% of net capital gains which are not taxable in Canada and share of profit ofassociates in certain jurisdictions.
The change in unrecorded tax benefit of losses and temporary differences of $210.2 in 2017 principally reflecteddeferred tax assets in Canada of $70.8 (2016 – $117.9) that were not recorded (as it was considered not probable thatthose losses could be utilized) and a reduction in tax credits and operating losses capitalized in prior years in theU.S. of $89.7 (2016 – nil), primarily driven by the effects of U.S. tax reform as discussed later in this note.
The change in tax rate related to U.S. tax reform of $222.4 (2016 – nil) principally reflected the impact of thereduction of the U.S. federal corporate income tax rate on the net deferred income tax asset. Other includingpermanent differences included an income tax rate benefit of $7.4 related to the impact of the transition tax underU.S. tax reform. The impact of U.S. tax reform on the company’s consolidated financial statements is discussed laterin this note.
Income taxes refundable and payable were as follows:
December 31, December 31,2017 2016
Income taxes refundable 147.0 202.7Income taxes payable (95.6) (35.4)
Net income taxes refundable 51.4 167.3
83

FAIRFAX FINANCIAL HOLDINGS LIMITED
Changes in net income taxes refundable during the years ended December 31 were as follows:
2017 2016
Balance – January 1 167.3 12.1Amounts recorded in the consolidated statements of earnings (178.0) (114.2)Payments made during the year 33.4 267.1Acquisitions of subsidiaries (note 23) 18.8 3.9Foreign exchange effect and other 9.9 (1.6)
Balance – December 31 51.4 167.3
Changes in the net deferred income tax asset during the years ended December 31 were as follows:
2017
ProvisionOperating for losses Provision Deferred
and and loss for premium Intan-capital adjustment unearned acquisition gible Invest- Tax
losses expenses premiums costs assets ments credits Other Total
Balance – January 1, 2017 188.8 182.3 126.6 (120.0) (347.6) 331.9 224.3 146.3 732.6Amounts recorded in the consolidated
statement of earnings (41.2) (72.3) (15.0) (0.6) 111.0 (140.1) (106.0) 33.9 (230.3)Amounts recorded in total equity – – – – – (15.5) (0.1) (5.1) (20.7)Acquisitions of subsidiaries (note 23) 33.1 20.5 (19.8) 53.6 (195.2) 0.9 – 5.4 (101.5)Foreign exchange effect and other 7.0 0.8 0.1 0.3 (11.7) 0.3 (0.1) 4.0 0.7
Balance – December 31, 2017 187.7 131.3 91.9 (66.7) (443.5) 177.5 118.1 184.5 380.8
2016
ProvisionOperating for losses Provision Deferred
and and loss for premium Intan-capital adjustment unearned acquisition gible Invest- Tax
losses expenses premiums costs assets ments credits Other Total
Balance – January 1, 2016 235.4 204.2 92.8 (96.9) (325.4) 49.0 174.9 129.9 463.9Amounts recorded in the consolidated
statement of earnings (57.8) (22.7) 31.8 (24.1) 27.9 266.9 49.4 2.4 273.8Amounts recorded in total equity – – – – – 17.7 – 19.6 37.3Acquisitions of subsidiaries (note 23) 9.7 – (0.3) 0.7 (47.7) (1.1) – (14.5) (53.2)Foreign exchange effect and other 1.5 0.8 2.3 0.3 (2.4) (0.6) – 8.9 10.8
Balance – December 31, 2016 188.8 182.3 126.6 (120.0) (347.6) 331.9 224.3 146.3 732.6
Management expects that the deferred income tax asset will be realized in the normal course of operations. The mostsignificant temporary differences included in the deferred income tax asset at December 31, 2017 related toinvestments and provision for losses and loss adjustment expenses, partially offset by a deferred income tax liabilityrelated to intangible assets. The temporary differences related to investments are primarily due to net unrealizedinvestment losses in the U.S. In these consolidated financial statements, investment gains and losses are primarilyrecognized on a mark-to-market basis but are only recognized for tax purposes when realized (particularly in the U.S.and several other jurisdictions). The provision for losses and loss adjustment expenses is recorded on anundiscounted basis in these consolidated financial statements but is recorded on a discounted basis in certainjurisdictions for tax purposes, resulting in temporary differences. Deferred taxes on intangible assets primarily relatesto intangible assets recognized on acquisitions (principally Allied World, Cara and Brit) that are typically notdeductible in the determination of income taxes payable. Other deferred taxes include temporary differences relatedto pensions and premises and equipment.
Management conducts ongoing reviews of the recoverability of the deferred income tax asset and adjusts, asnecessary, to reflect its anticipated realization. As at December 31, 2017 management has not recorded deferredincome tax assets of $878.3 (December 31, 2016 – $590.0) related primarily to operating and capital losses and
84

U.S. foreign tax credits. The losses for which deferred income tax assets have not been recorded are comprised of$1,516.4 of losses in Canada (December 31, 2016 – $1,064.7), $635.7 of losses in Europe (December 31, 2016 –$585.7), $44.6 of losses in the U.S. (December 31, 2016 – $44.6), and $159.0 of foreign tax credits in theU.S. (December 31, 2016 – $59.0). The losses in Canada expire between 2026 and 2037. The losses and foreign taxcredits in the U.S. expire between 2020 and 2035. Substantially all of the losses in Europe do not have an expiry date.
Deferred income tax has not been recognized for the withholding tax and other taxes that could be payable on theunremitted earnings of certain subsidiaries. Unremitted earnings amounted to approximately $3.1 billion atDecember 31, 2017 (December 31, 2016 – $3.1 billion) and are not likely to be repatriated in the foreseeable future.
The United States Tax Cuts and Jobs Act (‘‘U.S. tax reform’’) that was signed into law on December 22, 2017introduced a number of significant changes to U.S. corporate income tax for tax years beginning after December 31,2017: it reduces the U.S. federal corporate income tax rate from 35% to 21%, requires companies to pay a one-timetransition tax on earnings of certain foreign subsidiaries that were previously tax deferred, repeals the alternativeminimum tax (‘‘AMT’’) regime, modifies rules pertaining to loss reserve discounting, introduces a new minimumbase erosion and anti-abuse tax (‘‘BEAT’’) on certain payments to foreign affiliates, and implements a U.S. tax onforeign earnings for certain global intangible low-taxed income (‘‘GILTI’’).
Under IFRS, deferred income tax assets and liabilities are measured at the enacted or substantively enacted tax rateexpected to apply when temporary differences are to be realized or settled. The resulting deferred income tax isrecognized in the consolidated statement of earnings, except to the extent that it relates to items previouslyrecognized directly in equity. The company selected December 31, 2017 as the revaluation date for its U.S. netdeferred income tax asset as the impact between the date of enactment and December 31, 2017 was not consideredsignificant. The reduction in the U.S. corporate income tax rate decreased the U.S. net deferred income tax assetrelated to operating and capital losses and other timing differences by $229.2, of which $222.4 was recorded in theconsolidated statement of earnings and $6.8 was recorded in other comprehensive income. The company alsodecreased its recognized U.S. foreign tax credit carry forwards by $100.0 at December 31, 2017 as the reduction in theU.S. corporate income tax rate will make utilization of foreign tax credit carry forwards recognized in prior yearsmore difficult, requiring increased U.S. and foreign source income in the future.
For tax years beginning before January 1, 2018, U.S. tax reform requires that U.S. companies include in income themandatory deemed repatriation of post-1986 undistributed foreign earnings (the ‘‘transition tax’’). For the yearended December 31, 2017, the company included $79.1 of previously untaxed foreign earnings in taxable income.Future repatriation of this amount will not incur additional U.S. tax. The company utilized current and prior yearforeign tax credits (rather than net operating loss carry forwards) to offset this income to reduce the transition taxliability payable in cash to nil. The recognition of the transition tax caused the company to record reductions to adeferred tax liability of $34.5 related to previously deferred earnings of OdysseyRe’s U.K. operations and to foreigntax credit carry forwards of $27.1 that no longer have value due to the mandatory repatriation.
The tax effects included in these consolidated financial statements represent the company’s best estimate based uponthe information available, notwithstanding that the company is still analyzing certain aspects of U.S. tax reform andmay refine its computations, which could potentially affect the measurement of deferred taxes or give rise toadditional current tax liabilities. The repeal of the AMT regime did not have a significant impact on the company andthe company continues to reflect the AMT credit carryforwards as part of its net deferred income tax asset. Thecompany will recognize charges related to BEAT and GILTI, if any, in the periods in which they are incurred, and hasnot included their impacts in measuring its net deferred income tax asset at December 31, 2017.
19. Statutory Requirements
The retained earnings of the company are largely represented by retained earnings at the insurance and reinsurancesubsidiaries. The insurance and reinsurance subsidiaries are subject to certain requirements and restrictions undertheir respective insurance company Acts including minimum capital requirements and dividend restrictions. Thecompany’s capital requirements and management thereof are discussed in note 24. The company’s share ofdividends paid in 2017 by the insurance and reinsurance subsidiaries, which are eliminated on consolidation, was$418.1 (2016 – $445.8). In addition, the company received proceeds from the sale of First Capital as described innote 23 and the partial sale of ICICI Lombard as described in note 6.
85

FAIRFAX FINANCIAL HOLDINGS LIMITED
Based on the surplus and net earnings (loss) of the primary insurance and reinsurance subsidiaries as at and for theyear ended December 31, 2017, the maximum dividend capacity available in 2018 at each of those subsidiaries,payable to all shareholders (including non-controlling interests) is as follows:
December 31,2017
Allied World 688.0OdysseyRe 324.9Northbridge(1) 149.1Crum & Forster 130.2Zenith National 86.0Brit 195.1
1,573.3
(1) Subject to prior regulatory approval.
When determining the amount of dividends to be paid from its insurance and reinsurance subsidiaries, the companyconsiders not only regulatory capital requirements, but also rating agency capital tests, future capital levels requiredto support growth and tax planning matters, among other factors. In addition, the co-investors in Allied World andBrit have a dividend in priority to the company.
20. Contingencies and Commitments
Lawsuits
On July 26, 2006 Fairfax filed a lawsuit seeking $6 billion in damages from a number of defendants who, thecomplaint (as subsequently amended) alleges, participated in a stock market manipulation scheme involving Fairfaxshares. The complaint, filed in Superior Court, Morris County, New Jersey, alleges violations of various state laws,including the New Jersey Racketeer Influenced and Corrupt Organizations Act, pursuant to which treble damagesmay be available. On September 12, 2012, before trial, and consequently without having heard or made anydetermination on the facts, the Court dismissed the lawsuit on legal grounds. In October 2012 Fairfax filed an appealof this dismissal, as it believes that the legal basis for the dismissal is incorrect. On April 27, 2017, the appeals courtissued a decision reinstating certain claims but affirming the dismissal of the major portion of the claims. On July 10,2017, Fairfax filed with the New Jersey Supreme Court a petition for certification of the appeal court’s decision. OnOctober 20, 2017, that petition was denied by the court. The company is considering all its options. The ultimateoutcome of any litigation is uncertain. The financial effects, if any, of this lawsuit cannot be practicably determinedat this time, and the company’s consolidated financial statements include no anticipated recovery from the lawsuit.
Other
The Autorite des marches financiers (the ‘‘AMF’’), the securities regulatory authority in the Province of Quebec, isconducting an investigation of Fairfax, its CEO, Prem Watsa, and its President, Paul Rivett. The investigationconcerns the possibility of illegal insider trading and/or tipping (not involving any personal trading by theindividuals) in connection with the December 15, 2011 takeover offer by Resolute Forest Products Inc. for shares ofFibrek Inc. Except as set out below, further details concerning the investigation are, by law, not permitted tobe disclosed.
The AMF has authorized Fairfax to make the above-mentioned disclosure. Fairfax and its management are solelyresponsible for the content of the disclosure set out in the three following paragraphs; the AMF has not in any wayendorsed that content.
Resolute’s above-mentioned takeover offer was made to all Fibrek shareholders, including Fairfax. Fairfax agreed inthat transaction to a hard lock-up agreement with Resolute whereby Fairfax agreed to tender its shares of Fibrek,representing approximately 26% of Fibrek’s outstanding shares, to the Resolute takeover offer at the same price as allother Fibrek shareholders. At the time of the Resolute takeover offer for Fibrek, Fairfax’s position in Fibrek was valuedat approximately Cdn$32, representing less than 1⁄6 of 1% of Fairfax’s total invested assets at that time.
86

Fibrek actively opposed the Resolute takeover offer. ln 2012, the Fibrek transaction was the subject of numerousregulatory hearings in Quebec and court proceedings relating to Fibrek’s anti-takeover tactics and the hard lock-upsgiven by various selling shareholders, including Fairfax. Allegations were made in those hearings concerning thepossibility of non-compliance with the takeover bid rules. Resolute’s takeover offer was allowed to proceed andresulted in Resolute acquiring Fibrek.
Fairfax believes it has an unblemished record for honesty and integrity and is fully cooperating with the AMF’sinvestigation. Fairfax continues to be confident that in connection with the Resolute takeover offer, it had nomaterial non-public information, that it did not engage in illegal insider trading or tipping, and that there is noreasonable basis for any proceedings in this connection. To the best of Fairfax’s knowledge, the AMF investigation isstill ongoing. If the AMF commences legal proceedings, no assurance can be given at this time by Fairfax as tothe outcome.
Subsidiaries of the company are defendants in several damage suits and have been named as third party in othersuits. The uninsured exposure to the company is not considered to be material to the company’s financial position,financial performance or cash flows.
OdysseyRe, Brit, Allied World, Advent and RiverStone (UK) (‘‘the Lloyd’s participants’’) underwrite in the Lloyd’s ofLondon insurance market through their participation in certain Lloyd’s syndicates. The Lloyd’s participants havepledged cash and securities with fair values of $361.9 and $1,566.1 at December 31, 2017 as capital to support thoseunderwriting activities. Pledged securities and restricted cash consist of cash, fixed income and equity investmentswhich are included within portfolio investments on the consolidated balance sheet. The Lloyd’s participants havethe ability to substitute other securities for these pledged securities, subject to certain admissibility criteria. TheLloyd’s participants’ liability in respect of assets pledged as capital is limited to the aggregate amount of the pledgedassets and their obligation to support these liabilities will continue until such liabilities are settled or are reinsured bya third party approved by Lloyd’s. The company believes that the syndicates for which the Lloyd’s participants arecapital providers maintain sufficient liquidity and financial resources to support their ultimate liabilities and doesnot anticipate that the pledged assets will be utilized.
The company’s maximum capital commitments for potential investments in common stocks, limited partnershipsand associates at December 31, 2017 was $966.3, with a further amount of approximately $367 committed forinvestments described in note 23.
21. Pensions and Post Retirement Benefits
The funded status of the company’s defined benefit pension and post retirement plans were as follows:
Defined benefit Post retirementpension plans benefit plansDecember 31 December 31
2017 2016 2017 2016
Benefit obligation (918.3) (803.7) (118.5) (109.3)Fair value of plan assets 836.1 747.9 – –
Funded status of plans – deficit (82.2) (55.8) (118.5) (109.3)Impact of asset ceiling (1.0) (1.0) – –
Net accrued liability (notes 13 and 14)(1) (83.2) (56.8) (118.5) (109.3)
Weighted average assumptions used to determine benefit obligations:Discount rate 3.2% 3.6% 4.1% 4.2%Rate of compensation increase 2.8% 3.6% 3.3% 3.5%Health care cost trend – – 5.0% 5.7%
(1) The defined benefit pension plan net accrued liability at December 31, 2017 of $83.2 (December 31, 2016 – $56.8) wascomprised of pension surpluses of $49.1 and pension deficits of $132.3 (December 31, 2016 – $50.8 and $107.6).
87

FAIRFAX FINANCIAL HOLDINGS LIMITED
Pension and post retirement expenses recognized in the consolidated statements of earnings for the years endedDecember 31 were as follows:
2017 2016
Defined benefit pension plan expense 17.3 27.7Defined contribution pension plan expense 45.6 32.2Defined benefit post retirement expense 10.3 8.0
73.2 67.9
Pre-tax actuarial net losses recognized in the consolidated statements of comprehensive income for the years endedDecember 31 were comprised as follows:
2017 2016
Defined benefit pension plansActuarial net gains on plan assets and change in asset ceiling 18.6 54.5Actuarial net losses on benefit obligations (53.0) (76.4)
(34.4) (21.9)Post retirement benefit plans – actuarial net gains (losses) on benefit obligations 0.3 (1.4)
(34.1) (23.3)
During 2017 the company contributed $30.7 (2016 – $21.8) to its defined benefit pension and post retirementbenefit plans, and expects to make contributions of $28.2 in 2018.
22. Operating Leases
During 2017 the company incurred operating lease costs of $216.2 (2016 – $155.7).
Aggregate future minimum operating lease commitments at December 31, 2017 relating to premises, automobilesand equipment for various terms up to ten years were as follows:
2018 188.52019 173.22020 153.42021 139.52022 113.0Thereafter 458.2
23. Acquisitions and Divestitures
Subsequent to December 31, 2017
Receipt of Fairfax India Performance Fee
Pursuant to the company’s investment advisory agreement with Fairfax India, on March 9, 2018 the companyreceived a performance fee of $114.4 for the period January 30, 2015 to December 31, 2017 in the form of7,663,685 newly issued Fairfax India subordinate voting shares, which increased the company’s equity interest inFairfax India to 33.6% from 30.2% at December 31, 2017.
Acquisition of certain businesses of Carillion Canada Inc.
On March 7, 2018 the company acquired the services business carried on in Canada by Carillion Canada Inc. andcertain affiliates thereof (collectively ‘‘Carillion’’) relating to facilities management of airports, commercial and retailproperties, defense facilities, select healthcare facilities and on behalf of oil, gas and mining clients. The transactionwas approved by the Ontario Superior Court of Justice in Carillion’s proceedings under the Companies’ CreditorsArrangement Act (Canada). Carillion is an infrastructure services company that provides asset management andoperations solutions to industries and governments.
88

Sale of The Keg to Cara
On February 22, 2018 the company completed the sale of its 51.0% ownership interest in The Keg to Cara forconsideration of $74.6 (Cdn$94.7), comprised of cash of $7.9 (Cdn$10.0) and 3,400,000 Cara subordinate votingshares. The other shareholders of The Keg sold their 49.0% ownership interest to Cara for $82.7 (Cdn$105.0),comprised of cash of $74.8 (Cdn$95.0) and 401,123 Cara subordinate voting shares. Cara may be required to pay upto an additional $24 (Cdn$30) of cash consideration to the other shareholders of The Keg, contingent on theachievement of certain financial objectives within the first three years subsequent to closing. The transactionincreased the company’s equity interest in Cara to 43.2% from 40.2% at December 31, 2017.
Investment in The Catholic Syrian Bank Ltd.
On February 20, 2018 Fairfax India entered into an agreement to acquire a 51.0% equity interest in The CatholicSyrian Bank Ltd. (‘‘CS Bank’’) for approximately $186 (12.1 billion Indian rupees). The transaction is subject tocustomary closing conditions and is expected to close in the first half of 2018. CS Bank, headquartered in Thrissur,Kerala, offers banking services across India.
Year ended December 31, 2017
Divestiture of First Capital Insurance Limited
On December 28, 2017 the company completed the sale of its 97.7% interest in First Capital to Mitsui SumitomoInsurance Company Limited of Tokyo, Japan (‘‘Mitsui Sumitomo’’) for gross proceeds of $1,683.3 and realized a netafter-tax gain of $1,018.6. The transaction was completed pursuant to an agreement with Mitsui Sumitomo to pursuea global strategic alliance. The company expects to enter into a quota share participation in First Capital’s insuranceportfolio in 2018.
Acquisition of Allied World Assurance Holdings AG
On July 6, 2017 the company completed the acquisition of 94.6% of the outstanding shares of Allied WorldAssurance Company Holdings, AG (‘‘Allied World AG’’) for purchase consideration of $3,977.9, consisting of$1,905.6 in cash and $2,072.3 by the issuance of 4,799,497 subordinate voting shares. In addition, Allied World AGdeclared a special pre-closing cash dividend of $5.00 per share ($438.0). Contemporaneously with the closing of theacquisition of Allied World AG, Ontario Municipal Employees Retirement System (‘‘OMERS’’), the pension planmanager for government employees in the province of Ontario, Alberta Investment Management Corporation(‘‘AIMCo’’), an investment manager for pension, endowment and government funds in the province of Alberta, andcertain other third parties (together ‘‘the co-investors’’) invested $1,580.0 for an indirect equity interest in AlliedWorld AG. The remaining 5.4% of the outstanding shares of Allied World AG were acquired on August 17, 2017 forpurchase consideration of $229.0, consisting of $109.7 in cash and $119.3 by the issuance of 276,397 subordinatevoting shares, in a merger transaction under Swiss law pursuant to which Allied World Assurance CompanyHoldings, GmbH (‘‘Allied World’’) became the surviving entity. This merger resulted in the co-investors holding anindirect ownership interest in Allied World of 32.6%. The co-investors will have a dividend in priority to thecompany, and the company will have the ability to purchase the shares owned by the co-investors over the nextseven years. Allied World is a global property, casualty and specialty insurer and reinsurer.
Quess Corp. Transactions
On December 27, 2017 Quess acquired the facility management and catering business of Manipal Integrated ServicesPrivate Limited (‘‘Manipal’’) for $152.5 (9.8 billion Indian rupees), primarily comprised of the issuance of $117.7(7.5 billion Indian rupees) of Quess common shares to Manipal shareholders and the reinvestment of $34.3(2.2 billion Indian rupees) of Quess’ existing holdings of Manipal preferred shares upon cancellation of those shares.In November of 2017 Thomas Cook India sold a 5.4% equity interest in Quess for cash proceeds of $96.8 (6.3 billionIndian rupees). On August 18, 2017 Quess raised $132.2 (8.5 billion Indian rupees) in net proceeds following thecompletion of a private placement of common shares with institutional investors. These transactions atThomas Cook India and Quess collectively reduced the company’s indirect ownership of Quess from 42.1% to 33.1%and resulted in an increase in non-controlling interest of $210.0 and a dilution gain of $135.6, which are included inother net changes in capitalization in the consolidated statement of changes in equity. Quess is a provider of staffingand facilities management services.
89

FAIRFAX FINANCIAL HOLDINGS LIMITED
Additional investment in Grivalia Properties REIC
On July 4, 2017 the company acquired control of Grivalia Properties REIC (‘‘Grivalia Properties’’) by increasing itsequity interest to 52.6% through the purchase of an additional 10.3% equity interest from Eurobank Ergasias S.A. forcash consideration of $100.0 (A88.0). Accordingly, the company re-measured its equity accounted carrying value ofGrivalia Properties to fair value, recorded a net realized gain of $51.3 and commenced consolidating GrivaliaProperties in the Other reporting segment. Pursuant to Greek securities law, the company then made a tender offerfor all remaining outstanding shares of Grivalia Properties which expired on September 6, 2017, resulting in thecompany increasing its equity interest by 0.1% to 52.7% for cash consideration of $0.6 (A0.5). Grivalia Properties is areal estate investment company listed on the Athens Stock Exchange.
Acquisition of certain American International Group, Inc. operations in Latin America and Central and Eastern Europe
On October 18, 2016 the company agreed to acquire from American International Group, Inc. (‘‘AIG’’) its insuranceoperations in Argentina, Chile, Colombia, Uruguay, Venezuela and Turkey, and certain assets and renewal rights withrespect to the portfolio of local business written by AIG Europe in Bulgaria, Czech Republic, Hungary, Poland,Romania and Slovakia, for total consideration of approximately $240.
The company, through Colonnade Insurance, has completed the acquisition of the business and renewal rights ofthe insurance operations of AIG in Hungary, Czech Republic and Slovakia (effective from April 30, 2017), Turkey(on May 2, 2017 and sold to Gulf Insurance on the same day), Bulgaria (effective from May 31, 2017), Poland(effective from June 30, 2017) and Romania (effective October 31, 2017). Through an ongoing partnership, thecompany is providing claims handling and run-off management services to AIG in the European countries wherebusiness operations were acquired.
The company has completed the acquisition of the insurance operations of AIG in Chile and Colombia (effectivefrom July 31, 2017), Argentina (effective from September 30, 2017) and Uruguay (effective from January 31, 2018)(collectively ‘‘Fairfax Latam’’), and continues to work through the legal, regulatory and operational requirements tocomplete the acquisition in Venezuela.
Merger of Fairchem Speciality Limited and Privi Organics Limited
On March 14, 2017 Fairchem Speciality Limited (‘‘Fairchem’’) and Privi Organics Limited (‘‘Privi Organics’’)completed their previously announced merger, with the merged entity continuing under the Fairchem name. As aresult of the merger, Fairfax India, which had acquired a 44.7% interest in Fairchem on February 8, 2016 and a 50.8%interest in Privi Organics on August 26, 2016, became the dominant shareholder in Fairchem with a 48.7% interest.Prior to the merger, the company consolidated Privi Organics and applied the equity method of accounting to itsinvestment in Fairchem. Subsequent to the merger, the assets and liabilities and results of operations of Fairchemwere consolidated in the Other reporting segment.
Investment in Fairfax Africa Holdings Corporation
On February 17, 2017 the company acquired 22,715,394 multiple voting shares in a private placement and2,500,000 subordinate voting shares as part of the initial public offering of Fairfax Africa Holdings Corporation(‘‘Fairfax Africa’’) for total cash consideration of $252.2. The company also contributed its indirect equity interest inAFGRI Proprietary Limited (‘‘AFGRI’’) with a fair value of $72.8 to Fairfax Africa in exchange for 7,284,606 multiplevoting shares. Through its initial public offering, private placements and exercise of the over-allotment option by theunderwriters, Fairfax Africa raised net proceeds of $493.3 after issuance costs and expenses, inclusive of thecontribution of the investment in AFGRI. Following those transactions, the company’s $325.0 ($10.00 per share)investment represented 98.8% of the voting rights and 64.2% of the equity interest in Fairfax Africa. Fairfax Africawas established, with the support of Fairfax, to invest in public and private equity and debt instruments of Africanbusinesses or other businesses with customers, suppliers or business primarily conducted in, or dependent on, Africa.The assets and liabilities and results of operations of Fairfax Africa were consolidated in the Other reporting segment.
90

Acquisition of Saurashtra Freight Private Limited
On February 14, 2017 Fairfax India acquired a 51.0% interest in Saurashtra Freight Private Limited (‘‘SaurashtraFreight’’) for cash consideration of $30.0 (2.0 billion Indian rupees). Saurashtra Freight operates a container freightstation at the Mundra Port in the Indian state of Gujarat. The assets and liabilities and results of operations ofSaurashtra Freight were consolidated in the Other reporting segment.
Investment in Mosaic Capital Corporation
On January 26, 2017 the company invested $114.5 (Cdn$150.0) in securities of Mosaic Capital Corporation (‘‘MosaicCapital’’) issued through a private placement comprised of: (i) Cdn$100.0 principal amount of 6.00% seniorpreferred securities; (ii) Cdn$50.0 principal amount of 5.00% senior secured debentures; and (iii) warrants entitlingthe company to acquire up to 17,026,106 common shares of Mosaic Capital at a price of Cdn$8.81 per commonshare at any time until January 26, 2024 (the ‘‘Mosaic warrants’’). Pursuant to IFRS, the company’s investment inMosaic Capital warrants represent a potential voting interest of approximately 62% (assuming all holders of MosaicCapital convertible securities, including the company, exercised their options to convert), giving the company theability to control Mosaic Capital. Consequently, the assets and liabilities and results of operations of Mosaic Capitalwere consolidated in the Other reporting segment. Mosaic Capital is a Canadian investment company that owns aportfolio of established businesses in the infrastructure, printing, oil and gas services, technology, manufacturingand real estate industries.
Additional Investment in Fairfax India Holdings Corporation
On January 13, 2017 the company acquired 12,340,500 subordinate voting shares of Fairfax India for $145.0 ($11.75per share) in a private placement. Through that private placement and a contemporaneous bought deal publicoffering, Fairfax India raised proceeds of $493.5 net of commissions and expenses. Combined with various openmarket purchases of Fairfax India subordinate voting shares, the company’s multiple voting shares and subordinatevoting shares represented 93.6% of the voting rights and 30.2% of the equity interest in Fairfax India at the close ofthe private placement and public offering. These transactions collectively resulted in an increase in non-controllinginterest of $336.3 and a dilution loss of $3.3, which are included in other net changes in capitalization in theconsolidated statement of changes in equity.
91

FAIRFAX FINANCIAL HOLDINGS LIMITED
The determination of the fair value of assets acquired and liabilities assumed in connection with the acquisitionsdescribed above is currently underway and will be finalized within twelve months of the respective acquisition dates.Provisionally recorded amounts primarily include intangible assets, deferred income taxes, goodwill and the excessof fair value of net assets acquired over purchase consideration. The company has substantially completed itsvaluation of Allied World’s intangible assets.
Allied Grivalia FairfaxWorld Properties Latam Other(1)
Acquisition date July 6, 2017 July 4, 2017 Throughout 2017 Throughout 2017Percentage of common shares acquired 94.6% 52.6% 100.0%Assets:
Insurance contract receivables 1,212.5 – 235.8 0.4Portfolio investments(2) 8,568.7 139.1 250.4 76.0Recoverable from reinsurers 2,363.6 – 597.7 0.7Deferred income taxes – 0.3 48.3 5.0Goodwill and intangible assets 1,726.9(3) – 23.3 385.5Other assets 223.5 1,020.4 51.1 288.7
14,095.2 1,159.8 1,206.6 756.3
Liabilities:Accounts payable and accrued liabilities 300.7 25.3 172.3 167.4Income taxes payable 3.4 4.2 9.0 1.1Deferred income taxes 118.0 – 21.5 4.3Funds withheld payable to reinsurers 193.5 – 9.8 0.1Insurance contract liabilities 8,467.7 – 826.1 3.0Borrowings 860.5 137.6 – 83.9
9,943.8 167.1 1,038.7 259.8Non-controlling interests 173.5 470.5 – 8.1Purchase consideration 3,977.9 519.7 167.9 488.4Excess of fair value of net assets acquired over
purchase consideration – 2.5 – –
14,095.2 1,159.8 1,206.6 756.3
(1) Primarily comprised of the acquisitions of Mosaic Capital and certain AIG branches in Central and Eastern Europe, theacquisition of Pickle Barrel by Cara, the acquisition of Saurashtra Freight and consolidation of Fairchem by Fairfax India,and various acquisitions by Quess, Thomas Cook India, Mosaic Capital, and Boat Rocker.
(2) Included subsidiary cash and cash equivalents of Allied World ($1,195.4, of which $4.8 was restricted), GrivaliaProperties ($26.3) and Fairfax Latam ($67.2).
(3) Comprised of goodwill of $937.9 and intangible assets of $789.0 (primarily broker relationships of $574.0, Lloyd’sparticipation rights of $87.0 and brand names of $71.0).
Allied World contributed revenue of $1,050.5 and a net loss of $555.4 to the company’s consolidated financial resultsfor the year ended December 31, 2017. Had Allied World been acquired on January 1, 2017, the company’s pro-formaconsolidated revenue and net earnings would have been $17,514.6 and $1,766.4 for the year endedDecember 31, 2017.
Year ended December 31, 2016
Acquisition of Zurich Insurance Company South Africa Limited
On December 7, 2016 the company acquired a 100% interest in Zurich Insurance Company South Africa Limited(subsequently rebranded Bryte Insurance Company Limited (‘‘Bryte Insurance’’)) from Zurich InsuranceCompany Ltd. for $128.0 (1.8 billion South African rand). Bryte Insurance is a property and casualty insurer in SouthAfrica and Botswana. The assets and liabilities and results of operations of Bryte Insurance were consolidated in theInsurance and Reinsurance – Other reporting segment.
92

Acquisition of Original Joe’s Franchise Group Inc.
On November 28, 2016 Cara acquired an 89.2% interest in Original Joe’s Franchise Group Inc. (‘‘Original Joe’s’’) for$83.8 (Cdn$112.5), comprised of cash consideration of $69.3 (Cdn$93.0) and contingent consideration valued at$14.5 (Cdn$19.5). Original Joe’s is a Canadian multi-brand restaurant company based in the province of Alberta.
Acquisition of Golf Town Limited
On October 31, 2016 the company acquired a 60.0% indirect interest in Golf Town Limited (‘‘Golf Town’’) for $31.4(Cdn$42.0). Golf Town is a Canadian specialty retailer of golf equipment, consumables, golf apparel and accessories.The assets and liabilities and results of operations of Golf Town were consolidated in the Other reporting segment.
Acquisition of PT Asuransi Multi Artha Guna Tbk
On October 10, 2016 the company acquired an 80.0% interest in PT Asuransi Multi Artha Guna Tbk. (‘‘AMAG’’) fromPT Bank Pan Indonesia Tbk. (‘‘Panin Bank’’) for $178.9 (2.322 trillion Indonesian rupiah). AMAG will distribute itsinsurance products through a long-term bancassurance partnership with Panin Bank. AMAG is a general insurer inIndonesia. The assets and liabilities and results of operations of AMAG were consolidated in the Fairfax Asia reportingsegment. On December 31, 2016 Fairfax Indonesia was merged into AMAG.
Acquisition of Asian Alliance General Insurance Limited
On October 3, 2016 Union Assurance acquired a 100% equity interest in Asian Alliance General Insurance Limited(subsequently renamed Fairfirst Insurance Limited (‘‘Fairfirst Insurance’’)) for $10.2 (1,488.9 million Sri Lankanrupees). Fairfirst Insurance is a general insurer in Sri Lanka. The assets and liabilities and results of operations ofFairfirst Insurance were consolidated in the Fairfax Asia reporting segment. On February 28, 2017 Union Assurancewas merged into Fairfirst Insurance.
Acquisition of Groupe St-Hubert Inc.
On September 2, 2016 Cara acquired a 100% equity interest in Groupe St-Hubert Inc. (‘‘St-Hubert’’) for $413.8(Cdn$538.7), comprised of cash consideration of $372.4 (Cdn$484.8) and the issuance of $41.4 (Cdn$53.9) of Carasubordinate voting shares to St-Hubert shareholders. A portion of the cash consideration was financed through aprivate placement of 7,863,280 Cara subordinate voting shares at a price of Cdn$29.25 for gross proceeds of $179.2(Cdn$230.0), of which 3,418,804 shares were acquired by the company and its subsidiaries to maintain its equity andvoting interests in Cara. St-Hubert is a Canadian full-service restaurant operator and fully integrated foodmanufacturer in the province of Quebec.
Acquisition of Privi Organics Limited
On August 26, 2016 Fairfax India acquired a 50.8% equity interest in Privi Organics for $55.0 (3.7 billion Indianrupees) through the purchase of newly issued shares and shares acquired from existing shareholders. Privi Organics isa supplier of aroma chemicals to the fragrance industry.
Acquisition of Eastern European Insurers
On December 16, 2014 the company entered into an agreement with QBE Insurance (Europe) Limited (‘‘QBE’’) toacquire QBE’s insurance operations in the Czech Republic, Hungary and Slovakia (the ‘‘QBE insurance operations’’).A new Luxembourg insurer, Colonnade Insurance S.A. (‘‘Colonnade Insurance’’), was licensed in July 2015 andbranches of Colonnade Insurance were established in each of the Czech Republic, Hungary and Slovakia during thefourth quarter of 2015. The business and renewal rights of QBE’s Hungarian, Czech and Slovakian insuranceoperations were transferred to Colonnade Insurance on February 1, 2016, April 1, 2016 and May 2, 2016,respectively. The QBE insurance operations write business across a range of general insurance classes, includingproperty, travel, general liability and product protection.
93

FAIRFAX FINANCIAL HOLDINGS LIMITED
The fair value of assets acquired and liabilities assumed in connection with the 2016 acquisitions described above aresummarized in the table that follows:
BryteInsurance AMAG St-Hubert Other(1)
Acquisition date December 7, 2016 October 10, 2016 September 2, 2016 Throughout 2016
Percentage of common shares acquired 100.0% 80.0% 100.0%(2)
Assets:
Insurance contract receivables 45.0 8.9 – 41.3
Portfolio investments(3) 220.4 99.9 – 22.1
Recoverable from reinsurers 85.8 26.4 – 1.1
Deferred income taxes 11.4 – – 8.5
Goodwill and intangible assets 16.8(4) 161.2(5) 319.4(6) 146.1
Other assets 10.8 25.9 180.0 205.3
390.2 322.3 499.4 424.4
Liabilities:
Accounts payable and accrued liabilities 88.4 16.6 30.7 48.3
Deferred income taxes – 11.1 54.9 12.2
Funds withheld payable to reinsurers 1.4 5.4 – 0.4
Insurance contract liabilities 172.4 76.3 – 59.7
Borrowings – – – 48.1
262.2 109.4 85.6 168.7
Non-controlling interests – 34.0 – 57.3
Purchase consideration 128.0 178.9 413.8 191.6
Excess of fair value of net assets acquiredover purchase consideration – – – 6.8
390.2 322.3 499.4 424.4
(1) Includes the acquisitions of Fairfirst Insurance, Privi Organics, the QBE insurance operations and Golf Town, and Cara’sacquisition of Original Joe’s.
(2) The company’s economic interest in St-Hubert was 38.9% as a result of acquiring St-Hubert through 38.9%-owned Cara.
(3) Included subsidiary cash and cash equivalents of Bryte Insurance ($48.4) and AMAG ($6.2).
(4) Comprised of goodwill of $11.5 and intangible assets of $5.3.
(5) Comprised of goodwill of $43.0 and intangible assets of $118.2.
(6) Comprised of goodwill of $85.2 and intangible assets of $234.2 (primarily brand names of $183.1).
24. Financial Risk Management
Overview
The primary goals of the company’s financial risk management are to ensure that the outcomes of activitiesinvolving elements of risk are consistent with the company’s objectives and risk tolerance, while maintaining anappropriate balance between risk and reward and protecting the company’s consolidated balance sheet from eventsthat have the potential to materially impair its financial strength. The company’s exposure to potential loss from itsinsurance and reinsurance operations and investment activities primarily relates to underwriting risk, credit risk,liquidity risk and various market risks. Balancing risk and reward is achieved through identifying risk appropriately,aligning risk tolerances with business strategy, diversifying risk, pricing appropriately for risk, mitigating riskthrough preventive controls and transferring risk to third parties. There were no significant changes in the types ofthe company’s risk exposures or the processes used by the company for managing those risk exposures atDecember 31, 2017 compared to those identified at December 31, 2016, except as discussed below.
94

Financial risk management objectives are achieved through a two tiered system, with detailed risk managementprocesses and procedures at the company’s primary operating subsidiaries and its investment managementsubsidiary combined with the analysis of the company-wide aggregation and accumulation of risks at the holdingcompany level. In addition, although the company and its operating subsidiaries have designated Chief RiskOfficers, the company regards each Chief Executive Officer as the chief risk officer of his or her company: each ChiefExecutive Officer is the individual ultimately responsible for risk management for his or her company and itssubsidiaries.
The company’s designated Chief Risk Officer reports on risk considerations to Fairfax’s Executive Committee andprovides a quarterly report to the Board of Directors on the key risk exposures. The company’s management, inconsultation with the designated Chief Risk Officer, approves certain policies for overall risk management, as well aspolicies addressing specific areas such as investments, underwriting, catastrophe risk and reinsurance. Thecompany’s Investment Committee approves policies for the management of market risk (including currency risk,interest rate risk and other price risk) and the use of derivative and non-derivative financial instruments, andmonitors to ensure compliance with relevant regulatory guidelines and requirements. A discussion of the risks of thebusiness (the risk factors and the management of those risks) is an agenda item for every regularly scheduled meetingof the company’s Board of Directors.
Underwriting Risk
Underwriting risk is the risk that the total cost of claims, claims adjustment expenses and premium acquisitionexpenses will exceed premiums received and can arise as a result of numerous factors, including pricing risk,reserving risk and catastrophe risk. There were no significant changes to the company’s exposure to underwriting riskor the framework used to monitor, evaluate and manage underwriting risk at December 31, 2017 compared toDecember 31, 2016. While the acquisition of Allied World was significant, the company has determined that AlliedWorld’s exposure to underwriting risk and framework to monitor, evaluate and manage underwriting risk areconsistent with those of its own.
Principal lines of business
The company’s principal lines of business and the significant insurance risks inherent therein are as follows:
• Property, which insures against losses to property from (among other things) fire, explosion, natural perils(for example earthquake, windstorm and flood), terrorism and engineering problems (for example, boilerexplosion, machinery breakdown and construction defects). Specific types of property risks underwritten bythe company include automobile, commercial and personal property and crop;
• Casualty, which insures against accidents (including workers’ compensation and automobile) and alsoincludes employers’ liability, accident and health, medical malpractice, professional liability and umbrellacoverage;
• Specialty, which insures against marine, aerospace and surety risk, and other miscellaneous risks and liabilitiesthat are not identified above; and
• Reinsurance which includes, but is not limited to, property, casualty and liability exposures.
An analysis of net premiums earned by line of business is included in note 25.
95

FAIRFAX FINANCIAL HOLDINGS LIMITED
The table below shows the company’s concentration of risk by region and line of business based on gross premiumswritten prior to giving effect to ceded reinsurance premiums. The company’s exposure to general insurance riskvaries by geographic region and may change over time. Premiums ceded to reinsurers (including retrocessions) in2017 by line of business amounted to $992.3 for property (2016 – $463.5), $916.3 for casualty (2016 – $699.9) and$315.4 for specialty (2016 – $282.5).
Canada United States Asia(1) International(2) Total
For the years endedDecember 31 2017 2016 2017 2016 2017 2016 2017 2016 2017 2016
Property 646.8 582.7 1,878.6 1,466.0 586.5 464.8 995.7 502.7 4,107.6 3,016.2Casualty 602.6 528.5 4,899.4 4,002.9 400.8 352.3 805.0 465.1 6,707.8 5,348.8Specialty 143.4 126.4 548.8 485.6 275.1 231.9 424.8 325.4 1,392.1 1,169.3
Total 1,392.8 1,237.6 7,326.8 5,954.5 1,262.4 1,049.0 2,225.5 1,293.2 12,207.5 9,534.3
Insurance 1,295.3 1,134.6 5,855.4 4,607.0 684.9 516.3 1,494.3 672.3 9,329.9 6,930.2Reinsurance 97.5 103.0 1,471.4 1,347.5 577.5 532.7 731.2 620.9 2,877.6 2,604.1
1,392.8 1,237.6 7,326.8 5,954.5 1,262.4 1,049.0 2,225.5 1,293.2 12,207.5 9,534.3
(1) The Asia geographic segment comprises countries located throughout Asia, including China, India, Sri Lanka, Malaysia,Singapore, Indonesia and Thailand, and the Middle East.
(2) The International geographic segment comprises Australia and countries located in Africa, Europe and South America.
Pricing risk
Pricing risk arises because actual claims experience can differ adversely from the assumptions included in pricingcalculations. Historically the underwriting results of the property and casualty industry have fluctuated significantlydue to the cyclicality of the insurance market. The market cycle is affected by the frequency and severity of losses,levels of capacity and demand, general economic conditions and competition on rates and terms of coverage. Theoperating companies focus on profitable underwriting using a combination of experienced underwriting andactuarial staff, pricing models and price adequacy monitoring tools.
Reserving risk
Reserving risk arises because actual claims experience can differ adversely from the assumptions included in settingreserves, in large part due to the length of time between the occurrence of a loss, the reporting of the loss to theinsurer and the ultimate resolution of the claim. The degree of uncertainty will vary by line of business according tothe characteristics of the insured risks and the cost of a claim will be determined by the actual loss suffered by thepolicyholder. Claims provisions reflect expectations of the ultimate cost of resolution and administration of claimsbased on an assessment of facts and circumstances then known, a review of historical settlement patterns, estimatesof trends in claims severity and frequency, legal theories of liability and other factors.
The time required to learn of and settle claims is often referred to as the ‘‘tail’’ and is an important consideration inestablishing the company’s reserves. Short-tail claims are those for which losses are normally reported soon after theincident and are generally settled within months following the reported incident. This would include, for example,most property, automobile and marine and aerospace damage. Long-tail claims are considered by the company to bethose that often take three years or more to develop and settle, such as asbestos, environmental pollution, workers’compensation and product liability. Information concerning the loss event and ultimate cost of a long-tail claim maynot be readily available, making the reserving analysis of long-tail lines of business more difficult and subject togreater uncertainties than for short-tail lines of business. In the extreme cases of long-tail claims like those involvingasbestos and environmental pollution, it may take upwards of 40 years to settle. The company employs specializedtechniques to determine such provisions using the extensive knowledge of both internal and external asbestos andenvironmental pollution experts and legal advisors.
The establishment of provisions for losses and loss adjustment expenses is an inherently uncertain process that canbe affected by internal factors such as the inherent risk in estimating loss development patterns based on historicaldata that may not be representative of future loss payment patterns; assumptions built on industry loss ratios orindustry benchmark development patterns that may not reflect actual experience; and the intrinsic risk as to thehomogeneity of the underlying data used in carrying out the reserve analyses; and external factors such as trends
96

relating to jury awards; economic inflation; medical inflation; worldwide economic conditions; tort reforms; courtinterpretations of coverage; the regulatory environment; underlying policy pricing; claims handling procedures;inclusion of exposures not contemplated at the time of policy inception; and significant changes in severity orfrequency of losses relative to historical trends. Due to the amount of time between the occurrence of a loss, theactual reporting of the loss and the ultimate payment for the loss, provisions may ultimately develop differentlyfrom the actuarial assumptions made when initially estimating the provision for claims.
The company has exposures to risks in each line of business that may develop adversely and that could have amaterial impact upon the company’s financial position. The insurance risk diversity within the company’s portfolioof issued policies makes it difficult to predict whether material prior year reserve development will occur and, if itdoes occur, the location and the timing of such an occurrence.
Catastrophe risk
Catastrophe risk arises because property and casualty insurance companies may be exposed to large losses arisingfrom man-made or natural catastrophes that could result in significant underwriting losses. As the company does notestablish reserves for catastrophes in advance of the occurrence of such events, these events may cause volatility inthe levels of incurred losses and reserves, subject to the effects of reinsurance recoveries. This volatility may also becontingent upon political and legal developments after the occurrence of the event. The company evaluatespotential catastrophic events and assesses the probability of occurrence and magnitude of these eventspredominantly through probable maximum loss (‘‘PML’’) modeling techniques and through the aggregation oflimits exposed. A wide range of events are simulated using the company’s proprietary and commercial models,including single large events and multiple events spanning the numerous geographic regions in which the companyoperates.
Each operating company has developed and applies strict underwriting guidelines for the amount of catastropheexposure it may assume as a standalone entity for any one risk and location. Those guidelines are regularlymonitored and updated by the operating companies. Each of the operating companies also manages catastropheexposure by diversifying risk across geographic regions, catastrophe types and other lines of business, factoring inlevels of reinsurance protection, adjusting the amount of business written based on capital levels and adhering to risktolerances. The company’s head office aggregates catastrophe exposure company-wide and continually monitors thegroup’s exposure. Independent exposure limits for each entity in the group are aggregated to produce an exposurelimit for the group as there is presently no model capable of simultaneously projecting the magnitude andprobability of loss in all geographic regions in which the company operates. Currently the company’s objective is tolimit its company-wide catastrophe loss exposure such that one year’s aggregate pre-tax net catastrophe losses wouldnot exceed one year’s normalized net earnings before income taxes. The company takes a long term view andgenerally considers a 15% return on common shareholders’ equity, adjusted to a pre-tax basis, to be representative ofone year’s normalized net earnings. The modeled probability of aggregate catastrophe losses in any one yearexceeding this amount is generally more than once in every 250 years.
Management of underwriting risk
To manage its exposure to underwriting risk, and the pricing, reserving and catastrophe risks contained therein, thecompany’s operating companies have established limits for underwriting authority and requirements for specificapprovals of transactions involving new products or transactions involving existing products which exceed certainlimits of size or complexity. The company’s objective of operating with a prudent and stable underwritingphilosophy with sound reserving is also achieved through establishment of goals, delegation of authorities, financialmonitoring, underwriting reviews and remedial actions to facilitate continuous improvement. The company’sprovision for claims is reviewed separately by, and must be acceptable to, internal actuaries at each operatingcompany, the Chief Risk Officer at Fairfax and one or more independent actuaries. The company also purchasesreinsurance protection for risks assumed when it is considered prudent and cost effective to do so, at the operatingcompany level for specific exposures and, if needed, at the holding company level for aggregate exposures. Steps aretaken to actively reduce the volume of insurance and reinsurance underwritten on particular types of risks when thecompany desires to reduce its direct exposure due to inadequate pricing.
As part of its overall risk management strategy, the company cedes insurance risk through proportional,non-proportional and facultative reinsurance treaties. With proportional reinsurance, the reinsurer shares a pro rataportion of the company’s losses and premium, whereas with non-proportional reinsurance, the reinsurer assumespayment of the company’s loss above a specified retention, subject to a limit. Facultative reinsurance is the
97

FAIRFAX FINANCIAL HOLDINGS LIMITED
reinsurance of individual risks as agreed by the company and the reinsurer. The company follows the policy ofunderwriting and reinsuring contracts of insurance and reinsurance which, depending on the type of contract,generally limits the liability of the individual insurance and reinsurance subsidiaries on any policy to a maximumamount on any one loss. Reinsurance decisions are made by the subsidiaries to reduce and spread the risk of loss oninsurance and reinsurance written, to limit multiple claims arising from a single occurrence and to protect capitalresources. The amount of reinsurance purchased can vary among subsidiaries depending on the lines of businesswritten, their respective capital resources and prevailing or expected market conditions. Reinsurance is generallyplaced on an excess of loss basis and written in several layers, the purpose of which is to limit the amount of one riskto a maximum amount acceptable to the company and to protect from losses on multiple risks arising from a singleoccurrence. This type of reinsurance includes what is generally referred to as catastrophe reinsurance. The company’sreinsurance does not, however, relieve the company of its primary obligation to the policyholder.
The majority of reinsurance contracts purchased by the company provide coverage for a one year term and arenegotiated annually. The ability of the company to obtain reinsurance on terms and prices consistent with historicalresults reflects, among other factors, recent loss experience of the company and of the industry in general.Notwithstanding the significant current period catastrophe losses suffered by the industry in 2017, capital adequacywithin the reinsurance market remains strong and alternative forms of reinsurance capacity continue to be available.As a result, reinsurance pricing of loss affected business has increased modestly while non-loss affected property hasincreased to a lesser extent.
The company will remain opportunistic in its use of reinsurance, balancing capital requirements and the costof reinsurance.
Credit Risk
Credit risk is the risk of loss resulting from the failure of a counterparty to honour its financial obligations to thecompany. Credit risk arises predominantly with respect to cash and short term investments, investments in debtinstruments, insurance contract receivables, recoverable from reinsurers and receivable from counterparties toderivative contracts (primarily total return swaps and CPI-linked derivatives). There were no significant changes tothe company’s exposure to credit risk (except as set out in the discussion which follows) or the framework used tomonitor, evaluate and manage credit risk at December 31, 2017 compared to December 31, 2016.
The company’s gross credit risk exposure at December 31, 2017 (without taking into account amounts held by thecompany as collateral) was comprised as follows:
December 31, December 31,2017 2016
Cash and short term investments 19,198.8 11,235.6Investments in debt instruments:
U.S. sovereign government 1,779.3 1,117.3Other sovereign government rated AA/Aa or higher(1) 615.4 596.1All other sovereign government(2) 1,268.4 891.5Canadian provincials 93.8 196.9U.S. states and municipalities 2,452.1 4,732.2Corporate and other 4,081.8 2,633.5
Receivable from counterparties to derivative contracts 126.7 196.4Insurance contract receivables 4,686.9 2,917.5Recoverable from reinsurers 7,812.5 4,010.3Other assets 1,723.0 1,065.4
Total gross credit risk exposure 43,838.7 29,592.7
(1) Primarily comprised of bonds issued by the governments of Germany, Australia, the U.K, and Canada with fair values of$105.3, $97.9, $90.9 and $84.4 (December 31, 2016 – $201.7, $31.7, $23.4 and $311.4).
(2) Primarily comprised of bonds issued by the governments of India, Poland and Brazil with fair values of $734.7, $125.1and $101.7 (December 31, 2016 – $602.2, $117.2 and $80.3).
The company had income taxes refundable of $147.0 at December 31, 2017 (December 31, 2016 – $202.7).
98

Cash and short term investments
The company’s cash and short term investments (including at the holding company) are held at major financialinstitutions in the jurisdictions in which the company operates. At December 31, 2017, 87.4% of these balances wereheld in Canadian and U.S. financial institutions, 9.1% in European financial institutions and 3.5% in other foreignfinancial institutions (December 31, 2016 – 85.1%, 8.1% and 6.8% respectively). The company monitors risksassociated with cash and short term investments by regularly reviewing the financial strength and creditworthinessof these financial institutions and more frequently during periods of economic volatility. As a result of these reviews,the company may transfer balances from financial institutions where it perceives heightened credit risk to othersconsidered to be more stable.
Investments in debt instruments
The company’s risk management strategy for debt instruments is to invest primarily in high credit quality issuers andto limit the amount of credit exposure with respect to any one corporate issuer. While the company reviews thirdparty credit ratings, it also carries out its own analysis and does not delegate the credit decision to rating agencies.The company endeavours to limit credit exposure by monitoring fixed income portfolio limits on individualcorporate issuers and limits based on credit quality and may, from time to time, initiate positions in certain types ofderivatives to further mitigate credit risk exposure.
Investment in sovereign bonds rated AA/Aa or higher, considered by the company to present only a nominal risk ofdefault, with a fair value of $2,394.7 at December 31, 2017 (December 31, 2016 – $1,713.4), represented 6.1% of thetotal investment portfolio (December 31, 2016 – 6.0%) and consisted primarily of bonds issued by the governmentsof the U.S., U.K., Germany, Australia and Canada. Investments in debt instruments considered by the company to besubject to credit risk, with a fair value of $7,896.1 at December 31, 2017 (December 31, 2016 – $8,454.1), represented20.1% of the total investment portfolio (December 31, 2016 – 29.7%) and consisted primarily of all other sovereigngovernment bonds rated A/A or lower and all bonds included in Canadian provincials, U.S. states and municipalitiesand corporate and other.
The composition of the company’s investments in debt instruments classified according to the higher of eachsecurity’s respective S&P and Moody’s issuer credit rating is presented in the table that follows:
December 31, 2017 December 31, 2016
Amortized Fair Amortized FairIssuer Credit Rating cost value % cost value %
AAA/Aaa 2,476.3 2,432.0 23.7 2,042.0 1,915.8 18.8AA/Aa 2,149.5 2,408.8 23.4 3,669.1 4,383.3 43.1A/A 823.1 819.8 8.0 649.3 728.5 7.2BBB/Baa 1,617.1 1,764.8 17.1 910.4 1,024.0 10.1BB/Ba 151.1 154.0 1.5 98.5 117.6 1.2B/B 448.7 447.6 4.3 339.0 261.6 2.5Lower than B/B(1) 554.1 432.7 4.2 392.1 320.5 3.2Unrated(2) 1,594.4 1,831.1 17.8 1,416.7 1,416.2 13.9
Total 9,814.3 10,290.8 100.0 9,517.1 10,167.5 100.0
(1) Lower than B/B is primarily comprised of the fair value of the company’s investments in EXCO Resources, Inc. of $402.0(December 31, 2016 – $292.4).
(2) Unrated is primarily comprised of the fair value of the company’s investments in Blackberry Limited of $663.6(December 31, 2016 – $461.2), Sanmar Chemicals Group of $333.2 (December 31, 2016 – $299.1), ChorusAviation Inc. $155.2 (December 31, 2016 – nil) and FBD Insurance plc. of $112.0 (December 31, 2016 – $76.8).
At December 31, 2017, 72.2% (December 31, 2016 – 79.2%) of the fixed income portfolio carrying value was ratedinvestment grade or better, with 47.1% (December 31, 2016 – 61.9%) being rated AA or better (primarily consisting ofgovernment obligations). The increase in the fair value of bonds rated AAA/Aaa, A/A and BBB/Baa primarily reflectedthe consolidation of Allied World’s bond portfolio. The decrease in the fair value of bonds rated AA/Aa primarilyreflected net sales in 2017 of long dated U.S. state and municipal bonds (net proceeds of $2,346.5), partially offset bythe consolidation of Allied World’s bond portfolio. The increase in the fair value of bonds rated lower than B/Bprimarily reflected unrealized appreciation. The increase in bonds that were unrated primarily reflected unrealizedappreciation related to convertible bonds and purchases of certain corporate and other bonds. Except as described
99

FAIRFAX FINANCIAL HOLDINGS LIMITED
above, there were no other significant changes to the composition of the company’s fixed income portfolio classifiedaccording to the higher of each security’s respective S&P and Moody’s issuer credit rating at December 31, 2017compared to December 31, 2016.
At December 31, 2017 holdings of bonds in the ten issuers (excluding U.S., Canadian, U.K. and German sovereigngovernment bonds) to which the company had the greatest exposure totaled $3,398.7 (December 31, 2016 –$4,178.6), which represented approximately 8.7% (December 31, 2016 – 14.7%) of the total investment portfolio.Exposure to the largest single issuer of corporate bonds at December 31, 2017 was $663.6 (December 31, 2016 –$461.2), which represented approximately 1.7% (December 31, 2016 – 1.6%) of the total investment portfolio.
The consolidated investment portfolio included $2.5 billion at December 31, 2017 (December 31, 2016 –$4.7 billion) of U.S. state and municipal bonds (approximately $2.3 billion tax-exempt, $0.2 billion taxable), a largeportion of which were purchased during 2008 within subsidiary investment portfolios. At December 31, 2017approximately $1.5 billion (December 31, 2016 – $2.1 billion) of those U.S. state and municipal bonds are insured byBerkshire Hathaway Assurance Corp. for the payment of interest and principal in the event of issuer default, and aretherefore all rated AA or better.
Counterparties to derivative contracts
Counterparty risk arises from the company’s derivative contracts primarily in three ways: first, a counterparty may beunable to honour its obligation under a derivative contract and there may be insufficient collateral pledged in favourof the company to support that obligation; second, collateral deposited by the company to a counterparty as aprerequisite for entering into certain derivative contracts (also known as initial margin) may be at risk should thecounterparty face financial difficulty; and third, excess collateral pledged in favour of a counterparty may be at riskshould the counterparty face financial difficulty (counterparties may hold excess collateral as a result of the timing ofthe settlement of the amount of collateral required to be pledged based on the fair value of a derivative contract).
The company endeavours to limit counterparty risk through diligent selection of counterparties to its derivativecontracts and through the terms of negotiated agreements. Pursuant to these agreements, counterparties arecontractually required to deposit eligible collateral in collateral accounts (subject to certain minimum thresholds) forthe benefit of the company based on the then daily fair value of the derivative contracts. The company’s exposure torisk associated with providing initial margin is mitigated where possible through the use of segregated third partycustodian accounts whereby counterparties are permitted to take control of the collateral only in the event of defaultby the company.
Agreements negotiated with counterparties provide for a single net settlement of all financial instruments covered bythe agreement in the event of default by the counterparty, thereby permitting obligations owed by the company to acounterparty to be offset to the extent of the aggregate amount receivable by the company from that counterparty(the ‘‘net settlement arrangements’’). The following table sets out the company’s credit risk related to derivativecontract counterparties, assuming all such counterparties are simultaneously in default:
December 31, December 31,2017 2016
Total derivative assets(1) 126.7 196.4Impact of net settlement arrangements (38.6) (53.8)Fair value of collateral deposited for the benefit of the company(2) (39.1) (54.0)Excess collateral pledged by the company in favour of counterparties 9.0 12.2Initial margin not held in segregated third party custodian accounts 8.2 5.0
Net derivative counterparty exposure after net settlement and collateralarrangements 66.2 105.8
(1) Excludes equity warrants and equity call options which are not subject to counterparty risk.
(2) Excludes $0.4 (December 31, 2016 – $8.7) of excess collateral pledged by counterparties.
Collateral deposited for the benefit of the company at December 31, 2017 consisted of cash of $3.6 and governmentsecurities of $35.9 (December 31, 2016 – $8.3 and $54.4). The company had not exercised its right to sell or repledgecollateral at December 31, 2017.
100

Recoverable from reinsurers
Credit risk on the company’s recoverable from reinsurers balance existed at December 31, 2017 to the extent that anyreinsurer may be unable or unwilling to reimburse the company under the terms of the relevant reinsurancearrangements. The company is also exposed to the credit risk assumed in fronting arrangements and to potentialreinsurance capacity constraints. The company regularly assesses the creditworthiness of reinsurers with whom ittransacts business. Internal guidelines generally require reinsurers to have strong A.M. Best ratings and to maintaincapital and surplus in excess of $500.0. Where contractually provided for, the company has collateral for outstandingbalances in the form of cash, letters of credit, guarantees or assets held in trust accounts. This collateral may be drawnon when amounts remain unpaid beyond contractually specified time periods for each individual reinsurer.
The company’s reinsurance security department conducts ongoing detailed assessments of current and potentialreinsurers and annual reviews on impaired reinsurers, and provides recommendations for uncollectible reinsuranceprovisions for the group. This department also collects and maintains individual and group reinsurance exposuresacross the group. Most of the reinsurance balances for reinsurers rated B++ and lower or which are not rated wereinherited by the company on acquisition of a subsidiary. The company’s largest single recoverable from reinsurer(Munich Reinsurance Company) represented 6.5% of shareholders’ equity attributable to shareholders of Fairfax atDecember 31, 2017 (December 31, 2016 – 3.6%) and is rated A+ by A.M. Best.
The company’s gross exposure to credit risk from its reinsurers increased at December 31, 2017 compared toDecember 31, 2016, principally reflecting the impact from the consolidation of the recoverable from reinsurers ofAllied World and Fairfax Latam and current period catastrophe losses ceded to reinsurers. Changes that occurred inthe provision for uncollectible reinsurance during the period are disclosed in note 9.
The following table presents the gross recoverable from reinsurers classified according to the financial strengthratings of the reinsurers. Pools and associations, shown separately, are generally government or similar insurancefunds carrying limited credit risk.
December 31, 2017 December 31, 2016
Outstanding Net Outstanding NetGross balances unsecured Gross balances unsecured
recoverable for which recoverable recoverable for which recoverableA.M. Best Rating from security from from security from(or S&P equivalent) reinsurers is held reinsurers reinsurers is held reinsurers
A++ 429.6 31.9 397.7 390.0 27.2 362.8A+ 3,878.4 267.2 3,611.2 1,551.0 152.0 1,399.0A 2,311.9 95.4 2,216.5 1,130.8 67.3 1,063.5A- 245.5 15.1 230.4 299.7 19.9 279.8B++ 22.2 1.2 21.0 22.0 1.4 20.6B+ 3.1 0.8 2.3 2.0 1.2 0.8B or lower 5.4 3.0 2.4 11.9 8.9 3.0Not rated 948.2 493.8 454.4 703.3 218.5 484.8Pools and associations 134.6 4.5 130.1 71.3 5.6 65.7
7,978.9 912.9 7,066.0 4,182.0 502.0 3,680.0Provision for uncollectible reinsurance (166.4) (166.4) (171.7) (171.7)
Recoverable from reinsurers 7,812.5 6,899.6 4,010.3 3,508.3
Liquidity Risk
Liquidity risk is the potential for loss if the company is unable to meet financial commitments in a timely manner atreasonable cost as they fall due. The company’s policy is to ensure that sufficient liquid assets are available to meetfinancial commitments, including liabilities to policyholders and debt holders, dividends on preferred shares andinvestment commitments. Cash flow analysis is performed regularly at both the holding company and subsidiarycompany levels to ensure that future cash needs are met or exceeded by cash flows generated from operatingcompanies.
101

FAIRFAX FINANCIAL HOLDINGS LIMITED
The holding company’s known significant commitments for 2018 consist of payment of the $283.2 dividend oncommon shares ($10.00 per share paid January 2018), interest and corporate overhead expenses, preferred sharedividends, income tax payments, the purchase prices related to the acquisitions of certain businesses of Carillion andthe insurance operations of AIG in Uruguay (completed January 31, 2018) and Venezuela, and potential cashoutflows related to derivative contracts.
The company believes that holding company cash and investments, net of holding company short sale andderivative obligations at December 31, 2017 of $2,356.9 provides adequate liquidity to meet the holding company’sknown commitments in 2018. The holding company expects to continue to receive investment management andadministration fees from its insurance and reinsurance subsidiaries, investment income on its holdings of cash andinvestments, and dividends from its insurance and reinsurance subsidiaries. To further augment its liquidity, theholding company can draw upon its $2.0 billion unsecured revolving credit facility (described in note 15).
The liquidity requirements of the insurance and reinsurance subsidiaries principally relate to the liabilities associatedwith underwriting, operating costs and expenses, the payment of dividends to the holding company, contributionsto their subsidiaries, payment of principal and interest on their outstanding debt obligations, income tax paymentsand certain derivative obligations (described below). Liabilities associated with underwriting include the payment ofclaims and direct commissions. Historically, the insurance and reinsurance subsidiaries have used cash inflows fromoperating activities (primarily the collection of premiums and reinsurance commissions) and investment activities(primarily repayments of principal on debt investments, sales of investment securities and investment income) tofund their liquidity requirements. The insurance and reinsurance subsidiaries may also receive cash inflows fromfinancing activities (primarily distributions received from their subsidiaries).
The company’s insurance and reinsurance subsidiaries (and the holding company on a consolidated basis) focus onthe stress that could be placed on liquidity requirements as a result of severe disruption or volatility in the capitalmarkets or extreme catastrophe activity or the combination of both. The insurance and reinsurance subsidiariesmaintain investment strategies intended to provide adequate funds to pay claims or withstand disruption orvolatility in the capital markets without forced sales of investments. The insurance and reinsurance subsidiaries holdhighly liquid, high quality short-term investment securities and other liquid investment grade fixed maturitysecurities to fund anticipated claim payments, operating expenses and commitments related to investments. AtDecember 31, 2017 portfolio investments net of short sale and derivative obligations totaled $36.9 billion(December 31, 2016 – $27.1 billion). Portfolio investments include investments that may lack liquidity or areinactively traded, including corporate debentures, preferred stocks, common stocks, limited partnership interestsand other invested assets. At December 31, 2017 these asset classes represented approximately 12.3% (December 31,2016 – 9.6%) of the carrying value of the insurance and reinsurance subsidiaries’ portfolio investments. Fairfax Indiaand Fairfax Africa held investments that may lack liquidity or are inactively traded with a carrying value of $1,054.7at December 31, 2017 (December 31, 2016 – $326.6).
The insurance and reinsurance subsidiaries may experience cash inflows or outflows on occasion related to theirderivative contracts, including collateral requirements. During 2017 the insurance and reinsurance subsidiaries paidnet cash of $285.0 (2016 – $814.4) in connection with long and short equity and equity index total return swapderivative contracts (excluding the impact of collateral requirements). The closure in the fourth quarter of 2016 of allof the company’s short positions effected through total return swaps in the Russell 2000, S&P 500 and S&P/TSX60 equity indexes significantly reduced cash flow volatility related to derivatives in 2017.
The non-insurance companies have principal repayments coming due in 2018 of $855.9 primarily related to theFairfax India and Fairfax Africa term loans. Borrowings of the non-insurance companies are non-recourse to theholding company and are generally expected to be settled through a combination of refinancing and operatingcash flows.
102

The following tables set out the maturity profile of the company’s financial liabilities based on the expectedundiscounted cash flows from the end of the year to the contractual maturity date or the settlement date:
December 31, 2017
Less than 3 months More than3 months to 1 year 1 – 3 years 3 – 5 years 5 years Total
Accounts payable and accrued liabilities(1) 1,564.5 578.8 485.3 216.8 93.5 2,938.9Funds withheld payable to reinsurers 186.6 553.2 41.9 1.4 67.1 850.2Provision for losses and loss adjustment expenses 2,108.8 5,344.5 8,272.0 4,557.3 8,328.2 28,610.8Borrowings – principal 47.1 958.0 877.5 1,556.8 2,957.5 6,396.9Borrowings – interest 45.6 270.1 542.9 381.5 745.6 1,985.7
3,952.6 7,704.6 10,219.6 6,713.8 12,191.9 40,782.5
December 31, 2016
Less than 3 months More than3 months to 1 year 1 – 3 years 3 – 5 years 5 years Total
Accounts payable and accrued liabilities(1) 1,257.4 433.9 347.4 113.3 131.8 2,283.8Funds withheld payable to reinsurers 125.1 252.0 25.8 1.5 11.8 416.2Provision for losses and loss adjustment expenses 1,383.5 3,890.0 5,664.4 3,428.0 5,115.9 19,481.8Borrowings – principal 478.1 237.6 650.8 1,299.6 2,117.4 4,783.5Borrowings – interest 51.5 197.6 443.1 334.5 610.0 1,636.7
3,295.6 5,011.1 7,131.5 5,176.9 7,986.9 28,602.0
(1) Excludes pension and post retirement liabilities, ceded deferred premium acquisition costs and accrued interest. Operatinglease commitments are described in note 22.
The timing of loss payments is not fixed and represents the company’s best estimate. The payment obligations whichare due beyond one year in accounts payable and accrued liabilities primarily relate to certain payables to brokers andreinsurers not expected to be settled in the short term. At December 31, 2017 the company had income taxes payableof $95.6 (December 31, 2016 – $35.4).
The following table provides a maturity profile of the company’s short sale and derivative obligations based on theexpected undiscounted cash flows from the end of the year to the contractual maturity date or the settlement date:
December 31, 2017 December 31, 2016
Less than 3 months Less than 3 months3 months to 1 year Total 3 months to 1 year Total
Equity total return swaps – short positions 12.1 – 12.1 78.1 – 78.1Equity total return swaps – long positions 15.6 – 15.6 5.1 – 5.1Foreign exchange forward contracts 58.1 11.6 69.7 89.0 12.4 101.4U.S. treasury bond forwards 28.8 – 28.8 49.7 – 49.7
114.6 11.6 126.2 221.9 12.4 234.3
Market Risk
Market risk (comprised of foreign currency risk, interest rate risk and other price risk) is the risk that the fair value orfuture cash flows of a financial instrument will fluctuate because of changes in market prices. The company isexposed to market risk principally in its investing activities but also in its underwriting activities to the extent thatthose activities expose the company to foreign currency risk. The company’s investment portfolios are managed witha long term, value-oriented investment philosophy emphasizing downside protection. The company has policies tolimit and monitor its individual issuer exposures and aggregate equity exposure at the subsidiary level and in total atthe holding company level. The following is a discussion of the company’s primary market risk exposures and howthose exposures are managed.
103

FAIRFAX FINANCIAL HOLDINGS LIMITED
Interest rate risk
Interest rate risk is the risk that the fair value or future cash flows of a financial instrument will fluctuate because ofchanges in market interest rates. Typically, as interest rates rise, the fair value of fixed income investments declineand, conversely, as interest rates decline, the fair value of fixed income investments rise. In each case, the longer thematurity of the financial instrument, the greater the consequence of a change in interest rates. The company’sinterest rate risk management strategy is to position its fixed income portfolio based on its view of future interestrates and the yield curve, balanced with liquidity requirements. The company may reposition the portfolio inresponse to changes in the interest rate environment. At December 31, 2017 the company’s investment portfolioincluded fixed income securities with an aggregate fair value of $10.3 billion that is subject to interest rate risk.
The company’s exposure to interest rate risk remained relatively unchanged in 2017 compared to 2016 on a pre-taxbasis. Allied World’s bond portfolio ($5,337.2, acquired on July 6, 2017) was re-balanced to reflect the company’sinterest rate risk tolerance. Net sales of long dated U.S. state and municipal bonds (net proceeds of $2,346.5) werebroadly in line with the decrease in the notional amount of forward contracts to sell long dated U.S. treasury bonds(notional amount of $1,693.8 at December 31, 2017 compared to $3,013.4 at December 31, 2016). The table below,which displays the potential impact on net earnings of changes in interest rates on the company’s fixed incomeportfolio, incorporates the anticipated effects of U.S. tax reform on the company’s effective tax rate in 2017. Therewere no significant changes to the company’s framework used to monitor, evaluate and manage interest rate risk atDecember 31, 2017 compared to December 31, 2016.
Movements in the term structure of interest rates affect the level and timing of recognition in earnings of gains andlosses on fixed income securities held. Generally, the company’s investment income may be reduced duringsustained periods of lower interest rates as higher yielding fixed income securities are called, mature, or are sold andthe proceeds are reinvested at lower rates. During periods of rising interest rates, the market value of the company’sexisting fixed income securities will generally decrease and gains on fixed income securities will likely be reduced.Losses are likely to be incurred following significant increases in interest rates. General economic conditions,political conditions and many other factors can also adversely affect the bond markets and, consequently, the valueof fixed income securities held. These risks are monitored by the company’s senior portfolio managers and CEO, andtaken into consideration when managing the consolidated bond portfolio.
The table below displays the potential impact of changes in interest rates on the company’s fixed income portfoliobased on parallel 200 basis point shifts up and down, in 100 basis point increments. This analysis was performed oneach individual security to determine the hypothetical effect on net earnings.
December 31, 2017 December 31, 2016
Fair value Hypothetical Fair value Hypotheticalof fixed $ change effect Hypothetical of fixed $ change effect Hypotheticalincome on net % change in income on net % change in
portfolio earnings(1) fair value(1) portfolio earnings(1) fair value(1)
Change in interest rates200 basis point increase 9,897.4 (306.2) (3.8) 9,758.6 (295.1) (4.0)100 basis point increase 10,090.1 (155.6) (2.0) 9,962.2 (148.2) (2.0)No change 10,290.8 – – 10,167.5 – –100 basis point decrease 10,498.6 161.3 2.0 10,338.3 124.6 1.7200 basis point decrease 10,720.5 332.0 4.2 10,480.2 228.6 3.1
(1) Includes the impact of forward contracts to sell long dated U.S. treasury bonds with a notional amount of $1,693.8(December 31, 2016 – $3,013.4).
Certain shortcomings are inherent in the method of analysis presented above. Computations of the prospectiveeffects of hypothetical interest rate changes are based on numerous assumptions, including the maintenance of thelevel and composition of fixed income securities at the indicated date, and should not be relied on as indicative offuture results. Actual values may differ from the projections presented should market conditions vary fromassumptions used in the calculation of the fair value of individual securities; such variations may includenon-parallel shifts in the term structure of interest rates and changes in individual issuer credit spreads.
104

Market price fluctuations
Market price fluctuation is the risk that the fair value or future cash flows of a financial instrument will fluctuatebecause of changes in market prices (other than those arising from interest rate risk or foreign currency risk), whetherthose changes are caused by factors specific to the individual financial instrument or its issuer, or other factorsaffecting all similar financial instruments in the market. Changes to the company’s exposure to equity price riskthrough its equity and equity-related holdings at December 31, 2017 compared to December 31, 2016 are describedbelow.
The company holds significant investments in equity and equity-related instruments. The market value and theliquidity of these investments are volatile and may vary dramatically either up or down in short periods, and theirultimate value will therefore only be known over the long term or on disposition.
Throughout most of 2016 the company had economically hedged certain market risks associated with its equity andequity-related holdings (comprised of common stocks, convertible preferred stocks, convertible bonds,non-insurance investments in associates and equity-related derivatives) against a potential significant decline inequity markets by way of short positions effected through equity and equity index total return swaps (includingshort positions in certain equity indexes and individual equities) and equity index put options (S&P 500). Thecompany’s equity hedges were structured to provide a return that was inverse to changes in the fair values of theindexes and certain individual equities.
The company discontinued its economic equity hedging strategy in the fourth quarter of 2016 after givingconsideration to the possible and actual outcome of the U.S. elections and the potential for fundamental changesthat could improve U.S. economic growth and equity markets. During 2016 the company closed out $6,350.6notional amount of short positions effected through equity index total return swaps (comprised of Russell 2000,S&P 500 and S&P/TSX 60 short equity index total return swaps) and recognized a net loss on investment of $955.2(realized loss of $2,665.4 of which $1,710.2 had been recognized as unrealized losses in prior years). The companycontinues to hold short equity and equity index total return swaps for investment purposes, but no longer regardsthem as hedges of its equity and equity-related holdings. During 2017 the company closed out $1,202.9 notionalamount of short equity total return swaps and recognized a net loss on investment of $237.9 (realized loss of $553.1of which $315.2 was recognized as unrealized losses in prior years). In the first quarter of 2018 the company closedout an additional $481.3 notional amount of short equity and equity index total return swaps and recognized a netloss on investment of $8.1 (realized loss of $199.0 of which $190.9 was recognized as unrealized losses in prior years),which reduced the notional amount of remaining short equity and equity index total return swaps toapproximately $509.
105

FAIRFAX FINANCIAL HOLDINGS LIMITED
The following table summarizes the net effect of the company’s equity and equity-related holdings (long exposuresnet of short exposures) on the company’s financial position as at December 31, 2017 and 2016 and results ofoperations for the years then ended. The company considers the fair value of $3,846.2 (December 31, 2016 –$1,752.5) of its non-insurance investments in associates (see note 6) as a component of its equity and equity-relatedholdings when assessing its net equity exposures.
Year ended Year ended
December 31, December 31,
December 31, 2017 December 31, 2016 2017 2016
Exposure/ Exposure/ Pre-tax Pre-tax
Notional Carrying Notional Carrying earnings earnings
amount value amount value (loss) (loss)
Long equity exposures:Common stocks(1) 5,578.1 5,578.1 4,181.4 4,181.4 707.8 (78.0)Preferred stocks – convertible 68.1 68.1 9.1 9.1 (1.6) (6.6)Bonds – convertible 833.8 833.8 638.2 638.2 233.1 (39.4)Investments in associates(2) 3,846.2 2,945.3 1,752.5 1,693.0 69.8 –Derivatives and other invested assets:
Equity total return swaps – long positions 697.8 2.2 213.1 4.3 19.6 23.3Equity warrants and call options(4) 77.6 77.6 19.3 19.3 38.3 (4.0)
Total equity and equity related holdings 11,101.6 9,505.1 6,813.6 6,545.3 1,067.0 (104.7)
Short equity exposures and equity hedges(3):Derivatives and other invested assets:
Equity total return swaps – short positions (892.5) (0.3) (1,623.0) (67.7) (408.7) (208.0)Equity index total return swaps – short positions (52.6) 0.4 (43.3) 0.6 (9.2) (971.8)Equity index put options(4) – – – – – (13.1)
(945.1) 0.1 (1,666.3) (67.1) (417.9) (1,192.9)
Net equity exposures and financial effects 10,156.5 5,147.3 649.1 (1,297.6)
(1) The company excludes other funds that are invested principally in fixed income securities with a carrying value of $90.9 atDecember 31, 2017 (December 31, 2016 – $157.1) when measuring its equity and equity-related exposure.
(2) Excludes the company’s insurance and reinsurance investments in associates which are considered long term strategicholdings. See note 6 for details.
(3) Prior to the fourth quarter of 2016 the short equity exposures were considered economic hedges of certain market risksassociated with the company’s equity and equity-related holdings.
(4) The company does not consider the notional amounts of the S&P 500 call options and put options in its assessment of itsnet equity exposures if they are out-of-the-money.
The table that follows illustrates the potential impact on net earnings of changes in the fair value of the company’sequity and equity-related holdings (long exposures net of short exposures) as a result of changes in global equitymarkets at December 31, 2017 and 2016. The analysis assumes variations of 5% and 10% which the company
106

believes to be reasonably possible based on analysis of the return on various equity indexes and management’sknowledge of global equity markets.
December 31, 2017 December 31, 2016
Fair value Hypothetical Fair value Hypotheticalof equity $ change effect Hypothetical of equity $ change effect Hypothetical
and equity- on net % change and equity- on net % changerelated holdings earnings in fair value related holdings earnings in fair value
Change in globalequity markets
10% increase 6,887.9 479.9 9.2 3,755.3 248.6 10.65% increase 6,597.9 239.0 4.6 3,569.7 119.6 5.2No change 6,310.3 – – 3,394.7 – –5% decrease 6,023.0 (238.5) (4.6) 3,233.5 (106.7) (4.7)10% decrease 5,738.1 (475.0) (9.1) 3,082.9 (204.5) (9.2)
The changes in fair value of non-insurance investments in associates have been excluded from each of the scenariospresented above as any change in the fair value of an investment in associate is generally recognized in thecompany’s consolidated financial reporting only upon ultimate disposition of the associate.
The company’s risk management objective with respect to market price fluctuations places primary emphasis on thepreservation of invested capital. Subsequent to the economic downturn in 2008, the company became increasinglyconcerned about the risk of a potential significant decline in global equity markets. From 2010 until the fourthquarter of 2016, the company relied on certain derivative financial instruments to protect its equity and equity-related holdings. In the latter part of 2016, the company’s sentiment with respect to U.S. economic growth andimprovements in the global equity markets improved, resulting in the discontinuation of the economic equityhedging strategy. In the foreseeable future, the company does not expect to apply equity hedging strategies and willremain focused on its long-term value-oriented investment philosophy, seeking investments that are attractivelypriced, are selling at a discount to intrinsic value and afford a margin of safety.
At December 31, 2017 the company’s exposure to the ten largest issuers of common stock owned in its investmentportfolio was $3,138.1, which represented 8.0% of the total investment portfolio (December 31, 2016 – $2,113.8,7.4%). The exposure to the largest single issuer of common stock held at December 31, 2017 was $549.0, whichrepresented 1.4% of the total investment portfolio (December 31, 2016 – $391.7, 1.4%).
Risk of decreasing price levels
The risk of decreases in the general price level of goods and services is the potential for negative impacts on theconsolidated balance sheet (including the company’s equity and equity-related holdings and fixed incomeinvestments in non-sovereign debt) and the consolidated statement of earnings. Among their effects on theeconomy, decreasing price levels typically result in decreased consumption, restriction of credit, shrinking outputand investment and numerous bankruptcies.
The company has purchased derivative contracts referenced to consumer price indexes (‘‘CPI’’) in the geographicregions in which it operates to serve as an economic hedge against the potential adverse financial impact on thecompany of decreasing price levels. At December 31, 2017 these contracts have a remaining weighted average life of4.6 years (December 31, 2016 – 5.6 years), a notional amount of $117.3 billion (December 31, 2016 – $110.4 billion)and a fair value of $39.6 (December 31, 2016 -$83.4). As the average remaining life of a contract declines, the fairvalue of the contract (excluding the impact of CPI changes) will generally decline. The company’s maximumpotential loss on any contract is limited to the original cost of that contract. During 2017 the company did not enterinto any new CPI-linked derivative contracts. The company’s CPI-linked derivative contracts produced netunrealized losses of $71.0 in 2017 (2016 – $196.2).
Foreign currency risk
Foreign currency risk is the risk that the fair value or cash flows of a financial instrument or another asset willfluctuate because of changes in exchange rates and as a result, could produce an adverse effect on earnings and equitywhen measured in a company’s functional currency. The company is exposed to foreign currency risk through
107
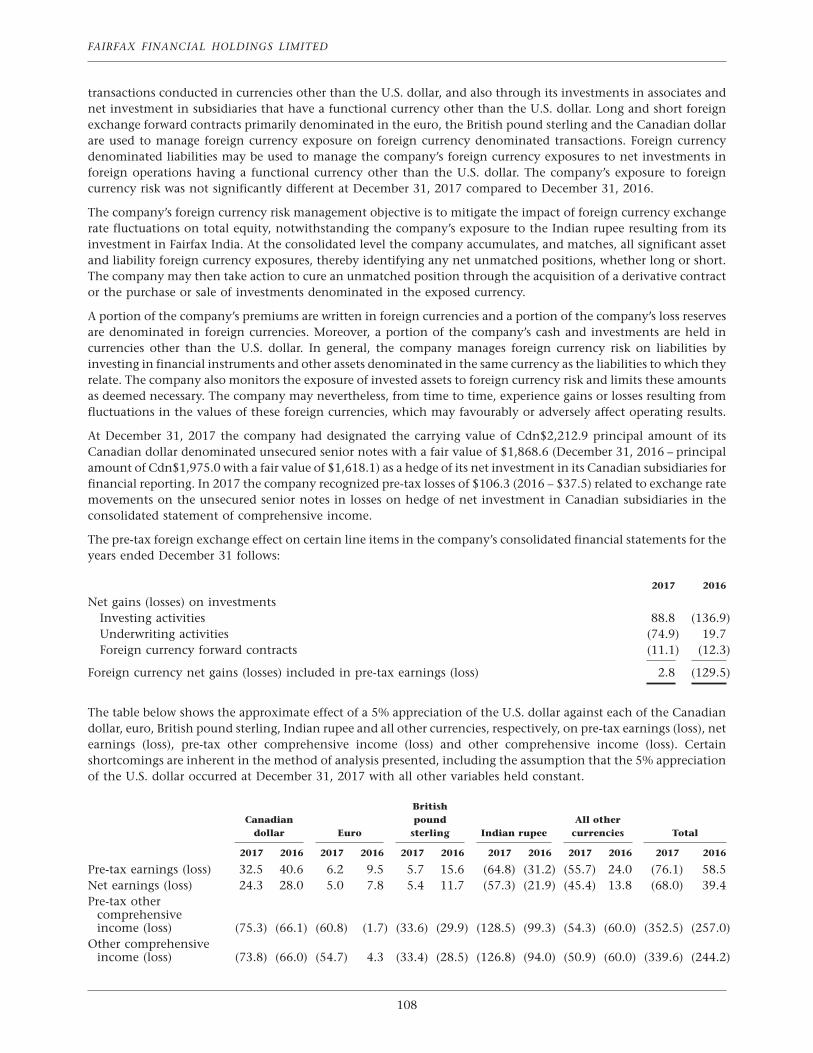
FAIRFAX FINANCIAL HOLDINGS LIMITED
transactions conducted in currencies other than the U.S. dollar, and also through its investments in associates andnet investment in subsidiaries that have a functional currency other than the U.S. dollar. Long and short foreignexchange forward contracts primarily denominated in the euro, the British pound sterling and the Canadian dollarare used to manage foreign currency exposure on foreign currency denominated transactions. Foreign currencydenominated liabilities may be used to manage the company’s foreign currency exposures to net investments inforeign operations having a functional currency other than the U.S. dollar. The company’s exposure to foreigncurrency risk was not significantly different at December 31, 2017 compared to December 31, 2016.
The company’s foreign currency risk management objective is to mitigate the impact of foreign currency exchangerate fluctuations on total equity, notwithstanding the company’s exposure to the Indian rupee resulting from itsinvestment in Fairfax India. At the consolidated level the company accumulates, and matches, all significant assetand liability foreign currency exposures, thereby identifying any net unmatched positions, whether long or short.The company may then take action to cure an unmatched position through the acquisition of a derivative contractor the purchase or sale of investments denominated in the exposed currency.
A portion of the company’s premiums are written in foreign currencies and a portion of the company’s loss reservesare denominated in foreign currencies. Moreover, a portion of the company’s cash and investments are held incurrencies other than the U.S. dollar. In general, the company manages foreign currency risk on liabilities byinvesting in financial instruments and other assets denominated in the same currency as the liabilities to which theyrelate. The company also monitors the exposure of invested assets to foreign currency risk and limits these amountsas deemed necessary. The company may nevertheless, from time to time, experience gains or losses resulting fromfluctuations in the values of these foreign currencies, which may favourably or adversely affect operating results.
At December 31, 2017 the company had designated the carrying value of Cdn$2,212.9 principal amount of itsCanadian dollar denominated unsecured senior notes with a fair value of $1,868.6 (December 31, 2016 – principalamount of Cdn$1,975.0 with a fair value of $1,618.1) as a hedge of its net investment in its Canadian subsidiaries forfinancial reporting. In 2017 the company recognized pre-tax losses of $106.3 (2016 – $37.5) related to exchange ratemovements on the unsecured senior notes in losses on hedge of net investment in Canadian subsidiaries in theconsolidated statement of comprehensive income.
The pre-tax foreign exchange effect on certain line items in the company’s consolidated financial statements for theyears ended December 31 follows:
2017 2016
Net gains (losses) on investmentsInvesting activities 88.8 (136.9)Underwriting activities (74.9) 19.7Foreign currency forward contracts (11.1) (12.3)
Foreign currency net gains (losses) included in pre-tax earnings (loss) 2.8 (129.5)
The table below shows the approximate effect of a 5% appreciation of the U.S. dollar against each of the Canadiandollar, euro, British pound sterling, Indian rupee and all other currencies, respectively, on pre-tax earnings (loss), netearnings (loss), pre-tax other comprehensive income (loss) and other comprehensive income (loss). Certainshortcomings are inherent in the method of analysis presented, including the assumption that the 5% appreciationof the U.S. dollar occurred at December 31, 2017 with all other variables held constant.
BritishCanadian pound All other
dollar Euro sterling Indian rupee currencies Total
2017 2016 2017 2016 2017 2016 2017 2016 2017 2016 2017 2016
Pre-tax earnings (loss) 32.5 40.6 6.2 9.5 5.7 15.6 (64.8) (31.2) (55.7) 24.0 (76.1) 58.5Net earnings (loss) 24.3 28.0 5.0 7.8 5.4 11.7 (57.3) (21.9) (45.4) 13.8 (68.0) 39.4Pre-tax other
comprehensiveincome (loss) (75.3) (66.1) (60.8) (1.7) (33.6) (29.9) (128.5) (99.3) (54.3) (60.0) (352.5) (257.0)
Other comprehensiveincome (loss) (73.8) (66.0) (54.7) 4.3 (33.4) (28.5) (126.8) (94.0) (50.9) (60.0) (339.6) (244.2)
108

The hypothetical impact in 2017 of the foreign currency movements on pre-tax earnings (loss) in the table aboveprincipally related to the following:
Canadian dollar: Foreign exchange forward contracts used as economic hedges of operational exposure atOdysseyRe (including OdysseyRe’s net investment in its Canadian branch where the net assets are translatedthrough other comprehensive income), the translation of the company’s Canadian dollar denominated seniornotes not included as part of the hedge of net investment in Canadian subsidiaries and certain net assets ofAllied World (consolidated during 2017).
Euro: Foreign exchange forward contracts at OdysseyRe and Crum & Forster used as economic hedges of eurodenominated operational exposure and portfolio investments, and certain net liabilities of Allied World(consolidated during 2017) and Run-off (principally provision for losses and loss adjustment expenses, partiallyoffset by portfolio investments).
British pound sterling: Certain net liabilities at OdysseyRe (principally insurance contract liabilities net ofrecoverable from reinsurers and portfolio investments) and Allied World (consolidated during 2017), partiallyoffset by certain net assets at Brit (principally portfolio investments and recoverable from reinsurers, net ofinsurance contract liabilities).
Indian rupee: The company’s 9.9% equity interest in ICICI Lombard (reclassified from investments in associatesto holding company cash and investments within Fairfax Asia during 2017) and portfolio investments heldbroadly across the company.
All other currencies: U.S. dollar denominated portfolio investments held in entities where the functionalcurrency is other than the U.S. dollar (primarily at OdysseyRe’s Paris branch and Newline syndicate), foreignexchange forward contracts used as economic hedges of operational exposure at OdysseyRe and certain netassets of Allied World (consolidated during 2017), partially offset by certain net liabilities at Fairfax India(primarily U.S. dollar long term debt).
The hypothetical impact in 2017 of the foreign currency movements on pre-tax other comprehensive income (loss)in the table above principally related to the translation of the company’s non-U.S. dollar net investments insubsidiaries and investments in associates as follows:
Canadian dollar: Net investments in Northbridge and Canadian subsidiaries within the Other reportingsegment, partially offset by the impact of the hedge of net investment in Canadian subsidiaries.
Euro: Net investments in Grivalia Properties (consolidated during 2017) and investments in associates(primarily Eurolife, Astarta and KWF LPs), partially offset by net liabilities in OdysseyRe’s Paris branch.
British pound sterling: Net investments in Newline syndicate (OdysseyRe) and RiverStone Insurance in the U.K.(European Run-off).
Indian rupee: Net investments in Fairfax India and Thomas Cook India.
All other currencies: Net investments in Fairfax Latin America (Argentine peso, Chilean peso, Colombian peso),Bryte Insurance (South African rand), Polish Re (Polish zloty), AMAG (Indonesian rupiah), Fairfirst Insurance(Sri Lankan rupee) and Pacific Insurance (Malaysian ringgit), and investments in associates (primarily Kuwaitidinar at Gulf Insurance, South African rand at AFGRI and Vietnamese dong at BIC Insurance).
109

FAIRFAX FINANCIAL HOLDINGS LIMITED
Capital Management
The company’s capital management framework is designed to protect, in the following order, its policyholders, itsbondholders and its preferred shareholders and then finally to optimize returns to common shareholders. Effectivecapital management includes measures designed to maintain capital above minimum regulatory levels, above levelsrequired to satisfy issuer credit ratings and financial strength ratings requirements, and above internally determinedand calculated risk management levels. Total capital at December 31, 2017, comprising total debt, shareholders’equity attributable to shareholders of Fairfax and non-controlling interests, was $24,826.1 compared to $16,587.7 atDecember 31, 2016. The company manages its capital based on the following financial measurements and ratios toprovide an indication of the company’s ability to issue and service debt without impacting the operating companiesor their portfolio investments:
December 31, December 31,2017 2016
Holding company cash and investments (net of short sale and derivative obligations) 2,356.9 1,329.4
Borrowings – holding company 3,475.1 3,472.5Borrowings – insurance and reinsurance companies 1,373.0 435.5Borrowings – non-insurance companies 1,566.0 859.6
Total debt 6,414.1 4,767.6
Net debt(1) 4,057.2 3,438.2
Common shareholders’ equity 12,475.6 8,484.6Preferred stock 1,335.5 1,335.5Non-controlling interests 4,600.9 2,000.0
Total equity 18,412.0 11,820.1
Net debt/total equity 22.0% 29.1%Net debt/net total capital(2) 18.1% 22.5%Total debt/total capital(3) 25.8% 28.7%Interest coverage(4) 7.1x n/aInterest and preferred share dividend distribution coverage(5) 6.0x n/a
(1) Net debt is is calculated by the company as total debt less holding company cash and investments (net of short sale andderivative obligations).
(2) Net total capital is calculated by the company as the sum of total equity and net debt.
(3) Total capital is calculated by the company as the sum of total equity and total debt.
(4) Interest coverage is calculated by the company as the sum of earnings (loss) before income taxes and interest expensedivided by interest expense.
(5) Interest and preferred share dividend distribution coverage is calculated by the company as the sum of earnings (loss)before income taxes and interest expense divided by interest expense and preferred share dividend distributions adjusted toa pre-tax equivalent at the company’s Canadian statutory income tax rate.
During 2017 the company completed an underwritten public offering of Cdn$650.0 principal amount of 4.25%senior notes due 2027 for net proceeds of $509.5. Those net proceeds were used to redeem the company’s remainingCdn$388.4 principal amount 7.5% senior notes for cash consideration of $340.6 (including accrued interest), repay$124.9 principal amount of purchase consideration payable upon maturity and reduce the amount outstanding onthe company’s revolving credit facility (note 15). The company also issued 5,075,894 subordinate voting shares witha fair value of $2,191.6 as part of the acquisition of Allied World (note 23).
The company’s capital management objectives include maintaining sufficient liquid resources at the holdingcompany to be able to pay interest on debt, dividends to preferred shareholders and all other holding companyobligations. Accordingly, the company monitors its interest and preferred share dividend distribution coverage ratiocalculated as described in footnote 5 of the table above.
110

In the United States, the National Association of Insurance Commissioners (‘‘NAIC’’) has developed a model law andrisk-based capital (‘‘RBC’’) formula designed to help regulators identify property and casualty insurers that may beinadequately capitalized. Under the NAIC’s requirements, an insurer must maintain total capital and surplus above acalculated threshold or face varying levels of regulatory action. The threshold is based on a formula that attempts toquantify the risk of a company’s insurance, investment and other business activities. At December 31, 2017 Crum &Forster, Zenith National, Allied World, OdysseyRe and U.S. Run-off subsidiaries had capital and surplus in excess ofthe regulatory minimum requirement of two times the authorized control level.
In Bermuda, the Bermuda Insurance Act 1978 imposes solvency and liquidity standards on Bermuda insurers andreinsurers. There is a requirement to hold available statutory economic capital and surplus equal to or in excess of anenhanced capital and target capital level as determined by the Bermuda Monetary Authority under the BermudaSolvency Capital Requirement model. The target capital level is measured as 120% of the enhanced capitalrequirements. At December 31, 2017 Allied World was in compliance with Bermuda’s regulatory requirements.
In Canada, property and casualty companies are regulated by the Office of the Superintendent of FinancialInstitutions on the basis of a minimum supervisory target of 150% of a minimum capital test (‘‘MCT’’) formula. AtDecember 31, 2017 Northbridge’s subsidiaries had a weighted average MCT ratio in excess of the 150% minimumsupervisory target.
The Lloyd’s market is subject to the solvency and capital adequacy requirements of the Prudential RegulatoryAuthority in the U.K. The capital requirements of Brit are based on the output of an internal model which reflects therisk profile of the business. At December 31, 2017 Brit’s available capital was in excess of its management capitalrequirements (capital required for business strategy and regulatory requirements).
In countries other than the U.S., Canada, the U.K. and Bermuda where the company operates, the company met orexceeded the applicable regulatory capital requirements at December 31, 2017.
25. Segmented Information
The company identifies its operating segments by operating company, consistent with its management structure.Certain of the operating segments have been aggregated into reporting segments, with reporting segmentscategorized by type of business as described below. The accounting policies of the reporting segments are the same asthose described in note 3. Transfer prices for inter-segment transactions are set at arm’s length. Geographic premiumsare determined based on the domicile of the various subsidiaries and where the primary underlying risk of thebusiness resides.
Insurance and Reinsurance
Northbridge – A national commercial property and casualty insurer in Canada providing property and casualtyinsurance products through its Northbridge Insurance and Federated subsidiaries.
OdysseyRe – A U.S.-based reinsurer that provides a full range of property and casualty products on a worldwide basis,and that underwrites specialty insurance, primarily in the U.S. and in the U.K., both directly and through the Lloyd’smarket in London.
Crum & Forster – A national commercial property and casualty insurer in the U.S. writing a broad range ofcommercial coverages, principally specialty coverages.
Zenith National – An insurer primarily engaged in workers’ compensation business in the U.S.
Brit – A market-leading global Lloyd’s of London specialty insurer and reinsurer.
Allied World – A global property, casualty and specialty insurer and reinsurer with a presence at Lloyd’s.
Fairfax Asia – This reporting segment includes the company’s operations that underwrite insurance and reinsurancecoverages in Singapore (First Capital, sold on December 28, 2017), Hong Kong (Falcon), Malaysia (Pacific Insurance),Indonesia (AMAG, acquired on October 10, 2016), and Sri Lanka (Fairfirst Insurance, acquired on October 3, 2016).Fairfax Asia also includes the company’s equity accounted interests in Vietnam-based BIC Insurance (35.0%),Thailand-based Falcon Thailand (41.2%) and Mumbai-based ICICI Lombard (partially sold during 2017 andreclassified to a common stock investment).
111

FAIRFAX FINANCIAL HOLDINGS LIMITED
Insurance and Reinsurance – Other – This reporting segment is comprised of Group Re, Bryte Insurance (acquired onDecember 7, 2016), Advent, Fairfax Latin America and Fairfax Central and Eastern Europe (‘‘Fairfax CEE’’). Group Reprimarily constitutes the participation of CRC Re and Wentworth (both based in Barbados) in the reinsurance ofFairfax’s subsidiaries by quota share or through participation in those subsidiaries’ third party reinsurance programson the same terms as third party reinsurers. Group Re also writes third party business. Bryte Insurance is anestablished property and casualty insurer in South Africa and Botswana. Advent is a specialty property reinsuranceand insurance company operating through Syndicate 780 at Lloyd’s. Fairfax Latin America is comprised of FairfaxBrasil, which writes commercial property and casualty insurance in Brazil, and Fairfax Latam, consisting of propertyand casualty insurance operations in Chile, Colombia and Argentina. Fairfax CEE is comprised of Polish Re, whichwrites reinsurance in Central and Eastern Europe, and Colonnade Insurance, a Luxembourg property and casualtyinsurer with branches in each of the Czech Republic, Hungary, Slovakia, Poland, Bulgaria and Romania, and aninsurance subsidiary in Ukraine.
Run-off
The Run-off reporting segment principally comprises RiverStone (UK), Syndicate 3500 at Lloyd’s (managed byRiverStone Managing Agency Limited), RiverStone Insurance (European Run-off) and TIG Insurance (U.S. Run-off).
Other
The Other reporting segment is comprised of the company’s non-insurance operations, including Cara and itssubsidiaries St-Hubert (acquired on September 2, 2016), Original Joe’s (acquired on November 28, 2016) and PickleBarrel (acquired on December 1, 2017), The Keg, Thomas Cook India and its subsidiaries Quess and Sterling Resorts,Grivalia Properties (consolidated on July 4, 2017), Mosaic Capital (consolidated on January 26, 2017), Pethealth,Praktiker, Sporting Life, William Ashley, Boat Rocker, Golf Town (acquired on October 31, 2016), Fairfax Africa (sinceits initial public offering on February 17, 2017), and Fairfax India and its subsidiaries NCML, Fairchem (merged onMarch 14, 2017 with Privi Organics (acquired on August 26, 2016)) and Saurashtra Freight (acquired onFebruary 14, 2017).
Corporate and Other
Corporate and Other includes the parent entity (Fairfax Financial Holdings Limited), its subsidiary intermediateholding companies and Hamblin Watsa, an investment management company.
112

Sources of Earnings by Reporting Segment
Sources of earnings by reporting segment for the years ended December 31 were as follows:
2017
Insurance and ReinsuranceCorporate Eliminations
Crum & Zenith Allied Fairfax Operating and and
Northbridge OdysseyRe Forster National Brit World(1) Asia Other companies Run-off Other Other adjustments Consolidated
Gross premiums written
External 1,180.4 2,725.7 2,120.0 849.0 2,048.1 1,447.6 667.9 1,160.4 12,199.1 8.4 – – – 12,207.5
Intercompany 6.6 57.4 54.5 – 8.9 – 2.5 83.9 213.8 – – – (213.8) –
1,187.0 2,783.1 2,174.5 849.0 2,057.0 1,447.6 670.4 1,244.3 12,412.9 8.4 – – (213.8) 12,207.5
Net premiums written 1,064.9 2,495.9 1,863.4 837.4 1,530.9 991.9 327.5 863.3 9,975.2 8.3 – – – 9,983.5
Net premiums earned
External 1,023.7 2,318.3 1,822.1 814.1 1,537.3 1,041.3 369.3 775.2 9,701.3 20.1 – – – 9,721.4
Intercompany (4.0) 15.1 30.7 (2.5) (0.4) (12.6) (41.7) 15.4 – – – – – –
1,019.7 2,333.4 1,852.8 811.6 1,536.9 1,028.7 327.6 790.6 9,701.3 20.1 – – – 9,721.4
Underwriting expenses(2) (1,010.7) (2,273.4) (1,849.6) (694.4) (1,738.8) (1,615.3) (289.4) (871.2) (10,342.8) (227.5) – – – (10,570.3)
Underwriting profit (loss) 9.0 60.0 3.2 117.2 (201.9) (586.6) 38.2 (80.6) (641.5) (207.4) – – – (848.9)
Interest income 56.1 131.0 53.4 26.8 41.9 76.8 31.3 38.7 456.0 37.2 29.7 (8.3) – 514.6
Dividends 9.5 15.6 3.4 3.8 3.7 2.2 3.2 11.8 53.2 4.6 9.1 6.3 – 73.2
Investment expenses (11.5) (21.7) (23.0) (7.2) (13.0) (13.1) (5.4) (12.0) (106.9) (12.9) (143.7) (2.1) 236.8 (28.8)
Interest and dividends 54.1 124.9 33.8 23.4 32.6 65.9 29.1 38.5 402.3 28.9 (104.9) (4.1) 236.8 559.0
Share of profit (loss) ofassociates 3.2 7.2 (1.1) (9.8) 9.2 (17.6) 29.4 3.0 23.5 (6.1) 55.4 127.7 – 200.5
Other
Revenue – – – – – – – – – – 3,257.6 – – 3,257.6
Expenses – – – – – – – – – – (2,996.0) – – (2,996.0)
– – – – – – – – – – 261.6 – – 261.6
Operating income (loss) 66.3 192.1 35.9 130.8 (160.1) (538.3) 96.7 (39.1) (215.7) (184.6) 212.1 123.6 236.8 172.2
Net gains (losses) oninvestments 44.8 253.1 27.9 26.6 79.0 (26.5) 1,083.9 69.5 1,558.3 73.3 7.2 (171.3) – 1,467.5
Gain on sale of subsidiary – – – – – – 1,018.6 – 1,018.6 – – – – 1,018.6
Loss on repurchase of longterm debt (note 15) – – – – – – – – – – – (28.6) – (28.6)
Interest expense – (3.3) (1.8) (3.3) (12.5) (15.6) – (4.8) (41.3) – (65.8) (224.1) – (331.2)
Corporate overhead (8.7) (27.4) (25.4) (8.2) (9.2) (27.9) (2.6) (22.2) (131.6) – – 93.1 (236.8) (275.3)
Pre-tax income (loss) 102.4 414.5 36.6 145.9 (102.8) (608.3) 2,196.6 3.4 2,188.3 (111.3) 153.5 (207.3) – 2,023.2
Income taxes (408.3)
Net earnings 1,614.9
Attributable to:
Shareholders of Fairfax 1,740.6
Non-controlling interests (125.7)
1,614.9
(1) Allied World is included in the company’s financial reporting with effect from July 6, 2017.
(2) Total underwriting expenses for the year ended December 31, 2017 are comprised as shown below. Accident year total underwriting expenses exclude the impact of favourable or unfavourable prior year claimsreserve development.
Insurance and Reinsurance
Crum & Zenith Allied Fairfax OperatingNorthbridge OdysseyRe Forster National Brit World Asia Other companies
Loss & LAE – accident year 760.1 1,827.7 1,209.8 477.9 1,117.8 1,293.1 263.1 563.8 7,513.3Commissions 164.5 492.5 292.4 83.5 424.8 32.6 4.7 148.4 1,643.4Premium acquisition costs and other underwriting
expenses 179.6 241.3 357.6 209.4 205.7 217.7 73.9 192.6 1,677.8
Total underwriting expenses – accident year 1,104.2 2,561.5 1,859.8 770.8 1,748.3 1,543.4 341.7 904.8 10,834.5Unfavourable (favourable) claims reserve development (93.5) (288.1) (10.2) (76.4) (9.5) 71.9 (52.3) (33.6) (491.7)
Total underwriting expenses – calendar year 1,010.7 2,273.4 1,849.6 694.4 1,738.8 1,615.3 289.4 871.2 10,342.8
113

FAIRFAX FINANCIAL HOLDINGS LIMITED
2016
Insurance and ReinsuranceCorporate Eliminations
Crum & Zenith Fairfax Operating and and
Northbridge OdysseyRe Forster National Brit Asia Other companies Run-off Other Other adjustments Consolidated
Gross premiums written
External 1,052.3 2,355.8 2,011.8 831.7 1,904.3 636.1 558.4 9,350.4 183.9 – – – 9,534.3
Intercompany 2.8 24.9 43.2 – 7.9 12.6 84.9 176.3 – – – (176.3) –
1,055.1 2,380.7 2,055.0 831.7 1,912.2 648.7 643.3 9,526.7 183.9 – – (176.3) 9,534.3
Net premiums written 942.6 2,100.2 1,801.1 819.4 1,480.2 303.1 458.4 7,905.0 183.4 – – – 8,088.4
Net premiums earned
External 915.8 2,083.9 1,738.6 809.3 1,396.5 348.5 406.1 7,698.7 163.5 – – – 7,862.2
Intercompany (7.0) (9.8) 30.9 (2.0) 2.8 (46.0) 31.1 – – – – – –
908.8 2,074.1 1,769.5 807.3 1,399.3 302.5 437.2 7,698.7 163.5 – – – 7,862.2
Underwriting expenses(1) (862.5) (1,838.9) (1,737.1) (643.2) (1,370.2) (261.4) (409.5) (7,122.8) (348.6) – – – (7,471.4)
Underwriting profit (loss) 46.3 235.2 32.4 164.1 29.1 41.1 27.7 575.9 (185.1) – – – 390.8
Interest income 56.6 158.5 72.8 33.0 66.5 26.6 32.2 446.2 58.6 21.3 (11.7) – 514.4
Dividends 8.4 23.9 5.8 4.3 2.6 3.4 2.7 51.1 5.9 8.2 1.6 – 66.8
Investment expenses (12.8) (28.7) (12.8) (7.7) (13.7) (3.3) (8.3) (87.3) (13.3) (12.8) (1.4) 88.8 (26.0)
Interest and dividends 52.2 153.7 65.8 29.6 55.4 26.7 26.6 410.0 51.2 16.7 (11.5) 88.8 555.2
Share of profit (loss) ofassociates 5.2 17.3 (22.6) 1.2 3.4 48.1 0.7 53.3 (15.5) 13.6 (27.2) – 24.2
Other
Revenue – – – – – – – – – 2,061.6 – – 2,061.6
Expenses – – – – – – – – – (1,958.4) – – (1,958.4)
– – – – – – – – – 103.2 – – 103.2
Operating income (loss) 103.7 406.2 75.6 194.9 87.9 115.9 55.0 1,039.2 (149.4) 133.5 (38.7) 88.8 1,073.4
Net gains (losses) oninvestments(3) (161.3) (318.7) (184.7) (168.2) 87.3 (1.7) (90.0) (837.3) (225.2) 30.1 (171.2) – (1,203.6)
Interest expense – (2.8) (1.6) (3.3) (14.2) – (4.2) (26.1) – (28.3) (188.4) – (242.8)
Corporate overhead (6.6) (30.2) (20.4) (8.4) (9.2) (0.1) – (74.9) – – (17.6) (88.8) (181.3)
Pre-tax income (loss) (64.2) 54.5 (131.1) 15.0 151.8 114.1 (39.2) 100.9 (374.6) 135.3 (415.9) – (554.3)
Income taxes 159.6
Net loss (394.7)
Attributable to:
Shareholders of Fairfax (512.5)
Non-controllinginterests 117.8
(394.7)
(1) Total underwriting expenses for the year ended December 31, 2016 are comprised as shown below. Accident year total underwriting expenses exclude the impact of favourable or unfavourableprior year claims reserve development.
Insurance and Reinsurance
Crum & Zenith Fairfax OperatingNorthbridge OdysseyRe Forster National Brit(1) Asia Other companies
Loss & LAE – accident year 651.1 1,438.4 1,136.1 459.3 909.7 252.5 290.1 5,137.2Commissions 150.6 431.4 283.2 81.9 292.3 (6.5) 101.8 1,334.7Premium acquisition costs and other underwriting
expenses 173.6 235.6 326.1 203.0 221.7 67.5 78.0 1,305.5
Total underwriting expenses – accident year 975.3 2,105.4 1,745.4 744.2 1,423.7 313.5 469.9 7,777.4Favourable claims reserve development (112.8) (266.5) (8.3) (101.0) (53.5) (52.1) (60.4) (654.6)
Total underwriting expenses – calendar year 862.5 1,838.9 1,737.1 643.2 1,370.2 261.4 409.5 7,122.8
114

Investments in Associates, Additions to Goodwill, Segment Assets and Segment Liabilities
Investments in associates, additions to goodwill, segment assets and segment liabilities by reporting segment as atand for the years ended December 31 were as follows:
Investments in Additions toassociates goodwill Segment assets Segment liabilities
2017 2016 2017 2016 2017 2016 2017 2016
Insurance and ReinsuranceNorthbridge 218.6 206.9 1.1 – 4,527.2 4,149.9 2,804.6 2,630.2OdysseyRe 355.7 373.5 – – 11,316.1 10,334.8 7,248.4 6,370.5Crum & Forster 263.2 153.5 – 7.8 6,290.6 6,294.1 4,651.1 4,625.7Zenith National 162.9 146.9 – – 2,586.8 2,590.7 1,653.8 1,633.1Brit 231.4 217.8 – – 7,480.1 6,579.5 5,930.1 4,915.7Allied World(1) 210.5 – 937.9 – 14,584.4 – 10,937.2 –Fairfax Asia 100.9 487.3 (24.2) 69.5 1,930.7 2,684.7 674.5 1,457.7Other 92.0 127.4 19.6 11.5 4,321.3 2,656.2 3,223.5 1,850.1
Operating companies 1,635.2 1,713.3 934.4 88.8 53,037.2 35,289.9 37,123.2 23,483.0Run-off 252.0 308.2 – – 5,207.2 5,709.5 3,456.5 3,970.4Other 1,250.8 255.3 277.9 127.2 8,684.0 4,740.2 3,245.8 2,029.8Corporate and Other and eliminations and
adjustments 518.3 356.7 – – (2,838.3) (2,355.2) 1,852.6 2,081.1
Consolidated 3,656.3 2,633.5 1,212.3 216.0 64,090.1 43,384.4 45,678.1 31,564.3
(1) Allied World is included in the company’s financial reporting with effect from July 6, 2017.
Product Line
Net premiums earned by product line for the years ended December 31 was as follows:
Property Casualty Specialty Total
2017 2016 2017 2016 2017 2016 2017 2016
Net premiums earned – Insurance andReinsurance
Northbridge 449.1 395.6 474.4 423.8 96.2 89.4 1,019.7 908.8OdysseyRe 1,206.0 1,159.9 901.5 714.5 225.9 199.7 2,333.4 2,074.1Crum & Forster 238.9 237.0 1,518.0 1,426.6 95.9 105.9 1,852.8 1,769.5Zenith National 32.1 29.3 779.5 778.0 – – 811.6 807.3Brit 427.1 402.7 755.7 664.3 354.1 332.3 1,536.9 1,399.3Allied World(1) 360.9 – 607.4 – 60.4 – 1,028.7 –Fairfax Asia 65.6 57.4 219.2 191.2 42.8 53.9 327.6 302.5Other 405.9 191.9 221.9 146.1 162.8 99.2 790.6 437.2
Operating companies 3,185.6 2,473.8 5,477.6 4,344.5 1,038.1 880.4 9,701.3 7,698.7Run-off – 0.4 22.9 162.6 (2.8) 0.5 20.1 163.5
Consolidated net premiums earned 3,185.6 2,474.2 5,500.5 4,507.1 1,035.3 880.9 9,721.4 7,862.2Interest and dividends 559.0 555.2Share of profit of associates 200.5 24.2Net gains (losses) on investments 1,467.5 (1,203.6)Gain on sale of subsidiary 1,018.6 –Other 3,257.6 2,061.6
Consolidated revenue 16,224.6 9,299.6
Allocation of net premiums earned 32.8% 31.5% 56.6% 57.3% 10.6% 11.2%
(1) Allied World is included in the company’s financial reporting with effect from July 6, 2017.
115

FAIRFAX FINANCIAL HOLDINGS LIMITED
Geographic Region
Net premiums earned by geographic region for the years ended December 31 was as follows:
Canada United States Asia(1) International(2) Total
2017 2016 2017 2016 2017 2016 2017 2016 2017 2016
Net premiums earned – Insurance andReinsurance
Northbridge 1,007.2 899.5 12.5 9.3 – – – – 1,019.7 908.8OdysseyRe 76.8 72.5 1,539.2 1,319.3 247.2 231.4 470.2 450.9 2,333.4 2,074.1Crum & Forster – – 1,852.6 1,769.3 – – 0.2 0.2 1,852.8 1,769.5Zenith National – – 811.6 807.3 – – – – 811.6 807.3Brit 83.1 77.1 1,036.5 942.1 60.3 54.0 357.0 326.1 1,536.9 1,399.3Allied World(3) 20.5 – 773.7 – 88.2 – 146.3 – 1,028.7 –Fairfax Asia 0.1 0.1 – 0.3 319.0 293.2 8.5 8.9 327.6 302.5Other 9.1 3.9 98.9 142.6 108.0 105.7 574.6 185.0 790.6 437.2
Operating companies 1,196.8 1,053.1 6,125.0 4,990.2 822.7 684.3 1,556.8 971.1 9,701.3 7,698.7Run-off – – 23.7 162.6 – – (3.6) 0.9 20.1 163.5
Consolidated net premiums earned 1,196.8 1,053.1 6,148.7 5,152.8 822.7 684.3 1,553.2 972.0 9,721.4 7,862.2Interest and dividends 559.0 555.2Share of profit of associates 200.5 24.2Net gains (losses) on investments 1,467.5 (1,203.6)Gain on sale of subsidiary 1,018.6 –Other 3,257.6 2,061.6
Consolidated revenue 16,224.6 9,299.6
Allocation of net premiums earned 12.3% 13.4% 63.2% 65.5% 8.5% 8.7% 16.0% 12.4%
(1) The Asia geographic segment comprises countries located throughout Asia, including China, India, Sri Lanka, Malaysia, Singapore,Indonesia and Thailand, and the Middle East.
(2) The International geographic segment comprises Australia and countries located in Africa, Europe and South America.
(3) Allied World is included in the company’s financial reporting with effect from July 6, 2017.
116

26. Expenses
Losses on claims, net, operating expenses and other expenses for the years ended December 31 were comprisedas follows:
2017 2016
Insurance and Insurance andreinsurance Non-insurance reinsurance Non-insurancecompanies(1) companies(2) Total companies(1) companies(2) Total
Losses and loss adjustment expenses 6,880.0 – 6,880.0 4,478.3 – 4,478.3Other reporting segment cost of sales – 1,821.4 1,821.4 – 1,095.2 1,095.2Wages and salaries 1,072.0 495.2 1,567.2 876.6 351.8 1,228.4Employee benefits 242.1 76.9 319.0 213.1 63.8 276.9Depreciation, amortization and
impairment charges 136.5 144.0 280.5 98.4 93.3 191.7Operating lease costs 79.3 136.9 216.2 60.6 95.1 155.7Audit, legal and tax professional fees 155.7 27.2 182.9 116.2 17.4 133.6Premium taxes 152.7 – 152.7 101.4 – 101.4Information technology costs 122.2 16.2 138.4 99.8 6.7 106.5Other reporting segment marketing
costs – 65.4 65.4 – 43.9 43.9Share-based payments to directors and
employees 58.4 5.4 63.8 48.1 5.5 53.6Restructuring costs 30.6 3.1 33.7 2.9 0.3 3.2Loss on repurchase of long term debt
(note 15)(2) – 28.6 28.6 – – –Administrative expense and other 266.9 204.3 471.2 220.9 185.4 406.3
9,196.4 3,024.6 12,221.0 6,316.3 1,958.4 8,274.7
(1) Total expense of the insurance and reinsurance companies is comprised of losses on claims, net and operating expenses as presented in the consolidatedstatement of earnings.
(2) Other expenses as presented in the consolidated statement of earnings is comprised of cost of sales and operating expenses of the non-insurance companies,and loss on repurchase of long term debt of the holding company.
117

FAIRFAX FINANCIAL HOLDINGS LIMITED
27. Supplementary Cash Flow Information
Cash and cash equivalents as presented in the consolidated balance sheets and the consolidated statements of cashflows were comprised as follows:
December 31, December 31,2017 2016
Holding company cash and investments:Cash and balances with banks 129.1 131.9Treasury bills and other eligible bills 866.3 401.3
995.4 533.2
Subsidiary cash and short term investments:Cash and balances with banks 2,355.5 1,668.2Treasury bills and other eligible bills 5,028.6 2,275.2
7,384.1 3,943.4
Subsidiary assets pledged for short sale and derivative obligations:Treasury bills and other eligible bills 16.8 –
Fairfax India:Cash and balances with banks 44.0 44.5Treasury bills and other eligible bills – 128.7
44.0 173.2
Fairfax Africa:Cash and balances with banks 329.7 –
Cash and cash equivalents as presented in the consolidated balancesheet 8,770.0 4,649.8
Less: Cash and cash equivalents – restricted(1)
Holding company cash and cash equivalents – restricted:Cash and balances with banks 1.7 2.8
Subsidiary cash and cash equivalents – restricted:Cash and balances with banks 546.8 180.8Treasury bills and other eligible bills 286.5 247.1
835.0 430.7
Cash and cash equivalents as presented in the consolidatedstatement of cash flows 7,935.0 4,219.1
(1) Cash, cash equivalents and bank overdrafts as presented in the consolidated statements of cash flows excludes balancesthat are restricted. Restricted cash and cash equivalents are comprised primarily of amounts required to be maintained ondeposit with various regulatory authorities to support the operations of the insurance and reinsurance subsidiaries.
118

Details of certain cash flows included in the consolidated statements of cash flows for the years ended December 31were as follows:
2017 2016
(a) Net sales of securities classified as FVTPLShort term investments (2,816.5) (2,688.0)Bonds 5,677.1 4,514.5Preferred stocks (249.6) (42.4)Common stocks 778.3 170.4Derivatives, short sales and other invested assets (710.9) (835.2)
2,678.4 1,119.3
(b) Changes in operating assets and liabilitiesNet increase in restricted cash and cash equivalents (245.4) (55.1)Provision for losses and loss adjustment expenses 1,842.1 (355.7)Provision for unearned premiums 395.2 326.2Insurance contract receivables (428.4) (296.6)Recoverable from reinsurers (1,168.5) (34.6)Other receivables (32.4) (36.5)Funds withheld payable to reinsurers 182.0 87.9Accounts payable and accrued liabilities 174.0 110.6Income taxes payable 46.5 (54.1)Other (209.7) (300.0)
555.4 (607.9)
(c) Net interest and dividends receivedInterest and dividends received 531.9 782.4Interest paid (277.9) (216.2)
254.0 566.2
(d) Net income taxes paid (33.4) (267.1)
28. Related Party Transactions
Compensation for the company’s key management team for the years ended December 31 determined in accordancewith the company’s IFRS accounting policies was as follows:
2017 2016
Salaries and other short-term employee benefits 9.7 8.2Share-based payments 3.1 2.5
12.8 10.7
Compensation for the company’s Board of Directors for the years ended December 31 was as follows:
2017 2016
Retainers and fees 0.8 0.8Share-based payments 0.3 0.1
1.1 0.9
During 2017 the company entered into an investment management contract on normal commercial terms pursuantto which effectively Benjamin Watsa, a member of the company’s Board of Directors and the son of Prem Watsa, thecompany’s Chairman and CEO and effectively controlling shareholder, would manage up to $50.0 for operatingcompanies within the Fairfax group.
119

FAIRFAX FINANCIAL HOLDINGS LIMITED
Subsequent to December 31, 2017
Pursuant to the company’s investment advisory agreement with Fairfax India, a performance fee of $114.4 in theform of newly issued Fairfax India subordinate voting shares was received on March 9, 2018. See note 23.
29. Subsidiaries
During 2017 the company acquired controlling interests in Allied World, Grivalia Properties, Mosaic Capital,Saurashtra Freight and Fairchem (through Fairfax India), and sold First Capital. The foregoing transactions aredescribed in note 23. The company has wholly-owned subsidiaries not presented in the tables below that areintermediate holding companies of investments in subsidiaries and intercompany balances, all of which areeliminated on consolidation.
Fairfax’s ownership(100% other than
December 31, 2017 Domicile as shown below)
Insurance and ReinsuranceNorthbridge Financial Corporation (Northbridge) CanadaOdyssey Re Holdings Corp. (OdysseyRe) United States
Hudson Insurance Company (Hudson Insurance) United StatesCrum & Forster Holdings Corp. (Crum & Forster) United StatesZenith National Insurance Corp. (Zenith National) United StatesBrit Limited (Brit) United Kingdom 72.5%Allied World Assurance Company Holdings, GmbH (Allied World) Switzerland 67.4%Advent Capital (Holdings) Ltd. (Advent) United KingdomFairfax Central and Eastern Europe, which consists of:
Polskie Towarzystwo Reasekuracji Spolka Akcyjna (Polish Re) PolandColonnade Insurance S.A. (Colonnade Insurance) Luxembourg
Fairfax Latin America, which consists of:Fairfax Brasil Seguros Corporativos S.A. (Fairfax Brasil) BrazilSBS Seguros Colombia S.A. (SouthBridge Colombia) ColombiaSouthbridge Companıa de Seguros Generales S.A. (SouthBridge
Chile) ChileLa Meridional Companıa Argentina de Seguros S.A. (La Meridional
Argentina) ArgentinaBryte Insurance Company Limited (Bryte Insurance) South AfricaGroup Re, which underwrites business in:
CRC Reinsurance Limited (CRC Re) BarbadosWentworth Insurance Company Ltd. (Wentworth) Barbados
Fairfax Asia, which consists of:Falcon Insurance Company (Hong Kong) Limited (Falcon) Hong KongThe Pacific Insurance Berhad (Pacific Insurance) Malaysia 85.0%PT Asuransi Multi Artha Guna TBK (AMAG) Indonesia 80.0%Fairfirst Insurance Limited (Fairfirst Insurance) Sri Lanka 78.0%
Run-offTIG Insurance Company (TIG Insurance) United StatesRiverStone Insurance (UK) Limited (RiverStone (UK)) United KingdomRiverStone Insurance Limited (RiverStone Insurance) United KingdomRiverStone Managing Agency Limited United Kingdom
120

Fairfax’sDecember 31, 2017 Domicile ownership Primary business
Other reporting segmentHamblin Watsa Investment Counsel Ltd. Canada 100.0% Investment management
(Hamblin Watsa)Fairfax Africa Holdings Corporation (Fairfax Canada 64.2%(1) Invests in public and private
Africa) African businessesGrivalia Properties Real Estate Investment Greece 52.7% Real Estate investment company
Company S.A. (Grivalia Properties)Mosaic Capital Corporation (Mosaic Capital) Canada —(2) Invests in private Canadian
businessesPethealth Inc. (Pethealth) Canada 100.0% Pet medical insurance and
database servicesBoat Rocker Media Inc. (Boat Rocker) Canada 58.2% Development, production,
marketing and distribution oftelevision programs
Restaurants and RetailCara Operations Limited (Cara) which owns: Canada 40.2%(1) Franchisor, owner and operator
of restaurants100.0% of Groupe St-Hubert Inc. (St-Hubert) Canada 40.2% Full-service restaurant operator
and a fully integrated foodmanufacturer
89.2% of Original Joe’s Franchise Group Inc. Canada 35.9% Multi-brand restaurant owner(Original Joe’s) and operator
100.0% of Pickle Barrel Restaurants Inc. (Pickle Canada 40.2% Owner and operator ofBarrel) restaurants and catering
business
Keg Restaurants Ltd. (The Keg) Canada 51.0% Owner and operator of premiumdining restaurants
Praktiker Hellas Commercial Societe Anonyme Greece 100.0% Retailer of home improvement(Praktiker) goods
Sporting Life Inc. (Sporting Life) Canada 75.0% Retailer of sporting goods andsports apparel
William Ashley China Corporation (William Canada 100.0% Retailer of tableware and giftsAshley)
Golf Town Limited (Golf Town) Canada 60.0%(3) Retailer of golf equipment,consumables, athletic appareland accessories
India focusedFairfax India Holdings Limited (Fairfax India) Canada 30.2%(1) Invests in public and private
which owns: Indian businesses89.5% of National Collateral Management India 27.0% Provider of agricultural
Services Limited (NCML) commodities storage48.7% of Fairchem Specialty Limited (Fairchem) India 14.7% Manufacturer, supplier and
exporter of aroma chemicals51.0% of Saurashtra Freight Private Limited India 15.4% Container freight station
(Saurashtra Freight) operator
Thomas Cook (India) Limited (Thomas Cook India 67.6% Provider of integrated travel andIndia) which owns: travel-related financial services49.0% of Quess Corp Limited (Quess) India 33.1% Provider of staffing and facilities
management services100.0% of Sterling Holiday Resorts Limited India 67.6% Owner and operator of holiday
(Sterling Resorts) resorts
(1) The company holds multiple voting shares that give it voting rights of 56.7% in Cara, 98.8% in Fairfax Africa and 93.6%in Fairfax India.
(2) The company holds Mosaic Capital warrants representing a potential voting interest of approximately 62%.
(3) The company holds 100% of the voting rights in Golf Town.
121

FAIRFAX FINANCIAL HOLDINGS LIMITED
Index to Management’s Discussion and Analysis of Financial Condition and Results of Operations
Notes to Management’s Discussion and Analysis of Financial Condition and Results of Operations . . . . . . 123Overview of Consolidated Performance . . . . . . . . . . . . . . . . . . . . . . . . . . . . . . . . . . . . . . . . . . . . . . . 124Business Developments
Acquisitions and Divestitures . . . . . . . . . . . . . . . . . . . . . . . . . . . . . . . . . . . . . . . . . . . . . . . . . . . 125Operating Environment . . . . . . . . . . . . . . . . . . . . . . . . . . . . . . . . . . . . . . . . . . . . . . . . . . . . . . . 127
Sources of Revenue . . . . . . . . . . . . . . . . . . . . . . . . . . . . . . . . . . . . . . . . . . . . . . . . . . . . . . . . . . . . . 128Net Premiums Earned by Geographic Region . . . . . . . . . . . . . . . . . . . . . . . . . . . . . . . . . . . . . . . . . . . 131Sources of Net Earnings . . . . . . . . . . . . . . . . . . . . . . . . . . . . . . . . . . . . . . . . . . . . . . . . . . . . . . . . . . 133Net Earnings by Reporting Segment . . . . . . . . . . . . . . . . . . . . . . . . . . . . . . . . . . . . . . . . . . . . . . . . . 136Balance Sheets by Reporting Segment . . . . . . . . . . . . . . . . . . . . . . . . . . . . . . . . . . . . . . . . . . . . . . . . 137Components of Net Earnings
Underwriting and Operating Income . . . . . . . . . . . . . . . . . . . . . . . . . . . . . . . . . . . . . . . . . . . . . . 139Interest and Dividends . . . . . . . . . . . . . . . . . . . . . . . . . . . . . . . . . . . . . . . . . . . . . . . . . . . . . . . 157Net Gains (Losses) on Investments . . . . . . . . . . . . . . . . . . . . . . . . . . . . . . . . . . . . . . . . . . . . . . . 157Interest Expense . . . . . . . . . . . . . . . . . . . . . . . . . . . . . . . . . . . . . . . . . . . . . . . . . . . . . . . . . . . . 157Corporate Overhead and Other . . . . . . . . . . . . . . . . . . . . . . . . . . . . . . . . . . . . . . . . . . . . . . . . . 157Income Taxes . . . . . . . . . . . . . . . . . . . . . . . . . . . . . . . . . . . . . . . . . . . . . . . . . . . . . . . . . . . . . . 158Non-controlling Interests . . . . . . . . . . . . . . . . . . . . . . . . . . . . . . . . . . . . . . . . . . . . . . . . . . . . . . 158
Components of Consolidated Balance SheetsConsolidated Balance Sheet Summary . . . . . . . . . . . . . . . . . . . . . . . . . . . . . . . . . . . . . . . . . . . . . 159Provision for Losses and Loss Adjustment Expenses . . . . . . . . . . . . . . . . . . . . . . . . . . . . . . . . . . . . 161Asbestos, Pollution and Other Hazards . . . . . . . . . . . . . . . . . . . . . . . . . . . . . . . . . . . . . . . . . . . . 163Recoverable from Reinsurers . . . . . . . . . . . . . . . . . . . . . . . . . . . . . . . . . . . . . . . . . . . . . . . . . . . . 165
InvestmentsHamblin Watsa Investment Counsel Ltd. . . . . . . . . . . . . . . . . . . . . . . . . . . . . . . . . . . . . . . . . . . . 168Overview of Investment Performance . . . . . . . . . . . . . . . . . . . . . . . . . . . . . . . . . . . . . . . . . . . . . 169Interest and Dividends . . . . . . . . . . . . . . . . . . . . . . . . . . . . . . . . . . . . . . . . . . . . . . . . . . . . . . . 169Share of Profit of Associates . . . . . . . . . . . . . . . . . . . . . . . . . . . . . . . . . . . . . . . . . . . . . . . . . . . . 170Net Gains (Losses) on Investments . . . . . . . . . . . . . . . . . . . . . . . . . . . . . . . . . . . . . . . . . . . . . . . 171Total Return on the Investment Portfolio . . . . . . . . . . . . . . . . . . . . . . . . . . . . . . . . . . . . . . . . . . . 173Bonds . . . . . . . . . . . . . . . . . . . . . . . . . . . . . . . . . . . . . . . . . . . . . . . . . . . . . . . . . . . . . . . . . . . 175Common Stocks . . . . . . . . . . . . . . . . . . . . . . . . . . . . . . . . . . . . . . . . . . . . . . . . . . . . . . . . . . . . 175Derivatives and Derivative Counterparties . . . . . . . . . . . . . . . . . . . . . . . . . . . . . . . . . . . . . . . . . . 176Float . . . . . . . . . . . . . . . . . . . . . . . . . . . . . . . . . . . . . . . . . . . . . . . . . . . . . . . . . . . . . . . . . . . . 177
Financial ConditionCapital Resources and Management . . . . . . . . . . . . . . . . . . . . . . . . . . . . . . . . . . . . . . . . . . . . . . 178Book Value per Share . . . . . . . . . . . . . . . . . . . . . . . . . . . . . . . . . . . . . . . . . . . . . . . . . . . . . . . . 181Liquidity . . . . . . . . . . . . . . . . . . . . . . . . . . . . . . . . . . . . . . . . . . . . . . . . . . . . . . . . . . . . . . . . . 183Contractual Obligations . . . . . . . . . . . . . . . . . . . . . . . . . . . . . . . . . . . . . . . . . . . . . . . . . . . . . . . 185Contingencies and Commitments . . . . . . . . . . . . . . . . . . . . . . . . . . . . . . . . . . . . . . . . . . . . . . . . 186
Accounting and Disclosure MattersManagement’s Evaluation of Disclosure Controls and Procedures . . . . . . . . . . . . . . . . . . . . . . . . . . 186Management’s Report on Internal Control Over Financial Reporting . . . . . . . . . . . . . . . . . . . . . . . . 186Critical Accounting Estimates and Judgments . . . . . . . . . . . . . . . . . . . . . . . . . . . . . . . . . . . . . . . . 187Significant Accounting Policy Changes . . . . . . . . . . . . . . . . . . . . . . . . . . . . . . . . . . . . . . . . . . . . 187Future Accounting Changes . . . . . . . . . . . . . . . . . . . . . . . . . . . . . . . . . . . . . . . . . . . . . . . . . . . . 187
Risk ManagementOverview . . . . . . . . . . . . . . . . . . . . . . . . . . . . . . . . . . . . . . . . . . . . . . . . . . . . . . . . . . . . . . . . . 189Issues and Risks . . . . . . . . . . . . . . . . . . . . . . . . . . . . . . . . . . . . . . . . . . . . . . . . . . . . . . . . . . . . 189
OtherQuarterly Data (unaudited) . . . . . . . . . . . . . . . . . . . . . . . . . . . . . . . . . . . . . . . . . . . . . . . . . . . . 199Stock Prices and Share Information . . . . . . . . . . . . . . . . . . . . . . . . . . . . . . . . . . . . . . . . . . . . . . . 200Compliance with Corporate Governance Rules . . . . . . . . . . . . . . . . . . . . . . . . . . . . . . . . . . . . . . . 200Forward-Looking Statements . . . . . . . . . . . . . . . . . . . . . . . . . . . . . . . . . . . . . . . . . . . . . . . . . . . 200
122

Management’s Discussion and Analysis of Financial Condition and Results of Operations(as of March 9, 2018)
(Figures and amounts are in US$ and $ millions except per share amounts and as otherwise indicated. Figures may not add dueto rounding.)
Notes to Management’s Discussion and Analysis of Financial Condition and Results of Operations
(1) Readers of the Management’s Discussion and Analysis of Financial Condition and Results of Operations(‘‘MD&A’’) should review the entire Annual Report for additional commentary and information. Additionalinformation relating to the company, including its annual information form, can be found on SEDAR atwww.sedar.com. Additional information can also be accessed from the company’s website www.fairfax.ca.
(2) Management analyzes and assesses the underlying insurance, reinsurance and run-off operations and thefinancial position of the consolidated group in various ways. Certain of the measures and ratios provided inthis Annual Report, which have been used historically and disclosed regularly in Fairfax’s Annual Reportsand interim financial reporting, do not have a prescribed meaning under IFRS and may not be comparableto similar measures presented by other companies.
(3) The company presents information on gross premiums written and net premiums written throughout thisMD&A. These two measures are used in the insurance industry and by management in evaluating operatingresults. Gross premiums written represents the total premiums on policies issued during a specified period,irrespective of the portion earned, and is an indicator of the volume of new business generated by thecompany. Net premiums written represents gross premiums written less amounts ceded to reinsurers and isconsidered a measure of the insurance risk that the company has chosen to retain from the new business ithas generated.
(4) The combined ratio is the traditional performance measure of underwriting results of property and casualtycompanies and is calculated by the company as the sum of the loss ratio (claims losses and loss adjustmentexpenses expressed as a percentage of net premiums earned) and the expense ratio (commissions, premiumacquisition costs and other underwriting expenses expressed as a percentage of net premiums earned).Other ratios used by the company include the commission expense ratio (commissions expressed as apercentage of net premiums earned) and the accident year combined ratio (calculated in the same manneras the combined ratio but excluding the net favourable or adverse development of reserves established forclaims that occurred in previous accident years). These ratios are calculated from information disclosed innote 25 (Segmented Information) to the consolidated financial statements for the year ended December 31,2017 and are used by management for comparisons to historical underwriting results and to theunderwriting results of competitors and the broader property and casualty industry.
(5) The company’s long equity total return swaps allow the company to receive the total return on a notionalamount of an equity index or individual equity instrument (including dividends and capital gains or losses)in exchange for the payment of a floating rate of interest on the notional amount. Conversely, short equitytotal return swaps allow the company to pay the total return on a notional amount of an equity index orindividual equity instrument in exchange for the receipt of a floating rate of interest on the notionalamount. Throughout this MD&A, the term ‘‘total return swap expense’’ refers to the net dividends andinterest paid or received related to the company’s long and short equity and equity index total return swaps.The company’s consolidated interest and dividend income is shown net of total return swap expense.
(6) The measures ‘‘pre-tax income before net gains (losses) on investments’’, ‘‘net realized gains (losses) oninvestments’’, and ‘‘net change in unrealized gains (losses) on investments’’ are each shown separately inthis MD&A to present more meaningfully the results of the company’s investment management strategies.The two measures ‘‘net realized gains (losses) on investments’’, and ‘‘net change in unrealized gains (losses)on investments’’ are derived from the details of net gains (losses) on investments as presented in note 5(Cash and Investments) to the consolidated financial statements for the year ended December 31, 2017, andtheir sum is equal to ‘‘net gains (losses) on investments’’ as presented in the consolidated statementof earnings.
(7) In this MD&A the term ‘‘equity hedges’’ refers to equity and equity-related short positions held in thecompany’s investment portfolio as part of the company’s economic hedging strategy that was discontinued
123

FAIRFAX FINANCIAL HOLDINGS LIMITED
in the fourth quarter of 2016; the term ‘‘short equity exposures’’ refers to equity and equity-related shortpositions held for investment purposes since discontinuing the economic hedging strategy.
(8) Ratios included in the Capital Resources and Management section of this MD&A include: net debt dividedby total equity, net debt divided by net total capital and total debt divided by total capital. Thoseperformance measures are used by the company to assess the amount of leverage employed in its operations.The company also calculates an interest coverage ratio and an interest and preferred share dividenddistribution coverage ratio as measures of its ability to service its debt and pay dividends to its preferredshareholders. These ratios are calculated using amounts presented in the company’s consolidated financialstatements for the year ended December 31, 2017 and are explained in detail in note 24 (Financial RiskManagement, under the heading of Capital Management).
(9) Average annual return on average equity is a performance measure calculated for a reporting segment as thecumulative net earnings for a specified period of time expressed as a percentage of average equity over thesame period, using net earnings and equity amounts from segment operating results and segment balancesheets respectively.
(10) Book value per basic share (also referred to as book value per share) is a performance measure calculated bythe company as common shareholders’ equity divided by the number of common shares outstanding.
(11) Intercompany shareholdings of insurance and reinsurance affiliates are presented as ‘‘Investments in Fairfaxinsurance and reinsurance affiliates’’ and intercompany shareholdings of non-insurance affiliates arepresented within ‘‘Portfolio investments’’ on the segmented balance sheets and carried at cost. Totalintercompany shareholdings are presented as ‘‘Investments in Fairfax affiliates’’ within the ‘‘Capital’’section of the segmented balance sheets.
(12) References in this MD&A to the company’s insurance and reinsurance operations do not include its run-offoperations.
Overview of Consolidated Performance
The insurance and reinsurance operations produced an underwriting loss of $641.5 and a combined ratio of 106.6%in 2017 compared to an underwriting profit of $575.9 and a combined ratio of 92.5% in 2016. The underwriting lossin 2017 principally reflected the impact of higher current period catastrophe losses, lower net favourable prior yearreserve development and an increase in non-catastrophe loss experience related to the current accident year. Theinsurance and reinsurance operations reported an operating loss (excluding net gains (losses) on investments) of$215.7 in 2017 compared to operating income of $1,039.2 in 2016 primarily as a result of the underwriting lossincurred in 2017, and lower share of profit of associates. Net premiums written by the insurance and reinsuranceoperations increased by 26.2% in 2017, principally reflecting the acquisition of Allied World on July 6, 2017,increased business volumes at OdysseyRe, and the consolidation of full year results for acquisitions made in 2016(primarily Bryte Insurance, AMAG and Fairfirst Insurance).
Net investment gains of $1,467.5 in 2017 (compared to net investment losses of $1,203.6 in 2016) were principallydue to the gain on the company’s reduction of its equity accounted interest in ICICI Lombard, and net gains on netequity exposure, partially offset by net losses on CPI-linked derivatives and U.S. treasury bond forward contracts thatreduce exposure to interest rate risk. Interest and dividends increased to $559.0 in 2017 from $555.2 in 2016,primarily reflecting lower total return swap expense, the consolidation of Allied World’s interest and dividends of($65.9) and increased interest income earned on cash equivalents and short term investments, partially offset bylower interest income earned as a result of sales of U.S. treasury and municipal bonds late in 2016 and in the firstquarter of 2017. At December 31, 2017 subsidiary cash and short term investments of $17,545.0 (excluding FairfaxIndia and Fairfax Africa) accounted for 47.5% of portfolio investments.
Net earnings of $1,740.6 in 2017 (compared to a net loss of $512.5 in 2016) primarily reflected net investment gains(compared to net investment losses in 2016), a gain on the sale of the company’s 97.7% interest in First Capital, andan increase in share of profit of associates, partially offset by underwriting losses due to current period catastrophelosses and an increased provision for income taxes primarily due to the impact of U.S. tax reform. The company’sconsolidated total debt to total capital ratio decreased to 25.8% at December 31, 2017 from 28.7% at December 31,2016 primarily as a result of increased total capital, partially offset by increased total debt. The increase in totalcapital primarily reflected increases in common shareholders’ equity (principally from the issuance of5,075,894 subordinate voting shares pursuant to the acquisition of Allied World), non-controlling interests
124
(principally from consolidating Allied World, Grivalia Properties and Fairfax Africa) and total debt (principally fromconsolidating the borrowings of Allied World, Grivalia Properties and Fairfax Africa, and increased borrowings byFairfax India). Common shareholders’ equity increased to $12,475.6 ($449.55 per basic share) at December 31, 2017from $8,484.6 ($367.40 per basic share) at December 31, 2016 (an increase of 24.7%, adjusted for the $10.00 percommon share dividend paid in the first quarter of 2017).
Maintaining its emphasis on financial soundness, the company held $2,368.4 of cash and investments at theholding company level ($2,356.9 net of $11.5 of holding company short sale and derivative obligations) atDecember 31, 2017 compared to $1,371.6 ($1,329.4 net of $42.2 of holding company short sale and derivativeobligations) at December 31, 2016.
Business Developments
Acquisitions and Divestitures
The following narrative sets out the company’s key business developments in 2017 and 2016 by reporting segment.Unless indicated otherwise, all completed acquisitions described in the following paragraphs resulted in a 100%ownership interest in the acquiree. For further details about these acquisitions and transactions (includingdefinitions of terms set out in italics), refer to note 23 (Acquisitions and Divestitures) to the consolidated financialstatements for the year ended December 31, 2017 or the Components of Net Earnings section of this MD&A underthe relevant reporting segment heading.
Crum & Forster
On October 4, 2016 Crum & Forster acquired Trinity, which focuses on occupational accident insurance andproduces approximately $26 of gross premiums written annually.
Allied World
On July 6, 2017 the company acquired 94.6% of Allied World AG. Contemporaneously with the closing of theacquisition of Allied World AG, OMERS, AIMCo and certain other third parties (‘‘the co-investors’’) invested fundsfor an indirect equity interest in Allied World AG. The remaining 5.4% of Allied World AG was acquired onAugust 17, 2017 in a merger transaction under Swiss law pursuant to which Allied World became the surviving entity.This merger resulted in the co-investors holding an indirect ownership in Allied World of 32.6%. Allied World is aglobal property, casualty and specialty insurer and reinsurer with gross written premiums of approximately$3.1 billion in 2017 (inclusive of gross written premiums prior to the acquisition by Fairfax).
Fairfax Asia
On December 28, 2017 the company completed the sale of its 97.7% interest in First Capital to Mitsui Sumitomo.
On August 30, 2017 Pacific Insurance acquired Prudential Assurance Malaysia, a general insurer in Malaysia.
On July 6, 2017 the company sold a 12.2% equity interest in ICICI Lombard to private equity investors. OnSeptember 19, 2017 the company sold an additional 12.1% equity interest through participation in ICICI Lombard’sinitial public offering. The company’s remaining 9.9% equity interest in ICICI Lombard was reclassified from theequity method of accounting to common stock at FVTPL (fair value of $549.0 at December 31, 2017). On March 31,2016 the company increased its ownership interest in ICICI Lombard to 34.6% by acquiring an additional 9.0% ofICICI Lombard from ICICI Bank.
On October 10, 2016 the company acquired an 80.0% interest in AMAG, an established general insurer in Indonesia.On December 31, 2016 Fairfax Indonesia was merged into AMAG.
On October 3, 2016 Union Assurance acquired Fairfirst Insurance, a general insurer in Sri Lanka. On February 28, 2017Union Assurance was merged into Fairfirst Insurance.
Insurance and Reinsurance – Other
During 2017 the company completed the acquisition of the business and renewal rights of the insurance operationsof AIG in Hungary, Czech Republic and Slovakia (effective from April 30, 2017), Turkey (on May 2, 2017 and sold toGulf Insurance on the same day), Bulgaria (effective from May 31, 2017), Poland (effective from June 30, 2017) and
125

FAIRFAX FINANCIAL HOLDINGS LIMITED
Romania (effective October 31, 2017). Further, the company completed the acquisition of the insurance operationsof AIG in Chile and Colombia (effective from July 31, 2017), Argentina (effective from September 30, 2017) andUruguay (effective January 31, 2018).
On December 7, 2016 the company acquired Bryte Insurance, a property and casualty insurer in South Africa andBotswana.
Other
Subsequent to December 31, 2017
On March 9, 2018 the company received a performance fee of $114.4 for the period January 30, 2015 toDecember 31, 2017 in the form of 7,663,685 newly issued Fairfax India subordinate voting shares, which increasedthe company’s equity interest in Fairfax India to 33.6% from 30.2% at December 31, 2017.
On March 7, 2018 the company acquired the services business of Carillion, an infrastructure services company.
On February 22, 2018 the company sold its 51.0% ownership interest in The Keg to Cara for consideration of $74.6(Cdn$94.7), comprised of cash consideration of $7.9 (Cdn$10.0) and 3,400,000 Cara subordinate voting shares. Thetransaction increased the company’s equity interest in Cara to 43.2% from 40.2% at December 31, 2017.
On February 20, 2018 Fairfax India entered into an agreement to acquire a 51.0% equity interest in The CatholicSyrian Bank Ltd. (‘‘CS Bank’’) for approximately $186 (12.1 billion Indian rupees). CS Bank, headquartered inThrissur, Kerala, offers banking services across India.
Years ended December 31, 2017 and 2016
On December 27, 2017 Quess acquired the facility management and catering business of Manipal primarily throughissuance of Quess common shares to Manipal shareholders and the reinvestment of Quess’ existing holdings ofManipal preferred shares upon cancellation of those shares. In November of 2017 Thomas Cook India sold a 5.4%interest in Quess. On August 18, 2017 Quess completed a private placement of common shares with institutionalinvestors. These transactions collectively reduced the company’s indirect ownership of Quess from 42.1% to 33.1%.
On December 1, 2017 Cara acquired Pickle Barrel, which operates restaurants and provides catering services in theprovince of Ontario, Canada.
On July 4, 2017 the company acquired control of Grivalia Properties by increasing its equity interest to 52.6% throughthe purchase of an additional 10.3% equity interest from Eurobank Ergasias S.A. Accordingly, the companyre-measured its equity accounted carrying value of Grivalia Properties to fair value and commenced consolidatingGrivalia Properties.
On March 14, 2017 Fairchem and Privi Organics completed their previously announced merger, with the mergedentity continuing under the Fairchem name. Subsequent to the merger, Fairfax India, which had acquired a 44.7%interest in Fairchem on February 8, 2016 and a 50.8% interest in Privi Organics on August 26, 2016, became thedominant shareholder in Fairchem with a 48.7% interest. Privi Organics is a supplier of aroma chemicals to thefragrances industry and Fairchem is a specialty chemical manufacturer of oleochemicals used in the paints, inks andadhesives industries, as well as intermediate nutraceutical and health products.
On February 17, 2017 the company acquired 98.8% of the voting rights and 64.2% of the equity interest in FairfaxAfrica, which was established, with the support of Fairfax, to invest in public and private equity and debt instrumentsof African businesses or other businesses with customers, suppliers or business primarily conducted in, or dependenton, Africa.
On February 14, 2017 Fairfax India acquired a 51.0% interest in Saurashtra Freight, which operates a container freightstation at the Mundra Port in the Indian state of Gujarat.
On January 26, 2017 the company invested in securities of Mosaic Capital through purchases of 6.00% seniorpreferred securities, 5.00% senior secured debentures and warrants entitling the company to acquire up to17,026,106 common shares of Mosaic Capital at any time until January 26, 2024. The company’s investment inMosaic Capital warrants represents a potential voting interest of approximately 62%.
On January 13, 2017 the company acquired an additional 12,340,500 subordinate voting shares of Fairfax India for$145.0 in a private placement.
126

On November 28, 2016 Cara acquired an 89.2% interest in Original Joe’s, a Canadian multi-brand restaurantcompany. On September 2, 2016 Cara acquired St-Hubert, a Canadian full-service restaurant operator and fullyintegrated food manufacturer.
On October 31, 2016 the company acquired a 60.0% indirect interest in Golf Town, a Canadian specialty retailer ofgolf equipment, consumables, golf apparel and accessories.
Operating Environment
Insurance Environment
The property and casualty insurance and reinsurance industry is expected to report a moderate underwriting loss in2017 driven by an active Atlantic hurricane season and wildfire activity on the U.S. west coast. This marks the firstyear of deteriorating underwriting results relative to the past several years, reflecting the above average catastrophelosses and the expectation that the benefit from prior year reserve releases may diminish somewhat, combined withthe challenging market conditions that persist across many lines of business. The industry continues to feel theeffects of low interest rates that negatively affect operating income, although investments results have been bolsteredby strong equity markets throughout 2017. Despite interest rates having increased recently, the interest rates thatcurrently prevail for reinvestment are still lower than those on maturing fixed income securities, with the gapnarrowing as the 10-year anniversary of the financial crisis approaches. Strong performance in the equity markets,partially offset by the impact of underwriting losses, is expected to contribute to low single digit growth in capital forthe industry. Insurance pricing on property and casualty lines of business shows signs of firming as catastrophe losseshave focused attention on pricing across all segments, some of which were being subsidized by property lines ofbusiness that were benefiting from lower than average catastrophe losses in recent years.
The reinsurance sector remains well capitalized despite the significant catastrophe losses in 2017. Pricing on manyreinsurance lines remains attractive: property catastrophe-exposed business has experienced significant rateincreases for loss affected lines of business with non-loss affected lines of business experiencing low single digit priceincreases and non-catastrophe property and casualty reinsurance business experiencing flat or nominal priceincreases after several years of price decreases.
127

FAIRFAX FINANCIAL HOLDINGS LIMITED
Sources of Revenue
Revenue for the most recent three years is shown in the table that follows.
2017 2016 2015
Net premiums earned – Insurance and ReinsuranceNorthbridge 1,019.7 908.8 874.7OdysseyRe 2,333.4 2,074.1 2,204.1Crum & Forster 1,852.8 1,769.5 1,522.0Zenith National 811.6 807.3 766.4Brit 1,536.9 1,399.3 892.5Allied World(1) 1,028.7 – –Fairfax Asia 327.6 302.5 287.0Other 790.6 437.2 442.7
Run-off 20.1 163.5 381.6
9,721.4 7,862.2 7,371.0Interest and dividends 559.0 555.2 512.2Share of profit of associates 200.5 24.2 172.9Net gains (losses) on investments 1,467.5 (1,203.6) (259.2)Gain on sale of subsidiary 1,018.6 – –Other revenue(2) 3,257.6 2,061.6 1,783.5
16,224.6 9,299.6 9,580.4
(1) Allied World is included in the company’s financial reporting with effect from July 6, 2017.
(2) Other revenue comprises the revenue earned by the Other reporting segment, which primarily comprises the revenue earnedby William Ashley, Sporting Life, Praktiker, The Keg, Thomas Cook India and its subsidiaries Quess and Sterling Resorts,Pethealth, Cara and its subsidiaries St-Hubert (acquired on September 2, 2016), Original Joe’s (acquired on November 28,2016) and Pickle Barrel (acquired on December 1, 2017), Boat Rocker, Golf Town (acquired on October 31, 2016), MosaicCapital (consolidated on January 26, 2017), Grivalia Properties (consolidated on July 4, 2017), Fairfax Africa (since itsinitial public offering on February 17, 2017), and Fairfax India and its subsidiaries NCML, Fairchem (merged onMarch 14, 2017 with Privi Organics (acquired on August 26, 2016)) and Saurashtra Freight (acquired onFebruary 14, 2017).
The increase in revenue to $16,224.6 in 2017 from $9,299.6 in 2016 principally reflected increased net gains oninvestments, a gain of $1,018.6 on the sale of the company’s 97.7% interest in First Capital, higher net premiumsearned (including the consolidation of the net premiums earned of Allied World of $1,028.7), higher other revenueand increased share of profit of associates. The increase in net gains on investments principally reflected the net gainof $930.1 related to the reduction in the company’s shareholding in ICICI Lombard in 2017, higher net gains oncommon stocks and lower net losses on short equity exposures and equity hedges, partially offset by higher net losseson U.S. treasury bond forward contracts. Interest and dividends increased modestly to $559.0 in 2017 from $555.2 in2016, primarily reflecting lower total return swap expense, the consolidation of the interest and dividends of AlliedWorld ($65.9) and increased interest income earned on cash equivalents and short term investments, partially offsetby lower interest income earned as a result of sales of U.S. treasury and municipal bonds late in 2016 and in the firstquarter of 2017. Share of profit of associates of $200.5 in 2017 increased from $24.2 in 2016, primarily due to anincrease at Eurolife in 2017 and a non-cash impairment charge of $100.4 recognized on Resolute in 2016.
The increase in net premiums earned by the company’s insurance and reinsurance operations in 2017 reflected theconsolidation of the net premiums earned by Allied World ($1,028.7), increases at Insurance and Reinsurance –Other ($353.4, 80.8% inclusive of the consolidation of the $241.1, $68.5 and $23.7 of net premiums earned by BryteInsurance, Fairfax Latam and Colonnade Insurance related to the AIG branches in Central and Eastern Europerespectively), OdysseyRe ($259.3, 12.5%), Brit ($137.6, 9.8%), Northbridge ($110.9, 12.2% including the favourableeffect of foreign currency translation), Crum & Forster ($83.3, 4.7%), Fairfax Asia ($25.1, 8.3% including theconsolidation of year-over-year increases of $34.4 and $8.6 of net premiums earned by AMAG and FairfirstInsurance) and Zenith National ($4.3, 0.5%). Net premiums earned at Run-off in 2016 principally reflected the
128

impacts of the second quarter 2016 construction defect reinsurance transaction and the habitational casualtyreinsurance transaction.
The decrease in revenue to $9,299.6 in 2016 from $9,580.4 in 2015 principally reflected increased net losses oninvestments and lower share of profit of associates, partially offset by higher net premiums earned, increased otherrevenue and higher interest and dividends. The increase in net losses on investments principally reflected net losseson equity and equity-related holdings after equity hedges (primarily realized losses) and CPI-linked derivatives,partially offset by net gains on bonds. Interest and dividends increased to $555.2 in 2016 from $512.2 in 2015reflecting higher interest earned (primarily due to increased holdings of higher yielding government and corporatebonds for most of 2016, partially offset by lower holdings of U.S. state and municipal bonds), lower total return swapexpense and lower interest on funds withheld expense. Share of profit of associates decreased to $24.2 in 2016 from$172.9 in 2015 primarily reflecting a non-cash impairment charge of $100.4 recognized on Resolute and lower shareof profit from the KWF LPs (a Kennedy Wilson real estate partnership recognized a significant gain on disposition ofits investment properties in 2015), partially offset by a higher share of profit of ICICI Lombard.
The increase in net premiums earned by the company’s insurance and reinsurance operations in 2016 compared to2015 reflected the consolidation of a full year of net premiums earned by Brit ($506.8 incremental increaseyear-over-year), increases at Crum & Forster ($247.5, 16.3%), Zenith National ($40.9, 5.3%), Northbridge ($34.1,3.9% including the unfavourable effect of foreign currency translation) and Fairfax Asia ($15.5, 5.4%), partially offsetby decreases at OdysseyRe ($130.0, 5.9%) and Insurance and Reinsurance – Other ($5.5, 1.2%). The decrease in netpremiums earned at Run-off in 2016 principally reflected the impact of two significant reinsurance transactions in2016 compared to the completion of four significant reinsurance transactions in 2015.
In order to better compare 2017 to 2016, the table which follows presents net premiums written by the company’sinsurance and reinsurance operations excluding the impact of the acquisition of Allied World (acquired July 6, 2017)and other smaller acquisitions as described in the footnotes.
% changeyear-over-
2017 2016 year
Net premiums writtenNorthbridge 1,064.9 942.6 13.0OdysseyRe 2,495.9 2,100.2 18.8Crum & Forster 1,863.4 1,801.1 3.5Zenith National 837.4 819.4 2.2Brit 1,530.9 1,480.2 3.4Fairfax Asia(1) 272.2 290.1 (6.2)Other(2) 480.7 458.4 4.9
Insurance and reinsurance operations 8,545.4 7,892.0 8.3
(1) Excludes AMAG (acquired October 10, 2016) and Fairfirst Insurance (acquired October 3, 2016).
(2) Excludes Bryte Insurance (acquired December 7, 2016), Fairfax Latam (Chile and Colombia (effective from July 31, 2017)and Argentina (effective from September 30, 2017)) and the AIG branches in Central and Eastern Europe (Hungary, CzechRepublic and Slovakia (effective from April 30, 2017), Bulgaria (effective from May 31, 2017), Poland (effective fromJune 30, 2017) and Romania (effective from October 31, 2017).
Northbridge’s net premiums written increased by 13.0% in 2017 including the favourable effect of foreign currencytranslation. In Canadian dollar terms, Northbridge’s net premiums written increased by 10.7% in 2017, primarilyreflecting increased renewal and new business writings, and price increases across the group.
OdysseyRe’s net premiums written increased by 18.8% in 2017, principally reflecting increases in the U.S. Insurancedivision (automobile, crop and liability package lines of business), North America division (property and casualtyreinsurance lines of business), EuroAsia division (crop, commercial automobile and credit and bond reinsurancelines of business) and the London Market division (affinity and liability insurance lines of business).
129

FAIRFAX FINANCIAL HOLDINGS LIMITED
Crum & Forster’s net premiums written increased by 3.5% in 2017, principally reflecting growth in the accident andhealth and commercial transportation lines of business, partially offset by decreases in excess and surplus and marinelines of business.
Zenith National’s net premiums written increased by 2.2% in 2017, primarily reflecting increased exposure, partiallyoffset by price decreases.
Brit’s net premiums written increased by 3.4% in 2017, principally reflecting better than expected development on2016 and prior underwriting years, inwards reinstatement premiums following the current period catastrophe losses,increased contribution from initiatives launched in recent years and measured growth in core lines of business,partially offset by modest price decreases and reductions in other lines of business through active portfoliomanagement, the unfavourable impact of foreign currency translation and the impact of additional reinsurancepurchased.
Net premiums written by Fairfax Asia decreased by 6.2% in 2017, principally reflecting lower writings in thecommercial automobile, property and marine lines of business and the impact of lower premium retention(primarily at First Capital).
Net premiums written by the Insurance and Reinsurance – Other reporting segment increased by 4.9% in 2017,principally reflecting increases at Fairfax CEE (primarily at Colonnade Insurance), Advent and Fairfax Brasil, partiallyoffset by decreases at Group Re.
Net gains (losses) on investments in 2017 and 2016 were comprised as shown in the following table:
2017 2016
Common stocks 707.8 (78.0)Preferred stocks – convertible (1.6) (6.6)Bonds – convertible 233.1 (39.4)Gain on disposition of associates(1) 69.8 –Other equity derivatives(2) 57.9 19.3
Long equity exposures 1,067.0 (104.7)Short equity exposures and equity hedges (417.9) (1,192.9)
Net equity exposure and financial effects 649.1 (1,297.6)Bonds 44.9 322.7CPI-linked derivatives (71.0) (196.2)U.S. treasury bond forwards (153.2) 47.0Other derivatives (0.3) (7.4)Foreign currency 2.8 (129.5)Gain on disposition of insurance and reinsurance associates(3) 930.1 –Other 65.1 57.4
Net gains (losses) on investments 1,467.5 (1,203.6)
Net gains (losses) on bonds is comprised as follows:Government bonds 24.2 256.8U.S. states and municipalities 67.3 (29.5)Corporate and other (46.6) 95.4
44.9 322.7
(1) During 2017 the company acquired control of Grivalia Properties by increasing its equity interest to 52.7% andcommenced consolidating Grivalia Properties in the Other reporting segment. As a result, the company re-measured itsequity accounted carrying value of Grivalia Properties to fair value and recorded a net realized gain of $51.3. Refer tonote 6 (Investments in Associates) to the consolidated financial statements for the year ended December 31, 2017.
(2) Other equity derivatives include long equity total return swaps, equity warrants and equity index call options.
(3) During 2017 the company sold a 24.3% equity interest in ICICI Lombard for net proceeds of $908.5 and recorded a netrealized gain of $595.6. The company’s remaining 9.9% equity interest in ICICI Lombard was reclassified to commonstock measured at FVTPL and re-measured to fair value for a net realized gain of $334.5. Refer to note 6 (Investments inAssociates) to the consolidated financial statements for the year ended December 31, 2017.
130

The company discontinued its economic equity hedging strategy in the fourth quarter of 2016 after givingconsideration to the possible and actual outcome of the U.S. elections and the potential for fundamental changesthat could improve U.S. economic growth and equity markets. During 2016 the company closed out $6,350.6notional amount of short positions effected through equity index total return swaps (comprised of Russell 2000,S&P 500 and S&P/TSX 60 short equity index total return swaps) and recognized a net loss on investment of $955.2(realized loss of $2,665.4 of which $1,710.2 had been recognized as unrealized losses in prior years). The companycontinues to hold short equity and equity index total return swaps for investment purposes, but no longer regardsthem as hedges of its equity and equity-related holdings.
During 2017 the company closed out $1,202.9 notional amount of short equity total return swaps and recognized anet loss on investment of $237.9 (realized loss of $553.1 of which $315.2 was recognized as unrealized losses in prioryears). In the first quarter of 2018 the company closed out an additional $481.3 notional amount of short equity andequity index total return swaps and recognized a net loss on investment of $8.1 (realized loss of $199.0 of which$190.9 was recognized as unrealized losses in prior years), which reduced the notional amount of remaining shortequity and equity index total return swaps to approximately $509. Refer to note 24 (Financial Risk Management)under the heading Market Price Fluctuations in the company’s consolidated financial statements for the year endedDecember 31, 2017 for a tabular analysis followed by a discussion of the net effect of the company’s equity andequity-related holdings (long exposures net of short exposures) and to the tabular analysis in the Investments sectionof this MD&A for further details about the components of net gains (losses) on investments.
Net gains on bonds of $44.9 in 2017 were primarily comprised of net gains on U.S. treasury bonds ($52.8) andU.S. state and municipal bonds ($67.3), partially offset by losses on Indian government bonds ($40.5) and corporateand other bonds ($46.6).
The company’s CPI-linked derivative contracts produced net unrealized losses of $71.0 and $196.2 in 2017 and 2016respectively. Net unrealized losses on CPI-linked derivative contracts typically reflect the market’s expectation ofincreases in the values of the CPI indexes underlying those contracts at their respective maturities during the periodspresented (those contracts are structured to benefit the company during periods of decreasing CPI index values).
The increase in other revenue to $3,257.6 in 2017 from $2,061.6 in 2016 principally reflected increases at Cara(reflecting the inclusion of the full year revenue of St-Hubert and Original Joe’s, and the consolidation of Pickle Barrelon December 1, 2017), Thomas Cook India (reflecting increased business volumes at Quess), Fairfax India (reflectingthe consolidation of Fairchem on March 14, 2017, the inclusion of the full year revenue of Privi Organics andincreased business volumes at NCML), Golf Town (reflecting the inclusion of the full year revenue), and theconsolidation of Mosaic Capital (on January 26, 2017) and Grivalia Properties (on July 4, 2017).
Net Premiums Earned by Geographic Region
As presented in note 25 (Segmented Information) to the consolidated financial statements for the year endedDecember 31, 2017, the United States, Canada, International and Asia accounted for 63.2%, 12.3%, 16.0% and 8.5%respectively, of net premiums earned by geographic region in 2017, compared to 65.5%, 13.4%, 12.4% and 8.7%respectively, in 2016.
United States
Net premiums earned in the United States geographic region increased by 19.3% from $5,152.8 in 2016 to $6,148.7in 2017 primarily reflecting the consolidation of Allied World ($773.7 for the period July 6, 2017 to December 31,2017) and increases at OdysseyRe (growth in the property and casualty reinsurance segments and the commercialautomobile, casualty and crop insurance segments), Brit (organic growth and new initiatives) and Crum & Forster(growth in accident and health and commercial transportation lines of business), partially offset by lower netpremiums earned at Run-off reflecting non-recurring transactions in 2016 involving the reinsurance of third partyrunoff portfolios.
131

FAIRFAX FINANCIAL HOLDINGS LIMITED
Canada
Net premiums earned in the Canada geographic region increased by 13.6% from $1,053.1 in 2016 to $1,196.8 in2017 primarily reflecting increased net premiums earned at Northbridge (increased new business writings, modestprice increases across the group and the favourable effect of the strengthening of the Canadian dollar relative to theU.S. dollar as measured by average annual rates of exchange) and the consolidation of Allied World ($20.5 for theperiod July 6, 2017 to December 31, 2017).
International
Net premiums earned in the International geographic region increased by 59.8% from $972.0 in 2016 to $1,553.2 in2017 primarily reflecting the consolidation of Bryte Insurance ($241.1), Allied World ($146.3 for the period July 6,2017 to December 31, 2017), and Fairfax Latam ($68.5), the impact of the expansion at Colonnade Insurance andmodest increases in net premiums earned at Brit and OdysseyRe.
Asia
Net premiums earned in the Asia geographic region increased by 20.2% from $684.3 in 2016 to $822.7 in 2017primarily as a result of the consolidation of Allied World ($88.2 for the period July 6, 2017 to December 31, 2017),year-over-year increases at AMAG and Fairfirst Insurance and modest increases in net premiums earned at Britand OdysseyRe.
132

Sources of Net Earnings
The following table presents the combined ratios and underwriting and operating results for each of the insuranceand reinsurance operations and, as applicable, for run-off operations, as well as the earnings contributions from theOther reporting segment for the years ended December 31, 2017, 2016 and 2015. In that table, interest and dividendsand share of profit (loss) of associates are presented separately as they relate to the insurance and reinsurancereporting segments, and included in Run-off, Corporate overhead and other, and Other as they relate to thosesegments. Pre-tax income before net gains (losses) on investments, net realized gains (losses) on investments, pre-taxincome (loss) including net realized gains (losses) on investments, and net change in unrealized gains (losses) oninvestments are each shown separately to present more meaningfully the results of the company’s investmentmanagement strategies.
2017 2016 2015
Combined ratios – Insurance and ReinsuranceNorthbridge 99.1% 94.9% 91.8%OdysseyRe 97.4% 88.7% 84.7%Crum & Forster 99.8% 98.2% 97.7%Zenith National 85.6% 79.7% 82.5%Brit 113.1% 97.9% 94.9%Allied World(1) 157.0% –% –%Fairfax Asia 88.4% 86.4% 87.9%Other 110.2% 93.7% 89.6%
Consolidated 106.6% 92.5% 89.9%
Sources of net earningsUnderwriting – Insurance and Reinsurance
Northbridge 9.0 46.3 71.4OdysseyRe 60.0 235.2 336.9Crum & Forster 3.2 32.4 35.4Zenith National 117.2 164.1 134.4Brit (201.9) 29.1 45.4Allied World(1) (586.6) – –Fairfax Asia 38.2 41.1 34.8Other (80.6) 27.7 46.2
Underwriting profit (loss) – Insurance and Reinsurance (641.5) 575.9 704.5Interest and dividends – Insurance and Reinsurance 402.3 410.0 338.9Share of profit of associates – Insurance and Reinsurance 23.5 53.3 138.1
Operating income (loss) – Insurance and Reinsurance (215.7) 1,039.2 1,181.5Run-off (excluding net gains (losses) on investments) (184.6) (149.4) (74.1)Other reporting segment (excluding net gains (losses) on investments) 212.1 133.5 127.8Interest expense (331.2) (242.8) (219.0)Corporate overhead and other 56.5 (131.2) (132.5)Gain on sale of subsidiary 1,018.6 – –
Pre-tax income before net gains (losses) on investments 555.7 649.3 883.7Net realized gains (losses) on investments 723.4 (2,071.4) 1,176.4
Pre-tax income (loss) including net realized gains (losses) on investments 1,279.1 (1,422.1) 2,060.1Net change in unrealized gains (losses) on investments 744.1 867.8 (1,435.6)
Pre-tax income (loss) 2,023.2 (554.3) 624.5Income taxes (408.3) 159.6 17.5
Net earnings (loss) 1,614.9 (394.7) 642.0
Attributable to:Shareholders of Fairfax 1,740.6 (512.5) 567.7Non-controlling interests (125.7) 117.8 74.3
1,614.9 (394.7) 642.0
Net earnings (loss) per share $ 66.74 $ (24.18) $ 23.67Net earnings (loss) per diluted share $ 64.98 $ (24.18) $ 23.15Cash dividends paid per share $ 10.00 $ 10.00 $ 10.00
(1) Allied World is included in the company’s financial reporting with effect from July 6, 2017.
133

FAIRFAX FINANCIAL HOLDINGS LIMITED
The company’s insurance and reinsurance operations produced an underwriting loss of $641.5 (combined ratio of106.6%) in 2017 compared to an underwriting profit of $575.9 (combined ratio of 92.5%) in 2016. The increase inthe combined ratio in 2017 principally reflected the impact of higher current period catastrophe losses, lower netfavourable prior year reserve development and an increase in non-catastrophe loss experience related to the currentaccident year.
Net favourable prior year reserve development of $491.7 (5.1 combined ratio points) in 2017 decreased from $654.6(8.5 combined ratio points) in 2016 and was comprised as follows:
2017 2016
Insurance and ReinsuranceNorthbridge (93.5) (112.8)OdysseyRe (288.1) (266.5)Crum & Forster (10.2) (8.3)Zenith National (76.4) (101.0)Brit (9.5) (53.5)Allied World(1) 71.9 –Fairfax Asia (52.3) (52.1)Other (33.6) (60.4)
Net favourable development (491.7) (654.6)
(1) Allied World is included in the company’s financial reporting with effect from July 6, 2017.
Current period catastrophe losses of $1,330.4 (13.7 combined ratio points) in 2017 increased from $352.7(4.6 combined ratio points) in 2016 and were comprised as follows:
2017 2016
Catastrophe Combined Catastrophe Combinedlosses(1) ratio impact losses(1) ratio impact
Hurricane Irma 372.0 3.8 – –Hurricane Maria 281.7 2.9 – –Hurricane Harvey 252.4 2.6 – –California wildfires 185.4 1.9 – –Mexico earthquakes 24.1 0.2 – –Hurricane Matthew – – 67.9 0.9Fort McMurray wildfires – – 61.8 0.8Other 214.8 2.3 223.0 2.9
1,330.4 13.7 points 352.7 4.6 points
(1) Net of reinstatement premiums.
The following table presents the components of the company’s combined ratios for the years ended December 31:
2017 2016
Underwriting profit (loss) – Insurance and Reinsurance (641.5) 575.9
Loss & LAE – accident year 77.4% 66.7%Commissions 16.9% 17.3%Underwriting expense 17.4% 17.0%
Combined ratio – accident year 111.7% 101.0%Net favourable development (5.1)% (8.5)%
Combined ratio – calendar year 106.6% 92.5%
134

The commission expense ratio decreased to 16.9% in 2017 from 17.3% in 2016, primarily reflecting theconsolidation of Allied World (non-recurring acquisition accounting adjustments reduced net premiums earned andcommission expense in the period July 6, 2017 to December 31, 2017 and resulted in a commission expense ratiothat was generally lower than Fairfax’s other operating companies), partially offset by an increased commissionexpense ratio at Brit (primarily the impacts of non-recurring acquisition accounting adjustments which reduced netpremiums earned and commission expense in 2016, partially offset by changes in the mix of business written,reinsurance purchased and higher net premiums earned in 2017).
The underwriting expense ratio increased to 17.4% in 2017 from 17.0% in 2016, primarily reflecting theconsolidation of Allied World (Allied World’s underwriting expense ratio of 21.1% for the period July 6, 2017 toDecember 31, 2017 was generally higher than Fairfax’s other operating companies), partially offset by increased netpremiums earned relative to underwriting expenses at OdysseyRe and Northbridge.
Underwriting expenses increased by 4.8% in 2017 (excluding the combined underwriting expenses of $310.2 ofAllied World, Bryte Insurance and Fairfax Latam in 2017), primarily reflecting increases at Crum & Forster (primarilydue to increased compensation costs related to new underwriting initiatives), Colonnade Insurance (primarilyreflecting its start-up costs), Zenith National (primarily reflecting higher underwriting expenses attributable toongoing investment in personnel) and Fairfax Asia (primarily reflecting the year-over-year impact of theconsolidation of the underwriting expenses of AMAG and Fairfirst Insurance and increased compensation costs),partially offset by a decrease at Brit (primarily reflecting the favourable effect of foreign currency translation andincreased fee income earned from the management of third party underwriting capital)
Operating expenses in the consolidated statements of earnings include only the operating expenses of the company’sinsurance and reinsurance and run-off operations and corporate overhead. Operating expenses increased to $2,049.5in 2017 from $1,597.7 in 2016 primarily as a result of increased underwriting expenses of the insurance andreinsurance operations as described in the preceding paragraph and increased Fairfax and subsidiary holdingcompanies’ corporate overhead, partially offset by lower operating expenses at Run-off.
Other expenses increased to $3,024.6 in 2017 from $1,958.4 in 2016 primarily as a result of increases at Cara(reflecting the inclusion of the full year expenses of St-Hubert and Original Joe’s, and the consolidation of PickleBarrel on December 1, 2017), Thomas Cook India (reflecting increased business volumes at Quess), Fairfax India(reflecting the consolidation of Fairchem on March 14, 2017, the inclusion of the full year expenses of Privi Organicsand increased business volume at NCML) and Golf Town (reflecting the inclusion of the full year expenses), and theconsolidation of Mosaic Capital (on January 26, 2017) and Grivalia Properties (on July 4, 2017).
The company reported net earnings attributable to shareholders of Fairfax of $1,740.6 (net earnings of $66.74 perbasic share and$64.98 per diluted share) in 2017 compared to a net loss attributable to shareholders of Fairfax of$512.5 (net loss of $24.18 per basic and diluted share) in 2016. The year-over-year increase in profitability primarilyreflected increased net gains on investments and the gain on the sale of the company’s 97.7% interest in First Capital,partially offset by a decrease in underwriting profit and increased provision for income taxes.
Common shareholders’ equity increased from $8,484.6 at December 31, 2016 to $12,475.6 at December 31, 2017,primarily reflecting the issuance of 5,075,894 shares with a fair value of $2,191.6 pursuant to the acquisition of AlliedWorld, net earnings attributable to shareholders of Fairfax of $1,740.6 and other comprehensive income of $283.8(comprised of net unrealized foreign currency translation gains on foreign operations of $200.4 and the company’sshare of other comprehensive income of associates of $114.3, partially offset by net losses on defined benefit plans of$30.9), partially offset by dividends paid of $282.0 on the company’s common and preferred shares. Commonshareholders’ equity per basic share at December 31, 2017 was $449.55 compared to $367.40 per basic share atDecember 31, 2016, representing an increase of 22.4% (without adjustment for the $10.00 per common sharedividend paid in the first quarter of 2017, or an increase of 24.7% adjusted to include that dividend).
135

FAIRFAX FINANCIAL HOLDINGS LIMITED
Net Earnings by Reporting Segment
The company’s sources of net earnings (loss) shown by reporting segment are set out below for the years endedDecember 31, 2017 and 2016. The intercompany adjustment for gross premiums written eliminates premiums onreinsurance ceded within the group, primarily to OdysseyRe and Group Re.
Year ended December 31, 2017
Insurance and ReinsuranceEliminations
Crum & Zenith Allied Fairfax Operating Run- Corporate andNorthbridge OdysseyRe Forster National Brit World(1) Asia Other companies off Other and Other adjustments Consolidated
Gross premiums written 1,187.0 2,783.1 2,174.5 849.0 2,057.0 1,447.6 670.4 1,244.3 12,412.9 8.4 – – (213.8) 12,207.5
Net premiums written 1,064.9 2,495.9 1,863.4 837.4 1,530.9 991.9 327.5 863.3 9,975.2 8.3 – – – 9,983.5
Net premiums earned 1,019.7 2,333.4 1,852.8 811.6 1,536.9 1,028.7 327.6 790.6 9,701.3 20.1 – – – 9,721.4
Underwriting profit (loss) 9.0 60.0 3.2 117.2 (201.9) (586.6) 38.2 (80.6) (641.5) (207.4) – – – (848.9)
Interest and dividends 54.1 124.9 33.8 23.4 32.6 65.9 29.1 38.5 402.3 28.9 (104.9) (4.1) 236.8 559.0
Share of profit (loss) ofassociates 3.2 7.2 (1.1) (9.8) 9.2 (17.6) 29.4 3.0 23.5 (6.1) 55.4 127.7 – 200.5
Operating income (loss) 66.3 192.1 35.9 130.8 (160.1) (538.3) 96.7 (39.1) (215.7) (184.6) (49.5) 123.6 236.8 (89.4)
Net gains (losses) oninvestments 44.8 253.1 27.9 26.6 79.0 (26.5) 1,083.9 69.5 1,558.3 73.3 7.2 (171.3) – 1,467.5
Gain on sale of subsidiary – – – – – – 1,018.6 – 1,018.6 – – – – 1,018.6
Other reporting segment – – – – – – – – – – 261.6 – – 261.6
Interest expense – (3.3) (1.8) (3.3) (12.5) (15.6) – (4.8) (41.3) – (65.8) (224.1) – (331.2)
Corporate overhead andother (8.7) (27.4) (25.4) (8.2) (9.2) (27.9) (2.6) (22.2) (131.6) – – 64.5 (236.8) (303.9)
Pre-tax income (loss) 102.4 414.5 36.6 145.9 (102.8) (608.3) 2,196.6 3.4 2,188.3 (111.3) 153.5 (207.3) – 2,023.2
Income taxes (408.3)
Net earnings 1,614.9
Attributable to:
Shareholders of Fairfax 1,740.6
Non-controlling interests (125.7)
1,614.9
Year ended December 31, 2016Insurance and Reinsurance
Corporate EliminationsCrum & Zenith Allied Fairfax Operating Run- and and
Northbridge OdysseyRe Forster National Brit World(1) Asia Other companies off Other Other adjustments Consolidated
Gross premiums written 1,055.1 2,380.7 2,055.0 831.7 1,912.2 – 648.7 643.3 9,526.7 183.9 – – (176.3) 9,534.3
Net premiums written 942.6 2,100.2 1,801.1 819.4 1,480.2 – 303.1 458.4 7,905.0 183.4 – – – 8,088.4
Net premiums earned 908.8 2,074.1 1,769.5 807.3 1,399.3 – 302.5 437.2 7,698.7 163.5 – – – 7,862.2
Underwriting profit (loss) 46.3 235.2 32.4 164.1 29.1 – 41.1 27.7 575.9 (185.1) – – – 390.8
Interest and dividends 52.2 153.7 65.8 29.6 55.4 – 26.7 26.6 410.0 51.2 16.7 (11.5) 88.8 555.2
Share of profit (loss) ofassociates 5.2 17.3 (22.6) 1.2 3.4 – 48.1 0.7 53.3 (15.5) 13.6 (27.2) – 24.2
Operating income (loss) 103.7 406.2 75.6 194.9 87.9 – 115.9 55.0 1,039.2 (149.4) 30.3 (38.7) 88.8 970.2
Net gains (losses) oninvestments (161.3) (318.7) (184.7) (168.2) 87.3 – (1.7) (90.0) (837.3) (225.2) 30.1 (171.2) – (1,203.6)
Other reporting segment – – – – – – – – – – 103.2 – – 103.2
Interest expense – (2.8) (1.6) (3.3) (14.2) – – (4.2) (26.1) – (28.3) (188.4) – (242.8)
Corporate overhead and other (6.6) (30.2) (20.4) (8.4) (9.2) – (0.1) – (74.9) – – (17.6) (88.8) (181.3)
Pre-tax income (loss) (64.2) 54.5 (131.1) 15.0 151.8 – 114.1 (39.2) 100.9 (374.6) 135.3 (415.9) – (554.3)
Income taxes 159.6
Net loss (394.7)
Attributable to:
Shareholders of Fairfax (512.5)
Non-controlling interests 117.8
(394.7)
(1) Allied World is included in the company’s financial reporting with effect from July 6, 2017.
136

Balance Sheets by Reporting Segment
The company’s segmented balance sheets as at December 31, 2017 and 2016 present the assets and liabilities of, andthe capital invested by the company in, each of the company’s reporting segments. The segmented balance sheetshave been prepared on the following basis:
(a) The balance sheet for each reporting segment is on a legal entity basis for the subsidiaries within thatsegment, in accordance with Fairfax’s IFRS accounting policies and includes, where applicable, acquisitionaccounting adjustments principally related to goodwill and intangible assets which arose on initialacquisition of the subsidiaries or on a subsequent step acquisition.
(b) Certain of the company’s subsidiaries held ownership interests in other Fairfax subsidiaries (‘‘Fairfaxaffiliates’’) at December 31, 2017. These investments in Fairfax affiliates are carried at cost and are disclosedin the table below. Affiliated insurance and reinsurance balances, including premiums receivable (includedin insurance contracts receivable), deferred premium acquisition costs, recoverable from reinsurers, fundswithheld payable to reinsurers, provision for losses and loss adjustment expenses and provision forunearned premiums, are not shown separately but are eliminated in Corporate and Other.
(c) Corporate and Other includes the Fairfax holding company and its subsidiary intermediate holdingcompanies as well as the consolidating and eliminating entries required under IFRS to prepare consolidatedfinancial statements. The most significant of those entries are derived from the elimination ofintercompany reinsurance (primarily consisting of reinsurance provided by Group Re and reinsurancebetween OdysseyRe and the primary insurers), which affects recoverable from reinsurers, provision forlosses and loss adjustment expenses and unearned premiums. Corporate and Other borrowings of $3,445.1as at December 31, 2017 primarily consisted of Fairfax holding company debt of $3,475.1, partially offset bythe elimination of intercompany debt. Corporate and Other borrowings of $3,479.6 as at December 31,2016 primarily consisted of Fairfax holding company debt of $3,341.2 and purchase consideration payableof $129.2 (repaid in 2017) related to the TRG acquisition.
Economic ownership percentage in Fairfax affiliates
Insurance &Crum & Zenith Allied Fairfax Reinsurance – Run- Corporate &
Northbridge OdysseyRe Forster National Brit World Asia Other off Other Consolidated
Investments ininsurance andreinsuranceaffiliates(1)(2)
Zenith National – 6.1% 2.0% – – – – – – 91.9% 100.0%
Advent – 15.7% 12.7% – – – – – 13.8% 57.8% 100.0%
TRG (Run-off) – – 5.2% – – – – 31.5% 44.9% 18.4% 100.0%
Investments in non-insuranceaffiliates(3)
Thomas Cook India – 11.0% 1.5% 0.4% – 1.8% 0.6% 1.7% 4.9% 45.7% 67.6%
Fairfax India – 6.9% 3.5% 1.0% 4.1% 4.8% 1.0% 2.0% 5.4% 1.5% 30.2%
The Keg 11.0% 14.7% 7.3% 8.0% – – – 6.6% 3.4% – 51.0%
Cara 8.5% 10.5% 4.9% – 3.8% 5.7% – – 6.3% 0.5% 40.2%
Boat Rocker Media – 27.3% – 20.1% – – – 10.8% – – 58.2%
Fairfax Africa 1.7% 20.1% 4.8% 9.1% 9.9% 4.2% 0.6% 7.6% 1.5% 4.7% 64.2%
Grivalia Properties 3.9% 18.8% 5.1% 1.4% 1.7% 5.0% – 5.0% 9.2% 2.6% 52.7%
(1) This table excludes subsidiaries where the company’s equity interest is entirely held by the holding company including Northbridge, OdysseyRe, Crum & Forster, Brit, Allied World,Fairfax Asia, Fairfax Brasil, Fairfax Latam, Bryte Insurance and Polish Re.
(2) Investments in insurance and reinsurance affiliates are reported in Investment in Fairfax insurance and reinsurance affiliates on the segmented balance sheet.
(3) Investments in non-insurance affiliates are reported within Portfolio investments on the segmented balance sheet.
137

FAIRFAX FINANCIAL HOLDINGS LIMITED
Segmented Balance Sheet as at December 31, 2017
Insurance and Reinsurance
Crum & Zenith Allied Fairfax Operating Corporate
Northbridge OdysseyRe Forster National Brit World(1) Asia Other companies Run-off Other and Other Consolidated
AssetsHolding company cash
and investments 107.0 557.8 5.3 9.4 – – 549.0 – 1,228.5 – – 1,139.9 2,368.4
Insurance contractreceivables 327.4 995.9 315.4 260.7 774.0 1,336.7 97.8 621.6 4,729.5 73.8 – (116.4) 4,686.9
Portfolio investments(2) 3,008.1 7,979.8 4,024.2 1,716.0 4,245.1 8,162.9 632.9 2,145.7 31,914.7 3,710.0 3,176.8 (1,788.3) 37,013.2
Deferred premiumacquisition costs 116.4 223.4 126.0 12.2 207.1 146.6 16.8 94.4 942.9 – – (15.4) 927.5
Recoverable fromreinsurers 441.5 976.1 1,033.7 53.1 1,437.6 2,879.6 275.9 1,110.2 8,207.7 737.9 – (1,133.1) 7,812.5
Deferred income taxes 81.6 195.7 151.6 29.9 – – – 66.3 525.1 25.3 – (169.6) 380.8
Goodwill and intangibleassets 172.8 171.3 318.2 433.1 725.6 1,702.6 196.4 66.6 3,786.6 36.8 2,242.7 6.4 6,072.5
Due from affiliates 205.4 1.6 3.0 – – – 8.6 32.0 250.6 437.6 – (688.2) –
Other assets 67.0 82.6 243.0 72.4 90.7 356.0 153.3 149.4 1,214.4 79.7 3,264.5 269.7 4,828.3
Investments in Fairfaxinsurance andreinsurance affiliates – 131.9 70.2 – – – – 35.1 237.2 106.1 – (343.3) –
Total assets 4,527.2 11,316.1 6,290.6 2,586.8 7,480.1 14,584.4 1,930.7 4,321.3 53,037.2 5,207.2 8,684.0 (2,838.3) 64,090.1
LiabilitiesAccounts payable and accrued
liabilities 187.2 533.0 309.9 108.6 156.5 272.2 114.2 442.0 2,123.6 90.4 1,288.0 127.5 3,629.5
Income taxes payable 16.2 34.4 – – 7.4 1.7 1.9 5.2 66.8 – 12.8 16.0 95.6
Short sale and derivativeobligations 2.7 61.0 19.1 4.3 12.5 0.6 0.1 1.6 101.9 13.0 12.6 (1.3) 126.2
Due to affiliates 0.9 5.1 10.9 2.8 – 6.0 0.7 13.4 39.8 1.6 189.8 (231.2) –
Funds withheld payable toreinsurers 4.9 94.2 21.4 – 450.1 270.3 12.5 103.2 956.6 12.5 – (118.9) 850.2
Provision for losses and lossadjustment expenses 1,964.3 5,521.8 3,535.4 1,194.2 4,136.1 7,787.9 359.5 1,836.5 26,335.7 3,331.0 – (1,055.9) 28,610.8
Provision for unearnedpremiums 628.4 909.1 713.0 305.7 891.2 1,653.0 177.1 726.3 6,003.8 8.0 – (60.1) 5,951.7
Deferred income taxes – – – – 42.8 67.5 8.5 3.2 122.0 – 146.6 (268.6) –
Borrowings – 89.8 41.4 38.2 233.5 878.0 – 92.1 1,373.0 – 1,596.0 3,445.1 6,414.1
Total liabilities 2,804.6 7,248.4 4,651.1 1,653.8 5,930.1 10,937.2 674.5 3,223.5 37,123.2 3,456.5 3,245.8 1,852.6 45,678.1
EquityShareholders’ equity
attributable toshareholders of Fairfax 1,722.5 4,067.7 1,639.5 933.0 1,550.0 3,641.6 1,195.0 1,095.7 15,845.0 1,750.7 5,092.5 (8,877.1) 13,811.1
Non-controlling interests 0.1 – – – – 5.6 61.2 2.1 69.0 – 345.7 4,186.2 4,600.9
Total equity 1,722.6 4,067.7 1,639.5 933.0 1,550.0 3,647.2 1,256.2 1,097.8 15,914.0 1,750.7 5,438.2 (4,690.9) 18,412.0
Total liabilities and totalequity 4,527.2 11,316.1 6,290.6 2,586.8 7,480.1 14,584.4 1,930.7 4,321.3 53,037.2 5,207.2 8,684.0 (2,838.3) 64,090.1
CapitalBorrowings – 89.8 41.4 38.2 233.5 878.0 – 92.1 1,373.0 – 1,596.0 3,445.1 6,414.1
Investments in Fairfaxaffiliates 154.3 824.2 298.6 106.0 193.4 244.1 26.0 195.2 2,041.8 629.0 – (2,670.8) –
Shareholders’ equityattributable toshareholders of Fairfax 1,568.2 3,243.5 1,340.9 827.0 921.3 2,173.7 1,169.0 902.6 12,146.2 1,121.7 2,563.3 (2,020.1) 13,811.1
Non-controlling interests 0.1 – – – 435.3 1,229.4 61.2 – 1,726.0 – 2,874.9 – 4,600.9
Total capital 1,722.6 4,157.5 1,680.9 971.2 1,783.5 4,525.2 1,256.2 1,189.9 17,287.0 1,750.7 7,034.2 (1,245.8) 24,826.1
% of consolidated totalcapital 6.9% 16.7% 6.8% 3.9% 7.2% 18.2% 5.1% 4.8% 69.6% 7.1% 28.3% (5.0)% 100.0%
(1) Allied World is included in the company’s financial reporting with effect from July 6, 2017.
(2) Includes investments in non-insurance affiliates.
138

Segmented Balance Sheet as at December 31, 2016
Insurance and Reinsurance
Crum & Zenith Fairfax Operating Corporate
Northbridge OdysseyRe Forster National Brit Asia Other companies Run-off Other and Other Consolidated
AssetsHolding company cash and investments 125.9 508.6 7.2 10.3 – – – 652.0 – – 719.6 1,371.6
Insurance contract receivables 272.7 830.8 279.1 238.2 639.2 169.6 385.7 2,815.3 196.8 – (94.6) 2,917.5
Portfolio investments(1) 2,748.8 7,243.8 3,907.7 1,708.7 3,986.7 1,568.8 1,680.6 22,845.1 3,847.2 1,476.5 (875.4) 27,293.4
Deferred premium acquisition costs 96.4 182.5 122.0 10.9 192.7 30.6 72.0 707.1 – – (14.0) 693.1
Recoverable from reinsurers 463.3 774.8 1,104.1 68.0 923.7 634.3 346.3 4,314.5 835.8 – (1,140.0) 4,010.3
Deferred income taxes 65.9 300.5 257.3 55.0 – – 18.9 697.6 11.6 – 23.4 732.6
Goodwill and intangible assets 152.8 174.9 331.6 439.0 730.9 173.1 33.9 2,036.2 37.1 1,766.0 8.2 3,847.5
Due from affiliates 120.9 4.0 31.4 – 0.3 23.3 35.1 215.0 575.3 – (790.3) –
Other assets 103.2 182.9 183.5 60.6 106.0 85.0 51.0 772.2 99.6 1,497.7 148.9 2,518.4
Investments in Fairfax insurance andreinsurance affiliates – 132.0 70.2 – – – 32.7 234.9 106.1 – (341.0) –
Total assets 4,149.9 10,334.8 6,294.1 2,590.7 6,579.5 2,684.7 2,656.2 35,289.9 5,709.5 4,740.2 (2,355.2) 43,384.4
LiabilitiesAccounts payable and accrued liabilities 161.3 511.0 282.2 94.6 79.4 273.7 261.1 1,663.3 104.2 973.8 147.3 2,888.6
Income taxes payable 6.3 – – 1.5 – 13.0 0.2 21.0 – 2.2 12.2 35.4
Short sale and derivative obligations 40.9 79.5 37.2 3.1 11.8 – 5.0 177.5 41.9 – 14.9 234.3
Due to affiliates 0.9 9.2 0.6 3.0 – 5.5 2.2 21.4 1.0 48.3 (70.7) –
Funds withheld payable to reinsurers 3.3 61.6 18.2 – 302.3 51.8 66.0 503.2 13.3 – (100.3) 416.2
Provision for losses and loss adjustmentexpenses 1,875.0 4,896.9 3,562.3 1,212.5 3,406.7 800.0 1,019.1 16,772.5 3,790.1 – (1,080.8) 19,481.8
Provision for unearned premiums 542.5 722.5 683.8 280.2 836.8 308.9 403.1 3,777.8 19.9 – (57.3) 3,740.4
Deferred income taxes – – – – 102.8 4.8 3.2 110.8 – 153.0 (263.8) –
Borrowings – 89.8 41.4 38.2 175.9 – 90.2 435.5 – 852.5 3,479.6 4,767.6
Total liabilities 2,630.2 6,370.5 4,625.7 1,633.1 4,915.7 1,457.7 1,850.1 23,483.0 3,970.4 2,029.8 2,081.1 31,564.3
EquityShareholders’ equity attributable to
shareholders of Fairfax 1,519.7 3,964.3 1,668.4 957.6 1,663.8 1,166.9 806.1 11,746.8 1,739.1 2,622.9 (6,288.7) 9,820.1
Non-controlling interests – – – – – 60.1 – 60.1 – 87.5 1,852.4 2,000.0
Total equity 1,519.7 3,964.3 1,668.4 957.6 1,663.8 1,227.0 806.1 11,806.9 1,739.1 2,710.4 (4,436.3) 11,820.1
Total liabilities and total equity 4,149.9 10,334.8 6,294.1 2,590.7 6,579.5 2,684.7 2,656.2 35,289.9 5,709.5 4,740.2 (2,355.2) 43,384.4
CapitalBorrowings – 89.8 41.4 38.2 175.9 – 90.2 435.5 – 852.5 3,479.6 4,767.6
Investments in Fairfax affiliates 110.6 544.0 197.5 40.8 74.7 44.8 99.3 1,111.7 523.3 – (1,635.0) –
Shareholders’ equity attributable toshareholders of Fairfax 1,409.1 3,420.3 1,470.9 916.8 1,125.7 1,122.1 706.8 10,171.7 1,215.8 1,233.9 (2,801.3) 9,820.1
Non-controlling interests – – – – 463.4 60.1 – 523.5 – 1,476.5 – 2,000.0
Total capital 1,519.7 4,054.1 1,709.8 995.8 1,839.7 1,227.0 896.3 12,242.4 1,739.1 3,562.9 (956.7) 16,587.7
% of consolidated total capital 9.2% 24.4% 10.3% 6.0% 11.1% 7.4% 5.4% 73.8% 10.5% 21.5% (5.8)% 100.0%
(1) Includes investments in non-insurance affiliates.
Components of Net Earnings
Underwriting and Operating Income
Set out and discussed below are the underwriting and operating results of Fairfax’s insurance and reinsuranceoperations, Run-off and Other by reporting segment for the years ended December 31, 2017 and 2016.
139

FAIRFAX FINANCIAL HOLDINGS LIMITED
Northbridge(1)
Cdn$
2017 2016 2017 2016
Underwriting profit 11.6 61.3 9.0 46.3
Loss & LAE – accident year 74.5% 71.6% 74.5% 71.6%Commissions 16.1% 16.6% 16.1% 16.6%Underwriting expenses 17.7% 19.1% 17.7% 19.1%
Combined ratio – accident year 108.3% 107.3% 108.3% 107.3%Net favourable development (9.2)% (12.4)% (9.2)% (12.4)%
Combined ratio – calendar year 99.1% 94.9% 99.1% 94.9%
Gross premiums written 1,539.4 1,395.9 1,187.0 1,055.1
Net premiums written 1,381.0 1,247.0 1,064.9 942.6
Net premiums earned 1,322.4 1,202.3 1,019.7 908.8
Underwriting profit 11.6 61.3 9.0 46.3Interest and dividends 70.2 69.0 54.1 52.2Share of profit of associates 4.1 6.9 3.2 5.2
Operating income 85.9 137.2 66.3 103.7
(1) These results differ from those published by Northbridge primarily due to purchase accounting adjustments related to theprivatization of Northbridge in 2009.
The Canadian dollar strengthened relative to the U.S. dollar (measured using average foreign exchange rates) by 2.0%in 2017 compared to 2016. To avoid the distortion caused by foreign currency translation, the table above presentsNorthbridge’s underwriting and operating results in both U.S. dollars and Canadian dollars (Northbridge’sfunctional currency). The discussion which follows makes reference to those Canadian dollar figures unless indicatedotherwise.
Northbridge reported an underwriting profit of Cdn$11.6 ($9.0) and a combined ratio of 99.1% in 2017 compared toan underwriting profit of Cdn$61.3 ($46.3) and a combined ratio of 94.9% in 2016. The decrease in underwritingprofit in 2017 principally reflected an increase in non-catastrophe loss experience related to the current accident year(particularly in personal lines and commercial property lines of business) and lower net favourable prior year reservedevelopment, partially offset by the impact of higher net premiums earned and lower current period catastrophelosses.
Net favourable prior year reserve development in 2017 of Cdn$121.3 ($93.5) representing 9.2 combined ratio pointsprincipally reflected better than expected emergence on automobile and casualty lines of business related to accidentyears 2009 to 2014. Net favourable prior year reserve development in 2016 of Cdn$149.2 ($112.8) representing12.4 combined ratio points principally reflected better than expected emergence on automobile and casualty lines ofbusiness related to accident years 2008 through 2014.
Current period catastrophe losses in 2017 of Cdn$11.6 ($8.9) (0.9 of a combined ratio point, principally the impactof storms in central Canada) decreased from Cdn$38.0 ($28.7) in 2016 (3.2 combined ratio points, principally theimpact of the Fort McMurray wildfires). The decrease in Northbridge’s underwriting expense ratio to 17.7% in 2017from 19.1% in 2016 principally reflected the impact of higher net premiums earned, partially offset by higherunderwriting expenses.
The increase in gross premiums written of 10.3% from Cdn$1,395.9 in 2016 to Cdn$1,539.4 in 2017, primarilyreflected increased renewal and new business writings, and price increases across the group. Net premiums writtenincreased by 10.7% in 2017, consistent with the growth in gross premiums written. Net premiums earned increasedby 10.0% in 2017, reflecting the growth in net premiums written during 2016 and 2017.
Interest and dividends of Cdn$70.2 ($54.1) in 2017, while comparable to Cdn$69.0 ($52.2) in 2016, principallyreflected lower total return swap expense in 2017, partially offset by lower interest income earned (reflecting sales ofU.S. treasury and municipal bonds late in 2016 and in the first quarter of 2017).
140

Cash provided by operating activities (excluding operating cash flow activity related to securities recorded at FVTPL)increased to Cdn$113.6 ($87.6) in 2017 from Cdn$67.4 ($51.0) in 2016, primarily due to higher net premiumscollected and lower income taxes paid, partially offset by higher net claims paid.
Northbridge’s average annual return on average equity over the past 32 years since inception in 1985 was 12.9% atDecember 31, 2017 (December 31, 2016 – 13.1%) (expressed in Canadian dollars).
OdysseyRe(1)
2017 2016
Underwriting profit 60.0 235.2
Loss & LAE – accident year 78.3% 69.3%Commissions 21.1% 20.8%Underwriting expenses 10.3% 11.4%
Combined ratio – accident year 109.7% 101.5%Net favourable development (12.3)% (12.8)%
Combined ratio – calendar year 97.4% 88.7%
Gross premiums written 2,783.1 2,380.7
Net premiums written 2,495.9 2,100.2
Net premiums earned 2,333.4 2,074.1
Underwriting profit 60.0 235.2Interest and dividends 124.9 153.7Share of profit of associates 7.2 17.3
Operating income 192.1 406.2
(1) These results differ from those published by Odyssey Re Holdings Corp. primarily due to differences between IFRS andU.S. GAAP and purchase accounting adjustments (principally goodwill and intangible assets) recorded by Fairfax relatedto the privatization of OdysseyRe in 2009.
OdysseyRe reported an underwriting profit of $60.0 and a combined ratio of 97.4% in 2017 compared to anunderwriting profit of $235.2 and a combined ratio of 88.7% in 2016. The decrease in underwriting profit in 2017principally reflected increased current period catastrophe losses (as set out in the table below), partially offset bymodestly higher net favourable prior year reserve development and lower current year extraordinary losses.
2017 2016
Catastrophe Combined Catastrophe Combinedlosses(1) ratio impact losses(1) ratio impact
Hurricane Maria 103.0 4.4 – –Hurricane Irma 70.4 3.0 – –Hurricane Harvey 51.6 2.2 – –California wildfires 46.6 2.0 – –Mexico earthquakes 8.2 0.4 – –Hurricane Matthew – – 30.0 1.4Fort McMurray wildfires – – 14.1 0.7France floods – – 10.0 0.5Belgium floods – – 9.0 0.4Other 111.9 4.8 128.8 6.2
391.7 16.8 points 191.9 9.2 points
(1) Net of reinstatement premiums.
141

FAIRFAX FINANCIAL HOLDINGS LIMITED
Net favourable prior year reserve development increased to $288.1 (12.3 combined ratio points) in 2017 from $266.5(12.8 combined ratio points) in 2016, principally related to net favourable emergence on casualty and catastropheloss reserves respectively in each of those periods. Current year extraordinary losses decreased to $28.4 (1.2 combinedratio points) in 2017 from $61.9 (3.0 combined ratio points) in 2016. The decrease in OdysseyRe’s underwritingexpense ratio to 10.3% in 2017 from 11.4% in 2016 principally reflected the impact of increased net premiumsearned. The increase in OdysseyRe’s commission expense ratio to 21.1% in 2017 from 20.8% in 2016 principallyreflected changes in the mix of business and commission expense adjustments.
The increase in gross premiums written and net premiums written of 16.9% and 18.8% in 2017 principally reflectedincreases in the U.S. Insurance division (automobile, crop and liability package lines of business), North Americadivision (property and casualty reinsurance lines of business), EuroAsia division (crop, commercial automobile andcredit and bond reinsurance lines of business) and the London Market division (affinity and liability insurance linesof business). Net premiums earned in 2017 increased 12.5%, consistent with the growth in net premiums written.
The decrease in interest and dividends to $124.9 in 2017 from $153.7 in 2016 principally reflected lower interestincome earned (reflecting sales of U.S. treasury and municipal bonds late in 2016 and in the first quarter of 2017),partially offset by lower total return swap expense.
Cash provided by operating activities (excluding operating cash flow activity related to securities recorded at FVTPL)increased to $389.9 in 2017 from $268.9 in 2016, primarily due to lower income taxes paid and increased netpremiums collected, partially offset by increased net claims paid related to current period catastrophes losses andlower investment income received.
Crum & Forster
2017 2016
Underwriting profit 3.2 32.4
Loss & LAE – accident year 65.3% 64.2%Commissions 15.8% 16.0%Underwriting expenses 19.3% 18.5%
Combined ratio – accident year 100.4% 98.7%Net favourable development (0.6)% (0.5)%
Combined ratio – calendar year 99.8% 98.2%
Gross premiums written 2,174.5 2,055.0
Net premiums written 1,863.4 1,801.1
Net premiums earned 1,852.8 1,769.5
Underwriting profit 3.2 32.4Interest and dividends 33.8 65.8Share of loss of associates (1.1) (22.6)
Operating income 35.9 75.6
On October 4, 2016 Crum & Forster acquired a 100% interest in Trinity Risk LLC (‘‘Trinity’’) for consideration of$12.0. Trinity focuses on occupational accident insurance and produces approximately $26 of gross premiumswritten annually.
142

Crum & Forster reported an underwriting profit of $3.2 and a combined ratio of 99.8% in 2017 compared to anunderwriting profit of $32.4 and a combined ratio of 98.2% in 2016. The decrease in underwriting profit in 2017principally reflected the impact of higher current period catastrophe losses (as set out in the table below) andincreased underwriting expenses, partially offset by increased net favourable prior year reserve development.
2017 2016
Catastrophe Combined Catastrophe Combinedlosses(1) ratio impact losses(1) ratio impact
Hurricane Irma 16.5 0.9 – –Hurricane Harvey 5.0 0.3 – –California wildfires 2.1 0.1 – –Texas hailstorms – – 10.5 0.6Hurricane Matthew – – 5.0 0.3Other 18.4 1.0 10.5 0.6
42.0 2.3 points 26.0 1.5 points
(1) Net of reinstatement premiums.
Net favourable prior year reserve development in 2017 of $10.2 (0.6 of a combined ratio point, principally related toexcess and surplus lines loss reserves, partially offset by net adverse development on commercial transportation lossreserves) increased from $8.3 in 2016 (0.5 of a combined ratio point, principally related to net favourable emergenceon workers’ compensation and professional risk loss reserves, partially offset by an increase in construction defectloss reserves).
The decrease in Crum & Forster’s commission expense ratio to 15.8% in 2017 from 16.0% in 2016, principallyreflected the impact of higher ceding commission income in 2017. The increase in Crum & Forster’s underwritingexpense ratio to 19.3% in 2017 from 18.5% in 2016 principally reflected increased compensation costs related to newunderwriting initiatives.
The increase in gross premiums written of 5.8% in 2017 principally reflected growth in the accident and health andcommercial transportation lines of business, partially offset by decreases in excess and surplus and marine lines ofbusiness. Net premiums written increased by 3.5% in 2017, consistent with the growth in gross premiums written.Net premiums earned increased by 4.7% in 2017, reflecting the growth in net premiums written during 2016and 2017.
The decrease in interest and dividends to $33.8 in 2017 from $65.8 in 2016 principally reflected lower interestincome earned (reflecting sales of U.S. treasury and municipal bonds late in 2016 and in the first quarter of 2017) andincreased investment management and administration fees, partially offset by lower total return swap expense.Share of loss of associates in 2016 included a non-cash impairment charge of $25.3 related to Resolute.
Cash provided by operating activities (excluding operating cash flow activity related to securities recorded at FVTPL)of $111.6 in 2017 decreased from $238.5 in 2016 primarily due to higher net paid losses and lower interest anddividend income received, partially offset by higher net premiums collected and lower income taxes paid.
Crum & Forster’s cumulative net earnings since acquisition on August 13, 1998 was $1,816.4 and its average annualreturn on average equity since acquisition was 8.7% (December 31, 2016 – 9.4%).
143

FAIRFAX FINANCIAL HOLDINGS LIMITED
Zenith National(1)
2017 2016
Underwriting profit 117.2 164.1
Loss & LAE – accident year 58.9% 56.9%Commissions 10.3% 10.1%Underwriting expenses 25.8% 25.2%
Combined ratio – accident year 95.0% 92.2%Net favourable development (9.4)% (12.5)%
Combined ratio – calendar year 85.6% 79.7%
Gross premiums written 849.0 831.7
Net premiums written 837.4 819.4
Net premiums earned 811.6 807.3
Underwriting profit 117.2 164.1Interest and dividends 23.4 29.6Share of profit (loss) of associates (9.8) 1.2
Operating income 130.8 194.9
(1) These results differ from those published by Zenith National primarily due to differences between IFRS and U.S. GAAP,intercompany investment transactions and acquisition accounting adjustments recorded by Fairfax related to theacquisition of Zenith National in 2010.
Zenith National reported an underwriting profit of $117.2 and a combined ratio of 85.6% in 2017 compared to anunderwriting profit of $164.1 and a combined ratio of 79.7% in 2016. The decrease in underwriting profit in 2017principally reflected lower net favourable prior year reserve development, an increase in non-catastrophe propertyloss experience related to the current accident year and higher current period catastrophe losses.
Net favourable prior year reserve development in 2017 of $76.4 (9.4 combined ratio points) decreased from $101.0 in2016 (12.5 combined ratio points), principally reflecting net favourable emergence related to accident years 2013through 2016 in 2017 and net favourable emergence related to accident years 2012 through 2015 in 2016.
In 2017 Zenith National’s agriculture property and casualty line of business incurred current period catastrophelosses of $8.2 (1.0 combined ratio point) related to the California wildfires and other large losses of $6.7 (0.8 of acombined ratio point). Excluding these incurred losses, the estimated accident year loss and LAE ratio in 2017 wascomparable to 2016 and reflected favourable loss development trends for accident year 2016, offset by modest earnedprice decreases and estimated loss trends for accident year 2017. The increase in Zenith National’s underwritingexpense ratio to 25.8% in 2017 from 25.2% in 2016 principally reflected flat net premiums earned and higherunderwriting expenses, primarily attributable to ongoing investment in personnel.
The increase in gross premiums written and net premiums written of 2.1% and 2.2% in 2017 principally reflectedincreased exposure, partially offset by price decreases. The increase in net premiums earned of 0.5% in 2017principally reflected the growth in net premiums written during 2016 and 2017.
The decrease in interest and dividends to $23.4 in 2017 from $29.6 in 2016 principally reflected lower interestincome earned (reflecting sales of U.S. treasury and municipal bonds late in 2016 and in the first quarter of 2017),partially offset by lower total return swap expense. Share of loss of associates in 2017 included a non-cashimpairment charge of $5.5 related to Thai Re.
Cash provided by operating activities (excluding operating cash flow activity related to securities recorded at FVTPL)of $95.5 in 2017 decreased from $141.2 in 2016, primarily due to higher income taxes paid, higher net paid lossesand expenses and lower investment income received, partially offset by higher net premiums collected.
144

Brit(1)
2017 2016
Underwriting profit (loss) (201.9) 29.1
Loss & LAE – accident year 72.7% 65.0%Commissions 27.6% 20.9%Underwriting expenses 13.4% 15.8%
Combined ratio – accident year 113.7% 101.7%Net favourable development (0.6)% (3.8)%
Combined ratio – calendar year 113.1% 97.9%
Gross premiums written 2,057.0 1,912.2
Net premiums written 1,530.9 1,480.2
Net premiums earned 1,536.9 1,399.3
Underwriting profit (loss) (201.9) 29.1Interest and dividends 32.6 55.4Share of profit of associates 9.2 3.4
Operating income (loss) (160.1) 87.9
(1) These results differ from those published by Brit primarily due to differences in presentation of net gains on investmentsand acquisition accounting adjustments recorded by Fairfax related to the acquisition of Brit on June 5, 2015.
On August 3, 2016 Brit purchased shares for cancellation from its minority shareholder Ontario MunicipalEmployees Retirement System (‘‘OMERS’’) for cash consideration of $57.8, which increased the company’sownership interest in Brit from 70.1% to 72.5%. On March 3, 2017 Brit paid a dividend of $45.8 to OMERS.
Brit reported an underwriting loss of $201.9 and a combined ratio of 113.1% in 2017 compared to an underwritingprofit of $29.1 and a combined ratio of 97.9% in 2016. The decrease in underwriting profit in 2017 principallyreflected an increase in current period catastrophe losses (as set out in the table below), lower net favourable prioryear reserve development and an increase in commission expense (described below).
2017 2016
Catastrophe Combined Catastrophe Combinedlosses(1) ratio impact losses(1) ratio impact
Hurricane Irma 110.5 7.2 – –Hurricane Harvey 54.3 3.5 – –Hurricane Maria 45.6 3.0 – –California wildfires 34.2 2.2 – –Mexico earthquakes 6.8 0.4 – –Hurricane Matthew – – 26.1 1.9Fort McMurray wildfire – – 17.8 1.3Other 7.5 0.5 32.5 2.3
258.9 16.8 points 76.4 5.5 points
(1) Net of reinstatement premiums.
Net favourable prior year reserve development in 2017 decreased to $9.5 (0.6 of a combined ratio point, principallyrelated to favourable emergence on casualty and property reinsurance and energy lines of business, partially offset bynet reserve strengthening of $13.1 resulting from a change in the Ogden discount rate that was effective fromMarch 2017) from $53.5 in 2016 (3.8 combined ratio points, principally related to favourable emergence on casualtyand property reinsurance lines of business). The Ogden discount rate is set and revised periodically by theU.K. government and is used by the U.K. courts in the assessment of lump sum awards for personal injury claimants.
145

FAIRFAX FINANCIAL HOLDINGS LIMITED
The increase in Brit’s commission expense ratio to 27.6% in 2017 from 20.9% in 2016 principally reflected theimpacts of non-recurring acquisition accounting adjustments which reduced net premiums earned and commissionexpense in 2016, partially offset by changes in the mix of business written, reinsurance purchased and higher netpremiums earned in 2017. The decrease in Brit’s underwriting expense ratio to 13.4% in 2017 from 15.8% in 2016principally reflected the favourable effect of foreign currency translation and increased fee income earned from themanagement of third party underwriting capital, partially offset by higher compensation costs.
The increase in gross premiums written and net premiums written of 7.6% and 3.4% in 2017 principally reflectedbetter than expected development on 2016 and prior underwriting years, inwards reinstatement premiumsfollowing the current period catastrophe losses, increased contribution from initiatives launched in recent years andmeasured growth in core lines of business, partially offset by modest price decreases and reductions in other lines ofbusiness through active portfolio management and the unfavourable impact of foreign currency translation. Theincrease in net premiums written was tempered by the impact of additional reinsurance purchased. The increase innet premiums earned of 9.8% in 2017 principally reflected the same factors that affected net premiums written andthe impact of the acquisition accounting adjustments described in the preceding paragraph.
The decrease in interest and dividends to $32.6 in 2017 from $55.4 in 2016 principally reflected lower interestincome earned (reflecting sales of U.S. treasury and municipal bonds late in 2016 and in the first quarter of 2017).
Cash provided by operating activities (excluding operating cash flow activity related to securities recorded at FVTPL)of $17.2 in 2017 decreased from $148.3 in 2016, primarily due to higher net paid losses and lower interest anddividend income received, partially offset by higher net premiums collected.
Allied World(1)
For the periodJuly 6, 2017 toDecember 31,
2017
Underwriting loss (586.6)
Loss & LAE – accident year 125.7%Commissions 3.2%Underwriting expenses 21.1%
Combined ratio – accident year 150.0%Net adverse development 7.0%
Combined ratio – calendar year 157.0%
Gross premiums written 1,447.6
Net premiums written 991.9
Net premiums earned 1,028.7
Underwriting loss (586.6)Interest and dividends 65.9Share of loss of associates (17.6)
Operating loss (538.3)
(1) These results differ from those published by Allied World primarily due to differences between IFRS and U.S. GAAP andacquisition accounting adjustments (principally goodwill and intangible assets) recorded by Fairfax related to theacquisition of Allied World on July 6, 2017.
On July 6, 2017 the company completed the acquisition of 94.6% of the outstanding shares of Allied WorldAssurance Company Holdings, AG (‘‘Allied World AG’’) for purchase consideration of $3,977.9, consisting of$1,905.6 in cash and $2,072.3 by the issuance of 4,799,497 subordinate voting shares. In addition, Allied World AGdeclared a special pre-closing cash dividend of $5.00 per share ($438.0). Contemporaneously with the closing of theacquisition of Allied World AG, Ontario Municipal Employees Retirement System (‘‘OMERS’’), the pension planmanager for government employees in the province of Ontario, Alberta Investment Management Corporation
146

(‘‘AIMCo’’), an investment manager for pension, endowment and government funds in the province of Alberta, andcertain other third parties (together, ‘‘the co-investors’’) invested $1,580.0 for an indirect equity interest in AlliedWorld AG. The remaining 5.4% of the outstanding shares of Allied World AG were acquired on August 17, 2017 forpurchase consideration of $229.0, consisting of $109.7 in cash and $119.3 by the issuance of 276,397 subordinatevoting shares, in a merger transaction under Swiss law pursuant to which Allied World Assurance CompanyHoldings, GmbH (‘‘Allied World’’) became the surviving entity. This merger resulted in the co-investors holding anindirect ownership interest in Allied World of 32.6%. The co-investors will have a dividend in priority to thecompany, and the company will have the ability to purchase the shares owned by the co-investors over the nextseven years. Allied World is a global property, casualty and specialty insurer and reinsurer.
Allied World reported an underwriting loss of $586.6 and a combined ratio of 157.0% in the period July 6, 2017 toDecember 31, 2017, which included current period catastrophe losses (as set out in the table below) and net adverseprior year reserve development of $71.9 (7.0 combined ratio points). Net adverse development principally related tothe insurance segment (due to higher than expected claims development within the professional liability line ofbusiness for the 2012 and 2013 accident years and the primary casualty line of business), partially offset by netfavourable development in the reinsurance segment (due to net favourable prior year reserve development in thespecialty and casualty lines of business, partially offset by net adverse prior year reserve development in the propertyline of business related to U.S. storms in 2015 and 2016). Allied World’s gross premiums written of $1,447.6 in theperiod July 6, 2017 to December 31, 2017 included assumed reinstatement premiums of $19.8 related to currentperiod catastrophe losses.
For the period July 6, 2017to
December 31, 2017
Catastrophe Combinedlosses(1) ratio impact
Hurricane Irma 153.9 15.1Hurricane Maria 124.9 12.0Hurricane Harvey 122.9 11.8California wildfires 87.3 8.4Mexico earthquakes 9.1 0.9Other 43.5 4.5
541.6 52.7 points
(1) Net of reinstatement premiums.
Share of loss of associates in the period July 6, 2017 to December 31, 2017 included a non-cash impairment charge of$19.2 related to an associate.
147

FAIRFAX FINANCIAL HOLDINGS LIMITED
Fairfax Asia
2017 2016
Underwriting profit 38.2 41.1
Loss & LAE – accident year 80.3% 83.4%Commissions 1.4% (2.1)%Underwriting expenses 22.7% 22.3%
Combined ratio – accident year 104.4% 103.6%Net favourable development (16.0)% (17.2)%
Combined ratio – calendar year 88.4% 86.4%
Gross premiums written 670.4 648.7
Net premiums written 327.5 303.1
Net premiums earned 327.6 302.5
Underwriting profit 38.2 41.1Interest and dividends 29.1 26.7Share of profit of associates 29.4 48.1
Operating income 96.7 115.9
Fairfax Asia comprises the company’s Asian holdings and operations: 97.7%-owned Singapore-based First CapitalInsurance Limited (‘‘First Capital’’, sold on December 28, 2017), Hong Kong-based Falcon Insurance (Hong Kong)Company Ltd. (‘‘Falcon’’), 85.0%-owned Malaysia-based The Pacific Insurance Berhad (‘‘Pacific Insurance’’), 80.0%-owned Indonesia-based PT Asuransi Multi Artha Guna Tbk. (‘‘AMAG’’), 78.0%-owned Sri Lanka-based FairfirstInsurance Limited (‘‘Fairfirst Insurance’’), 35.0%-owned Vietnam-based Bank for Investment and Development ofVietnam Insurance Joint Stock Corporation (‘‘BIC Insurance’’), 41.2%-owned Bangkok-based Falcon Insurance PLC(‘‘Falcon Thailand’’) and Mumbai-based ICICI Lombard General Insurance Company Limited (‘‘ICICI Lombard’’,partially sold during 2017 and reclassified to a common stock investment).
On December 28, 2017 the company completed the sale of its 97.7% interest in First Capital to Mitsui SumitomoInsurance Company Limited of Tokyo, Japan (‘‘Mitsui Sumitomo’’) for gross proceeds of $1,683.3 and realized a netafter-tax gain of $1,018.6. The transaction was completed pursuant to an agreement with Mitsui Sumitomo to pursuea global strategic alliance. The company expects to enter into a quota share participation in First Capital’s insuranceportfolio in 2018.
On August 30, 2017 Pacific Insurance acquired the assets and liabilities of the general insurance business ofPrudential Assurance Malaysia Berhad (‘‘Prudential Assurance Malaysia’’) for $2.3. Prudential Assurance Malaysia is ageneral insurer in Malaysia.
On July 6, 2017 the company sold a 12.2% equity interest in ICICI Lombard to private equity investors for netproceeds of $376.3 and a net realized investment gain of $223.3. On September 19, 2017 the company sold anadditional 12.1% equity interest through participation in ICICI Lombard’s initial public offering for net proceeds of$532.2 and a net realized investment gain of $372.3. The company’s remaining 9.9% equity interest in ICICILombard (fair value of $549.0 at December 31, 2017) was reclassified from the equity method of accounting tocommon stock at FVTPL (included in holding company cash and investments in the Fairfax Asia reporting segment),resulting in a $334.5 re-measurement gain. In 2017, Fairfax Asia paid dividends to Fairfax of $2,429.7 primarilycomprised of the proceeds from the partial sale of ICICI Lombard and the sale of the company’s 97.7% interest inFirst Capital. On March 31, 2016 the company increased its ownership interest in ICICI Lombard to 34.6% byacquiring an additional 9.0% of the issued and outstanding shares of ICICI Lombard from ICICI Bank for $234.1(15.5 billion Indian rupees).
On October 10, 2016 the company acquired an 80.0% interest in AMAG from PT Bank Pan Indonesia Tbk. (‘‘PaninBank’’) for $178.9 (2.322 trillion Indonesian rupiah). AMAG will distribute its insurance products through along-term bancassurance partnership with Panin Bank. AMAG is a general insurer in Indonesia. On December 31,2016 Fairfax Indonesia was merged into AMAG.
148

On October 3, 2016 Union Assurance acquired a 100% equity interest in Asian Alliance General Insurance Limited(subsequently renamed Fairfirst Insurance Limited) for $10.2 (1,488.9 million Sri Lankan rupees). Fairfirst Insuranceis a general insurer in Sri Lanka. On February 28, 2017 Union Assurance was merged into Fairfirst Insurance.
Fairfax Asia reported an underwriting profit of $38.2 and a combined ratio of 88.4% in 2017, compared to anunderwriting profit of $41.1 and a combined ratio of 86.4% in 2016. The entities comprising Fairfax Asia producedcombined ratios as set out in the following table:
2017 2016
First Capital 69.5% 64.9%Falcon 99.1% 97.6%Pacific Insurance 99.6% 95.6%(1)
AMAG 95.9% 128.0%Fairfirst Insurance 99.0% 105.2%
(1) Excludes the impact of an intercompany loss portfolio transfer in 2016 of commercial automobile loss reserves ($15.8) andthe related premiums ceded to reinsurers ($15.8) (the ‘‘2016 LPT’’). Underwriting profit remained unchanged.
Net favourable prior year reserve development in 2017 of $52.3 (16.0 combined ratios points, principally related tocommercial automobile, health, marine and property loss reserves) increased nominally from $52.1 in 2016(17.2 combined ratio points, principally related to commercial automobile, engineering and marine hullloss reserves).
Fairfax Asia’s commission expense ratio of 1.4% in 2017 compared to its commission income ratio of 2.1% in 2016primarily reflected decreased profit commission on reinsurance ceded by First Capital related to commercial propertyand marine lines of business and the consolidation of the higher commission expense ratios of recent acquisitionsAMAG and Fairfirst Insurance.
The consolidation of AMAG, Fairfirst Insurance and the 2016 LPT affected gross premiums written, net premiumswritten and net premiums earned as set out in the following table:
2017 2016
Gross Net Net Gross Net Netpremiums premiums premiums premiums premiums premiums
written written earned written written earned
Fairfax Asia – as reported 670.4 327.5 327.6 648.7 303.1 302.5Fairfirst Insurance (11.9) (11.4) (12.4) (4.1) (3.9) (3.8)AMAG (62.9) (43.9) (45.1) (11.8) (9.1) (10.7)Pacific Insurance – 2016 LPT – – – – 15.8 15.8
Fairfax Asia – as adjusted 595.6 272.2 270.1 632.8 305.9 303.8
Percentage change (year-over-year) (5.9)% (11.0)% (11.1)%
The decrease in gross premiums written of 5.9% in 2017 principally reflected lower writings in the commercialautomobile, property and marine lines of business. The decrease in net premiums written of 11.0% in 2017principally reflected the impact of lower premium retention (primarily at First Capital) and the same factors whichaffected gross premiums written. Net premiums earned decreased by 11.1% in 2017 reflecting the decreases in netpremiums written during 2016 and 2017.
The decrease in share of profit of associates to $29.4 in 2017 from $48.1 in 2016 primarily reflected the impact ofreclassifying the remaining 9.9% equity interest in ICICI Lombard from the equity method of accounting tocommon stock at FVTPL during the third quarter of 2017.
149

FAIRFAX FINANCIAL HOLDINGS LIMITED
Insurance and Reinsurance – Other
2017
FairfaxCentral
Fairfax andBryte Latin Eastern Inter-
Group Re Insurance Advent America Europe company Total
Underwriting profit (loss) 7.1 (3.0) (48.7) (22.2) (13.8) – (80.6)
Loss & LAE – accident year 96.1% 68.6% 81.7% 54.8% 51.5% – 71.3%Commissions 29.0% 17.9% 24.3% 1.1% 19.1% – 18.8%Underwriting expenses 4.3% 17.2% 21.1% 57.5% 31.2% – 24.3%
Combined ratio – accident year 129.4% 103.7% 127.1% 113.4% 101.8% – 114.4%Net adverse (favourable) development (35.2)% (2.5)% (0.8)% 5.1% 9.7% – (4.2)%
Combined ratio – calendar year 94.2% 101.2% 126.3% 118.5% 111.5% – 110.2%
Gross premiums written 147.9 348.9 271.2 314.1 168.6 (6.4) 1,244.3
Net premiums written 129.2 240.8 184.4 160.6 148.3 – 863.3
Net premiums earned 124.4 241.1 185.1 120.1 119.9 – 790.6
Underwriting profit (loss) 7.1 (3.0) (48.7) (22.2) (13.8) – (80.6)Interest and dividends 1.9 16.8 5.9 12.7 1.2 – 38.5Share of profit (loss) of associates 3.4 – (1.2) – 0.8 – 3.0
Operating income (loss) 12.4 13.8 (44.0) (9.5) (11.8) – (39.1)
2016
FairfaxCentral
Fairfax andBryte Latin Eastern Inter-
Group Re Insurance Advent America Europe company Total
Underwriting profit (loss) 35.4 – 0.5 0.5 (8.7) – 27.7
Loss & LAE – accident year 66.0% – 70.7% 61.4% 59.1% – 66.4%Commissions 30.9% – 22.3% 12.6% 18.5% – 23.3%Underwriting expenses 5.2% – 19.3% 32.6% 28.1% – 17.8%
Combined ratio – accident year 102.1% – 112.3% 106.6% 105.7% – 107.5%Net adverse (favourable) development (28.5)% – (12.6)% (7.7)% 6.3% – (13.8)%
Combined ratio – calendar year 73.6% – 99.7% 98.9% 112.0% – 93.7%
Gross premiums written 156.9 – 257.8 144.8 90.4 (6.6) 643.3
Net premiums written 140.6 – 177.0 58.3 82.5 – 458.4
Net premiums earned 133.8 – 185.1 45.6 72.7 – 437.2
Underwriting profit (loss) 35.4 – 0.5 0.5 (8.7) – 27.7Interest and dividends 8.7 – 10.6 5.5 1.8 – 26.6Share of profit (loss) of associates 0.8 – (0.1) – – – 0.7
Operating income (loss) 44.9 – 11.0 6.0 (6.9) – 55.0
On December 7, 2016 the company acquired a 100% interest in Zurich Insurance Company South Africa Limited(subsequently rebranded Bryte Insurance Company Limited (‘‘Bryte Insurance’’)) from Zurich InsuranceCompany Ltd. for $128.0 (1.8 billion South African rand). Bryte Insurance is a property and casualty insurer in SouthAfrica and Botswana.
150

Fairfax Latin America is comprised of Fairfax Brasil (established by Fairfax in 2010) and Fairfax Latam, which consistsof the insurance operations acquired from AIG in Chile and Colombia (effective from July 31, 2017), Argentina(effective from September 30, 2017) and Uruguay (effective from January 31, 2018). Fairfax Latam continues to workthrough the legal, regulatory and operational requirements to complete the acquisition of the insurance operationsof AIG in Venezuela.
Fairfax Central and Eastern Europe (‘‘Fairfax CEE’’) is comprised of Colonnade Insurance and Polish Re (acquired in2009). Colonnade Insurance includes the following: the business and renewal rights of the insurance operationsacquired from QBE in Hungary, Czech Republic and Slovakia (effective from February 1, 2016, April 1, 2016 andMay 2, 2016 respectively); the business and renewal rights of the insurance operations acquired from AIG inHungary, Czech Republic and Slovakia (effective from April 30, 2017), Bulgaria (effective from May 31, 2017), Poland(effective from June 30, 2017) and Romania (effective from October 31, 2017); and Colonnade Ukraine (acquired in2015). On July 31, 2017 (‘‘the effective date’’) a Part VII transfer pursuant to the U.K. Financial Services and MarketsAct 2000 was completed to legally transfer the run-off of the business written by QBE’s insurance operations inHungary, Czech Republic and Slovakia prior to the effective date (‘‘the transferring business’’) from QBE toColonnade Insurance. The net liabilities relating to the transferring business have been fully reinsured by Polish Resince December 31, 2014 through various 100% quota share transactions with QBE. All reinsurance protection thatbenefited the transferring business was transferred from QBE to Colonnade Insurance at the effective date.
The Insurance and Reinsurance – Other reporting segment produced an underwriting loss of $80.6 and a combinedratio of 110.2% in 2017 compared to an underwriting profit of $27.7 and a combined ratio of 93.7% in 2016. Thedecrease in underwriting profit in 2017 principally reflected increased current period catastrophe losses (as set out inthe table below), lower net favourable prior year reserve development and higher non-catastrophe loss experiencerelated to the current accident year.
2017 2016
Catastrophe Combined Catastrophe Combinedlosses(1) ratio impact losses(1) ratio impact
Hurricane Irma 20.7 2.6 – –Hurricane Harvey 18.6 2.4 – –Hurricane Maria 8.2 1.0 – –California wildfires 7.0 0.9 – –Fort McMurray wildfire – – 7.3 1.7Hurricane Matthew – – 5.7 1.3Other 24.6 3.1 16.7 3.8
79.1 10.0 points 29.7 6.8 points
(1) Net of reinstatement premiums.
The underwriting results in 2017 included net favourable prior year reserve development of $33.6 (4.2 combinedratio points), primarily reflecting net favourable development at Group Re (property and liability loss reserves),partially offset by net adverse development at Fairfax CEE (liability loss reserves at Polish Re) and Fairfax LatinAmerica (general liability loss reserves in Argentina). The underwriting results in 2016 included net favourable prioryear reserve development of $60.4 (13.8 combined ratio points), primarily reflecting net favourable development atGroup Re (property and liability loss reserves including net favourable emergence on the run-off of the intercompanyquota share reinsurance contract with Northbridge), Advent (property and casualty reinsurance loss reserves) andFairfax Latin America (Fairfax Brasil).
The expense ratio increased to 24.3% in 2017 from 17.8% in 2016, principally reflecting higher operating expenses atFairfax Brasil, the impact of the start-up of Colonnade Insurance and a higher expense ratio at Fairfax Latam due tolower net premium earned from changes to its reinsurance structure subsequent to its acquisition by Fairfax, partiallyoffset by lower operating expenses at Polish Re. The commission expense ratio decreased to 18.8% in 2017 from23.3% in 2016, primarily reflecting the impact of the consolidation of Bryte Insurance and Fairfax Latam which havecommission expense ratios that are generally lower than the other companies within the Insurance andReinsurance – Other segment. Fairfax Latam’s commission income ratio reflected the impact of the lag fromchanging from proportional reinsurance (with high ceding commissions) to a combination of proportionalreinsurance and non-proportional reinsurance (with lower ceding commissions).
151

FAIRFAX FINANCIAL HOLDINGS LIMITED
The consolidation of Bryte Insurance, Fairfax Latam and the business and renewal rights of the insurance operationsacquired from AIG in Central and Eastern Europe affected gross premiums written, net premiums written and netpremiums earned as set out in the following table:
2017 2016
Gross Net Net Gross Net Netpremiums premiums premiums premiums premiums premiums
written written earned written written earned
Insurance and Reinsurance – Other – as reported 1,244.3 863.3 790.6 643.3 458.4 437.2Bryte Insurance (348.9) (240.8) (241.1) – – –Insurance operations acquired from AIG in Latin America (166.5) (97.7) (68.5) – – –Business and renewal rights of the insurance operations acquired from
AIG in CEE (57.0) (44.1) (23.7) – – –
Insurance and Reinsurance – Other – as adjusted 671.9 480.7 457.3 643.3 458.4 437.2
Percentage change (year-over-year) 4.4% 4.9% 4.6%
The increase in gross premiums written, net premiums written and net premiums earned by 4.4%, 4.9% and 4.6% in2017 principally reflected increases at Fairfax CEE (primarily related to inward reinstatement premiums related to alarge loss in the commercial automobile line of business at Polish Re and organic growth at Colonnade Insurance)and Advent (primarily reflecting organic growth in property binders and consumer products lines of business),partially offset by decreases at Group Re (primarily reflecting the non-renewal in 2017 of certain reinsurancecontracts). Net premiums written in 2017 was also affected by increased premium retention at Polish Re and FairfaxBrasil, partially offset by outwards reinstatement premiums on current period catastrophe losses at Advent andpurchases of additional reinsurance at Advent and Group Re. The increase in net premiums earned reflected thegrowth in net premiums written during 2016 and 2017.
The increase in interest and dividends to $38.5 in 2017 from $26.6 in 2016 principally reflected the consolidation ofthe interest and dividends of Bryte Insurance and Fairfax Latam, and lower total return swap expense, partially offsetby lower interest income earned (reflecting sales of U.S. treasury and municipal bonds late in 2016 and in the firstquarter of 2017).
Run-off
The Run-off business segment was formed with the acquisition of the company’s interest in The Resolution Group(‘‘TRG’’) on August 11, 1999, and currently consists of two groups: the U.S. Run-off group, principally consisting ofTIG Insurance Company, and the European Run-off group, principally consisting of RiverStone (UK), Syndicate 3500at Lloyd’s and RiverStone Insurance. The Run-off reporting segment also includes Resolution Group Reinsurance(Barbados) Limited and TIG Insurance (Barbados) Limited, formed to facilitate certain reinsurance transactions. Bothgroups are managed by the dedicated RiverStone Run-off management operation which has 406 employees in theU.S. and the U.K.
On December 13, 2017 U.S. Run-off repaid $124.9 aggregate principal amount of purchase consideration payableupon maturity.
On December 31, 2016 U.S. Run-off agreed to reinsure a portfolio of casualty exposures associated with habitationalrisks (commercial residential properties such as apartment buildings and condominiums) relating to accident years2011 through 2016 from a U.S.-based insurer (the ‘‘habitational casualty reinsurance transaction’’). The 2016U.S. Run-off results reflected premiums of $110.7 as consideration for the assumption of $90.2 of net loss reservesand net provision for unearned premiums of $19.9.
On April 1, 2016 U.S. Run-off agreed to reinsure a portfolio of business comprised of construction defect exposures invarious states in the western U.S. relating to accident years 2008 to 2013 (the ‘‘second quarter 2016 constructiondefect reinsurance transaction’’). U.S. Run-off received a cash premium of $71.5 as consideration for the assumptionof $70.5 of net loss reserves and paid a commission of $1.0 to a third party for facilitating the transaction.
152

Set out below is a summary of the operating results of Run-off for the years ended December 31, 2017 and 2016.
2017 2016Gross premiums written 8.4 183.9
Net premiums written 8.3 183.4
Net premiums earned 20.1 163.5
Losses on claims (125.4) (236.2)
Operating expenses (102.1) (112.4)
Interest and dividends 28.9 51.2
Share of loss of associates (6.1) (15.5)
Operating loss (184.6) (149.4)
Run-off reported an operating loss of $184.6 in 2017 compared to an operating loss of $149.4 in 2016. Net premiumsearned of $20.1 in 2017 principally reflected the run-off of the unearned premium related to the habitationalcasualty reinsurance transaction (net premiums earned of $15.1 and losses on claims of $12.9). Losses on claims of$125.4 in 2017 principally reflected net adverse prior year reserve development of $145.9 at U.S. Run-off, partiallyoffset by net favourable prior year reserve development of $33.4 at European Run-off. Net adverse prior year reservedevelopment at U.S. Run-off was principally comprised of $182.5 related to APH exposures assumed primarily fromCrum & Forster and in the legacy portfolio of Clearwater Insurance, partially offset by $39.0 of net favourable prioryear reserve development at TIG Insurance related to workers’ compensation loss reserves. Net favourable prior yearreserve development of $33.4 at European Run-off principally related to the World Trade Center aviation marketsettlement.
Net premiums earned of $163.5 and losses on claims of $236.2 in 2016 principally reflected the impact of thehabitational casualty reinsurance transaction and the second quarter 2016 construction defect reinsurancetransaction. Losses on claims in 2016 also reflected net adverse prior year reserve development of $96.6 atU.S. Run-off, partially offset by net favourable prior year reserve development of $17.1 at European Run-off. Netadverse prior year reserve development of $96.6 at U.S. Run-off was principally comprised of $149.1 related to APHexposures assumed from Crum & Forster and in the legacy portfolio of Clearwater Insurance (including $50.0 relatedto a single assumed excess of loss contract with exposures to APH that was triggered and a loss of $18.8 incurred inconnection with the commutation of certain assumed long tail APH liabilities) and $30.2 of non-APH loss reservestrengthening, partially offset by $89.5 of net favourable prior year reserve development at TIG Insurance principallyrelated to workers’ compensation loss reserves. Net favourable prior year reserve development at European Run-offwas across various lines of business.
Operating expenses decreased to $102.1 in 2017 from $112.4 in 2016 principally reflecting a decrease in theprovision for reinsurance recoverables.
Interest and dividends decreased to $28.9 in 2017 from $51.2 in 2016 primarily as a result of lower interest incomeearned (reflecting sales of U.S. treasury and municipal bonds late in 2016 and in the first quarter of 2017), partiallyoffset by lower total return swap expense. Share of loss of associates in 2016 included a non-cash impairment chargeof $23.6 related to Resolute.
Run-off’s cash flows may be volatile as to timing and amount, with potential variability arising principally from therequirement to pay gross claims initially while third party reinsurance is only subsequently collected in accordancewith its terms and from the delay, until some time after claims are paid, of the release of assets pledged to secure thepayment of those claims.
153

FAIRFAX FINANCIAL HOLDINGS LIMITED
Other
2017
Restaurants Fairfax Thomas Cookand retail(1) India(2) India(3) Other(4) Total
Revenue 1,441.7 336.0 1,009.6 470.3 3,257.6Expenses (1,322.5) (315.9) (953.1) (404.5) (2,996.0)Interest and dividends 7.7 (116.8) – 4.2 (104.9)Share of profit of associates – 45.5 0.3 9.6 55.4
Operating income (loss) 126.9 (51.2) 56.8 79.6 212.1Net gains (losses) on investments (0.4) (4.6) 0.6 11.6 7.2
Pre-tax income (loss) before interest expense 126.5 (55.8) 57.4 91.2 219.3
2016
Restaurants Fairfax Thomas Cookand retail(1) India(2) India(3) Other(4) Total
Revenue 978.3 154.6 786.4 142.3 2,061.6Expenses (897.0) (151.5) (769.5) (140.4) (1,958.4)Interest and dividends 7.2 9.5 – – 16.7Share of profit of associates – 13.6 – – 13.6
Operating income 88.5 26.2 16.9 1.9 133.5Net gains (losses) on investments 8.8 20.4 1.5 (0.6) 30.1
Pre-tax income before interest expense 97.3 46.6 18.4 1.3 163.6
(1) Comprised primarily of Cara and its subsidiaries Pickle Barrel (acquired on December 1, 2017), St. Hubert (acquired onSeptember 2, 2016) and Original Joe’s (acquired on November 28, 2016), The Keg, Praktiker, William Ashley, SportingLife and Golf Town (acquired on October 31, 2016).
(2) Comprised of Fairfax India and its subsidiaries NCML, Fairchem (merged on March 14, 2017 with Privi Organics) andSaurashtra Freight (acquired on February 14, 2017). These results differ from those published by Fairfax India primarilydue to Fairfax India’s application of investment entity accounting under IFRS. Interest and dividends at Fairfax India in2017 is net of a performance fee accrual of $114.4 (2016 – nil).
(3) Comprised of Thomas Cook India and its subsidiaries Quess and Sterling Resorts. These results differ from those publishedby Thomas Cook India primarily due to differences between IFRS and Indian GAAP, and acquisition accountingadjustments.
(4) Comprised primarily of Grivalia Properties (consolidated on July 4, 2017), Fairfax Africa (since its initial public offeringon February 17, 2017), Mosaic Capital (consolidated on January 26, 2017), Pethealth and Boat Rocker.
Restaurants and retail
Subsequent to December 31, 2017
On February 22, 2018 the company sold its 51.0% ownership interest in The Keg to Cara for consideration of $74.6(Cdn$94.7), comprised of cash consideration of $7.9 (Cdn$10.0) and 3,400,000 Cara subordinate voting shares. Thetransaction increased the company’s equity interest in Cara to 43.2% from 40.2% at December 31, 2017.
Year ended December 31, 2017
On December 1, 2017 Cara acquired a 100% equity interest in Pickle Barrel Restaurants Inc. (‘‘Pickle Barrel’’) forpurchase consideration of $16.9 (Cdn$21.5). Pickle Barrel operates restaurants and provides catering services in theprovince of Ontario.
154

Year ended December 31, 2016
On November 28, 2016 Cara acquired an 89.2% interest in Original Joe’s Franchise Group Inc. (‘‘Original Joe’s’’) for$83.8 (Cdn$112.5), comprised of cash consideration of $69.3 (Cdn$93.0) and contingent consideration valued at$14.5 (Cdn$19.5). Original Joe’s is a Canadian multi-brand restaurant company based in the province of Alberta.
On September 2, 2016 Cara acquired a 100% equity interest in Groupe St-Hubert Inc. (‘‘St-Hubert’’) for $413.8(Cdn$538.7), comprised of cash consideration of $372.4 (Cdn$484.8) and the issuance of $41.4 (Cdn$53.9) of Carasubordinate voting shares to St-Hubert shareholders. A portion of the cash consideration was financed through aprivate placement of 7,863,280 Cara subordinate voting shares at a price of Cdn$29.25 for gross proceeds of $179.2(Cdn$230.0), of which 3,418,804 shares were acquired by the company and its subsidiaries to maintain its equity andvoting interests in Cara. St-Hubert is a Canadian full-service restaurant operator and fully integrated foodmanufacturer in the province of Quebec.
The year-over-year increases in the revenues and expenses of Restaurants and retail in 2017 primarily reflectedincreased revenue and expenses at Cara due to the inclusion of the full year results of St-Hubert and Original Joe’s,and the consolidation of Pickle Barrel on December 1, 2017.
Fairfax India
Subsequent to December 31, 2017
On March 9, 2018 the company received a performance fee of $114.4 for the period January 30, 2015 toDecember 31, 2017 in the form of 7,663,685 newly issued Fairfax India subordinate voting shares, which increasedthe company’s equity interest in Fairfax India to 33.6% from 30.2% at December 31, 2017.
On February 20, 2018 Fairfax India entered into an agreement to acquire a 51.0% equity interest in The CatholicSyrian Bank Ltd. (‘‘CS Bank’’) for approximately $186 (12.1 billion Indian rupees). The transaction is subject tocustomary closing conditions and is expected to close in the first half of 2018. CS Bank, headquartered in Thrissur,Kerala, offers banking services across India.
Year ended December 31, 2017
On March 14, 2017 Fairchem Speciality Limited (‘‘Fairchem’’) and Privi Organics Limited (‘‘Privi Organics’’)completed their previously announced merger, with the merged entity continuing under the Fairchem name. As aresult of the merger, Fairfax India, which had acquired a 44.7% interest in Fairchem on February 8, 2016 and a 50.8%interest in Privi Organics on August 26, 2016, became the dominant shareholder in Fairchem with a 48.7% interest.Prior to the merger, the company consolidated Privi Organics and applied the equity method of accounting to itsinvestment in Fairchem.
On February 14, 2017 Fairfax India acquired a 51.0% interest in Saurashtra Freight Private Limited (‘‘SaurashtraFreight’’) for cash consideration of $30.0 (2.0 billion Indian rupees). Saurashtra Freight operates a container freightstation at the Mundra Port in the Indian state of Gujarat.
On January 13, 2017 the company acquired 12,340,500 subordinate voting shares of Fairfax India for $145.0 ($11.75per share) in a private placement. Through that private placement and a contemporaneous bought deal publicoffering, Fairfax India raised proceeds of $493.5 net of commissions and expenses. Combined with various openmarket purchases of Fairfax India subordinate voting shares, the company’s multiple voting shares and subordinatevoting shares represented 93.6% of the voting rights and 30.2% of the equity interest in Fairfax India at the close ofthe aforementioned private placement and public offering.
Year ended December 31, 2016
On August 26, 2016 Fairfax India acquired a 50.8% equity interest in Privi Organics for $55.0 (3.7 billion Indianrupees) through the purchase of newly issued shares and shares acquired from existing shareholders. Privi Organics isa supplier of aroma chemicals to the fragrance industry.
On February 8, 2016 Fairfax India acquired a 44.7% interest in Adi Finechem Limited (subsequently renamedFairchem Specialty Limited (‘‘Fairchem’’)) for $19.4 (1.3 billion Indian rupees). Fairchem is a specialty chemicalmanufacturer in India of oleochemicals used in the paints, inks and adhesives industries, as well as intermediatenutraceutical and health products.
155

FAIRFAX FINANCIAL HOLDINGS LIMITED
The year-over-year increases in the revenues and expenses of Fairfax India in 2017 primarily reflected theconsolidation of Fairchem on March 14, 2017, the inclusion of the full year results of Privi Organics and increasedbusiness volumes at NCML. Interest and dividends in 2017 included the accrual of a performance fee of $114.4payable to Fairfax for the period January 30, 2015 to December 31, 2017 (subsequently settled on March 9, 2018) asFairfax India’s common shareholders’ equity at December 31, 2017 exceeded a specified hurdle rate for that period.The performance fee is an intercompany transaction that is eliminated on consolidation. The increase in share ofprofit of associates in 2017 primarily reflected the contribution from Bangalore Airport since March 24, 2017 and ayear-over-year increase related to IIFL Holdings. Net losses on investments in 2017 primarily reflected net losses onIndian government bonds.
Thomas Cook India
Year ended December 31, 2017
On December 27, 2017 Quess acquired the facility management and catering business of Manipal Integrated ServicesPrivate Limited (‘‘Manipal’’) for $152.5 (9.8 billion Indian rupees), primarily comprised of the issuance of $117.7(7.5 billion Indian rupees) of Quess common shares to Manipal shareholders and the reinvestment of $34.3(2.2 billion Indian rupees) of Quess’ existing holdings of Manipal preferred shares upon cancellation of those shares.In November of 2017 Thomas Cook India sold a 5.4% equity interest in Quess for cash proceeds of $96.8 (6.3 billionIndian rupees). On August 18, 2017 Quess raised $132.2 (8.5 billion Indian rupees) in net proceeds following thecompletion of a private placement of common shares with institutional investors. These transactions at ThomasCook India and Quess collectively reduced the company’s indirect ownership of Quess from 42.1% to 33.1%. Quess isa provider of staffing and facilities management services.
The year-over-year increases in the revenues and expenses of Thomas Cook India in 2017 primarily reflectedincreased revenue and expenses at Quess driven by the growth in its business.
Other
Subsequent to December 31, 2017
On March 7, 2018 the company acquired the services business carried on in Canada by Carillion Canada Inc. andcertain affiliates thereof (collectively ‘‘Carillion’’) relating to facilities management of airports, commercial and retailproperties, defense facilities, select healthcare facilities and on behalf of oil, gas and mining clients. The transactionwas approved by the Ontario Superior Court of Justice in Carillion’s proceedings under the Companies’ CreditorsArrangement Act (Canada). Carillion is an infrastructure services company that provides asset management andoperations solutions to industries and governments.
Year ended December 31, 2017
On July 4, 2017 the company acquired control of Grivalia Properties REIC (‘‘Grivalia Properties’’) by increasing itsequity interest to 52.6% through the acquisition of an additional 10.3% equity interest from Eurobank Ergasias S.A.for cash consideration of $100.0 (A88.0) and commenced consolidating Grivalia Properties in the Other reportingsegment. Grivalia Properties is a real estate investment company listed on the Athens Stock Exchange.
On February 17, 2017 the company acquired 22,715,394 multiple voting shares in a private placement and2,500,000 subordinate voting shares as part of the initial public offering of Fairfax Africa Holdings Corporation(‘‘Fairfax Africa’’) for total cash consideration of $252.2. The company also contributed its indirect equity interest inAFGRI Proprietary Limited (‘‘AFGRI’’) with a fair value of $72.8 to Fairfax Africa in exchange for 7,284,606 multiplevoting shares. Through its initial public offering, private placements and exercise of the over-allotment option by theunderwriters, Fairfax Africa raised net proceeds of $493.3 after issuance costs and expenses, inclusive of thecontribution of the investment in AFGRI. Following those transactions, the company’s $325.0 ($10.00 per share)investment represented 98.8% of the voting rights and 64.2% of the equity interest in Fairfax Africa. Fairfax Africawas established, with the support of Fairfax, to invest in public and private equity and debt instruments of Africanbusinesses or other businesses with customers, suppliers or business primarily conducted in, or dependent on, Africa.
On January 26, 2017 the company invested $114.5 (Cdn$150.0) in securities of Mosaic Capital Corporation (‘‘MosaicCapital’’) issued through a private placement comprised of: (i) Cdn$100.0 principal amount of 6.00% seniorpreferred securities; (ii) Cdn$50.0 principal amount of 5.00% senior secured debentures; and (iii) warrants entitlingthe company to acquire up to 17,026,106 common shares of Mosaic Capital at a price of Cdn$8.81 per common
156

share at any time until January 26, 2024 (the ‘‘Mosaic warrants’’). The company’s Mosaic Capital warrants represent apotential voting interest of approximately 62% (assuming all holders of Mosaic Capital convertible securities,including the company, exercised their options to convert), giving the company the ability to controlMosaic Capital.
Year ended December 31, 2016
On October 31, 2016 the company acquired a 60.0% indirect interest in Golf Town Limited (‘‘Golf Town’’) for $31.4(Cdn$42.0). Golf Town is a Canadian specialty retailer of golf equipment, consumables, golf apparel and accessories.
The year-over-year increases in the revenues and expenses of Other in 2017 reflected the inclusion of the full yearresults of Golf Town and the consolidation of Mosaic Capital (on January 26, 2017) and Grivalia Properties (on July 4,2017). Share of profit of associates in 2017 primarily reflected the contribution from joint ventures held by GrivaliaProperties. Net gains on investments in 2017 primarily reflected net gains on Atlas Mara convertible bonds andequity call options held by Fairfax Africa.
Interest and Dividends
An analysis of interest and dividends is presented in the Investments section of this MD&A.
Net Gains (Losses) on Investments
An analysis of consolidated net gains (losses) on investments is provided in the Investments section of this MD&A.
Interest Expense
Consolidated interest expense increased to $331.2 in 2017 from $242.8 in 2016, primarily reflecting the impact ofincreased borrowings at Fairfax India and its subsidiaries, the issuance on December 16, 2016 of Cdn$450.0 principalamount of 4.70% unsecured senior notes due 2026, consolidation of the interest expense of Allied World, increasedborrowings in 2017 on the holding company’s revolving credit facility, increased subsidiary borrowings (primarily atCara), consolidation of the interest expense of Grivalia Properties and Mosaic Capital and the issuance onDecember 4, 2017 of Cdn$650.0 principal amount of 4.25% unsecured senior notes due 2027.
Consolidated interest expense in 2017 of $331.2 (2016 – $242.8) was primarily attributable to interest expense at theholding company of $224.1 (2016 – $188.4). Interest expense by reporting segment is set out in the Sources of NetEarnings section of this MD&A.
Corporate Overhead and Other
Corporate overhead and other consists of the expenses of all of the group holding companies, net of investmentmanagement and administration fees earned by the holding company and the interest and dividend income earnedon holding company cash and investments.
2017 2016
Fairfax corporate overhead 143.7 106.4Subsidiary holding companies’ corporate overhead 49.5 15.5Subsidiary holding companies’ non-cash intangible asset amortization(1) 82.1 59.4Holding company interest and dividends 4.1 11.5Holding company share of (profit) loss of associates (127.7) 27.2Investment management and administration fees (236.8) (88.8)Loss on repurchase of long term debt 28.6 –
(56.5) 131.2
(1) Non-cash amortization of intangible assets is principally comprised of customer and broker relationships.
Fairfax corporate overhead increased to $143.7 in 2017 from $106.4 in 2016, primarily reflecting increases incharitable donations and consulting fees, and fees related to the renegotiation of the company’s revolving creditfacility, partially offset by non-recurring expenses incurred in connection with business acquisitions in 2016(principally Fairfax Latam).
157

FAIRFAX FINANCIAL HOLDINGS LIMITED
Subsidiary holding companies’ corporate overhead increased to $49.5 in 2017 from $15.5 in 2016, primarilyreflecting restructuring costs incurred in 2017 at Bryte Insurance and Fairfax Latam, non-recurring expenses incurredin connection with the acquisition of Allied World, the consolidation of the corporate overhead of Allied World andincreased charitable donations. Subsidiary holding companies’ non-cash intangible asset amortization increased to$82.1 in 2017 from $59.4 in 2016, primarily due to amortization of intangible assets related to the acquisition ofAllied World.
Holding company interest and dividends included total return swap expense which decreased to $16.8 in 2017 from$27.9 in 2016, primarily reflecting a reduction in short equity and equity index total return swaps in 2017. Excludingthe impact of total return swap expense, holding company interest and dividends decreased to $12.7 in 2017 from$16.4 in 2016, primarily reflecting decreased interest income on bonds, partially offset by increased dividendincome.
Holding company share of profit of associates of $127.7 in 2017 primarily reflected increased share of profit ofEurolife, partially offset by decreased share of profit of Gulf Insurance. Holding company share of loss of associates of$27.2 in 2016 included a non-cash impairment charge related to Resolute of $34.8.
Investment management and administration fees increased to $236.8 in 2017 from $88.8 in 2016, primarilyreflecting the performance fee receivable from Fairfax India of $114.4 (2016 – nil) and increased investment andadvisory fees earned on the investment portfolios of Allied World, Fairfax India and Fairfax Africa.
Loss on repurchase of long term debt arose on the early redemption of Cdn$388.4 principal amount 7.5% unsecuredsenior notes due 2019 and the purchase of principal amounts of $8.7, $5.8 and $3.3 of the holding company’sunsecured senior notes due in 2019, 2020 and 2021. Refer to note 15 (Borrowings) to the consolidated financialstatements for the year ended December 31, 2017.
Net gains (losses) on investments attributable to the Corporate and Other reporting segment are set out in theInvestments section of this MD&A.
Income Taxes
The company’s effective income tax rate in 2017 of 20.2% ($408.3 provision for income taxes) was lower than thecompany’s Canadian statutory income tax rate of 26.5% primarily due to the impact of net gains on the sales of ICICILombard and First Capital which were not taxable in the jurisdictions in which they were held (income tax ratebenefits of $246.5 in Mauritius and $269.9 in Barbados respectively) and non-taxable investment income(principally comprised of dividend income, non-taxable interest income and share of profit of associates in certainjurisdictions), partially offset by the revaluation of U.S. deferred tax assets as a result of U.S. tax reform (income taxrate charge of $222.4), losses at Allied World that are taxed at rates lower than the Canadian statutory income tax rateand a reduction in U.S. tax credits and operating losses capitalized in prior years primarily driven by the effects ofU.S. tax reform (income tax rate charge of $89.7).
The company’s effective income tax recovery rate in 2016 of 28.8% ($159.6 recovery of income taxes) was higherthan the company’s Canadian statutory income tax rate of 26.5% primarily due to non-taxable investment income(including dividend income and non-taxable interest income), losses incurred in the U.S. that are taxed at rateshigher than the Canadian statutory income tax rate and income in the U.K. that is taxed at rates lower than theCanadian statutory rate, partially offset by deferred taxes not recorded in Canada.
For further details related to the impact of U.S. tax reform on the company’s financial reporting, please refer tonote 18 (Income Taxes) to the consolidated financial statements for the year ended December 31, 2017.
Non-controlling Interests
Non-controlling interests principally relate to Allied World, Fairfax India, Cara, Grivalia Properties, Brit, ThomasCook India and Fairfax Africa. For further details refer to note 16 (Total Equity) to the consolidated financialstatements for the year ended December 31, 2017.
158

Components of Consolidated Balance Sheets
Consolidated Balance Sheet Summary
The assets and liabilities reflected on the company’s consolidated balance sheet at December 31, 2017 were primarilyimpacted by the acquisitions of Allied World and Fairfax Latam, the consolidation of Grivalia Properties and thedivestiture of the company’s 97.7% interest in First Capital. Refer to note 23 (Acquisitions and Divestitures) to theconsolidated financial statements for the year ended December 31, 2017 for additional details related to thesetransactions.
Holding company cash and investments increased to $2,368.4 ($2,356.9 net of $11.5 of holding companyshort sale and derivative obligations) at December 31, 2017 from $1,371.6 at December 31, 2016 ($1,329.4 net of$42.2 of holding company short sale and derivative obligations). Significant cash movements at the holdingcompany level in 2017 are as set out in the Financial Condition section of this MD&A under the heading Liquidity.
Insurance contract receivables increased by $1,769.4 to $4,686.9 at December 31, 2017 from $2,917.5 atDecember 31, 2016 primarily reflecting the impact of the consolidation of Allied World ($1,336.7) and Fairfax Latam($162.9) and growth in business volumes at OdysseyRe and Brit, partially offset by the impact of the divestiture ofFirst Capital ($113.1).
Portfolio investments comprise investments carried at fair value and equity accounted investments, theaggregate carrying value of which was $37,013.2 at December 31, 2017 ($36,898.5 net of subsidiary short sale andderivative obligations) compared to an aggregate carrying value at December 31, 2016 of $27,293.4 ($27,101.3 net ofsubsidiary short sale and derivative obligations). The increase of $9,797.2 primarily reflected the consolidation of theinvestment portfolios of Allied World ($7,918.8) and Fairfax Latam ($248.6), the net proceeds received from FairfaxAfrica’s initial public offering and Fairfax India’s secondary offering and the favourable impact of foreign currencytranslation (principally the strengthening of the euro, Canadian dollar and the British pound relative to theU.S. dollar), partially offset by the divestiture of First Capital’s investment portfolio ($686.7) and the reduction inownership of ICICI Lombard (see the discussion of investments in associates below), in addition to the specificfactors which caused movements in portfolio investments as discussed in the subsequent paragraphs.
Subsidiary cash and short term investments (including cash and short term investments pledged for short sale andderivative obligations) increased by $7,675.8, primarily reflecting the consolidation of the cash and short terminvestments of Allied World ($4,509.0) and Fairfax Latam ($77.2), the proceeds received from net sales of long datedU.S. state and municipal and corporate and other bonds (primarily corporate and other bonds that were part of theacquisition of Allied World) where a portion of the proceeds was retained in cash or invested in short terminvestments, and net proceeds received from Fairfax Africa’s initial public offering, partially offset by the divestitureof the cash and short term investments of First Capital ($362.4).
Bonds (including bonds pledged for short sale derivative obligations) increased by $19.0 primarily reflecting theconsolidation of the bond portfolios of Allied World ($2,306.2) and Fairfax Latam ($148.9), partially offset by netsales of U.S. state and municipal and corporate and other bonds (primarily corporate and other bonds that were partof the acquisition of Allied World), and the divestiture of the bond portfolio of First Capital ($140.9).
Common stocks increased by $698.8 primarily reflecting the consolidation of the common stock portfolios of AlliedWorld ($833.8) and Fairfax Latam ($13.5), net unrealized appreciation and the favourable impact of foreign currencytranslation (principally the strengthening of the euro, Canadian dollar and the British pound relative to theU.S. dollar), partially offset by net sales of certain common stock investments and the divestiture of the commonstock portfolio of First Capital ($117.0).
Investments in associates increased by $1,022.8 primarily reflecting associates acquired in 2017 by Fairfax India(Bangalore Airport) and Fairfax Africa (Atlas Mara) and the insurance and reinsurance companies (Farmers Edge,Astarta and Sigma), increased investments in associates owned prior to 2017 (APR Energy, IIFL Holdings and PeakAchievement) and the share of profit of associates ($200.5), partially offset by the reduction in ownership of ICICILombard (proceeds from the sale of a 24.3% equity interest in ICICI Lombard were remitted to the holding companyand the remaining 9.9% equity interest in ICICI Lombard, previously reflected as an investment in associate withinportfolio investments, was reclassified to common stock at FVTPL within holding company cash and investments(fair value of $549.0 at December 31, 2017).
Derivatives and other invested assets net of short sale and derivative obligations increased by $153.6 primarily due toinvestments in equity warrants, the closure of various short equity total return swaps and decreased payables to
159

FAIRFAX FINANCIAL HOLDINGS LIMITED
counterparties to the company’s U.S. treasury bond forward contracts (excluding the impact of collateralrequirements), partially offset by net unrealized losses on CPI-linked derivatives.
Recoverable from reinsurers increased by $3,802.2 to $7,812.5 at December 31, 2017 from $4,010.3 atDecember 31, 2016 primarily reflecting the consolidation of Allied World ($2,879.6) and Fairfax Latam ($572.6) andthe impact of current period catastrophe losses ceded to reinsurers (primarily by Brit, OdysseyRe and Advent),partially offset by a decrease at Run-off and the divestiture of the recoverable from reinsurers of First Capital ($447.1).
Deferred income taxes decreased by $351.8 to $380.8 at December 31, 2017 from $732.6 at December 31, 2016primarily due to the revaluation of the net U.S. deferred tax asset to the lower corporate income tax rate as a result ofU.S. tax reform, a reduction in tax credits and operating losses capitalized in prior years and deferred tax liabilitiesrelated to intangible assets recognized in connection with the acquisition of Allied World. Refer to note 18 (IncomeTaxes) to the consolidated financial statements for the year ended December 31, 2017 for additional details related tothe impact of U.S. tax reform on the company’s financial reporting.
Goodwill and intangible assets increased by $2,225.0 to $6,072.5 at December 31, 2017 from $3,847.5 atDecember 31, 2016 primarily as a result of the acquisitions of Allied World ($1,726.9) and Fairfax Latam ($23.3), theconsolidation of Mosaic Capital ($49.0), various acquisitions by Quess ($204.5, including $154.2 related to Quess’acquisition of Manipal) and the favourable impact of foreign currency translation (principally the strengthening ofthe Canadian dollar and Indian rupee relative to the U.S. dollar), partially offset by non-cash intangible assetamortization ($159.5).
The aforementioned acquisitions, and the allocation of goodwill of $2,904.7 and intangible assets of $3,167.8 atDecember 31, 2017 (December 31, 2016 – $1,633.7 and $2,213.8) by operating segment, are described in note 23(Acquisitions and Divestitures) to the consolidated financial statements for the year ended December 31, 2017.Impairment tests for goodwill and intangible assets not subject to amortization were completed in 2017 and it wasconcluded that no impairments had occurred.
Other assets increased by $2,309.9 to $4,828.3 at December 31, 2017 from $2,518.4 at December 31, 2016 primarilyas a result of the consolidation of Grivalia Properties ($1,170.4 comprised principally of its portfolio of investmentproperties), Allied World ($356.0) and Fairfax Latam ($96.5). Acquisitions completed in 2017 and recorded in theOther reporting segment also contributed to increased other assets, primarily related to premises and equipment,inventories and sales receivables.
Provision for losses and loss adjustment expenses increased by $9,129.0 to $28,610.8 at December 31, 2017from $19,481.8 at December 31, 2016 primarily reflecting the consolidation of Allied World ($7,787.9) and FairfaxLatam ($581.1), the impact of significant current period catastrophe losses (primarily related to Hurricanes Harvey,Irma and Maria and the California wildfires) and the impact on loss reserves of the strengthening of certain foreigncurrencies relative to the U.S. dollar (principally at OdysseyRe, Brit and Northbridge), partially offset by Runoff’scontinued progress settling its claims liabilities, the divestiture of the provision for loss and loss adjustment expensesof First Capital ($512.5) and prior year favourable reserve development (principally at OdysseyRe, Northbridge,Zenith National, Fairfax Asia and Group Re).
Non-controlling interests increased by $2,600.9 to $4,600.9 at December 31, 2017 from $2,000.0 atDecember 31, 2016 principally reflecting the consolidation of Allied World ($1,229.4) and Grivalia Properties($517.6), Fairfax India’s secondary offering in January 2017, Fairfax Africa’s initial public offering in February 2017,the reduction in the company’s indirect ownership of Quess from 42.1% to 33.1% and foreign currency translation(principally the strengthening of the Canadian dollar relative to the U.S. dollar), partially offset by the net lossattributable to non-controlling interests ($125.7) and dividends paid to non-controlling interests (principally thedividend paid by Brit to its minority shareholder OMERS). For further details refer to note 16 (Total Equity) andnote 23 (Acquisitions and Divestitures) to the consolidated financial statements for the year endedDecember 31, 2017.
Comparison of 2016 to 2015 – Total assets increased to $43,384.4 at December 31, 2016 from $41,529.0 atDecember 31, 2015 primarily reflecting the acquisitions of Bryte Insurance, AMAG, St-Hubert and Original Joe’s(at Cara) and Privi Organics (at Fairfax India) pursuant to the transactions described in note 23 (Acquisitions andDivestitures) to the consolidated financial statements for the year ended December 31, 2017.
160

Provision for Losses and Loss Adjustment Expenses
Since 1985, in order to ensure so far as possible that the company’s provision for losses and loss adjustment expenses(‘‘LAE’’) (often called ‘‘loss reserves’’ or ‘‘provision for claims’’) is adequate, management has established proceduresso that the provision for losses and loss adjustment expenses at the company’s insurance, reinsurance and run-offoperations are subject to several reviews, including by one or more independent actuaries. The reserves are reviewedseparately by, and must be acceptable to, internal actuaries at each operating company, the Chief Risk Officer atFairfax, and one or more independent actuaries.
The tables below present the company’s gross provision for losses and loss adjustment expenses by reporting segmentand line of business for the years ended December 31:
2017
Insurance and Reinsurance
Crum & Zenith Allied Fairfax Operating Corporate
Northbridge OdysseyRe Forster National Brit World(1) Asia Other Companies Run-off and Other Consolidated
Property 285.5 1,575.6 146.9 23.6 674.7 1,382.8 99.8 604.5 4,793.4 32.9 – 4,826.3
Casualty 1,614.6 3,451.5 3,171.9 1,162.9 2,637.5 5,940.7 159.4 813.1 18,951.6 2,491.9 – 21,443.5
Specialty 57.6 348.5 149.8 7.7 782.2 452.3 100.2 272.6 2,170.9 170.1 – 2,341.0
1,957.7 5,375.6 3,468.6 1,194.2 4,094.4 7,775.8 359.4 1,690.2 25,915.9 2,694.9 – 28,610.8
Intercompany 6.6 146.2 66.8 – 41.7 12.1 0.1 146.3 419.8 636.1 (1,055.9) –
Provision forlosses andLAE 1,964.3 5,521.8 3,535.4 1,194.2 4,136.1 7,787.9 359.5 1,836.5 26,335.7 3,331.0 (1,055.9) 28,610.8
2016
Insurance and Reinsurance
Crum & Zenith Allied Fairfax Operating Corporate
Northbridge OdysseyRe Forster National Brit World(1) Asia Other Companies Run-off and Other Consolidated
Property 251.3 1,199.2 147.9 10.1 378.4 – 239.0 283.4 2,509.3 120.9 – 2,630.2
Casualty 1,570.6 3,312.5 3,140.5 1,193.7 2,280.0 – 274.8 346.8 12,118.9 2,668.8 – 14,787.7
Specialty 47.4 328.3 210.8 8.7 703.5 – 284.6 181.3 1,764.6 299.3 – 2,063.9
1,869.3 4,840.0 3,499.2 1,212.5 3,361.9 – 798.4 811.5 16,392.8 3,089.0 – 19,481.8
Intercompany 5.7 56.9 63.1 – 44.8 – 1.6 207.6 379.7 701.1 (1,080.8) –
Provision forlosses andLAE 1,875.0 4,896.9 3,562.3 1,212.5 3,406.7 – 800.0 1,019.1 16,772.5 3,790.1 (1,080.8) 19,481.8
(1) Allied World is included in the company’s financial reporting with effect from July 6, 2017.
In the ordinary course of carrying on business, the company’s insurance, reinsurance and run-off companies maypledge their own assets as security for their own obligations to pay claims or to make premium (and accrued interest)payments. Circumstances where assets may be pledged (either directly or to support letters of credit) include:regulatory deposits (such as with U.S. states for workers’ compensation business); deposits of funds at Lloyd’s insupport of London market underwriting; and by a non-admitted company under U.S. insurance regulations assecurity for claims assumed or to support funds withheld obligations. Generally, the pledged assets are released as theunderlying payment obligation is fulfilled. The $5.7 billion of cash and investments pledged by the company’ssubsidiaries at December 31, 2017, as described in note 5 (Cash and Investments) to the consolidated financialstatements for the year ended December 31, 2017, represented the aggregate amount at that date that had beenpledged in the ordinary course of business to support each pledging subsidiary’s respective obligations (these pledgesdo not involve the cross-collateralization by one group company of another group company’s obligations).
Claims provisions are established by the company’s primary insurance companies by the case method as claims areinitially reported. The provisions are subsequently adjusted as additional information on the estimated ultimateamount of a claim becomes known during the course of its settlement. The company’s reinsurance companies rely oninitial and subsequent claims reports received from ceding companies to establish estimates of provision for claims.
161

FAIRFAX FINANCIAL HOLDINGS LIMITED
In determining the provision to cover the estimated ultimate liability for all of the company’s insurance andreinsurance obligations, a provision is also made for management’s calculation of factors affecting the futuredevelopment of claims including incurred but not reported claims based on the volume of business currently inforce, the historical experience on claims and potential changes, such as changes in the underlying book of business,in law and in cost factors.
As time passes, more information about the claims becomes known and provision estimates are consequentlyadjusted upward or downward. Because of the various elements of estimation encompassed in this process and thetime it takes to settle many of the more substantial claims, several years may be required before a meaningfulcomparison of actual losses to the original estimates of provision for claims can be developed.
The development of the provision for claims is often measured as the difference between estimates of reserves as ofthe initial year-end and the re-estimated liability at each subsequent year-end. This is based on actual payments infull or partial settlement of claims, plus re-estimates of the reserves required for claims still open or claims stillunreported. Favourable development (or redundancies) means that subsequent reserve estimates are lower thanoriginally indicated, while unfavourable development (or deficiencies) means that the original reserve estimateswere lower than subsequently indicated. The net favourable reserve development in the two tables that followexcludes the loss reserve development of a subsidiary in the year it is acquired. In the second table below, asubsidiary’s provision for claims balance at December 31 in the year of acquisition is included in the line ‘Provisionfor claims of companies acquired during the year at December 31’, whereas the net favourable reserve developmentas set out in the Sources of Net Earnings section of this MD&A and the consolidated statement of earnings includesthe loss reserve development of a subsidiary from its acquisition date.
Aggregate net favourable development for the years ended December 31, 2017 and 2016 were comprised as shown inthe following table:
Favourable/(Unfavourable)
2017(1) 2016(2)
Insurance and ReinsuranceNorthbridge 93.5 112.8OdysseyRe 288.1 266.5Crum & Forster 10.2 8.3Zenith National 76.4 101.0Brit 9.5 53.5Fairfax Asia 53.1 50.7Other 36.3 60.4
Operating companies 567.1 653.2Run-off (112.5) (79.5)
454.6 573.7
(1) Excludes net unfavourable development of companies acquired in 2017 – Allied World ($71.9), Fairfax Latam ($6.7) andPrudential Assurance Malaysia ($0.8). Also excluded in 2017 is net favourable development on the CTR Life business($4.0).
(2) Excludes net favourable development of companies acquired in 2016 – Fairfirst Insurance ($1.4).
162

Changes in provision for losses and loss adjustment expenses recorded on the consolidated balance sheets and therelated impact on unpaid claims and allocated loss adjustment expenses for the years ended December 31 were asshown in the following table:
Reconciliation of Provision for Claims – Consolidated
2017 2016 2015 2014 2013
Provision for claims at January 1 – net 16,289.4 16,596.3 14,378.2 14,981.6 15,075.8Foreign exchange effect of change in provision for claims 463.3 (103.7) (559.3) (496.2) (128.0)Provision for claims occurring:
In the current year 6,192.9 5,286.9 4,307.0 4,166.2 4,151.2In the prior years (454.6) (573.7) (467.5) (374.4) (476.0)
Paid on claims during the year related to:The current year (1,691.3) (1,304.5) (1,055.3) (1,076.7) (1,050.8)The prior years (3,876.8) (3,695.2) (2,688.4) (2,822.7) (3,068.7)
Provision for claims of companies acquired during the yearat December 31 5,725.0 83.3 2,681.6 0.4 478.1
Divestiture of subsidiary (235.5) – – – –
Provision for claims at December 31 before the undernoted 22,412.4 16,289.4 16,596.3 14,378.2 14,981.6CTR Life(1) 8.7 12.8 14.2 15.2 17.9
Provision for claims at December 31 – net 22,421.1 16,302.2 16,610.5 14,393.4 14,999.5Reinsurers’ share of provision for claims at December 31 6,189.7 3,179.6 3,205.9 3,355.7 4,213.3
Provision for claims at December 31 – gross 28,610.8 19,481.8 19,816.4 17,749.1 19,212.8
(1) Guaranteed minimum death benefit retrocessional business written by Compagnie Transcontinentale de Reassurance(‘‘CTR Life’’), a wholly owned subsidiary of the company that was transferred to Wentworth and placed into run-offin 2002.
The foreign exchange effect of change in provision for claims principally related to the impact in 2017 of thestrengthening of the the Canadian dollar, British pound and the euro relative to the U.S. dollar (principally atOdysseyRe, Northbridge, Brit and Run-off). In general, the company manages foreign currency risk on claimsliabilities by investing in financial instruments and other assets denominated in the same currency as the liabilitiesto which they relate.
The company endeavours to establish adequate provisions for losses and loss adjustment expenses at the originalvaluation date, with the objective of achieving net favourable prior period reserve development at subsequentvaluation dates. The reserves will always be subject to upward or downward development in the future and futuredevelopment could be significantly different from the past due to many unknown factors.
Available on Fairfax’s website (www.fairfax.ca) in the Annual Financial Supplement for the year ended December 31,2017 are tables that show the historical reserve reconciliation and the reserve development of Northbridge,OdysseyRe, Crum & Forster, Zenith National, Fairfax Asia and Insurance and Reinsurance – Other (comprised ofGroup Re, Bryte Insurance, Advent, Fairfax Latin America and Fairfax Central and Eastern Europe), and Run-off’sreconciliation of provision for claims.
Asbestos, Pollution and Other Hazards
General Discussion
The company’s exposure to asbestos claims, environmental pollution and other types of mass tort or health hazardclaims (collectively ‘‘APH exposures’’) are described in more detail in the following paragraphs.
A number of the company’s subsidiaries wrote general liability policies and reinsurance prior to their acquisition byFairfax under which policyholders continue to present asbestos-related injury claims. Substantially all of thecompany’s exposure to asbestos losses are now under the management of Run-off. The vast majority of these claimsare presented under policies written many years ago. There is a great deal of uncertainty surrounding these types ofclaims, which impacts the ability of insurers and reinsurers to estimate the ultimate amount of unpaid claims and
163

FAIRFAX FINANCIAL HOLDINGS LIMITED
related settlement expenses. The majority of these claims differ from most other types of claims because there isinconsistent precedent, if any at all, to determine what, if any, coverage exists or which, if any, policy years andinsurers/reinsurers may be liable. These uncertainties are exacerbated by judicial and legislative interpretations ofcoverage that in some cases have eroded the clear and express intent of the parties to the insurance contracts, and inothers have expanded theories of liability. Further, asbestos litigation itself continues to be an imperfect process forresolving asbestos claims fairly and cost effectively. The insurance industry as a whole is engaged in extensivelitigation over these coverage and liability issues and is thus confronted with continuing uncertainty in its efforts toquantify asbestos exposures.
The company also faces exposure to other types of mass tort or health hazard claims including claims related toenvironmental pollution and exposure to potentially harmful products or substances such as breast implants,pharmaceutical products, chemical products, lead-based pigments, tobacco, hepatitis C, talc, head trauma and inutero exposure to diethylstilbestrol (‘‘DES’’). Tobacco, although a significant potential risk to the company, has notpresented significant actual exposure to date. Methyl tertiary butyl ether (‘‘MTBE’’) contamination of undergrounddrinking water supplies was a significant potential health hazard, and while the company has resolved most of itspotential MBTE exposures, some exposure lingers. Although still a risk due to occasional unfavourable courtdecisions, lead pigment has had some favourable underlying litigation developments resulting in this hazardpresenting less of a risk to the company. The company has been monitoring claims alleging breast cancer as a result ofin utero exposure to DES, a synthetic estrogen supplement prescribed to prevent miscarriages or premature births.Since first emerging several years ago, the DES breast cancer claims have not progressed due to a lack of widelyaccepted scientific support for such claims. The company is also monitoring an emerging body of claims by womenwho claim exposure to talc as an ingredient of consumer products such as powders and cosmetics resulted in ovariancancer. Since 2016, a number of large talc verdicts have been awarded against a number of defendants. However,there have been developments in defendants’ favour in 2017, including the reversal of two sizeable plaintiff verdictsby appellate courts based on jurisdictional and scientific defenses as well as a defense verdict.
Asbestos Claims Discussion
Tort reform in the first decade of the millennium, both legislative and judicial, has had a significant impact on theasbestos litigation landscape. The majority of claims now being filed and litigated continue to be mesothelioma andlung cancer claims, with cases alleging less serious injury continuing to be brought in a small number ofjurisdictions. With unimpaired and non-malignant claims brought much less frequently, the litigation industry hasfocused on the more seriously injured plaintiffs, and the number of mesothelioma cases has not tailed off asexpected. Though there are fewer cases overall, the average number of defendants named in each case continues torise, and each year more defendants not previously sued for asbestos liability are named in lawsuits for the first time.Furthermore, there continues to be an increase in the settlement value of asbestos cases involving malignancies.Defense costs have also increased because the malignancy cases often are more heavily litigated than thenon-malignancy cases and because the asbestos litigation process and practices in the U.S. continue to be inefficient.Asbestos trial results have been mixed, with both plaintiff and defense verdicts having been rendered in courtsthroughout the U.S. Some plaintiffs continue to focus their efforts on maximizing their recoveries in the U.S. tortsystem from solvent defendants by heavily emphasizing their exposure to these defendants’ products andoperations, however limited that exposure may have been. Separately, these plaintiffs also seek to recover from thetrusts established by the bankruptcies of large asbestos manufacturing defendants associated with significant andprolonged worksite contamination, which, in some cases, is not identified in the allegations in the tort system. Theunfortunate result in these instances is a disproportionate shift in financial responsibility for alleged asbestos injuriesfrom large bankrupt entities to solvent peripheral defendants. The company continues to implement strategies andinitiatives to address these issues and will prudently evaluate and adjust its asbestos reserves as necessary as thelitigation landscape continues to evolve. As set out in the table that follows, the company has strengthened asbestosreserves by $153.0 or 11.4% in 2017.
In November 2016 A.M. Best Company issued its Asbestos Review, where it estimated net ultimate asbestos losses inthe U.S. property and casualty industry at $100 billion, an increase of more than $15 billion from its previous review,citing ‘‘an unstable environment faced with evolving litigation, increasing secondary exposure cases, and an increasein life expectancy.’’ The company has seen some of the underlying litigation factors that A.M. Best cites in theasbestos claims in the Run-off portfolio. The policyholders with the most significant asbestos exposure continue tobe defendants who manufactured, distributed or installed asbestos products on a nationwide basis. The run-offcompanies are exposed to these risks and have the bulk of the direct asbestos exposure within Fairfax. While these
164

insureds are relatively small in number, asbestos exposures for such entities have increased over the past decade dueto the rising volume of claims, the erosion of underlying limits, and the bankruptcies of target defendants. Inaddition, less prominent or ‘‘peripheral’’ defendants, including a mix of manufacturers, distributors, and installers ofasbestos-containing products, as well as premises owners continue to present with new reports. For the most part,these insureds are defendants on a regional rather than nationwide basis. Reinsurance contracts entered into before1984 also continue to present exposure to asbestos.
Reserves for asbestos cannot be estimated using traditional loss reserving techniques that rely on historical accidentyear loss development factors. Because each insured presents different liability and coverage issues, the companyevaluates its asbestos exposure on an insured-by-insured basis. Since the mid-1990’s Fairfax has utilized asophisticated, non-traditional methodology that draws upon company experience and asbestos claim data sets toassess asbestos liabilities on reported claims. The methodology utilizes a ground-up, exposure-based analysis thatconstitutes the industry ‘‘best practice’’ approach for asbestos reserving. The methodology was initially critiqued byoutside legal and actuarial consultants, and the results are reviewed annually by actuaries, all of whom haveconsistently found the methodology comprehensive and the results reasonable.
In the course of the insured-by-insured evaluation of exposure the following factors are considered: availableinsurance coverage, including any umbrella or excess insurance that has been issued to the insured; limits,deductibles, and self-insured retentions; an analysis of each insured’s potential liability; the jurisdictions involved;past and anticipated future asbestos claim filings against the insured; loss development on pending claims; pastsettlement values of similar claims; allocated claim adjustment expenses; applicable coverage defenses and theimpact of the defense strategies and initiatives advanced on behalf of each insured.
Following is an analysis of the company’s gross and net loss and ALAE reserves from asbestos exposures as atDecember 31, 2017 and 2016, and the movement in gross and net reserves for those years:
2017 2016
Gross Net Gross Net
AsbestosProvision for asbestos claims and ALAE at January 1 1,347.7 1,065.5 1,381.0 1,043.8Asbestos losses and ALAE incurred during the year 153.0 141.8 219.9 218.7Asbestos losses and ALAE paid during the year (208.6) (174.0) (253.2) (197.0)
Provision for asbestos claims and ALAE at December 31 1,292.1 1,033.3 1,347.7 1,065.5
Summary
Management believes that the asbestos reserves reported at December 31, 2017 are reasonable estimates of theultimate remaining liability for these claims based on facts currently known, the present state of the law andcoverage litigation, current assumptions, and the reserving methodologies employed. These asbestos reserves arecontinually monitored by management and reviewed by actuaries. To the extent that future social, scientific,economic, legal, or legislative developments alter the volume of claims, the liabilities of policyholders, the originalintent of the policies and the ability to recover reinsurance, adjustments to loss reserves may emerge infuture periods.
Recoverable from Reinsurers
The company’s subsidiaries purchase reinsurance to reduce their exposure on the insurance and reinsurance risksthey underwrite. Credit risk associated with reinsurance is managed through adherence to internal reinsuranceguidelines whereby the company‘s ongoing reinsurers generally must have high A.M. Best and/or Standard & Poor’sfinancial strength ratings and maintain capital and surplus exceeding $500.0. Most of the reinsurance balances forreinsurers rated B++ and lower or which are not rated were inherited by the company on acquisition of a subsidiary.
Recoverable from reinsurers of $7,812.5 on the consolidated balance sheet at December 31, 2017 consisted of futurerecoverables from reinsurers on unpaid claims ($6,216.2), reinsurance receivable on paid losses ($593.7) and theunearned portion of premiums ceded to reinsurers ($1,169.0), net of provision for uncollectible balances ($166.4).Recoverables from reinsurers on unpaid claims increased by $3,006.2 to $6,216.2 at December 31, 2017 from$3,210.0 at December 31, 2016 principally reflecting the consolidation of the recoverable from reinsurers of Allied
165

FAIRFAX FINANCIAL HOLDINGS LIMITED
World and Fairfax Latam (refer to note 23 (Acquisitions and Divestitures) to the consolidated financial statements forthe year ended December 31, 2017) and current period catastrophe losses ceded to reinsurers.
The following table presents the company’s top 25 reinsurance groups (ranked by gross recoverable from reinsurers)at December 31, 2017, which represented 81.0% (December 31, 2016 – 72.2%) of total recoverable from reinsurers.
Gross Net unsecuredA.M. Best recoverable recoverable
rating (or S&P from fromReinsurance group Principal reinsurers equivalent)(1) reinsurers(2) reinsurers(3)
Munich Munich Reinsurance Company A+ 1,181.5 1,027.1Swiss Re Swiss Reinsurance America Corporation A+ 737.0 726.7Lloyd’s Lloyd’s A 520.5 516.4AIG American Home Assurance Company A 520.2 510.9Markel Markel CATCo Reinsurance Ltd A 462.6 235.0Everest Everest Reinsurance (Bermuda), Ltd A+ 372.4 328.2AXIS AXIS Reinsurance Company A+ 329.8 318.1HDI Hannover Ruck SE A+ 317.5 307.4Berkshire Hathaway General Reinsurance Corporation A++ 259.5 258.3Alleghany Transatlantic Reinsurance Company A+ 194.2 191.3SCOR SCOR Global P&C SE A+ 152.6 151.2Arch Capital Arch Reinsurance Company A+ 149.6 144.7XL XL Insurance Company of New York, Inc. A 145.7 139.6RenaissanceRe Renaissance Reinsurance US Inc A 145.7 138.7Liberty Mutual Liberty Mutual Insurance Company A 130.7 130.6WR Berkley Berkley Insurance Company A+ 113.2 109.7EXOR Partner Reinsurance Company of the U.S. A 110.1 106.2QBE QBE Reinsurance Corporation A 104.0 103.3Chubb Chubb Tempest Reinsurance Ltd A++ 98.8 70.5Tokio Marine Tokio Millennium Re AG A++ 84.9 81.4Aspen Aspen Insurance UK Ltd A 78.8 78.8Singapore Re Singapore Reinsurance Corporation Ltd A- 66.2 66.2Nationwide Nationwide Mutual Insurance Company A+ 65.9 65.7Validus AlphaCat Reinsurance Limited A 61.4 24.4ARAG Holding ARAG Allgemeine Versicherungs-AG NR 60.1 60.1
Top 25 reinsurance groups 6,462.9 5,890.5Other reinsurers 1,516.0 1,175.5
Total recoverable from reinsurers 7,978.9 7,066.0Provision for uncollectible reinsurance (166.4) (166.4)
Recoverable from reinsurers 7,812.5 6,899.6
(1) Financial strength rating of principal reinsurer (or, if principal reinsurer is not rated, of the group).
(2) Excludes specific provisions for uncollectible reinsurance.
(3) Net of outstanding balances for which security was held, and excludes specific provisions for uncollectible reinsurance.
The following table presents the classification of the $7,812.5 recoverable from reinsurers according to the financialstrength rating of the responsible reinsurers at December 31, 2017, shown separately for the insurance andreinsurance operations and for the run-off operations. At December 31, 2017 approximately 8.7% (December 31,
166

2016 – 19.3%) of the consolidated recoverable from reinsurers related to run-off operations. Pools and associations,shown separately, generally consist of government or similar insurance funds carrying limited credit risk.
Insurance and Reinsurance Run-off Consolidated
Net Net NetA.M. Best Gross Balance unsecured Gross Balance unsecured Gross Balance unsecured
rating recoverable for which recoverable recoverable for which recoverable recoverable for which recoverable(or S&P from security is from from security is from from security is from
equivalent) reinsurers held reinsurers reinsurers held reinsurers reinsurers held reinsurers
A++ 353.0 30.9 322.1 76.6 1.0 75.6 429.6 31.9 397.7
A+ 3,596.3 242.8 3,353.5 282.1 24.4 257.7 3,878.4 267.2 3,611.2
A 2,178.8 81.8 2,097.0 133.1 13.6 119.5 2,311.9 95.4 2,216.5
A- 235.6 9.4 226.2 9.9 5.7 4.2 245.5 15.1 230.4
B++ 20.2 0.2 20.0 2.0 1.0 1.0 22.2 1.2 21.0
B+ 2.2 0.4 1.8 0.9 0.4 0.5 3.1 0.8 2.3
B or lower 3.1 3.0 0.1 2.3 – 2.3 5.4 3.0 2.4
Not rated 649.1 413.4 235.7 299.1 80.4 218.7 948.2 493.8 454.4
Pools and associations 125.0 4.5 120.5 9.6 – 9.6 134.6 4.5 130.1
7,163.3 786.4 6,376.9 815.6 126.5 689.1 7,978.9 912.9 7,066.0
Provision for uncollectiblereinsurance (31.9) (31.9) (134.5) (134.5) (166.4) (166.4)
Recoverable from reinsurers 7,131.4 6,345.0 681.1 554.6 7,812.5 6,899.6
To support recoverable from reinsurers balances, the company had the benefit of letters of credit or trust fundstotaling $912.9 at December 31, 2017 as follows:
• for reinsurers rated A – or better, security of $409.6 against outstanding reinsurance recoverables of $6,865.4;
• for reinsurers rated B++ or lower, security of $5.0 against outstanding reinsurance recoverables of $30.7;
• for unrated reinsurers, security of $493.8 against outstanding reinsurance recoverables of $948.2; and
• for pools and associations, security of $4.5 against outstanding reinsurance recoverables of $134.6.
In addition to the above security arrangements, Lloyd’s is also required to maintain funds in Canada and theUnited States that are monitored by the applicable regulatory authorities in those jurisdictions.
Substantially all of the provision for uncollectible reinsurance of $166.4 at December 31, 2017 related to the $480.1of net unsecured reinsurance recoverables from reinsurers rated B++ or lower or which are unrated (which excludespools and associations).
Based on the preceding analysis of the company’s recoverable from reinsurers and on the credit risk analysisperformed by the company’s reinsurance security department as described below, the company believes that itsprovision for uncollectible reinsurance has reasonably estimated all incurred losses arising from uncollectiblereinsurance at December 31, 2017.
The company’s reinsurance security department, with its dedicated specialized personnel and expertise in analyzingand managing credit risk, is responsible for the following with respect to recoverable from reinsurers: evaluating thecreditworthiness of all reinsurers and recommending to the company’s reinsurance committee those reinsurerswhich should be included on the list of approved reinsurers; on a quarterly basis, monitoring reinsurancerecoverables by reinsurer, by operating company, and in aggregate, and recommending the appropriate provision foruncollectible reinsurance; and pursuing collections from, and global commutations with, reinsurers which are eitherimpaired or considered to be financially challenged.
The insurance and reinsurance companies purchase reinsurance to achieve various objectives including protectionfrom catastrophic financial loss resulting from a single event, such as the total loss of a large manufacturing plantfrom a fire, protection against the aggregation of many smaller claims resulting from a single event, such as anearthquake or major hurricane, that may affect many policyholders simultaneously and generally to protect capitalby limiting loss exposure to acceptable levels. Consolidated net earnings included the pre-tax benefit of cededreinsurance of $621.3 (2016 – pre-tax cost of $123.1). The consolidated pre-tax impact of ceded reinsurance wascomprised as follows: reinsurers’ share of premiums earned (see tables which follow this paragraph); commissionsearned on reinsurers’ share of premiums earned of $347.1 (2016 – $267.4); losses on claims ceded to reinsurers of$2,367.1 (2016 – $952.1); and recovery of uncollectible reinsurance of $7.7 (2016 – $4.9).
167

FAIRFAX FINANCIAL HOLDINGS LIMITED
Year ended December 31, 2017
Insurance and ReinsuranceCorporate
Crum & Zenith Allied Fairfax Operating and Inter-Northbridge OdysseyRe Forster National Brit World(1) Asia Other companies Run-off Other Other company Consolidated
Reinsurers’ share ofpremiums earned 121.2 283.1 292.6 11.9 465.8 390.7 330.8 414.1 2,310.2 0.1 – – (209.7) 2,100.6
Pre-tax benefit (cost) of cededreinsurance (60.2) 156.4 90.1 (11.8) 155.8 318.7 (75.8) 19.0 592.2 68.7 – – (39.6) 621.3
Year ended December 31, 2016
Insurance and ReinsuranceCorporate
Crum & Zenith Allied Fairfax Operating and Inter-Northbridge OdysseyRe Forster National Brit World(1) Asia Other companies Run-off Other Other company Consolidated
Reinsurers’ share ofpremiums earned 113.5 300.3 258.7 11.9 341.0 – 338.9 155.1 1,519.4 0.5 – – (172.4) 1,347.5
Pre-tax benefit (cost) ofceded reinsurance (36.5) (16.6) 128.0 (12.5) (113.8) – (11.2) (85.6) (148.2) 77.9 – – (52.8) (123.1)
(1) Allied World is included in the company’s financial reporting with effect from July 6, 2017.
Reinsurers’ share of premiums earned increased from $1,347.5 in 2016 to $2,100.6 in 2017 primarily reflecting theconsolidation of Allied World and Fairfax Latam, the inclusion of the full year results of Bryte Insurance, increases atCrum & Forster (consistent with increased business volumes) and Brit (primarily reflecting lower risk retention), andhigher reinstatement premiums paid as a result of current period catastrophe losses in 2017, partially offset by adecrease at OdysseyRe (primarily reflecting the non-renewal in 2017 of a specific fronting arrangement).
Commissions earned on reinsurers’ share of premiums earned increased from $267.4 in 2016 to $347.1 in 2017primarily reflecting the consolidation of Allied World and Fairfax Latam, the inclusion of the full year results of BryteInsurance and increases at Crum & Forster and Brit consistent with the increase in reinsurers’ share of premiumsearned.
Reinsurers’ share of losses on claims increased from $952.1 in 2016 to $2,367.1 in 2017 primarily reflecting theconsolidation of Allied World and Fairfax Latam, the inclusion of the full year results of Bryte Insurance andsignificant current period catastrophe losses in 2017. The company recorded net recoveries of uncollectiblereinsurance of $7.7 in 2017 (2016 – $4.9).
The use of reinsurance in 2017 decreased cash provided by operating activities by approximately $469 (2016 – $152).The increase in cash used in operating activities in 2017 primarily reflected the timing of premiums paid to reinsurers($2,224.0 in 2017 compared to $1,445.9 in 2016) being sooner than the receipt of reinsurance recoverables, primarilyrelated to significant current period catastrophe losses in 2017 (total reinsurance recoveries received of $1,314.0 in2017 compared to $1,017.4 in 2016).
Investments
Hamblin Watsa Investment Counsel Ltd.
Hamblin Watsa Investment Counsel Ltd. (‘‘Hamblin Watsa’’) is a wholly owned subsidiary of the company thatserves as the investment manager for Fairfax, its insurance, reinsurance and run-off companies, Fairfax India andFairfax Africa. Following a long-term value-oriented investment philosophy with primary emphasis on thepreservation of invested capital, Hamblin Watsa looks for investments with a margin of safety by conductingthorough proprietary analysis of investment opportunities and markets to assess the financial strength of issuers,identifying attractively priced securities selling at discounts to intrinsic value and hedging risks where appropriate.Hamblin Watsa is opportunistic and disciplined in seeking undervalued securities in the market, often investing inout-of-favour securities when sentiment is negative, and willing to maintain a large proportion of its investmentportfolio in cash and cash equivalents when it perceives markets to be over-valued.
Hamblin Watsa generally operates as a separate investment management entity, with Fairfax’s CEO and one othercorporate officer being members of Hamblin Watsa’s investment committee. This investment committee isresponsible for making all investment decisions, subject to relevant regulatory guidelines and constraints, andoversight by management of Hamblin Watsa. Fairfax’s Board of Directors, its insurance, reinsurance and run-off
168

companies, Fairfax India and Fairfax Africa are kept apprised of significant investment decisions through thefinancial reporting process as well as periodic presentations by Hamblin Watsa management.
Overview of Investment Performance
Investments at their year-end carrying values (including at the holding company) for the company’s first year and forthe past ten years are presented in the following table. Included in bonds are U.S. treasury bond forward contracts,CPI-linked derivatives and credit default swaps and included in common stocks are investments in associates andequity derivatives.
Cash andshort term Preferred Common Real Per share
Year(1) investments Bonds(2) stocks stocks estate(3) Total(4) ($)
1985 6.4 14.1 1.0 2.5 – 24.0 4.80�
2008 6,343.5 9,069.6 50.3 4,480.0 6.4 19,949.8 1,140.852009 3,658.8 11,550.7 357.6 5,697.9 8.0 21,273.0 1,064.242010 4,073.4 13,353.5 627.3 5,095.3 150.5 23,300.0 1,139.072011 6,899.1 12,074.7 608.3 4,448.8 291.6 24,322.5 1,193.702012 8,085.4 11,545.9 651.4 5,397.6 413.9 26,094.2 1,288.892013 7,988.0 10,710.3 764.8 4,951.0 447.5 24,861.6 1,172.722014 6,428.5 12,660.3 520.6 5,968.1 615.2 26,192.7 1,236.902015 7,368.7 14,905.0 116.9 6,124.4 501.1 29,016.1 1,306.222016 11,214.4 10,358.3 70.6 6,281.1 506.3 28,430.7 1,231.112017(5) 19,186.2 10,392.5 299.6 9,014.1 363.0 39,255.4 1,414.55
(1) IFRS basis for 2010 to 2017; Canadian GAAP basis for 2009 and prior. Under Canadian GAAP, investments weregenerally carried at cost or amortized cost in 2006 and prior.
(2) Includes the company’s investment in other funds with a carrying value of $90.9 at December 31, 2017 (December 31,2016 – $157.1, December 31, 2015 – $1.094.0) that are invested principally in fixed income securities.
(3) Includes the company’s equity-accounted investments in KWF LPs, and Grivalia Properties prior to its consolidationeffective July 4, 2017.
(4) Net of short sale and derivative obligations of both the holding company and the operating companies commencingin 2004.
(5) Includes Allied World’s investment portfolio of $7,918.8, which the company commenced consolidating on July 6, 2017.
Investments per share increased by $183.44 to $1,414.55 at December 31, 2017 from $1,231.11 at December 31,2016. Approximately $106 of the increase in investments per share reflected the factors that increased investmentsdescribed under the heading ‘‘Components of Consolidated Balance Sheets’’ in this MD&A (excluding the impact ofthe acquisition of Allied World). Approximately $56 of the increase in investments per share reflected theconsolidation of Allied World’s investment portfolio of $7,918.8 relative to the 5,075,894 subordinate voting sharesissued to acquire Allied World. The remaining increase in investments per share of approximately $21 reflected theimpact of net repurchases of shares by the company for treasury for use in its share-based payment awards and forcancellation pursuant to normal course issuer bids. Fairfax common shares effectively outstanding increased to27,751,073 at December 31, 2017 from 23,093,566 at December 31, 2016. Since 1985, investments per share havecompounded at a rate of 19.4% per year, including the impact of acquisitions.
Interest and Dividends
The majority of interest and dividends is earned by the insurance, reinsurance and run-off companies. Interest anddividends on holding company cash and investments was $12.7 in 2017 (2016 – $16.4) prior to giving effect to total
169

FAIRFAX FINANCIAL HOLDINGS LIMITED
return swap expense of $16.8 (2016 – $27.9). Interest and dividends earned in the company’s first year and for thepast ten years is presented in the following table.
Interest and dividends
Average Pre-tax After tax
Investments at Yield(3) Per share Yield(3) Per shareYear(1) carrying value(2) Amount (%) ($) Amount(4) (%) ($)
1986 46.3 3.4 7.34 0.70 1.8 3.89 0.38�
2008 19,468.8 626.4 3.22 34.73 416.6 2.14 23.102009 20,604.2 712.7 3.46 38.94 477.5 2.32 26.092010 22,270.2 711.5 3.20 34.82 490.9 2.20 24.022011 23,787.5 705.3 2.97 34.56 505.7 2.13 24.782012 25,185.2 409.3 1.63 19.90 300.8 1.19 14.632013 25,454.7 376.9 1.48 18.51 277.0 1.09 13.602014 25,527.2 403.8 1.58 18.70 296.8 1.16 13.742015 27,604.4 512.2 1.86 22.70 376.5 1.36 16.692016 28,723.4 555.2 1.93 24.12 408.1 1.42 17.732017 33,843.1 559.0 1.65 21.42 410.9 1.21 15.74
(1) IFRS basis for 2010 to 2017; Canadian GAAP basis for 2009 and prior. Under Canadian GAAP, investments weregenerally carried at cost or amortized cost in 2006 and prior.
(2) Comprised of cash and investments at both the holding company and operating companies, net of short sale and derivativeobligations commencing in 2004.
(3) Interest and dividends, on a pre-tax and after-tax basis, expressed as a percentage of average investments at carrying value.
(4) Tax effected at the company’s Canadian statutory income tax rate.
Interest and dividends increased modestly to $559.0 in 2017 from $555.2 in 2016, primarily reflecting lower totalreturn swap expense, partially offset by lower interest earned. Lower interest earned principally reflected sales ofU.S. treasury and municipal bonds late in 2016 and in the first quarter of 2017, partially offset by the impact ofconsolidating Allied World’s investment portfolio and the higher interest earned on increased holdings of cash andshort term investments. Total return swap expense decreased to $53.2 in 2017 from $146.4 in 2016, primarilyreflecting the closure of the Russell 2000 short equity index total return swaps in the fourth quarter of 2016.
The company’s pre-tax interest and dividends yield decreased from 1.93% in 2016 to 1.65% in 2017 and thecompany’s after-tax interest and dividends yield decreased from 1.42% in 2016 to 1.21% in 2017. Prior to givingeffect to the interest which accrued to reinsurers on funds withheld of $2.8 (2016 – $0.9) and total return swapexpense of $53.2 (2016 – $146.4), interest and dividends in 2017 of $609.4 (2016 – $700.7) produced a pre-tax grossportfolio yield of 1.80% (2016 – 2.44%). The decline in the pre-tax gross portfolio yield was primarily due to lowerinterest earned on bonds as the result of sales of U.S. treasury and municipal bonds late in 2016 and in the firstquarter of 2017 as described in the preceding paragraph.
Share of Profit of Associates
Share of profit of associates increased to $200.5 in 2017 from $24.2 in 2016, primarily due to year-over-year increasesof $124.0 related to Eurolife and a non-cash impairment charge of $100.4 recognized on Resolute in 2016. Details ofthe company’s associates and transactions related to associates are described in note 6 (Investments in Associates) tothe consolidated financial statements for the year ended December 31, 2017.
170

Net Gains (Losses) on Investments
Net gains on investments of $1,467.5 in 2017 (2016 – net losses on investments of $1,203.6) were comprised asshown in the following table:
2017 2016
Net Net change in Net gains Net Net change in Net gainsrealized gains unrealized (losses) on realized gains unrealized (losses) on
(losses) gains (losses) investments (losses) gains (losses) investments
Common stocks 125.1 582.7 707.8 (151.2)(5)(6) 73.2(5)(6) (78.0)Preferred stocks – convertible – (1.6) (1.6) (68.0)(5)(7) 61.4(5)(7) (6.6)Bonds – convertible 25.9 207.2 233.1 35.0 (74.4) (39.4)Gain on disposition of associates(1) 69.8 – 69.8 – – –Other equity derivatives(2)(3) (19.9) 77.8 57.9 – 19.3 19.3
Long equity exposures 200.9 866.1 1,067.0 (184.2) 79.5 (104.7)Short equity exposures and equity
hedges(3) (553.1) 135.2 (417.9) (2,634.8) 1,441.9 (1,192.9)
Net equity exposure andfinancial effects (352.2) 1,001.3 649.1 (2,819.0) 1,521.4 (1,297.6)Bonds 419.8 (374.9) 44.9 648.7 (326.0) 322.7CPI-linked derivatives – (71.0) (71.0) – (196.2) (196.2)U.S. treasury bond forwards (174.5) 21.3 (153.2) 96.7 (49.7) 47.0Other derivatives (8.4) 8.1 (0.3) (70.6) 63.2 (7.4)Foreign currency (95.1) 97.9 2.8 80.6 (210.1) (129.5)Gain on disposition of insurance
and reinsurance associates(4) 930.1 – 930.1 – – –Other 3.7 61.4 65.1 (7.8) 65.2 57.4
Net gains (losses) on investments 723.4 744.1 1,467.5 (2,071.4) 867.8 (1,203.6)
Net gains (losses) on bonds iscomprised as follows:Government bonds (2.6) 26.8 24.2 334.3 (77.5) 256.8U.S. states and municipalities 437.5 (370.2) 67.3 321.4 (350.9) (29.5)Corporate and other (15.1) (31.5) (46.6) (7.0) 102.4 95.4
419.8 (374.9) 44.9 648.7 (326.0) 322.7
(1) During 2017 the company acquired control of Grivalia Properties by increasing its equity interest to 52.7% andcommenced consolidating Grivalia Properties in the Other reporting segment. As a result, the company re-measured itsequity accounted carrying value of Grivalia Properties to fair value and recorded a net realized gain of $51.3. Refer tonote 6 (Investments in Associates) to the consolidated financial statements for the year ended December 31, 2017.
(2) Other equity derivatives include long equity total return swaps, equity warrants and equity index call options.
(3) Gains and losses on equity and equity index total return swaps that are regularly renewed as part of the company’s longterm investment strategy are presented within net change in unrealized gains (losses). During 2017 the company closedout $1,202.9 notional amount of short equity total return swaps and recogonized a net loss on investment of $237.9(realized loss of $553.1, of which $315.2 was recognized as unrealized losses in prior years). In the fourth quarter of 2016the company discontinued its economic hedging strategy and recorded a net loss on investment of $955.2 (realized loss of$2,665.4, of which $1,710.2 had been recogonized as unrealized losses in prior years).
(4) During 2017 the company sold a 24.3% equity interest in ICICI Lombard for net proceeds of $908.5 and recorded a netrealized gain of $595.6. The company’s remaining 9.9% equity interest in ICICI Lombard was reclassified to commonstock measured at FVTPL and re-measured to fair value for a net realized gain of $334.5. Refer to note 6 (Investments inAssociates) to the consolidated financial statements for the year ended December 31, 2017.
(5) During 2016 the company recognized net realized losses of $220.3 and $103.7 on common and preferred stockinvestments pursuant to the issuer’s plan of restructuring and subsequent emergence from bankruptcy protection. Priorperiod unrealized losses on the common and preferred stock investments of $209.5 and $99.6 were reclassified to netrealized losses with a net impact of nil on the consolidated statement of earnings.
171

FAIRFAX FINANCIAL HOLDINGS LIMITED
(6) During 2016 the company increased its ownership interest in APR Energy to 49.0% and commenced applying the equitymethod of accounting, resulting in the reclassification of an unrealized loss of $68.1 on APR Energy to realized losses witha net impact of nil on the consolidated statement of earnings.
(7) During 2016 the company was required to convert a preferred stock investment into common shares of the issuer, resultingin a net realized gain on investment of $35.1 (the difference between the share price of the underlying common stock at thedate of conversion and the exercise price of the preferred stock). Prior period unrealized gains on the preferred stockinvestment of $41.7 were reclassified to net realized gains with a net impact of nil on the consolidated statementof earnings.
Net equity exposure and financial effects: During 2017 the company’s net equity exposure (long equityexposures net of short equity exposures) produced net gains of $649.1 (2016 – net losses of $1,297.6).
Throughout most of 2016 the company had economically hedged certain market risks associated with its equity andequity-related holdings (comprised of common stocks, convertible preferred stocks, convertible bonds,non-insurance investments in associates and equity-related derivatives) against a potential significant decline inequity markets by way of short positions effected through equity and equity index total return swaps (includingshort positions in certain equity indexes and individual equities) and equity index put options (S&P 500). Thecompany’s equity hedges were structured to provide a return that was inverse to changes in the fair values of theindexes and certain individual equities.
The company discontinued its economic equity hedging strategy in the fourth quarter of 2016 after givingconsideration to the possible and actual outcome of the U.S. elections and the potential for fundamental changesthat could improve U.S. economic growth and equity markets. During 2016 the company closed out $6,350.6notional amount of short positions effected through equity index total return swaps (comprised of Russell 2000,S&P 500 and S&P/TSX 60 short equity index total return swaps) and recognized a net loss on investment of $955.2(realized loss of $2,665.4 of which $1,710.2 had been recognized as unrealized losses in prior years). The companycontinues to hold short equity and equity index total return swaps for investment purposes, but no longer regardsthem as hedges of its equity and equity-related holdings. During 2017 the company closed out $1,202.9 notionalamount of short equity total return swaps and recognized a net loss on investment of $237.9 (realized loss of $553.1of which $315.2 was recognized as unrealized losses in prior years). In the first quarter of 2018 the company closedout an additional $481.3 notional amount of short equity and equity index total return swaps and recognized a netloss on investment of $8.1 (realized loss of $199.0 of which $190.9 was recognized as unrealized losses in prior years),which reduced the notional amount of remaining short equity and equity index total return swaps toapproximately $509.
At December 31, 2017 the company had entered into long equity total return swaps on individual equities forinvestment purposes with an original notional amount of $706.3 (December 31, 2016 – $283.9).
Bonds: Net gains on bonds of $44.9 in 2017 were primarily comprised of net gains on U.S. treasury bonds ($52.8)and U.S. state and municipal bonds ($67.3), partially offset by losses on Indian government bonds ($40.5) andcorporate and other bonds ($46.6).
CPI-linked derivatives: The company has purchased derivative contracts referenced to consumer price indexes(‘‘CPI’’) in the geographic regions in which it operates to serve as an economic hedge against the potential adversefinancial impact on the company of decreasing price levels. During 2017 the company did not enter into any newCPI-linked derivative contracts. The company’s CPI-linked derivative contracts produced net unrealized losses of$71.0 in 2017 (2016 – $196.2).
Net unrealized losses on CPI-linked derivative contracts typically reflect increases in the values of the CPI indexesunderlying those contracts during the periods presented (those contracts are structured to benefit the companyduring periods of decreasing CPI index values). Refer to the analysis in note 7 (Short Sales and Derivatives) under theheading CPI-linked derivatives in the company’s consolidated financial statements for the year ended December 31,2017 for a discussion and analysis of the company’s CPI-linked derivatives.
172

Net gains (losses) on investments by reporting segment: Net gains (losses) on investments by reportingsegment for 2017 and 2016 were comprised as shown in the following tables:
Year ended December 31, 2017Insurance and Reinsurance
CorporateCrum & Zenith Allied Fairfax Operating and
Northbridge OdysseyRe Forster National Brit World(1) Asia Other companies Run-off Other Other Consolidated
Long equity exposures 114.4 362.0 119.1 24.6 80.9 0.6 130.5 80.8 912.9 129.9 23.6 0.6 1,067.0
Short equity exposures (35.7) (46.2) (114.5) – – – – (8.3) (204.7) (35.1) – (178.1) (417.9)
Bonds (21.9) (13.5) 102.6 5.1 (10.4) (35.5) 11.9 6.9 45.2 8.0 (2.5) (5.8) 44.9
U.S treasury bond forwards (2.3) (29.0) (84.0) (8.5) (1.2) – – (2.4) (127.4) (23.5) – (2.3) (153.2)
CPI-linked derivatives (5.5) (22.2) (5.0) (5.5) (7.6) – – (17.3) (63.1) (1.9) – (6.0) (71.0)
Foreign currency (5.9) 0.1 9.6 10.3 15.5 10.1 10.7 2.8 53.2 (4.1) (13.4) (32.9) 2.8
Other(2) 1.7 1.9 0.1 0.6 1.8 (1.7) 930.8 7.0 942.2 – (0.5) 53.2 994.9
Net gains (losses) on investments 44.8 253.1 27.9 26.6 79.0 (26.5) 1,083.9 69.5 1,558.3 73.3 7.2 (171.3) 1,467.5
Year ended December 31, 2016Insurance and Reinsurance
CorporateCrum & Zenith Allied Fairfax Operating and
Northbridge OdysseyRe Forster National Brit World(1) Asia Other companies Run-off Other Other Consolidated
Long equity exposures 42.6 (16.1) 31.1 (43.2) (36.9) – 5.2 (9.6) (26.9) (32.4) 13.5 (58.9) (104.7)
Short equity exposures (181.8) (389.0) (155.0) (107.0) (13.1) – – (62.1) (908.0) (159.0) – (125.9) (1,192.9)
Bonds 67.6 90.9 (27.9) 19.8 110.6 – 0.4 33.9 295.3 7.1 19.0 1.3 322.7
CPI-linked derivatives (20.3) (43.8) (16.7) (15.5) (20.6) – – (44.1) (161.0) (11.2) – (24.0) (196.2)
Foreign currency (67.8) 27.8 (35.1) (20.7) 41.5 – (7.0) (5.7) (67.0) (48.6) (5.9) (8.0) (129.5)
Other (1.6) 11.5 18.9 (1.6) 5.8 – (0.3) (2.4) 30.3 18.9 3.5 44.3 97.0
Net gains (losses) on investments (161.3) (318.7) (184.7) (168.2) 87.3 – (1.7) (90.0) (837.3) (225.2) 30.1 (171.2) (1,203.6)
(1) Allied World is included in the company’s financial reporting with effect from July 6, 2017.(2) Includes net realized gains of $930.1 on partial disposition of the company’s investment in ICICI Lombard at Fairfax Asia, refer to note 6 (Investments in Associates) to
the consolidated financial statements for the year ended December 31, 2017.
Total Return on the Investment Portfolio
The following table presents the performance of the investment portfolio since Fairfax’s inception in 1985. For theyears 1986 to 2006, the calculation of total return on average investments included interest and dividends, netrealized gains (losses) and changes in net unrealized gains (losses) as the majority of the company’s investmentportfolio was carried at cost or amortized cost under Canadian GAAP. For the years 2007 to 2009, Canadian GAAPrequired the company to carry the majority of its investments at fair value and as a result, the calculation of totalreturn on average investments during this period included interest and dividends, net investment gains (losses)recorded in net earnings, net unrealized gains (losses) recorded in other comprehensive income and changes in netunrealized gains (losses) on equity accounted investments in associates. Effective January 1, 2010 the companyadopted IFRS and was required to carry the majority of its investments at FVTPL and as a result, the calculation oftotal return on average investments for the years 2010 to 2017 includes interest and dividends, net investment gains(losses) recorded in net earnings and changes in net unrealized gains (losses) on equity accounted investments inassociates. All noted amounts above are included on a pre-tax basis in the calculation of total return on averageinvestments.
173

FAIRFAX FINANCIAL HOLDINGS LIMITED
Change inNet gains (losses)
unrealizedrecorded in: Total return
Average Net Change in gainson average
investments Interest realized unrealized Net Other (losses) oninvestments(8)
at carrying and gains gains earnings comprehensive investmentsYear(1) value(2) dividends (losses) (losses) (loss)(3) income (loss) in associates(8) (%)
1986 46.3 3.4 0.7 (0.2) – – – 3.9 8.41987 81.2 6.2 7.1 (6.1) – – – 7.2 8.91988 102.6 7.5 6.5 9.5 – – – 23.5 22.91989 112.4 10.0 13.4 (5.1) – – – 18.3 16.31990 201.2 17.7 2.0 (28.5) – – – (8.8) (4.4)1991 292.3 22.7 (3.9) 24.0 – – – 42.8 14.61992 301.8 19.8 2.8 (8.3) – – – 14.3 4.71993 473.1 18.1 21.6 22.2 – – – 61.9 13.11994 871.5 42.6 14.6 (30.7) – – – 26.5 3.01995 1,163.4 65.3 52.5 32.7 – – – 150.5 12.91996 1,861.5 111.0 96.3 82.1 – – – 289.4 15.51997 3,258.6 183.8 149.3 (6.9) – – – 326.2 10.01998 5,911.2 303.7 314.3 (78.3) – – – 539.7 9.11999 10,020.3 532.7 63.8 (871.4) – – – (274.9) (2.7)2000 11,291.5 534.0 259.1 584.1 – – – 1,377.2 12.22001 10,264.3 436.9 121.0 194.0 – – – 751.9 7.32002 10,377.9 436.1 465.0 263.2 – – – 1,164.3 11.22003 11,527.5 331.9 826.1 142.4 – – – 1,300.4 11.32004 12,955.8 375.7 300.5(4) 165.6 – – – 841.8 6.52005 14,142.4 466.1 385.7 73.0 – – – 924.8 6.52006 15,827.0 746.5 789.4(5) (247.8) – – – 1,288.1 8.12007 17,898.0 761.0 – – 1,639.5 304.5 (131.2) 2,573.8 14.42008 19,468.8 626.4 – – 2,718.6 (426.7) 278.3 3,196.6 16.42009 20,604.2 712.7 – – 904.3(6) 1,076.7 (185.2) 2,508.5 12.22010 22,270.2 711.5 – – 28.7 – 98.2 838.4 3.82011 23,787.5 705.3 – – 737.7 – 78.5 1,521.5 6.42012 25,185.2 409.3 – – 639.4 – 79.6 1,128.3 4.52013 25,454.7 376.9 – – (1,579.8) – (44.6) (1,247.5) (4.9)2014 25,527.2 403.8 – – 1,682.7 – 70.3 2,156.8 8.42015 27,604.4 512.2 – – (341.3) – 20.9 191.8 0.72016 28,723.4 555.2 – – (1,223.3) – 160.1 (508.0) (1.8)2017 33,843.1 559.0 – – 1,542.4 – 339.2 2,440.6 7.2
Cumulative from inception 11,005.0 3,887.8 6,748.9 8.2(7)
(1) IFRS basis for 2010 to 2017; Canadian GAAP for 2009 and prior. Under Canadian GAAP, investments were generallycarried at cost or amortized cost in 2006 and prior.
(2) Comprised of cash and investments at both the holding company and operating companies, net of short sale and derivativeobligations commencing in 2004.
(3) Excludes net gains (losses) recognized on the company’s underwriting activities related to foreign currency since 2008.
(4) Excludes the $40.1 gain on the company’s secondary offering of Northbridge and the $27.0 loss in connection with thecompany’s repurchase of outstanding debt at a premium to par during 2004.
(5) Excludes the $69.7 gain on the company’s secondary offering of OdysseyRe, the $15.7 loss on the company’s repurchase ofoutstanding debt at a premium to par and the $8.1 dilution loss on conversions of the OdysseyRe convertible seniordebenture during 2006.
(6) Net gains on investments in 2009 excluded $25.9 of gains recognized on transactions involving the common and preferredshares of the company’s consolidated subsidiaries.
(7) Simple average of the total return on average investments for each of the 32 years.
(8) Total return on average investments is considered a non-IFRS measure as it includes changes in net unrealized gains(losses) on equity accounted investments in associates and excludes share of profit (loss) of associates.
174

Investment gains have been an important component of Fairfax’s financial results since 1985, having contributed anaggregate $11,695.4 (pre-tax) to total equity since inception. The contribution has fluctuated significantly fromperiod to period; the amount of investment gains (losses) for any period has no predictive value and variations inamount from period to period have no practical analytical value. From inception in 1985 to 2017, total return onaverage investments has averaged 8.2%.
The company has a long term, value-oriented investment philosophy. It continues to expect fluctuations in theglobal financial markets for common stocks, bonds, derivatives and other securities.
Bonds
Credit Risk
At December 31, 2017, 72.2% (December 31, 2016 – 79.2%) of the fixed income portfolio carrying value was ratedinvestment grade or better, with 47.1% (December 31, 2016 – 61.9%) being rated AA or better (primarily consisting ofgovernment obligations). Refer to note 24 (Financial Risk Management) under the heading Investments in DebtInstruments in the consolidated financial statements for the year ended December 31, 2017 for a discussion of thecompany’s exposure to the credit risk of individual issuers, sovereign and U.S. state and municipal governments.
Interest Rate Risk
Hypothetical parallel upward shifts in the term structure of interest rates by 100 basis points and 200 basis pointswould potentially decrease net earnings by $155.6 and $306.2 respectively (2016 – $148.2 and $295.1). Thecompany’s exposure to interest rate risk did not change significantly during 2017 compared to 2016. Allied World’sbond portfolio ($5,337.2, acquired on July 6, 2017) was re-balanced to reflect the company’s interest rate risktolerance. To reduce its exposure to interest rate risk (specifically exposure to U.S. state and municipal bonds andlong dated U.S. treasury bonds held in its fixed income portfolio), the company entered into forward contracts to selllong dated U.S. treasury bonds with a notional amount of $1,693.8 as at December 31, 2017 (December 31, 2016 –$3,013.4). These contracts have an average term to maturity of less than three months and may be renewed atmarket rates.
The company’s exposure to interest rate risk is discussed further in note 24 (Financial Risk Management) to theconsolidated financial statements for the year ended December 31, 2017.
Common Stocks
The company holds significant investments in equity and equity-related instruments. The market value and theliquidity of these investments are volatile and may vary dramatically either up or down in short periods, and theirultimate value will therefore only be known over the long term or on disposition. Throughout most of 2016 thecompany had economically hedged its equity and equity-related holdings. The company discontinued its economicequity hedging strategy in the fourth quarter of 2016 after giving consideration to the possible and actual outcome ofthe U.S. elections and the potential for fundamental changes that could improve U.S. economic growth and equitymarkets. During 2017 the company’s equity and equity-related exposure increased, primarily reflecting theconsolidation of the common stock portfolio of Allied World ($833.8), net acquisitions of non-insurance andreinsurance associates, purchases of common stocks and the continued reduction of the notional amount of shortequity total return swaps.
The company’s risk management objective with respect to market price fluctuations places primary emphasis on thepreservation of invested capital. Subsequent to the economic downturn in 2008, the company became increasinglyconcerned about the risk of a potential significant decline in global equity markets. From 2010 until the fourthquarter of 2016, the company relied on certain derivative financial instruments to protect its equity and equity-related holdings. In the latter part of 2016, the company’s sentiment with respect to U.S. economic growth andimprovements in the global equity markets improved, resulting in the discontinuation of the economic equityhedging strategy. In the foreseeable future, the company does not expect to apply equity hedging strategies and willremain focused on its long-term value-oriented investment philosophy, seeking investments that are attractivelypriced, are selling at a discount to intrinsic value and afford a margin of safety.
As a result of the increase in its net equity exposures and the termination of its economic equity hedging strategy, ahypothetical decrease in global equity markets of 5% and 10% at December 31, 2017 would potentially decrease thecompany’s net earnings by $238.5 and $475.0 respectively (2016 – $106.7 and $204.5). The company’s net equity
175

FAIRFAX FINANCIAL HOLDINGS LIMITED
exposure and exposure to market price fluctuations are discussed further in note 24 (Financial Risk Management) tothe consolidated financial statements for the year ended December 31, 2017.
The company’s holdings of common stocks and long equity total return swaps at December 31, 2017 and 2016 aresummarized by the issuer’s primary industry in the table below.
December 31, December 31,2017(1) 2016(1)
Financials and investment funds 4,171.6 2,988.2Commercial and industrial 1,356.1 571.5Consumer products and other 748.2 834.8
6,275.9 4,394.5
(1) Excludes other funds of $90.9 at December 31, 2017 (December 31, 2016 – $157.1) that are invested principally in fixedincome securities.
The company’s holdings of common stocks and long equity total return swaps at December 31, 2017 and 2016 aresummarized by the issuer’s country of domicile in the table below.
December 31, December 31,2017(1) 2016(1)
United States 2,078.2 1,266.9Canada 1,060.7 755.6India 621.2 247.8Greece 434.1 297.0Egypt 367.1 331.5Netherlands 355.8 231.9China 214.3 167.2Singapore 122.9 182.3Hong Kong 115.2 66.8Thailand 111.0 105.5United Kingdom 94.3 35.8Nigeria 78.4 74.4Kuwait 47.7 70.3Germany 29.5 30.3Ireland 0.8 102.8All other 544.7 428.4
6,275.9 4,394.5
(1) Excludes other funds of $90.9 at December 31, 2017 (December 31, 2016 – $157.1) that are invested principally in fixedincome securities.
Derivatives and Derivative Counterparties
The company endeavours to limit counterparty risk through diligent selection of counterparties to its derivativecontracts and through the terms of negotiated agreements. Pursuant to these agreements, counterparties arecontractually required to deposit eligible collateral in collateral accounts (subject to certain minimum thresholds) forthe benefit of the company based on the then daily fair value of the derivative contracts. Agreements negotiated withcounterparties provide for a single net settlement of all financial instruments covered by the agreement in the eventof default by the counterparty, thereby permitting obligations owed by the company to a counterparty to be offset tothe extent of the aggregate amount receivable by the company from that counterparty. The company’s exposure toderivative counterparty risk at December 31, 2017 was estimated to be $66.2 (December 31, 2016 – $105.8).
Refer to note 24 (Financial Risk Management) under the heading Credit Risk – Counterparties to DerivativeContracts in the company’s consolidated financial statements for the year ended December 31, 2017 for a discussionand tabular analysis of the company’s exposure to derivative counterparty risk.
176

Float
Fairfax’s float (a non-IFRS measure) is the sum of its loss reserves, including loss adjustment expense reserves,unearned premiums and other insurance contract liabilities, less insurance contract receivables, recoverable fromreinsurers and deferred premium acquisition costs. The annual benefit (cost) of float is calculated by dividing theunderwriting profit (loss) by the average float in that year. Float arises as an insurance or reinsurance businessreceives premiums in advance of the payment of claims.
The following table presents the accumulated float and the cost of generating that float for Fairfax’s insurance andreinsurance operations. The average float from those operations increased by 23.5% in 2017 to $16,977.9, at a costof 3.8%.
Average longterm Canada
Underwriting Average Cost (benefit) treasuryYear profit (loss)(1) float of float bond yield
1986 2.5 21.6 (11.6)% 9.6%�
2013 440.0 12,045.7 (3.7)% 2.8%2014 552.0 11,707.4 (4.7)% 2.8%2015 704.5 12,634.9 (5.6)% 2.2%2016 575.9 13,748.6 (4.2)% 1.9%2017 (641.5) 16,977.9 3.8% 2.3%Weighted average since inception 0.7% 3.7%
Fairfax’s weighted average net benefit of float since inception: 3.0%
(1) IFRS basis for 2010 to 2017; Canadian GAAP basis for 2009 and prior.
The following table presents a breakdown of total year-end float for the most recent five years.
Insurance and Reinsurance
Crum & Zenith Allied Fairfax OngoingYear Northbridge(1) OdysseyRe(2) Forster(3) National(4) Brit(5) World(6) Asia(7) Other(8) operations Run-off(9) Total
2013 2,112.0 4,673.5 2,338.7 1,202.3 – – 519.3 1,003.2 11,849.0 3,701.5 15,550.52014 1,910.8 4,492.3 2,562.7 1,195.2 – – 524.4 880.4 11,565.8 3,499.2 15,065.02015 1,626.1 4,172.2 2,593.6 1,217.1 2,731.8 – 570.7 792.5 13,704.0 3,367.6 17,071.62016 1,670.7 4,024.6 2,706.5 1,179.1 2,795.8 – 561.1 855.4 13,793.2 2,879.7 16,672.92017 1,760.2 4,439.6 2,860.8 1,177.2 3,078.3 5,457.2 233.5 1,155.8 20,162.6 2,566.9 22,729.5
During 2017 the company’s total float increased by $6,056.6 to $22,729.5.
(1) Northbridge’s float increased by 5.4% primarily due to the effect of the strengthening of the Canadian dollar relative to theU.S. dollar. In Canadian dollar terms, Northbridge’s float decreased by 1.7% primarily due to a decrease in loss reservesreflecting favourable prior year development and an increase in insurance balances receivables.
(2) OdysseyRe’s float increased by 10.3% primarily due to increases in loss reserves and unearned premiums, partially offsetby increases in insurance balances receivable and reinsurance recoverables. The increases in loss reserves and reinsurancerecoverables were principally due to increased catastrophe losses in 2017. The increase in unearned premiums primarilyreflected higher business volumes.
(3) Crum & Forster’s float increased by 5.7% primarily due to an increase in unearned premiums from higher businessvolumes, partially offset by lower loss reserves and reinsurance recoverables.
(4) Zenith National’s float was consistent year-over-year (decreased by 0.2%) but reflected an increase in unearned premiumsdue to slightly higher business volumes, largely offset by an increase in insurance balances receivable.
(5) Brit’s float increased by 10.1% due to increases in loss reserves and unearned premiums, partially offset by increases inreinsurance recoverables and insurance balances receivable. The increases in loss reserves and reinsurance recoverableswere principally due to increased catastrophe losses in 2017.
(6) Allied World increased the company’s float with effect from its acquisition date of July 6, 2017.
177

FAIRFAX FINANCIAL HOLDINGS LIMITED
(7) Fairfax Asia’s float decreased by 58.4% primarily due to the sale of its 97.7% interest in First Capital in 2017. Excludingthe impact of the First Capital sale, Fairfax Asia’s float decreased by 2.6%.
(8) Insurance and Reinsurance – Other’s float increased by 35.1% primarily due the consolidation of Fairfax Latam and thestrengthening of the Canadian dollar, South African rand and Polish zloty relative to the U.S. dollar, partially offset by thestrengthening of the U.S. dollar relative to the Brazilian real. The increase in float also reflected increases in loss reservesand reinsurance recoverables principally due to increased catastrophe losses in 2017.
(9) Run-off’s float decreased by 10.9% primarily due to lower loss reserves, partially offset by lower insurance balancesreceivable and reinsurance recoverables. Lower loss reserves and reinsurance recoverables were principally due to normalcourse cession and collection activity, partially offset by net adverse prior year reserve development. The decrease ininsurance balances receivable reflected the settlement of a large receivable balance which was outstanding at the endof 2016.
Financial Condition
Capital Resources and Management
The company manages its capital based on the following financial measurements and ratios:
December 31,
2017 2016 2015 2014 2013
Holding company cash and investments (net of short saleand derivative obligations) 2,356.9 1,329.4 1,275.9 1,212.7 1,241.6
Borrowings – holding company 3,475.1 3,472.5 2,599.0 2,656.5 2,491.0Borrowings – insurance and reinsurance companies 1,373.0 435.5 468.5 385.9 458.8Borrowings – non-insurance companies 1,566.0 859.6 284.0 136.6 44.7
Total debt 6,414.1 4,767.6 3,351.5 3,179.0 2,994.5
Net debt(1) 4,057.2 3,438.2 2,075.6 1,966.3 1,752.9
Common shareholders’ equity 12,475.6 8,484.6 8,952.5 8,361.0 7,186.7Preferred stock 1,335.5 1,335.5 1,334.9 1,164.7 1,166.4Non-controlling interests 4,600.9 2,000.0 1,731.5 218.1 107.4
Total equity 18,412.0 11,820.1 12,018.9 9,743.8 8,460.5
Net debt/total equity 22.0% 29.1% 17.3% 20.2% 20.7%Net debt/net total capital(2) 18.1% 22.5% 14.7% 16.8% 17.2%Total debt/total capital(3) 25.8% 28.7% 21.8% 24.6% 26.1%Interest coverage(4) 7.1x n/a 3.9x 12.3x n/aInterest and preferred share dividend distribution coverage(5) 6.0x n/a 2.9x 9.0x n/a
(1) Net debt is calculated by the company as total debt less holding company cash and investments (net of short sale andderivative obligations).
(2) Net total capital is calculated by the company as the sum of total equity and net debt.
(3) Total capital is calculated by the company as the sum of total equity and total debt.
(4) Interest coverage is calculated by the company as the sum of earnings (loss) before income taxes and interest expensedivided by interest expense.
(5) Interest and preferred share dividend distribution coverage is calculated by the company as the sum of earnings (loss)before income taxes and interest expense divided by interest expense and preferred share dividend distributions adjusted toa pre-tax equivalent at the company’s Canadian statutory income tax rate.
Holding company cash and investments increased to $2,356.9 at December 31, 2017 from $1,329.4 at December 31,2016. Significant cash movements at the Fairfax holding company level during 2017 are as set out in the FinancialCondition section of this MD&A under the heading Liquidity.
Borrowings – holding company increased by $2.6 to $3,475.1 at December 31, 2017 from $3,472.5 at December 31,2016 primarily reflecting the issuance of Cdn$650.0 principal amount of 4.25% unsecured senior notes due
178

December 6, 2027 and the impact of foreign currency translation on the company’s Canadian dollar denominatedlong term debt, partially offset by the early redemption of the Cdn$388.4 principal amount of 7.50% unsecuredsenior notes due 2019, the repayment of the amount drawn on the revolving credit facility, the repayment ofpurchase consideration payable upon maturity and the repurchases of $17.8 principal amount of Fairfax senior notesdue 2019, 2020 and 2021.
Borrowings – insurance and reinsurance companies increased by $937.5 to $1,373.0 at December 31, 2017 from$435.5 at December 31, 2016 primarily reflecting the consolidation of the borrowings of Allied World ($878.0) andborrowings of $45.0 on Brit’s revolving credit facility which was repaid in January 2018.
Borrowings – non-insurance companies increased by $706.4 to $1,566.0 at December 31, 2017 from $859.6 atDecember 31, 2016 primarily reflecting the consolidation of the borrowings of Grivalia Properties ($160.4), MosaicCapital ($54.0) and Fairfax Africa (term loan of $150.0) and increased borrowings at Fairfax India (term loan of$400.0 at December 31, 2017 compared to $225.0 at December 31, 2016).
Common shareholders’ equity increased from $8,484.6 at December 31, 2016 to $12,475.6 at December 31, 2017primarily reflecting the issuance of 5,075,894 subordinate voting shares pursuant to the acquisition of Allied World($2,191.6), net earnings attributable to shareholders of Fairfax ($1,740.6) and other comprehensive income ($283.8,comprised of net unrealized foreign currency translation gains on foreign operations of $200.4 and share of othercomprehensive income of associates of $114.3, partially offset by net losses on defined benefit plans of $30.9),partially offset by the payment of dividends on the company’s common and preferred shares ($282.0).
Non-controlling interests increased from $2,000.0 at December 31, 2016 to $4,600.9 at December 31, 2017principally reflecting the impact of the consolidation of Allied World ($1,229.4) and Grivalia Properties ($517.6),Fairfax India’s secondary offering in January 2017 and Fairfax Africa’s initial public offering in February 2017, thereduction in the company’s indirect ownership of Quess from 42.1% to 33.1% and foreign currency translation(principally the strengthening of the Canadian dollar relative to the U.S. dollar), partially offset by the net lossattributable to non-controlling interests ($125.7) and dividends paid to non-controlling interests (principally thedividend paid by Brit to its minority shareholder OMERS).
The changes in holding company borrowings, subsidiary borrowings (comprised of the borrowings of the insuranceand reinsurance companies and the non-insurance companies) and common shareholders’ equity affected thecompany’s leverage ratios as follows: the consolidated net debt/net total capital ratio decreased from 22.5% atDecember 31, 2016 to 18.1% at December 31, 2017 primarily as a result of increased net total capital, partially offsetby increased net debt. The increase in net debt was primarily due to increased subsidiary borrowings, partially offsetby increased holding company cash and investments. The increase in net total capital was primarily due to increasesin common shareholders’ equity, non-controlling interests and net debt. The consolidated total debt/total capitalratio decreased from 28.7% at December 31, 2016 to 25.8% at December 31, 2017 primarily as a result of increasedtotal capital (reflecting increases in common shareholders’ equity, non-controlling interests and total debt), partiallyoffset by increased total debt.
The company believes that holding company cash and investments, net of short sale and derivative obligations, atDecember 31, 2017 of $2,356.9 (December 31, 2016 – $1,329.4) provide adequate liquidity to meet the holdingcompany’s known commitments in 2018. Refer to the Liquidity section of this MD&A for a discussion of the holdingcompany’s available sources of liquidity and known significant commitments for 2018.
The company’s insurance and reinsurance companies continue to maintain capital above minimum regulatorylevels, at levels adequate to support their issuer credit and financial strength ratings, and above internally calculatedrisk management levels as discussed below. A common non-IFRS measure of capital adequacy in the property and
179

FAIRFAX FINANCIAL HOLDINGS LIMITED
casualty industry is the ratio of net premiums written to statutory surplus (or total equity). This ratio is shown for theinsurance and reinsurance companies for the most recent five years in the following table:
Net premiums written to statutorysurplus (total equity)
2017 2016 2015 2014 2013
Insurance and ReinsuranceNorthbridge (Canada) 1.0 0.9 0.9 0.8 0.9OdysseyRe (U.S.) 0.6 0.5 0.5 0.6 0.6Crum & Forster (U.S.) 1.4 1.5 1.3 1.1 1.1Zenith National (U.S.) 1.5 1.5 1.3 1.3 1.4Brit(1) 1.4 1.3 1.4 n/a n/aAllied World(2) 0.9 – – – –Fairfax Asia(3) 0.4 0.4 0.5 0.5 0.5Other(4) 0.8 0.7 0.7 0.5 0.6
Canadian insurance industry 1.1 1.0 1.0 1.0 1.0U.S. insurance industry 0.8 0.7 0.7 0.7 0.7
(1) The 2015 ratio presented for Brit includes net premiums written by Brit prior its acquisition by the company onJune 5, 2015.
(2) The 2017 ratio presented for Allied World includes net premiums written by Allied World prior its acquisition by thecompany on July 6, 2017 and its U.S. GAAP equity of $2,523.8 at December 31, 2017.
(3) Total equity excludes certain holding company investments.
(4) Other includes Group Re, Bryte Insurance, Advent, Fairfax Latin America (Fairfax Brasil and Fairfax Latam) and FairfaxCEE (Colonnade Insurance and Polish Re).
In the U.S., the National Association of Insurance Commissioners (‘‘NAIC’’) has developed a model law andrisk-based capital (‘‘RBC’’) formula designed to help regulators identify property and casualty insurers that may beinadequately capitalized. Under the NAIC’s requirements, an insurer must maintain total capital and surplus above acalculated threshold or face varying levels of regulatory action. The threshold is based on a formula that attempts toquantify the risk of a company’s insurance and reinsurance, investment and other business activities. AtDecember 31, 2017 OdysseyRe, Crum & Forster, Zenith National, Allied World and U.S. Run-off subsidiaries hadcapital and surplus in excess of the regulatory minimum requirement of two times the authorized control level; eachsubsidiary had capital and surplus of at least 3.3 times (December 31, 2016 – 3.4 times) the authorized control level,except for TIG Insurance which had 2.3 times (December 31, 2016 – 2.2 times).
In Canada, property and casualty companies are regulated by the Office of the Superintendent of FinancialInstitutions on the basis of a minimum supervisory target of 150% of a minimum capital test (‘‘MCT’’) formula. AtDecember 31, 2017 Northbridge’s subsidiaries had a weighted average MCT ratio of 205% of the minimum statutorycapital required, compared to 211% at December 31, 2016.
In Bermuda, insurance and reinsurance companies are regulated by the Bermuda Monetary Authority and are subjectto the statutory requirements of the Bermuda Insurance Act 1978. There is a requirement to hold available statutoryeconomic capital and surplus equal to or in excess of an enhanced capital and target capital level as determinedunder the Bermuda Solvency Capital Requirement model. The target capital level is measured as 120% of theenhanced capital requirements. At December 31, 2017 Allied World was in compliance with Bermuda’s regulatoryrequirements.
The Lloyd’s market is subject to the solvency and capital adequacy requirements of the Prudential RegulatoryAuthority in the U.K. The capital requirements of Brit are based on the output of an internal model which reflects therisk profile of the business. At December 31, 2017 Brit’s available capital consisted of net tangible assets (total assetsless any intangible assets and all liabilities), subordinated debt and contingent funding in the form of letters of creditand amounted to $1,468.5 (December 31, 2016 – $1,457.3). This represented a surplus of $395.1 (December 31,2016 – $297.1) over the management capital requirements (capital required for business strategy and regulatoryrequirements), compared to Brit’s minimum targeted surplus of $200.0 (December 31, 2016 – $200.0).
180

In countries other than the U.S., Canada, the U.K. and Bermuda where the company operates, the company met orexceeded the applicable regulatory capital requirements at December 31, 2017.
The issuer credit ratings and financial strength ratings of Fairfax and its insurance and reinsurance operatingcompanies at December 31, 2017 were as follows:
StandardIssuer Credit Ratings A.M. Best & Poor’s Moody’s DBRS
BBBFairfax Financial Holdings Limited bbb BBB- Baa3 (high)
Financial Strength RatingsCrum & Forster Holdings Corp.(1) A A- Baa1 –Zenith National Insurance Corp.(1) A A- Baa1 –Odyssey Re Holdings Corp.(1) A A- A3 –Brit Limited(2) A A+ – –Northbridge General Insurance Corp. A A- A3 AFederated Insurance Company of Canada A A- – AAllied World Assurance Company Holdings, GmbH(1) A A- A3 –Wentworth Insurance Company Ltd. A – – –Falcon Insurance Company (Hong Kong) Limited – A- – –Advent Capital (Holdings) Ltd.(2) A A+ – –Polish Re A- – – –Colonnade Insurance S.A. A- – – –
(1) Financial strength ratings apply to the operating companies.
(2) Advent and Brit’s ratings are the A.M. Best and Standard & Poor’s ratings assigned to Lloyd’s.
During 2017 DBRS upgraded the Issuer Credit Rating of Fairfax to ‘‘BBB (high)’’ from ‘‘BBB’’ and the FinancialStrength Ratings of Northbridge General Insurance Corp. and Federated Insurance Company of Canada to ‘‘A’’ from‘‘A (low)’’. Standard & Poor’s and Moody’s downgraded the Financial Strength Ratings of Allied World’s operatingcompanies to ‘‘A-’’ and ‘‘A3’’ from ‘‘A’’ and ‘‘A2’’ respectively subsequent to the acquisition by Fairfax. A.M. Bestassigned a Financial Strength Rating of ‘‘A-’’ to Colonnade Insurance.
Book Value Per Share
Common shareholders’ equity at December 31, 2017 of $12,475.6 or $449.55 per basic share (excluding theunrecorded $1,233.0 pre-tax excess of fair value over the carrying value of investments in associates and certainconsolidated non-insurance subsidiaries) compared to $8,484.6 or $367.40 per basic share (excluding the unrecorded$1,001.7 pre-tax excess of fair value over the carrying value of investments in associates and certain consolidatednon-insurance subsidiaries) at December 31, 2016, representing an increase per basic share in 2017 of 22.4%(without adjustment for the $10.00 per common share dividend paid in the first quarter of 2017, or a increase of24.7% adjusted to include that dividend). During 2017 the number of basic shares increased primarily as a result ofthe issuance of 5,075,894 subordinate voting shares related to the acquisition of Allied World, partially offset by netrepurchases of 243,087 subordinate voting shares for treasury (for use in the company’s share-based payment awards)and purchases of 184,367 subordinate voting shares for cancellation. At December 31, 2017 there were27,751,073 common shares effectively outstanding.
181

FAIRFAX FINANCIAL HOLDINGS LIMITED
The company has issued and repurchased common shares in the most recent five years as follows:
Number of Averagesubordinate issue/repurchase Net proceeds/
Date voting shares price per share (repurchase cost)
2013 – issuance of shares 1,000,000 399.49 399.52013 – repurchase of shares (36) 402.78 –2014 – repurchase of shares (8) 430.98 –2015 – issuance of shares 1,169,294 502.01 587.02016 – issuance of shares 1,000,000 523.50 523.52016 – repurchase of shares (30,732) 458.81 (14.1)2017 – issuance of shares 5,084,961 431.94 2,196.42017 – repurchase of shares (184,367) 521.79 (96.2)
On September 28, 2017 the company commenced its normal course issuer bid by which it is authorized, until expiryof the bid on September 27, 2018, to acquire up to 2,672,504 subordinate voting shares, 601,538 Series C preferredshares, 344,111 Series D preferred shares, 396,713 Series E preferred shares, 357,204 Series F preferred shares,743,295 Series G preferred shares, 256,704 Series H preferred shares, 1,046,555 Series I preferred shares,153,444 Series J preferred shares, 950,000 Series K preferred shares and 920,000 Series M preferred shares,representing at that date approximately 10% of the public float in respect of the subordinate voting shares and 10%of the public float in respect of each series of preferred shares. Decisions regarding any future repurchases will bebased on market conditions, share price and other factors including opportunities to invest capital for growth. TheNotice of Intention to Make a Normal Course Issuer Bid is available by contacting the Corporate Secretary ofthe company.
Virtually all of the common share issuances in 2013, 2015 and 2016 were pursuant to public offerings. During 2013and 2014 the company repurchased 36 and 8 subordinate voting shares respectively for cancellation from formeremployees. During 2016 and 2017 the company repurchased 30,732 and 184,367 subordinate voting sharesrespectively for cancellation under the terms of its normal course issuer bids.
The company’s indirect ownership of its own shares through The Sixty Two Investment Company Limited results inan effective reduction of shares outstanding by 799,230, and this reduction has been reflected in the earnings pershare and book value per share figures.
The table below presents the pre-tax excess (deficiency) of fair value over carrying value of investments in associatesand certain non-insurance subsidiaries the company considers to be portfolio investments but that are required to beconsolidated under IFRS. The aggregate pre-tax excess of fair value over carrying value of these investments is notincluded in the calculation of book value per share.
December 31, 2017 December 31, 2016
Excess Excess(deficiency) of (deficiency) of
Fair Carrying fair value over Fair Carrying fair value overvalue value(1) carrying value value value(1) carrying value
Insurance and reinsurance associates 783.1 711.0 72.1 1,514.8 940.5 574.3Non-insurance associates(2) 2,041.2 1,776.0 265.2 1,440.6 1,452.5 (11.9)Cara(3) 486.3 519.5 (33.2) 433.9 454.9 (21.0)Grivalia Properties 568.6 573.2 (4.6) – – –Thomas Cook India 996.6 449.7 546.9 691.2 296.2 395.0Fairfax India 666.4 448.4 218.0 355.7 290.4 65.3Fairfax Africa 460.2 291.6 168.6 – – –
6,002.4 4,769.4 1,233.0 4,436.2 3,434.5 1,001.7
(1) The carrying values of Cara, Grivalia Properties, Thomas Cook India, Fairfax India and Fairfax Africa represent theirapproximate carrying values under the equity method of accounting.
(2) Excludes investments in associates held by Fairfax India and Fairfax Africa.
(3) Impairment tests for goodwill and intangible assets not subject to amortization were completed in 2017 and 2016. It wasconcluded that no impairment had occurred in each year.
182

Liquidity
Holding company cash and investments at December 31, 2017 totaled $2,368.4 ($2,356.9 net of $11.5 of holdingcompany short sale and derivative obligations) compared to $1,371.6 at December 31, 2016 ($1,329.4 net of $42.2 ofholding company short sale and derivative obligations).
Significant cash and investment movements at the holding company level during 2017 included the followingsignificant inflows: dividends from Fairfax Asia ($2,429.7 comprised of net proceeds from the partial sale of ICICILombard and the sale of First Capital), net proceeds of $509.5 from the issuance of Cdn$650.0 principal amount of4.25% unsecured senior notes due 2027 and dividends from other subsidiaries (primarily Zenith National ($102.0),OdysseyRe ($100.0) and Northbridge ($213.2)). The company’s remaining 9.9% equity interest in ICICI Lombard,previously reflected as an investment in associate within portfolio investments, was reclassified to common stock atFVTPL within holding company cash and investments (fair value of $549.0 at December 31, 2017).
Significant holding company outflows during 2017 included the following: cash consideration of $435.3 paid topartially fund the acquisition of Allied World, the redemption of Cdn$388.4 principal amount of 7.5% unsecuredsenior notes due 2019 ($340.6), payment of common and preferred share dividends ($282.0), repayment of theamount drawn on the revolving credit facility ($200.0), net cash paid of $179.0 with respect to the reset provisions oflong and short equity and equity index total return swaps (excluding the impact of collateral requirements), cashconsideration of $167.9 paid to acquire Fairfax Latam, repayment of purchase consideration payable upon maturity($124.9) and purchases of subordinate voting shares for cancellation under the terms of normal course issuerbids ($96.2).
The carrying value of holding company cash and investments was also affected by the following: receipt ofinvestment management and administration fees, disbursements associated with corporate overhead expenses andinterest paid on long term debt. The carrying value of holding company cash and investments will vary with changesin the fair values of those investments (including derivative contracts that may have collateral and cash settlementrequirements).
The company believes that holding company cash and investments, net of holding company short sale andderivative obligations at December 31, 2017 of $2,356.9 provides adequate liquidity to meet the holding company’sknown commitments in 2018. The holding company expects to continue to receive investment management andadministration fees from its insurance and reinsurance subsidiaries, investment income on its holdings of cash andinvestments, and dividends from its insurance and reinsurance subsidiaries. To further augment its liquidity, theholding company can draw upon its $2.0 billion unsecured revolving credit facility (for further details related to therevolving credit facility, refer to note 15 (Borrowings) to the consolidated financial statements for the year endedDecember 31, 2017).
The holding company’s known significant commitments for 2018 consist of payment of the $283.2 dividend oncommon shares ($10.00 per share paid January 2018), interest and corporate overhead expenses, preferred sharedividends, income tax payments, the purchase prices related to the acquisitions of certain businesses of Carillion andthe insurance operations of AIG in Uruguay (completed January 31, 2018) and Venezuela, and potential cashoutflows related to derivative contracts.
During 2017 subsidiary cash and short term investments (including cash and short term investments pledged forshort sale and derivative obligations) increased by $7,675.8 primarily reflecting the consolidation of the cash andshort term investments of Allied World ($4,509.0) and Fairfax Latam ($77.2), the proceeds received from net sales oflong dated U.S. state and municipal and corporate and other bonds (primarily corporate and other bonds that werepart of the acquisition of Allied World) where a portion of the proceeds was retained in cash or invested in short terminvestments, and net proceeds received from Fairfax Africa’s initial public offering, partially offset by the impact ofthe divestiture of the cash and short term investments of First Capital ($362.4).
The insurance and reinsurance subsidiaries may experience cash inflows or outflows on occasion related to theirderivative contracts, including collateral requirements. During 2017 the insurance and reinsurance subsidiaries paidnet cash of $285.0 (2016 – $814.4) in connection with long and short equity and equity index total return swaps(excluding the impact of collateral requirements). The closure in the fourth quarter of 2016 of all of the company’sshort positions effected through total return swaps in the Russell 2000, S&P 500 and S&P/TSX 60 equity indexessignificantly reduced cash flow volatility related to derivatives in 2017.
183

FAIRFAX FINANCIAL HOLDINGS LIMITED
The non-insurance companies have principal repayments coming due in 2018 of $855.9 primarily related to FairfaxIndia and Fairfax Africa term loans. Borrowings of the non-insurance companies are non-recourse to the holdingcompany and are generally expected to be settled through a combination of refinancing and operating cash flows.
The following table presents major components of cash flows for the years ended December 31, 2017 and 2016:
2017 2016
Operating activitiesCash provided by operating activities before the undernoted 22.2 138.9Net sales of investments classified as FVTPL 2,678.4 1,119.3
Investing activitiesPurchases of investments in associates (1,026.5) (735.3)Sales of investments in associates 1,014.9 45.8Purchases of subsidiaries, net of cash acquired (1,107.7) (779.1)Sale of subsidiary, net of cash divested 640.4 –Net purchases of premises and equipment and intangible assets (415.2) (208.3)Decrease in restricted cash for purchase of subsidiary – 6.5
Financing activitiesNet proceeds from borrowings – holding company and insurance and reinsurance
companies 577.0 637.7Repayment of borrowings – holding company and insurance and reinsurance companies (483.7) (5.4)Net borrowings from (repayments to) holding company revolving credit facility (200.0) 200.0Net proceeds from borrowings – non-insurance companies 500.6 360.5Repayment of borrowings – non-insurance companies (268.7) (38.9)Net borrowings from revolving credit facilities – non-insurance companies 193.7 193.6Increase in restricted cash related to financing activities (150.8) (18.9)Issuances of subordinate voting shares – 523.5Purchases of subordinate voting shares for treasury (140.5) (64.2)Purchases of subordinate voting shares for cancellation (96.2) (14.1)Issuances of subsidiary common shares to non-controlling interests 2,223.2 157.1Purchases of subsidiary common shares from non-controlling interests (140.3) (87.2)Sales of subsidiary common shares to non-controlling interests 96.8 12.7Common and preferred share dividends paid (282.0) (271.8)Dividends paid to non-controlling interests (67.5) (41.2)
Increase in cash and cash equivalents during the year 3,568.1 1,131.2
Cash provided by operating activities (excluding net purchases of investments classified as FVTPL) decreased from$138.9 in 2016 to $22.2 in 2017, principally reflecting higher net paid losses and expenses and lower interest anddividends received, partially offset by higher net premium collections and lower income taxes paid. Refer to note 27(Supplementary Cash Flow Information) to the consolidated financial statements for the year ended December 31,2017 for details of net purchases of securities classified as FVTPL.
Purchases of investments in associates of $1,026.5 in 2017 primarily reflected investments in Astarta (28.1%),Farmers Edge (46.1%), Sigma (81.2%), Bangalore Airport (48.0% by Fairfax India), Atlas Mara (43.3% by FairfaxAfrica) and the purchase of an additional indirect interest in APR Energy (ownership increased by 22.9%). Purchasesof investments in associates of $735.3 in 2016 primarily reflected the purchase of an additional ownership interest inICICI Lombard (ownership increased by 9.0%), an additional indirect interest in APR Energy, an investment inFairchem (44.7% by Fairfax India), and the acquisition of indirect interests in Eurolife (40.0%) and Peak Achievement(38.2%). Sales of associates of $1,014.9 in 2017 primarily reflected net proceeds received on the sale of a 24.3% equityinterest in ICICI Lombard ($908.5) and distributions received from the company’s insurance and non-insuranceassociates.
Purchases of subsidiaries, net of cash acquired of $1,107.7 in 2017 primarily related to the acquisitions of AlliedWorld and Fairfax Latam (100%), an additional investment in Grivalia Properties (ownership increased by 10.3%),and the acquisition of Saurashtra Freight (51.0% by Fairfax India). Purchases of subsidiaries, net of cash acquired of$779.1 in 2016 primarily related to the acquisitions of St-Hubert (100% by Cara), Original Joe’s (89.2% by Cara),
184

AMAG (80.0%), Privi Organics (50.8% by Fairfax India), Bryte Insurance (100%) and Golf Town (60.0%). Sale ofsubsidiary, net of cash divested in 2017 related to the divestiture of a 97.7% equity interest in First Capital.
Net proceeds from borrowings – holding company and insurance and reinsurance companies of $577.0 in 2017primarily reflected net proceeds from the issuance of Cdn$650.0 principal amount of 4.25% unsecured senior notesdue December 6, 2027. Net proceeds from borrowings – holding company and insurance and reinsurance companiesof $637.7 in 2016 primarily reflected net proceeds from the issuance of Cdn$400.0 principal amount of 4.50%unsecured senior notes due March 22, 2023 and Cdn$450.0 principal amount of 4.70% unsecured senior notes dueDecember 16, 2026. Repayment of borrowings – holding company and insurance and reinsurance companies of$483.7 in 2017 primarily reflected the early redemption of Cdn$388.4 principal amount of 7.5% unsecured seniornotes due 2019 and repayment of $124.9 principal amount of purchase consideration payable upon maturity.
Net proceeds from borrowings by non-insurance companies of $500.6 in 2017 primarily reflected net proceeds fromFairfax India’s term loan ($400.0). Repayment of borrowings by non-insurance companies of $268.7 in 2017primarily reflected Fairfax India’s repayment of a previous term loan ($225.0). Net borrowings from revolving creditfacilities and short term loans by non-insurance companies of $193.7 in 2017 primarily reflected proceeds fromFairfax Africa’s term loan ($150.0) that required cash collateral of $150.0 (included in restricted cash related tofinancing activities). Net proceeds from borrowings – non-insurance companies of $360.5 in 2016 reflected netproceeds from Cara’s floating rate term loan of $115.2 (Cdn $150.0) to finance its acquisition of St-Hubert and FairfaxIndia’s term loan ($225.0). Net borrowings from revolving credit facilities – non-insurance companies of $193.6 in2016 principally reflected Cara’s borrowing on its floating rate revolving credit facility to finance its acquisitions ofSt-Hubert and Original Joe’s.
Purchases of subordinate voting shares for treasury in 2017 of $140.5 (2016 – $64.2) were for the company’s share-based payment awards. Issuance of subsidiary common shares to non-controlling interests of $2,223.2 in 2017primarily reflected certain co-investors acquiring an indirect equity interest in Allied World, the public offerings byFairfax Africa and Fairfax India and the issuance of common shares by Quess. Purchases of subsidiary common sharesfrom non-controlling interests of $140.3 in 2017 primarily reflected Mosaic Capital’s redemption of certain of itspreferred shares and other equity instruments. Sales of subsidiary common shares to non-controlling interests of$96.8 in 2017 reflected Thomas Cook India’s sale of a 5.4% equity interest in Quess.
Issuance of subordinate voting shares of $523.5 in 2016 reflected net proceeds received from the underwritten publicoffering of 1.0 million subordinate voting shares. Issuance of subsidiary common shares to non-controlling interestsof $157.1 in 2016 primarily reflected Cara’s issuance of subordinate voting shares to finance its acquisition ofSt-Hubert and the issuance of common shares by Quess through its initial public offering. Purchases of subsidiarycommon shares from non-controlling interests of $87.2 in 2016 primarily reflected the repurchase by Brit of itscommon shares from OMERS and the repurchase of subordinate voting shares for cancellation by Fairfax India.
Contractual Obligations
The following table sets out the expected payment schedule of the company’s significant contractual obligations asat December 31, 2017:
Less than More than1 year 1-3 years 3-5 years 5 years Total
Provision for losses and loss adjustment expenses 7,453.3 8,272.0 4,557.3 8,328.2 28,610.8Borrowings – principal 1,005.1 877.5 1,556.8 2,957.5 6,396.9Borrowings – interest 315.7 542.9 381.5 745.6 1,985.7Operating leases 188.5 326.6 252.5 458.2 1,225.8
8,962.6 10,019.0 6,748.1 12,489.5 38,219.2
For further detail on the maturity profile of the company’s financial liabilities, please see the heading Liquidity Riskin note 24 (Financial Risk Management) to the consolidated financial statements for the year endedDecember 31, 2017.
185

FAIRFAX FINANCIAL HOLDINGS LIMITED
Contingencies and Commitments
For a full description of these matters, please see note 20 (Contingencies and Commitments) to the consolidatedfinancial statements for the year ended December 31, 2017.
Accounting and Disclosure Matters
Management’s Evaluation of Disclosure Controls and Procedures
Under the supervision and with the participation of the company’s management, including the company’s CEO andCFO, the company conducted an evaluation of the effectiveness of its disclosure controls and procedures as ofDecember 31, 2017, as required by Canadian securities legislation. Disclosure controls and procedures are designedto ensure that the information required to be disclosed by the company in the reports it files or submits undersecurities legislation is recorded, processed, summarized and reported on a timely basis and that such information isaccumulated and reported to management, including the company’s CEO and CFO, as appropriate, to allow requireddisclosures to be made in a timely fashion. Based on their evaluation, the CEO and CFO have concluded that as ofDecember 31, 2017, the company’s disclosure controls and procedures were effective.
Management’s Report on Internal Control Over Financial Reporting
The company’s management is responsible for establishing and maintaining adequate internal control over financialreporting (as defined in Rule 13a-15(f) under the Securities Exchange Act of 1934 and under NationalInstrument 52-109). The company’s internal control over financial reporting is a process designed to providereasonable assurance regarding the reliability of financial reporting and the preparation of financial statements forexternal purposes in accordance with International Financial Reporting Standards (‘‘IFRS’’) as issued by theInternational Accounting Standards Board (‘‘IASB’’). A company’s internal control over financial reporting includesthose policies and procedures that: (i) pertain to the maintenance of records that, in reasonable detail, accurately andfairly reflect the transactions and dispositions of the assets of the company; (ii) provide reasonable assurance thattransactions are recorded as necessary to permit preparation of financial statements in accordance with IFRS as issuedby the IASB, and that receipts and expenditures of the company are being made only in accordance withauthorizations of management and directors of the company; and (iii) provide reasonable assurance regardingprevention or timely detection of unauthorized acquisition, use, or disposition of the company’s assets that couldhave a material effect on the financial statements.
Because of its inherent limitations, internal control over financial reporting may not prevent or detectmisstatements. Also, projections of any evaluation of effectiveness to future periods are subject to the risk thatcontrols may become inadequate because of changes in conditions, or that the degree of compliance with thepolicies or procedures may deteriorate.
The company’s management assessed the effectiveness of the company’s internal control over financial reporting asof December 31, 2017. In making this assessment, the company’s management used the criteria set forth by theCommittee of Sponsoring Organizations of the Treadway Commission (‘‘COSO’’) in Internal Control – IntegratedFramework (2013). Based on this assessment, except as described below under ‘‘Limitation on scope of design andevaluation’’, the company’s management, including the CEO and CFO, concluded that, as of December 31, 2017, thecompany’s internal control over financial reporting was effective based on the criteria in Internal Control – IntegratedFramework (2013) issued by COSO.
Pursuant to the requirements of the U.S. Securities Exchange Act, the effectiveness of the company’s internal controlover financial reporting as of December 31, 2017 has been audited by PricewaterhouseCoopers LLP, an independentregistered public accounting firm, as stated in its report which appears within this Annual Report.
Limitation on scope of design and evaluation
On July 6, 2017 the company completed the acquisition of Allied World Assurance Company Holdings, AG, whichwas subsequently renamed Allied World Assurance Company Holdings, GmbH (‘‘Allied World’’). Management hasdetermined to limit the scope of the design and evaluation of the company’s internal control over financial reportingto exclude the controls, policies and procedures of Allied World, the results of which are included in the consolidatedfinancial statements of the company for the year ended December 31, 2017 since the acquisition date. The scopelimitation is in accordance with Canadian and U.S. securities laws, which allow an issuer to limit its design andevaluation of internal control over financial reporting to exclude the controls, policies and procedures of a company
186

acquired not more than 365 days before the end of the financial period to which the applicable certifications relate.The operations of Allied World represented 6.5% of the company’s consolidated revenue for the year endedDecember 31, 2017 and represented 22.8% and 23.9% of the company’s consolidated assets and liabilitiesrespectively as at December 31, 2017. In addition, the table that follows presents a summary of financial informationfor Allied World.
For the periodJuly 6, 2017 to
December 31, 2017
Revenue 1,050.5
Net loss (555.4)
As atDecember 31, 2017
AssetsInsurance contract receivables 1,336.7Portfolio investments 8,162.9Deferred premium acquisition costs 146.6Recoverable from reinsurers 2,879.6Goodwill and intangible assets 1,702.6Other assets 356.0
14,584.4
LiabilitiesAccounts payable and accrued liabilities 272.2Income taxes payable 1.7Short sale and derivative obligations 0.6Due to affiliates 6.0Funds withheld payable to reinsurers 270.3Insurance contract liabilities 9,440.9Deferred income taxes 67.5Borrowings 878.0
10,937.2
Equity 3,647.2
14,584.4
Critical Accounting Estimates and Judgments
Please refer to note 4 (Critical Accounting Estimates and Judgments) to the consolidated financial statements for theyear ended December 31, 2017.
Significant Accounting Policy Changes
There were no significant accounting policy changes during 2017. Please refer to note 3 (Summary of SignificantAccounting Policies) to the consolidated financial statements for the year ended December 31, 2017 for a detaileddescription of the company’s accounting policies.
Future Accounting Changes
Certain new IFRS standards may have a significant impact on the company’s consolidated financial reporting in thefuture. Each of those standards will require a moderate to high degree of implementation effort within the next threeyears as described below. The company does not expect to adopt any of these new standards in advance of theirrespective effective dates. New standards and amendments that have been issued but are not yet effective are alsodescribed in note 3 (Summary of Significant Accounting Policies) to the consolidated financial statements for theyear ended December 31, 2017.
187

FAIRFAX FINANCIAL HOLDINGS LIMITED
IFRS 9 Financial Instruments (‘‘IFRS 9’’)
In July 2014 the IASB issued the complete version of IFRS 9 which will supersede the 2010 version of IFRS 9 currentlyapplied by the company (‘‘IFRS 9 (2010)’’). IFRS 9 is effective for annual periods beginning on or after January 1,2018, with retrospective application, and includes requirements for the classification and measurement of financialassets and liabilities, an expected credit loss model that replaces the existing incurred loss impairment model, andnew hedge accounting guidance.
The company evaluated the impact of IFRS 9 by assessing its business models and the cash flow characteristics of itsfinancial assets to determine their appropriate classifications under the new standard, and is nearing completion ofthat analysis. The company expects equities and derivative instruments held within the company’s investmentportfolio to continue to be classified as FVTPL, and the classification of financial liabilities and its hedge of netinvestment to also remain substantially unchanged from IFRS 9 (2010). The company continues to monitor andconsider evolving guidance and interpretations related to IFRS 9 as it works through the classification analysis for itsinvestments in debt instruments.
IFRS 15 Revenue from Contracts with Customers (‘‘IFRS 15’’)
In May 2014 the IASB issued IFRS 15 which introduces a single model for recognizing revenue from contracts withcustomers. IFRS 15 excludes insurance contracts and financial instruments from its scope and is applicable primarilyto the company’s non-insurance companies. In April 2016 the IASB issued amendments to clarify certain aspects ofIFRS 15 and to provide additional practical expedients upon transition. The standard is effective for annual periodsbeginning on or after January 1, 2018, with retrospective application.
During 2016 the company developed a detailed project plan for the implementation of IFRS 15 and conducted animpact assessment, involving all of its significant operating companies, that focused on identifying, by industry andkey revenue streams, potential measurement differences under IFRS 15 compared to current accounting policies.Further study of a limited number of potential issues for certain of the non-insurance companies, particularly in therestaurant and staffing industries, was undertaken in 2017. Based on the cumulative work performed, the companyhas substantially completed its analysis of the accounting requirements under IFRS 15 and does not anticipaterecording any significant transition adjustments upon adoption on January 1, 2018.
IFRS 16 Leases (‘‘IFRS 16’’)
In January 2016 the IASB issued IFRS 16 which largely eliminates the distinction between finance and operatingleases for lessees. With limited exceptions, a lessee will be required to recognize a right-of-use asset and a liability forits obligation to make lease payments. The standard is effective for annual periods beginning on or after January 1,2019, with a choice of modified retrospective or full retrospective application.
During 2017 the company developed an implementation plan for IFRS 16 and had its operating companiesundertake a detailed inventory of leases to determine the characteristics of their leases and the completeness ofhistoric lease data required for IFRS 16 transition calculations. Further work will be undertaken in 2018 to developIFRS 16 lease liability calculations and to identify and implement enhancements to current processes andinformation systems that may be required to embed such calculations within the company’s financial reporting.
IFRS 17 Insurance Contracts (‘‘IFRS 17’’)
In May 2017 the IASB issued IFRS 17, a comprehensive standard that establishes principles for the recognition,measurement, presentation and disclosure of insurance contracts. The measurement approach is based on thefollowing: (i) a current, unbiased probability-weighted estimate of future cash flows expected to arise as the insurerfulfills the contract; (ii) the effect of the time value of money; (iii) a risk adjustment that measures the effects ofuncertainty about the amount and timing of future cash flows; and (iv) a contractual service margin whichrepresents the unearned profit in a contract (that is recognized in net earnings as the insurer fulfills its performanceobligations under the contract). Estimates are required to be re-measured each reporting period. In addition, asimplified measurement approach is permitted for short-duration contracts in which the coverage period isapproximately one year or less. The standard is effective for annual periods beginning on or after January 1, 2021,with retrospective application and some practical expedients available on adoption.
188

The company is currently evaluating the impact of the new standard on its financial reporting, and potentially, itsbusiness activities. The new measurement approach and its need for current estimates is expected to significantlyincrease operational complexity compared to existing practice. The use of different measurement models dependingon whether an insurance contract is considered short-duration or long-duration under the standard presents certainimplementation challenges and the presentation requirements significantly alter the disclosure of profit and lossfrom insurance contracts in the consolidated financial statements. The company is devoting significant effort to theanalysis of IFRS 17, including education workshops and impact assessments at its largest insurance and reinsurancecompanies. Findings from those impact assessments will support implementation planning and analysis for allinsurance and reinsurance operations in 2018.
Risk Management
Overview
The primary goals of the company’s financial risk management program are to ensure that the outcomes of activitiesinvolving elements of risk are consistent with the company’s objectives and risk tolerance, while maintaining anappropriate balance between risk and reward and protecting the company’s consolidated balance sheet from eventsthat have the potential to materially impair its financial strength. Please refer to note 24 (Financial RiskManagement) to the consolidated financial statements for the year ended December 31, 2017 for a detaileddiscussion of the company’s risk management policies.
Issues and Risks
The following issues and risks, among others, should be considered in evaluating the outlook of the company. Forfurther detail about the issues and risks relating to the company, please see Risk Factors in Fairfax’s most recent ShortForm Base Shelf Prospectus and Supplements filed with the securities regulatory authorities in Canada, which areavailable on SEDAR at www.sedar.com.
Claims Reserves
Reserves are maintained to cover the estimated ultimate unpaid liability for losses and loss adjustment expenses withrespect to reported and unreported claims incurred as of the end of each accounting period. The company’s success isdependent upon its ability to accurately assess the risks associated with the businesses being insured or reinsured.Failure to accurately assess the risks assumed may lead to the setting of inappropriate premium rates and establishingreserves that are inadequate to cover losses. This could adversely affect the company’s net earnings and financialcondition.
Reserves do not represent an exact calculation of liability, but instead represent estimates at a given point in timeinvolving actuarial and statistical projections of the company’s expectations of the ultimate settlement andadministration costs of claims incurred. Establishing an appropriate level of claims reserves is an inherentlyuncertain process. Both proprietary and commercially available actuarial models, as well as historical insuranceindustry loss development patterns, are utilized to establish appropriate claims reserves. The company’smanagement of pricing risk is discussed in note 24 (Financial Risk Management), and management of claims reservesis discussed in note 4 (Critical Accounting Estimates and Judgments) and note 8 (Insurance Contract Liabilities), tothe consolidated financial statements for the year ended December 31, 2017.
Catastrophe Exposure
The company’s insurance and reinsurance operations are exposed to claims arising out of catastrophes. Catastrophescan be caused by various events, including natural events such as hurricanes, windstorms, earthquakes, tornadoes,hailstorms, severe winter weather and fires, and unnatural events such as terrorist attacks and riots. The incidenceand severity of catastrophes are inherently unpredictable.
The extent of losses from a catastrophe is a function of both the total amount of insured exposure in the area affectedby the event and the severity of the event. Most catastrophes are restricted to small geographic areas; however,hurricanes, windstorms and earthquakes may produce significant damage in large, heavily populated areas.Catastrophes can cause losses in a variety of property and casualty lines, including losses relating to businessinterruptions occurring in the same geographic area as the catastrophic event or in the other geographic areas. It ispossible that a catastrophic event or multiple catastrophic events could have a material adverse effect upon the
189
FAIRFAX FINANCIAL HOLDINGS LIMITED
company’s financial condition, profitability or cash flows. The company believes that increases in the value andgeographic concentration of insured property, higher construction costs due to labour and raw material shortagesfollowing a significant catastrophe event, and climate change could increase the severity of claims from catastrophicevents in the future. The company’s management of catastrophe risk is discussed in note 24 (Financial RiskManagement) to the consolidated financial statements for the year ended December 31, 2017.
Cyclical Nature of the Property & Casualty Business
The financial performance of the insurance and reinsurance industries has historically tended to fluctuate due tocompetition, frequency of occurrence or severity of catastrophic events, levels of capacity, general economicconditions and other factors. Demand for insurance and reinsurance is influenced significantly by underwritingresults of primary insurers and prevailing general economic conditions. Factors such as changes in the level ofemployment, wages, consumer spending, business investment and government spending, the volatility andstrength of the global capital markets and inflation or deflation all affect the business and economic environmentand, ultimately, the demand for insurance and reinsurance products, and therefore may affect the company’s netearnings, financial position or cash flows.
The property and casualty insurance business historically has been characterized by periods of intense pricecompetition due to excess underwriting capacity, as well as periods when shortages of underwriting capacity havepermitted attractive premium levels. The company expects to continue to experience the effects of this cyclicality,which, during down periods, could reduce the premiums the company writes and could harm its financial position,profitability or cash flows.
In the reinsurance industry, the supply of reinsurance is related to prevailing prices and levels of surplus capacitythat, in turn, may fluctuate in response to changes in rates of return being realized. It is possible that premium ratesor other terms and conditions of trade could vary in the future, that the present level of demand will not continuebecause insurers, including the larger insurers created by industry consolidation, may require less reinsurance or thatthe present level of supply of reinsurance could increase as a result of capital provided by existing reinsurers oralternative forms of reinsurance capacity entering the market from recent or future market entrants. If any of theseevents transpire, the profitability of the company’s reinsurance business could be adversely affected.
The company actively manages its operations to withstand the cyclical nature of the property and casualty businessby maintaining sound liquidity and strong capital management as discussed in note 24 (Financial Risk Management)to the consolidated financial statements for the year ended December 31, 2017.
Investment Portfolio
Investment returns are an important part of the company’s overall profitability as the company’s operating resultsdepend in part on the performance of its investment portfolio. The company’s investment portfolio includes bondsand other debt instruments, common stocks, preferred stocks, equity-related securities and derivative instruments.Accordingly, fluctuations in the fixed income or equity markets could impair the company’s financial condition,profitability or cash flows. Investment income is derived from interest and dividends, together with net gains orlosses on investments. The portion derived from net gains or losses on investments generally fluctuates from year toyear and is typically a less predictable source of investment income than interest and dividends, particularly in theshort term. The return on the portfolio and the risks associated with the investments are affected by the asset mix,which can change materially depending on market conditions.
The ability of the company to achieve its investment objectives is affected by general economic conditions that arebeyond its control. General economic conditions can adversely affect the markets for interest-rate-sensitivesecurities, including the extent and timing of investor participation in such markets, the level and volatility ofinterest rates and, consequently, the value of fixed income securities. Interest rates are highly sensitive to manyfactors, including governmental monetary policies, domestic and international economic and political conditionsand other factors beyond the company’s control. General economic conditions, stock market conditions and manyother factors can also adversely affect the equity markets and, consequently, the value of the equities owned. Inaddition, defaults by third parties who fail to pay or perform on their obligations could reduce the company’sinvestment income and net gains on investment or result in investment losses. The company’s management of creditrisk, liquidity risk, market risk and interest rate risk is discussed in note 24 (Financial Risk Management) to theconsolidated financial statements for the year ended December 31, 2017.
190

Derivative Instruments
The company may be a counterparty to various derivative instruments, primarily for general protection againstdeclines in the fair value of its financial assets. Derivative instruments may be used to manage or reduce risks or as acost-effective way to synthetically replicate the investment characteristics of an otherwise permitted investment.The market value and liquidity of these investments are volatile and may vary dramatically up or down in shortperiods, and their ultimate value will therefore only be known upon their disposition or settlement.
The use of derivative instruments is governed by the company’s investment policies and exposes the company to anumber of risks, including credit risk, interest rate risk, liquidity risk, inflation risk, market risk, basis risk andcounterparty risk, although these risks are diminished because the company’s principal use of derivative instrumentsis to hedge exposures to various risks. The company endeavors to limit counterparty risk through diligent selection ofcounterparties to its derivative instruments and through the terms of agreements negotiated with counterparties.Pursuant to these agreements, both parties are required to deposit eligible collateral in collateral accounts for eitherthe benefit of the company or the counterparty depending on the then current fair value or change in the fair valueof the derivative contract.
The company may not be able to realize its investment objectives with respect to derivative instruments, whichcould have a material adverse effect upon its financial position, profitability or cash flows. The company’s use ofderivatives is discussed in note 7 (Short Sales and Derivatives) and management of credit risk, liquidity risk, marketrisk and interest rate risk is discussed in note 24 (Financial Risk Management) to the consolidated financialstatements for the year ended December 31, 2017.
Economic Hedging Strategies
The company may use derivative instruments from time to time to manage or reduce its exposure to credit risk andvarious market risks, including interest rate risk, equity market risk, inflation/deflation risk and foreign currency risk.The company may choose to hedge risks associated with a specific financial instrument, asset or liability or at amacro level to hedge systemic financial risk and the impact of potential future economic crisis and credit relatedproblems on its operations and the value of its financial assets. Credit default swaps, total return swaps and consumerprice index-linked derivative instruments have typically been used to hedge macro level risks, although the companydoes not expect to undertake hedges of such risks in the foreseeable future. The company’s use of derivatives isdiscussed in note 7 (Short Sales and Derivatives) to the consolidated financial statements for the year endedDecember 31, 2017.
The company’s derivative instruments may expose it to basis risk. Basis risk is the risk that the fair value or cash flowsof derivative instruments applied as economic hedges will not experience changes in exactly the opposite directionsfrom those of the underlying hedged exposure. This imperfect correlation may adversely impact the net effectivenessof the hedge and may diminish the financial viability of maintaining the hedging strategy and therefore adverselyimpact the company’s financial condition, profitability or cash flows.
The company regularly monitors the prospective and retrospective effectiveness of any hedging instruments and willadjust the amount and/or type of hedging instruments as required to achieve its risk management goals. Themanagement of credit risk and various market risks is discussed in note 24 (Financial Risk Management) to theconsolidated financial statements for the year ended December 31, 2017.
Latent Claims
The company has established loss reserves for asbestos, environmental and other latent claims that represent its bestestimate of ultimate claims and claims adjustment expenses based upon known facts and current law. As a result ofsignificant issues surrounding liabilities of insurers, risks inherent in major litigation and diverging legalinterpretations and judgments in different jurisdictions, actual liability for these types of claims could exceed the lossreserves set by the company by an amount that could be material to the company’s financial condition, profitabilityor cash flows in future periods.
The company’s exposure to asbestos, environmental and other latent claims is discussed in the Asbestos, Pollutionand Other Hazards section of this MD&A. The company’s management of reserving risk is discussed in note 24(Financial Risk Management) and in note 8 (Insurance Contract Liabilities) to the consolidated financial statementsfor the year ended December 31, 2017.
191

FAIRFAX FINANCIAL HOLDINGS LIMITED
Recoverable from Reinsurers and Insureds
Most insurance and reinsurance companies reduce their exposure to any individual claim by reinsuring amounts inexcess of their maximum desired retention. Reinsurance is an arrangement in which an insurer, called the cedant,transfers insurance risk to another insurer, called the reinsurer, which accepts the risk in return for a premiumpayment. This third party reinsurance does not relieve the company, as a cedant, of its primary obligation to theinsured. Recoverable from reinsurers balances may become an issue mainly due to reinsurer solvency and creditconcerns, due to the potentially long time period over which claims may be paid and the resulting recoveries arereceived from the reinsurers, or due to policy disputes. If reinsurers are unwilling or unable to pay amounts due underreinsurance contracts, the company will incur unexpected losses and its operations, financial positions and cashflows will be adversely affected. The credit risk associated with the company’s reinsurance recoverable balances isdescribed in note 24 (Financial Risk Management) to the consolidated financial statements for the year endedDecember 31, 2017 and in the Recoverable from Reinsurers section of this MD&A.
The company’s insurance and reinsurance companies write certain insurance policies, such as large deductiblepolicies (policies where the insured retains a specific amount of any potential loss), in which the insured mustreimburse the company’s insurance and reinsurance companies for certain losses. Accordingly, the company’sinsurance and reinsurance companies bear credit risk on these policies as there is no assurance that the insureds willprovide reimbursement on a timely basis or at all.
Acquisitions and Divestitures
The company may periodically and opportunistically acquire other insurance and reinsurance companies or executeother strategic initiatives developed by management. Although the company undertakes due diligence prior to thecompletion of an acquisition, it is possible that unanticipated factors could arise and there is no assurance that theanticipated financial or strategic objectives following an integration effort or the implementation of a strategicinitiative will be achieved which could adversely affect the company’s financial condition, profitability or cash flows.The company may periodically explore opportunities to make strategic investments in all or part of certainbusinesses or companies. Acquisitions may involve a number of special risks, including failure to retain keypersonnel, unanticipated events or circumstances and legal liabilities, some or all of which could have a materialadverse effect on the company’s business, results of operations and financial position. The company cannot be surethat any acquired businesses will achieve the anticipated revenues, income and synergies. Failure on the company’spart to manage its acquisition strategy successfully could have a material adverse effect on its business, results ofoperations and financial position. The company cannot be sure that it will be able to identify appropriate targets,profitably manage additional businesses or successfully integrate any acquired business into its operations.
The strategies and performance of operating companies, and the alignment of those strategies throughout theorganization, are regularly assessed through various processes involving senior management and the company’sBoard of Directors.
Ratings
Financial strength and credit ratings by the major North American rating agencies are important factors inestablishing competitive position for insurance and reinsurance companies. Third-party rating agencies assess andrate the claims-paying ability of reinsurers and insurers based upon the criteria of such rating agencies. Periodicallythe rating agencies evaluate the company’s insurance and reinsurance subsidiaries to confirm that they continue tomeet the criteria of the ratings previously assigned to them. The claims-paying ability ratings assigned by ratingagencies to reinsurance or insurance companies represent independent opinions of financial strength and ability tomeet policyholder obligations. A downgrade in these ratings could lead to a significant reduction in the number ofinsurance policies the company’s insurance subsidiaries write and could cause early termination of contracts writtenby the company’s reinsurance subsidiaries or a requirement for them to post collateral at the direction of theircounterparts. A downgrade of the company’s long term debt ratings by the major rating agencies could require thecompany and/or its subsidiaries to accelerate their cash settlement obligations for certain derivative transactions towhich they are a party, and could result in the termination of certain other derivative transactions. In addition, adowngrade of the company’s credit rating may affect the cost and availability of unsecured financing. Ratings aresubject to periodic review at the discretion of each respective rating agency and may be revised downward or revokedat their sole discretion. Rating agencies may also increase their scrutiny of rated companies, revise their rating
192

standards or take other action. The company has dedicated personnel that manage the company’s relationships withits various rating agencies.
Competition
The property and casualty insurance industry and the reinsurance industry are both highly competitive, and willlikely remain highly competitive in the foreseeable future. Competition in these industries is based on many factors,including premiums charged and other terms and conditions offered, products and services provided, commissionstructure, financial ratings assigned by independent rating agencies, speed of claims payment, reputation, sellingeffort, perceived financial strength and the experience of the insurer or reinsurer in the line of insurance orreinsurance to be written. The company competes with a large number of Canadian, U.S. and foreign insurers andreinsurers, as well as certain underwriting syndicates, some of which have greater financial, marketing andmanagement resources than the company. In addition, some financial institutions, such as banks, are now able tooffer services similar to those offered by the company’s reinsurance subsidiaries while in recent years, capital marketparticipants have also created alternative products that are intended to compete with reinsurance products.
Consolidation within the insurance industry could result in insurance and reinsurance market participants usingtheir market power to implement price reductions. If competitive pressures compel the company to reduce its prices,the company’s operating margins would decrease. As the insurance industry consolidates, competition for customerscould become more intense and the importance of acquiring and properly servicing each customer could becomegreater, causing the company to incur greater expenses relating to customer acquisition and retention and furtherreducing operating margins. The company’s management of pricing risk is discussed in note 24 (Financial RiskManagement) to the consolidated financial statements for the year ended December 31, 2017.
Emerging Claim and Coverage Issues
The provision for claims is an estimate and may be found to be deficient, perhaps very significantly, in the future as aresult of unanticipated frequency or severity of claims or for a variety of other reasons including unpredictable juryverdicts, expansion of insurance coverage to include exposures not contemplated at the time of policy issue (as wasthe case with asbestos and pollution exposures) and extreme weather events. Unanticipated developments in the lawas well as changes in social and environmental conditions could result in unexpected claims for coverage underinsurance and reinsurance contracts. With respect to casualty lines of business, these legal, social and environmentalchanges may not become apparent until some time after their occurrence.
The full effects of these and other unforeseen emerging claim and coverage issues are extremely hard to predict. As aresult, the full extent of the company’s liability under its coverages, and in particular its casualty insurance policiesand reinsurance contracts, may not be known until many years after a policy or contract is issued. The company’sexposure to this uncertainty is greatest in its ‘‘long-tail’’ casualty lines of business where claims can typically be madefor many years, rendering them more susceptible to these trends than in the property insurance lines of business,which is more typically ‘‘short-tail’’. In addition, the company could be adversely affected by the growing trend ofplaintiffs targeting participants in the property-liability insurance industry in purported class action litigationrelating to claims handling and other practices.
The company seeks to limit its loss exposure by employing a variety of policy limits and other terms and conditionsand through prudent underwriting of each program written. Loss exposure is also limited by geographicdiversification. The company’s management of reserving risk is discussed in note 24 (Financial Risk Management)and in note 8 (Insurance Contract Liabilities) to the consolidated financial statements for the year endedDecember 31, 2017 and in the Asbestos, Pollution and Other Hazards section of this MD&A.
Cost of Reinsurance and Adequate Protection
The company uses reinsurance arrangements, including reinsurance of its own reinsurance business purchased fromother reinsurers, referred to as retrocessionaires, to help manage its exposure to property and casualty risks. Theavailability of reinsurance and the rates charged by reinsurers are subject to prevailing market conditions, both interms of price and available capacity, which can affect the company’s business volume and profitability. Reinsurancecompanies can also add or exclude certain coverages from, or alter terms in, the policies they offer. Reinsurers mayalso impose terms, such as lower per occurrence and aggregate limits, on primary insurers that are inconsistent withcorresponding terms in the policies written by these primary insurers. As a result, the company’s insurancesubsidiaries, like other primary insurance companies, increasingly are writing insurance policies which to some
193

FAIRFAX FINANCIAL HOLDINGS LIMITED
extent do not have the benefit of reinsurance protection. These gaps in reinsurance protection expose the companyto greater risk and greater potential losses.
The rates charged by reinsurers and the availability of reinsurance to the company’s subsidiaries will generally reflectthe recent loss experience of the company and of the industry in general. For example, the significant hurricanelosses in 2004 and 2005 caused the prices for catastrophe reinsurance protection in Florida to increase significantly in2006. In 2011 the insurance industry experienced the second highest number of insured losses in history, primarilydue to numerous catastrophes. The significant catastrophe losses incurred by reinsurers worldwide resulted in highercosts for reinsurance protection in 2012. More recently, there has been excess capital within the reinsurance marketdue to favourable operating results of reinsurers and alternative forms of reinsurance capacity entering the market.As a result, the market has become very competitive with prices decreasing for most lines of business. However,significant hurricane loss activity in 2017 may again result in higher costs for reinsurance protection going forward.Each of the company’s subsidiaries continue to evaluate the relative costs and benefits of accepting more risk on a netbasis, reducing exposure on a direct basis, and paying additional premiums for reinsurance.
Holding Company Liquidity
Fairfax is a holding company that conducts substantially all of its business through its subsidiaries and receivessubstantially all of its earnings from them. The holding company controls the operating insurance and reinsurancecompanies, each of which must comply with applicable insurance regulations of the jurisdictions in which itoperates. Each operating company must maintain reserves for losses and loss adjustment expenses to cover the risksit has underwritten.
Although substantially all of the holding company’s operations are conducted through its subsidiaries, none of itssubsidiaries are obligated to make funds available to the holding company for payment of its outstanding debt.Accordingly, the holding company’s ability to meet financial obligations, including the ability to make payments onoutstanding debt, is dependent on the distribution of earnings from its subsidiaries. The ability of subsidiaries to paydividends in the future will depend on their statutory surplus, on earnings and on regulatory restrictions. Dividends,distributions or returns of capital to the holding company are subject to restrictions set forth in the insurance lawsand regulations of the countries where the company operates (principally the U.S., Canada, the United Kingdom andBermuda) (in each case, including the provinces, states or other jurisdictions therein) and is affected by thesubsidiaries’ credit agreements, indentures, rating agencies, the discretion of insurance regulatory authorities andcapital support agreements with subsidiaries. The holding company strives to be soundly financed and maintainshigh levels of liquid assets as discussed in note 24 (Financial Risk Management) to the consolidated financialstatements for the year ended December 31, 2017 and in the Liquidity section of this MD&A.
Access to Capital
The company’s future capital requirements depend on many factors, including its ability to successfully write newbusiness and to establish premium rates and reserves at levels sufficient to cover losses. To the extent that the fundsgenerated by the company’s business are insufficient to fund future operations, additional funds may need to beraised through equity or debt financings. If the company requires additional capital or liquidity but cannot obtain iton reasonable terms or at all, its business, financial condition and profitability would be materially adverselyaffected.
The company’s ability and/or the ability of its subsidiaries to obtain additional financing for working capital, capitalexpenditures or acquisitions in the future may also be limited under the terms of its revolving credit facility discussedin note 15 (Borrowings) to the consolidated financial statements for the year ended December 31, 2017. Therevolving credit facility contains various covenants that may restrict, among other things, the company’s ability orthe ability of its subsidiaries to incur additional indebtedness, to create liens or other encumbrances and to sell orotherwise dispose of assets and merge or consolidate with another entity. In addition, the revolving credit facilitycontains certain financial covenants that require the company to maintain a ratio of consolidated debt toconsolidated capitalization of not more than 0.35:1 and consolidated shareholders’ equity of not less than$9.5 billion. A failure to comply with the obligations and covenants under the revolving credit facility could result inan event of default under such agreement which, if not cured or waived, could permit acceleration of indebtedness,including other indebtedness of Fairfax or its subsidiaries. If such indebtedness were to be accelerated, there can beno assurance that the company’s assets would be sufficient to repay that indebtedness in full. This risk is mitigated bymaintaining high levels of liquid assets at the holding company. The company’s management of liquidity risk is
194

discussed further in note 24 (Financial Risk Management) to the consolidated financial statements for the year endedDecember 31, 2017 and in the Liquidity section of this MD&A.
Key Employees
The company is substantially dependent on a small number of key employees, including its Chairman, ChiefExecutive Officer and significant shareholder, Mr. Prem Watsa, and the senior management of the company and itsoperating subsidiaries. The industry experience and reputations of these individuals are important factors in thecompany’s ability to attract new business. The company’s success has been, and will continue to be, dependent on itsability to retain the services of existing key employees and to attract and retain additional qualified personnel in thefuture. At the operating subsidiaries, employment agreements have been entered into with key employees. Thecompany does not maintain key employee insurance with respect to any of its employees.
Regulatory, Political and other Influences
The insurance and reinsurance industries are highly regulated and are subject to changing political, economic andregulatory influences. These factors affect the practices and operation of insurance and reinsurance organizations.Federal, state and provincial governments in the United States and Canada, as well as governments in foreignjurisdictions in which the company operates, have periodically considered programs to reform or amend theinsurance systems at both the federal and local levels. For example, in recent years the company has had toimplement the following: new regulatory capital guidelines for the company’s European operations due to SolvencyII; the Dodd-Frank Act created a new framework for regulation of over-the-counter derivatives in the United Stateswhich could increase the cost of the company’s use of derivatives for investment and hedging purposes; the activitiesof the International Association of Insurance Supervisors has resulted in additional regulatory oversight of thecompany; and the Canadian and U.S. insurance regulators’ Own Risk and Solvency Assessment (‘‘ORSA’’) initiativeshave required the company’s North American operations to perform self-assessments of the capital available tosupport their business risks. Such initiatives could adversely affect the financial results of the company’s subsidiaries,including their ability to pay dividends, cause unplanned modifications of products or services, or result in delays orcancellations of sales of products and services by insurers or reinsurers. Insurance industry participants may respondto changes by reducing their investments or postponing investment decisions, including investments in thecompany’s products and services. The company’s management of the risks associated with its capital within thevarious regulatory regimes in which it operates is discussed in note 24 (Financial Risk Management) under theheading of Capital Management in the consolidated financial statements for the year ended December 31, 2017 andin the Capital Resources and Management section of this MD&A.
Information Requests or Proceedings by Government Authorities
From time to time, the insurance industry has been subject to investigations, litigation and regulatory activity byvarious insurance, governmental and enforcement authorities, concerning certain practices within the industry. Thecompany sometimes receives inquiries and informational requests from insurance regulators in the jurisdictions inwhich its insurance and reinsurance subsidiaries operate. From time to time, consumer advocacy groups or the mediaalso focus attention on certain insurance industry practices. The company cannot predict at this time the effect thatinvestigations, litigation and regulatory activity or negative publicity from consumers or the media will have on theinsurance or reinsurance industry or its business, or whether activities or practices currently thought to be lawful willbe characterized in the future as unlawful or will become subject to negative scrutiny from consumer advocacygroups or the media. The company’s involvement in any investigations and related lawsuits would cause it to incurlegal costs and, if the company were found to have violated any laws, could be required to pay fines and damages,perhaps in material amounts. In addition, the company could be materially adversely affected by the negativepublicity for the insurance industry related to any such proceedings, and by any new industry-wide regulations orpractices that may result from such proceedings or publicity. It is possible that future investigations or relatedregulatory developments will mandate changes in industry practices in a fashion that increases the company’s costsof doing business or requires the company to alter aspects of the manner in which it conducts its business. Thecompany’s internal and external legal counsels coordinate with operating companies in responding to informationrequests and government proceedings.
195

FAIRFAX FINANCIAL HOLDINGS LIMITED
Regional or Geographical Limitations and Risks
The company’s international operations are regulated in various jurisdictions with respect to licensing requirements,currency, amount and type of security deposits, amount and type of reserves, amount and type of local investmentand other matters. International operations and assets held abroad may be adversely affected by political and otherdevelopments in foreign countries, including possibilities of tax changes, nationalization and changes in regulatorypolicy, as well as by consequences of hostilities and unrest. The risks of such occurrences and their overall effect uponthe company vary from country to country and cannot easily be predicted.
The company regularly monitors for political and other changes in each country where it operates. The decentralizednature of the company’s operations permits quick adaptation to, or mitigation of, evolving regional risks.Furthermore, the company’s international operations are widespread and therefore not dependent on the economicstability of any one particular region.
Lawsuits
The company may, from time to time, become party to a variety of legal claims and regulatory proceedings including,but not limited to: disputes over coverage or claims adjudication; disputes regarding sales practices, disclosures,premium refunds, licensing, regulatory compliance and compensation arrangements; disputes with its agents,brokers or network providers over compensation and termination of contracts and related claims; regulatory actionsrelating to consumer pressure in relation to benefits realized by insurers; disputes with taxing authorities regardingits tax liabilities and tax assets; regulatory proceedings and litigation related to acquisitions or divestitures made orproposed by the company or its subsidiaries or in connection with subsidiaries in which the company holds aninvestment; and disputes relating to certain businesses acquired or disposed of by the company. The existence ofsuch claims against the company or its affiliates, directors or officers could have various adverse effects, including theincurrence of significant legal expenses defending claims, even those without merit.
Operating companies manage day-to-day regulatory and legal risk primarily by implementing appropriate policies,procedures and controls. Internal and external legal counsels also work closely with the operating companies toidentify and mitigate areas of potential regulatory and legal risk. The company’s legal and regulatory matters arediscussed in note 20 (Contingencies and Commitments) to the consolidated financial statements for the year endedDecember 31, 2017.
Significant Shareholder
The company’s Chairman and Chief Executive Officer, Mr. Prem Watsa, owns, directly or indirectly, or exercisescontrol or direction over shares representing 42.5% of the voting power of the company’s outstanding shares.Mr. Watsa has the ability to substantially influence certain actions requiring shareholder approval, includingapproving a business combination or consolidation, liquidation or sale of assets, electing members of the Board ofDirectors and adopting amendments to articles of incorporation and by-laws.
Amendments were made to the terms of the company’s multiple voting shares, which are controlled by Mr. Watsa, inAugust of 2015 having the effect of preserving the voting power represented by the multiple voting shares at 41.8%even if additional subordinate voting shares are issued in the future. The amendments are described in note 16 (TotalEquity) to the consolidated financial statements for the year ended December 31, 2015 and in the company’s annualinformation form filed with the securities regulatory authorities in Canada, which are available on SEDAR atwww.sedar.com.
Foreign Exchange
The company’s reporting currency is the U.S. dollar. A portion of the company’s premiums and expenses aredenominated in foreign currencies and a portion of assets (including investments) and loss reserves are alsodenominated in foreign currencies. The company may, from time to time, experience losses resulting fromfluctuations in the values of foreign currencies (including when certain foreign currency assets and liabilities arehedged) which could adversely affect the company’s financial condition, profitability or cash flows. The company’smanagement of foreign currency risk is discussed in note 24 (Financial Risk Management) to the consolidatedfinancial statements for the year ended December 31, 2017.
196

Reliance on Distribution Channels
The company uses brokers to distribute its business and in some instances will distribute through agents or directly tocustomers. The company may also conduct business through third parties such as managing general agents where itis cost effective to do so and where the company can control the underwriting process to ensure its risk managementcriteria are met. Each of these channels has its own distinct distribution characteristics and customers. A largemajority of the company’s business is generated by brokers (including international reinsurance brokers with respectto the company’s reinsurance operations), with the remainder split among the other distribution channels. This issubstantially consistent across the company’s insurance and reinsurance subsidiaries.
The company’s insurance operations have relationships with many different types of brokers including independentretail brokers, wholesale brokers and national brokers depending on the particular jurisdiction, while the company’sreinsurance operations are dependent primarily on a limited number of international reinsurance brokers. Thecompany transacts business with these brokers on a non-exclusive basis. These independent brokers also transact thebusiness of the company’s competitors and there can be no assurance as to their continuing commitment todistribute the company’s insurance and reinsurance products. The continued profitability of the company depends,in part, on the marketing efforts of independent brokers and the ability of the company to offer insurance andreinsurance products and maintain financial ratings that meet the requirements and preferences of such brokers andtheir policyholders.
Because the majority of the company’s brokers are independent, there is limited ability to exercise control over them.In the event that an independent broker exceeds its authority by binding the company on a risk which does notcomply with the company’s underwriting guidelines, the company may be at risk for that policy until the applicationis received and a cancellation effected. Although to date the company has not experienced a material loss fromimproper use of binding authority by its brokers, any improper use of such authority may result in losses that couldhave a material adverse effect on the business, financial condition, profitability or cash flows of the company. Thecompany’s insurance and reinsurance subsidiaries closely manage and monitor broker relationships and regularlyaudit broker compliance with the company’s established underwriting guidelines.
Goodwill and Intangible Assets
The goodwill and intangible assets on the company’s consolidated balance sheet originated from variousacquisitions made by the company or its operating subsidiaries. Continued profitability of acquired businesses is akey driver for there to be no impairment in the carrying value of goodwill and intangible assets. An intangible assetmay be impaired if the economic benefit to be derived from its use is unexpectedly diminished.
Management regularly reviews the current and expected profitability of the operating companies relative to plan inassessing the carrying value of goodwill. The intended use, expected life, and economic benefit to be derived fromintangible assets are evaluated by the company when there are potential indicators of impairment. The carryingvalues of goodwill and indefinite-lived intangible assets are tested for impairment at least annually or more often ifevents or circumstances indicate there may be potential impairment.
Taxation
Realization of deferred income tax assets is dependent upon the generation of taxable income in those jurisdictionswhere the relevant tax losses and temporary differences exist. Failure to achieve projected levels of profitability couldlead to a reduction in the company’s deferred income tax asset if it is no longer probable that the amount of the assetwill be realized.
The company is subject to income taxes in Canada, the U.S. and many foreign jurisdictions where it operates, andthe company’s determination of its tax liability is subject to review by applicable domestic and foreign taxauthorities. While the company believes its tax positions to be reasonable, where the company’s interpretationsdiffer from those of tax authorities or the timing of realization is not as expected, the provision for income taxes mayincrease or decrease in future periods to reflect actual experience.
The company has specialist tax personnel responsible for assessing the income tax consequences of plannedtransactions and events and undertaking the appropriate tax planning. The company also consults with external taxprofessionals as needed. Tax legislation of each jurisdiction in which the company operates is interpreted todetermine the provision for income taxes and expected timing of the reversal of deferred income tax assets andliabilities.
197

FAIRFAX FINANCIAL HOLDINGS LIMITED
Guaranty Funds and Shared Markets
Virtually all U.S. states require insurers licensed to do business in their state to bear a portion of the loss suffered bysome insureds as a result of impaired or insolvent insurance companies. Many states also have laws that establishsecond-injury funds to provide compensation to injured employees for aggravation of a prior condition or injury,which are funded by either assessments based on paid losses or premium surcharge mechanisms. In addition, as acondition to the ability to conduct business in various jurisdictions, the company’s insurance subsidiaries arerequired to participate in mandatory property and casualty shared market mechanisms or pooling arrangements,which provide various types of insurance coverage to individuals or other entities that otherwise are unable topurchase that coverage from private insurers. The effect of these assessments and mandatory shared-marketmechanisms or changes in them could reduce the profitability of the company’s U.S. insurance subsidiaries in anygiven period or limit their ability to grow their business. Similarly, the company’s Canadian insurance subsidiariescontribute to a mandatory guaranty fund that protects insureds in the event of a Canadian property and casualtyinsurer becoming insolvent.
Technological Changes
Technological changes could have unpredictable effects on the insurance and reinsurance industries. It is expectedthat new services and technologies will continue to emerge that will affect the demand for insurance and reinsuranceproducts and services, the premiums payable, the profitability of such products and services and the risks associatedwith underwriting certain lines of business, including new lines of business. Failure to understand evolvingtechnologies, or to position the company in the appropriate direction, or to deploy new products and services in atimely way that considers customer demand and competitor activities could have an adverse impact on thecompany’s business, financial condition, profitability or cash flows. The company maintains an innovation workinggroup comprised of members with diverse backgrounds from across its global operating companies to regularly assessnew services and technologies that that may be applicable or disruptive to the insurance and reinsurance industries.
Technology Infrastructure
The company’s business is highly dependent upon the successful and uninterrupted functioning of its computer anddata processing systems which are relied upon to perform actuarial and other modeling functions necessary forwriting business, to process and make claim payments and to process and summarize investment transactions. Thirdparties provide certain of the key components of the company’s business infrastructure such as voice and datacommunications and network access. Given the high volume of transactions processed daily, the company is relianton such third party provided services to successfully deliver its products and services. The failure of these systemscould interrupt the company’s operations or impact its ability to rapidly evaluate and commit to new businessopportunities. If sustained or repeated, a system failure could result in the loss of existing or potential businessrelationships, or compromise the company’s ability to pay claims in a timely manner.
In addition, a security breach of the company’s computer systems could damage its reputation or result in liability.The company retains confidential information regarding its business dealings in its computer systems, including, insome cases, confidential personal information regarding insureds. Significant capital and other resources may berequired to protect against security breaches or to alleviate problems caused by such breaches. Any well publicizedcompromise of security could deter people from conducting transactions that involve transmitting confidentialinformation to the company’s systems. Therefore, it is critical that these facilities and infrastructure remain secureand are perceived by the marketplace to be secure. This infrastructure may be vulnerable to physical break-ins,computer viruses, programming errors, attacks by third parties or similar disruptive problems. In addition, thecompany could be subject to liability if hackers were able to penetrate its network security or otherwisemisappropriate confidential information.
The company has highly trained staff that is committed to the continual development and maintenance of itstechnology infrastructure. Security measures, including data security programs specific to confidential personalinformation, have been implemented and are regularly upgraded. The company and its third party service providersalso maintain contingency plans specific to its technology infrastructure.
Systemic Cyber-Attacks
The company relies on information technology in virtually all aspects of its business. A significant disruption orfailure of the company’s information technology systems could result in service interruptions, safety failures,
198

security violations, regulatory compliance failures, and inability to protect information and assets against intruders,and other operational difficulties. Attacks perpetrated against those information systems could result in loss of assetsand critical information, expose the company to remediation costs and reputational damage, and adversely affectthe company’s results of operations, financial condition and liquidity.
Cyber-attacks could further adversely affect the company’s ability to operate facilities, information technology andbusiness systems, or compromise confidential customer and employee information. Cyber-attacks resulting inpolitical, economic, social or financial market instability or damage to or interference with the company’s assets, orits customers or suppliers may result in business interruptions, lost revenue, higher commodity prices, disruption infuel supplies, lower energy consumption, unstable markets, increased security and repair or other costs, any of whichmay affect the company’s consolidated financial results. Furthermore, instability in the financial markets as a resultof terrorism, sustained or significant cyber-attacks, or war could also adversely affect the company’s ability toraise capital.
The company has taken steps intended to mitigate these risks, including implementation of cyber security measures,business continuity planning, disaster recovery planning and business impact analysis, and regularly updates theseplans and security measures.
Other
Quarterly Data (unaudited)
Years ended December 31
First Second Third Fourth FullQuarter Quarter Quarter Quarter Year
2017Revenue 2,737.6 3,258.2 4,907.3 5,321.5 16,224.6Net earnings 75.3 312.6 370.2 856.8 1,614.9Net earnings attributable to shareholders of Fairfax 82.6 311.6 476.9 869.5 1,740.6Net earnings per share $ 3.11 $ 13.04 $ 16.85 $ 30.87 $ 66.74Net earnings per diluted share $ 3.03 $ 12.67 $ 16.42 $ 30.06 $ 64.98
2016Revenue 2,186.5 2,907.0 2,431.4 1,774.7 9,299.6Net earnings (loss) (16.7) 293.5 32.7 (704.2) (394.7)Net earnings (loss) attributable to shareholders of Fairfax (51.0) 238.7 1.3 (701.5) (512.5)Net earnings (loss) per share $ (2.76) $ 9.81 $ (0.42) $ (30.77) $ (24.18)Net earnings (loss) per diluted share $ (2.76) $ 9.58 $ (0.42) $ (30.77) $ (24.18)
Revenue of $4,907.3 and $5,321.5 in the third and fourth quarter of 2017 increased from $2,431.4 and $1,774.7 inthe third and fourth quarter of 2016, principally as a result of net gains from the partial sale of ICICI Lombard in thethird quarter of 2017, the sale of the company’s 97.7% interest in First Capital in the fourth quarter of 2017, and theconsolidation of the net premiums earned by Allied World from July 6, 2017.
Net earnings attributable to shareholders of Fairfax of $476.9 (net earnings of $16.85 per basic share and $16.42 perdiluted share) in the third quarter of 2017 compared to net earnings attributable to shareholders of Fairfax of $1.3(net loss of $0.42 per basic and diluted share) in the third quarter of 2016, reflected higher net gains on investments(which primarily resulted from the partial sale of ICICI Lombard and increased net gains on net equity exposure),partially offset by underwriting losses (which primarily resulted from current period catastrophe losses related toHurricanes Harvey, Irma and Maria).
Net earnings attributable to shareholders of Fairfax of $869.5 (net earnings of $30.87 per basic share and $30.06 perdiluted share) in the fourth quarter of 2017 compared to a net loss attributable to shareholders of Fairfax of $701.5(net loss of $30.77 per basic and diluted share) in the fourth quarter of 2016, reflected higher net gains oninvestments (which primarily resulted from decreased net losses on bonds and increased net gains on net equityexposure) and the net gain on the sale of the company’s 97.7% interest in First Capital, partially offset by decreasedunderwriting profit (which primarily resulted from current period catastrophe losses related to the Californiawildfires) and increased provision for income taxes.
199

FAIRFAX FINANCIAL HOLDINGS LIMITED
Operating results at the company’s insurance and reinsurance operations continue to be affected by a difficultcompetitive environment. Individual quarterly results have been (and may in the future be) affected by losses fromsignificant natural or other catastrophes, by favourable or adverse reserve development and by settlements orcommutations, the occurrence of which are not predictable, and have been (and are expected to continue to be)significantly impacted by net gains or losses on investments, the timing of which are not predictable.
Stock Prices and Share Information
At March 9, 2018, Fairfax had 26,934,931 subordinate voting shares and 1,548,000 multiple voting sharesoutstanding (an aggregate of 27,683,701 shares effectively outstanding after an intercompany holding). Eachsubordinate voting share carries one vote per share at all meetings of shareholders except for separate meetings ofholders of another class of shares. The multiple voting shares cumulatively carry 41.8% voting power at all meetingsof shareholders except in certain circumstances (which have not occurred) and except for separate meetings ofholders of another class of shares. The multiple voting shares are not publicly traded.
The table that follows presents the Toronto Stock Exchange high, low and closing Canadian dollar prices ofsubordinate voting shares of Fairfax for each quarter of 2017 and 2016.
First Second Third FourthQuarter Quarter Quarter Quarter
(Cdn$)
2017High 663.63 628.42 652.89 708.99Low 598.00 547.95 552.01 639.00Close 605.20 562.01 649.33 669.34
2016High 780.13 736.54 774.90 777.45Low 646.03 637.17 673.00 586.00Close 727.07 695.83 768.72 648.50
Compliance with Corporate Governance Rules
Fairfax is a Canadian reporting issuer with securities listed on the Toronto Stock Exchange and trading in Canadiandollars under the symbol FFH and in U.S. dollars under the symbol FFH.U. It has in place corporate governancepractices that comply with all applicable rules and substantially comply with all applicable guidelines and policies ofthe Canadian Securities Administrators and the practices set out therein.
The company’s Board of Directors has adopted a set of Corporate Governance Guidelines (which include a writtenmandate of the Board), established an Audit Committee, a Governance and Nominating Committee and aCompensation Committee, approved written charters for all of its committees, approved a Code of Business Conductand Ethics applicable to all directors, officers and employees of the company and established, in conjunction withthe Audit Committee, a Whistleblower Policy. The company continues to monitor developments in the area ofcorporate governance as well as its own procedures.
Forward-Looking Statements
Certain statements contained herein may constitute forward-looking statements and are made pursuant to the ‘‘safeharbour’’ provisions of the United States Private Securities Litigation Reform Act of 1995. Such forward-lookingstatements are subject to known and unknown risks, uncertainties and other factors which may cause the actualresults, performance or achievements of Fairfax to be materially different from any future results, performance orachievements expressed or implied by such forward-looking statements.
Such factors include, but are not limited to: a reduction in net earnings if our loss reserves are insufficient;underwriting losses on the risks we insure that are higher or lower than expected; the occurrence of catastrophicevents with a frequency or severity exceeding our estimates; changes in market variables, including interest rates,foreign exchange rates, equity prices and credit spreads, which could negatively affect our investment portfolio; thecycles of the insurance market and general economic conditions, which can substantially influence our and ourcompetitors’ premium rates and capacity to write new business; insufficient reserves for asbestos, environmental and
200

other latent claims; exposure to credit risk in the event our reinsurers fail to make payments to us under ourreinsurance arrangements; exposure to credit risk in the event our insureds, insurance producers or reinsuranceintermediaries fail to remit premiums that are owed to us or failure by our insureds to reimburse us for deductiblesthat are paid by us on their behalf; our inability to maintain our long term debt ratings, the inability of oursubsidiaries to maintain financial or claims paying ability ratings and the impact of a downgrade of such ratings onderivative transactions that we or our subsidiaries have entered into; risks associated with implementing our businessstrategies; the timing of claims payments being sooner or the receipt of reinsurance recoverables being later thananticipated by us; risks associated with any use we may make of derivative instruments; the failure of any hedgingmethods we may employ to achieve their desired risk management objective; a decrease in the level of demand forinsurance or reinsurance products, or increased competition in the insurance industry; the impact of emerging claimand coverage issues or the failure of any of the loss limitation methods we employ; our inability to access cash of oursubsidiaries; our inability to obtain required levels of capital on favourable terms, if at all; the loss of key employees;our inability to obtain reinsurance coverage in sufficient amounts, at reasonable prices or on terms that adequatelyprotect us; the passage of legislation subjecting our businesses to additional supervision or regulation, includingadditional tax regulation, in the United States, Canada or other jurisdictions in which we operate; risks associatedwith government investigations of, and litigation and negative publicity related to, insurance industry practice orany other conduct; risks associated with political and other developments in foreign jurisdictions in which weoperate; risks associated with legal or regulatory proceedings or significant litigation; failures or security breaches ofour computer and data processing systems; the influence exercisable by our significant shareholder; adversefluctuations in foreign currency exchange rates; our dependence on independent brokers over whom we exerciselittle control; an impairment in the carrying value of our goodwill and indefinite-lived intangible assets; our failureto realize deferred income tax assets; technological or other change which adversely impacts demand, or thepremiums payable, for the insurance coverages we offer; disruptions of our information technology systems; andassessments and shared market mechanisms which may adversely affect our insurance subsidiaries. Additional risksand uncertainties are described in this Annual Report, which is available at www.fairfax.ca, and in our Supplementaland Base Shelf Prospectus (under ‘‘Risk Factors’’) filed with the securities regulatory authorities in Canada, which isavailable on SEDAR at www.sedar.com. Fairfax disclaims any intention or obligation to update or revise any forward-looking statements.
201

FAIRFAX FINANCIAL HOLDINGS LIMITED
APPENDIXGUIDING PRINCIPLES FOR FAIRFAX FINANCIAL HOLDINGS LIMITED
OBJECTIVES:
1) We expect to compound our mark-to-market book value per share over the long term by 15% annually byrunning Fairfax and its subsidiaries for the long term benefit of customers, employees, shareholders and thecommunities where we operate – at the expense of short term profits if necessary.
2) Our focus is long term growth in book value per share and not quarterly earnings. We plan to grow throughinternal means as well as through friendly acquisitions.
3) We always want to be soundly financed.
4) We provide complete disclosure annually to our shareholders.
STRUCTURE:
1) Our companies are decentralized and run by the presidents except for performance evaluation, successionplanning, acquisitions, financing and investments, which are done by or with Fairfax. Investing will always beconducted based on a long term value-oriented philosophy. Cooperation among companies is encouraged to thebenefit of Fairfax in total.
2) Complete and open communication between Fairfax and subsidiaries is an essential requirement at Fairfax.
3) Share ownership and large incentives are encouraged across the Group.
4) Fairfax will always be a very small holding company and not an operating company.
VALUES:
1) Honesty and integrity are essential in all our relationships and will never be compromised.
2) We are results oriented – not political.
3) We are team players – no ‘‘egos’’. A confrontational style is not appropriate. We value loyalty – to Fairfax andour colleagues.
4) We are hard working but not at the expense of our families.
5) We always look at opportunities but emphasize downside protection and look for ways to minimize lossof capital.
6) We are entrepreneurial. We encourage calculated risk taking. It is all right to fail but we should learn fromour mistakes.
7) We will never bet the company on any project or acquisition.
8) We believe in having fun – at work!
202

Directors of the Company Operating ManagementAnthony F. Griffiths Fairfax Insurance GroupCorporate Director Andrew A. Barnard, PresidentRobert J. Gunn NorthbridgeCorporate Director
Silvy Wright, PresidentAlan D. Horn Northbridge Financial CorporationPresident and Chief Executive OfficerRogers Telecommunications Limited OdysseyReKaren L. Jurjevich Brian D. Young, PresidentPrincipal, Branksome Hall Odyssey Re Holdings Corp.Christine N. McLean (as of April 2018) Crum & ForsterDirector of Research Marc Adee, PresidentSprucegrove Investment Management Ltd. Crum & Forster Holdings Corp.John R.V. Palmer
Zenith NationalChairman, Toronto Leadership CentreKari Van Gundy, PresidentTimothy R. PriceZenith National Insurance Corp.Chairman, Brookfield Funds, a division of
Brookfield Asset Management Inc. BritBrandon W. Sweitzer Mark Cloutier, Executive ChairmanDean, School of Risk Management, St. John’s University Matthew Wilson, President
Brit LimitedLauren C. TempletonPresident, Templeton and Phillips Capital Management, LLC Allied World
Scott A. Carmilani, PresidentBenjamin P. WatsaAllied World Assurance Company Holdings, GmbHPresident and Founder, Marval Capital Ltd.
Fairfax AsiaV. Prem WatsaChairman and Chief Executive Officer of the Company Ramaswamy Athappan, Chief Executive Officer
Officers of the Company Sammy Y. Chan, PresidentJennifer Allen Gobinath Athappan, Chief Operating OfficerVice President and President, Pacific InsuranceDavid Bonham
Insurance and Reinsurance – OtherVice President and Chief Financial OfficerBruno Camargo, PresidentPeter Clarke Fairfax BrasilVice President and Chief Risk OfficerNigel Fitzgerald, President
Jean Cloutier Advent Capital (Holdings)Vice President, International Operations
Jacek Kugacz, PresidentVinodh Loganadhan Polish ReVice President, Administrative Services
Peter Csakvari, PresidentBradley Martin Colonnade InsuranceVice President, Strategic Investments Edwyn O’Neill, PresidentPaul Rivett Bryte InsurancePresident Fabricio Campos, PresidentEric Salsberg Fairfax Latin AmericaVice President, Corporate Affairs and Corporate Secretary Run-offRonald Schokking Nicholas C. Bentley, PresidentVice President and Treasurer RiverStone GroupJohn Varnell OtherVice President, Corporate Development
Bijan Khosrowshahi, PresidentV. Prem Watsa Fairfax InternationalChairman and Chief Executive Officer
Sean Smith, PresidentAuditor
PethealthPricewaterhouseCoopers LLP
Roger Lace, PresidentGeneral Counsel
Hamblin Watsa Investment CounselTorys LLP
Head Office 95 Wellington Street West, Suite 800, Toronto, Canada M5J 2N7Telephone: (416) 367-4941Website: www.fairfax.ca
203
