2000 annual report - s1.q4cdn.coms1.q4cdn.com/579586326/files/doc_financials/ar2000.pdf · 2000...
TRANSCRIPT

2000 Annual Report

Contents
Five Year Financial Highlights 1
Corporate Profile 2
Chairman’s Letter to Shareholders 5
Fairfax Consolidated Financial Statements 28
Auditors’ Report to the Shareholders 32
Valuation Actuary’s Report 32
Notes to Consolidated Financial Statements 33
Management’s Discussion and Analysis 52
Fairfax Insurance and Reinsurance Companies –
Combined Financial Statements 92
Fairfax with Equity Accounting of Lindsey Morden –
Consolidated Financial Statements 94
Lindsey Morden Group Inc. – Consolidated
Financial Statements 96
Fairfax Unconsolidated Financial Statements 98
Appendix – Fairfax Guiding Principles 100
Consolidated Financial Summary 101
Corporate Information 102

2000 Annual Report
Five Year Financial Highlights(in $ millions except share and per share data)
2000 1999 1998 1997 1996
Revenue 6,188.5 5,788.5 3,574.3 2,088.3 1,475.8
Net earnings 137.4 124.2 387.5 232.5 150.8
Total assets 31,833.3 31,979.1 20,886.7 10,207.3 5,778.4
Common shareholders’
equity 3,180.3 3,116.0 2,238.9* 1,395.7 911.1
Common shares
outstanding – year-end
(millions) 13.1 13.4 12.1* 11.1 10.5
Return on average equity 4.1% 4.3% 20.1% 20.4% 21.4%
Per share
Net earnings 9.41 9.20 32.63 21.59 15.36
Common shareholders’
equity 242.75 231.98 184.54 125.38 87.05
Market prices per share
High 246.00 610.00 603.00 403.00 310.00
Low 146.75 180.00 253.00 285.00 98.00
Close 228.50 245.50 540.00 320.00 290.00
* not including share subscription receipts issued December 22, 1998 or their proceeds
1

FAIRFAX FINANCIAL HOLDINGS LIMITED
Corporate Profile
Fairfax Financial Holdings Limited is a financial services holding company whose
corporate objective is to achieve a high rate of return on invested capital and build long term
shareholder value. The company has been under present management since September 1985.
Insurance subsidiaries
Commonwealth Insurance, based in Vancouver, offers commercial property and oil, gas
and petrochemicals insurance in Canada, the United States and internationally, and
commercial casualty insurance in Canada. The company has been in business since 1947.
In 2000, Commonwealth’s net premiums written were $80.0 million. At year-end, the
company had capital and surplus of $146.9 million and there were 130 employees.
Crum & Forster (C&F), based in Morristown, New Jersey, is a national commercial lines
property and casualty insurance group in the United States that operates on a regional basis
and produces business through a network of independent agents and brokers and specialty
producers. The company has been in business since 1824. In 2000, C&F’s net premiums
written were US$506.5 million. At year-end, the company had capital and surplus of
US$980.5 million and there were 1,205 employees.
Falcon Insurance, based in Hong Kong, writes property and casualty insurance to niche
markets in Hong Kong. In 2000, Falcon’s net premiums written were HK$66.1 million
(approximately HK$5.2 = C$1). At year-end, the company had capital and surplus of
HK$241.8 million and there were 42 employees.
Federated Insurance, based in Winnipeg, markets a broad range of insurance products
in Canada primarily for commercial customers. The company has been in business since 1920.
In 2000, Federated’s net premiums written were $71.0 million, consisting of $56.0 million of
property and casualty business and $15.0 million of life and group health and disability
products. At year-end, the company had capital and surplus of $42.9 million and there were
255 employees.
Lombard Insurance, based in Toronto, writes a complete range of commercial and personal
insurance products in Canada. The company has been in business since 1904. In 2000,
Lombard’s net premiums written were $343.3 million. At year-end, the company had capital
and surplus of $174.2 million and there were 673 employees.
Markel Insurance, based in Toronto, is the leading trucking insurance company in Canada
and has provided the Canadian trucking industry with a continuous market for this class of
insurance since 1951. In 2000, Markel’s net premiums written were $65.2 million. At year-end,
the company had capital and surplus of $45.5 million and there were 131 employees.
Ranger Insurance, based in Houston, specializes in writing property and casualty insurance
in the United States to niche markets which require unique underwriting, claims and loss
control expertise (propane, agri-products, self-storage, bail bonds and public entities). The
company has been in business since 1923. In 2000, Ranger’s net premiums written were
2

US$47.0 million. At year-end, the company had capital and surplus of US$107.7 million and
there were 166 employees.
TIG Specialty Insurance, based in Dallas, is licensed to write substantially all lines of
property and casualty insurance in all states of the United States and in Canada. The company
has been in business since 1911. In 2000, TIG’s net premiums written were US$978.6 million.
At year-end, the company had capital and surplus of US$1,256.8 million and there were
748 employees.
Odyssey Re Group reinsurance subsidiaries
Odyssey America Reinsurance, based in Stamford, Connecticut, underwrites treaty and
facultative reinsurance as well as certain insurance business, with branches in London, Paris,
Singapore and Toronto and affiliated offices in New York, Miami, Mexico City, Santiago,
Cologne, Stockholm and Tokyo. In 2000, Odyssey America Re’s net premiums written were
US$677.2 million. At year-end, the company had capital and surplus of US$1,039.3 million
and there were 304 employees. London market business is primarily underwritten through
Syndicate #1218 at Lloyd’s. In 2000, the Syndicate’s net premiums written (included in
Odyssey America Re’s net premiums written) were US$68.0 million.
Compagnie Transcontinentale de Reassurance (CTR), based in Paris, writes life
reinsurance internationally. In 2000, CTR’s property and casualty and life reinsurance net
premiums written were US$110.3 million. Effective July 1, 2000, CTR’s European property and
casualty reinsurance was written through Odyssey America Re’s Paris branch, and effective
January 1, 2001, CTR’s Asian property and casualty reinsurance was written through Odyssey
America Re’s Singapore branch. At year-end, the company had capital and surplus of US$104.4
million and there were 119 employees.
Other reinsurance subsidiaries
CRC (Bermuda) Reinsurance, based in Bermuda, continues to be a major reinsurer of
Lombard Insurance. In 2000, CRC (Bermuda)’s net premiums written were $118.0 million.
At year-end, the company had capital and surplus of $147.9 million.
ORC Re, based in Dublin, was established in 1997. It writes selected long term property and
casualty reinsurance and fully reinsures the reinsurance portfolios of Fairfax’s international
runoff operations to provide consolidated investment and liquidity management services, with
the RiverStone Group retaining full responsibility for all other aspects of the runoff. In 2000,
ORC Re’s net premiums written were US$141.4 million. At year-end, the company had capital
and surplus of US$1,910.8 million and there were eight employees.
Wentworth Insurance, based in Barbados, was incorporated in 1990. In 2000, Wentworth’s
net premiums written were US$40.6 million. At year-end, the company had capital and surplus
of US$154.4 million and there were seven employees.
3

FAIRFAX FINANCIAL HOLDINGS LIMITED
Runoff subsidiaries
The Resolution Group (TRG) was formed in 1993 to manage the runoff of International
Insurance Company and other discontinued lines of business written by the former Talegen
group of insurance companies. The runoff required effective management of major direct
excess and surplus lines insurance and reinsurance liabilities, the resolution of complex
litigation and the collection and management of reinsurance assets. At year-end, International
Insurance had capital and surplus of US$319.2 million.
RiverStone Group (RiverStone), run by TRG management, was established following the
acquisition of TRG, primarily to manage the runoff of certain Fairfax insurance subsidiaries
and other discontinued lines of business written by other Fairfax companies. RiverStone
manages the Sphere Drake and Odyssey Re Stockholm runoff operations.
Claims adjusting and insurance brokerage
Lindsey Morden Group is engaged in providing claims adjusting, appraisal and claims and
risk management services to a wide variety of insurance companies and self-insured
organizations in Canada, the United States, the United Kingdom, continental Europe, the
Far East, Latin America and the Middle East. In 2000, revenue totalled $376.9 million. The
company was established in 1923, and at year-end the group had 3,705 employees located in
348 offices.
Hub International is an insurance brokerage company selling a broad range of commercial,
personal and life insurance products. The company was established in 1998, and at year-end
had 1,330 employees in 113 offices in Canada and the United States.
Investment management subsidiary
Hamblin Watsa Investment Counsel (HWIC) provides investment management to the
insurance, reinsurance and runoff subsidiaries of Fairfax. HWIC was founded in 1984.
Note: All companies are wholly owned except TRG, a private company in which Fairfax owns an
effective 27.5% economic (100% voting) interest; Lindsey Morden Group, a public company of
which Fairfax owns 66.5% of the equity and 85.9% of the votes; and Hub International, a public
company of which Fairfax owns 41.7%.
4

To Our Shareholders
I was too optimistic! For the fourth time in 15 years and the first consecutive two year period,
we did not earn a return on equity in excess of 20%. We earned 4.1% on shareholders’ equity
in 2000 (versus 11.4% for the TSE300) – another year of very low returns on equity and again,
for the second year in a row, a return less than the TSE300. Net income after taxes increased
by 11% to $137.4 million while earnings per share increased by only 2% (because of preferred
share dividends in 2000 of $13.4 million) to $9.41 from $9.20 per share. Book value per share
increased by 5% to $242.75 while our share price dropped 7% to $228.50 from $245.50 at
year-end 1999. From a net income and return point of view, there is no question that 1999
and 2000 were the worst years we have had in our 15 year history. This resulted in our stock
price selling below book value for 15 months – from September 1999 to December 2000 – only
the second time this has happened in our 15 year history (the first was from March 1990 to
September 1991). Our low stock price attracted many ‘‘deep value’’ investors who purchased
our stock just as they purchased bankrupt Loewen Group bonds. For most of 2000, Fairfax was
worth more dead than alive and, given our results, it was easy to see why! 2000 was a very
difficult and disappointing year for our company and its shareholders – and I was too
optimistic as I said earlier (more on that later).
Having admitted to very disappointing results in the last two years, I want to remind you again
that since we began in September 1985, our company has always been run for the long term.
We have stressed many times over the years and more recently in our November 1999 letter
to you, our shareholders, that ‘‘we will accept short term volatility in our earnings for better
long term results’’. While the future is always uncertain, I continue to believe that the long
term prospects for Fairfax have never been brighter.
Before discussing 2000 (easier to discuss the past than the present!), let me reiterate Fairfax’s
excellent long term track record which has been achieved during the longest and toughest
down-cycle in the history of the property and casualty business. Book value per share has
compounded at 37% annually, while our stock price, even after the recent declines in 1999
and 2000, has compounded at 33% annually. In Canada, there are only two companies, and in
the U.S., eight companies, whose stock price has compounded at a rate faster than ours over
the past 15 years. Our company has earned an average 18.2% on shareholders’ equity since we
began 15 years ago (below our objective of 20%, because of our low profits in the past two
years) versus 9.4% for the 25 leading U.S. property and casualty insurers. There is only one
property and casualty company in the U.S. and Canada that has had a higher return on equity
than Fairfax in the past 15 years and none has compounded book value or stock price as fast.
You can see why we are so grateful for this long term record.
So what’s wrong with Fairfax? When stock prices go down, most investors, various industry
analysts and commentators and perhaps even some of our own shareholders are concerned
about (a) the long term prospects for Fairfax (Will it ever make a 20% return on equity again?)
and (b) the financial strength of the company (Can it survive?).
Both (a) and (b) arise from the fact that we purchased two very large U.S. property and casualty
companies in 1998 and 1999 – Crum & Forster (C&F) and TIG. As you know, we bought them
5

FAIRFAX FINANCIAL HOLDINGS LIMITED
at discounts to book value with reinsurance protection for reserve deficiencies and
unrecoverable reinsurance. Many observers believe because we purchased these companies at
discounts to book value that they were ‘‘damaged goods’’ or have some unfixable problems.
On the other hand, they believe that paying multiples of book value for a company indicates
that the company has a solid franchise. Our experience is just the opposite! While there are
a few companies that have excellent franchises in the P&C industry, we believe that most
acquirers of P&C companies at multiples of book value will be very disappointed with the
returns that they will achieve on their purchase price, especially if they have no protection
from the past. An analysis of recent acquisition activity in the P&C industry, we think, will
confirm our view. Speaking of protection from the past, we have mentioned to you previously
that the amortization of the negative goodwill created by our acquisitions at a discount to
book value provides some protection from unforeseeable events arising from those acquisitions
in the future. As more fully described on page 58, in 2000 we made various reductions to the
amortization periods after a thorough review and analysis of the appropriate periods for
amortization, based on all available knowledge.
We continue to feel very strongly that we will achieve our 20% return on equity objective on
our purchase price for both C&F and TIG – even though the returns will be delayed some! And
here is where I have been too optimistic and very wrong! I underestimated the time it would
take to turn around the combined ratios for C&F and TIG in the midst of a property and
casualty market in 1998 and 1999 which was the softest in well over a decade. So I initially
expected C&F to achieve 110% in 1999 and 106% in 2000 (versus results of 124% in 2000) and
TIG to achieve 105% in 2000 (versus results of 123%). Clearly, I was too optimistic in my
expectations in terms of how long it would take to reduce the combined ratios of C&F and TIG
and our results have been atrocious because of that optimism. However, under the leadership
of Bruce Esselborn at C&F and Courtney Smith at TIG, we believe strongly that it is not
a question of ‘‘if’’ but only a question of ‘‘when’’ both companies achieve their goal of 100%
combined or better. I have no forecasts as to ‘‘when’’ other than to say that C&F and TIG, like
all of our companies, are singularly focused on this goal of underwriting profitability. The
biblical ‘‘you will reap what you sow’’ does not make us unhappy, at least in a business sense.
For you naysayers, the following table shows our record of combined ratios by company under
our ownership compared to 5 year results prior to our purchase.
6
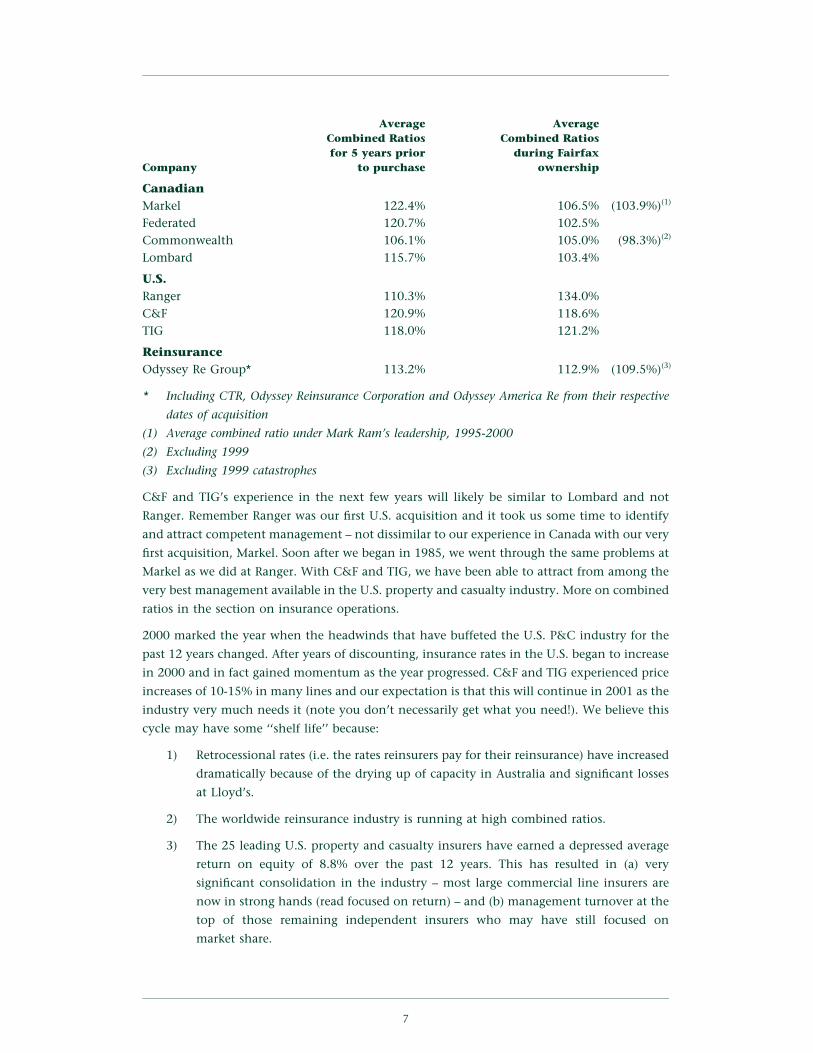
Average AverageCombined Ratios Combined Ratiosfor 5 years prior during Fairfax
Company to purchase ownership
CanadianMarkel 122.4% 106.5% (103.9%)(1)
Federated 120.7% 102.5%Commonwealth 106.1% 105.0% (98.3%)(2)
Lombard 115.7% 103.4%
U.S.Ranger 110.3% 134.0%C&F 120.9% 118.6%TIG 118.0% 121.2%
ReinsuranceOdyssey Re Group* 113.2% 112.9% (109.5%)(3)
* Including CTR, Odyssey Reinsurance Corporation and Odyssey America Re from their respective
dates of acquisition
(1) Average combined ratio under Mark Ram’s leadership, 1995-2000
(2) Excluding 1999
(3) Excluding 1999 catastrophes
C&F and TIG’s experience in the next few years will likely be similar to Lombard and not
Ranger. Remember Ranger was our first U.S. acquisition and it took us some time to identify
and attract competent management – not dissimilar to our experience in Canada with our very
first acquisition, Markel. Soon after we began in 1985, we went through the same problems at
Markel as we did at Ranger. With C&F and TIG, we have been able to attract from among the
very best management available in the U.S. property and casualty industry. More on combined
ratios in the section on insurance operations.
2000 marked the year when the headwinds that have buffeted the U.S. P&C industry for the
past 12 years changed. After years of discounting, insurance rates in the U.S. began to increase
in 2000 and in fact gained momentum as the year progressed. C&F and TIG experienced price
increases of 10-15% in many lines and our expectation is that this will continue in 2001 as the
industry very much needs it (note you don’t necessarily get what you need!). We believe this
cycle may have some ‘‘shelf life’’ because:
1) Retrocessional rates (i.e. the rates reinsurers pay for their reinsurance) have increased
dramatically because of the drying up of capacity in Australia and significant losses
at Lloyd’s.
2) The worldwide reinsurance industry is running at high combined ratios.
3) The 25 leading U.S. property and casualty insurers have earned a depressed average
return on equity of 8.8% over the past 12 years. This has resulted in (a) very
significant consolidation in the industry – most large commercial line insurers are
now in strong hands (read focused on return) – and (b) management turnover at the
top of those remaining independent insurers who may have still focused on
market share.
7

FAIRFAX FINANCIAL HOLDINGS LIMITED
4) A number of insurers have experienced well-publicized serious financial difficulties.
This has resulted in rating agencies being very pessimistic on the industry and access
to capital from banks and capital markets being significantly reduced.
5) Reserve redundancies in the past five years, particularly from U.S. auto, are over. The
industry has no place to hide and, in fact, reserve deficiencies from the soft markets
of 1997-99 are clearly becoming more evident. Note – Fairfax’s indemnification and
other protection obtained on the purchase of C&F and TIG relates to two of those
three years.
Rating agency pessimism on the U.S. P&C industry, combined with their expectation that it
would take us much longer to turn around the operating performance of our recent purchases,
C&F and TIG, unfortunately resulted in Fairfax’s debt ratings being downgraded.
Here are some relevant statistics on our financial position as of December 31 in the past
eight years.
1993 1994 1995 1996 1997 1998 1999 2000
Holding company cash and
marketable securities
($ millions) 4.1 7.2 70.4 101.1 207.1 305.4 712.7 545.4
Net debt/equity 47% 56% 48% 41% 37% 51% 34% 35%
Long term bank lines
($ millions) 75 105 215 600 1,000 1,300 1,300 1,265
Unused indemnifications* 26 56 33 280 334 957 673 463
Swiss Re protection** – – – – – – 1,087 715
Negative goodwill – – – 111.7 184.1 227.8 234.2 129.8
S&P debt rating BBB BBB BBB+ BBB+ BBB+ BBB+ BBB+ BBB–
* Against pre-acquisition reserve development and unrecoverable reinsurance, excluding TRG; see page 79 in the
MD&A.
** See pages 56 and 57 in the MD&A.
As you can see from the table above, our financial position in terms of cash and marketable
securities in the holding company, net debt/equity, long term bank lines, balance sheet
protection provided by indemnifications and our corporate insurance cover from Swiss Re, and
negative goodwill have never been stronger than in 1999/2000.
So while we have expanded significantly in the past five years, it has not been at the expense of
our financial position. As it has always been our objective to maintain a very strong financial
position, the downgrade in our debt ratings by Standard & Poor’s was very disappointing. We
firmly believe that these ratings do not reflect our underlying financial strength on an absolute
or relative basis. It is our expectation that improved performance by C&F and TIG will result in
our ratings rising to levels that more appropriately reflect our underlying financial strength.
The problems of the P&C industry plus concerns about our ratings have increased our bond
spreads (and those of other industry participants) to record levels. The spreads on bonds that
we issued at 150-200 basis points over treasuries, depending on term, have now more than
doubled. Who said the markets are always rational?
8

Having discussed our debt ratings, I am happy to report that we were able to maintain C&F,
TIG and Odyssey Re’s A.M. Best ratings at the ‘‘A’’ level (A- for C&F) – which are very important
in the U.S. P&C insurance industry.
C&F and TIG’s focus on re-underwriting their books of business to concentrate on
underwriting profitability resulted in negative cash flow at their level. Combined with rising
interest rates for most of the year (resulting in unrealized bond losses), 2000 provided Fairfax
and HWIC management with some excellent experience which we could have done without!
Our small team reacted well again.
Speaking of our small team, we are very fortunate to have a ‘‘few good men and women’’ who,
with no egos, are experienced in monitoring operations and reacting quickly to opportunities
while focusing on downside protection from worst case events. The outstanding team we have
at head office in Toronto includes Trevor Ambridge, Sam Chan, Francis Chou, Jean Cloutier,
Brad Martin, Elizabeth Murphy, Rick Salsberg, Ron Schokking and John Varnell, and at Fairfax
Inc. includes Jim Dowd, Scott Galiardo and Jim Migliorini in New York and Cindy Crandall in
Dallas.
During the year, C&F purchased Seneca Insurance as a bolt-on acquisition for US$65 million.
Doug Libby, who has run Seneca for the past ten years, has had an excellent track record with
combined ratios below 100% for the past five years, together with consistent reserve
redundancies over the past ten years. Bruce Esselborn and Nick Antonopoulos (the President of
C&F) knew Doug Libby and Seneca as they were former directors of the company. Seneca,
which is headquartered in Manhattan, will serve as the New York City office for C&F. The
purchase price of US$65 million was a small premium to underlying book value of
US$59 million. We welcome Doug Libby and all the employees of Seneca to the Fairfax group
and look forward to their significant contributions to our group.
As you know, in 1999 we purchased approximately 38% of Zenith National Insurance Corp.
run by Stanley Zax for the past 22 years. As a bonus, Stanley introduced us to Brian Caudle who
heads the Advent Group which controls three syndicates at Lloyd’s of London with a
combined underwriting capacity of some £250 million. Brian has one of the best track records
at Lloyd’s spanning some 25 years. We sold Kingsmead Agencies, a Lloyd’s agency we inherited
with the purchase of TIG, for 22% of Advent. We are delighted to be long term shareholders of
Advent along with Brian Caudle. As an aside, insurance companies specializing in worker’s
compensation in California have fallen like dominoes in 1999/2000. Zenith is one of the few
specialty worker’s compensation insurance company survivors.
In its second year of operation, Hub International, under Chairman Marty Hughes and President
Rick Gulliver, ably assisted by John Varnell of Fairfax, completed several important acquisitions in
the United States and Canada. Hub continued to improve profitability and operating free cash flow
in 2000 and continues to respond to opportunities for expansion in the United States and Canada.
On January 20, 2001, Hub announced its agreement to purchase the Kaye Group, a NASDAQ listed
brokerage group, for approximately US$119 million. Hub has accomplished a great deal in a short
period of time and is a strategic investment for Fairfax. For more information, please read Hub
International’s Annual Report which is posted on Hub’s website www.hubinternational.com in the
Investor Relations section under ‘‘Financial Reports’’.
9

FAIRFAX FINANCIAL HOLDINGS LIMITED
After about five years of watching the developments in the state owned property and casualty
industry in India, Fairfax was able to announce a joint venture with ICICI, a dynamic Indian
commercial bank, as the Indian government decided to open up the industry to foreign
investment for the first time since 1972. The joint venture, called ICICI-Lombard, gives us
a maximum equity interest of 26% (under current law) for a capital investment of $10 million.
This project required a significant commitment from a Fairfax-wide team to complete.
Congratulations to Chandran Ratnaswami, Paul Fink, Jim Dowd, Jim Migliorini, Byron
Messier, Kim Tan and many others for providing this long term opportunity to Fairfax. We
expect to be writing policies this year.
During the year, the principals of HWIC decided to discontinue management of external funds
(primarily pension funds) and focus on the management of Fairfax funds alone. HWIC has
been managing pension funds and some individual funds for the better part of 16 years. For
the record (and for the last time), results over that time period have been as follows:
Annualized rates of return (%)
16 years ended December 31, 2000
1985 – 2000
Canadian Equities 13.3
TSE300 11.5
U.S. Equities 19.7
S&P500 17.9
Canadian Bonds 11.7
SM Index 10.8
Balanced Fund 13.8
Source: Representative balanced fund managed by HWIC for 16 years
These pension fund results rank HWIC among the top fund managers in Canada and the
United States. The Value Fund, an HWIC managed pooled fund for individuals, compounded
at 13.6% annually since inception in June 30, 1985 (versus 10.9% for the TSE300).
The compensation arrangements with the principals of HWIC were also changed from the
arrangements arrived at in 1992 when HWIC was purchased by Fairfax. Going forward, the
principals will have a fixed salary and a discretionary bonus based on performance as opposed
to the participation in the profit sharing pools that has prevailed over the past 8 years. These
new arrangements were concluded to the satisfaction of all the principals.
This brings me to my own compensation arrangements. For many years now I have felt that as
a controlling shareholder involved in the management of the company, my compensation
should be closely linked to all shareholders. So from 2000 onwards, my compensation will be
a fixed salary of $600,000 with no bonuses. This compensation will not increase annually, and
if 1999/2000 is repeated, could decrease!! However, to make sure that my family survives,
Fairfax will examine instituting a dividend – yes, a modest dividend – in 2001 at an annual rate
of $1 or $2 per share. Going forward, the only difference between me and you, our
shareholders, will be my salary of $600,000 – which based on recent performance, many of you
may think is too high! While the payment of a modest dividend results in double taxation to
10

most of you and is not as economically efficient as retaining all our profits and compounding
at high rates of return (as we have done for the past 15 years), this was the only way I could
think of to bring my compensation in line with your interests. While I may have generated
some sympathy from you, I should add that I continue to travel well – in fact a little better
recently because we sold our Lear Jet for US$2.5 million (cost US$1.8 million) and purchased
a Gulfstream II for US$6.2 million.
Below, we update the table on intrinsic value and stock prices that we first presented last year.
INTRINSIC VALUE STOCK PRICE
% Change inROE Book Value* % Change in
% per Share Stock Price
1986 25.4 + 183 +2921987 31.3 + 41 – 31988 21.2 + 22 + 211989 20.3 + 23 + 251990 23.0 + 39 – 411991 21.3 + 24 + 931992 7.7 + 11 + 181993 20.3 + 48 + 1451994 12.1 + 25 + 91995 20.1 + 22 + 461996 21.4 + 63 + 1961997 20.4 + 44 + 101998 20.1 + 47 + 691999 4.3 + 26 – 552000 4.1 + 5 – 7
1985-2000 18.2% + 37% + 33%
* First measure of intrinsic value as discussed in our 1997 Annual Report
The table was discussed in great detail last year. I’ll spare you that this year! Suffice to say that
while statistically, intrinsic value did not increase much last year (book value per share
increased 5% while investments per share dropped 10% in 2000), the managements of our
insurance and reinsurance businesses have significantly increased the long term value of our
businesses, as should become evident in the next few years. We did a good job of masking the
improvement in 2000!
Of course, the low returns on equity resulted in our stock price continuing to be weak in 2000.
Note, however, that over the long term, stock prices and book values have compounded at
approximately comparable rates – depending on the year, book value or stock price is slightly
ahead!
As discussed in our 1999 Annual Report, the low stock price for Fairfax allowed us to
repurchase some of our shares – 325,309 shares at an average price of $183.47 per share
in 2000. This means that in 1999/2000 we retired 1,031,412 shares at an average price of
$258.35 per share. As discussed last year, our policy of not buying back our shares at the
expense of our financial position prevented us from buying back more shares of Fairfax
in 2000.
11

FAIRFAX FINANCIAL HOLDINGS LIMITED
As far as future acquisitions are concerned, other than small bolt-on acquisitions like Seneca, I
want to reiterate our statements from our 1999 Annual Report.
1) We do not plan to make any significant acquisition until our group combined ratio
drops to 105% and is clearly headed lower.
2) We do not plan to issue our stock at prices less than $500 per share to buy another
company – however attractive it may be.
Our guiding principles (again set out in the Appendix) were tested in 2000 and, I’m happy to
say, survived intact. These guiding principles are firmly entrenched in all of our companies and
are a major source of our long term strength.
While internet stocks collapsed last year (more later), under Sam Chan’s leadership we initiated
a Fairfax intranet that links all of our operations and provides a free flow of information across
all our subsidiaries. Also, we are building our e-commerce platform and have two products
developed from end-to-end on the internet. In both these ventures, we have benefited greatly
from the committed services of DK Matai and mi2g. We look forward to further development
in 2001.
The table below shows the sources of our net earnings with Lindsey Morden equity accounted.
2000 1999($000) ($000)
Underwriting
Insurance
Canada (13,025) (96,570)
U.S. (588,408) (273,131)
Reinsurance (97,367) (247,364)
Interest and dividends 593,512 711,475
Insurance and reinsurance earnings (loss)
before realized gains (105,288) 94,410
Realized gains 378,305 121,670
Runoff 43,303 (54,231)
Claims adjusting (Fairfax portion) (15,387) 2,784
Interest expense (164,743) (129,262)
Goodwill and other amortization (5,362) (5,067)
Negative goodwill 99,113 –
Swiss Re premium (167,196) (35,312)
Kingsmead losses (32,963) –
Restructuring (16,402) –
Corporate overhead and other (22,966) (20,174)
Pre-tax income (loss) (12,586) (25,182)
Less (add): taxes (173,306) (158,023)
Less: non-controlling interests 23,279 8,633
Net earnings 137,441 124,208
12

The table shows you the results from our insurance (underwriting and investments), runoff
and non-insurance operations. In this report, insurance operations include reinsurance operations.
Runoff operations include TRG, Odyssey Re Stockholm and Sphere Drake. Claims adjusting
shows you our share of Lindsey Morden’s after-tax income. Goodwill and other amortization
includes Hamblin Watsa goodwill ($1.4 million) and amortization from Ranger and Seneca.
The corporate overhead expense is net of HWIC’s pre-tax income and interest income
on Fairfax’s cash balances and, in 1999, includes one time expenses associated with our
acquisitions. The premium payable to Swiss Re of $167.2 million is shown separately and
discussed in the MD&A on pages 56 and 57. Also shown separately are realized gains so that
you can better understand our earnings from our operating companies. Also, please note the
unaudited financial statements of our combined insurance and reinsurance operations and of
Fairfax with Lindsey Morden equity accounted, as well as Lindsey Morden’s financial
statements, shown on pages 92 to 97.
The continued very large underwriting losses were due to TIG ($342.9 million), C&F
($197.9 million), Odyssey Re Group ($97.4 million), Ranger ($47.6 million) and the Canadian
insurance companies ($13.0 million). Reserve development for the 1999 accident year reflected
in those underwriting losses cost us $164.4 million because of TIG ($99.4 million),
C&F ($69.8 million), Odyssey Re Group ($5.4 million) and Ranger ($4.8 million), offset by the
Canadian insurance companies’ net redundancies ($15.0 million). As we have taken this
development into account in our 2000 loss ratio picks and because of higher rates in the U.S.,
we do not expect this negative reserve development to be repeated in 2001.
Interest and dividends declined by $118.0 million in 2000 to $593.5 million because of
a significant decrease in the investment portfolio of the insurance and reinsurance companies
of $2.4 billion. The major reason for the decrease in the investment portfolios is the
re-underwriting that took place in 2000 (please see page 82). With higher premiums and
increased volumes, this should begin to reverse itself in 2001.
Last year, we discussed Fairfax’s purchase of a US$1 billion adverse loss development
reinsurance cover (for 1998 and prior claims and unrecoverable reinsurance) from an AAA
rated subsidiary of Swiss Re Group. In 2000, we ceded US$272.3 million to the cover for
a cumulative total of US$523.6 million. The adverse development arose mainly from
TIG (US$150.9 million), C&F (US$18.1 million) and our runoff subsidiaries, mainly
Sphere Drake (US$98.6 million). The cost for this cover in 2000 is the Swiss Re premium shown
of $167.2 million (more on pages 56 and 57).
Our runoff operations (TRG, Odyssey Re Stockholm and Sphere Drake) earned us
$43.3 million, mainly because of higher investment income and realized gains on investments
on the runoff portfolio, offset by losses from Sphere Drake that resulted from adverse
development largely due to the 1999 European storms.
The adverse development in the 1999 underwriting year ($164.4 million), the cost of
protection (the Swiss Re premium) for 1998 and prior reserve development ($167.2 million),
restructuring costs ($16.4 million) discussed in the MD&A on page 57, and Kingsmead losses
($33.0 million) discussed in the MD&A on page 57, cost Fairfax a total of $381.0 million
13

FAIRFAX FINANCIAL HOLDINGS LIMITED
pre-tax, offset by a reduction in the amortization period of negative goodwill of $79.2 million,
for a net pre-tax cost of $301.8 million.
In spite of substantial realized gains in 2000, the very significant underwriting losses resulted in
a pre-tax loss again in 2000 – similar to the one in 1999. We recorded a tax recovery of
$173.3 million because our underwriting losses are in high tax jurisdictions while other
income was earned in areas with lower tax rates.
Insurance operations
The table below shows the combined ratios of each of our companies for 2000 and 1999. While
the group combined ratio in 2000 was worse than in 1999, the underlying operations are very
much improved – but the figures mask the improvement. However, there is no question that
I was too optimistic in my report to you last year and was wrong. As I said earlier,
I underestimated the soft markets in the U.S. of 1998 and 1999, the effects of reserve
deficiencies in these years on our results in 2000 and finally, the enormity of turning around
these operations in the midst of these soft markets. While 1999 was impacted by catastrophes,
2000 was impacted by reserve development from the 1999 underwriting year. Excluding this
reserve development, the group’s combined ratio was 112.6%.
Underwritingloss Combined ratio
2000 2000 1999($ millions) % %
Commonwealth 3.7 105.5 186.7
Federated 4.6 106.5 113.8
Lombard 2.7 100.6 105.0
Markel 2.0 103.4 104.6
Total Canadian insurance 13.0 102.0 114.9
Ranger 47.6 146.3 149.4
C&F 197.9 124.3 120.9
TIG 345.9 123.1 105.6
Total U.S. insurance 588.4 124.3 111.8
Odyssey Re Group* 97.4 108.0 119.4
Total reinsurance 97.4 108.0 119.4
Total 698.8 116.3 114.6
* including CTR
From the table you can see that our Canadian operations, while not yet below 100% in total,
are well on their way to achieving that objective. Our U.S. operations, particularly TIG and
C&F, were significantly impacted by reserve development from the 1999 year. Excluding this
development, the combined ratio for TIG was 116.4% and C&F 116.3%. Given the
re-underwriting that was done in both companies and the price increases achieved, the
14

combined ratios for both companies should decline significantly in 2001 but not to our
targeted level of 100% – yet!
For all our U.S. insurance business, price increases and improved policy conditions were
applied gradually over the year, with price increases accelerating to their highest levels in the
fourth quarter. While these measures are partially reflected in this year’s underwriting results,
their full impact will not be realized until 2001.
Commonwealth, with its significant U.S. property and oil and gas business, bounced back
in 2000 with a combined ratio of 105.5% from its record high ratio of 186.7% in 1999. Gross
premiums written increased by 25% over the prior year to $213.0 million while net premiums
written increased by 74% to $80.0 million.
Commonwealth’s expense ratio dropped by 9.2 percentage points to 25.1% as underwriting
expenses declined by 9% to $15.6 million. Commonwealth should have an excellent year
in 2001 barring catastrophes. In 2000, the company earned $6.8 million after tax compared to
a loss of $12.0 million in 1999. During the year, John Watson passed the CEO title to
Ron Schwab but will continue as Chairman of the company. During his tenure as CEO of
Commonwealth, John Watson took the company from $68.4 million in gross premiums
written in 1977 to $213.0 million gross premiums written in 2000 with a cumulative combined
ratio of 98.3% (excluding 1999). Cumulative after-tax income earned during John Watson’s
tenure was more than $182 million. During this period, Commonwealth’s shareholders’ equity
increased from $3.3 million in 1977 to $146.9 million at the end of 2000, after net dividends
paid of $70.3 million. Commonwealth has been a great investment for Fairfax and on behalf of
all our shareholders, we thank John for his superb performance. John will continue to help
Fairfax in a variety of ways.
Federated, under John Paisley’s leadership, improved its combined ratio to 106.5% in 2000
from 113.8% in 1999 (including the life company). The reason Federated did not achieve
its 100% goal was again due to a high frequency of large ‘‘individual risk’’ losses. For example,
in 2000, Federated had its largest property loss ever, which was a total fire loss of an equipment
dealership with an excellent twelve year relationship with the company. This is the inherent
risk in our business! John Paisley has achieved a 10% rate increase during 2000, has continued
re-underwriting the book of business including exiting the fertilizer dealer market, and with
a high 88% retention ratio expects to have a combined ratio below 100% in 2001. Federated’s
property and casualty gross premiums written increased by 2% to $65.0 million while its net
premiums written increased by 1% to $56.0 million. Federated maintained its expense ratio
below 30%. It earned $0.9 million after tax in 2000 versus $2.3 million in 1999 mainly due to
reduced realized gains. Federated Life had gross premiums written of $18.5 million, an increase
of 8% from 1999. Net premiums written increased by 4% to $15.0 million. Profit after tax was
$1.5 million, almost twice that earned in 1999 because of reduced expenses, lower loss ratios
and higher investment income. Federated Life will be changing its name so as to access new
distribution channels, markets and partners.
Lombard’s combined ratio improved significantly to 100.6% due to strict underwriting
discipline (resulting in a 38% drop in new business written) combined with reserve
redundancies from past years. During the year, Byron Messier and his management team
15

FAIRFAX FINANCIAL HOLDINGS LIMITED
undertook a company-wide focus to reduce underwriting and claims leakage (not charging
enough for your services and paying too much for claims). Together with a continued focus on
underwriting profitability, Byron expects to achieve a combined ratio below 100% in 2001. In
late 2000, Lombard formed a strategic partnership with CARP (Canadian Association of Retired
Persons) as sole supplier of property and casualty products through CARP to Canadians over
the age of 50. I’m a member also but definitely not retired!! This strategic partnership will help
Lombard’s Privilege 50 program which had net premiums of $30.8 million (versus
$29.8 million in 1999) with a combined ratio of 101.4% (115.0% in 1999).
Lombard’s gross premiums written (including cessions to CRC (Bermuda)) were down 2% to
$501.5 million in 2000 while net premiums written (on the same basis) were down 5% to
$444.7 million. Net income after taxes increased to $41.2 million from $29.7 million in 1999.
Falcon, led by Kenneth Kwok, continued to write very little business due to soft markets
in 2000. Falcon wrote net premiums of HK$66.1 million (Cdn$12.6 million) in 2000 versus
HK$60.5 million (Cdn$12.1 million) in 1999. With a start-up expense ratio of 86%, Falcon had
a combined ratio of 173% in 2000 versus 165% in 1999. With a hardening market at
year-end 2000 and planned expense reductions, Falcon expects to get its combined ratio
below 120% in 2001. Falcon lost HK$29.1 million (Cdn$6.7 million) in 2000.
In what was another terrible year for most writers of long-haul trucking insurance in Canada
and the U.S., Markel, under Mark Ram’s management, once again delivered a solid combined
ratio of 103.4% in 2000. With its proven leadership position in the trucking insurance
marketplace, its experienced team and strong reserving practices, Markel is well-positioned to
achieve its 100% combined ratio goal in 2001. Over the past six years under current
management, Markel has outperformed both the long-haul trucking insurance marketplace
and the general property and casualty industry in Canada, writing a total of $500 million of
business with an average combined ratio of 103.9%. In 2001, Markel will be celebrating its
50th anniversary serving the Canadian trucking industry. We’re certainly looking forward to
the next 50 under Mark’s leadership!! Gross premiums written in 2000 increased by 16% to
$89 million while net premiums written rose by 19% to $65 million. Net income after taxes
was down $4.5 million to $1.1 million due primarily to lower investment returns.
The downsizing of Ranger continued in 2000. The company’s gross written premiums declined
to US$78.0 million from US$137.6 million in 1999, and its net written premiums to
US$47.0 million from US$88.3 million – both down about 50% from 1999. While the all-in
combined ratio was 146.3%, excluding discontinued lines the combined ratio was 121.6%. In
spite of an expense reduction of 31% to US$32.6 million in 2000, Ranger has an extremely
high expense ratio (including commissions) of 50% which we are working with Phil Broughton
to reduce. Ranger, like other U.S. companies, has had significant rate increases recently – and
we wait patiently for improved results. Ranger had a pre-tax loss of US$19.1 million (before
stop loss) versus US$25.6 million in 1999 (before stop loss). Ranger’s management continues to
take the actions necessary to improve results – but no forecasts from me for 2001!
Our confidence in Bruce Esselborn was not misplaced. Bruce, Nick, Mary Jane Robertson (C&F’s
CFO) and the new management team are well on their way to restoring the excellent
underwriting reputation that C&F once had many decades ago. As shareholders, you will be
16
extremely pleased at the huge asset that this team is expected to develop for Fairfax over the
next few years. Bruce is very much focused on underwriting profitability and is shooting for
‘‘a nickel on the dollar’’ in terms of underwriting profits.
Here’s what the C&F team has done in 2000:
1) The management team was strengthened significantly, particularly with
underwriting talent.
2) Underwriting focus and discipline was restored.
3) Pricing (renewal pricing up 11.9% in the fourth quarter) and policy terms were
improved.
4) Unprofitable business was shed.
5) Commissions were reduced by almost 3 percentage points.
6) Operating expenses were cut by US$18.7 million.
7) Product offerings were expanded (D&O and Surety, for example).
8) Seneca and Transnational (a surplus lines shell renamed Crum & Forster Specialty)
were acquired.
9) The agency force was refreshed and expanded with 277 appointments and
32 terminations.
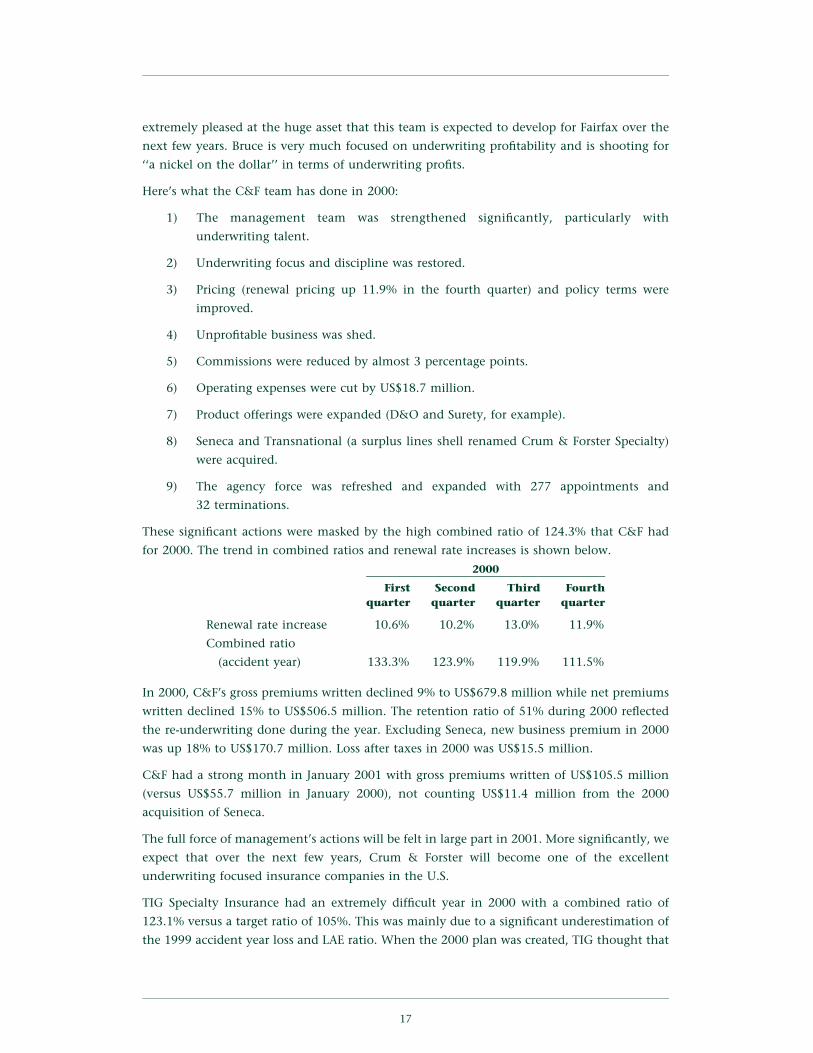
These significant actions were masked by the high combined ratio of 124.3% that C&F had
for 2000. The trend in combined ratios and renewal rate increases is shown below.
2000
First Second Third Fourthquarter quarter quarter quarter
Renewal rate increase 10.6% 10.2% 13.0% 11.9%
Combined ratio
(accident year) 133.3% 123.9% 119.9% 111.5%
In 2000, C&F’s gross premiums written declined 9% to US$679.8 million while net premiums
written declined 15% to US$506.5 million. The retention ratio of 51% during 2000 reflected
the re-underwriting done during the year. Excluding Seneca, new business premium in 2000
was up 18% to US$170.7 million. Loss after taxes in 2000 was US$15.5 million.
C&F had a strong month in January 2001 with gross premiums written of US$105.5 million
(versus US$55.7 million in January 2000), not counting US$11.4 million from the 2000
acquisition of Seneca.
The full force of management’s actions will be felt in large part in 2001. More significantly, we
expect that over the next few years, Crum & Forster will become one of the excellent
underwriting focused insurance companies in the U.S.
TIG Specialty Insurance had an extremely difficult year in 2000 with a combined ratio of
123.1% versus a target ratio of 105%. This was mainly due to a significant underestimation of
the 1999 accident year loss and LAE ratio. When the 2000 plan was created, TIG thought that
17

FAIRFAX FINANCIAL HOLDINGS LIMITED
the 1999 underwriting year was 18 points better than it actually turned out to be. This was
a result of the very soft market in 1999 generally, mentioned earlier, together with significant
negative development taking place in most of its business segments including Workers’
Compensation, Excess Casualty, Non-Standard Auto and Sports and Leisure. This shortfall was
accentuated by very poor results in an expanding non-standard auto book as well as some drag
from clean-up activities of the past. As TIG distributes its products through managing general
agents (MGAs), pricing and claims management initiatives took longer to take hold.
As at C&F, Courtney Smith and his management team have made very significant
improvements in TIG’s operations, which have been masked by the very poor results in 2000.
Some of these improvements were:
1) The management team was strengthened significantly, particularly in claims and
actuarial.
2) A management reporting and control system is now in place by customer group.
3) Key producer contracts were renegotiated to provide more pricing, underwriting and
claims control.
4) Pricing (renewal pricing up 13% in the fourth quarter) and policy terms were
improved.
5) Unprofitable distribution relationships were terminated.
6) Third party administrator relationships on 24 programs were terminated. Those
claims are now being handled in-house. Improvements in the quality of claims
handling at TIG should significantly reduce claims costs in the future.
7) Operating expenses were cut by US$5.6 million.
8) Commission rates were reduced for many underperforming programs and more
closely linked to underwriting performance.
9) The Special Risk Operations Unit (US$41.8 million in net premiums written) and
Hawaii (US$54.8 million in net premiums written) achieved combined ratios
below 100%.
A very strong focus on strict underwriting (in spite of the MGA relationships), higher price
increases, a changing mix of business and much improved claims management should yield
substantially improved results in 2001. TIG remains committed to achieving an underwriting
profit in 2002.
TIG’s gross premiums written in 2000 were US$1,379.4 million versus US$1,350.0 million
in 1999. Net premiums written increased 2% to US$978.6 million and the combined ratio for
2000 was 116.4% (excluding 1999 reserve strengthening) versus a restated combined ratio
for 1999 of 118.4%. Net loss after taxes for 2000 was US$125.9 million versus US$24 million for
nine months in 1999.
Under Andy Barnard’s leadership, Odyssey Re Group consolidated its global franchise via
a branch network with offices all over the world. The company operates with a capital base of
over US$1 billion and had a worldwide gross premium base of US$986 million. Net premiums
18

written worldwide decreased by 3% in 2000 to US$787.5 million from US$814.9 million
in 1999. The combined ratio for 2000 was 108.0%. While these results did not achieve our
objective of 104% for 2000, we expect that Andy and Odyssey Re Group outperformed the
reinsurance industry’s 2000 combined ratio. Given the increase in underlying insurance rates
and the higher reinsurance rates experienced in January 2001, Odyssey Re Group is well
positioned to drop its combined ratios to the 103%-104% area in 2001. Odyssey Re Group
earned US$110.4 million after taxes in 2000 versus a loss of US$48.0 million in 1999.
With the exception of TIG, our insurance companies continue to be well capitalized as shown
on page 85. Important information for you to review when you look at insurance companies is
the disclosure regarding their claims reserves. As you know, it is our policy to have our reserves
set at a level that results in redundancies in future years. How did we do in 2000? We provide
extensive disclosure on our claims reserves beginning on page 62 in the MD&A. In Canada, our
insurance companies had redundancies of $17.1 million in 2000 while in the U.S., C&F, TIG
and Ranger had an aggregate deficiency of US$284.8 million. Odyssey Re Group had an
aggregate deficiency of US$62.1 million. The reasons for these deficiencies, including the
softness of the insurance market in 1999, are discussed on pages 68 to 72 in the MD&A. We
continue to work to get our U.S. and reinsurance reserves to the standards of our Canadian
reserves.
During the year, the RiverStone Group (TRG), led by Mike Coutu and Dennis Gibbs, took over
the runoff of all discontinued operations across the Fairfax group. As well, they became
responsible for:
a) settling all latent claims including asbestos, pollution and other hazards. Also, all
construction defect claims, originating mainly from California, were centralized
under RiverStone;
b) the management of reinsurance recoverables across the group, particularly ones in
dispute or with financial problems. They are also responsible for all commutations as
well as the security list for ongoing reinsurers; and
c) the management of any significant lawsuits, including the personal accident and
worker’s compensation dispute described in last year’s Annual Report.
TRG has been a tremendous resource for us and the 160 people that they have at Manchester,
New Hampshire are a welcome addition to the Fairfax family. Please review the MD&A for
more details on our runoff operations.
Claims adjusting
2000 was a very poor year for Lindsey Morden. Revenue dropped 15% to $376.9 million
in 2000, while the company lost $23.1 million after taxes – the largest loss in its history. The
losses were mainly due to poor results in North America and the United Kingdom. Free cash
flow was negative $7.7 million ($0.64 per share) compared to a positive $25.6 million ($2.17
per share) in 1999. These poor results resulted in the elimination of the dividend in early 2001.
In normal succession planning, Ferd Roibas was made President and Chief Operating Officer as
of September 14, 2000 while Ken Polley became Chairman of the Board replacing me. Ken has
19

FAIRFAX FINANCIAL HOLDINGS LIMITED
retired as CEO after almost 35 years with Lindsey Morden, and on an interim basis Francis
Chou has become Chief Executive Officer. Ken’s dedication to Lindsey Morden was legendary,
and he was at the helm as it developed from a purely Canadian operation, with annual revenue
of $31 million when it went public in 1987, into one of the few global claims management
companies, with revenue of $377 million last year. During the year, Karen Murphy, former
Chief Financial Officer of a large property and casualty insurance company in Canada, joined
Lindsey Morden as Chief Financial Officer. Peter Fritze, from Torys, joined Lindsey Morden as
Senior Vice President, Corporate Affairs. Farid Nagji was promoted to President,
U.S. Operations on Don Smith’s retirement. This team has the urgent task of returning Lindsey
Morden to profitability immediately and then capitalizing on its opportunities as one of the
few global adjusters in the world.
To maintain Lindsey Morden’s financial strength, the company did a $20 million rights issue
(at $8.50 per share) in late 2000 back-stopped by Fairfax. The issue was almost totally
subscribed by Fairfax. Only a year ago, I happily reported to you that we bought 0.8 million
shares at $20.00 per share!! For more information on Lindsey Morden, pleaser refer to their
annual report that you can get from their website (www.cunninghamlindsey.com).
Financial position
As mentioned in previous Annual Reports, we feel our unaudited balance sheet with Lindsey
Morden equity accounted (shown on page 94) is the best way to understand our financial
position. Below, we show you our year-end financial position compared to the end of 1999.
2000 1999($ millions)
Cash and marketable securities 545.4 712.7
Long term debt 1,851.4 1,959.0
Net debt 1,306.0 1,246.3
Common shareholders’ equity 3,180.3 3,116.0
Preferred securities 592.0 578.8
Total equity 3,772.3 3,694.8
Net debt/equity 35% 34%
Net debt/total capital 26% 25%
As shown, there was very little change in our financial position during the year 2000. Similar to
only once before (1990), shareholders’ equity did not increase significantly in 2000. Our net
debt to equity and net debt to total capital ratios increased a little because of a reduction in
cash and marketable securities in the holding company and the effect of the lower Canadian
dollar on U.S. dollar denominated debt.
As insurance company balance sheets can be complicated, this year we wanted to review for
you on a line-by-line basis all of the major assets and liabilities on our balance sheet. To spare
some of you less-detailed types, this commentary is included in the MD&A beginning on
page 60. From this review, you can see why we feel our balance sheet is very sound and
conservatively accounts for our assets and liabilities.
20

Due to our low profits in the last two years, our financial position at year-end 2000 is not as
strong as it was last year. However, it continues to be strong for the following reasons:
1) We have no bank debt. Our debt consists of seven public debentures with a long term
to maturity (3 years to 37 years) and low interest rates (6.875% to 8.30%), two small
debentures issued to vendors, and certain debt assumed with the acquisition of TIG.
All of the public debentures were issued under a single trust indenture containing no
restrictive covenants, thus providing us with great flexibility. We have swapped the
fixed interest rates on all of the public debentures (with the exception of the ones
maturing in 2003) into floating rates (or as noted in the next sentence), saving
approximately 69 basis points on average currently. We swapped US$125 million of
our 7.375% debentures due April 15, 2018 for Japanese yen denominated debt of the
same maturity with a fixed rate of 3.48% per annum (see note 5 to the consolidated
financial statements). Including the amortization of the unrealized foreign exchange
loss on this swap over the remaining term to maturity, the effective rate for 2000 was
5.081% per annum, still below the 7.375% coupon rate of the swapped debentures.
2) We have unsecured, committed, long term bank lines in excess of $1.2 billion with
excellent covenants. These bank lines are with five Canadian, five U.S. and three
European banks. Please see the details on page 87 in the MD&A.
3) Our net long term debt is less than three times our normalized earnings base (you
have yet to see it!!). Also, our earnings base is well diversified among many insurance
and reinsurance companies and Lindsey Morden and geographically from Canadian,
U.S. and international sources of income.
4) Available cash flow at the Fairfax (holding company) level from dividends,
management fees and interest covers our administrative and interest expenses and
preferred dividends by about two times. This is based on normal dividend payouts
from our insurance companies, which are much less than our maximum dividend-
paying capacity. Note Fairfax’s combined holding company income statement on
page 99.
5) With more than $500 million in cash and marketable securities in the holding
company at year-end, we could pay our administrative and interest expenses and
preferred dividends at Fairfax, with no dividends from any of our insurance or
reinsurance companies, for approximately two years – our management holding
company survival ratio! This is less than our target of three to four years.
6) As discussed on page 85 in the MD&A, all our insurance and reinsurance companies
(with the exception of TIG) are well capitalized with significant solvency margins in
excess of mandated regulatory levels.
7) Our foreign exchange exposure from our U.S. insurance and reinsurance companies
has been fully hedged by our U.S. dollar debenture issues and the purchase of foreign
exchange contracts.
21

FAIRFAX FINANCIAL HOLDINGS LIMITED
Investments
Finally, equity markets in the U.S. declined in 2000, with the S&P500 down 10% and the
NASDAQ down 39%. The TSE300 was up slightly (6%) while U.S. long treasuries increased
significantly as long term interest rates dropped from 61/2% to 51/2%.
The unrealized gains (losses) as of year-end are as follows:
2000 1999($ millions)
Bonds (463.3) (1,241.0)
Preferred stocks (0.7) (1.3)
Common stocks (25.2) 15.7
(489.2) (1,226.6)
We realized $382.8 million in gains in 2000 – more than triple what we realized in 1999 and
almost equal to the record realized gains in 1998 of $441 million. Unrealized bond losses
declined significantly from $1,241.0 million as of December 31, 1999 to $463.3 million as of
December 31, 2000 and continued to decline in 2001 to about $220 million as of February 28,
primarily reflecting declining long term interest rates. Assuming corporate spreads remain at
their current levels (they deteriorated in 2000), our unrealized bond losses would disappear at
long term interest rates of 5% and would become an $800 million unrealized gain at long term
interest rates of 4%.
We are relieved that our comment to you last year, that unrealized bond losses do not impact
our regulatory capital in the U.S. and will not be realized (as we can hold these bonds to
maturity or until interest rates drop), was justified only one year later. However, not realizing
significant bond losses at C&F and TIG, in a negative cash flow environment resulting from
declining premiums (because of very soft industry pricing), was much more difficult than we
expected and required the talents of all of our people, including HWIC, Fairfax and the
financial staff at both companies.
22

Shown below is our record of realized gains since inception.
1986 1987 1988 1989 1990 1991 1992 1993
Investment portfolio (average)($ millions) 64.2 109.8 130.8 135.7 237.9 338.5 366.5 418.2Realized gains– ($ millions) 1.0 9.2 7.8 15.5 2.3 (4.5) 3.4 27.8– % of portfolio 1.6 8.4 6.0 11.4 1.0 (1.3) 0.9 6.6Unrealized gains (losses)(at year-end)– ($ millions) 1.1 (6.9) 5.2 (1.1) (34.0) (6.1) (17.3) 11.5– % of portfolio 1.2 (5.6) 3.8 (0.8) (10.1) (1.8) (4.4) 1.4
1994 1995 1996 1997 1998 1999 2000
Investment portfolio (average)($ millions) 852.0 1,608.1 2,548.1 4,584.6 8,877.5 14,684.0 16,306.2Realized gains– ($ millions) 20.0 71.9 131.3 206.8 440.8 121.7 382.8– % of portfolio 2.3 4.5 5.2 4.5 5.0 0.8 2.3Unrealized gains (losses)(at year-end)– ($ millions) (30.9) 14.5 127.2 122.7 5.5 (1,226.6) (489.2)– % of portfolio (2.0) (0.9) 8.7 2.1 0.0 (7.0) (3.2)
You will note the following from the table above:
1. Realized gains have been significant over the years with no predictability whatsoever.
However, we have earned realized gains in some years in excess of 5% of the
portfolio. While unable to predict when, we think this is still a very realistic
possibility for Fairfax even with a $15 billion investment portfolio.
2. Unrealized gains/losses have no predictability whatsoever in terms of future realized
gains.
3. Cumulative realized gains since we began in 1985 have been $1.4 billion. With a
much larger portfolio to work with and the same investment team (a little older
now), we expect to earn significant realized gains in the future. Discontinuing
management of pension and individual portfolios allows HWIC to focus even more
on this objective.
As discussed in our 1998 Annual Report, the possibilities for realized gains continue to be:
1. We have approximately $5.5 billion invested in ‘‘put’’ bonds (described in our 1997
Annual Report) that have significant upside potential if interest rates decline (limited
downside if interest rates increase). As a result of these put bonds, our bond portfolio
has an average maturity of 8 years to the put date and 18 years to the long date.
2. We continue to have US$800 million in S&P500 Index puts at an average level of
1,277, which can result in large profits if the U.S. stock market declines significantly.
Since we began buying these puts three years ago, they have cost us US$163 million,
of which US$115 million has been written off at December 31, 2000.
3. We have $885 million invested in common stock on which we expect to make
significant gains.
23

FAIRFAX FINANCIAL HOLDINGS LIMITED
Gross realized gains in 2000 totaled $488.5 million. After realized losses of $12.4 million and
increased provisions of $93.3 million (primarily on the S&P500 Index put contracts and on a
preferred stock inherited on an acquisition), net realized gains were $382.8 million. Net gains
from fixed income securities were $22.4 million while net gains from common stocks and
other investments were $360.4 million. The principal contributors to the stock realized gains
were Latin American stocks ($247.8 million), Loews ($53.4 million), put contracts on a basket
of technology stocks ($47.4 million), Samsung Fire & Marine ($7.5 million), Everest Re
($6.8 million) and Old Republic ($6.3 million). As an aside, we have made cumulative realized
gains in excess of $500 million outside North America since we began investing internationally
in 1997.
The table on page 83 shows the return on our investment portfolio. Investment income
(interest and dividends) increased in 2000 due to the inclusion of TIG Specialty Insurance and
Odyssey America Re for a full year, partially offset by a reduction in premiums due to
re-underwriting and the runoff of certain insurance company portfolios. Pre-tax investment
income increased to $62.10 per share in 2000 from $56.48 in 1999.
The speculation that we documented in our 1999 Annual Report ended with a thud in 2000 as
technology stocks came back to earth. As shown below, the ‘‘senior’’ issues have dropped by
more than 50% while the junior issues are down over 90%, as expected. By the way, we would
consider these declines as ‘‘permanent’’ losses as mentioned in last year’s Annual Report, as it is
highly unlikely that any of these companies will see the high prices that prevailed in
1999/2000 again in the next ten years.
December 31, 1999 December 31, 2000 % change
‘‘Senior’’ issues
AOL Time Warner 75.88 34.80 –54
Amazon.com 76.13 15.56 –80
Yahoo! 216.34 30.06 –86
Cisco 53.56 38.25 –29 (–55)*
Dell 51.00 17.44 –66
‘‘Junior’’ issues
DoubleClick 126.53 11.00 –91
Go2Net 87.00 16.10 –81 (–92)*
Infospace.com 53.50 8.84 –83 (–93)*
Red Hat 105.63 6.25 –94
VerticalNet 82.00 6.66 –92
* at February 27, 2001
When you consider that AOL Time Warner is still selling at 61x cash earnings (pro forma loss
of $1.02 per share), Yahoo! at 59x cash earnings (before charges related to acquisitions,
investment losses, etc.) and Amazon.com is still losing money, you may feel like us that there is
still plenty of downside left.
While technology stocks have come down significantly, as we have just discussed, the S&P500
is still selling at very high levels. I have to admit that we first began getting concerned about
U.S. equity markets in late 1996 and very concerned from 1998 onwards. As the markets went
24

higher, we felt we were from another planet (another country I can understand!). Here’s an
update on the S&P500 since 1996.
As of Price/ % ChangeDecember 31 Index Earnings Earnings in Index
1996 741 39 19x
1997 970 40 24x +31%
1998 1229 38 33x +27%
1999 1469 49 30x +20%
2000 1320 54 25x –10%
1996-2000 +38% +32% +78%
As you can see, the S&P500 was down 10% in 2000 but is still a far cry from where it was in
1996. While the P/E ratio declined in 2000, it is still at very high and vulnerable levels. As an
example of high P/E ratios, we observed in 1997 that GE was selling at 27.5x earnings.
Currently, GE is selling at 38x earnings. Perhaps we are in a ‘‘New Era’’ with an all-powerful
Federal Reserve that justifies GE selling at 38x earnings and 9.4x book value. We beg to differ
and remind you that the S&P500 dropped by approximately 50% between 1972 and 1974, the
last time GE sold at an astronomical P/E of 28x earnings. GE, by the way, dropped 59% in that
time period. And yes, it took GE ten years to get back to the high price that it sold at in 1972.
While the investment climate appears to have decidedly turned bearish in the past
three months, we want to remind you that we continue to think that most participants in
today’s equity markets in the U.S. will suffer significant permanent loss and it is very likely that
the high price for the S&P500 (1,552) and Dow Jones (11,750) reached in early 2000 will not be
seen again in the next ten years. While this may sound like a very bold statement, all it reflects
is the fact that the median P/E over the past 100 years in the U.S. is approximately 15x and
long term earnings growth for the S&P500 has been in the 6% – 7% area annually. So-called
‘‘long term’’ investors in the marketplace who are extrapolating the 15% – 20% return of the
past decade are very likely to be disappointed.
We must also remind you again of two major risks that we see in the U.S. and Canadian
financial markets that we first commented on in our 1997 Annual Report. The first is
a potential ‘‘run’’ on mutual funds and the second is the possibility of ‘‘repricing of risk’’ as the
default experience of bonds collateralized with consumer debt (credit card receivables, second
mortgages, auto dealer receivables, etc.) becomes significantly worse than in the past. These are
very significant risks given that more than 50% of all Americans are now in the stock market. It
could be very dangerous.
As you know, we have backed our concerns about the U.S. markets with US$800 million
(notional value) in S&P500 Index puts and also US$142 million (notional value) in similar one
year contracts on a basket of technology stocks (we realized some of the gains in 2000). The
S&P puts have already cost us US$115 million over the past three years as we have expensed
the purchase costs of these puts over the terms of the contracts. The US$800 million in S&P
puts have a carrying value of US$48 million in our books (current value approximately
US$68 million).
25

FAIRFAX FINANCIAL HOLDINGS LIMITED
We have approximately 6% of our investment portfolios in common shares and almost all the
rest in cash and good quality marketable bonds (86.5% of the bonds are rated A or above, and
almost none are below a BBB rating – please see page 83). By country, our common stock
investments at December 31, 2000 were as follows:
Book Value Market Value($ millions)
Canada 167 166
Japan 155 153
U.S. 122 125
Other 441 416
885 860
As shown, most of our common stock investments continue to be outside of North America –
particularly in Asia. Our S&P500 Index puts and our similar contracts on technology stocks are
included in Other. Over time, we expect to realize gains on these investments – particularly if
there is a full testing of our ‘‘doomsday’’ scenario.
Miscellaneous
In 2000, Fairfax and its subsidiaries donated $2.4 million to a variety of charities across North
America. On a cumulative basis, since we began our donations program in 1991, we have
donated $18.4 million to charitable institutions – and to think our whole company was worth
$1.8 million when we began in September 1985!
Please review page 98 which is an unaudited unconsolidated balance sheet showing you where
your money is invested. We have yet to list on the NYSE as the lower Canadian dollar has not
made it conducive to unwind our foreign exchange hedges. However, it will be only a question
of time before we list on the Big Board.
Given our poor performance in 1999/2000, I noticed that we have attracted for the first time
a new type of investor in Fairfax – a few short sellers!! We had 47,100 shares sold short
(i.e. hoping to benefit from a decline in our share price) as of December 31, 2000 – and I
thought we attracted long term investors only!
Our strengths that we listed for you in the 1997 Annual Report continue to hold – and so have
the risks, listed again on pages 88 and 89. We are very disappointed with our performance for
you, our shareholders, in the last two years. Rest assured that we are totally focused on
achieving our objective of a 20% return on equity over time – again. I wish I could tell you
when but, like each of the past 15 years, I couldn’t forecast the next quarter, let alone the next
year. However, with the best management team we have ever had, investment portfolios of
approximately $15 billion and some better fortune, we expect to get into your good books
again.
Our Annual Meeting this year will continue to be held at the Metro Toronto Convention
Centre and will take place on Tuesday, April 17, 2001 in Room 106 at 9:30 a.m. We will be
ready to answer all your questions and, of course, all our Presidents, Fairfax officers and
Hamblin Watsa principals will also be there to share in the glory!
26

John Puddington will be retiring this year as a director of Fairfax. John has been a pleasure to
work with for the past ten years and has always been supportive of our company and its
interests. As we wish him all the best in the future, we welcome Paul Ingrey to the Board. Paul
has had one of the best track records in the reinsurance business, having founded and run
F&G Re (part of U.S. F&G, now St. Paul’s) for 14 years with a cumulative combined ratio of
91%. We look forward to Paul’s wise counsel in the years to come.
I want to again highlight our website for you (www.fairfax.ca) and remind you that all our
16 Annual Reports are readily available there. Our press releases are immediately posted to our
website. Our quarterly reports for 2001 will be posted to our website on the following days after
the market close: first quarter – May 3, second quarter – August 7, and third quarter –
November 6. Our Annual Report will be posted on March 8, 2002.
Again, on your behalf, I would like to thank the Board and the management and employees of
all our companies for their dedication and commitment during an extremely difficult year.
March 1, 2001
V. Prem Watsa
Chairman and
Chief Executive Officer
27
V. Prem Watsa (signed)

FAIRFAX FINANCIAL HOLDINGS LIMITED
Consolidated Financial Statements
Consolidated Balance Sheetsas at December 31, 2000 and 1999
2000 1999($000) ($000)
Assets
Cash and short term investments ************************* 450,205 613,197
Marketable securities ************************************* 95,235 99,479
Accounts receivable and other **************************** 2,917,416 2,589,452
Recoverable from reinsurers (note 8) ********************** 11,099,462 9,743,256
Income taxes refundable ********************************* – 83,167
14,562,318 13,128,551
Portfolio investments (note 2)
Subsidiary cash and short term investments
(market value – $1,955,476; 1999 – $1,846,706)********** 1,955,476 1,846,706
Bonds (market value – $11,295,015; 1999 – $12,065,723) *** 11,758,316 13,306,760
Preferred stocks (market value – $69,522; 1999 – $132,614) *** 70,212 133,928
Common stocks (market value – $859,751;
1999 – $1,413,643) ************************************ 884,948 1,397,905
Real estate (market value – $76,347; 1999 – $80,735)******* 76,347 80,735
Total (market value – $14,256,111; 1999 – $15,539,421) **** 14,745,299 16,766,034
Investments in Hub and Zenith National ****************** 396,539 363,380
Deferred premium acquisition costs *********************** 386,689 361,146
Future income taxes (note 9) ***************************** 1,276,291 893,034
Capital assets ******************************************** 140,752 122,223
Goodwill ************************************************ 259,652 246,099
Other assets ********************************************* 65,751 98,622
31,833,291 31,979,089
Signed on behalf of the Board
Director
Director
28
V. Prem Watsa (signed)
Robbert Hartog (signed)

2000 1999($000) ($000)
Liabilities
Lindsey Morden bank indebtedness *********************** 42,469 43,801
Accounts payable and accrued liabilities ******************* 1,449,437 1,385,613
Funds withheld payable to reinsurers********************** 1,325,320 1,198,516
2,817,226 2,627,930
Provision for claims (note 3)****************************** 20,225,831 20,442,199
Unearned premiums ************************************* 2,252,312 2,276,344
Long term debt (note 5)********************************** 1,990,627 2,102,010
Trust preferred securities of subsidiaries (note 6) *********** 392,022 378,789
24,860,792 25,199,342
Non-controlling interests ********************************* 645,159 601,595
Excess of net assets acquired over purchase price paid ****** 129,808 234,243
Shareholders’ Equity
Common stock (note 7) ********************************** 2,012,916 2,066,297
Preferred stock (note 7) ********************************** 200,000 200,000
Retained earnings**************************************** 1,167,390 1,049,682
3,380,306 3,315,979
31,833,291 31,979,089
29

FAIRFAX FINANCIAL HOLDINGS LIMITED
Consolidated Statements of Earningsfor the years ended December 31, 2000 and 1999
2000 1999($000) ($000)
Revenue
Gross premiums written ********************************* 6,054,324 5,707,518
Net premiums written*********************************** 4,566,478 4,151,129
Net premiums earned *********************************** 4,610,662 4,470,719
Interest and dividends (note 2) ************************** 818,069 752,980
Realized gains on investments (note 2) ******************* 382,849 121,670
Claims fees ********************************************* 376,943 443,085
6,188,523 5,788,454
Expenses
Losses on claims **************************************** 3,874,882 3,578,337
Operating expenses ************************************* 1,297,758 1,216,326
Commissions, net*************************************** 885,247 869,696
Interest expense **************************************** 179,600 141,410
Restructuring and other costs **************************** 30,240 —
Kingsmead losses (note 14) ****************************** 32,963 —
Negative goodwill*************************************** (79,245) —
6,221,445 5,805,769
Earnings (loss) before income taxes ******************* (32,922) (17,315)
Provision for (recovery of) income taxes (note 9)************ (186,381) (152,085)
Earnings from operations ********************************** 153,459 134,770
Non-controlling interests ********************************** (16,018) (10,562)
Net earnings ******************************************** 137,441 124,208
Net earnings per share (note 13)************************ $ 9.41 $ 9.20
Consolidated Statements of Retained Earningsfor the years ended December 31, 2000 and 1999
2000 1999($000) ($000)
Retained earnings – beginning of year **************** 1,049,682 1,016,511
Net earnings for the year ******************************** 137,441 124,208
Excess over stated value of shares purchased for
cancellation (note 7) ********************************** (6,305) (91,037)
Preferred share dividends ******************************** (13,428) –
Retained earnings – end of year *********************** 1,167,390 1,049,682
30
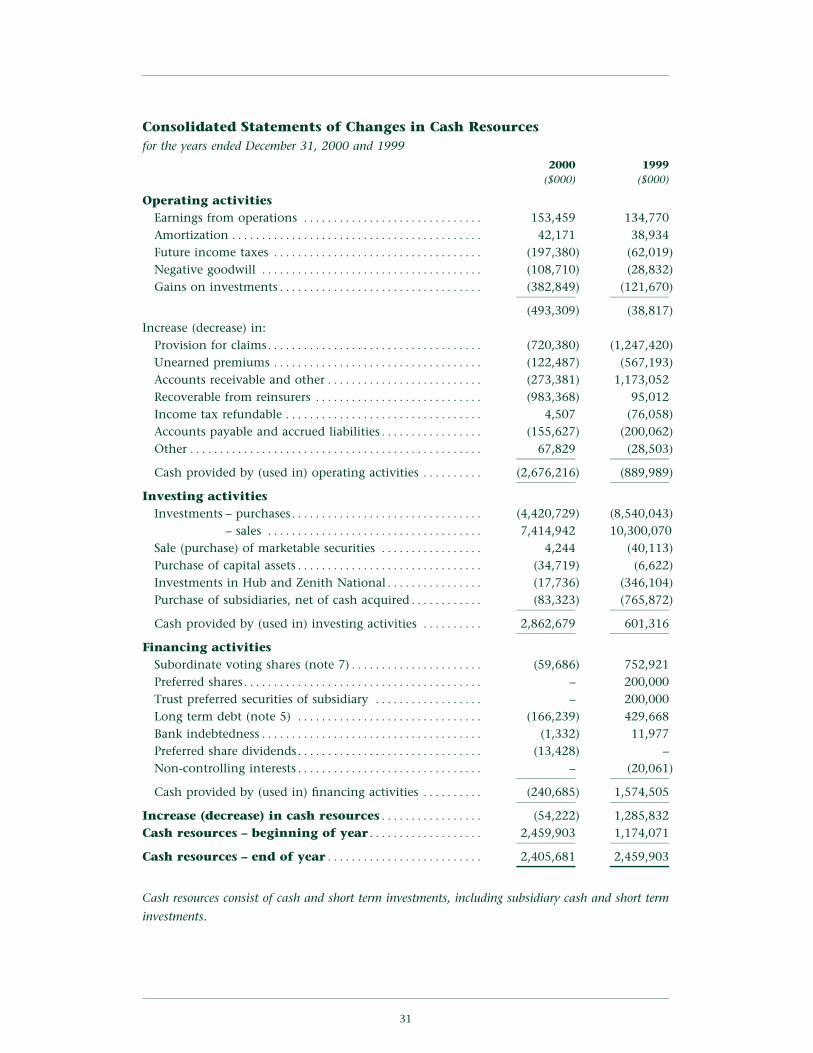
Consolidated Statements of Changes in Cash Resourcesfor the years ended December 31, 2000 and 1999
2000 1999($000) ($000)
Operating activitiesEarnings from operations ****************************** 153,459 134,770Amortization ****************************************** 42,171 38,934Future income taxes *********************************** (197,380) (62,019)Negative goodwill ************************************* (108,710) (28,832)Gains on investments********************************** (382,849) (121,670)
(493,309) (38,817)Increase (decrease) in:
Provision for claims************************************ (720,380) (1,247,420)Unearned premiums *********************************** (122,487) (567,193)Accounts receivable and other************************** (273,381) 1,173,052Recoverable from reinsurers **************************** (983,368) 95,012Income tax refundable ********************************* 4,507 (76,058)Accounts payable and accrued liabilities***************** (155,627) (200,062)Other ************************************************* 67,829 (28,503)
Cash provided by (used in) operating activities ********** (2,676,216) (889,989)
Investing activitiesInvestments – purchases******************************** (4,420,729) (8,540,043)
– sales ************************************ 7,414,942 10,300,070Sale (purchase) of marketable securities ***************** 4,244 (40,113)Purchase of capital assets******************************* (34,719) (6,622)Investments in Hub and Zenith National**************** (17,736) (346,104)Purchase of subsidiaries, net of cash acquired************ (83,323) (765,872)
Cash provided by (used in) investing activities ********** 2,862,679 601,316
Financing activitiesSubordinate voting shares (note 7)********************** (59,686) 752,921Preferred shares**************************************** – 200,000Trust preferred securities of subsidiary ****************** – 200,000Long term debt (note 5) ******************************* (166,239) 429,668Bank indebtedness************************************* (1,332) 11,977Preferred share dividends******************************* (13,428) –Non-controlling interests******************************* – (20,061)
Cash provided by (used in) financing activities ********** (240,685) 1,574,505
Increase (decrease) in cash resources***************** (54,222) 1,285,832Cash resources – beginning of year******************* 2,459,903 1,174,071
Cash resources – end of year************************** 2,405,681 2,459,903
Cash resources consist of cash and short term investments, including subsidiary cash and short term
investments.
31

FAIRFAX FINANCIAL HOLDINGS LIMITED
February 7, 2001
Auditors’ Report to the Shareholders
We have audited the consolidated balance sheets of Fairfax Financial Holdings Limited as at
December 31, 2000 and 1999 and the consolidated statements of earnings, retained earnings
and changes in cash resources for the years then ended. These financial statements are the
responsibility of the company’s management. Our responsibility is to express an opinion on
these financial statements based on our audits.
We conducted our audits in accordance with Canadian generally accepted auditing standards.
Those standards require that we plan and perform an audit to obtain reasonable assurance
whether the financial statements are free of material misstatement. An audit includes
examining, on a test basis, evidence supporting the amounts and disclosures in the financial
statements. An audit also includes assessing the accounting principles used and significant
estimates made by management, as well as evaluating the overall financial statement
presentation.
In our opinion, these consolidated financial statements present fairly, in all material respects,
the financial position of the company as at December 31, 2000 and 1999 and the results of its
operations and its cash flows for the years then ended in accordance with Canadian generally
accepted accounting principles.
PricewaterhouseCoopers LLP
Chartered Accountants
Toronto, Ontario
February 7, 2001
Valuation Actuary’s Report
PricewaterhouseCoopers LLP has reviewed management’s valuation, including management’s
selection of appropriate assumptions and methods, of the policy liabilities of the subsidiary
insurance and reinsurance companies of Fairfax Financial Holdings Limited in its consolidated
balance sheet at December 31, 2000 and their change as reflected in its consolidated statement
of earnings for the year then ended, in accordance with accepted actuarial practice.
In our opinion, management’s valuation is appropriate, except as noted in the following
paragraph, and the consolidated financial statements fairly present its results.
Under accepted actuarial practice, the valuation of policy liabilities reflects the time value of
money. Management has chosen not to reflect the time value of money in its valuation of the
policy liabilities.
PricewaterhouseCoopers LLP
Richard Gauthier, FCIA, FCAS
Toronto, Ontario
32
PricewaterhouseCoopers LLP (signed)
PricewaterhouseCoopers LLP (signed)

Notes To Consolidated Financial Statementsfor the years ended December 31, 2000 and 1999
(in $000s except per share amounts and as otherwise indicated)
1. Summary of Significant Accounting Policies
The preparation of financial statements in accordance with generally accepted accounting
principles requires management to make estimates and assumptions that affect reported
amounts of assets and liabilities and disclosures of contingent assets and liabilities as at the
date of the financial statements and the reported amounts of revenue and expenses during the
periods covered by the financial statements. Actual results could differ from those estimates.
Business operations
The company is a financial services holding company which, through its subsidiaries, is
principally engaged in property and casualty insurance conducted on a direct and reinsurance
basis, investment management and insurance claims management.
Principles of consolidation
The consolidated financial statements include the accounts of the company and all of its
subsidiaries:
Insurance Reinsurance group
Commonwealth Insurance Company Odyssey America Reinsurance Corporation
Crum & Forster Holdings, Inc. Compagnie Transcontinentale de
Falcon Insurance Company Limited Reassurance
Federated Insurance Holdings of Syndicate 1218 at Lloyd’s
Canada Ltd. Other reinsurance subsidiariesLombard General Insurance Company
CRC (Bermuda) Reinsurance Limitedof Canada
ORC Re LimitedMarkel Insurance Company of Canada
Wentworth Insurance Company Ltd.Ranger Insurance Company
TIG Specialty Insurance Company
Runoff
The Resolution Group, Inc.
Sphere Drake Limited
Odyssey Re Stockholm Insurance Corporation (publ)
Other
Hamblin Watsa Investment Counsel Ltd. (investment management)
Lindsey Morden Group Inc. (insurance claims management)
All subsidiaries are wholly-owned except for The Resolution Group with an effective 27.5%
economic and 100% voting interest, and Lindsey Morden with a 66.5% equity and 85.9%
voting interest. The company has investments in Hub International Limited with a 41.7%
equity interest and Zenith National Insurance Corp. with a 39.0% equity interest. The
company has an agreement with Zenith National that it will not seek to control or influence
Zenith’s Board of Directors, management or policies.
33

FAIRFAX FINANCIAL HOLDINGS LIMITED
Acquisitions are accounted for by the purchase method, whereby the results of acquired
companies are included only from the date of acquisition. Divestitures are included up to the
date of disposal.
Premiums
Insurance and reinsurance premiums are taken into income evenly throughout the terms of
the related policies.
Deferred premium acquisition costs
Certain costs, consisting of brokers’ commissions and premium taxes, of acquiring insurance
premiums are deferred, to the extent that they are considered recoverable, and charged to
income as the premiums are earned. The ultimate recoverability of deferred premium
acquisition costs is determined without regard to investment income.
Investments
Bonds are carried at amortized cost providing for the amortization of the discount or premium
on a yield to maturity basis. Preferred and common stocks are carried at cost. Real estate is
carried at book value. When there has been a loss in value of an investment that is other than
temporary, the investment is written down to its estimated net realizable value. Such
writedowns are reflected in realized gains (losses) on investments. At December 31, 2000, the
aggregate provision for losses on investments was $ 22.7 million (1999 – $26.4 million).
The company purchases foreign currency forward contracts to hedge its foreign equity
portfolio. At December 31, 2000, the company held Yen 22.5 billion of such contracts,
maturing in 2002 and 2003. Once the securities are sold, the contracts are closed out and any
gain or loss is then included in realized gain or loss on sale of investments. Gains or losses on
contracts in excess of hedging requirements are recorded in income as they arise.
Provision for claims
Claim provisions are established by the case method as claims are reported. For reinsurance,
the provision for claims is based on reports and individual case estimates received from ceding
companies. The estimates are regularly reviewed and updated as additional information on the
estimated claims becomes known and any resulting adjustments are included in income. A
provision is also made for management’s calculation of factors affecting the future
development of claims including claims incurred but not reported (IBNR) based on the volume
of business currently in force and the historical experience on claims.
Translation of foreign currencies
Assets and liabilities in foreign currencies are translated into Canadian dollars at year-end
exchange rates. Income and expenses are translated at the exchange rates in effect at the date
incurred. Realized gains and losses on foreign exchange transactions are recognized in the
statements of earnings.
The operations of the company’s subsidiaries (principally in the United States, France and the
U.K.) are self-sustaining. As a result, the assets and liabilities of these subsidiaries are translated
at the year-end rates of exchange. Revenue and expenses are translated at the average rate of
34
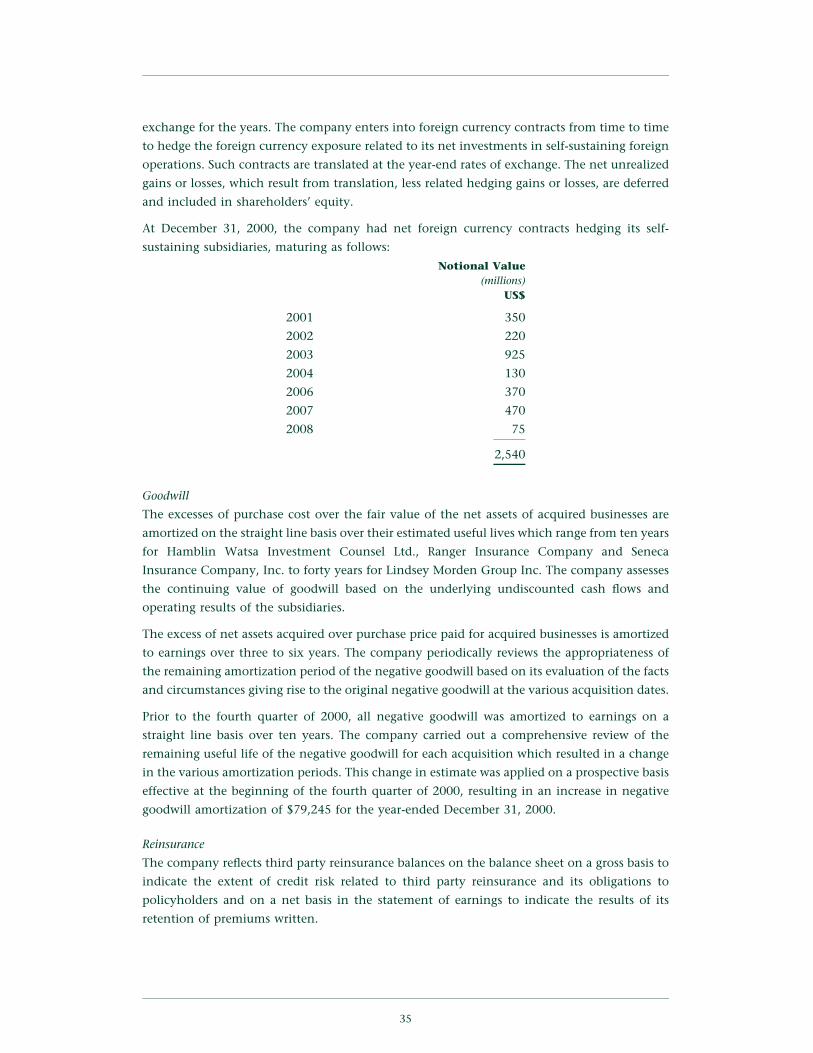
exchange for the years. The company enters into foreign currency contracts from time to time
to hedge the foreign currency exposure related to its net investments in self-sustaining foreign
operations. Such contracts are translated at the year-end rates of exchange. The net unrealized
gains or losses, which result from translation, less related hedging gains or losses, are deferred
and included in shareholders’ equity.
At December 31, 2000, the company had net foreign currency contracts hedging its self-
sustaining subsidiaries, maturing as follows:
Notional Value(millions)
US$
2001 350
2002 220
2003 925
2004 130
2006 370
2007 470
2008 75
2,540
Goodwill
The excesses of purchase cost over the fair value of the net assets of acquired businesses are
amortized on the straight line basis over their estimated useful lives which range from ten years
for Hamblin Watsa Investment Counsel Ltd., Ranger Insurance Company and Seneca
Insurance Company, Inc. to forty years for Lindsey Morden Group Inc. The company assesses
the continuing value of goodwill based on the underlying undiscounted cash flows and
operating results of the subsidiaries.
The excess of net assets acquired over purchase price paid for acquired businesses is amortized
to earnings over three to six years. The company periodically reviews the appropriateness of
the remaining amortization period of the negative goodwill based on its evaluation of the facts
and circumstances giving rise to the original negative goodwill at the various acquisition dates.
Prior to the fourth quarter of 2000, all negative goodwill was amortized to earnings on a
straight line basis over ten years. The company carried out a comprehensive review of the
remaining useful life of the negative goodwill for each acquisition which resulted in a change
in the various amortization periods. This change in estimate was applied on a prospective basis
effective at the beginning of the fourth quarter of 2000, resulting in an increase in negative
goodwill amortization of $79,245 for the year-ended December 31, 2000.
Reinsurance
The company reflects third party reinsurance balances on the balance sheet on a gross basis to
indicate the extent of credit risk related to third party reinsurance and its obligations to
policyholders and on a net basis in the statement of earnings to indicate the results of its
retention of premiums written.
35

FAIRFAX FINANCIAL HOLDINGS LIMITED
Income taxes
Income taxes reflect the expected future tax consequences of temporary differences between
the carrying amounts of assets and liabilities and their tax bases based on tax rates which are
expected to be in effect when the asset or liability is settled.
2. Investment Information
2000 1999Book Estimated Book EstimatedValue Fair Value Value Fair Value($000) ($000) ($000) ($000)
Subsidiary cash and short term
investments 1,955,476 1,955,476 1,846,706 1,846,706
Bonds
Canadian – government 851,866 798,257 785,073 727,547
– corporate 237,946 223,617 276,847 248,003
U.S. – government 4,882,611 4,785,107 6,151,941 5,490,068
– corporate 5,203,215 4,929,031 5,369,040 4,916,635
Other – government 414,848 406,010 574,247 543,759
– corporate 167,830 152,993 149,612 139,711
Preferred stocks
Canadian 70,212 69,522 113,994 112,680
Other – – 19,934 19,934
Common stocks
Canadian 166,514 165,706 222,998 202,930
U.S. 122,024 124,685 298,331 255,861
Other 596,410 569,360 876,576 954,852
Real estate 76,347 76,347 80,735 80,735
14,745,299 14,256,111 16,766,034 15,539,421
The estimated fair values of preferred and common stocks and debt securities are based on
quoted market values. The book value of real estate approximates fair value. At December 31,
2000, the company had S&P put contracts with a weighted average strike price of 1,277 and a
notional value of US$700 million. The premiums paid to acquire these contracts are being
charged to realized losses on equity investments on a straight line basis over their term to
maturity in December 2001.
Management has reviewed currently available information regarding those investments whose
estimated fair value is less than book value, amounting to an aggregate unrealized loss of
$602,954 at December 31, 2000, and has determined that the book values are expected to be
recovered. Debt securities whose book value exceeds market value can be held until maturity.
Preferred and common stock investments have been reviewed to ensure that corporate
performance expectations have not changed significantly to adversely affect the market value
of these securities other than on a temporary basis.
36

The company’s subsidiaries have pledged (either directly or indirectly to support letters of
credit, including $136 million of intercompany letters of credit) cash and investments of
$2.6 billion as security for reinsurance balances and regulatory deposits.
Liquidity and Interest Rate Risk
Maturity profile as at December 31, 2000:
Within 1 1 to 5 6 to 10 Over 10Year Years Years Years Total
($000) ($000) ($000) ($000) ($000)
Bonds (book value) 180,148 3,047,238 6,154,034 2,376,896 11,758,316
Effective interest rate 5.9%
Bonds are classified at the earliest of the available maturity dates.
Investment Income2000 1999
($000) ($000)
Interest and dividends:
Cash and short term investments 109,434 89,929
Bonds 655,639 640,474
Preferred stocks 4,689 7,371
Common stocks 54,193 20,348
823,955 758,122
Expenses (5,886) (5,142)
818,069 752,980
Gain on sale of investments:
Bonds 22,383 31,194
Preferred stocks (174) 10
Common stocks 402,996 95,944
Other (20,913) (6,151)
Change in provision for loss (21,443) 673
382,849 121,670
Net investment income 1,200,918 874,650
37

FAIRFAX FINANCIAL HOLDINGS LIMITED
3. Provision for Claims
The provisions for unpaid claims and adjustment expenses and for the third party reinsurers’
share thereof are estimates subject to variability, and the variability could be material in the
near term. The variability arises because all events affecting the ultimate settlement of claims
have not taken place and may not take place for some time. Variability can be caused by receipt
of additional claim information, changes in judicial interpretation of contracts or liability or
significant changes in severity or frequency of claims from historical trends. The estimates are
principally based on the company’s historical experience. Methods of estimation have been
used which the company believes produce reasonable results given current information.
Changes in claim liabilities recorded on the balance sheet for the years ended December 31,
2000 and 1999 and their impact on unpaid claims and adjustment expenses for these two years
are as shown in the following table:
2000 1999($000) ($000)
Unpaid claim liabilities – beginning of year – net 12,179,511 9,320,581
Foreign exchange effect of change in claim liabilities 388,624 (438,057)
Increase in estimated losses and expenses for losses occurring
in prior years 680,413 83,238
Recovery under Swiss Re cover (404,011) (89,720)
Provision for losses and expenses on claims occurring in the
current year 3,465,266 2,695,419
Paid on claims occurring during:
the current year (983,921) (793,294)
prior years (4,242,419) (2,054,037)
Unpaid claim liabilities at December 31 of:
Seneca 71,392 –
TIG – 1,187,246
Odyssey America Re – 1,394,859
TRG – 873,276
Unpaid claim liabilities – end of year – net 11,154,855 12,179,511
Unpaid claim liabilities at December 31 of Federated Life 30,725 28,500
Unpaid claim liabilities – end of year – net 11,185,580 12,208,011
Reinsurance gross-up 9,040,251 8,234,188
Unpaid claim liabilities – end of year – gross 20,225,831 20,442,199
The foreign exchange effect of change in claim liabilities results from the fluctuation of the
value of the Canadian dollar in relation to the U.S. dollar and European currencies.
The basic assumptions made in establishing actuarial liabilities are best estimates of possible
outcomes. The company presents its claims on an undiscounted basis.
The company’s provision for asbestos, pollution and other hazards claims is set out in the table
on page 74 of the MD&A.
38

As part of its acquisition strategy, the company generally obtains vendor indemnifications
from adverse development in the acquired company’s claims reserves and unrecoverable
reinsurance. A summary of these indemnifications is set out in the table on page 79 of the
MD&A.
4. Contingent Value Rights
As part of the consideration for the purchase of Sphere Drake, the company issued contingent
value rights (‘‘CVRs’’) of US$170.4 million (including effectively 8% interest per annum)
payable in 2007, subject to earlier redemption at the option of the company. The amount
payable at maturity is subject to adjustments for the development of Sphere Drake’s provision
for claims as of December 31, 1996, the development of Sphere Drake’s reserves for
unrecoverable receivables from reinsurers and indemnifiers as of December 31, 1996, the result
of commutations and certain actuarial expenses. At December 31, 2000, adverse development
has amounted to $209.7 million (US$139.6 million), with a remaining CVR obligation of
US$30.8 million (the present value of which at December 31, 2000 was $27.0 million
(US$18.0 million)).
39

FAIRFAX FINANCIAL HOLDINGS LIMITED
5. Long Term Debt
The long term debt at December 31 consists of the following balances:
2000 1999($000) ($000)
Fairfax unsecured note with interest based on STIBOR due
September 4, 2000 – 53,925
Fairfax unsecured senior notes of US$100 million at 7.75% due
December 15, 2003 150,200 145,130
Fairfax unsecured senior note at 7.75% due December 15, 2003 25,000 25,000
Fairfax unsecured senior notes of US$275 million at 73/8% due
March 15, 2006(1) 413,050 399,107
Fairfax FF300 million unsecured debt at 21/2% due February 27,
2007 (effectively a FF200 million debt at 8%) 52,487 51,699
Fairfax unsecured senior notes of US$175 million at 6.875% due
April 15, 2008(1) 262,850 253,977
Fairfax unsecured senior notes of US$100 million at 8.25% due
October 1, 2015(1) 150,200 145,130
Fairfax unsecured senior notes of US$225 million at 7.375% due
April 15, 2018(1)(2) 337,950 326,542
Fairfax unsecured senior notes of US$125 million at 8.30% due
April 15, 2026(1) 187,750 181,413
Fairfax unsecured senior notes of US$125 million at 7.75% due
July 15, 2037(1) 187,750 181,413
Mandatory redeemable preferred stock of TIG, with an annual
cash dividend of US$7.75 per share and redemption value of
US$100 per share, due April 27, 2000 (250,000 shares) – 36,282
TIG senior unsecured non-callable notes of US$100 million at
8.125% due April 15, 2005 148,915 145,130
Other long term debt of TIG 27,766 40,211
Lindsey Morden unsecured Series B debentures at 7% due
June 16, 2008 125,000 125,000
Other long term debt of Lindsey Morden 14,249 17,968
Other long term debt of The Resolution Group – 60,229
2,083,167 2,188,156
Less: Lindsey Morden debentures held by Fairfax (8,218) (8,218)
Fairfax debentures held by subsidiaries (84,322) (77,928)
1,990,627 2,102,010
(1) The company has entered into various interest rate swap agreements on the above-noted debt with
an aggregate balance of $1,539,550 whereby it now pays interest on that debt at a rate linked to
LIBOR or as noted in (2) below, saving approximately 69 basis points on average during 2000.
(2) During 1998, the company swapped US$125 million of its debt at 7.375% due April 15, 2018 for
Japanese yen denominated debt of the same maturity, with fixed interest at 3.48% per annum.
40

The pre-tax unrealized loss, net of accumulated amortization, on the foreign exchange component
of the yen debt swap amounted to $24.1 million at December 31, 2000 and is being amortized to
income over the remaining term to maturity.
Interest expense on long term debt amounted to $174,071 (1999 – $138,613). Interest expense
on Lindsey Morden’s bank indebtedness amounted to $5,529 (1999 – $2,797).
Principal repayments are due as follows:
($000)
2001 10,742
2002 14,141
2003 181,670
2004 4,313
2005 149,910
Thereafter 1,629,851
6. Trust Preferred Securities of Subsidiaries
TIG Holdings has issued $187,750 (US$125 million) of 8.597% junior subordinated debentures
to TIG Capital Trust (a statutory business trust subsidiary of TIG Holdings) which, in turn,
issued US$125 million of 8.597% mandatory redeemable capital securities, maturing in 2027.
Fairfax RHINOS Trust (a statutory business trust subsidiary of Fairfax Inc.) has issued $204,272
(US$136 million) of Redeemable Hybrid Income Overnight Shares (RHINOS) (136,000 trust
preferred securities) with a distribution rate of LIBOR plus 150 basis points maturing
February 24, 2003. The company has agreed to issue US$136 million of subordinate voting
shares (or convertible preferred shares) by November 24, 2002, which proceeds will be used to
mandatorily redeem the outstanding RHINOS.
7. Capital Stock
Authorized capital
The authorized share capital of the company consists of an unlimited number of preferred
shares issuable in series, an unlimited number of multiple voting shares carrying ten votes per
share and an unlimited number of subordinate voting shares carrying one vote per share.
41

FAIRFAX FINANCIAL HOLDINGS LIMITED
Issued capital
2000 1999number ($000) number ($000)
Multiple voting shares 1,548,000 5,000 1,548,000 5,000
Subordinate voting shares 12,352,118 2,026,938 12,677,427 2,080,319
13,900,118 2,031,938 14,225,427 2,085,319
Interest in shares held through
ownership interest in shareholder (799,230) (19,022) (799,230) (19,022)
Net shares effectively outstanding 13,100,888 2,012,916 13,426,197 2,066,297
Fixed/floating cumulative redeemable
preferred shares, Series A, with a
fixed dividend of 6.5% per annum
until November 30, 2004 and stated
capital of $25 per share 8,000,000 200,000 8,000,000 200,000
In 2000, under the terms of normal course issuer bids approved by The Toronto Stock
Exchange, the company purchased and cancelled 325,309 subordinate voting shares for an
aggregate cost of $59,686, of which $6,305 was charged to retained earnings.
In 1999, under the terms of normal course issuer bids approved by the Toronto Stock
Exchange, the company purchased and cancelled 706,103 subordinate voting shares for an
aggregate cost of $206,779, of which $91,037 was charged to retained earnings.
On November 18, 1999, the company issued 8,000,000 fixed/floating cumulative redeemable
preferred shares, Series A, at $25 per share for cash of $200 million.
8. Reinsurance
The company follows the policy of underwriting and reinsuring contracts of insurance and
reinsurance which, depending on the type of contract, generally limits the liability of the
individual insurance and reinsurance subsidiaries to a maximum amount on any one loss of
$7.5 million. Reinsurance is generally placed on an excess of loss basis in several layers. The
company’s reinsurance does not, however, relieve the company of its primary obligation to the
policyholders.
The company has guidelines and a review process in place to assess the creditworthiness of the
companies to which it cedes.
The company makes specific provisions against reinsurance recoverable from companies
considered to be in financial difficulty. In addition, the company records a general allowance
based upon analysis of historical recoveries, the level of allowance already in place and
management’s judgment. The allocation of the allowance for loss is as follows:
42

2000 1999($000) ($000)
Specific 785,207 895,104
General 134,740 73,302
Total 919,947 968,406
A summary of the company’s major reinsurers, showing their A.M. Best rating and outstanding
balance at December 31, 2000, is set out in the table on page 76 of the MD&A.
During the year, the company ceded premiums earned of $1,427,086 (1999 – $1,522,714) and
$2,540,552 (1999 – $2,540,104) of claims incurred.
9. Income Taxes
The provision for income taxes differs from the statutory marginal rate as certain sources of
income are exempt from tax or are taxed at other than the marginal rate.
A reconciliation of income tax calculated at the statutory marginal tax rate with the income
tax provision at the effective tax rate in the financial statements is summarized in the
following table:
2000 1999($000) ($000)
Provision for (recovery of) income taxes at
statutory marginal income tax rate (14,469) (7,705)
Non-taxable investment income (13,666) (28,888)
Income earned outside Canada (149,823) (72,400)
Negative goodwill amortization (49,508) (11,548)
Change in tax rate for future income taxes 7,900 –
Unrecorded tax benefit of losses and utilization of
prior years’ losses 33,185 (31,544)
Provision for (recovery of) income taxes (186,381) (152,085)
Future income taxes of the company are as follows:
2000 1999($000) ($000)
Operating and capital losses 784,726 508,592
Claims discount 436,976 357,215
Unearned premium reserve 104,786 103,510
Deferred premium acquisition cost (104,261) (105,871)
Investments (24,803) (135,230)
Allowance for doubtful accounts 16,737 34,735
Other 130,139 181,786
Valuation allowance (68,009) (51,703)
Future income taxes 1,276,291 893,034
43

FAIRFAX FINANCIAL HOLDINGS LIMITED
The future income tax asset relating to these losses is expected to be recovered from future
profitable operations.
10. Statutory Requirements
The company’s insurance and reinsurance subsidiaries are subject to certain requirements and
restrictions under their respective insurance company Acts including minimum capital
requirements and dividend restrictions.
The company can receive up to $343 million as dividends from insurance and reinsurance
subsidiaries without obtaining the prior approval of insurance regulators.
At December 31, 2000, statutory surplus, determined in accordance with the various insurance
regulations, amounted to $3.5 billion for the insurance subsidiaries, $1.6 billion for the
reinsurance subsidiaries and $1.1 billion for the runoff subsidiaries.
11. Contingencies and Commitments
In 2000, the legal proceedings commenced by Sphere Drake in 1999 against a group of agents
and intermediaries whom it alleged fraudulently obtained and utilized a binding authority to
write reinsurance contracts which expose Sphere Drake to significantly under-priced
U.S. workers’ compensation business, which was filed in New York, was dismissed as to most
defendants primarily on the ground that London, England was a more convenient forum in
which the dispute should be resolved. Sphere Drake subsequently commenced proceedings in
London, England against its agent and the agent of the cedants, alleging fraud and breach of
duty. Sphere Drake has rescinded the majority of the inward reinsurance contracts placed
under the binding authority and is defending arbitration proceedings initiated by the cedants
of a number of those contracts. It is not yet possible to develop any reasonably based estimates
of the amount of claims which might be made on these contracts. However, based on
extensive legal advice, Sphere Drake believes that there is abundant evidence of fraud and that
it has substantial grounds to challenge the enforceability of the business bound on its behalf.
While the eventual outcome is uncertain, the company believes that the likely ultimate net
liability which might arise in respect of this business will not be material to Sphere Drake’s
financial position.
Subsidiaries of the company are also defendants in several damage suits and have been named
as third party in other suits. The uninsured exposure to the company is not considered to be
material to the company’s financial position.
Unsecured letters of credit aggregating $459 million have been issued upon the company’s
application and have been pledged as security for subsidiaries’ reinsurance balances,
principally relating to intercompany reinsurance between subsidiaries. These are unsecured
letters of credit in addition to the secured letters of credit referred to in note 2.
The company may under certain circumstances be obligated to purchase loans to officers and
directors of the company and its subsidiaries from Canadian chartered banks totalling $16,559
(1999 – $15,728) for which 315,861 (1999 – 335,846) subordinate voting shares of the
company with a year-end market value of $72,174 (1999 – $82,450) have been pledged as
security. The company has a restricted stock plan for the management of its subsidiaries with
vesting periods of up to ten years from the date of grant. Stock grant costs are amortized to
compensation expense over the vesting period. Shares for the plan are purchased on the open
44

market. At December 31, 2000, 227,338 subordinate voting shares had been purchased for the
plan at a cost of $66,899. Amortization expense for the year for stock grant costs amounted to
$6,214.
12. Operating Leases
Aggregate future commitments at December 31, 2000 under operating leases relating to
premises, automobiles and equipment for various terms up to ten years are as follows:
($000)
2001 91,838
2002 76,401
2003 63,229
2004 51,203
2005 45,598
Thereafter 103,145
13. Earnings per Share
Earnings per share are calculated after providing for dividends on the Series A fixed/floating
cumulative redeemable preferred shares.
Fully diluted and basic earnings per share are the same in 2000 and 1999. The weighted average
number of shares for 2000 was 13,172,448 (1999 – 13,331,671).
14. Acquisitions
Effective August 31, 2000, Crum & Forster purchased Sen-Tech Holdings, Inc. (and its wholly-
owned subsidiary, Seneca Insurance Company, Inc. of New York) for US$65 million
($96 million) cash. Effective December 21, 2000, Crum & Forster also purchased Transnational
Insurance Company for US$17 million ($26 million) cash. At the respective dates of
acquisition, the companies had US$193 million in total assets and US$119 million in total
liabilities, at fair value, resulting in goodwill of US$8 million which is being amortized on a
straight line basis over 10 years.
Effective August 11, 1999, the company purchased the class 1 voting shares of TRG Holding
Corporation of Chicago for US$97 million ($144 million) cash. At August 11, 1999, TRG had
US$2.6 billion in total assets and US$2.1 billion in total liabilities, at fair value, and non-
controlling interest (consisting of class 2 non-voting participating preferred shares) of
US$368 million, resulting in an excess of the fair value of net assets acquired over the purchase
price paid of US$40.0 million. Effective December 31, 1992, Ridge Re, a wholly-owned
subsidiary of Xerox Financial Services, provided US$578 million of aggregate excess of loss
reinsurance to International Insurance, a wholly-owned subsidiary of TRG, covering any
inadequacy in International’s provision for claims as at December 31, 1992 and for any of
International’s reinsurance receivable relating to the period up to December 31, 1992 which
subsequently becomes unrecoverable, net of 15% coinsurance. International has not written
any business since 1992. At December 31, 1999, the remaining reinsurance under the Ridge Re
contract was US$212 million, net of 15% coinsurance.
Effective April 13, 1999, the company purchased TIG Holdings, Inc. of New York for
US$847 million ($1,262 million) cash. At April 13, 1999, TIG had US$7.5 billion in total assets
and US$6.7 billion in total liabilities, at fair value. As part of its acquisition of TIG, the
45

FAIRFAX FINANCIAL HOLDINGS LIMITED
company purchased a US$1 billion insurance cover from Swiss Re to protect itself from adverse
development in its subsidiaries’ (including TIG) claims reserves and unrecoverable reinsurance
at December 31, 1998. As part of the acquisition of TIG, the company acquired a 90%
ownership in Kingsmead Managing Agency, a managing agent for three Lloyd’s syndicates for
which TIG provided underwriting capacity. On June 29, 2000, the company entered into an
agreement to sell Kingsmead to Advent Capital plc for a 22% interest in Advent, which sale
closed on November 16, 2000. The company recorded operating losses from the Kingsmead-
managed syndicates of $33.0 million for the year ended December 31, 2000 and there was no
gain or loss on the sale.
15. Segmented Information
The company is a financial services holding company which, through its subsidiaries, is
primarily engaged in property and casualty insurance conducted on a direct and reinsurance
basis. The runoff business segment was formed with the acquisition of the company’s interest
in The Resolution Group (‘‘TRG’’) and its wholly-owned subsidiary, International Insurance,
on August 11, 1999 and also includes Sphere Drake, which was transferred to runoff effective
July 1, 1999, and Odyssey Re Stockholm, a runoff company purchased in September 1998. The
international runoff operations have reinsured their reinsurance portfolios to ORC Re to
provide consolidated investment and liquidity management services, with the RiverStone
Group retaining full responsibility for all other aspects of the runoff. Accordingly, for
segmented information, ORC Re is classified in the Runoff and other segment. The 1999
comparatives have been restated on a consistent basis. The company also provides claims
adjusting, appraisal and loss management services.
46
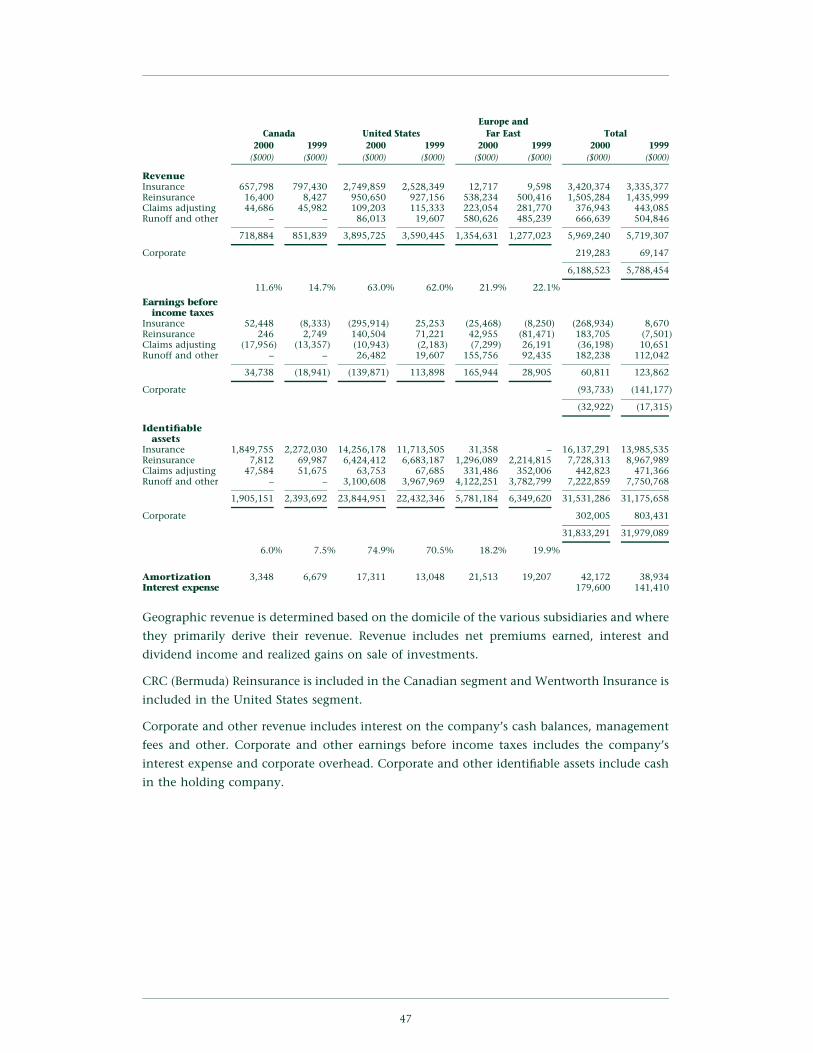
Europe andCanada United States Far East Total
2000 1999 2000 1999 2000 1999 2000 1999($000) ($000) ($000) ($000) ($000) ($000) ($000) ($000)
RevenueInsurance 657,798 797,430 2,749,859 2,528,349 12,717 9,598 3,420,374 3,335,377Reinsurance 16,400 8,427 950,650 927,156 538,234 500,416 1,505,284 1,435,999Claims adjusting 44,686 45,982 109,203 115,333 223,054 281,770 376,943 443,085Runoff and other – – 86,013 19,607 580,626 485,239 666,639 504,846
718,884 851,839 3,895,725 3,590,445 1,354,631 1,277,023 5,969,240 5,719,307
Corporate 219,283 69,147
6,188,523 5,788,454
11.6% 14.7% 63.0% 62.0% 21.9% 22.1%
Earnings beforeincome taxes
Insurance 52,448 (8,333) (295,914) 25,253 (25,468) (8,250) (268,934) 8,670Reinsurance 246 2,749 140,504 71,221 42,955 (81,471) 183,705 (7,501)Claims adjusting (17,956) (13,357) (10,943) (2,183) (7,299) 26,191 (36,198) 10,651Runoff and other – – 26,482 19,607 155,756 92,435 182,238 112,042
34,738 (18,941) (139,871) 113,898 165,944 28,905 60,811 123,862
Corporate (93,733) (141,177)
(32,922) (17,315)
Identifiableassets
Insurance 1,849,755 2,272,030 14,256,178 11,713,505 31,358 – 16,137,291 13,985,535Reinsurance 7,812 69,987 6,424,412 6,683,187 1,296,089 2,214,815 7,728,313 8,967,989Claims adjusting 47,584 51,675 63,753 67,685 331,486 352,006 442,823 471,366Runoff and other – – 3,100,608 3,967,969 4,122,251 3,782,799 7,222,859 7,750,768
1,905,151 2,393,692 23,844,951 22,432,346 5,781,184 6,349,620 31,531,286 31,175,658
Corporate 302,005 803,431
31,833,291 31,979,089
6.0% 7.5% 74.9% 70.5% 18.2% 19.9%
Amortization 3,348 6,679 17,311 13,048 21,513 19,207 42,172 38,934Interest expense 179,600 141,410
Geographic revenue is determined based on the domicile of the various subsidiaries and where
they primarily derive their revenue. Revenue includes net premiums earned, interest and
dividend income and realized gains on sale of investments.
CRC (Bermuda) Reinsurance is included in the Canadian segment and Wentworth Insurance is
included in the United States segment.
Corporate and other revenue includes interest on the company’s cash balances, management
fees and other. Corporate and other earnings before income taxes includes the company’s
interest expense and corporate overhead. Corporate and other identifiable assets include cash
in the holding company.
47

FAIRFAX FINANCIAL HOLDINGS LIMITED
16. Fair Value
Information on the fair values of financial instruments of the company where those values
differ from their carrying values in the financial statements at December 31, 2000 include:
Note Book EstimatedReference Value Fair Value
($000) ($000)
Portfolio investments 2 14,745,299 14,256,111
Investments in Hub and Zenith National – 396,539 401,630
Long term debt 5 1,990,627 1,680,016
Trust preferred securities of subsidiaries 6 392,022 335,697
Foreign exchange contracts 1 – (123,830)
The amounts do not include the fair value of underlying lines of business. While fair value
amounts are designed to represent estimates of the amounts at which instruments could be
exchanged in current transactions between willing parties, certain of the company’s financial
instruments lack an available trading market. Therefore, these instruments have been valued
on a going concern basis. Fair value information on the provision for claims is not
determinable.
These fair values have not been reflected on the financial statements.
17. US GAAP Reconciliation
The consolidated financial statements of the company have been prepared in accordance with
Canadian generally accepted accounting principles (‘‘GAAP’’) which are different in some
respects from those applicable in the United States, as described below.
Consolidated Statements of Earnings
For the years ended December 31, 2000 and 1999, significant differences between consolidated
net earnings under Canadian GAAP and consolidated net earnings under US GAAP were as
follows:
(a) In Canada, the unrealized loss on the translation of the foreign exchange component of
the yen debt swap is deferred and amortized to income over the remaining term to
maturity. In the U.S., the unrealized foreign exchange loss is recognized in income in the
year, although there is no intention to settle the swap prior to maturity.
(b) In Canada, the Swiss Re recoveries are recorded at the same time as the claims incurred are
ceded to Swiss Re. In the U.S., the Swiss Re recoveries are recorded up to the amount of the
premium paid with the excess of the ceded liabilities over the premium paid recorded as a
deferred gain. The deferred gain is amortized to income over the estimated settlement
period over which the company expects to receive the recoveries.
(c) In Canada, the amortization period of negative goodwill is periodically reviewed to
determine whether the remaining useful life continues to be appropriate or whether the
amortization period should be adjusted, based on the facts and circumstances giving rise
to the negative goodwill at the date of acquisition. In the U.S., in the case of financial
48

institutions, the SEC staff generally take exception to a negative goodwill amortization
period of less than 10 years.
(d) In Canada, the cost to close duplicate facilities in the London market operations on the
acquisition of TIG Holdings in 1999 was accrued for in the purchase equation. In the U.S.,
such costs are expensed as they relate to the closure of the company’s own operations.
(e) Under Canadian GAAP, the Canadian federal income tax rate reductions that become
effective January 1, 2001 and subsequent are reflected in the rate used to measure future
income tax balances. Under United States GAAP, Statement of Financial Accounting
Standards No. 109, ‘‘Accounting for Income Taxes’’, this rate change does not impact the
measurement of the company’s future income tax balances until it is passed into law.
The following shows the net earnings in accordance with US GAAP:
2000 1999($000) ($000)
Net earnings, Canadian GAAP 137,441 124,208
Foreign exchange gain (loss) on yen debt swap,
net of tax 9,268 (10,636)
Recovery on Swiss Re cover, net of tax (159,636) (24,154)
Amortization of negative goodwill (79,245) –
Change in tax rate for future income taxes 7,900 –
Closure costs, net of tax – (11,266)
Net earnings (loss), US GAAP (84,272) 78,152
Net earnings (loss) per share, US GAAP $ (7.42) $ 5.86
Consolidated Balance Sheets
In Canada, portfolio investments are carried at cost or amortized cost with a provision for
declines in value which are considered to be other than temporary. In the U.S., such
investments are classified as available for sale and marked to market through shareholders’
equity.
In Canada, trust preferred securities of subsidiaries (including RHINOS) are included in total
liabilities. In the U.S., trust preferred securities are shown as a separate caption after total
liabilities, in a manner similar to non-controlling interests.
49

FAIRFAX FINANCIAL HOLDINGS LIMITED
The following shows the balance sheet amounts in accordance with US GAAP, setting out
individual amounts where different from the amounts reported under Canadian GAAP:
2000 1999($000) ($000)
Assets
Portfolio investments
Bonds 11,295,015 12,065,723
Preferred stocks 69,522 132,614
Common stocks 859,751 1,413,643
Total portfolio investments 12,224,288 13,611,980
Future income taxes 1,634,520 1,402,841
Goodwill 352,092 326,282
All other assets 17,583,872 15,957,561
Total assets 31,794,772 31,298,664
Liabilities
Accounts payable and accrued liabilities 1,935,534 1,544,808
All other liabilities 25,836,559 26,019,068
Total liabilities 27,772,093 27,563,876
Trust preferred securities of subsidiaries 392,022 378,789
Non-controlling interest 645,159 601,595
Excess of net assets acquired over purchase price paid 209,053 234,243
1,246,234 1,214,627
Shareholders’ Equity
Total shareholders’ equity 2,776,445 2,520,161
The difference in consolidated shareholders’ equity is as follows:
2000 1999($000) ($000)
Shareholders’ equity based on Canadian GAAP 3,380,306 3,315,979
Other comprehensive income (336,093) (749,762)
Cumulative reduction in net earnings under US GAAP (267,768) (46,056)
Shareholders’ equity based on US GAAP 2,776,445 2,520,161
50

Statement of Financial Accounting Standards No. 130 ‘‘Reporting Comprehensive Income’’
requires the company to disclose items of other comprehensive income in a financial
statement and to disclose accumulated balances of other comprehensive income in the equity
section of a financial statement. Other comprehensive income includes unrealized gains and
losses on investments, as follows:
2000 1999($000) ($000)
Unrealized gain (loss) on investments available for sale (489,188) (1,226,613)
Less: related deferred income taxes 153,095 476,851
(336,093) (749,762)
Disclosure of interest and income taxes paid
The aggregate amount of interest paid (excluding interest received on interest rate swaps) for
the years ended December 31, 2000 and 1999 was $195,460 and $161,162 respectively. The
aggregate amount of income taxes paid for the years ended December 31, 2000 and 1999 was
$4,507 and $24,235 respectively.
Future changes in United States accounting policies
The company is required to adopt for United States reporting purposes Statement of Financial
Accounting Standards No. 133, ‘‘Accounting for Derivative Instruments and Hedging
Activities’’, starting with financial statements for the year ending December 31, 2001.
Under this standard, all derivatives are recognized at fair value in the balance sheet. Changes in
the fair value of derivatives that are not hedges are recognized in the Consolidated Statement
of Earnings as they arise consistent with current practice. If the derivative is a hedge,
depending on the nature of the hedge, changes in the fair value of the derivative will either be
offset in the Consolidated Statement of Earnings against the change in the fair value of the
hedged asset or will be recognized in other comprehensive income until the hedged item is
recognized in the Consolidated Statement of Earnings. If the change in the fair value of the
derivative is not completely offset by the change in the value of the item it is hedging, the
difference will be recognized immediately in the Consolidated Statement of Earnings.
The company’s forward contracts are hedges of net investments in subsidiaries and therefore
there is no impact as a result of this Standard. The fair value of all other derivative instruments
(put options and interest rate swaps) at January 1, 2001 is approximately $10 million less than
their carrying value.
51

FAIRFAX FINANCIAL HOLDINGS LIMITED
Management’s Discussion and Analysis of Financial Condition andResults of Operations
Note: Readers of the Management’s Discussion and Analysis of Financial Condition and
Results of Operations should review the entire Annual Report for additional
commentary and information.
Sources of Revenue
Revenue reflected in the consolidated financial statements includes net premiums earned,
interest and dividend income and realized gains on sale of investments of the insurance,
reinsurance and runoff companies, claims adjusting fees of Lindsey Morden and other
miscellaneous income. The runoff business segment was formed with the acquisition of the
company’s interest in The Resolution Group (‘‘TRG’’) and its wholly-owned subsidiary,
International Insurance, on August 11, 1999 and also includes Sphere Drake, which was
transferred to runoff effective July 1, 1999, and Odyssey Re Stockholm, a runoff company
purchased in September 1998. The international runoff operations have reinsured their
reinsurance portfolios to ORC Re to provide consolidated investment and liquidity
management services, with the RiverStone Group retaining full responsibility for all other
aspects of the runoff. Accordingly, for segmented information, ORC Re is classified in the
Runoff and other segment. The 1999 comparatives have been restated on a consistent basis.
Revenue by
Line of Business
2000 1999 1998 1997 1996($000) ($000) ($000) ($000) ($000)
Insurance 3,420,374 3,335,377 1,823,760 1,086,854 1,026,107
Reinsurance 1,505,284 1,435,999 1,380,065 801,864 273,340
Claims adjusting 376,943 443,085 294,843 166,331 162,266
Runoff and other 666,639 504,846 – – –
Corporate 219,283 69,147 75,649 33,258 14,102
6,188,523 5,788,454 3,574,317 2,088,307 1,475,815
The 2000 increase in insurance revenue was mainly the result of the inclusion of TIG Specialty
Insurance’s revenue for a full year in 2000 (compared with nine months in 1999), partially
offset by reduced premiums for C&F and Ranger as a result of their re-underwriting actions.
The increase in reinsurance revenue in 2000 arose from the inclusion of Odyssey America Re’s
(formerly TIG Re) revenue for a full year in 2000 (compared with nine months in 1999),
partially offset by CTR’s reduced premium volume as it significantly reduced its unprofitable
facultative and other classes of business, the impact of the lower Euro/Canadian dollar
exchange rate in 2000 on CTR’s revenue, and the inclusion of Sphere Drake’s revenue for the
six months ended June 30, 1999 when it ceased active underwriting (and was thereafter
included in runoff).
52

The 2000 decrease in claims adjusting revenue reflects lower weather-related claims activity in
North America and the U.K. as well as fewer ground subsidence claims in the U.K.
The increase in runoff and other revenue reflects the inclusion of TRG’s revenue for a full year
in 2000 (compared with four months in 1999) and the higher realized gains and investment
income on the international runoff portfolios.
On a geographic basis, the United States operations accounted for 63% of total revenue in 2000
compared with 62% in 1999. Operating loss before income taxes from U.S. operations
amounted to $139.9 million in 2000 compared with an operating profit of $113.9 million in
1999. Canadian operations accounted for 12% of total revenue in 2000 compared with 15% in
1999. Operating profit from Canadian operations amounted to $34.7 million in 2000
compared with an operating loss of $18.9 million in 1999. The Europe and Far East operations
accounted for 22% of total revenue in 2000, the same as in 1999. Operating profit from the
Europe and Far East operations amounted to $165.9 million in 2000 compared with
$28.9 million in 1999. The balance of revenue and operating profit or loss was related to
corporate.
53

FAIRFAX FINANCIAL HOLDINGS LIMITED
Net Earnings
Sources of net earnings (with Lindsey Morden equity accounted) were as follows for the past
five years:
2000 1999 1998 1997 1996($000) ($000) ($000) ($000) ($000)
Underwriting
Insurance
Canada (13,025) (96,570) (40,338) 5,202 3,921
U.S. (588,408) (273,131) (116,470) (25,572) (49,767)
Reinsurance (97,367) (247,364) (154,571) (35,787) (4,717)
Interest and dividends 593,512 711,475 432,024 242,300 144,101
Insurance and reinsurance
earnings (loss) before realized
gains (105,288) 94,410 120,645 186,143 93,538
Realized gains 378,305 121,670 440,785 206,773 131,274
Runoff 43,303 (54,231) – – –
Claims adjusting (Fairfax portion) (15,387) 2,784 12,388 1,824 2,298
Interest expense (164,743) (129,262) (84,356) (43,182) (34,997)
Goodwill and other amortization (5,362) (5,067) (4,985) (4,817) (4,765)
Negative goodwill 99,113 – – – –
Swiss Re premium (167,196) (35,312) – – –
Kingsmead losses (32,963) – – – –
Restructuring (16,402) – – – –
Corporate overhead and other (22,966) (20,174) (15,963) (14,991) (6,656)
Pre-tax income (loss) (12,586) (25,182) 468,514 331,750 180,692
Less (add): taxes (173,306) (158,023) 80,979 99,252 29,872
Less: non-controlling interests 23,279 8,633 – – –
Net earnings 137,441 124,208 387,535 232,498 150,820
Net earnings in 2000 were $137.4 million, an increase of $13.2 million or 11% from 1999 net
earnings of $124.2 million.
The major changes which affected net earnings are set out below.
Insurance and reinsurance earnings before realized gains decreased by $199.7 million over
1999 due to higher underwriting losses of $81.7 million and lower interest and dividend
income of $118.0 million. Underwriting losses at TIG and CTR reflect the benefit of the Swiss
Re cover.
Canadian insurance underwriting losses improved by $83.5 million which reflects the
improvement in the group’s combined ratio to 102.0% in 2000 from 114.9% in 1999.
Commonwealth successfully re-underwrote its Oil, Gas and Petrochemicals and U.S. Property
business in 1999, when it suffered due to soft markets and the company’s willingness to walk
away from underpriced accounts. In 2000, Commonwealth obtained significant pricing
increases on these books of business. Lombard’s underwriting results improved from a
54

combined ratio of 105.0% in 1999 to 100.6% in 2000 reflecting strict underwriting discipline as
well as redundancies from prior years’ reserves.
U.S. insurance underwriting losses deteriorated by $315.3 million which reflects a deterioration
in the group’s combined ratio to 124.3% in 2000 compared with 111.8% in 1999. TIG and C&F
incurred adverse development of $169 million on the 1999 accident year which was the
bottom of the soft U.S. insurance market and which represented 6.5% of their combined 1999
net earned premiums. Excluding the 1999 accident year adverse development, the 2000
combined ratio for the U.S. insurance companies would have been 117.1%.
TIG’s 2000 combined ratio (excluding 1999 reserve strengthening) was 116.4% compared to
118.4% in 1999 (before purchase adjustments and after reflecting the 1999 reserve
strengthening in 2000). In 2000, TIG significantly re-underwrote its programs by exercising
more underwriting and pricing control while bringing more claims handling in-house. The
impact of these changes will emerge primarily in 2001. Offsetting these underwriting and
claims actions, TIG incurred underwriting losses of $56.0 million on its Non-Standard Auto
program (adding 1.8 percentage points to its 2000 combined ratio). This program has now
been discontinued due to its poor performance and since it is not part of the company’s
strategic focus.
Excluding 1999 reserve strengthening, C&F’s 2000 combined ratio was 116.3% compared to a
1999 combined ratio of 128.6% (after reflecting the 1999 reserve strengthening in 2000). The
improvement in C&F’s adjusted underwriting loss amounted to $156.3 million reflecting the
significant underwriting and pricing actions taken by C&F in 1999 and 2000.
Ranger’s 2000 underwriting loss was $47.6 million, approximately $33.0 million of which
resulted from Ranger’s programs discontinued in 1999 (Petroleum and Natural Gas Marketers,
Mississippi Insurance Managers and California Artisan Contractors). The combined ratio on
Ranger’s continuing programs was 121.6%.
The U.S. insurance companies experienced average price increases of 8.5% for 2000 with
average price increases in excess of 12% in the fourth quarter of 2000, compared to overall
price decreases of 4% to 6% in 1999.
The reinsurance underwriting loss improved $150.0 million from $247.4 million in 1999 to
$97.4 million in 2000. The group incurred minimal catastrophe losses in 2000 compared with
$127.8 million in 1999. CTR discontinued its non-performing facultative business in 2000. The
Paris branch of Odyssey America Re will only write facultative business in Europe and Asia in
support of its treaty book.
55

FAIRFAX FINANCIAL HOLDINGS LIMITED
Interest and dividends declined by $118.0 million from $711.5 million in 1999 to
$593.5 million in 2000 reflecting:
– a $2.4 billion decrease in the investment portfolios of the insurance and reinsurance
companies in 2000 due to the significant reduction in C&F’s net premiums earned
which declined from US$933.7 million in 1997 (the year before Fairfax’s acquisition)
to US$548.0 million in 2000, a significant reduction in the net premiums written of
Odyssey America Re (formerly TIG Re) of $100.0 million from 1997 to 1999 as it exited
the reverse flow and facultative business, payment by the reinsurance group on 1999
catastrophe losses and Ranger’s 65% reduction in net premiums earned since 1997;
– an increase in funds withheld interest expense from $79.5 million in 1999 to
$102.4 million in 2000, reflecting TIG and TIG Re’s extensive use of finite risk stop loss
treaties before their acquisition by Fairfax; and
– the transfer to runoff effective July 1, 1999 of Sphere Drake, which contributed
$23.6 million to 1999 interest and dividend income.
Net realized gains increased in 2000 to $378.3 million from $121.7 million in 1999, principally
relating to the sale of Fairfax’s Latin American common equity portfolio ($247.8 million) and
other common equity gains ($184.5 million), offset primarily by put amortization
($71.9 million).
Runoff operations comprise Odyssey Re Stockholm, Sphere Drake since July 1, 1999 and TRG
since August 11, 1999. The earnings of $43.3 million from runoff operations primarily resulted
from higher investment income from TRG (included for a full year in 2000 compared with four
months in 1999) and the international runoff operations, and the runoff of Sphere Drake’s
premiums since the transfer of Sphere Drake to runoff effective July 1, 1999, offset by Sphere
Drake’s 2000 reserve strengthening on 1999 catastrophes.
Fairfax’s $15.4 million share of Lindsey Morden’s (claims adjusting) loss in 2000, compared
with a $2.8 million share of profits in 1999, reflects Lindsey Morden’s significantly lower
revenue and operating profit from its U.K. and U.S. operations as reductions in operating costs
lagged revenue declines. In addition, Lindsey Morden incurred restructuring and other costs of
$13.8 million to reduce staffing levels in line with lower claims activity in its U.S. and U.K.
operations.
Interest expense increased in 2000 due to a full year of interest expense on debt incurred to
purchase TIG Holdings and on TIG Holdings’ debt assumed, compared with nine months in
1999.
As part of its acquisition of TIG effective April 13, 1999, Fairfax purchased a US$1 billion
corporate insurance cover from Swiss Re protecting it from adverse development in claims and
unrecoverable reinsurance above the reserves set up by all of its subsidiaries (including TIG
Specialty Insurance and Odyssey America Re (formerly TIG Re) but otherwise not including
subsidiaries acquired after 1998) at December 31, 1998. In 2000, Fairfax strengthened 1998 and
prior reserves and ceded these losses of $404.0 million (US$272.3 million) to Swiss Re for which
it will pay an additional premium of $167.2 million (US$112.7 million) to a funds withheld
account to the benefit of Swiss Re. The 2000 cession included:
56

– $224.0 million in respect of TIG’s claims reserves (prior to its acquisition by Fairfax)
primarily relating to California construction defect exposures, the losses on which are
expected to emerge over the next five to ten years. One of the reasons for purchasing
the corporate insurance cover was to provide TIG with reinsurance protection (similar
to Fairfax’s other vendor indemnities);
– $145.0 million in respect of Sphere Drake’s claims reserves on its 1997 and 1998
underwriting years, including catastrophe losses resulting from Hurricane George. As
set out in note 4 to the consolidated financial statements, Fairfax has remaining CVR
protection of $46.3 million (US$30.8 million) on Sphere Drake’s 1996 and prior claims
reserves;
– $27.6 million in respect of Crum & Forster’s claims reserves from August 13, 1998 (the
date of its acquisition by Fairfax) to December 31, 1998. Crum & Forster continues to
have reinsurance protection of its August 13, 1998 and prior claims reserves of
$259 million (see Indemnifications on page 79);
– $31.9 million in respect of CTR’s 1997 and 1998 underwriting years, primarily from its
now discontinued facultative books of business; and
– $24.5 million in offsetting net redundancies from the remaining subsidiaries.
Additional premium will be payable to Swiss Re if additional losses are ceded to this cover in
future years.
As part of the acquisition of TIG Holdings, TIG Specialty Insurance had a 90% ownership in
Kingsmead Managing Agency, a managing agent for three Lloyd’s syndicates for which TIG
provided underwriting capacity of £151.4 million for 2000. On June 29, 2000, Fairfax signed an
agreement to sell its investment in Kingsmead to Advent Capital plc for 22% of Advent, which
sale closed in the fourth quarter. Fairfax’s operating losses from the Kingsmead syndicates for
the year ended December 31, 2000 amounted to $33.0 million, primarily relating to reserve
strengthening on the 1999 underwriting year. There was no gain or loss on the sale.
The restructuring costs of $16.4 million in 2000 relate to further restructuring of C&F’s
operations (net of its remaining acquisition date accrual), the closure of TIG offices, including
severance, and the closure of Odyssey America Re’s U.S. facultative offices. The remaining
$13.8 million of the $30.2 million Restructuring and other costs shown on Fairfax’s statement
of earnings on page 30 relates to Lindsey Morden (and is included in Fairfax’s portion of the
claims adjusting loss in the above table of sources of net earnings).
Fairfax’s acquisition policy is to purchase under-valued insurance and reinsurance companies
at a discount to book value and/or with vendor indemnities or reinsurance stop loss treaties
protecting Fairfax against adverse development on pre-acquisition claims reserves and
unrecoverable reinsurance. Four acquisitions, Odyssey Reinsurance Corporation (1996), CTR
(1997), C&F (1998) and TRG (1999), resulted in negative goodwill arising out of the purchase
price equation at the date of acquisition. In general, the negative goodwill arises from a
combination of the following factors relating to the acquired company:
57

FAIRFAX FINANCIAL HOLDINGS LIMITED
– the former owner which put the company up for sale was unable to find a buyer at a
premium to book value;
– there was a need to bolster the franchise value due to lack of scale as the company was
part of a larger insurance group or had been publicly up for sale for an extended period
of time;
– the company had quality of management issues and a lack of focus on underwriting
profitability;
– the company had a high and inefficient cost structure;
– there was a risk that, although assets and liabilities were valued at fair value at the
acquisition date and vendor indemnities were provided for these acquisitions, assets,
including reinsurance recoverables, could be overstated or liabilities, including
provisions for claims, could be understated.
Fairfax’s accounting policy previously arbitrarily set ten years as the period over which the
negative goodwill would be amortized to income. This reflected the lack of experience and
uncertainty with the period over which the factors giving rise to the negative goodwill would
be resolved. Periodically the company reviews the appropriateness of the remaining period of
the negative goodwill based on its evaluation of the facts and circumstances giving rise to the
original negative goodwill at the various acquisition dates. In 2000, the company carried out a
comprehensive review of the remaining useful life of the negative goodwill for each acquisition
and concluded that the amortization periods should be shortened from ten years to five years
for Odyssey Reinsurance Corporation, six years for CTR, three years for C&F and four years for
TRG. Odyssey Reinsurance Corporation (now part of Odyssey America Re) has established itself
as a global reinsurer which, effective July 1, 2000, is writing CTR’s European property and
casualty business through its Paris branch, and effective January 1, 2001 is writing CTR’s Asian
property and casualty business through its Singapore branch. There have been no unexpected
valuation issues arising from the acquisition date assets and liabilities and the vendor
indemnities have not been fully utilized. In the case of C&F, its restructuring and re-
underwriting activities were completed in 2000. Additional losses were incurred on the in-force
unearned premiums at the acquisition date and have been recorded in 1999 and 2000. C&F’s
operating results continue to improve, with pre-tax income of US$4.0 million in 2000
compared to a pre-tax loss of US$31.0 million in 1999.
These changes in estimates were applied on a prospective basis effective at the beginning of the
fourth quarter of 2000, resulting in an increase in negative goodwill amortization of
$79.2 million for the year ended December 31, 2000, from $29.5 million to $108.7 million.
The remaining balance of negative goodwill of $129.8 million at December 31, 2000 will be
amortized to income in 2001 ($75.8 million), 2002 ($40.0 million) and 2003 ($14.0 million),
assuming that the revised amortization periods remain appropriate.
Corporate overhead and other consists of holding company expenses net of Hamblin Watsa’s
pre-tax income and interest income on Fairfax’s cash balances.
The company recorded a recovery for income taxes in 2000 due to income earned outside
Canada at lower rates of tax and operating losses in higher tax rate jurisdictions.
58

The non-controlling interests represent the 33.5% public minority interest in Lindsey Morden
and Xerox’s effective 72.5% economic interest in TRG’s results of operations and net assets.
Fairfax owns all of TRG’s voting common shares resulting in an effective 27.5% economic
interest in TRG’s results of operations and net assets. Xerox retains all of TRG’s participating
non-voting preferred shares resulting in an effective 72.5% economic interest in TRG’s results
of operations and net assets. Xerox’s wholly-owned subsidiary, Ridge Re, also provides TRG’s
wholly-owned subsidiary, International Insurance, with the vendor indemnity referred to
under Indemnifications on page 79. TRG’s cessions to Ridge Re are fully collateralized by letters
of credit in the same amount as the cessions.
Insurance Underwriting
Fairfax’s insurance and reinsurance companies employ disciplined underwriting practices with
the objective of rejecting underpriced risks. The combined loss and expense ratio is the
traditional measure of underwriting results of property and casualty companies. In any year
when the ratio exceeds 100%, it generally indicates that unprofitable business has been
underwritten.
A summary follows of the net premiums written and earned, and the loss, expense and
combined ratios, for the past sixteen years for Fairfax’s insurance companies and, for Fairfax’s
reinsurance companies, for the five years that Fairfax has owned these companies.
InsuranceNET PREMIUMS RATIOS
Written Earned Loss Expense Combined($000) ($000) (%) (%) (%)
1985 23,415 14,049 96 30 126
1986 55,992 40,885 72 23 95
1987 71,378 62,012 73 25 98
1988 68,224 66,265 73 19 92
1989 35,477 40,444 100 40 140
1990 74,487 78,427 82 31 113
1991 93,450 90,507 60 34 94
1992 128,664 118,854 79 35 114
1993 163,508 150,844 73 26 99
1994 411,570 400,559 74 30 104
1995 864,589 829,340 74 31 105
1996 879,687 864,169 75 31 106
1997 864,708 867,218 71 31 102
1998 1,310,141 1,402,771 78 33 111
1999 2,745,629 2,957,006 77 36 113
2000 3,112,176 3,073,133 85 35 120
In 2000, the combined ratio was well above 100% with a combined ratio of 102% for the
Canadian insurance companies and 124% for the U.S. insurance companies. Since current
management took over in September 1985 Fairfax has had combined ratios of less than 100%
in five of the fifteen full years and greater than 100% in the remaining ten years.
59

FAIRFAX FINANCIAL HOLDINGS LIMITED
Reinsurance NET PREMIUMS RATIOS
Written Earned Loss Expense Combined($000) ($000) (%) (%) (%)
1996 163,392 166,719 62 34 96
1997 527,919 593,423 72 35 107
1998 966,466 992,080 80 36 116
1999 1,276,912 1,275,245 85 34 119
2000 1,222,916 1,224,213 71 37 108
In 2000, the combined ratio decreased to 108% from 119% in 1999. Excluding international
catastrophe-related losses of $127.8 million, the combined ratio was 109.5% in 1999. There
were minimal catastrophe losses in 2000.
Balance Sheet Analysis
Cash and short term investments and Marketable securities consist of the holding
company’s cash deposits and short term investments which it maintains as a safety net to
ensure that it can cover its debt service and operating requirements for some years even if its
insurance subsidiaries pay no dividends (see the discussion on page 86). Cash and short term
investments include the company’s bank operating account, overnight bank deposits and
investments in short term government treasury bills ($450 million). Marketable securities
include short term government bonds ($39 million) and the company’s investment in S&P500
Index put contracts ($56 million).
Accounts receivable and other primarily consists of premiums receivable (net of
provisions for uncollectible amounts) of $1.9 billion, funds withheld receivables from cedants
and other reinsurance balances of $400 million, accrued interest of $150 million and prepaid
expenses and other accounts receivable of $467 million.
Recoverable from reinsurers includes future recoveries on unpaid claims ($9.5 billion),
reinsurance receivable on paid losses ($1.2 billion) and unearned premiums from reinsurers
($400 million). Please see Reinsurance Recoverables beginning on page 76 for a detailed
discussion of amounts recoverable from reinsurers.
Investments in Hub and Zenith National represent Fairfax’s investment in 42%-owned
Hub International Limited ($111 million) and 39%-owned Zenith National Insurance Corp.
($285 million), both of which are publicly listed companies (the combined market value of
these investments was $402 million at December 31, 2000).
Deferred premium acquisition costs (DPAC) consist of brokers’ commissions and
premium taxes. These are deferred, together with the related unearned premiums (UPR), and
amortized to income over the term of the underlying insurance policies. Unlike many
companies in the insurance industry, the company does not defer internal underwriting costs
as part of DPAC and the recoverability of DPAC is determined without giving credit to
investment income. The ratio of DPAC to UPR (17.2% at December 31, 2000) varies from time
to time depending on the mix of business being written and the estimated recoverability of
DPAC given expected loss ratios on the UPR.
60

Future income taxes represent amounts expected to be recovered in future years from the
taxation authorities in the countries in which the company operates. At December 31, 2000
future income taxes consisted of $717 million of capitalized operating and capital losses
($785 million gross less a valuation allowance of $68 million), and timing differences of
$559 million which represent expenses recorded in the financial statements but not yet
deducted for income tax purposes. The capitalized operating losses relate primarily to the
U.S. companies (including $430 million arising on the acquisition of TIG in 1999) as well as to
the Canadian holding company, CTR and Sphere Drake. The company expects to realize the
benefit of these capitalized losses from future profitable operations. The valuation allowance
recognizes the uncertainty in realizing the benefit of certain of the operating losses depending
on the jurisdiction and on the time limit before the losses expire. The timing differences
principally relate to insurance-related balances such as claims, DPAC and UPR; such timing
differences are expected to continue for the foreseeable future in light of the company’s
ongoing operations.
Goodwill arises on the acquisition of companies where the purchase price paid exceeds the
fair value of the underlying net tangible assets acquired. Goodwill at December 31, 2000 arises
from Lindsey Morden ($226 million), Lombard’s acquisition of brokers in 2000 ($16 million),
C&F’s acquisition of Seneca and Transnational in 2000 ($12 million), Ranger ($3 million) and
Hamblin Watsa ($3 million). Lindsey Morden’s goodwill is amortized to income on a straight
line basis over 40 years while the other companies’ goodwill is amortized to income on a
straight line basis over ten years.
Other assets include loans receivable and shares held in connection with the company’s
management share purchase and restricted stock grant programs ($60 million) and
miscellaneous other balances.
Accounts payable and accrued liabilities include employee related liabilities, amounts
due to brokers and agents including contingent commissions, liabilities for operating expenses
incurred in the normal course of business, dividends payable to policyholders, salvage and
subrogation payable and other similar balances.
Funds withheld payable to reinsurers represent premiums and accumulated accrued
interest (at rates ranging from 5.75% to 8.0% per annum) on finite risk and aggregate stop loss
reinsurance treaties, principally relating to Odyssey America Re ($480 million), TIG
($405 million), C&F ($181 million) and Fairfax’s corporate insurance cover with Swiss Re
($116 million). The companies retain ownership of the underlying investments. Claims
payable under such treaties are paid first out of the funds withheld payable balances.
Provision for claims consists of the gross amount of individual case reserves established by
the insurance companies, individual case estimates reported by ceding companies to the
reinsurance companies and management’s estimate of claims incurred but not reported (IBNR)
based on the volume of business currently in force and the historical experience on claims.
Please see Provision for Claims beginning on the next page for a detailed discussion of the
company’s provision for claims.
Unearned premiums are described above under Deferred premium acquisition costs.
61

FAIRFAX FINANCIAL HOLDINGS LIMITED
Non-controlling interests represent the minority shareholders’ 72.5% share of the
underlying net assets of TRG ($571 million) and 33.5% share of the underlying net assets of
Lindsey Morden ($74 million). All of the assets and liabilities, including long term debt of
these two companies, are included in the company’s consolidated balance sheet.
Excess of net assets acquired over purchase price paid (negative goodwill) represents
the aggregate unamortized amount of such excess, which arose as a result of the company’s
acquisition of certain companies at prices less than the fair value of the underlying net tangible
assets acquired. Please see pages 57 and 58 for a detailed discussion of the company’s negative
goodwill.
Provision for Claims
Claim provisions are established by the case method as claims are reported. The provisions are
subsequently adjusted as additional information on the estimated amount of a claim becomes
known during the course of its settlement. A provision is also made for management’s
calculation of factors affecting the future development of claims including IBNR based on the
volume of business currently in force and the historical experience on claims.
As time passes, more information about the claims becomes known and provision estimates are
appropriately adjusted upward or downward. Because of the estimation elements encompassed
in this process, and the time it takes to settle many of the more substantial claims, several years
are required before a meaningful comparison of actual losses to the original provisions can be
developed.
The development of the provision for claims is shown by the difference between estimates of
reserves as of the initial year-end and the re-estimated liability at each subsequent year-end.
This is based on actual payments in full or partial settlement of claims, plus re-estimates of the
reserves required for claims still open or claims still unreported. Unfavourable development
means that the original reserve estimates were lower than subsequently indicated.
The following table presents a reconciliation of the provision for claims and loss adjustment
expense (LAE) for the insurance, reinsurance and runoff lines of business for the past five years.
As shown in the table, the sum of the provision for claims for all of Fairfax’s insurance,
reinsurance and runoff subsidiaries is $20,225.8 million as at December 31, 2000 – the amount
shown as Provision for claims on Fairfax’s balance sheet on page 29. The ‘‘Other’’ shown in the
following table was the $14 million Fairfax indemnification of Ranger reserves.
62

Reconciliation of Provision for Claims
and LAE as at December 31
2000 1999 1998 1997 1996($000) ($000) ($000) ($000) ($000)
Insurance subsidiaries
owned throughout the
year – net of
indemnification 5,538,484 4,258,180 1,107,551 978,498 956,704
Insurance subsidiaries
acquired during the year 71,392 1,187,246 3,802,794 – –
Total insurance subsidiaries 5,609,876 5,445,426 4,910,345 978,498 956,704
Reinsurance subsidiaries
owned throughout the
year 3,641,344 2,732,941 2,981,663 1,215,130 13,363
Reinsurance subsidiaries
acquired during the year – 1,394,859 1,362,274 1,869,526 1,138,865
Total reinsurance
subsidiaries 3,641,344 4,127,800 4,343,937 3,084,656 1,152,228
Runoff subsidiaries owned
throughout the year 2,307,647 1,733,009 – – –
Runoff subsidiaries
acquired during the year – 873,276 – – –
Total runoff subsidiaries 2,307,647 2,606,285 – – –
Federated Life 30,725 28,500 26,675 24,626 23,095
Other – – 14,000 14,000 14,000
Total provision for claims
and LAE 11,589,592 12,208,011 9,294,957 4,101,780 2,146,027
Reinsurance gross-up 8,636,239 8,234,188 3,866,258 2,220,957 1,147,422
Total including gross-up 20,225,831 20,442,199 13,161,215 6,322,737 3,293,449
The seven tables that follow show the reconciliation and the reserve development of the
insurance (Canadian and U.S.), reinsurance and runoff subsidiaries’ provision for claims,
before the company’s US$1 billion corporate insurance cover from Swiss Re. The commentary
to the various tables discloses the group’s share of the cession to the Swiss Re corporate cover.
Because business is done in various locations, there will necessarily be some distortions caused
by foreign exchange fluctuations. The insurance subsidiaries’ tables are presented in Canadian
dollars for the Canadian subsidiaries and in U.S. dollars for the U.S. subsidiaries (Falcon is
included with the U.S. insurance subsidiaries for convenience). The reinsurance and runoff
subsidiaries’ tables are presented in U.S. dollars as the reinsurance and runoff businesses are
substantially transacted in that currency.
63

FAIRFAX FINANCIAL HOLDINGS LIMITED
Canadian Insurance Subsidiaries
The following table shows for Fairfax’s Canadian insurance subsidiaries the provision for
claims liability for unpaid losses and LAE as originally and as ultimately estimated for the years
1996 through 2000. The favourable or unfavourable development from prior years is credited
or charged to each year’s earnings.
Reconciliation of Provision for Claims –
Canadian Insurance Subsidiaries
2000 1999 1998 1997 1996($000) ($000) ($000) ($000) ($000)
Provision for claims and LAE at
January 1 890,360 818,840 764,052 746,119 695,328
Incurred losses on claims and LAE
Provision for current accident
year’s claims 502,808 560,961 545,306 553,902 482,970
Increase (decrease) in provision for
prior accident years’ claims (17,098) (8,010) (2,464) (11,974) (16,692)
Total incurred losses on claims
and LAE 485,710 552,951 542,842 541,928 466,278
Payments for losses on claims
and LAE
Payments on current accident
year’s claims (214,955) (230,996) (239,426) (285,067) (195,604)
Payments on prior accident years’
claims (264,999) (250,435) (248,628) (238,928) (219,883)
Total payments for losses on claims
and LAE (479,954) (481,431) (488,054) (523,995) (415,487)
Provision for claims and LAE at
December 31 896,116 890,360 818,840 764,052 746,119
The company strives to establish adequate provisions at the original valuation date. It is the
company’s objective to have favourable development from the past. The reserves will always be
subject to upward or downward development in the future.
64

The following table shows for Fairfax’s Canadian insurance subsidiaries the original provision
for claims reserves including LAE at each calendar year-end commencing in 1990 with the
subsequent cumulative payments made from these years and the subsequent re-estimated
amount of these reserves. The following Canadian insurance subsidiaries’ reserves are included
from the respective years in which such subsidiaries were acquired:
Year Acquired
Markel 1985
Federated 1990
Commonwealth 1990
Lombard (including CRC (Bermuda)) 1994
Provision for Canadian Insurance Subsidiaries’ Claims Reserve Development
1990and
As at prior 1991 1992 1993 1994 1995 1996 1997 1998 1999 2000December 31 ($000) ($000) ($000) ($000) ($000) ($000) ($000) ($000) ($000) ($000) ($000)
Provision for claimsincluding LAE 192,372 168,393 179,587 185,010 673,789 695,328 746,119 764,052 818,840 890,360 896,116
Cumulative payments as of:One year later 44,055 48,050 56,824 62,955 233,811 219,883 238,928 248,628 250,435 264,999Two years later 76,947 75,403 87,878 105,537 351,600 355,035 386,447 392,699 409,855Three years later 98,150 94,834 110,565 127,418 457,680 455,301 494,014 504,796Four years later 115,417 110,838 126,123 147,296 525,453 531,979 577,065Five years later 127,003 120,435 137,732 159,482 577,504 585,789Six years later 135,020 128,060 145,986 166,015 612,691Seven years later 142,080 134,465 150,589 170,919Eight years later 147,015 138,286 154,133Nine years later 149,732 141,347Ten years later 152,512Reserves re-estimated as of:One year later 175,138 168,001 179,948 187,819 677,938 678,636 734,145 761,588 810,830 873,262Two years later 173,992 157,849 174,820 191,825 676,826 692,888 743,443 758,562 808,334Three years later 165,753 157,671 171,833 197,833 685,675 704,431 748,532 756,958Four years later 166,797 156,291 177,451 198,650 688,769 707,148 750,204Five years later 165,625 158,366 177,370 199,317 695,907 705,680Six years later 167,289 161,088 177,964 197,691 694,477Seven years later 169,803 162,501 175,936 198,798Eight years later 171,625 160,606 177,982Nine years later 170,215 161,868Ten years later 171,616Favourable (unfavourable)
development 20,756 6,525 1,605 (13,788) (20,688) (10,352) (4,085) 7,094 10,506 17,098
The Canadian insurance subsidiaries had a net redundancy (favourable development) of
$17.1 million during 2000, primarily relating to conservative reserving at Lombard, Federated
and Markel, partially offset by unfavourable development on Commonwealth’s casualty book.
The net deficiency in 1993 resulted from the impact of U.S. floods late in the year for which
Commonwealth underestimated the ultimate losses. The net deficiency in 1994 relates to the
impact of Lombard’s increase in its casualty retention which was initially underestimated by
the company. The net deficiency in 1995 relates to an excess of loss contract assumed by CRC
(Bermuda) which had higher than expected losses. The net redundancies on 1998 and prior
losses for the Canadian insurance group of $14.4 million in 2000 reduced the cession to the
Swiss Re corporate cover.
65

FAIRFAX FINANCIAL HOLDINGS LIMITED
Management is pleased with the generally favourable development for the Canadian insurance
subsidiaries over the last five years. Future development could be significantly different from
the past due to many unknown factors.
U.S. Insurance Subsidiaries
The following table shows for Fairfax’s U.S. insurance subsidiaries the provision for claims
liability for unpaid losses and LAE as originally and as ultimately estimated for the years 1996
through 2000. The favourable or unfavourable development from prior years is credited or
charged to each year’s earnings.
Reconciliation of Provision for Claims –
U.S. Insurance Subsidiaries2000 1999 1998 1997 1996
(US$000) (US$000) (US$000) (US$000) (US$000)
Provision for claims and LAEat January 1 for Ranger, forC&F and Falcon beginningin 1999 and for TIGbeginning in 2000 3,138,611 2,693,929 184,003 187,644 157,804
Incurred losses on claimsand LAEProvision for current
accident year’s claims 1,317,131 624,666 104,477 105,462 111,607Increase in provision for
prior accident years’ claims 284,819 29,753 43,821 8,681 25,352
Total incurred losses on claimsand LAE 1,601,950 654,419 148,298 114,143 136,959
Payments for losses on claimsand LAEPayments on current
accident year’s claims (434,626) (272,502) (40,477) (37,962) (37,767)Payments on prior accident
years’ claims (1,215,145) (755,292) (70,130) (79,822) (69,352)
Total payments for losses onclaims and LAE (1,649,771) (1,027,794) (110,607) (117,784) (107,119)
Provision for claims and LAEat December 31 3,090,790 2,320,554 221,694 184,003 187,644
Provision for claims and LAEfor Seneca Insurance atDecember 31 47,532 – – – –
Provision for claims and LAEfor TIG Specialty Insuranceat December 31 – 818,057 – – –
Provision for claims and LAEfor C&F at December 31 – – 2,466,685 – –
Provision for claims and LAEfor Falcon at December 31 – – 5,550 – –
66

2000 1999 1998 1997 1996(US$000) (US$000) (US$000) (US$000) (US$000)
Provision for claims and LAEfor U.S. insurancesubsidiaries at December 31before indemnification 3,138,322 3,138,611 2,693,929 184,003 187,644
Reserve indemnification – – (34,000) (34,000) (34,000)
Provision for claims and LAEfor U.S. insurancesubsidiaries afterindemnification 3,138,322 3,138,611 2,659,929 150,003 153,644
Exchange rate 1.5020 1.4513 1.5382 1.4296 1.3706Converted to Canadian dollars C$4,713,760 C$4,555,066 C$4,091,505 C$214,446 C$210,585
The company strives to establish adequate provisions at the original valuation date. It is the
company’s objective to have favourable development from the past. The reserves will always be
subject to upward or downward development in the future.
67

FAIRFAX FINANCIAL HOLDINGS LIMITED
The following table shows for Fairfax’s U.S. insurance subsidiaries the original provision for
claims reserves including LAE at each calendar year-end commencing in 1993 (the date of
Ranger’s acquisition) with the subsequent cumulative payments made from these years and the
subsequent re-estimated amounts of these reserves. The following U.S. insurance subsidiaries’
reserves are included from the respective years in which such subsidiaries were acquired:
Year Acquired
Ranger 1993
C&F 1998
Falcon 1998
TIG 1999
Seneca 2000
Provision for U.S. Insurance Subsidiaries’ Claims Reserve DevelopmentAs atDecember 31 1993 1994 1995 1996 1997 1998 1999 2000
(US$000) (US$000) (US$000) (US$000) (US$000) (US$000) (US$000) (US$000)
Provision for claimsincluding LAE 173,887 154,870 157,804 187,644 184,003 2,693,929 3,138,611 3,138,322
Cumulative payments as of:One year later 78,544 89,093 69,352 79,822 70,130 755,292 1,215,145Two years later 141,662 130,040 119,882 125,286 128,042 1,363,198Three years later 169,259 158,738 135,225 157,508 168,914Four years later 185,800 166,941 155,229 184,072Five years later 188,254 179,913 171,800Six years later 194,391 193,936Seven years later 197,677
Reserves re-estimated as of:One year later 171,418 191,038 183,156 196,325 227,824 2,723,682 3,423,430Two years later 199,586 206,856 190,861 229,083 236,318 2,715,758Three years later 214,492 216,783 210,832 236,311 251,940Four years later 222,191 226,006 212,900 246,683Five years later 227,579 229,793 216,184Six years later 229,418 231,965Seven years later 232,869
Favourable (unfavourable)development (58,982) (77,095) (58,380) (59,039) (67,937) (21,829) (284,819)
Ranger has had significant net deficiencies in each year since 1993. Its generally unfavourable
development over the years has been a source of significant concern. Ranger’s new senior
management team took the necessary steps to eliminate and terminate unprofitable lines of
business (Petroleum and Natural Gas Marketers, Mississippi Insurance Managers and California
Artisan Contractors) in 1999. Ranger’s net adverse development of US$12.7 million in 2000
resulted from its discontinued California Artisan Contractors program where the losses
continued to develop with a greater frequency than had been expected (US$10.4 million) and
its 1985 and prior discontinued assumed reinsurance program (US$6.5 million), offset by
redundancies of US$4.2 million in its continuing programs.
68

TIG and C&F’s net aggregate adverse development of US$272.1 million in 2000 included
US$115.0 million of unfavourable development on the 1999 accident year, reflecting the
underpricing conditions which existed at the bottom of the U.S. insurance market. In 1999,
new management at C&F and TIG had strengthened former management’s estimated 1999 loss
ratios by about 10 percentage points. However, like many other U.S. insurance companies, the
ultimate losses were still underestimated, resulting in strengthening of the 1999 accident year
loss ratios by 6% to 7% of 1999 net earned premiums. The remaining US$172.5 million of TIG
and C&F’s gross adverse development in 2000 was on 1998 and prior years, primarily relating
to TIG’s California Construction Defect exposures where the company experienced a higher
level of claims emergence than had been previously estimated, and was partially offset by
C&F’s redundancy of US$15.4 million on its unallocated loss and loss adjustment expense
reserve of prior years. Of the total net adverse development on 1998 and prior losses for the
U.S. insurance group in 2000, $170.6 million formed part of the cession to the Swiss Re
corporate cover.
Management is disappointed with the continuing adverse development in each of the last five
years and since the acquisition of Ranger in 1993. Future development could be significantly
different from the past due to many unknown factors.
69

FAIRFAX FINANCIAL HOLDINGS LIMITED
Reinsurance Subsidiaries
The following table shows for Fairfax’s reinsurance subsidiaries the provision for claims
liability for unpaid losses and LAE as originally and as ultimately estimated for the years 1997
through 2000. The favourable or unfavourable development from prior years is credited or
charged to each year’s earnings.
Reconciliation of Provision for Claims –
Reinsurance Subsidiaries2000 1999 1998 1997
(US$000) (US$000) (US$000) (US$000)
Provision for claims and LAE atJanuary 1 (in 1997, only forOdyssey Reinsurance (New York)and Wentworth) 2,844,208 2,824,039 2,157,706 858,469
Provision for claims and LAE forSphere Drake, Odyssey ReStockholm and Dai Tokyo (UK)(transferred to runoff) (67,434) (1,264,470) – –
Adjusted provision for claims andLAE at January 1 2,776,774 1,559,569 2,157,706 858,469
Incurred losses on claims and LAEProvision for current accident
year’s claims 523,636 623,730 504,347 150,166Increase (decrease) in provision
for prior accident years’ claims 62,124 (15,909) 26,017 (7,901)
Total incurred losses on claims and LAE 585,760 607,821 530,364 142,265
Payments for losses on claims and LAEPayments on current accident
year’s claims (36,882) (6,392) (292,325) (31,055)Payments on prior accident years’
claims (901,323) (277,900) (457,334) (119,698)
Total payments for losses on claimsand LAE (938,205) (284,292) (749,659) (150,753)
Provision for claims and LAE atDecember 31 2,424,329 1,883,098 1,938,411 849,981
Provision for claims and LAE forCTR and Sphere Drake atDecember 31 – – – 1,307,725
Provision for claims and LAE forOdyssey Re Stockholmand ORC Re at December 31 – – 885,628 –
Provision for claims and LAE forTIG Re at December 31 – 961,110 – –
Provision for claims and LAE forreinsurance subsidiaries atDecember 31 2,424,329 2,844,208 2,824,039 2,157,706Exchange rate 1.5020 1.4513 1.5382 1.4296Converted to Canadian dollars C$3,641,344 C$4,127,800 C$4,343,937 C$3,084,656
70
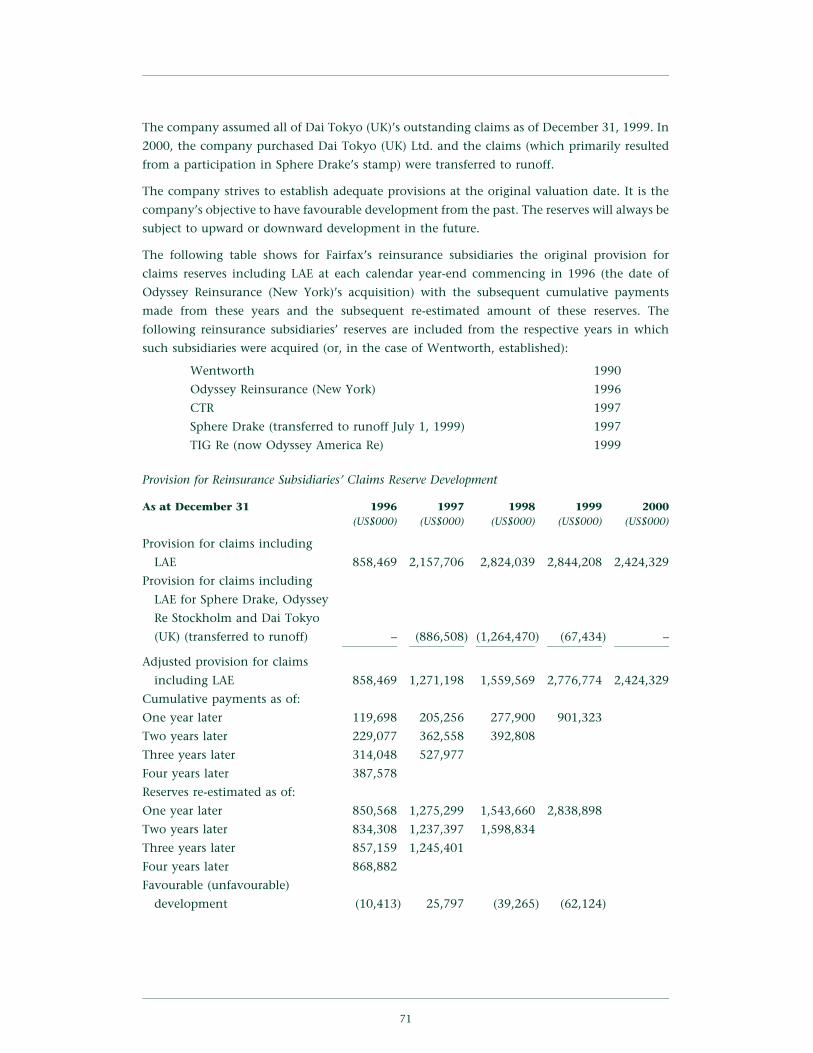
The company assumed all of Dai Tokyo (UK)’s outstanding claims as of December 31, 1999. In
2000, the company purchased Dai Tokyo (UK) Ltd. and the claims (which primarily resulted
from a participation in Sphere Drake’s stamp) were transferred to runoff.
The company strives to establish adequate provisions at the original valuation date. It is the
company’s objective to have favourable development from the past. The reserves will always be
subject to upward or downward development in the future.
The following table shows for Fairfax’s reinsurance subsidiaries the original provision for
claims reserves including LAE at each calendar year-end commencing in 1996 (the date of
Odyssey Reinsurance (New York)’s acquisition) with the subsequent cumulative payments
made from these years and the subsequent re-estimated amount of these reserves. The
following reinsurance subsidiaries’ reserves are included from the respective years in which
such subsidiaries were acquired (or, in the case of Wentworth, established):
Wentworth 1990
Odyssey Reinsurance (New York) 1996
CTR 1997
Sphere Drake (transferred to runoff July 1, 1999) 1997
TIG Re (now Odyssey America Re) 1999
Provision for Reinsurance Subsidiaries’ Claims Reserve Development
As at December 31 1996 1997 1998 1999 2000(US$000) (US$000) (US$000) (US$000) (US$000)
Provision for claims including
LAE 858,469 2,157,706 2,824,039 2,844,208 2,424,329
Provision for claims including
LAE for Sphere Drake, Odyssey
Re Stockholm and Dai Tokyo
(UK) (transferred to runoff) – (886,508) (1,264,470) (67,434) –
Adjusted provision for claims
including LAE 858,469 1,271,198 1,559,569 2,776,774 2,424,329
Cumulative payments as of:
One year later 119,698 205,256 277,900 901,323
Two years later 229,077 362,558 392,808
Three years later 314,048 527,977
Four years later 387,578
Reserves re-estimated as of:
One year later 850,568 1,275,299 1,543,660 2,838,898
Two years later 834,308 1,237,397 1,598,834
Three years later 857,159 1,245,401
Four years later 868,882
Favourable (unfavourable)
development (10,413) 25,797 (39,265) (62,124)
71

FAIRFAX FINANCIAL HOLDINGS LIMITED
The unfavourable development of US$62.1 million in 2000 was primarily due to adverse
development on CTR’s now discontinued facultative business from the 1998 underwriting year
and unfavourable foreign exchange effect on CTR’s reserves. The favourable development in
1998 was principally due to a favourable foreign exchange effect on CTR’s reserves. Of the total
net adverse development on 1998 and prior losses for the reinsurance group in 2000,
US$19.8 formed part of the cession to the Swiss Re corporate cover.
Future development could be significantly different from the past due to many unknown
factors.
Runoff Subsidiaries
The following table shows for Fairfax’s runoff subsidiaries the provision for claims liability for
unpaid losses and LAE as originally and as ultimately estimated since 1998. The favourable or
unfavourable development from prior years is credited or charged to each year’s earnings.
Reconciliation of Provision for Claims –
Runoff Subsidiaries2000 1999
(US$000) (US$000)
Provision for claims and LAE at January 1 for Odyssey Re
Stockholm and Sphere Drake and, in 2000, TRG 1,795,828 1,264,470
Provision on claims and LAE for Dai Tokyo (UK)
(transferred to runoff) 67,434 –
1,863,262 1,264,470
Incurred losses on claims and LAE
Foreign exchange effect on claims 4,992 (19,056)
Provision for current accident year’s claims 155,633 187,790
Increase in provision for prior accident years’ claims 123,109 40,709
Total incurred losses on claims and LAE 283,734 209,443
Payments for losses on claims and LAE
Payments on current accident year’s claims (46,699) (99,447)
Payments on prior accident years’ claims (563,914) (180,358)
Total payments for losses on claims and LAE (610,613) (279,805)
Provision for claims and LAE at December 31 1,536,383 1,194,108
Provision for claims and LAE for TRG at December 31 – 601,720
Provision for claims and LAE for runoff subsidiaries at
December 31 1,536,383 1,795,828
Exchange rate 1.5020 1.4513
Converted to Canadian dollars C$2,307,647 C$2,606,285
The unfavourable reserve development of US$123.1 million in 2000 included additional
development of reserves at Sphere Drake in 1996 and subsequent underwriting years of
US$106.1 million (this was not related to the litigation referred to in note 11 to the
72

consolidated financial statements), and adverse development on TRG’s 1992 and prior claims
of US$37.0 million, offset by favourable development of US$20.0 million on Odyssey Re
Stockholm claims. Total net adverse development on 1998 and prior losses for the runoff group
of US$91.6 million in 2000, principally relating to unfavourable development on Sphere
Drake’s claims on the 1997 and 1998 underwriting years, formed part of the cession to the
Swiss Re corporate cover. The runoff claims reserves are expected to be paid out approximately
half over the next five years and three-quarters over the next ten years.
The company strives to establish adequate provisions at the original valuation date. It is the
company’s objective to have favourable development from the past. The reserves will always be
subject to upward or downward development in the future.
73

FAIRFAX FINANCIAL HOLDINGS LIMITED
Asbestos, Pollution and Other Hazards
A number of Fairfax’s subsidiaries wrote insurance and reinsurance policies prior to their
acquisition by Fairfax which involve asbestos-related, environmental pollution and other
hazards (APH) coverage, primarily in the United States. Following is an analysis of Fairfax’s
gross and net reserves from APH exposures at year-end 2000 and 1999 and the movement in
gross and net reserves for those years.
2000 1999
Gross Net Gross Net(US$000) (US$000) (US$000) (US$000)
Provision for APH claims and LAE at
January 1 2,634,714 962,394 864,196 595,952
APH losses and LAE incurred during
the year 420,688 203,131 92,390 55,734
APH losses and LAE paid during the year (675,483) (139,873) (93,886) (72,930)
Provision for APH claims and LAE at
December 31 2,379,919 1,025,652 862,700 578,756
Dai Tokyo (UK) provision for APH claims
and LAE at December 31 31,548 23,623 – –
TIG provision for APH claims and LAE at
December 31 – – 159,398 51,939
International Insurance (TRG) provision
for APH claims and LAE at December 31 – – 1,592,312 322,504
Odyssey Re Stockholm provision for APH
claims and LAE at December 31 – – 20,304 9,195
Total provision for APH claims and LAE at
December 31 2,411,467 1,049,275 2,634,714 962,394
Comprising:
Outstanding 958,616 267,796 1,047,482 266,060
IBNR 1,452,851 781,479 1,587,232 696,334
Survival ratio – 3 year (before
indemnifications) 9.8 10.5
Survival ratio – 3 year (after
indemnifications) 14.7 19.6
The 1999 comparatives have been restated to include other hazards claims for TRG and the
APH claims and LAE for Odyssey Re Stockholm as at the end of the year; also, the net APH
incurred and paid losses for 1999 now reflect the benefit of cessions under C&F’s vendor
indemnity.
The 2000 gross amount of US$2,411.5 million is included in the C$20,225.8 million shown as
Provision for claims at December 31, 2000 on Fairfax’s balance sheet on page 29.
The 3-year survival ratio represents the outstanding APH claims and LAE (including IBNR) at
December 31 divided by the average paid APH claims for the last three years (including
Fairfax’s effective 27.5% economic interest in International Insurance). The survival ratio after
74

indemnifications includes one-half of the remaining indemnifications at December 31, 2000
for Odyssey Reinsurance (New York) (an internal indemnification as described on page 79),
CTR, Sphere Drake, C&F and International Insurance and one-half of the remaining Swiss Re
cover. The increase in the gross and net incurred and paid APH claims during 2000, and the
resulting reduction in the 3-year survival ratios, resulted from the inclusion of TRG in the 2000
activity and the buyback and cancellation of two major APH-exposed policies by two of the
companies (net paid losses of $28 million). Fairfax’s 3-year survival ratio before and after
indemnifications of 9.8 and 14.7 years respectively compares very favourably with A.M. Best
Co’s 3-year average survival ratio of 7.8 years for the U.S. property and casualty insurance
industry (as set out in their study of U.S. property and casualty insurers’ and reinsurers’
December 31, 1999 asbestos and environmental claims reserve information, published in
‘‘Best’s Viewpoint’’ dated October 26, 2000). A.M. Best’s 3-year average survival ratio was
adjusted to exclude US$1.6 billion in 1999 Fibreboard asbestos products losses (US$1.1 billion –
CNA; US$0.5 billion – Chubb). Excluding the above-mentioned buyback and cancellation of
two major APH-exposed policies, Fairfax’s 3-year survival ratio, before and after
indemnification, would be 11.1 and 16.7 years respectively.
Many insurance coverage issues and circumstantial uncertainties make the estimation of these
reserves very difficult. Inconsistencies among the States with regard to coverage, occurrence
definitions and Superfund reform can all affect the outcome of APH claims. Also, during 2000,
there was renewed asbestos liability activity primarily relating to the emergence of so-called
non-products liability claims. Generally, as asbestos defendants, especially manufacturers of
products containing asbestos, exhaust available product hazard coverage, they are increasingly
seeking to expand available insurance coverage by alleging that the asbestos claims to which
they are subject are not product hazard claims, but are rather so-called non-products claims for
which the liability limits of their insurance have not been exhausted.
These APH reserves are continuously monitored by management and are reviewed extensively
by independent consulting actuaries.
Fairfax is protected against adverse development of these reserves at Odyssey Reinsurance (New
York) (by an internal indemnification described on page 79), CTR, Sphere Drake, C&F and
International Insurance from their levels at the time of acquisition of those companies
(December 31, 1992 in the case of International Insurance) to the extent of the available
indemnifications obtained in connection with those acquisitions, as discussed under
Indemnifications on page 79, and at all Fairfax subsidiaries (including TIG but otherwise not at
subsidiaries acquired after 1998) by the Swiss Re cover.
75

FAIRFAX FINANCIAL HOLDINGS LIMITED
Reinsurance Recoverables
Fairfax’s subsidiaries purchase certain reinsurance so as to reduce their liability on the
insurance and reinsurance risks which they write. Fairfax strives to minimize the credit risk of
purchasing reinsurance through adherence to its internal reinsurance guidelines. To be an
ongoing reinsurer of Fairfax, a company must have high A.M. Best and/or Standard & Poor’s
ratings and maintain capital and surplus exceeding $500 million. Most of the reinsurance
balances for reinsurers rated B++ and lower or which are not rated were inherited by Fairfax on
acquisition of a subsidiary. The risk of uncollectible reinsurance has been mitigated by vendor
indemnifications and the purchase of additional reinsurance protection, as outlined under
Indemnifications below. The following table shows Fairfax’s top twenty reinsurance groups
(based on gross reinsurance recoverable) at December 31, 2000. These twenty reinsurance
groups represent 80.1% of Fairfax’s $11,099.5 million in total reinsurance recoverable (which
total is net of bad debt reserves aggregating $919.9 million).A.M. Best
Rating Gross(or S&P Reinsurance
Group Principal Reinsurers equivalent)(1) Recoverable($000)
Swiss Re European Reinsurance Company ofZurich A++ 1,488,805
General Electric ERC Frankona Ruck A++ 977,006Zurich Reinsurance Zurich Reinsurance (N.A.) Inc. A+ 769,614Munich Re American Reinsurance A++ 763,845Xerox Ridge Reinsurance NR 640,228(2)
Equitas Equitas NR 611,745Great West Life London Life & Casualty Reinsurance A 566,708Gerling Global Gerling Global International Re AA–(3) 390,239Aegon ARC Re & Pyramid Insurance
Companies NR 374,380(2)
St. Paul Mountain Ridge Ins. Co. of N.A.(2) NR 342,186Ace Insurance Co. of North America A 318,936Lloyd’s of London Lloyd’s of London Underwriters A 307,528
UnderwritersBerkshire Hathaway General Reinsurance Corp. (USA) A++ 288,835CNA Continental Casualty A 220,581Royal Sun Alliance Security Ins. Co. of Hartford A+ 164,367Hartford(4) New England Re B+ 161,183KWELM Walbrook NR 140,093Groupama GAN Life A+ 135,623Nationwide Nationwide Mutual Insurance
Company A+ 120,122XL NAC Re A+ 110,923Other reinsurers 3,126,462
Total reinsurance recoverable 12,019,409Provision for uncollectible reinsurance 919,947
Net reinsurance recoverable 11,099,462
(1) Of principal reinsurer
(2) Fully secured by letters of credit and/or trust funds (gross reinsurance recoverable from Mountain
Ridge is $188.5 million)
(3) S&P rating
(4) Rated A+ by A.M. Best
76

The following table shows the classification of the total reinsurance recoverable by credit rating
of the responsible reinsurers:
OutstandingA.M. Best Balances Provision NetRating Gross for which for Unsecured(or S&P Reinsurance Security Uncollectible Reinsuranceequivalent) Recoverable is Held Reinsurance Recoverable
($000) ($000) ($000) ($000)
A++ 2,824,600 165,617 3,258 2,655,725
A+ 2,221,131 545,891 5,259 1,669,981
A 2,492,249 737,658 4,569 1,750,022
A– 281,000 25,145 2,110 253,745
B++ 102,262 10,135 879 91,248
B+ 336,667 31,144 3,064 302,459
B 19,669 1,436 4,242 13,991
C/D 92,528 13,857 2,957 75,714
E 81,284 2,188 7,074 72,022
Not rated 3,568,019 1,964,327 751,795 851,897
Total reinsurance recoverable 12,019,409 3,497,398 785,207 7,736,804
Provision for uncollectible
reinsurance
– specific 785,207
– general 134,740
Net reinsurance recoverable 11,099,462
To support gross reinsurance recoverable balances, Fairfax has the benefit of letters of credit,
trust funds or offsetting balances payable totalling $3,497.4 million, as follows:
for reinsurers rated A– or better, Fairfax has security of $1,474.3 million against
outstanding reinsurance recoverable of $7,819.0 million;
for reinsurers rated B++ or lower, Fairfax has security of $58.8 million against outstanding
reinsurance recoverable of $632.4 million; and
for unrated reinsurers, Fairfax has security of $1,964.3 million against outstanding
reinsurance recoverable of $3,568.0 million.
Equitas and Lloyd’s are also required to maintain funds in Canada and the United States which
are monitored by the applicable regulatory authorities. Fairfax has an aggregate provision for
uncollectible reinsurance of $919.9 million at December 31, 2000 (of which only $15.2 million
relates to reinsurers rated A– or higher) compared with unsecured reinsurance recoverable from
reinsurers rated B++ or lower and unrated reinsurers totalling $2,177.3 million. Fairfax believes
that this provision provides for all likely losses arising from uncollectible reinsurance at
December 31, 2000.
Approximately 44% of the reinsurance balances for reinsurers rated B+ or lower or which are
unrated were inherited on the acquisition of TRG in 1999. Fairfax purchased 100% of TRG’s
voting common shares for US$97 million which represents an effective 27.5% economic
77

FAIRFAX FINANCIAL HOLDINGS LIMITED
interest in TRG’s results of operations and net assets. Xerox retains all of TRG’s participating
non-voting preferred shares resulting in an effective 72.5% economic interest in TRG’s results
of operations and net assets. Xerox’s wholly-owned subsidiary, Ridge Re, also provides TRG’s
wholly-owned subsidiary, International Insurance, with the vendor indemnity (unutilized
coverage of $228 million at December 31, 2000) referred to under Indemnifications below.
TRG’s cessions to Ridge Re are fully collateralized by letters of credit in the same amount as the
cessions. Accordingly, Fairfax’s exposure to loss is limited to its US$97 million investment.
The following table shows the classification of the total reinsurance recoverable, excluding
TRG-related balances, by credit rating of the responsible reinsurers:
OutstandingA.M. Best Balances Provision NetRating Gross for which for Unsecured(or S&P Reinsurance Security Uncollectible Reinsuranceequivalent) Recoverable is Held Reinsurance Recoverable
($000) ($000) ($000) ($000)
A++ 2,642,861 113,775 2,749 2,526,337
A+ 1,959,856 508,047 406 1,451,403
A 2,121,713 731,564 4,171 1,385,978
A– 253,748 21,737 1,413 230,598
B++ 78,078 9,598 75 68,405
B+ 240,723 30,318 2,612 207,793
B 12,382 904 4,171 7,307
C/D 92,049 13,857 2,852 75,340
E 56,752 2,188 4,279 50,285
Not rated 1,874,775 1,499,911 103,929 270,935
Total reinsurance recoverable 9,332,937 2,931,899 126,657 6,274,381
Provision for uncollectible
reinsurance
– specific 126,657
– general 134,740
Net reinsurance recoverable 9,071,540
Excluding TRG-related balances, Fairfax has gross outstanding reinsurance balances for
reinsurers which are rated B+ or lower or which are unrated of $2,276.7 million for which it
holds security of $1,547.2 million and has an aggregate provision for uncollectible reinsurance
of $252.6 million (35% of the net exposure prior to such provision), leaving a net exposure of
$476.9 million.
Fairfax is protected against adverse development of the reserves and unrecoverable reinsurance
at Odyssey Reinsurance (New York) (by an internal indemnification described under
Indemnifications below), CTR, Sphere Drake, C&F and International Insurance from their
levels at the time of acquisition of those companies (December 31, 1992 in the case of
International Insurance) to the extent of the available indemnifications obtained in
connection with those acquisitions, as discussed under Indemnifications below. In addition,
Fairfax has a US$1 billion cover from Swiss Re protecting it from adverse development in its
78

subsidiaries’ (including TIG but otherwise not including subsidiaries acquired after 1998)
claims reserves and uncollectible reinsurance at December 31, 1998.
Indemnifications
Shown below are the continuing indemnifications originally received by Fairfax on the
acquisition of its various insurance and reinsurance subsidiaries. These indemnifications
protect Fairfax from adverse development in the respective companies’ claims reserves and
unrecoverable reinsurance as at the end (or, as regards C&F, as of August 13) of the respective
original years shown. Those indemnifications for which a settlement year is shown will be
settled as of the end of the respective settlement years shown. The protected net reserves
represent the respective companies’ carried reserves, net of reinsurance recoverable, at
December 31, 2000, which are subject to the related indemnification.
During 1999, the indemnity in respect of Odyssey Reinsurance (New York) was assumed by a
Fairfax reinsurance subsidiary in consideration of a cash payment made to that reinsurer,
which Fairfax believes represented fair value to assume that indemnity.
Unused Protected NetIndemnifications Reserves at at December 31, Settlement December 31,
Year Company Amount Amount 2000 Year 2000(millions) (C$millions) (C$millions) (C$millions)
1992 International Insurance(TRG) US$ 578** 868** 228 None 446
1995* Odyssey Reinsurance(New York) US$ 175 263 134 2005 1,395
1995 CTR FF 250 54 23 2005 232
1996 Sphere Drake US$ 171 257 47 2006 649
1998 C&F US$ 368** 553** 259 None 1,927
1998 All Fairfax subsidiariesowned at the endof 1998 and TIG(Swiss Re cover) US$1,000*** 1,502 715 None 6,858
2,629 1,178
* This indemnity is provided by a Fairfax reinsurance subsidiary, as described above.
** After coinsurance.
*** Additional premium is payable as additional losses are ceded to this cover.
Excluding International Insurance, at December 31, 2000 the unused indemnifications amount
to 17% of protected net reserves.
The company has negotiated final settlement of the CTR indemnity, with closing subject to
completion of final documentation.
Insurance Environment
The property and casualty insurance market continued to be very competitive in 2000 with
combined ratios in Canada and the U.S. expected to be approximately 108% and 110%
respectively, versus 105% and 108% respectively in 1999. Adverse development from very
79

FAIRFAX FINANCIAL HOLDINGS LIMITED
inadequate pricing and 1999 year-end catastrophes negatively impacted on 2000 combined
ratios. Significant restructuring and consolidation continues to take place in the industry.
While prices started to increase in 2000, continued significant price increases are required to
return the insurance industry to pricing adequacy and underwriting profitability. The industry
continues to be highly competitive and significant excess capital and underwriting capacity
remain to take advantage of firming prices.
Acquisitions
Effective August 31, 2000, C&F acquired Sen-Tech International Holdings, Inc. (and its wholly-
owned subsidiary, Seneca Insurance Company, Inc. of New York). Effective December 21,
2000, C&F also purchased Transnational Insurance Company (a licensed excess and surplus
lines shell company). The balance sheets of the two companies upon acquisition were as
follows:
Seneca Transnational(US$ millions) (US$ millions)
Investments, including cash 102 15
Accounts receivable, including
reinsurance 63 –
Other assets 13 –
Total assets 178 15
Provision for claims 78 –
Other liabilities 41 –
Shareholders’ equity 59 15
The acquisition prices of US$65 million ($96 million) for the common shares of Seneca and
US$17 million ($26 million) for the common shares of Transnational were paid in cash.
80

Interest and Dividend Income
The majority of interest and dividend income is earned by the insurance, reinsurance and
runoff companies. Upon the acquisitions noted below, the respective amounts shown below
were added to the company’s portfolio investments.
PortfolioInvestments
Acquisition Date Company Acquired ($ millions)
March 21, 1990 Federated 101
November 14, 1990 Commonwealth 130
December 31, 1993 Ranger 400
November 30, 1994 Lombard (including CRC (Bermuda)) 684
May 31, 1996 Odyssey Reinsurance (New York) 1,490
February 27, 1997 CTR 764
December 3, 1997 Sphere Drake 1,068
August 13, 1998 Crum & Forster 4,955
September 4, 1998 Odyssey Re Stockholm 831
April 13, 1999 TIG 5,597
August 11, 1999 TRG 1,670
Interest and Dividend IncomeAveragePre-Tax After-TaxInvestments
at Book Value Amount Yield Per Share Amount Yield Per Share($000) ($000) (%) ($) ($000) (%) ($)
1985 29,060 2,445 8.45 0.87 1,271 4.37 0.45
1986 64,181 4,678 7.29 0.96 2,522 3.93 0.52
1987 109,825 8,042 7.32 1.10 5,499 5.01 0.77
1988 130,782 8,922 6.82 1.22 6,618 5.06 0.90
1989 135,703 11,628 8.57 1.51 8,537 6.29 1.11
1990 237,868 20,704 8.70 2.75 14,017 5.89 1.86
1991 338,461 26,051 7.70 4.44 17,731 5.24 3.02
1992 366,481 23,988 6.55 4.17 17,749 4.84 3.09
1993 418,207 23,251 5.56 3.78 17,994 4.30 2.92
1994 852,010 58,219 6.83 7.12 39,608 4.65 4.85
1995 1,608,054 89,354 5.56 10.00 73,664 4.58 8.25
1996 2,548,076 151,387 5.94 15.42 111,458 4.37 11.35
1997 4,584,569 254,562 5.55 23.64 174,408 3.80 16.19
1998 8,877,495 443,838 5.00 37.37 337,519 3.80 28.42
1999 14,684,044 752,980 5.13 56.48 492,033 3.35 36.91
2000 16,306,184 818,069 5.02 62.10 578,377 3.55 43.91
Interest and dividend income increased in 2000 due to the inclusion of TIG and TRG for a full
year in 2000 compared with nine months and four months, respectively, in 1999. As shown,
the pre-tax income yield decreased in 2000 to 5.02% due to lower interest rates, partially offset
by a weaker Canadian dollar. The after-tax income yield increased in 2000 because of more
investment income earned in lower tax rate jurisdictions. Since 1985, pre-tax interest and
dividend income per share has compounded at 32.9% per year.
81

FAIRFAX FINANCIAL HOLDINGS LIMITED
Investments for the past sixteen years are shown in the following table, the first five columns
of which show them at their average carrying values for each year, and the final two columns
of which show them at year-end.
Cash andTotal InvestmentsShort Term
Investments Bonds Preferreds Common Average Year-End Per Share($000) ($000) ($000) ($000) ($000) ($000) ($)
1985 10,526 15,388 732 2,414 29,060 32,728 6.55
1986 16,605 24,523 7,979 15,074 64,181 95,633 13.65
1987 28,025 26,242 16,516 39,042 109,825 124,016 16.90
1988 29,843 23,575 25,191 52,173 130,782 137,548 18.79
1989 20,623 28,528 32,212 54,340 135,703 133,858 18.30
1990 33,596 99,220 45,652 59,400 237,868 335,740 61.30
1991 60,099 140,177 75,685 62,500 338,461 341,180 62.54
1992 77,929 108,818 99,821 79,913 366,481 396,240 65.44
1993 102,968 90,682 118,604 105,953 418,207 848,774 106.70
1994 226,205 303,859 132,138 189,808 852,010 1,551,343 173.25
1995 297,989 796,310 157,017 356,738 1,608,054 1,668,656 188.14
1996 470,651 1,462,064 168,438 446,923 2,548,076 3,454,521 330.07
1997 822,569 2,989,063 226,936 546,001 4,584,569 5,795,703 520.62
1998 1,116,239 6,856,713 213,311 691,232 8,877,495 12,108,374 998.03
1999 1,858,597 11,583,341 144,454 1,097,653 14,684,045 17,478,710 1,298.57
2000 2,530,149 12,532,538 102,070 1,141,427 16,306,184 15,290,739 1,167.15
Total investments and total investments per share decreased at year-end 2000 due to the
payment of claims by the U.S. insurance companies while realizing lower premium volumes as
those companies re-underwrote their business, the ongoing reduction of the runoff claims
portfolios and the payment of 1999 catastrophe losses, partially offset by a weaker Canadian
dollar. Since 1985, investments per share have compounded at 41.3% per year.
82

The breakdown of the fixed income portfolio, by the higher of the S&P and Moody’s credit
ratings, as at December 31, 2000 was as follows:
Credit Book Market UnrealizedRating Value Value gain/(loss)
($000) ($000) ($000)
AAA 6,127,028 5,974,621 (152,407)
AA 1,450,693 1,395,031 (55,662)
A 2,590,931 2,470,329 (120,602)
BBB 1,478,599 1,375,829 (102,770)
BB 58,156 39,691 (18,465)
B 20,551 17,739 (2,812)
C 20,372 10,359 (10,013)
NR 11,986 11,416 (570)
Total 11,758,316 11,295,015 (463,301)
86.5% of the fixed income portfolio is rated A or better.
Return on Investment Portfolio
The following table shows the performance of the investment portfolio for the past sixteen
years. The total return includes all interest and dividend income, gains (losses) on the disposal
of securities and the change in the unrealized gains (losses) during the year.
RealizedInterest Gains Change in
Average and (Losses) Unrealized Total ReturnInvestments Dividends after Gains on Average
at Book Value Earned Provisions (Losses) Investments($000) ($000) ($000) ($000) ($000) (%)
1985 29,060 2,455 459 878 3,792 13
1986 64,181 4,678 952 (352) 5,278 8
1987 109,825 8,042 9,159 (7,976) 9,225 8
1988 130,782 8,922 7,802 12,131 28,855 22
1989 135,703 11,628 15,458 (6,272) 20,814 15
1990 237,868 20,704 2,278 (32,943) (9,961) (4)
1991 338,461 26,051 (4,512) 27,866 49,405 15
1992 366,481 23,988 3,400 (11,197) 16,191 4
1993 418,207 23,251 27,822 28,792 79,865 19
1994 852,010 58,219 20,026 (42,407) 35,838 4
1995 1,608,054 89,354 71,912 45,438 206,704 13
1996 2,548,076 151,387 131,274 112,676 395,337 16
1997 4,584,569 254,562 206,773 (4,479) 456,856 10
1998 8,877,495 443,838 440,785 (117,169) 767,454 9
1999 14,684,045 752,980 121,670 (1,232,111) (357,461) (2)
2000 16,306,184 818,069 382,849 737,425 1,938,343 12
83
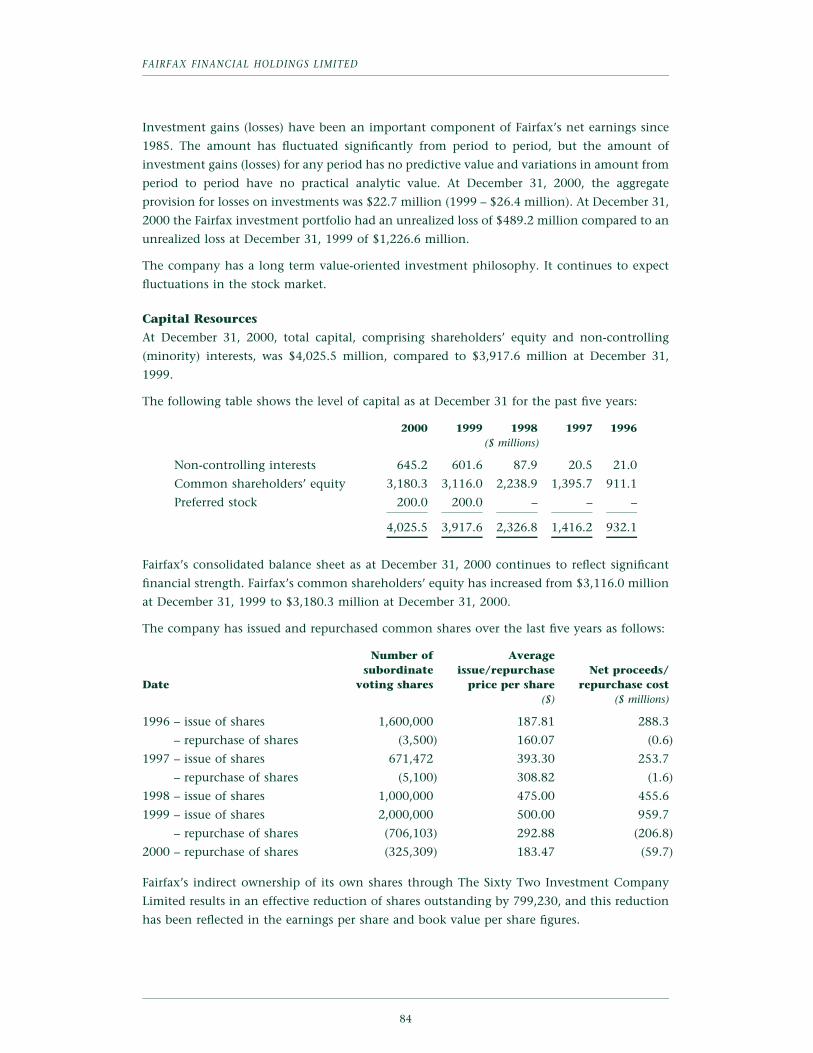
FAIRFAX FINANCIAL HOLDINGS LIMITED
Investment gains (losses) have been an important component of Fairfax’s net earnings since
1985. The amount has fluctuated significantly from period to period, but the amount of
investment gains (losses) for any period has no predictive value and variations in amount from
period to period have no practical analytic value. At December 31, 2000, the aggregate
provision for losses on investments was $22.7 million (1999 – $26.4 million). At December 31,
2000 the Fairfax investment portfolio had an unrealized loss of $489.2 million compared to an
unrealized loss at December 31, 1999 of $1,226.6 million.
The company has a long term value-oriented investment philosophy. It continues to expect
fluctuations in the stock market.
Capital Resources
At December 31, 2000, total capital, comprising shareholders’ equity and non-controlling
(minority) interests, was $4,025.5 million, compared to $3,917.6 million at December 31,
1999.
The following table shows the level of capital as at December 31 for the past five years:
2000 1999 1998 1997 1996($ millions)
Non-controlling interests 645.2 601.6 87.9 20.5 21.0
Common shareholders’ equity 3,180.3 3,116.0 2,238.9 1,395.7 911.1
Preferred stock 200.0 200.0 – – –
4,025.5 3,917.6 2,326.8 1,416.2 932.1
Fairfax’s consolidated balance sheet as at December 31, 2000 continues to reflect significant
financial strength. Fairfax’s common shareholders’ equity has increased from $3,116.0 million
at December 31, 1999 to $3,180.3 million at December 31, 2000.
The company has issued and repurchased common shares over the last five years as follows:
Number of Averagesubordinate issue/repurchase Net proceeds/
Date voting shares price per share repurchase cost($) ($ millions)
1996 – issue of shares 1,600,000 187.81 288.3
– repurchase of shares (3,500) 160.07 (0.6)
1997 – issue of shares 671,472 393.30 253.7
– repurchase of shares (5,100) 308.82 (1.6)
1998 – issue of shares 1,000,000 475.00 455.6
1999 – issue of shares 2,000,000 500.00 959.7
– repurchase of shares (706,103) 292.88 (206.8)
2000 – repurchase of shares (325,309) 183.47 (59.7)
Fairfax’s indirect ownership of its own shares through The Sixty Two Investment Company
Limited results in an effective reduction of shares outstanding by 799,230, and this reduction
has been reflected in the earnings per share and book value per share figures.
84

A common measure of capital adequacy in the property and casualty industry is the premiums
to surplus (or common shareholders’ equity) ratio. This is shown for the insurance and
reinsurance subsidiaries of Fairfax for the past five years in the following table:
Net Premiums Written to Surplus(Common Shareholders’ Equity)
2000 1999 1998 1997 1996
Insurance
Commonwealth 0.5 0.3 0.5 0.6 0.6
Crum & Forster 0.5 0.6 0.7 – –
Falcon 0.3 0.3 0.1 – –
Federated 1.7 1.6 1.6 1.2 1.2
Lombard 2.0 1.7 1.7 1.4 1.7
Markel 1.4 1.1 1.3 0.9 1.2
Ranger 0.4 0.8 1.2 1.1 1.1
TIG Specialty Insurance 0.8 1.1 – – –
Reinsurance
Odyssey America Re 0.7 0.6 0.5 0.5 0.6
Canadian insurance industry 1.3 1.2 1.2 1.2 1.3
U.S. insurance industry 0.9 0.8 0.8 0.9 1.0
Effective July 1, 2000, CTR’s European property and casualty business was being written
through Odyssey America Re’s Paris branch and effective January 1, 2001, its Asian property
and casualty business was being written through Odyssey America Re’s Singapore branch.
In Canada, property and casualty companies are regulated by the Office of the Superintendent
of Financial Institutions on the basis of their Section 516 surplus. At December 31, 2000,
Fairfax’s Canadian property and casualty insurance subsidiaries had a combined Section 516
surplus of approximately $241 million (1999 – $233 million) in excess of minimum
requirements.
In the U.S., the National Association of Insurance Commissioners (NAIC) has developed a
model law and risk-based capital (RBC) formula designed to help regulators identify property
and casualty insurers that may be inadequately capitalized. Under the NAIC’s requirements, an
insurer must maintain total capital and surplus above a calculated threshold or face varying
levels of regulatory action. The threshold is based on a formula that attempts to quantify the
risk of a company’s insurance, investment and other business activities. Fairfax does not
anticipate any adverse effects of such requirements. At the end of 2000, the U.S. insurance and
reinsurance subsidiaries had capital and surplus in excess of the regulatory minimum
requirement of two times the authorized control level – except for TIG, each subsidiary had
capital and surplus in excess of three times the authorized control level. The company’s
objective is for TIG to have capital and surplus in excess of three times the authorized control
level by the end of 2002. Subsequent to December 31, 2000 Fairfax contributed additional
capital of $167 million (US$111 million) to TIG as part of its commitment to strengthen TIG’s
capital ratio. TIG does not intend to pay dividends until it has capital and surplus in excess of
three times the authorized control level.
85

FAIRFAX FINANCIAL HOLDINGS LIMITED
Fairfax and its insurance and reinsurance subsidiaries are rated as follows by the respective
rating agencies:
StandardA.M. Best & Poor’s Fitch DBRS Moody’s
Fairfax – BBB- BBB* BBB+ Baa3
Commonwealth A BBB+ A – –
Crum & Forster A– BBB+ A – Baa2
Falcon – BBB+ – – –
Federated A– BBB+ A – –
Lombard A– BBB+ A – –
Markel A– BBB+ A – –
Ranger B++ – A – –
TIG Specialty Insurance A BBB+ A
CRC (Bermuda) A– – – – –
CTR A– BBB+ A – –
Odyssey America Re A BBB+ A – Baa1
ORC Re – – A – –
Wentworth A – – – –
* Fairfax’s claims paying ability is rated a by Fitch.
Liquidity
The purpose of liquidity management is to ensure that there is sufficient cash to meet all
financial commitments and obligations as they fall due.
Fairfax’s combined holding company income statement is disclosed, and its composition is
explained, on page 99. As shown, the holding companies had revenue of $392.1 million in
2000, consisting of dividends from their insurance and reinsurance subsidiaries
($322.8 million), interest income ($21.1 million), management fees ($24.4 million) and
realized gains ($23.8 million). After interest expense ($165.3 million), operating expenses
($51.0 million) and non-recurring expenses ($22.7 million), the holding companies had pre-
tax earnings of $153.0 million. The operating expenses include, besides administration
expenses, the cost of Fairfax’s corporate catastrophe cover and certain systems and other costs
of insurance subsidiaries reimbursed by the holding companies. The non-recurring expenses
include certain C&F restructuring costs reimbursed by the holding companies and the
amortization of note issuance costs. This income statement shows that in 2000, Fairfax
comfortably met all its obligations from internal sources.
In 2001, Fairfax continues to have access to dividends and management fees and should again
meet all its debt service and overhead obligations from internal sources.
At the end of 2000, Fairfax had a large cash and marketable securities holding of $545.4 million
available to meet unexpected requirements. The cash in the holding company would permit
Fairfax to meet its net interest, preferred dividend and other overhead expenses for
approximately two years, without access to any dividends from its insurance and reinsurance
86

subsidiaries. As noted on page 85, subsequent to December 31, 2000 Fairfax contributed
additional capital of $167 million to TIG out of its cash holding.
Also, Fairfax has in excess of $1.25 billion of unsecured, committed bank lines, of which $885
million are five-year lines (subject to reduction over the last three years of the five-year term if
they are not renewed) and the remainder are non-renewed lines reducing over the period to
2004. The company has used $340 million of the credit available under the lines for the
issuance of letters of credit in support of its subsidiaries’ reinsurance obligations, principally
relating to intercompany reinsurance of subsidiaries. The only significant covenant attached to
these lines is a covenant to maintain a net debt to equity ratio not exceeding 1:1 (currently,
that ratio is 0.35:1).
The company manages its debt levels based on the following financial measurements and
ratios (with Lindsey Morden equity accounted):
2000 1999 1998 1997 1996($ millions)
Cash and marketable securities 545.4 712.7 305.4 207.1 101.1
Long term debt 1,851.4 1,959.0 1,444.4 718.4 470.5
Net debt 1,306.0 1,246.3 1,139.0 511.3 369.4
Common shareholders’ equity 3,180.3 3,116.0 2,238.9 1,395.7 911.1
Preferred shares and trust preferred
securities of subsidiaries 592.0 578.8 – – –
Total equity 3,772.3 3,694.8 2,238.9 1,395.7 911.1
Net debt/equity 35% 34% 51% 37% 41%
Net debt/total capital 26% 25% 34% 27% 29%
Net debt/earnings 9.5x 10.0x 3.1x 2.2x 2.4x
Interest coverage 0.9x 0.7x 6.6x 8.7x 6.2x
The company’s financial position remains strong. The slight increase in net debt/equity and
net debt/total capital ratios in 2000 is principally due to the weakening of the Canadian dollar
against the U.S. dollar, which increases the Canadian dollar value of the company’s U.S. dollar
denominated debt (notwithstanding that that increase is offset by an equivalent increase in
the dollar value of the company’s U.S. assets). Excluding the impact of the
U.S. dollar/Canadian dollar exchange rate movement in 2000, the company’s net debt/equity
ratio would be 33% and its net debt/total capital ratio would be 25%.
During 2000, the company repaid the vendor note given on the acquisition of Odyssey Re
Stockholm ($53.9 million), TRG’s long term debt ($60.2 million) and, to the extent required
annually, long term debt of TIG ($12.4 million), amounting to an aggregate of $126.5 million,
from subsidiary company dividends and cash flow. The company also repaid TIG’s mandatory
redeemable preferred stock of $36.3 million from holding company cash. Other than annual
repayments on TIG’s long term debt, the company does not have any long term debt or
preferred security maturities until 2003, during which year $379.5 million comes due.
The recent net debt/earnings and interest coverage ratios reflect the company’s low level of
earnings in 1999 and 2000.
87

FAIRFAX FINANCIAL HOLDINGS LIMITED
The company intends to examine instituting a dividend in 2001 at an annual rate of $1 or $2
per share (see page 10 of the Chairman’s message).
Issues and Risks
The following issues and risks, among others, should also be considered in evaluating the
outlook of the company.
Claims Reserves
The major risk that all property and casualty insurance and reinsurance companies face is that
the provision for claims is an estimate and may be found to be deficient in the future for a
variety of reasons including unpredictable jury verdicts, expansion of insurance coverage to
include exposures not contemplated at the time of policy issue (e.g. asbestos, pollution, breast
implants), and poor weather. Fairfax’s gross provision for claims was $20,225.8 million as at
December 31, 2000.
Reinsurance Recoverables
Most insurance and reinsurance companies reduce their liability for any individual claim by
reinsuring amounts in excess of the maximum they want to retain. This third party
reinsurance does not relieve the company of its primary obligation to the insured. Reinsurance
recoverables can become an issue mainly due to solvency credit concerns, given the long time
period over which claims are paid and the resulting recoveries are received from the reinsurers,
or policy disputes. Fairfax had $11,099.5 million recoverable from reinsurers as at
December 31, 2000.
Catastrophe Exposure
Insurance and reinsurance companies are subject to losses from catastrophes like earthquakes,
windstorms or hailstorms, which are unpredictable and can be very significant.
Prices
Prices in the insurance and reinsurance industry are cyclical and can fluctuate quite
dramatically. With under-reserving, competitors can price below underlying costs for many
years and still survive.
Foreign Exchange
The company has assets, liabilities, revenue and costs that are subject to currency fluctuations,
particularly in the U.S. dollar but also other foreign currencies. These currency fluctuations
have been and can be very significant.
Cost of Revenue
Unlike most businesses, the insurance and reinsurance business can have enormous costs that
can significantly exceed the premiums received on the underlying policies. Similar to short
selling in the stock market (selling shares not owned), there is no limit to the losses that can
arise from most insurance policies, even though most contracts have policy limits.
88
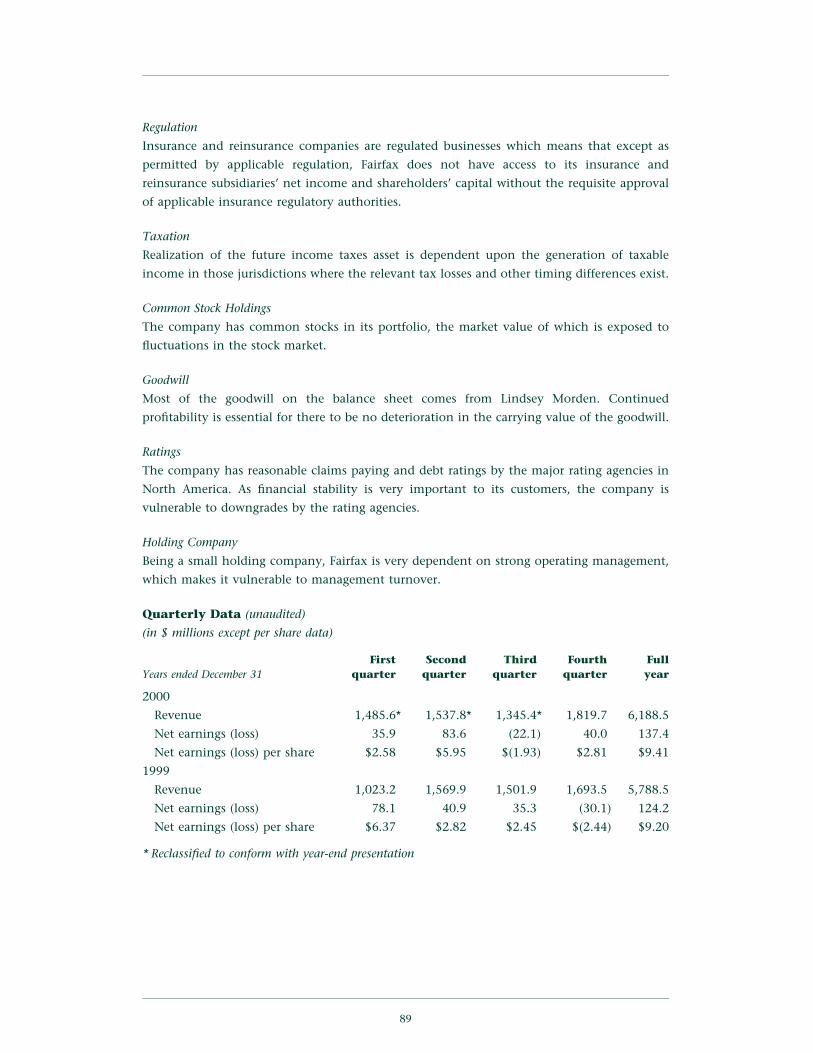
Regulation
Insurance and reinsurance companies are regulated businesses which means that except as
permitted by applicable regulation, Fairfax does not have access to its insurance and
reinsurance subsidiaries’ net income and shareholders’ capital without the requisite approval
of applicable insurance regulatory authorities.
Taxation
Realization of the future income taxes asset is dependent upon the generation of taxable
income in those jurisdictions where the relevant tax losses and other timing differences exist.
Common Stock Holdings
The company has common stocks in its portfolio, the market value of which is exposed to
fluctuations in the stock market.
Goodwill
Most of the goodwill on the balance sheet comes from Lindsey Morden. Continued
profitability is essential for there to be no deterioration in the carrying value of the goodwill.
Ratings
The company has reasonable claims paying and debt ratings by the major rating agencies in
North America. As financial stability is very important to its customers, the company is
vulnerable to downgrades by the rating agencies.
Holding Company
Being a small holding company, Fairfax is very dependent on strong operating management,
which makes it vulnerable to management turnover.
Quarterly Data (unaudited)
(in $ millions except per share data)
First Second Third Fourth FullYears ended December 31 quarter quarter quarter quarter year
2000
Revenue 1,485.6* 1,537.8* 1,345.4* 1,819.7 6,188.5
Net earnings (loss) 35.9 83.6 (22.1) 40.0 137.4
Net earnings (loss) per share $2.58 $5.95 $(1.93) $2.81 $9.41
1999
Revenue 1,023.2 1,569.9 1,501.9 1,693.5 5,788.5
Net earnings (loss) 78.1 40.9 35.3 (30.1) 124.2
Net earnings (loss) per share $6.37 $2.82 $2.45 $(2.44) $9.20
* Reclassified to conform with year-end presentation
89

FAIRFAX FINANCIAL HOLDINGS LIMITED
Stock Prices
Below are The Toronto Stock Exchange high, low and closing prices of subordinate voting
shares of Fairfax for each quarter of 2000 and 1999.
First Second Third Fourthquarter quarter quarter quarter
($) ($) ($) ($)
2000
High 246.00 194.00 201.00 242.20
Low 146.75 150.00 161.00 176.00
Close 178.00 162.00 188.25 228.50
1999
High 610.00 460.00 425.00 279.50
Low 415.00 361.00 194.00 180.00
Close 440.00 395.00 220.00 245.50
90

(This page intentionally left blank)
91

FAIRFAX FINANCIAL HOLDINGS LIMITED
Fairfax Insurance and Reinsurance Companies
Combined Balance Sheetsas at December 31, 2000 and 1999
(unaudited)
2000 1999($000) ($000)
Assets
Accounts receivable and other ************************* 2,677,220 2,148,313
Recoverable from reinsurers *************************** 7,224,342 7,793,632
Income taxes refundable ****************************** 67,496 –
9,969,058 9,941,945
Portfolio investments (at book value)
Cash and short term investments ********************** 1,437,086 1,321,018
Bonds************************************************ 9,939,970 11,531,924
Preferred stocks*************************************** 70,212 116,549
Common stocks ************************************** 562,270 1,491,311
Real estate ******************************************* 64,643 48,790
12,074,181 14,509,593
Investments in Hub and Zenith************************ 396,539 363,380
Deferred premium acquisition costs ******************** 382,898 336,874
Future income taxes ********************************** 989,838 893,742
Capital assets***************************************** 98,758 46,854
Other assets ****************************************** 12,526 27,426
23,923,798 26,119,814
Liabilities
Accounts payable and accrued liabilities**************** 1,135,229 1,148,744
Funds withheld payable to reinsurers ****************** 1,324,680 1,198,516
Income taxes payable ********************************* – 57,070
2,459,909 2,404,330
Provision for claims*********************************** 14,958,155 17,168,763
Unearned premiums ********************************** 2,233,333 2,050,160
Long term debt*************************************** 27,766 40,211
17,219,254 19,259,134
Shareholders’ Equity
Capital stock ***************************************** 2,965,571 3,331,453
Contributed surplus*********************************** 698,675 39,542
Retained earnings************************************* 580,389 1,085,355
4,244,635 4,456,350
23,923,798 26,119,814
92

Fairfax Insurance and Reinsurance Companies
Combined Statements of Earningsfor the years ended December 31, 2000 and 1999
(unaudited)
2000 1999($000) ($000)
Revenue
Gross premiums written ********************************** 5,524,524 5,540,508
Net premiums written ************************************ 4,335,093 4,022,541
Net premiums earned************************************* 4,297,346 4,232,251
Expenses
Losses on claims****************************************** 3,484,264 3,346,505
Operating expenses *************************************** 674,128 633,114
Commissions, net **************************************** 837,755 869,696
4,996,147 4,849,315
Underwriting loss *************************************** (698,801) (617,064)
Investment and other income (expense)
Interest and dividends ************************************ 593,512 711,475
Realized gains on investments***************************** 90,297 149,678
683,809 861,153
Other**************************************************** (55,497) (63,082)
628,312 798,071
Earnings (loss) before income taxes********************* (70,489) 181,007
Provision for (recovery of) income taxes ******************* (281,706) (143,740)
Net earnings ********************************************* 211,217 324,747
Loss ratio************************************************* 81.1% 79.1%
Expense ratio ******************************************** 35.2% 35.5%
Combined ratio ****************************************** 116.3% 114.6%
Fairfax Insurance and Reinsurance Companies
Fairfax’s insurance business is conducted by a number of subsidiaries. These subsidiaries
underwrite a wide range of commercial and personal property, oil and gas, casualty and life
insurance and property, casualty and life reinsurance in Canada, the United States and
internationally.
93

FAIRFAX FINANCIAL HOLDINGS LIMITED
Fairfax with Equity Accounting of Lindsey Morden
Consolidated Balance Sheetsas at December 31, 2000 and 1999
(unaudited)
2000 1999($000) ($000)
AssetsCash and short term investments **************************** 450,205 613,197Marketable securities **************************************** 95,235 99,479Accounts receivable and other ******************************* 2,745,337 2,414,017Recoverable from reinsurers********************************** 11,099,462 9,743,256Income taxes refundable************************************* 155 96,812
14,390,394 12,966,761
Portfolio investmentsSubsidiary cash and short term investments (market value –
$1,954,096; 1999 – $1,844,218) **************************** 1,954,096 1,844,218Bonds
(market value – $11,295,015; 1999 – $12,065,723)*********** 11,758,316 13,306,760Preferred stocks
(market value – $69,522; 1999 – $132,614)****************** 70,212 133,928Common stocks
(market value – $859,751; 1999 – $1,403,367)*************** 884,948 1,387,628Real estate (market value – $76,347; 1999 – $80,735) ********** 76,347 80,735
Total (market value – $14,254,731; 1999 – $15,526,657) ********* 14,743,919 16,753,269
Investment in Lindsey Morden******************************* 101,927 104,607Investments in Hub and Zenith National ********************* 396,539 363,380Deferred premium acquisition costs ************************** 386,689 361,146Future income taxes***************************************** 1,273,899 890,574Capital assets *********************************************** 110,936 89,567Goodwill *************************************************** 34,074 6,690Other assets************************************************* 65,751 95,103
31,504,128 31,631,097
LiabilitiesAccounts payable and accrued liabilities ********************** 1,374,629 1,296,872Funds withheld payable to reinsurers ************************* 1,325,320 1,198,516
2,699,949 2,495,388
Provision for claims ***************************************** 20,225,831 20,442,199Unearned premiums***************************************** 2,252,312 2,276,344Long term debt ********************************************* 1,851,378 1,959,042Trust preferred securities of subsidiaries*********************** 392,022 378,789
24,721,543 25,056,374
Non-controlling interest ************************************* 572,522 529,113
Excess of net assets acquired over purchase price paid ********* 129,808 234,243
Shareholders’ EquityCommon stock ********************************************* 2,012,916 2,066,297Preferred stock ********************************************** 200,000 200,000Retained earnings ******************************************* 1,167,390 1,049,682
3,380,306 3,315,979
31,504,128 31,631,097
94

Fairfax with Equity Accounting of Lindsey Morden
Consolidated Statements of Earningsfor the years ended December 31, 2000 and 1999
(unaudited)
2000 1999($000) ($000)
Revenue
Gross premiums written ********************************* 6,054,324 5,707,518
Net premiums written*********************************** 4,566,478 4,151,129
Net premiums earned *********************************** 4,610,662 4,470,719
Interest and dividends*********************************** 818,069 752,980
Realized gains on investments *************************** 378,305 121,670
Equity (loss) earnings of Lindsey Morden ***************** (15,387) 2,784
5,791,649 5,348,153
Expenses
Losses on claims **************************************** 3,874,882 3,578,337
Operating expenses ************************************* 909,243 796,040
Commissions, net*************************************** 885,247 869,696
Interest expense **************************************** 164,743 129,262
Restructuring and other costs **************************** 16,402 –
Kingsmead losses *************************************** 32,963 –
Negative goodwill*************************************** (79,245) –
5,804,235 5,373,335
Earnings (loss) before income taxes ******************* (12,586) (25,182)
Provision for (recovery of) income taxes ****************** (173,306) (158,023)
Net earnings before non-controlling interest ********* 160,720 132,841
Non-controlling interest ********************************* (23,279) (8,633)
Net earnings ******************************************** 137,441 124,208
Net earnings per share ********************************* $ 9.41 $ 9.20
95

FAIRFAX FINANCIAL HOLDINGS LIMITED
Lindsey Morden Group Inc.
Consolidated Balance Sheetsas at December 31, 2000 and 1999
2000 1999($000) ($000)
Assets
Cash ****************************************************** 1,380 2,488
Accounts receivable***************************************** 89,493 95,275
Claims in process******************************************* 52,083 56,355
Temporary investment in common shares******************** – 10,277
Prepaid expenses ******************************************* 5,499 3,989
Income taxes recoverable *********************************** 7,027 2,687
155,482 171,071
Property and equipment ************************************ 29,816 32,656
Goodwill ************************************************** 225,578 239,409
Future income taxes **************************************** 9,039 7,038
Other assets************************************************ 25,003 23,333
444,918 473,507
Liabilities
Bank indebtedness****************************************** 42,469 43,801
Accounts payable and accrued liabilities ********************* 89,513 80,682
Income taxes payable *************************************** 8,505 10,825
Current portion of long term debt*************************** 2,249 2,165
Future income taxes **************************************** 6,647 10,084
149,383 147,557
Long term debt ******************************************** 133,524 132,840
Future employee benefits *********************************** 5,725 13,435
Other liabilities********************************************* 3,121 2,586
291,753 296,418
Shareholders’ Equity
Share capital and contributed surplus ************************ 167,458 147,090
Currency translation adjustment **************************** (10,572) (1,885)
Retained earnings (deficit) ********************************** (3,721) 31,884
153,165 177,089
444,918 473,507
96

Lindsey Morden Group Inc.
Consolidated Statements of Earningsfor the years ended December 31, 2000 and 1999
2000 1999($000) ($000)
Revenue ******************************************************* 376,943 443,085
Cost and expenses
Cost of service ************************************************* 305,756 333,870
Selling, general and administration ***************************** 69,652 76,898
Interest******************************************************** 14,857 12,148
Other ********************************************************* 13,838 –
404,103 422,916
Earnings (loss) before income taxes ************************** (27,160) 20,169
Provision for (recovery of) income taxes ************************* (13,075) 5,938
Earnings (loss) before goodwill amortization**************** (14,085) 14,231
Goodwill amortization ******************************************* 9,038 9,518
Net earnings (loss)********************************************* (23,123) 4,713
Consolidated Statements of Retained Earnings (Deficit)for the years ended December 31, 2000 and 1999
2000 1999($000) ($000)
Retained earnings – beginning of year************************ 31,884 39,011
Net earnings (loss) for the year ********************************** (23,123) 4,713
Dividends paid ************************************************* (12,482) (11,840)
Retained earnings (deficit) – end of year********************** (3,721) 31,884
These condensed financial statements have been prepared from the Lindsey Morden Group Inc. audited
consolidated financial statements as at and for the years ended December 31, 2000 and 1999, copies
of which are available on request.
97

FAIRFAX FINANCIAL HOLDINGS LIMITED
Fairfax Financial Holdings Limited
Unconsolidated Balance Sheetsas at December 31, 2000 and 1999
(unaudited)
2000 1999($000) ($000)
Assets
Subsidiary companies
Insurance companies ************************************* 2,405,841 2,302,193
Reinsurance companies *********************************** 1,614,983 1,400,716
Runoff companies **************************************** 407,884 601,584
Hamblin Watsa******************************************* 2,567 3,967
Noro **************************************************** 8,304 1,372
Other investments****************************************** 10,606 10,606
4,450,185 4,320,438
Cash and short term investments**************************** 450,205 613,197
Marketable securities**************************************** 95,235 99,479
Swiss Re recoverable **************************************** 165,466 225,365
Other assets ************************************************ 44,256 49,033
5,205,347 5,307,512
Liabilities
Accounts payable and other liabilities************************ 57,804 282,122
Long term debt********************************************* 1,767,237 1,709,411
1,825,041 1,991,533
Shareholders’ Equity
Common stock********************************************* 2,012,916 2,066,297
Preferred stock ********************************************* 200,000 200,000
Retained earnings ****************************************** 1,167,390 1,049,682
3,380,306 3,315,979
5,205,347 5,307,512
The investments in subsidiaries reflect the underlying equity of the subsidiaries. The investments in
Hub International and Lindsey Morden are held through the company’s other subsidiaries.
98

Fairfax Financial Holdings Limited
Unconsolidated Statements of Earnings(combined holding company income statements)
for the years ended December 31, 2000 and 1999
(unaudited)
2000 1999($000) ($000)
Revenue
Dividend income ******************************************** 322,816 374,131
Interest income ********************************************** 21,104 36,368
Management fees ******************************************** 24,350 18,661
Realized gains (losses) **************************************** 23,784 (46,496)
392,054 382,664
Expenses
Interest expense ********************************************* 165,325 128,948
Operating expenses ****************************************** 50,951 41,066
Non-recurring expenses ************************************** 22,730 8,797
239,006 178,811
Earnings before income taxes ****************************** 153,048 203,853
Note: The combined holding company statements include the unconsolidated earnings
statements of Fairfax Financial Holdings Limited, the Canadian holding company, and
the U.S. holding companies which have issued long term debt or trust preferred
securities and which carry out certain of Fairfax’s parent company corporate functions.
These statements exclude intercompany arrangements other than dividends from
subsidiaries, and exclude the combined holding company’s premium payments and
recoveries under the corporate insurance cover with Swiss Re. None of the companies
pays tax currently, and accordingly these statements are presented on a pre-tax basis.
99

FAIRFAX FINANCIAL HOLDINGS LIMITED
APPENDIX
GUIDING PRINCIPLES FOR FAIRFAX FINANCIAL HOLDINGS LIMITED
OBJECTIVES:
1) We expect to earn long term returns on shareholders’ equity in excess of 20% annually by
running Fairfax and its subsidiaries for the long term benefit of customers, employees and
shareholders – at the expense of short term profits if necessary.
Our focus is long term growth in book value per share and not quarterly earnings. We plan
to grow through internal means as well as through friendly acquisitions.
2) We always want to be soundly financed.
3) We provide complete disclosure annually to our shareholders.
STRUCTURE:
1) Our companies are decentralized and run by the presidents except for performance
evaluation, succession planning, acquisitions and financing which are done by or with
Fairfax. Cooperation among companies is encouraged to the benefit of Fairfax in total.
2) Complete and open communication between Fairfax and subsidiaries is an essential
requirement at Fairfax.
3) Share ownership and large incentives are encouraged across the Group.
4) Fairfax will always be a very small holding company and not an operating company.
VALUES:
1) Honesty and integrity are essential in all our relationships and will never be compromised.
2) We are results oriented – not political.
3) We are team players – no ‘‘egos’’. A confrontational style is not appropriate. We value
loyalty – to Fairfax and our colleagues.
4) We are hard working but not at the expense of our families.
5) We always look at opportunities but emphasize downside protection and look for ways to
minimize loss of capital.
6) We are entrepreneurial. We encourage calculated risk taking. It is all right to fail but we
should learn from our mistakes.
7) We will never bet the company on any project or acquisition.
8) We believe in having fun – at work!
100

Consolidated Financial Summary (in $ millions except share and per share data)(1)
Per Share
Return on Net Earningsaverage Share- earnings before Share- Closing
shareholders’ holders’ – fully income Net Total Invest- Net holders’ Shares shareequity equity diluted Revenue taxes earnings assets(2) ments debt(3) equity outstanding price
(000)
As at and for the years ended December 31:
1985 – 2.08 (1.89) 17.0 (0.9) (0.9) 41.5 32.7 – 10.4 5,000 3.25(4)
1986 25.4% 5.89 1.35 53.7 9.1 6.5 129.8 95.6 2.8 41.3 7,007 12.75
1987 31.3% 8.32 2.23 113.0 18.2 16.0 185.4 124.0 2.8 61.0 7,337 12.37
1988 21.2% 10.13 1.94 133.6 21.3 14.4 246.8 137.5 28.2 74.2 7,322 15.00
1989 20.3% 12.41 2.25 125.8 19.2 16.7 248.1 133.9 22.0 90.8 7,316 18.75
1990 23.0% 17.29 2.92 195.4 23.2 21.3 536.0 335.7 65.9 94.7 5,477 11.00
1991 21.3% 21.41 3.94 250.0 32.5 22.5 516.6 341.2 51.3 116.8 5,455 21.25
1992 7.7% 23.76 1.76 286.8 7.0 10.0 590.5 396.2 68.2 143.8 6,055 25.00
1993 20.3% 35.13 5.42 344.0 46.7 33.3 1,200.3 848.8 132.4 279.5 7,955 61.25
1994 12.1% 43.77 4.66 634.9 46.0 38.1 2,173.4 1,551.3 218.0 391.9 8,955 67.00
1995 20.1% 53.28 9.79 1,145.5 95.9 87.5 2,873.5 1,668.1 227.7 472.6 8,869 98.00
1996 21.4% 87.05 15.36 1,475.8 187.3 150.8 5,778.4 3,454.5 369.4 911.1 10,466 290.00
1997 20.4% 125.38 21.59 2,088.3 336.0 232.5 10,207.3 5,795.7 511.3 1,395.7 11,132 320.00
1998 20.1% 184.54 32.63 3,574.3 484.8 387.5 20,886.7 12,108.4 1,139.0 2,238.9 12,132 540.00
1999 4.3% 231.98 9.20 5,788.5 (17.3) 124.2 31,979.1 17,434.9 1,246.3 3,116.0 13,426 245.50
2000 4.1% 242.75 9.41 6,188.5 (32.9) 137.4 31,833.3 15,290.7 1,306.0 3,180.3 13,101 228.50
(1) All share references are to common shares(2) Commencing in 1995, reflects a change in accounting policy for reinsurance recoverables(3) Total debt (beginning in 1994, net of cash in the holding company) with Lindsey Morden equity accounted(4) When current management took over in September 1985
101

FAIRFAX FINANCIAL HOLDINGS LIMITED
Directors of the Company Officers of the Company* Winslow W. Bennett Trevor J. Ambridge
President, Winwood Holdings Ltd. Vice President and Chief Financial Officer* Robbert Hartog Sam Chan
President, Robhar Investments Ltd. Vice PresidentPaul B. Ingrey (as of April 2001) Francis ChouRetired Reinsurance Executive Vice Presidentand Corporate Director Jean CloutierKenneth R. Polley Vice PresidentChairman J. Paul T. FinkLindsey Morden Group Inc. Vice President
* V. Prem Watsa Bradley P. MartinChairman and Chief Executive Officer Vice President
* Audit Committee Member Elizabeth J. MurphyVice President and Corporate SecretaryEric P. Salsberg
Operating Management Vice President, Corporate AffairsJohn Watson, Chairman Ronald SchokkingRonald Schwab, President Vice President, FinanceCommonwealth Insurance Company John C. VarnellBruce Esselborn, Chairman Vice PresidentCrum & Forster Holdings, Inc. V. Prem WatsaKenneth Kwok, President Chairman and Chief Executive OfficerFalcon Insurance Company Limited
Officers of Fairfax Inc.John M. Paisley, PresidentCindy Crandall, Vice PresidentFederated Insurance Company of CanadaJames F. Dowd, PresidentAnthony F. Hamblin, PresidentScott Galiardo, Vice PresidentHamblin Watsa Investment Counsel Ltd.James Migliorini, Vice President
Marty Hughes, ChairmanRichard A. Gulliver, President Head OfficeHub International Limited 95 Wellington Street WestKenneth R. Polley, Chairman Suite 800J. Ferdinand Roibas, President Toronto, Ontario, Canada M5J 2N7Lindsey Morden Group Inc. Telephone (416) 367-4941
Website www.fairfax.caByron G. Messier, PresidentLombard General Insurance Company of Canada AuditorsMark J. Ram, President
PricewaterhouseCoopers LLPMarkel Insurance Company of CanadaAndrew A. Barnard, President General CounselOdyssey Re Group Ltd. Torys
Michael Wacek, PresidentTransfer Agent and RegistrarOdyssey Re – AmericasCIBC Mellon Trust CompanyLucien Pietropoli, President
Odyssey Re – Euro-Asia Share ListingDavid Newman, CEO The Toronto Stock ExchangeNewline Syndicate (Lloyd’s) Stock Symbol FFH
Philip Broughton, PresidentAnnual MeetingRanger Insurance CompanyThe annual meeting of shareholders of FairfaxCourtney Smith, PresidentFinancial Holdings Limited will be held onTIG Specialty Insurance CompanyTuesday, April 17, 2001 at 9:30 a.m. inMichael A. Coutu, ChairmanRoom 106 at the Metro Toronto ConventionDennis C. Gibbs, PresidentCentre, 255 Front Street West, Toronto.TRG Holding Corporation
102
